| February 19, 2020

Why Europe Needs a New Competition Paradigm for the 5G Era (co-published with GSMA Intelligence)

This article is being co-published with GSMA Intelligence. As the exclusive global network performance data provider to the intelligence unit of the mobile industry trade group GSMA, Ookla® supports their extensive efforts to provide data-driven insights and context on the state of the mobile industry around the world. Speedtest® data is leveraged by GSMA Intelligence analysts and experts on an ongoing basis, including within the recent "Mobile Market Structure and Performance in Europe" report.

The mobile market in Europe has come to the end of its main phase of investments in fourth generation (4G) mobile networks and operators are now turning their attention to 5G. Services have already been launched in Switzerland and the UK, and more markets expected to launch in 2020, for example Germany and France.

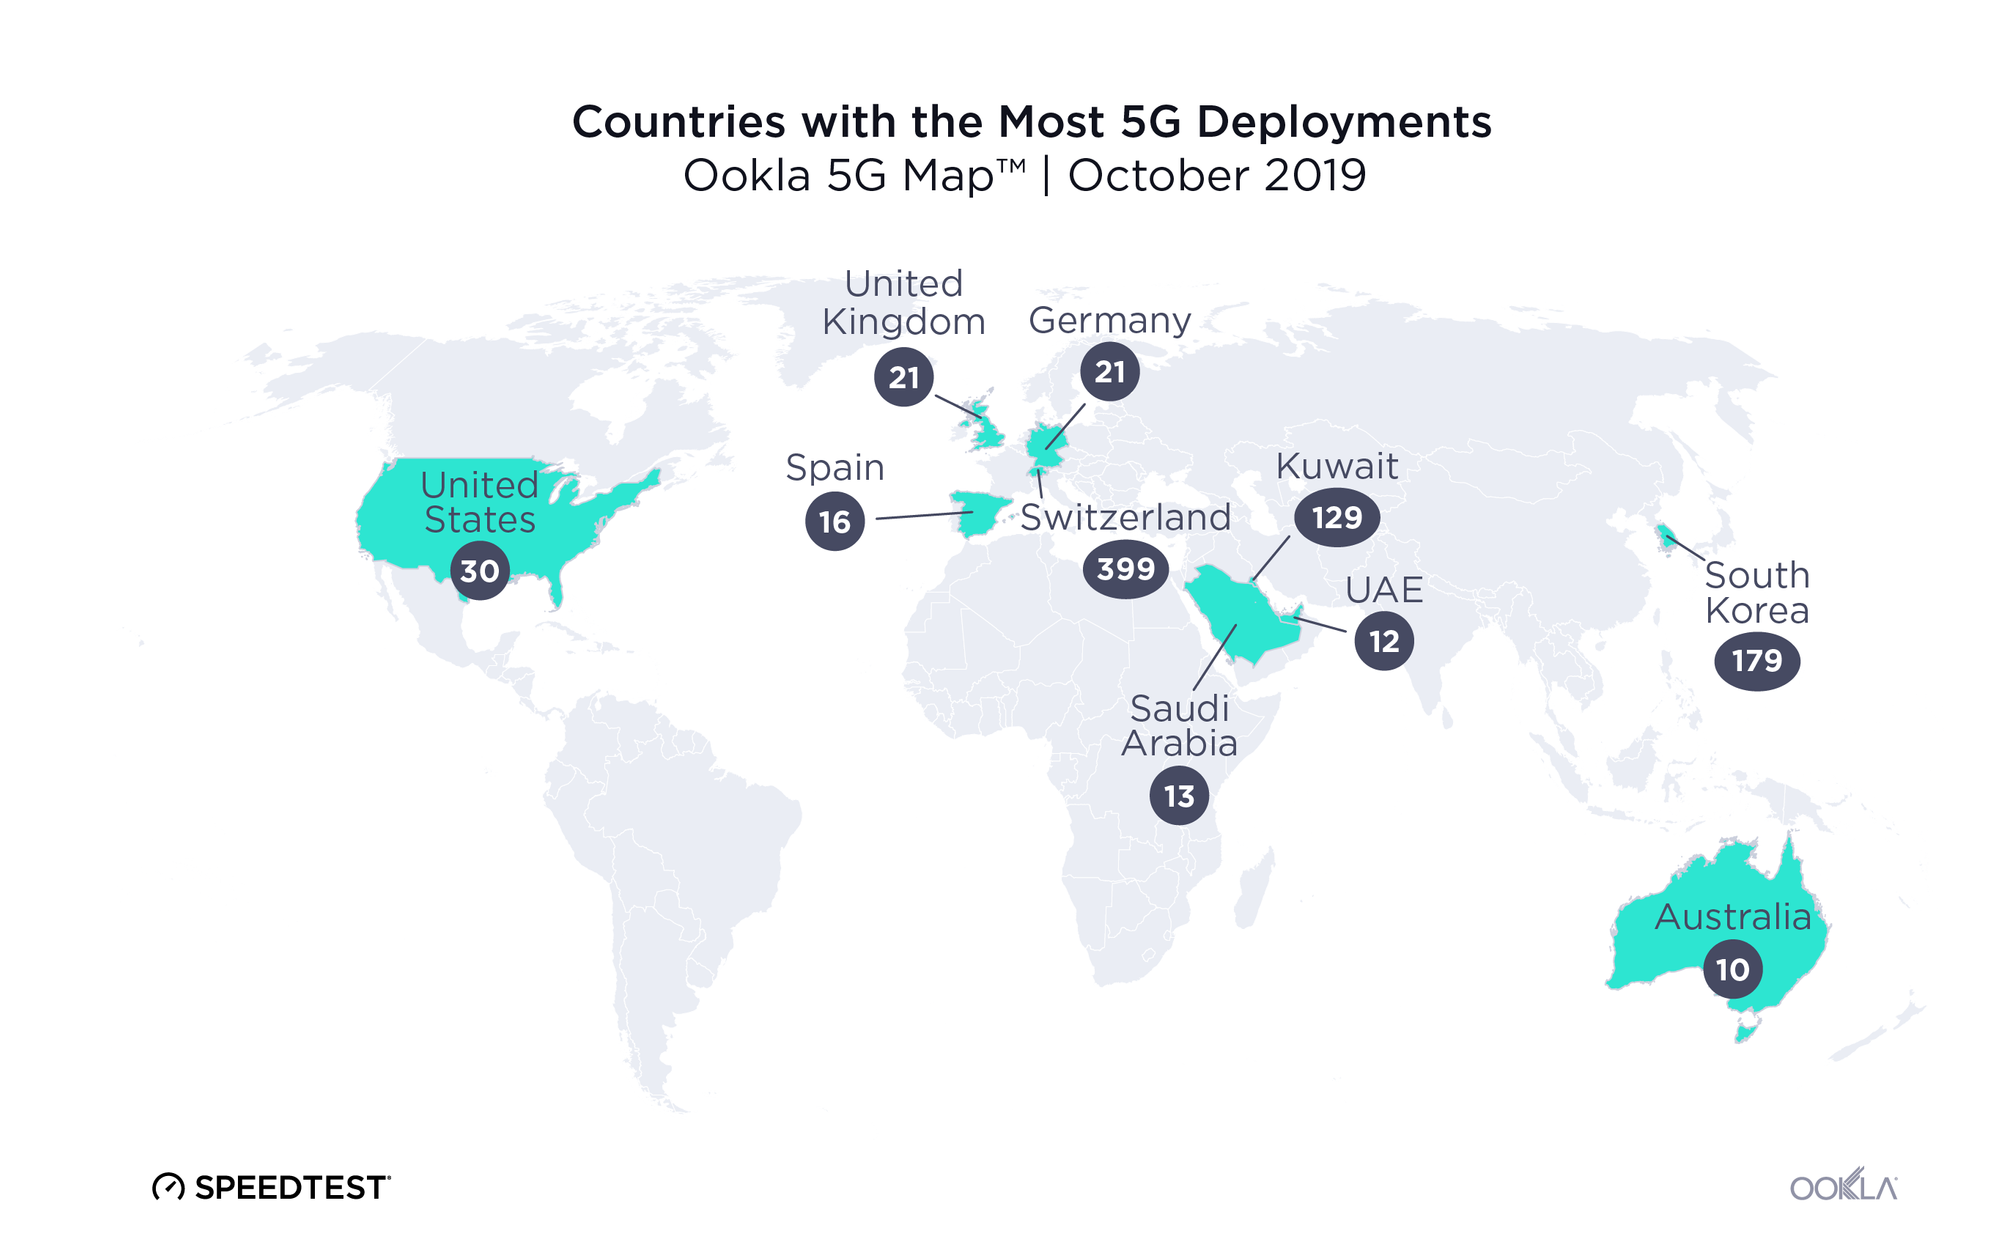
Despite these positive steps, industry analysts do not expect a rapid roll-out of 5G in Europe. On the contrary, most expect 5G deployments in European markets to lag behind countries such as the US, China, Korea and Japan. The reason is that delivering 5G services will require large additional investments, and these will be a lot harder to justify in European markets that have recently delivered lower profit margins than in other parts of the world.

With this largely subdued investment climate, what can be done so that Europe doesn’t lose out on the 5G opportunity? One thing that could change this is competition dynamics. More concentrated market structures (for example with less players) can deliver economies of scale, a more efficient utilization of assets (such as sites and spectrum), and also enable large investments in 5G networks. However, concentrated markets can also raise flags with regulatory and competition authorities that may be concerned about consumer prices being higher.

Understanding the relationship between market structure and the quality, innovation and prices that consumers can expect is therefore crucial. A strong debate exists about the competition dynamics that will deliver best value for consumers in the 5G era. As arguments can be made in both directions, it is important to look at data from the recent past to help draw some lessons that can inform decisions going forward.

This is precisely what GSMA Intelligence did. In a recent study, they evaluate how market structures impacted consumers during the 4G era in Europe. They looked at data covering the period from 2011 to 2018, for 29 European countries. They combined coverage and other publicly available data from operators with network-quality measurement data from Ookla®, a global leader in mobile and broadband network intelligence, testing applications and technology.

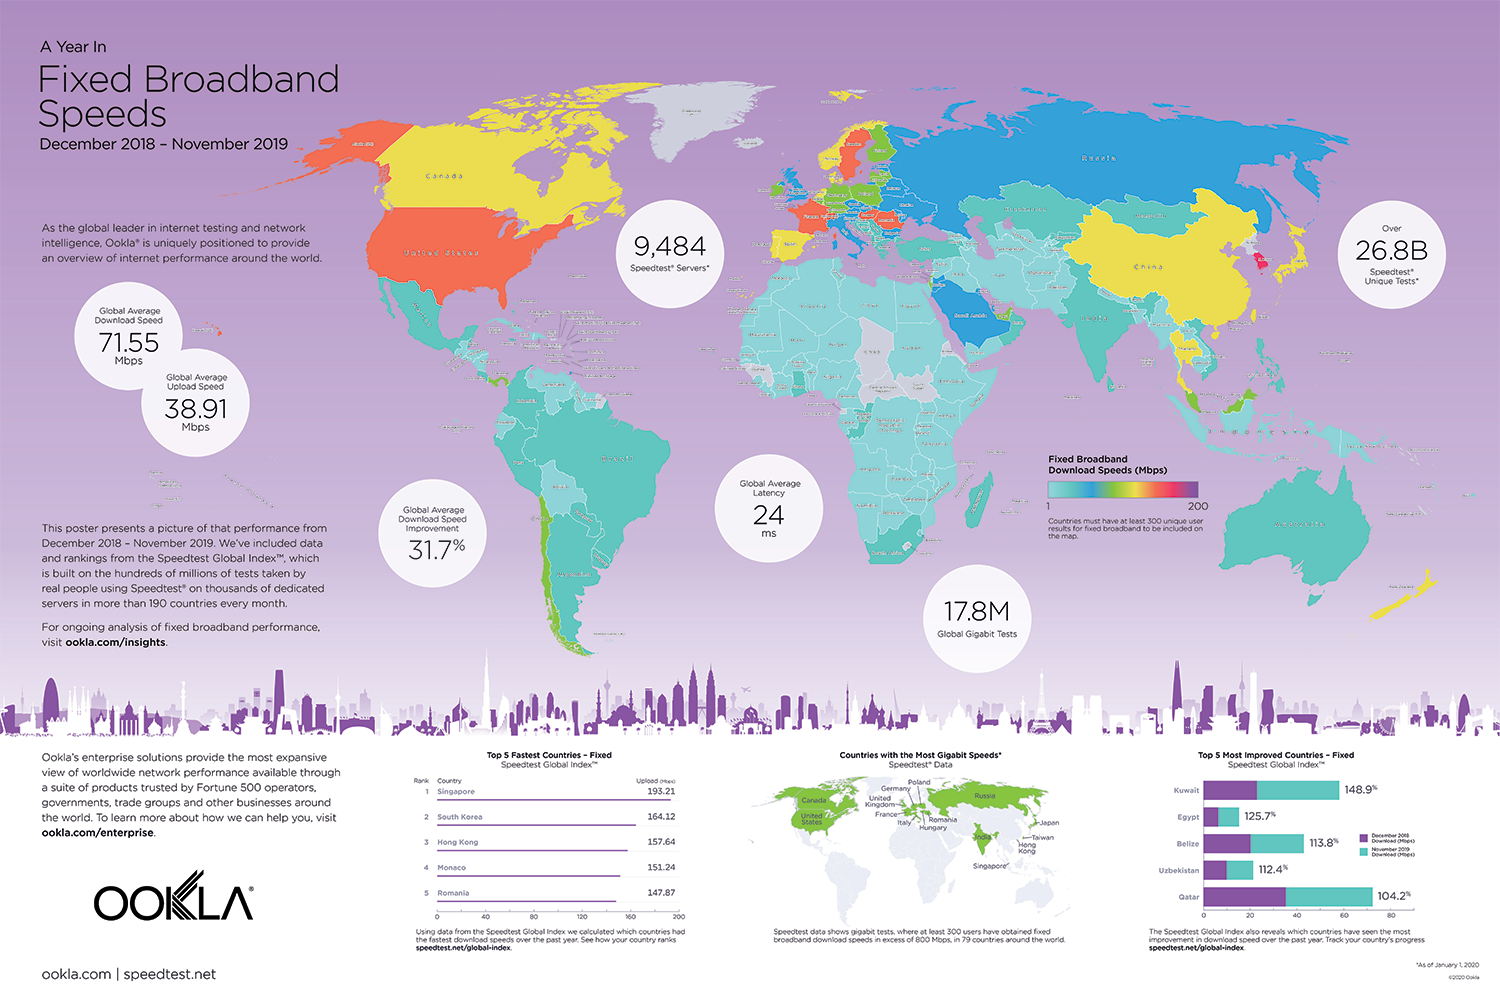
Overall, the 4G era was a positive and expansive one for European mobile consumers everywhere. Already by 2016, 90% of consumers were covered by 4G networks. Since then, operators have delivered greater speeds and lower latencies (signal delay), resulting in a far superior consumer experience today. Download speeds increased on average from 2 Mbps in 2011 to 37 Mbps in 2018. The average price per MB also dropped sharply as mobile data became cheaper and users consumed ever-increasing volumes of data, with average monthly data usage increasing more than twelve-fold.

But while all European consumers experienced improvements during the 4G era, the study shows that European mobile users in three-player markets benefited the most from higher quality and innovation.

By the end of 2018, three-player markets were outperforming four-player markets by 4.5 Mbps in download speeds, and over half of that difference (around 3.5 Mbps) can be attributed to the role of market structure in three-player markets. In particular, operators in more concentrated markets were able to utilize assets more efficiently (especially spectrum) and generate higher returns that allowed them to invest more in their networks. This is an important insight when considering the best ways to unlock the full potential of 5G networks, including advanced applications that require very low latencies, high speeds and plenty of network capacity.

Did this come at the expense of higher prices? On the basis of the pricing data that GSMA Intelligence was able to analyse, it did not. In addition to general improvements in performance, prices also decreased across Europe in the 4G era, indicating more efficiency and better value for consumers over time. Implicit unit prices (i.e. revenue per MB and revenue per user) decreased similarly in both three- and four-player markets.

In other words, during the 4G era, a European consumer in a three-player market experienced on average a better quality mobile broadband service while paying similar prices per MB of data to a consumer in a four-player market.

Does this therefore mean that more consolidation in European markets is the only solution to deliver the right investments for 5G? Not necessarily.
An option that is often touted as an alternative to full consolidation is increased network sharing. GSMA Intelligence’s analysis showed that in the 4G era, progressively deeper levels of network integration delivered improved performance, although they came short of full integration in terms of network quality. Network sharing could therefore also help promote faster deployments of high-performing 5G networks in Europe over the coming years.

Ultimately, every case and country needs to be considered on the basis of its own merits and situation. What works in one country does not necessarily work in another and operator incentives and consumer attitudes to products and services will differ from market to market.

But there is one key lesson from the 4G era that does apply to all countries equally: to support the delivery of high performing 5G networks, policymakers should fully consider all aspects of consumer welfare when assessing the relative advantages of more concentrated markets in merger control, antitrust policy and spectrum management.

Read the full report here.

Ookla retains ownership of this article including all of the intellectual property rights, data, content graphs and analysis. This article may not be quoted, reproduced, distributed or published for any commercial purpose without prior consent. Members of the press and others using the findings in this article for non-commercial purposes are welcome to publicly share and link to report information with attribution to Ookla.

| October 21, 2019

Exploring Recent Trends in the India Telecom Market

With the release of new fiber-to-the-home services and a strong push by providers to bring 4G to more parts of the country, we decided to check in and see how fixed broadband speed, mobile speed and 4G Availability have looked over the last two quarters in India.

Our analysis includes performance data from 21,096,823 consumer-initiated tests taken with Speedtest® and coverage data from over 2.5 billion coverage scans on 2,436,758 devices during Q2-Q3 2019.

For the first time ever we are also making available for download a detailed report on performance by operator including an in-depth look at peak time performance. Download the full report.

Mobile and fixed speeds are increasing at the country level

India-Mobile-Fixed-Speeds-in-Largest-Markets--1-
Mean fixed broadband download speeds in India rose 16.5% during Q2-Q3 2019 and topped 34.07 Mbps in September. Compared to Bangladesh, which saw a similar rate of improvement but lower speeds at 24.02 Mbps, and Pakistan, where speeds stayed relatively flat between 8.54 and 9.14 Mbps, India is the regional leader in mean download speed.

With Reliance Jio’s rollout of its new GigaFiber service in India in early September, we will likely continue to see country-wide speeds increase. (Download the full report to compare Jio’s monthly fixed download speeds before and after the launch of GigaFiber.)

However, mobile download speeds were relatively flat in India, fluctuating between 10.63 Mbps and 11.18 Mbps during Q2-Q3 2019. Regionally, India’s mobile performance is marginally faster than Bangladesh’s, which saw average speeds max out at 10.43 Mbps, and somewhat slower than Pakistan’s top speeds of 15.55 Mbps.

4G Availability continues to improve in India

India’s mobile providers are still trying to provide consistent 4G coverage across the country. We compared coverage data for over 231,274,713 samples from Speedtest Android users across Indian mobile operators in Q2-Q3 2019 to benchmark India’s 4G Availability against other markets in the region.

India-4G-Availability-by-Country

4G Availability is the percentage of an operator’s known locations where a device has access to LTE service (including roaming). India’s 4G Availability was relatively high at 87.9% across providers during Q2-Q3 2019. That means that Speedtest users had access to LTE service at 87.9% of surveyed locations. For comparison, 4G Availability was 58.9% in Pakistan and 58.7% in Bangladesh during the same period.

Fixed broadband speeds show wide disparities between India’s largest cities

In a country as large as India, country-wide averages factor in many regional differences. To get a clearer picture of how consumers experience the internet across the country, we looked at fixed and mobile download speeds in the 15 largest cities in India during Q2-Q3 2019.

Ookla_Internet-Speeds-in-India---Largest-Cities-2

Chennai had by far the fastest mean download speed over fixed broadband (51.07 Mbps), followed by Bengaluru (42.50 Mbps) and Hyderabad (41.68 Mbps). The slowest download speeds on our list were measured in Nagpur (20.10 Mbps), followed by Pune (22.78 Mbps) and Kanpur (23.20 Mbps).

Mobile download speeds — which include all cellular technologies — showed somewhat less variation from city to city. Mumbai (11.87 Mbps), Indore (11.80 Mbps), Visakhapatnam (11.74 Mbps), Hyderabad (11.48) and Kolkata (11.46 Mbps) had the fastest mobile download speeds. The slowest mean download speed on our list was measured in Lucknow (8.94 Mbps).

Want to see which ISPs and mobile operators were fastest in each city, plus a breakdown of how operators perform at peak times of network congestion, based on signal metrics? Download the full report.

Ookla retains ownership of this article including all of the intellectual property rights, data, content graphs and analysis. This article may not be quoted, reproduced, distributed or published for any commercial purpose without prior consent. Members of the press and others using the findings in this article for non-commercial purposes are welcome to publicly share and link to report information with attribution to Ookla.

| February 27, 2020

Illustrating a Year of Mobile and Fixed Broadband Improvements Around the World (Poster Download)

Mobile and fixed broadband networks change so rapidly it’s easy to overlook how much providers around the world are improving performance and connectivity every year. In celebration of your efforts, we’ve created a downloadable poster that highlights some major industry achievements during 2019.

Mobile operators rolled out more than 6,600 5G deployments

Ookla_Mobile-Speeds-Poster_2020
5G was a key effort for many providers around the globe, with 6,629 deployments in 2019. We also saw download speeds increase in most countries. The poster highlights some specific achievements, like Bosnia and Herzegovina’s 359% increase in speed. Visit the Speedtest Global IndexTM to learn even more and to watch worldwide mobile performance continue to improve throughout 2020.

Global fixed broadband download speed increased 31.7%

Ookla_Fixed-Broadband-Speeds-Poster_2020
We saw gigabit-speed Speedtest® results increase exponentially in 2019, which helped drive a global jump in mean download speed over fixed broadband. Singapore was the country with the fastest mean download speed and Kuwait showed the most improvement last year. To stay up to date on performance in specific countries, refer to the Speedtest Global Index for monthly comparisons of internet speeds.

Download Ookla’s Year in Mobile and Fixed Broadband Speeds poster here to see the full picture of network performance, availability and quality around the world. It works as a desktop background or you can hang it on your wall. Congratulations on a banner year in mobile performance, and cheers to even more improvements in 2020!

We want to know what you think. Our team is interested in better understanding who you are and why you use Speedtest. Take this very brief survey to help us improve upcoming product features. Thank you!

Ookla retains ownership of this article including all of the intellectual property rights, data, content graphs and analysis. This article may not be quoted, reproduced, distributed or published for any commercial purpose without prior consent. Members of the press and others using the findings in this article for non-commercial purposes are welcome to publicly share and link to report information with attribution to Ookla.

| October 29, 2019

Introducing Speedtest® CLI

At Ookla’s core, we are a team of passionate technology enthusiasts who constantly push to improve the speed of the internet across the globe. For thirteen years, Speedtest.net has provided the leading tools for people around the world to measure the speed and latency of their internet connections. From our Adobe Flash roots to our modern HTML5 and native applications, we have constantly focused on providing a high fidelity and rich experience for all internet users.

We have seen and have connected with many others who have the same goal — teams who have built brilliant ideas that leverage internet performance metrics to drive speed and reliability advancements across global networks.

Ookla’s goal is to support these teams by providing the best benchmarking toolsets to drive internet performance improvements across the world. Speedtest CLI is the next step in providing developers and engineers low level access to programmatically measure internet performance.

You can now run a Speedtest from your command line

We are proud to introduce our latest (and most visually minimal) application, Speedtest CLI. Speedtest CLI is a major departure from our existing applications — it is entirely text driven and does not have a traditional user interface. However, this minimalist interface is incredibly powerful — it provides the core of our Speedtest engines to software developers across the world.
speedtest-cli-Command_Line_Interface_1019L-1

This release marks the ability for any non-commercial individual to leverage over a decade of optimization and experience of network benchmarking within their own applications. Not only does Speedtest CLI provide best in class measurement techniques, but it also leverages our highly optimized C++ engine, custom Layer 7 protocols and the largest internet performance server network in the world to squeeze every bit per second out of a connection — even on embedded hardware. This is the same engine that powers our other native applications, and it is much more performant than existing solutions that rely on HTTP/S and traditional file transfer libraries.

For commercial entities, we offer Speedtest PoweredTM. Speedtest Powered further improves upon Speedtest CLI by providing deep network level customization, additional architectures, custom toolchain builds and enterprise support.

How you can use Speedtest CLI

We provide a number of different methods of working and communicating with Speedtest CLI. There is a basic user interface which provides the current stage and progress of the test for interactive use. However, the real power lies in the other output formats. We provide output in character delimited formats (CSV/TSV) and JSONL with a high sample rate — these can be consumed via the standard input of other applications to create live time progress meters and dynamic user interfaces.

Speedtest CLI can run on any platform

Speedtest is renowned for the ability to run on any platform, and Speedtest CLI is no exception. At launch, we will support Windows, MacOS, Linux and FreeBSD operating systems with statically compiled binaries. We are also excited to see what people will build within the IoT space on embedded devices — as a result, not only will we support the traditional i386 and AMD64 architectures, but we will also provide optimized builds for the ARM32 and ARM64 architectures on Linux.

Use cases for Speedtest CLI

One example of how Speedtest CLI can be used is a historical network monitoring tool. In a previous post, How I Maximized The Speed Of My Non-gigabit Internet Connection, Brennen Smith showcased an open source application which has tracked the historical performance of his internet connection with an internal build of Speedtest CLI. Now that this tool has been running for over a year, we can see that there have been multiple improvements on the ISP’s network. We can see that his upstream provider improved latency on November 2nd, and that there were multiple improvements on upload bandwidth since November 2018. Despite these improvements, one can also observe that there was degradation of the network from March 7th – 9th.
Ookla_Graphed-Speedtest-CLI-to-track-historical-performance_1019-1

These are critical key performance indicators to track; with Speedtest CLI, anyone can build world-class applications to monitor and track network performance around the globe.

Tell us what you’re building with Speedtest CLI

The team at Ookla is incredibly excited to see what the community builds around Speedtest CLI. Please share your achievements and any tools you build with Speedtest CLI by tagging us on GitHub, Facebook or Twitter. We’re looking forward to seeing how you drive innovation and improvements to create a better internet for everyone across the world.

For more information about Speedtest CLI and documentation, please visit the Speedtest CLI page.

Ookla retains ownership of this article including all of the intellectual property rights, data, content graphs and analysis. This article may not be quoted, reproduced, distributed or published for any commercial purpose without prior consent. Members of the press and others using the findings in this article for non-commercial purposes are welcome to publicly share and link to report information with attribution to Ookla.

| August 21, 2019

Examining Vodafone Idea Performance One Year After the Merger

When Vodafone India merged with Idea Cellular, the company promised a better network and new technology that would result in improved performance. So has it? We analyzed Speedtest IntelligenceTM data from August 2018 – July 2019 to find out. Because Vodafone and Idea still maintain separate brands, we’ve considered their data separately, but the trends in their performance are similar.

How mobile speeds have changed in India

vodafone-graph-1

Speedtest results show that mobile download speeds in India improved on average for all the top mobile operators over the period of August 2018 – July 2019, with Airtel holding onto the title of fastest operator throughout these 12 months.

However, a month-by-month view reveals a more interesting story. After May 2019, mean mobile download speeds for both Airtel and Jio started a decline that continued through July 2019. Meanwhile, Vodafone saw a decline in mean mobile speed from November 2018 through January 2019, after which they recovered to significantly increase download speed to effect a year-over-year improvement of 23.6%. Mobile download speeds on Idea improved in every month except December 2018, for a year-over-year improvement of 51.2%. In comparison, Airtel’s download speed increased 7.7% during the same period and Jio’s download speed went up 10.8%.

Operators meeting the Acceptable Speed Ratio

vodafone-graph-2

One measure of a mobile operator’s performance is how consistently they provide speeds at or above 5 Mbps, which is fast enough for consumers to reliably use mobile devices to stream HD video. We call this the Acceptable Speed Ratio (ASR).

Looking at mobile performance in India over the past year, Airtel had the highest ASR in every single month, with an ASR for the year of 70.4%. Despite a dip in January, Vodafone had the second highest ASR throughout the year with an average ASR of 60.3%. Jio held third place for ASR until April 2019, when they were overtaken by a steadily improving Idea. On average, though, Jio ranked third for ASR for the year at 54.5% while Idea’s ASR for the year was 52.5%.

How mobile and fixed broadband speeds compare in India

vodafone-graph-3

Looking at India as a whole, mean mobile download speed increased 16.2% in India last year. While this percentage alone may appear strong, it represents an improvement of less than 1.5 Mbps over 12 months. Also worrying, the country’s average mobile download speed declined after May 2019. 5G can’t come soon enough.

Meanwhile, India’s download speed over fixed broadband achieved a 25.3% increase during the past 12 months, a 6.21 Mbps improvement. Jio saw the largest increase in mean download speed over fixed broadband among top providers during the past 12 months with a 120.1% increase. BSNL increased 74.2%, GTPL 32.1%, Airtel 23.8%, YOU Broadband 13.9%, and ACT 12.0%. Hathway’s mean download speed over fixed broadband fell 0.2%. ACT was the fastest provider for each of the 12 months we examined.

India’s global ranking for mobile speeds is falling

vodafone-graph-4

Looking at the Speedtest Global IndexTM, India ranks poorly for mobile download speed when compared with neighboring countries and fell further behind throughout the past year. India ranked better for fixed broadband when compared to neighboring countries, though that rank, too, has slipped over the past 12 months. We’ll be interested to see if Jio’s plan to launch fiber-to-the-home (FTTH) in September improves the national average speed for fixed broadband.

Based on mobile download speed and ASR, Vodafone Idea customers are definitely benefitting from last year’s merger. Which is good, because the increase in mobile download speeds in India as a whole was nominal and not keeping pace with the rise in download speed over fixed broadband. Worse, India’s mobile download speed is not keeping up with a general global improvement. We hope continued investments by mobile operators will turn mobile speeds around even before 5G finally launches in India. We’ll continue to watch for increases in performance and to see how the coming FTTH expansion affects India’s fixed broadband speeds.

Ookla retains ownership of this article including all of the intellectual property rights, data, content graphs and analysis. This article may not be quoted, reproduced, distributed or published for any commercial purpose without prior consent. Members of the press and others using the findings in this article for non-commercial purposes are welcome to publicly share and link to report information with attribution to Ookla.

| January 15, 2020

Power is Key to Mobile Network Recovery After Earthquakes in Puerto Rico

Mobile connectivity is crucial in the wake of a natural disaster as consumers seek to connect with loved ones and vital services. This is made all the more difficult by the fact that natural disasters can also wreak havoc on the infrastructure that supports that connectivity, including electrical power. In order to support recovery efforts, we used Speedtest® data from before and after the major recent earthquakes in Puerto Rico to see how mobile users were affected and where network connectivity currently stands.

While it was reported that power plants automatically shut off for safety following the quake on Monday, January 6 at 6:32 a.m. local time, we do not see the same effect to mobile networks during that time as we did when power plants were then reportedly damaged in the Tuesday, January 7 quake that struck at 4:24 a.m. local time. Not all power plants were yet fully online by the time of the quake on Saturday, January 11 at 8:54 a.m. Electricity is essential to power cellular networks and not all cell sites have on-site power generators. We explore the various impacts of these power outages below.

Signal measurements and test volumes dropped after Tuesday’s quake

An hourly timelapse from the time before the first major earthquake on Monday, January 6, through the second (Tuesday, January 7) and third (Saturday, January 11) show the number of passive signal measurements from Android devices on the island of Puerto Rico.

Coverage scans timelapse

We see a similar pattern of scans throughout the period, but the volume of samples declines following each of the three quakes.

PR-Embedded-Volumes-Devices-Tests-4

Embedded tests also dropped off after the Tuesday, January 7 earthquake. These come from devices (including: routers, gateways, modems, test and measurement devices and IoT Devices) that use Speedtest PoweredTM to monitor connectivity by running a Speedtest, usually on a regular schedule. Except when the power is out.

No service status jumped after Tuesday’s quake

PR-No-Service-Scans-Devices

The proportion of scans and devices with no service in Puerto Rico show a large jump after the earthquake on Tuesday, January 7 compared with the time period following the Monday, January 6 quake. This shows that the real impact to mobile networks was a result of the quake on Tuesday, January 7, likely because of power outages, and that networks were slowly recovering in the days after.

It looks as though scans and devices with no service were trending upward following the quake on Saturday, January 11 as well, though full data was still trickling in as this article was being written.

Battery level fell when devices were disconnected from power

For signal to matter, a device needs to have battery or the ability to charge. We used Speedtest data to analyze the proportion of devices that were connected to power during a coverage scan during the month of January.
Proportion-of-Devices-Connected-Puerto-Rico_0120-4
Before and after the earthquake on Monday, January 6, we see a fairly consistent daily pattern where between 30% and 85% of devices are connected to power during a scan. Immediately following the quake on Tuesday, January 7, there is a sharp drop in devices connected to power. The pattern had still not fully recovered when the third major quake hit on the morning of Saturday, January 11. There also appeared to be a longer than average dip in devices connected to power immediately following Saturday’s quake, but the pattern looks to be normalizing in the days since.

The disruption in devices connected to power after the January 7 quake then affected average battery life of unplugged devices. This drop in average battery level reflects devices that had been charging when the power went out. We can also see that the average battery level didn’t return to a normal cycle until Friday, January 10.

Average-Battery-Level-of-Devices-Puerto-Rico_0120-2

While these battery observations may appear straight-forward, they are important to highlight because they illuminate the cascading connectivity challenges that communities face in times of crisis.

Natural disasters can happen anywhere. In places like Puerto Rico, where the power grid is still suffering from the effects of Hurricane Maria, the effects of additional natural disasters on critical mobile networks can be especially challenging. Full power was expected to have been restored to the island on Sunday.

At Ookla, we share data pro bono in times of need that can help assist recovery in a number of ways. If you are an operator or regulator assisting with rebuild efforts in Puerto Rico that could use Ookla data to aid your immediate efforts, please inquire for more information.

Ookla retains ownership of this article including all of the intellectual property rights, data, content graphs and analysis. This article may not be quoted, reproduced, distributed or published for any commercial purpose without prior consent. Members of the press and others using the findings in this article for non-commercial purposes are welcome to publicly share and link to report information with attribution to Ookla.

| September 17, 2019

What Happens to the Internet When Mobile Providers Go Down

You may have experienced the panic that happens when you realize you can’t get a connection on your phone. Most of us in these moments will try several ways of getting online before rushing to Downdetector® to see if our mobile operator is out of service or if it’s just us. Having access to data from both Downdetector and Speedtest® gives us unique insight into how network outages impact the internet as a whole, and in this article we’re exploring that impact in several key markets around the world.

The outages we explored

We looked specifically for recent outages that affected mobile networks in a variety of countries around the globe. The outages we explored were in Brazil (Vivo — 12,994 reports on August 22), Canada (Rogers and Freedom Mobile — 35,685 reports July 7-8), Italy (Iliad — 3,018 reports on June 21), India (Vodafone-Idea — 1,386 reports on July 17), the Netherlands (KPN Mobile, T-Mobile and Vodafone — 92,391 reports on June 24), Sweden (Tele2 — 7,275 reports June 17-19) and the United States (T-Mobile — 95,267 reports on September 6).

Working hypotheses

We had three hypotheses when we set out to do this analysis based on what we would expect to happen in a prolonged, near-total mobile outage:

  1. Mobile speeds would increase during an outage (for those who could connect) because there would be significantly less network congestion.
  2. Fixed broadband speeds would not change during an outage.
  3. The number of mobile Speedtest results would increase on the day of the outage as users tried to troubleshoot their connections.
  4. The number of fixed broadband Speedtest results would also increase on the day of the outage as people switched from mobile to fixed broadband to try and connect.

As with any real-world experiment there are many variables that can affect the results but for which we cannot control. Each of these outages varied in duration, cause and totality — factors which affect potential outcomes.

Mobile Outages Affect Download Speed in Different Ways

We compared each operator’s mean download speed over mobile on the day of the outage with their mean speed during that month to see if our hypothesis held. Results were mixed.

How Mobile Outages Affect Mobile Speed

In India and the U.S., mobile download speeds did increase very slightly for each provider on the day of the outage when compared with the monthly average. Both of these outages were localized within the country with the Indian outage centering around Ahmedabad and the U.S. outage falling on the East Coast.

On the other hand, mobile download speeds in Brazil and Italy were lower on the day of the outage than the monthly average. Significantly so in Italy. In both of these instances the mobile operator was experiencing a geographically widespread outage.

The outage in Canada revealed two different stories as download speed decreased slightly during the outage for Rogers customers and increased for customers of Freedom Mobile. Results were also mixed in the Netherlands with Vodafone customers seeing a significantly higher download speed, KPN Mobile customers seeing a slightly higher speed and T-Mobile customers seeing a decrease in download speed.

The outage in Sweden occurred in three waves over three separate days:

Downdetector view of June 2019 Tele2 Outage Peaks

We looked at each separately and found that mobile download speed on Tele2 increased during the smaller first and last waves. Meanwhile, mean download speed decreased during the largest middle outage.

Fixed broadband speeds show only slight variations

We measured download speed over fixed broadband at the country level both on the day(s) of the outages and compared that number with the average download speed for the appropriate month.

How Mobile Outages Affect Fixed Broadband Speed

Our hypothesis about fixed speeds not changing during mobile outages proved mostly true. Although download speed over fixed broadband did decrease in Italy and the Netherlands during their country-wide outages, the decrease was very small. In Canada there was virtually no difference in speed between the day of the outage and the monthly average.

Download speed over fixed broadband was faster during the outages in all other countries we examined. However, the differences were not large enough to rule out day-to-day fluctuations in speed.

Speedtest results usually increase during outages

We also compared the number of Speedtest results over both mobile and fixed broadband during the outages with the daily averages in each country for the appropriate month.

Effect of Mobile Outages on Number of Speedtest Results

Our hypothesis that the number of mobile Speedtest results would increase on the day of an outage held mostly true. Exceptions were Canada and two days of the Swedish outage. Fixed broadband Speedtest results also mostly increased, except in Canada and the Netherlands, but for the most part only very minimally.

Contact us to learn how data from Downdetector and Speedtest can help you before, during and after an outage.

Ookla retains ownership of this article including all of the intellectual property rights, data, content graphs and analysis. This article may not be quoted, reproduced, distributed or published for any commercial purpose without prior consent. Members of the press and others using the findings in this article for non-commercial purposes are welcome to publicly share and link to report information with attribution to Ookla.

| October 1, 2019

How 5G is Changing the Global Mobile Landscape

Five months ago, we started using the Ookla 5G MapTM to track 5G across the world. In the months since, 5G deployments have increased exponentially — where we saw 294 around the world in May, today there are more than that in Switzerland alone. Today we’re exploring where 5G is gaining the most traction, including an analysis of how much faster 5G is than 4G in various markets.

Countries with the most 5G deployments

The Ookla 5G Map reveals that Switzerland is winning the race of 5G expansion with more than twice as many commercially available deployments as second-place South Korea. Kuwait has the third largest number of 5G deployments in the world.

Ookla_Countries-with-the-most-5G-deployments-2

It’s interesting to note that of the world’s six largest economies, three do not have commercially available 5G at all (China, Japan and India). China does have 29 locations where 5G is in pre-release (with 5G network hardware in place but not yet accessible to consumers). Japan is expected to launch 5G in 2020 and 5G will likely be available in India in 2021.

The other three largest economies (the U.S., Germany and the U.K.) do feature among the 10 countries with the most commercially available 5G deployments, although they individually have many fewer deployments than Switzerland, South Korea and Kuwait.

5G downloads are at least 300% faster than 4G

In theory, 5G could eventually offer download speeds about 1300% faster than those on 4G. Real-world factors affect those numbers, though, so we examined data from Speedtest IntelligenceTM to see what consumers actually experienced in several key markets between June and August 2019.

Comparing Mean Speeds on 5G and 4G
Speedtest Results | June-August 2019
Country 4G Download (Mbps) 4G Upload (Mbps) 5G Download (Mbps) 5G Upload (Mbps) % Difference Download
Australia 60.59 16.37 258.18 33.25 326.1%
Bahrain 28.80 13.43 311.41 29.43 981.3%
Kuwait 34.02 18.36 352.93 23.24 937.4%
Qatar 62.27 17.57 303.57 36.78 387.5%
Saudi Arabia 42.11 16.50 395.04 33.75 838.1%
South Korea 64.79 14.66 393.07 30.33 506.7%
Switzerland 50.65 20.10 362.75 43.12 616.2%
United Arab Emirates 59.23 20.12 334.27 32.07 464.4%
United Kingdom 31.03 11.47 181.87 18.34 486.1%
United States 34.33 9.98 477.42 21.93 1290.7%

The mean download speed over 5G was fastest in the U.S. and also showed the largest percent difference when compared with mean download speed over 4G. Saudi Arabia had the second fastest mean download speed over 5G with South Korea coming in a close third. On the other end of the spectrum, the U.K. had the slowest mean download speed over 5G. Australia was the second slowest and Bahrain third slowest. Bahrain showed the second highest percent improvement when comparing 4G and 5G download speeds, though, and Kuwait was third. Australia showed the lowest percent increase between 4G and 5G download speeds and Qatar had the second lowest.

Mean upload speeds over 5G are less remarkable, though in almost every country we analyzed they represent a 50-120% improvement over those available on 4G. Kuwait was the exception, with only a 26.6% improvement in mean upload speed when using 5G rather than 4G. The U.S. and Bahrain were nearly tied for most improved with increases of 119.7% and 119.1%, respectively, when comparing mean upload speed on 5G to that on 4G. Switzerland had the fastest mean upload speed over 5G, Qatar was second and Saudi Arabia third. Mean upload speed over 5G was the slowest in the U.K., second slowest in the U.S. and third slowest in Kuwait.

5G Share of 4G/5G Speedtest Samples
June-August 2019
Country % 5G
South Korea 12.72%
Australia 1.31%
United Arab Emirates 0.65%
Kuwait 0.64%
Switzerland 0.59%
Qatar 0.43%
United Kingdom 0.30%
United States 0.20%
Bahrain 0.09%
Saudi Arabia 0.03%

The 5G share of the tests taken on either 4G or 5G differs widely among the countries on our list. South Korea was clearly on top with 5G accounting for nearly 13% of Speedtest 4G/5G samples. This is not surprising given that one South Korean mobile operator already has 1 million 5G subscribers. Australia had the second largest percentage of 5G tests and the U.A.E. third. Saudi Arabia had the smallest percentage of 5G results.

Ookla is your go-to resource for ongoing 5G analysis

Ookla will continue to analyze 5G speeds as operators across the globe make this significant improvement in their networks. We’re uniquely capable of measuring 5G speeds because Speedtest uses a client and server testing engine capable of measuring high-speed connections (up to 10 Gbps) that dynamically scales the number of connections to the server in order to saturate and accurately measure the client-side connection. This allows us to measure the full extent of real-world performance and overcome the effects of network bottlenecks such as TCP slow start and means we are unique in our ability to measure 5G.

In addition, Ookla has partnered with operators and device manufacturers all over the world to implement accurate in-app 5G detection — even as Android Pie, which powers the current generation of 5G devices, does not natively identify 5G connection types. Through this approach, we’re able to properly configure the parameters of a Speedtest and measure 5G tests.

Keep watching this space for future analyses or contact us to learn more about how our data can help you.

To get a broader understanding of how 5G is changing the mobile landscape, read our previous coverage here:

Ookla retains ownership of this article including all of the intellectual property rights, data, content graphs and analysis. This article may not be quoted, reproduced, distributed or published for any commercial purpose without prior consent. Members of the press and others using the findings in this article for non-commercial purposes are welcome to publicly share and link to report information with attribution to Ookla.

| January 28, 2020

Mobile Experience in the Caribbean: Where Roaming Doesn’t Sink Speeds


Winter’s on in the northern hemisphere, and travelers from all over are booking cruises to the Caribbean for a little sun. If a phone figures into that fabulous vacation, it’s important to know where mobile roaming speeds will slow down the fun. We examined Speedtest® data from Q4 2019 for five popular Caribbean destinations to see which country has the best roaming speed, how roaming affects latency and how country of origin affects results.

Roaming speeds excel in the French Antilles

Roaming agreements are complex arrangements negotiated between individual mobile operators on a country-by-country basis. For travelers this means that mobile speeds can be very unpredictable abroad. Speedtest data showed Guadeloupe and Martinique had the fastest mean inbound roaming download speeds of all the countries on our list during Q4 2019.
Ookla-Inbound-Roaming-Speeds-Caribbean_0120
On the other hand, visitors to Cuba and The Bahamas saw the slowest mean download speeds while roaming during Q4 2019.

Local speed does not predict roaming speed

We expect to see slow roaming speeds in countries with slow mobile speeds overall, because roaming relies on in-country networks. However, when we look only at the percent difference between roaming and local speeds, we see that local speed was not the only indicator of roaming speed.

Comparing Inbound Roaming Speeds to Local Speeds in the Caribbean
Speedtest® Data | Q4 2019
Country Local Download (Mbps) % Decrease Download When Roaming Local Upload (Mbps) % Decrease Upload When Roaming
Cuba 28.45 82.9% 12.98 19.4%
Antigua and Barbuda 41.66 75.5% 13.18 56.4%
The Bahamas 23.21 68.8% 11.99 49.0%
Guadeloupe 46.33 31.6% 12.52 45.8%
Puerto Rico 27.46 31.3% 10.83 37.4%
Dominican Republic 26.58 21.8% 10.49 37.9%
Martinique 32.59 4.2% 10.37 4.1%

For example, Antigua and Barbuda’s mean local download speed was the second fastest on our list during Q4 2019, but that figure represents a 75.5% decrease in mean roaming download speed. The result is that Antigua and Barbuda ranked third to last for mean roaming download speed during Q4 2019. Cuba showed the largest decrease in mean download speed between roaming and local at 82.9%. Martinique showed the smallest decrease at 4.2%.

Roaming’s effect on latency

Latency is a major pain point for consumers who are roaming outside of their home country. Roaming signals are routed from the country a consumer is visiting to their country of origin and then back to where they physically are with their phones.

Comparing Inbound Roaming to Local Latency in Caribbean Countries
Speedtest® Data | Q4 2019
Country Roaming Latency (ms) Local Latency (ms) % Increase Latency When Roaming
Cuba 472 100 372.0%
Guadeloupe 289 80 261.3%
Martinique 289 99 191.9%
Dominican Republic 216 35 517.1%
Puerto Rico 174 52 234.6%
Antigua and Barbuda 149 28 432.1%
The Bahamas 149 32 365.6%

Latency while roaming was highest by far in Cuba during Q4 2019. Roaming latency represented a 372.0% increase over local latency, which was also higher in Cuba than any other country on this list. The high roaming latency in both Guadeloupe and Martinique is likely both because local latency is higher there and because the majority of samples we saw in those locations were roamers from France, so the signals for roamers had to cross an ocean, twice.

Antigua and Barbuda and The Bahamas were tied for the lowest latency we saw for consumers roaming in the Caribbean during Q4 2019. These two countries also had the lowest local latencies during this period.

Performance varies widely by roamer’s origin and destination

Mobile Roaming Speeds and Latency for U.S. Consumers in Three Caribbean Markets
Speedtest® Data | Q4 2019
Country Roaming Download (Mbps) % Decrease Download When Roaming Roaming Upload (Mbps) % Decrease Upload When Roaming Roaming Latency (ms) % Increase Latency When Roaming
Dominican Republic 21.43 19.4% 5.98 43.0% 144 311.4%
Puerto Rico 19.74 28.1% 6.43 40.6% 172 230.8%
The Bahamas 7.20 69.0% 6.20 48.3% 143 346.9%

Although Puerto Rico is a U.S. territory, visitors from the 50 states of the union had a faster mean download speed roaming in the Dominican Republic than they did in Puerto Rico during Q4 2019. Both were slower than the U.S. average download of 38.74 Mbps during that period.

Roaming download speed for U.S. visitors to The Bahamas were much slower than those seen in the other two locations and 19.4% slower than the mean download speed for residents of The Bahamas. Latency for U.S. roamers was also much higher in Puerto Rico than it was in either The Bahamas or the Dominican Republic. For comparison, mean latency in the U.S. was 47 ms during the same period.

Roaming upload speeds for U.S. visitors were much more similar between the three destinations than we saw on the download side. All were much slower than the mean upload speed in the U.S. of 11.19 Mbps during Q4 2019.

Mobile Roaming Speeds and Latency for French Consumers in Two Caribbean Markets
Speedtest® Data | Q4 2019
Country Roaming Download (Mbps) % Decrease Download When Roaming Roaming Upload (Mbps) % Decrease Upload When Roaming Roaming Latency (ms) % Increase Latency When Roaming
Guadeloupe 35.65 23.1% 7.53 39.9% 285 256.3%
Martinique 31.22 4.2% 9.94 4.1% 289 191.9%

French visitors to Guadeloupe and Martinique experienced similar speeds and latency roaming in both locations, despite the sharp difference in local speeds. Considering the mean download speed in France was 44.19 Mbps and upload was 10.94 Mbps during the same period, these roaming speeds require a bit of an adjustment, but not painfully so. Latency, on the other hand, will require users to pack their patience, as mean latency in France during this same period was 41 ms.

Guadeloupe, Martinique, the Dominican Republic and Puerto Rico are among the best Caribbean destinations if roaming performance is a factor in choosing a cruise. Either way, multi-island travelers should be prepared for a variety of mobile roaming experiences in a variety of countries and aboard ships where roaming uses the ship’s cellular or Wi-Fi network.

If you’re a mobile operator interested in improving roaming performance to make your country even more attractive to foreign visitors, learn more about how Speedtest IntelligenceTM can help you.

Ookla retains ownership of this article including all of the intellectual property rights, data, content graphs and analysis. This article may not be quoted, reproduced, distributed or published for any commercial purpose without prior consent. Members of the press and others using the findings in this article for non-commercial purposes are welcome to publicly share and link to report information with attribution to Ookla.

| October 14, 2019

Exploring Recent Trends in the Latin American Telecom Market


Leer en español | Leia em Português

The Latin American telecommunications market continues to be fascinating to watch as fixed broadband speeds increase and mobile operators ready their networks for 5G. In anticipation of Futurecom, we analyzed internet speeds and 4G Availability for Q2-Q3 2019 in Latin America’s major markets to see who’s leading the charge to the future.

Mobile and fixed speeds are increasing at the country level

LatAm-Mobile-Fixed-Speeds-in-Largest-Markets

Fixed broadband speeds are on the rise in Latin America’s largest markets. Colombia’s mean download speed increased 30.6% during Q2-Q3 2019 while Mexico’s increased 15.6%. Chile had the fastest mean download speed over fixed broadband by far and showed a 26.7% increase in speed during the period. Brazil was the second fastest throughout the period. Peru, Mexico and Argentina were closely vying for third, but in the end Peru won out. Colombia had the slowest download speed over fixed broadband.

Mobile speeds were much more competitive in Latin America’s largest markets. Increases in mean download speeds were not nearly as impressive as they were with fixed broadband, though. Mexico saw the greatest increase during Q2-Q3 2019 at 12.0%. Argentina’s mobile download speed increased 11.0%, followed by Brazil (7.9%), Chile (5.1%) and Colombia (4.6%). Peru’s mean download speed over mobile decreased 2.2% during the period. Mexico had the fastest mobile speed, followed by Peru, Brazil, Argentina, Chile and, finally, Colombia.

4G Availability varies widely by country

LatAm-4G-Availability-Q2-Q3

We looked at the percentage of surveyed locations where devices could access 4G LTE service in Latin America’s major markets during Q2-Q3 2019 and found that Peru was on top with 77.8% 4G Availability during the period. Chile came in second with 75.5% and Argentina third at 71.4%. Brazil had the lowest 4G Availability at 47.3% and Colombia had the second lowest at 50.6%.

City speeds vary by technology

Ookla_Internet-Speeds-in-Latin-America-Largetst-Cities_1019_EN
Fixed broadband speeds have increased dramatically in Latin America’s largest cities since we last examined them and these speeds have shifted the rankings significantly. Santiago, Chile had the fastest download speed over fixed broadband in Q2-Q3 2019, beating second-place Brasília, Brazil by 66.6%. São Paulo, Brazil came in a close third. Bogotá, Colombia had the slowest download speed over fixed broadband of the cities on our list. Lima, Peru was the second slowest city and Mexico City, Mexico third slowest.

Because of the political situation in Venezuela, we did not include Caracas in our analysis.

Mobile rankings have changed significantly since we last considered speeds in Latin America’s largest cities. Salvador, Brazil had the fastest mobile download speed on our list during this period. Brasília, Brazil was a close second and Mexico City, Mexico third fastest. Bogotá, Colombia also had the slowest mobile download speed on our list. Santiago, Chile was the second slowest city for mobile and Fortaleza, Brazil the third slowest.

Ookla will be at Futurecom! If you’d like to connect to learn more about the Latin American telecom market and how our data can help you, contact us.

Análisis de las tendencias recientes en el mercado de las telecomunicaciones de América Latina

El mercado de las telecomunicaciones de América Latina continúa siendo fascinante de analizar a medida que las velocidades de la banda ancha fija aumentan y los operadores de telefonía móvil preparan sus redes para la tecnología 5G. Mientras esperamos Futurecom, examinamos las velocidades de Internet y la disponibilidad de 4G en el segundo y tercer trimestre de 2019 en los principales mercados de América Latina para ver quién está a la vanguardia del cambio de cara al futuro.

Las velocidades fijas y móviles están aumentando en cada país

LatAm-Mobile-Fixed-Speeds-in-Largest-Markets_ES

Las velocidades de la banda ancha fija están en aumento en los mercados más importantes de América Latina. La velocidad media de descarga de Colombia aumentó un 30,6 % durante el segundo y tercer trimestre de 2019, mientras que la de México se incrementó en un 15,6 %. Chile tuvo la velocidad media de descarga por banda ancha más rápida por lejos y demostró un aumento del 26,7 % en la velocidad durante el período. Brasil fue el segundo más rápido en todo el período. Perú, México y Argentina le siguieron de cerca compitiendo por el tercer puesto, pero al final, ganó Perú. Colombia tuvo la velocidad de descarga por banda ancha fija más lenta.

Las velocidades móviles fueron mucho más competitivas en los mercados más importantes de América Latina. Sin embargo, los aumentos en las velocidades medias de descarga no fueron tan impresionantes como lo fueron los de la banda ancha fija. México tuvo el mayor aumento durante el segundo y tercer trimestre de 2019 con un 12 %. La velocidad de descarga móvil de Argentina aumentó un 11 %, seguida por Brasil (7,9 %), Chile (5,1 %) y Colombia (4,6 %). La velocidad media de descarga móvil de Perú disminuyó un 2,2 % durante el período. México tuvo la velocidad móvil más rápida, seguido por Perú, Brasil, Argentina, Chile y, por último, Colombia.

La disponibilidad de 4G varía ampliamente por país

LatAm-4G-Availability-Q2-Q3_ES

Examinamos el porcentaje de lugares encuestados en donde los dispositivos pudieran acceder al servicio 4G LTE en los principales mercados de América Latina durante el segundo y tercer trimestre de 2019 y concluimos que Perú quedó en la cima con un 77,8 % de disponibilidad de 4G durante el período. Chile quedó segundo con el 75,5 % y Argentina quedó en el tercer lugar con el 71,4 %. Brasil tuvo la menor disponibilidad de 4G con el 47,3 % y Colombia tuvo el segundo nivel más bajo, con el 50,6 %.

Las velocidades de las ciudades varían según la tecnología

Ookla_Internet-Speeds-in-Latin-America-Largetst-Cities_1019_ES

Las velocidades de la banda ancha fija han aumentado drásticamente en las ciudades más importantes de América Latina desde la última vez que las analizamos y estas velocidades han cambiado las clasificaciones de manera significativa. Santiago, Chile, tuvo la mayor velocidad de descarga en banda ancha fija en el segundo y tercer trimestre de 2019, y venció a Brasilia, Brasil, que se quedó con el segundo lugar por el 66.6%. San Pablo, Brasil, quedó en tercer lugar, cerca. Bogotá, Colombia tuvo la velocidad de descarga por banda ancha fija más lenta de las ciudades en nuestra lista. Lima, Perú, fue la segunda ciudad más lenta, y la Ciudad de México, México, la tercera.

Debido a la situación política de Venezuela, no incluimos a Caracas en nuestro análisis.

Las clasificaciones móviles ha cambiado de manera significativa desde la última vez que analizamos las velocidades en las ciudades más importantes de América Latina. Salvador, Brasil, tuvo la velocidad de descarga móvil más rápida en nuestra lista durante este período. Brasilia, Brasil, quedó en segundo lugar por poco, y la Ciudad de México, México, fue la tercera más rápida. Bogotá, Colombia, también tuvo la velocidad de descarga móvil más lenta en nuestra lista. Santiago, Chile, fue la segunda ciudad más lenta en velocidad móvil, y Fortaleza, Brasil, la tercera más lenta.

Ookla estará en Futurecom. Si desean ponerse en contacto para obtener más información sobre el mercado de las telecomunicaciones en América Latina y cómo nuestros datos pueden ayudarlos, comuníquense con nosotros.

Tendências recentes no mercado de telecomunicações da América Latina

O mercado de telecomunicações da América Latina continua fascinante graças ao aumento das velocidades de banda larga e a preparação das redes de operadoras de celular para o 5G. Nas vésperas da Futurecom, analisamos as velocidades da internet e a disponibilidade de redes 4G entre o segundo e o terceiro trimestres de 2019 nos principais mercados da América Latina, para ver quem está liderando essa empreitada em direção ao futuro.

As velocidades de redes fixas e móveis dos países estão aumentando

LatAm-Mobile-Fixed-Speeds-in-Largest-Markets_PT

A velocidade da banda larga está aumentando nos maiores mercados da América Latina. A velocidade média de download da Colômbia aumentou 30,6% entre o segundo e o terceiro trimestres de 2019, enquanto no México ela aumentou 15,6%. O Chile teve, de longe, a maior velocidade média de download em banda larga fixa, com um aumento de 26,7% na velocidade durante o período. O Brasil foi o segundo mais rápido durante o período. Peru, México e Argentina disputaram acirradamente o terceiro lugar, mas o Peru acabou vencendo. A Colômbia teve a menor velocidade de download em banda larga fixa.

Houve um aumento na concorrência no setor de velocidades móveis nos maiores mercados da América Latina. No entanto, o aumento na velocidade média de download não foi tão impressionante quanto na banda larga fixa. O México teve o maior aumento entre o segundo e o terceiro trimestres de 2019, com 12%. A velocidade de download móvel da Argentina aumentou 11%, seguida pelo Brasil (7,9%), Chile (5,1%) e Colômbia (4,6%). A velocidade média de download do Peru em rede móvel diminuiu 2,2% durante o período. O México teve a maior velocidade móvel, seguido de Peru, Brasil, Argentina, Chile e, por fim, Colômbia.

Disponibilidade do 4G varia muito conforme o país

LatAm-4G-Availability-Q2-Q3_PT

Analisamos a porcentagem de dispositivos com acesso ao serviço 4G LTE nos maiores mercados da América Latina entre o segundo e o terceiro trimestres de 2019 e descobrimos que o Peru teve a maior disponibilidade do 4G no período, com 77,8%. O Chile ficou em segundo, com 75,5%, enquanto a Argentina ficou em terceiro com 71,4%. O Brasil teve a menor disponibilidade do 4G, com 47,3%, enquanto a Colômbia teve a segunda menor, com 50,6%.

Velocidades no meio urbano variam de acordo com a tecnologia

Ookla_Internet-Speeds-in-Latin-America-Largetst-Cities_1019_PT

A velocidade de banda larga fixa aumentou dramaticamente nas maiores cidades da América Latina desde a nossa última análise, o que alterou os rankings de maneira significativa. Santiago, no Chile, teve a maior velocidade de download em banda larga fixa entre o segundo e terceiro trimestres de 2019, acima do segundo lugar, Brasília, com 66,6%. São Paulo ficou em terceiro lugar, com uma porcentagem próxima. Bogotá, na Colômbia, teve a menor velocidade de download em banda larga fixa nas cidades da lista. Lima, no Peru, teve a segunda menor velocidade, com a Cidade do México, no México, em terceiro.

Devido à situação política da Venezuela, Caracas não foi incluída na análise.

Os rankings de rede móvel mudaram significativamente desde nossa última análise da velocidade nas maiores cidades da América Latina. Salvador teve a maior velocidade de download em rede móvel durante o período. Brasília ficou em segundo lugar por pouco, enquanto a Cidade do México, no México, ficou em terceiro. Bogotá, na Colômbia, também teve a menor velocidade de download em rede móvel na nossa lista. Santiago, no Chile, teve a segunda menor velocidade para redes móveis, seguida por Fortaleza, que teve a terceira menor velocidade.

A Ookla estará na Futurecom! Entre em contato conosco para saber mais sobre o mercado de telecomunicações da América Latina e como nossos dados podem ajudá-lo.

Ookla retains ownership of this article including all of the intellectual property rights, data, content graphs and analysis. This article may not be quoted, reproduced, distributed or published for any commercial purpose without prior consent. Members of the press and others using the findings in this article for non-commercial purposes are welcome to publicly share and link to report information with attribution to Ookla.