Every telecommunications provider faces the challenge of customer churn — the rate at which subscribers cancel or switch providers over a given time period. While churn is inevitable, it isn’t cheap. Industry studies consistently show that acquiring a new customer costs 5 to 25 times more than keeping an existing one. Despite this economic reality, many internet providers struggle to identify the specific factors that drive customers to switch services.
As new technologies like 5G and Fiber to the Home (FTTH) transform the telecommunications landscape, providers need to look beyond traditional metrics like download speed to understand and improve customer satisfaction. Network responsiveness and the quality of everyday connected experiences – like video conferencing, streaming movies, and online gaming – play crucial roles in retaining customers. But without access to granular data and insights into these actual user experiences, providers risk misallocating resources and missing opportunities to address the true drivers of churn.
Ookla’s crowdsourced data provides these key insights by capturing both Quality of Experience (QoE) and Quality of Service (QoS) metrics, along with provider ratings and Net Promoter Scores (NPS), to reveal the reasons behind customer churn. In this article, we’ll explore how these comprehensive measurements help providers pinpoint churn factors, improve retention strategies, and optimize user experiences. For a deeper dive, check out our webinar “Why Customers Leave: Preventing Churn with Crowdsourced Data.”
The Connection Between Network Performance and Customer Retention
Customer decisions to stay or leave are heavily influenced by network performance. While promotional offers and pricing strategies play a role in these decisions, long-term retention also depends on delivering a fast, consistent, and responsive experience. Providers that fall short risk losing subscribers to competitors that consistently meet customer expectations.
A recent Ookla analysis revealed a striking pattern across the United States: providers with higher percentages of low-latency connections consistently achieve better customer satisfaction scores and higher retention rates than those with slower, less responsive networks. The impact of low latency on customer loyalty is particularly clear when looking at customer satisfaction for users on fiber compared to those on non-fiber networks:
Fiber networks averaged a 3.84 customer rating (on a 5-point scale) versus 3.17 for non-fiber connections.
Net Promoter Score (NPS) — a standard customer loyalty metric that measures willingness to recommend a company on a scale from 0-10 — showed an even more dramatic difference, with fiber networks achieving positive scores of around +20 while non-fiber networks averaged -16.5.
While providers have traditionally emphasized download speed in their marketing and performance assessments, our data shows that latency may play an even bigger role in keeping customers happy and reducing churn.
Beyond Speed: Understanding QoS and QoE Metrics
For decades, the telecommunications industry has typically focused on a single metric — download speed — as the primary measure of network quality. With download speed often viewed as a proxy for overall bandwidth, the assumption was that more bandwidth would generally lead to a better user experience.
However, speed alone doesn’t fully explain why customers with objectively fast connections can still experience issues like slow video buffering, delays in real-time applications, or inconsistent app performance. Other network factors — particularly latency — can significantly contribute to these problems, often leading to user frustration and, in some cases, prompting them to switch providers.
That’s why it’s crucial for providers to gain a more holistic view of performance that reflects how customers actually experience their network in daily life. Ookla collects this comprehensive data through two complementary approaches:
Quality of Service (QoS): Measuring What Networks Deliver
Quality of Service measures the technical aspects of network performance that affect user experience, including speed and latency, which influence how well a network can deliver a smooth, consistent connection.
QoS is measured when users actively run a Speedtest. These tests capture key network performance metrics, including:
Download and upload speeds (measuring network capacity)
Latency and jitter (measuring network responsiveness)
Network provider identification and connection type (mobile, fixed, Wi-Fi)
Quality of Experience (QoE): Measuring Real-World User Experiences
Quality of Experience metrics examine how users actually experience the network during everyday digital activities. These metrics provide insights into how various network types perform across key performance indicators that directly impact user satisfaction. From streaming Netflix and video chatting with colleagues to competing in online games, network performance plays a significant role in shaping the user experience.
QoE metrics are primarily collected through Ookla’s embedded SDK across hundreds of applications in the digital ecosystem, measuring performance across various network types, including fiber and non-fiber connections. Here are some notable performance differences observed between fiber and non-fiber networks based on QoE metrics:
Video streaming: Metrics like video start time show significant differences between network types, with fiber connections averaging 1.47 seconds versus 1.76 seconds for non-fiber, a 16% improvement that reduces buffering when starting videos or changing resolutions.
Web browsing: Page load times on fiber networks averaged 1.12 seconds compared to 1.35 seconds for non-fiber, a 17% faster experience that adds up to significant time savings during extended browsing sessions.
Video conferencing: Across Zoom, Google Meet, Microsoft Teams, and WhatsApp, fiber networks delivered conferencing latency of 51.56 ms versus 79.43 ms for non-fiber, a 35% improvement that, combined with other network factors, contributes to more consistent video and audio quality.
Gaming: Lower latency in fiber networks can create substantial competitive advantages in gaming. Ookla data shows fiber networks deliver gaming latency improvements ranging from 22.8% in Atlanta (48.95 ms vs 63.33 ms) to 62.2% in Seattle (39.35 ms vs 104.18 ms). For gamers, milliseconds matter – faster network response means more immediate reactions to controls, giving players a smoother experience and potential edge.
No one likes a laggy game, a frozen video call, or a sluggish webpage — and when frustration piles up, customers often start looking for a better option. Ookla’s QoE and QoS insights can help providers stay ahead of customer experience issues and make the kinds of improvements that keep users happy.
Understanding Churn: Where Customers Go and Why They Leave
It’s not enough to know that customers are leaving — providers need to know where they’re going and why. Traditional churn metrics only tell you that subscribers are switching, but they typically don’t reveal which competitors are gaining them or which locations are most affected.
That’s where Ookla’s Net Flow Percentage analysis comes in. By tracking aggregated, anonymized user data, providers can pinpoint exactly where they’re losing customers, find patterns in subscriber movement, and see how network performance correlates with subscriber losses or gains. Net Flow Percentage analysis helps providers:
Identify location patterns by analyzing service areas with changing usage trends
Observe provider transitions to understand shifts in market share over time
Calculate Net Flow percentage as the difference between users gained and users lost in a given area
When combined with performance metrics, Net Flow Percentage analysis offers key correlations that can guide targeted technical improvements where they’ll have the greatest impact on retention, while also revealing potential reasons behind churn.
How ISPs Can Prevent Churn
Providers can no longer afford to simply react to customer churn; they must be proactive in staying ahead of potential issues and actively fostering loyalty. Strategies that focus on continuously enhancing the customer experience are now essential. Ookla’s data provides valuable competitive benchmarking and insights to help identify and prioritize areas for optimization. Using this information, providers can deliver a high-quality user experience that minimizes churn and strengthens long-term customer relationships.
With data-driven insights, ISPs can focus on strategies to improve customer retention:
Fiber Deployment (FTTH) Expansion: High-performing fiber networks consistently deliver faster speeds and more reliable performance compared to non-fiber alternatives, providing a superior experience that helps reduce churn.
Low Latency: Providing users with consistently low latency is crucial for ensuring a smooth and responsive network experience, particularly for activities like video conferencing, gaming, and web browsing. Providers that deliver low latency tend to see higher customer satisfaction and reduced churn.
Quality of Experience Optimization and Proactive Monitoring: QoE metrics track critical user experience factors like video start times and service stability, allowing providers to monitor and address issues proactively, preventing dissatisfaction and minimizing churn risks.
Implementing proactive strategies to reduce churn enables ISPs to enhance customer satisfaction and build lasting loyalty, providing a strong competitive edge in the fast-evolving telecom industry.
Turning Insights into Action: Real-World Examples of Churn Prevention
Understanding why and where customers leave is only valuable if it leads to proactive, targeted action. Ookla’s analysis has pinpointed several examples where granular insights into network performance, user behavior, and technology gaps directly guided providers to address the root causes of churn:
Tackling Performance Issues: Small performance degradations can drive major customer losses. One provider observed that a 25% increase in YouTube and Google loading times coincided with significant customer departures. After network infrastructure upgrades at key connection points, web performance improved and customer retention stabilized.
Addressing Network Technology Gaps: Disparities in technology can significantly impact customer decisions. Data from Houston showed fiber networks delivering 10x faster speeds than non-fiber alternatives (477 Mbps vs. 47 Mbps), while users in Seattle experienced dramatically higher latency on non-fiber networks.
Leveraging Early Infrastructure Investments: Providers who deployed fiber early captured significant market share that continues to grow. This underscores the importance of timely network upgrades and the need for providers to accelerate fiber deployments, optimize latency, and consistently enhance the quality of experience to maintain competitive advantage.
While customer churn remains a major concern among telecom providers, those who leverage crowdsourced data to identify specific performance issues and technology gaps gain a decisive advantage. The key is targeting investments with precision, creating a virtuous cycle — better performance drives higher satisfaction, reduced churn, and ultimately stronger returns on infrastructure investments.
Conclusion: Using Data-Driven Insights Reduce Churn
The bottom line is that keeping customers is much cheaper than replacing them. That’s why understanding why they leave — and taking steps to prevent it — is so critical. By leveraging insights from Ookla’s QoS and QoE data, providers can gain a comprehensive understanding of both network performance and its impact on real-world user satisfaction.
With a clearer picture of the factors that drive churn, providers can address issues like slow speeds, high latency, and inconsistent experiences. Providers that invest in fiber, consistently deliver low latency, and proactively monitor QoE are better positioned to keep their customers happy — and prevent churn.
Ookla retains ownership of this article including all of the intellectual property rights, data, content graphs and analysis. This article may not be quoted, reproduced, distributed or published for any commercial purpose without prior consent. Members of the press and others using the findings in this article for non-commercial purposes are welcome to publicly share and link to report information with attribution to Ookla.
Dave Andersen is a Marketing Program Manager at Ookla, where he creates enterprise and consumer content across Ookla’s brands. Dave got his start in the telco space in 2012, producing content for RootMetrics. Dave has a bachelors in marketing from Washington State University and studied creative writing in Oklahoma State’s MFA program.
Ookla® is back with exciting, fresh data from Q3 and Q4 2022 for SpaceX’s Starlink and Sky Logic in Europe and Oceania, as well as new Starlink markets we haven’t yet featured in our ongoing series on satellite internet. With the FCC greenlighting Amazon’s Project Kuiper and many other exciting satellite developments launching this year, we’re certain all eyes will be on the sky in 2023 as new orbital connectivity options become available for consumers.
This analysis includes Starlink results from six new countries, and data for Starlink and Sky Logic in Europe and Starlink in Oceania. We also examine how Starlink’s internet performance has changed over the past year in Australia, Austria, Belgium, Croatia, France, Germany, Ireland, Italy, the Netherlands, New Zealand, Poland, Portugal, and the United Kingdom.
Starlink is mostly speeding up again from Q3 to Q4 2022, but is still slower than a year ago
As Starlink rides the wave of becoming an increasingly popular connectivity option for consumers, we’ve seen the service speed up and then slow down year-over-year in most markets. However, Q4 2022 data shows many countries are experiencing a modest rise in median download speeds when compared to Q3 2022. That’s encouraging for consumers, especially as Starlink hit over 1 million users in Q4 2022, and could be a sign that Starlink seems to be maturing its constellation’s capacity. That’s particularly intriguing as Starlink launches more next-gen satellites, which were first deployed at the tail end of Q4 2022 and will most likely show up in Q1 2023 results.
In Europe, all the countries we evaluated for year-over-year median download speeds were slower for Q4 2022 than Q4 2021 when there were fewer users on each network. Most countries showed between 10-20% slower speeds in Q4 2022 than what users experienced in Q4 2021, including Ireland (at least 11% slower), Austria (at least 13%), Portugal (at least 14%), Italy (at least 15%), Germany (at least 16%), and the U.K. (at least 19%). Users in France saw very similar speeds year over year, with just a 4% decrease from Q4 2021 to Q4 2022, while users in Poland saw a large decrease (at least 56% slower), and users in the Netherlands (at least 21%) and Belgium (at least 28%) saw substantial decrease during the same period.
In Oceania, Starlink year-over-year results were mixed, with Starlink’s download speed in Australia 24% slower in Q4 2022 than during Q4 2021, while in New Zealand it was 4% faster in Q4 2022 than Q4 2021.
Starlink in Denmark and Switzerland had the fastest satellite internet in Europe during Q4 2022
Speedtest Intelligence® reveals there was no fastest satellite provider in Europe during Q4 2022, though Starlink in Denmark (147.52 Mbps) and Switzerland (136.03 Mbps) led the pack for fastest median download speed. In all, Starlink download speeds were faster than 100 Mbps in 10 out of 15 European countries during Q4 2022 — a rise from just five out 15 in Q3 2022.
Starlink outperformed fixed broadband providers over download speed in eight countries, including: Austria (105.67 Mbps), Belgium (104.84 Mbps), Croatia (102.99 Mbps), Czechia (64.67 Mbps), Germany (94.37 Mbps), Ireland (103.39 Mbps), Italy (101.06 Mbps), and the U.K. (96.79 Mbps). Fixed broadband providers were faster than satellite providers analyzed in Denmark, France, Netherlands, and Poland. Results were too close to call in Sweden with fixed providers at 106.73 Mbps and Starlink at 101.83 Mbps, as well as Portugal with Starlink at 108.02 Mbps and fixed broadband at 117.97 Mbps. Skylogic was too close to call between the median fixed broadband speed in Italy at 55.50 Mbps to 59.40 Mbps, and had download speeds faster than 40 Mbps in France (44.46 Mbps) and Sweden (48.09 Mbps).
For upload speeds, every country’s combined fixed broadband providers had faster median upload speeds than every satellite provider, though Starlink in Portugal had the fastest upload speed among satellite providers at 20.86 Mbps. All Starlink upload speeds ranged between 10-20 Mbps except Poland (9.79 Mbps) and Denmark (8.04 Mbps).
Multi-server latency for all satellite providers was higher than fixed broadband providers in every European country in Q4 2022, which ranged from 12.34 ms in Sweden to 23.46 ms in Italy. However, Starlink had a median multiserver latencies of less than 60 ms in the U.K. (53.24 ms), Portugal (56.81 ms), and the Netherlands (58.85 ms). Most latencies were between 60-75 ms, with Poland having the highest latency at 86.46 ms — still low enough to have a good quality of experience and be able to video chat.
Starlink in New Zealand was the fastest satellite provider in Oceania
During Q4 2022, Starlink in New Zealand had the fastest median download speed among satellite providers in Oceania at 124.72 Mbps, followed by Starlink in Australia (106.43 Mbps), and Starlink in Tonga (35.15 Mbps). However, New Zealand fixed broadband outperformed Starlink, while Starlink in Australia outperformed fixed broadband providers. In Tonga, speeds were too close to call.
Speedtest Intelligence shows Starlink falling behind fixed broadband providers for median upload speeds in New Zealand (16.89 Mbps) and Australia (11.38 Mbps), while Tonga was again too close to call.
Multi-server latency was higher over Starlink than fixed broadband in all three countries we surveyed in Oceania during Q4 2022. However, Starlink’s median latency was under 50 ms in New Zealand (48.11 ms), which is a very exciting development for consumers, especially with latency becoming an increasingly important metric. Starlink latency in Australia was higher at 65.52 ms, while Tonga followed at 88.81 ms.
New Q4 2022 Starlink countries show very promising results
Speedtest Intelligence shows the six new countries where we found new Starlink data are off to a roaring start in Q4 2022, which include Bulgaria, Finland, Jamaica, Japan, Latvia, and Malta. Starlink had faster median download speeds than the country’s respective fixed broadband providers combined in two countries: Bulgaria (110.76 Mbps versus 65.69 Mbps), and Jamaica (87.43 Mbps vs. 48.34 Mbps), while results were too close to call in the remaining four markets. However, Starlink showed promising 100+ Mbps speeds in Japan (156.94 Mbps), Finland (102.70 Mbps), and Malta (101.36 Mbps).
Median upload speeds for Starlink lagged behind fixed broadband providers in all markets, though Malta was too close to call (20.40 Mbps for Starlink and 20.25 Mbps for fixed broadband). Starlink upload speeds ranged from about 14 Mbps to 20 Mbps in every market.
Consumers and enterprises stand to benefit from satellite developments in 2023
Starlink dominated headlines in 2022 — and for good reason. They’ve gained over 1 million users worldwide, will be available in connected vehicles, planes, RVs, and ships, partnered with T-Mobile to bring Starlink to mobile devices, and launched their second-gen satellites at the end of 2022. But that could very seriously change in 2023 with multiple competitors deploying major offensives in the satellite market. We’ll say it again: there is a new space race for connectivity being waged, and we’re just at the tip of what’s to come.
Here are some major updates about what’s next for various different satellite competitors:
Amazon’s Project Kuiper approved by the FCC
The biggest news concerning satellite connectivity is the FCC approving Amazon’s Project Kuiper constellation, which will include 3,236 satellites in an LEO array. On two fronts, this poses two potential challenges for Starlink: on one hand, Amazon has the global reach, scale, and consumer base that being one of the largest companies in the world provides. On the other, Blue Origin is a direct competitor of SpaceX, and won’t have to rely on the service or other vendors to launch their array into space. Amazon is in a good position to compete and Project Kuiper could become a major player if their prototypes, which will be launched in early 2023, reach speeds anywhere close to competing with broadband internet.
Viasat set to launch Viasat-3 arrays around April 8, 2023
Long-term incumbent satellite internet provider, Viasat, has a big year ahead after years of planning and providing connectivity to remote locations around the world. Viasat is finally set to launch its Viasat-3 array, which aims to provide 1 Terabit per second (Tbps) of network capacity on each satellite, allowing its users to experience 100+ Mbps connections; that’s a huge improvement for the mainly GEO provider. While consumers likely won’t see these results until Q4 2023, we’re very excited to see how Viasat improves its network.
Eutelsat’s merger with OneWeb approved by Eutelsat board, second-gen array being planned
One of the biggest mergers in recent years among satellite providers has jumped a major hurdle and was approved by the Eutelsat board. While the combined entities still have to be approved by shareholders and regulators, this merger could expand both companies’ market share, particularly in India, which has fast become an important satellite market. Furthermore, OneWeb is already planning a second-gen satellite, which they’re aiming to launch in 2025.
European Commission forges ahead on Constellation Iris
HughesNet aiming to launch Jupiter 3 array in H1 2023
Incumbent satellite internet provider HughesNet is planning to launch its new Jupiter 3 array in the first half of 2023, which will help expand its network capacity, “doubling the size of the Hughes JUPITER fleet over North and South America.” While the Jupiter 3 array will still be a GEO constellation, the added network capacity will alleviate congested networks and give consumers more bandwidth to use the internet.
Ookla will continue monitoring new satellite internet developments
As 2023 continues to shape up as a pivotal year for satellite internet providers, we’ll be watching the sky to make sure providers are providing the connectivity consumers need. We’ll continue our series next quarter with Q4 2022 and Q1 2023 data from North and South America and any new countries where Starlink launches, and be back with Europe and Oceania data in Q3 2023. In the meantime, be sure to download the Speedtest® app for Windows and Mac computers or for iOS or Android for devices and see how your satellite internet stacks up to our findings.
Ookla retains ownership of this article including all of the intellectual property rights, data, content graphs and analysis. This article may not be quoted, reproduced, distributed or published for any commercial purpose without prior consent. Members of the press and others using the findings in this article for non-commercial purposes are welcome to publicly share and link to report information with attribution to Ookla.
The satellite internet race is heating up, with more competitors serving more areas than even a quarter ago. We’re back with a broader look at internet network performance for satellite providers across the globe based on Q2 2021 data from Speedtest Intelligence™.
Starlink speeds beat competitors in the U.S., can’t top fixed broadband
Given that satellite internet is often the only solution for folks with little to no fixed broadband access, the Speedtest® results we saw coming from HughesNet, Starlink and Viasat during Q2 2021 were encouraging. However, Starlink was the only satellite internet provider in the United States with fixed-broadband-like latency figures, and median download speeds fast enough to handle most of the needs of modern online life at 97.23 Mbps during Q2 2021 (up from 65.72 Mbps in Q1 2021). HughesNet was a distant second at 19.73 Mbps (15.07 Mbps in Q1 2021) and Viasat third at 18.13 Mbps (17.67 Mbps in Q1 2021). None of these are as fast as the 115.22 Mbps median download speed for all fixed broadband providers in the U.S. during Q2 2021, but it beats digging twenty miles (or more) of trench to hook up to local infrastructure.
Starlink’s median upload speed of 13.89 Mbps (up from 13.77 Mbps in Q1 2021) was much closer to that on fixed broadband (17.18 Mbps in Q2 2021, 15.99 Mbps in Q1 2021). Viasat had the second fastest upload speed among satellite providers at 3.38 Mbps (3.48 in Q1 2021). HughesNet was third (2.43 Mbps in Q1 and Q2 2021).
Critically, Starlink was the only satellite internet provider with a median latency that was anywhere near that seen on fixed broadband in Q2 2021 (45 ms and 14 ms, respectively). A low latency connection is more responsive, making it essential for many common applications such as voice and video calling, gaming and live streaming of content. Starlink is able to achieve these lower latency numbers through the use of their low earth orbit (LEO) satellite constellation. At altitudes between 550-1200 km, these satellites are physically closer to the earth’s surface than traditional satellite providers. Therefore it takes less time for the signal to relay back to a downlink station on earth, ensuring a much more responsive connectivity experience for the user. Viasat and HughesNet both utilize considerably higher “geosynchronous” orbits of around 35,000 km for their satellites. This allows them to serve much wider swaths of the Earth’s surface with fewer satellites, but with a dramatic increase in latency in our data of 630 ms and 724 ms respectively.
Satellite internet speeds in the U.S. are increasing, mostly
Consumers are used to incremental increases in fixed broadband performance as that’s a developed technology with a stable market share. Satellite internet is newer and speeds fluctuate as technologies improve and as more users are added to sometimes crowded networks. Data from Speedtest Intelligence during Q1-Q2 2021 shows some of these struggles as median download speeds for both Starlink and HughesNet dipped in February and then rose again through the period only to dip again in June. This could be related to seasonal weather patterns. Viasat’s median download speed rose slightly from January through April and then started to decline slightly in May and June. We’ll continue watching the performance of these companies over time to see if they reach the steady climb that fixed broadband enjoys.
Starlink performance varies at the county level, but not widely
We saw sufficient samples during Q2 2021 to analyze Starlink performance in 458 counties in the U.S. While there was about a 100 Mbps range in performance between the county with the fastest median download speed (Morgan County, Alabama at 168.30 Mbps) and the county with the slowest median download speed (Madison County, Indiana at 64.51 Mbps), even the lower-end speeds are well above the FCC’s Baseline performance tier of at least a 25 Mbps download speed. We also saw many more counties qualify for analysis during Q2 2021 than we saw in Q1 2021.
Satellite internet performance elsewhere in the world
The ambition and potential of satellite internet providers is of course to increase internet access across the globe. To that end, we examined satellite internet performance in countries with an established market share.
Brazil: Viasat download speed is comparable to fixed broadband, upload is not
Viasat’s 60.30 Mbps median download speed during Q2 2021 in Brazil was very close to the national average for fixed broadband of 61.38 Mbps. Viasat’s median upload speed (1.05 Mbps) was much slower, however, than that on fixed broadband (28.75 Mbps), and Viasat’s latency was much higher (613 ms vs 7 ms).
Our previous article showed that Starlink’s median download speed was slower than fixed broadband in three provinces and faster in two. Data from Q2 2021 shows that Starlink’s median download speed exceeded that of fixed broadband in Canada (86.92 Mbps vs. 84.24 Mbps), making Starlink a reasonable alternative to fixed broadband in Canada. Starlink’s median upload speed was slower than fixed broadband (13.63 Mbps vs. 17.76 Mbps). Latency on Starlink was much higher (55 ms vs. 12 ms), but many customers in remote areas would gladly accept a latency in that range in exchange for having access to internet service.
Starlink performance varies at the province level, but not widely
Starlink showed enough samples to analyze performance in 8 provinces in Canada during Q2 2021. Starlink’s Q2 2021 median download speed was faster than fixed broadband in five provinces (Manitoba, New Brunswick, Nova Scotia, Quebec and Saskatchewan), though samples in Nova Scotia were few enough and showed enough variability that there is room for interpretation. Download speeds were comparable between Starlink and overall fixed broadband in two provinces (Alberta and Ontario) and fixed broadband was faster in British Columbia.
Chile: HughesNet shows comparable speeds here and in the U.S.
At 15.43 Mbps, the median download speed for HughesNet in Chile during Q2 2021 was not fast, especially compared with the country’s fixed broadband average of 111.94 Mbps. Median upload speeds also showed a wide gap (3.23 Mbps for HughesNet to 39.48 Mbps on fixed broadband), and HughesNet’s latency was very high (678 ms vs. 8 ms).
Colombia: HughesNet is slowest
The slowest performance we saw for HughesNet was in Colombia, where fixed broadband speeds are also slower than in other countries surveyed. HughesNet showed a median download speed of 9.28 Mbps during Q2 2021, compared with Colombia’s 35.90 Mbps for fixed broadband overall. Median upload speed was also slower using the satellite internet provider (3.03 Mbps) than fixed broadband (8.56 Mbps), and latency was much higher on satellite (799 ms vs. 17 ms).
France: Where the fastest Starlink download speeds are
Satellite internet users in France saw the fastest median download speeds from Starlink of all countries we surveyed during Q2 2021. At 139.39 Mbps, Starlink’s download speed easily beat the country-wide average for fixed broadband of 70.81 Mbps. Starlink’s upload speed was slower than the fixed broadband average, but still respectable (29.35 Mbps vs. 52.56 Mbps), and Starlink’s latency was higher (53 ms vs. 13 ms).
Germany: Starlink far surpasses local fixed broadband
Consumers looking for fast internet in Germany have a great option in Starlink. Starlink’s median download and upload speeds were much faster than the country averages for fixed broadband in Q2 2021. The only drawback is Starlink’s 37 ms latency, compared to the 15 ms average for fixed broadband.
Mexico: Viasat and HughesNet are comparable, though slower than fixed broadband
Mexico has options when it comes to satellite internet, and the faster of the two options appears to be Viasat, for now. With a median download speed of 13.95 Mbps in Mexico during Q2 2021, Viasat was faster than HughesNet (11.92 Mbps) but slower than the country’s average for fixed broadband (29.99 Mbps). Median upload speed told a similar story, though HughesNet was slightly faster than Viasat (3.25 Mbps vs. 2.01 Mbps). While Viasat’s latency was high (672 ms vs 13 ms for fixed broadband), it was lower than HughesNet’s (714 ms).
New Zealand: Starlink is faster than fixed broadband
Data from Speedtest Intelligence shows that Starlink’s median download speed was much faster than New Zealand’s average fixed broadband download speed during Q2 2021 (127.02 Mbps vs. 78.85 Mbps), and the upload speeds were nearly identical (23.61 Mbps vs. 23.51 Mbps). Starlink did have a much higher latency (101 ms vs. 7 ms). Starlink is relatively new in the country and does not have a large market share yet; we’ll be interested to see how their speeds hold up under heavier use.
United Kingdom: Starlink beats fixed broadband providers
Starlink showed a much faster median download speed in the U.K. during Q2 2021 (108.30 Mbps) than the country’s average for fixed broadband (50.14 Mbps). Starlink’s upload speed was also slightly faster (15.64 Mbps vs. 14.76 Mbps), and the latency was pretty good, given the distance traveled (37 ms vs. 15 ms). This brings Starlink closer to contender status for consumers across the U.K., not just those stranded in internet-free zones in Northern Scotland, once the service interruptions are under control. It also shows that because satellite internet is not constrained by the infrastructure of a given country, there is the potential to radically outperform fixed broadband.
This data is changing rapidly as satellite internet providers launch new service locations and improve their technology. We’ll be excited to see if Starlink is still the satellite provider to beat next quarter and in what other countries satellite internet provides a viable alternative to fixed broadband.
Ookla retains ownership of this article including all of the intellectual property rights, data, content graphs and analysis. This article may not be quoted, reproduced, distributed or published for any commercial purpose without prior consent. Members of the press and others using the findings in this article for non-commercial purposes are welcome to publicly share and link to report information with attribution to Ookla.
Several countries in the Middle East, including Bahrain, Jordan, Qatar, Saudi Arabia, and the U.A.E., are leaders in fiber deployment and adoption. The introduction of gigabit packages and the increase in entry-level speeds have significantly boosted their ranking in the Speedtest Global Index® for fixed broadband. This article examines the impact of Wi-Fi standards on fiber performance and discusses ISPs’ initiatives to enhance in-home performance.
Key Takeaways:
Median download speeds now exceed 300 Mbps in the UAE, 180 Mbps in Jordan, 130 Mbps in Bahrain, and 120 Mbps in Saudi Arabia. Since 2024, regulatory mandates and commercial upgrades across the Gulf and Jordan have driven a significant surge in fixed-broadband performance: minimum entry-level speeds doubled or tripled in some markets, fiber coverage expanded, and gigabit-plus packages became more common.
In-home Wi-Fi remains the key bottleneck to delivering fiber’s high throughputs and enhancing real-world user experience. Most customers still rely on legacy Wi-Fi standards (Wi-Fi-4 and 5), underscoring the necessity for ISPs to accelerate CPE (customer premises equipment) upgrades to Wi-Fi-6/7 to potentially boost the in-home broadband experience many-fold. Speedtest data shows that Wi-Fi 6 can achieve more than 10 times the download speed of Wi-Fi 4.
ISPs launched multiple initiatives to encourage customers to upgrade to gigabit packages and improve in-home connectivity. These include bundling advanced CPEs (Wi-Fi 6 and even Wi-Fi 7), mesh Wi-Fi equipment, and deploying fiber-to-the-room (FTTR) to ensure whole-home gigabit coverage. They have also slashed gigabit pricing, making ultra-high-speed broadband more affordable and driving mass adoption.
Fixed broadband performance in the Gulf region and Jordan has improved since 2024, thanks to a regulatory and commercial push for higher speeds
Operators in Bahrain, Jordan, Qatar, Saudi Arabia, and the U.A.E. offer some of the fastest broadband speeds in the Middle East region. In a previous analysis, we reported on the improvement in download and upload speeds realized by these markets thanks to expanding fiber coverage, an increase in entry-level packages’ speed, and the introduction of multi-gigabit plans (i.e., with headline speed of more than 1 Gbps). Note that we have excluded Kuwait and Oman from the analysis because they have lower levels of fiber penetration than the selected countries.
ISPs in the UAE increased the minimum broadband package speed from 250 Mbps to 500 Mbps in Q4 2022, which resulted in notable improvements in median download speeds, reaching 317.98 Mbps in Q2 2025. A similar uplift was observed in upload speeds, reaching 147.28 Mbps and converging with Jordan and Qatar. Both ISPs, e& UAE and du, offer packages with up to 5 Gbps and 10 Gbps in select areas.
In April 2023, Bahrain‘s telecoms regulator mandated ISPs to double the speed of entry-level fiber packages while maintaining the same wholesale prices. In March 2025, minimum speeds were further increased from 100 Mbps to 300 Mbps. This impacted the ISPs immediately, with median download speeds jumping from 86.61 Mbps in Q4 2024 to 130.74 Mbps in Q2 2025. Upload speeds nearly tripled from 20.72 Mbps to 58.9 Mbps over the same period, reaching the same level as Saudi Arabia.
Qatar was the first country in the Gulf to offer 10 Gbps consumer broadband packages. Local ISPs raised the minimum speed to 1 Gbps in June 2023 while offering discounts on more expensive fiber packages, making gigabit speeds the norm in the country. These initiatives resulted in a step change in download speeds, more than doubling over two years to Q2 2025.
Jordan established a fiber wholesale company in 2019 to accelerate network deployment and drive competition. As of June 2025, it covered 1.65 million premises with a network that spans 13,200 km. According to the latest report from the Telecommunication Regulatory Commission (TRC), the number of fiber subscriptions increased by 9.5% to 591,284 (out of 821,192 fixed broadband lines) in Q4 2024. As fiber represents nearly 73% of fixed broadband subscriptions, the proportion of customers on a 200+ Mbps plan increased from 42.1% in Q3 2023 to 58.5% between Q4 2023 and Q4 2024. Local ISPs have also been increasing the speed of entry-level plans and offering gigabit packages. For example, Orange Jordan introduced 2 Gbps and 10 Gbps plans in May 2023. The accelerated fiber take-up steadily boosted the median download and upload speeds to 181.59 Mbps and 143.47 Mbps, respectively, in Q2 2025.
In Saudi Arabia, stc was the first to increase the minimum download speed from 100 Mbps to 300 Mbps in the summer of 2022, followed by Mobily, which doubled the speed of its entry-level package and introduced a 1 Gbps broadband plan during Q2 2023, and Zain and Salam which offer a range of home packages from 100 Mbps to 1Gbps. The median download speed surpassed 120 Mbps for the first time in Q4 2024, reaching 124.89 Mbps by Q2 2025. Upload speeds saw a more modest improvement, rising to 56.96 Mbps during this period. Speedtest Intelligence’s Enrichment API allows us to track the adoption and performance of individual fixed broadband technologies and assess their impact on the Saudi market. For example, the fiber share of stc Speedtest samples represented 74.5% of Speedtest samples in Q2 2025.
Fixed Network Performance Evolution, Bahrain, Jordan, Qatar, Saudi Arabia, and the U.A.E.
Source: Speedtest Intelligence | Q2 2023 – Q2 2025
Fixed Network Performance Evolution, Bahrain, Jordan, Qatar, Saudi Arabia, and the U.A.E.
Growing adoption of new CPEs is helping to improve speed, but persistent usage of legacy Wi-Fi continues to be a limitation for some users
The increase in fiber adoption contributes to raising overall fixed broadband performance across download and upload speed metrics and creates a path for ISPs to upsell to packages with better features. However, the indoor Wi-Fi network can be a bottleneck to translating improvements in access speeds to better end-user experiences, especially in larger properties.
To illustrate this, we looked at the difference in performance between fiber Speedtest samples (by selecting low-latency samples only) that connect via an Ethernet cable compared to Wi-Fi. Results show that, in general, users who connect online through cable to the ONT (optical network terminal) or router could experience a 2x to 3x uplift in download speed and a 1.6x to 2.1x increase in upload speed compared to those who connect via Wi-Fi. The gains are bigger in countries with the highest download and upload speeds. Ethernet download speeds reached 790.0 Mbps, 653.6 Mbps, and 489.1 Mbps in the U.A.E., Qatar, and Jordan, respectively, in Q2 2025. Similarly, upload speeds are more than twice as high with Ethernet as with Wi-Fi, reaching 348.6 Mbps in Q2 2025.
Fiber Network Performance, by Access Technology, Bahrain, Jordan, Qatar, Saudi Arabia, and the U.A.E.
Source: Speedtest Intelligence | Q2 2025
Fiber Network Performance, by Access Technology, Bahrain, Jordan, Qatar, Saudi Arabia, and the U.A.E.
The charts above show that most users who connect their devices through Wi-Fi are not able to take advantage of fiber speed due to aging equipment. To bridge this gap, most ISPs in these countries now offer CPEs that support at least the Wi-Fi 6 (802.11ax) standard, which enables faster maximum data rates (up to 9.6 Gbps) and lower latency than the earlier Wi-Fi 4 and 5 generations. Its newer iteration, Wi-Fi 7, can combine 2.4 GHz, 5 GHz, and 6 GHz spectrum bands and support wider channels for better throughput and less interference.
Legacy standards (Wi-Fi 4 and Wi-Fi 5) are prevalent despite their progressive replacement with newer standards. In H1 2025, more than 75% of test samples were using Wi-Fi 4 or Wi-Fi 5 connected to the fixed CPE, down from 75.6% in H2 2023. The share of Wi-Fi 4/5 samples varies by country, with the highest incidence in Jordan (89%) and the lowest in Qatar (60.7%).
While the sample percentage for Wi-Fi 5 (around half of the samples) did not change materially between H2 2023 and H1 2025, the share of Wi-Fi 6 (including Wi-Fi 6E) increased from 18.6% to 24.2% during that period, reflecting the increased availability of newer CPEs and consumers’ adoption. Qatar has the highest penetration of Wi-Fi 6 samples at 39.05%, followed by the U.A.E. with 34.5%.
Wi-Fi 7 remains nascent in the Middle East, representing 0.19% of Speedtest samples in H1 2025. The U.A.E. and Qatar lead the region with penetration rates at 0.41% and 0.25%, respectively, while Jordan has the lowest share of Wi-Fi 7 samples at 0.04%.
Fiber Speedtest Samples by Wi-Fi Generation, Bahrain, Jordan, Qatar, Saudi Arabia, and the U.A.E.
Source: Speedtest Intelligence | Q1-Q2 2025
Fiber Speedtest Samples by Wi-Fi Generation, Bahrain, Jordan, Qatar, Saudi Arabia, and the U.A.E.
The choice of Wi-Fi standard and spectrum bands has a direct impact on the indoor experience of fiber services
Consumer-initiated speed tests confirm that users’ experience of network speed is significantly affected by how their devices connect to the Wi-Fi access point. The charts below show the median download speed distribution by Wi-Fi standard used.
The median download speed for samples that use Wi-Fi 4 topped at 45.65 Mbps in Bahrain, and dropped as low as 35.96 Mbps in Jordan. Wi-Fi 5 samples achieved a 5.0x to 5.8x increase in speed compared to Wi-Fi 4, with Jordan seeing the largest gain at 209.22 Mbps, while Bahrain had the most modest gain at 226.63 Mbps in Q2 2025. With Wi-Fi 6, the speed increased more than 10 times in Jordan, Qatar, and the U.A.E. compared to Wi-Fi 4, with Qatar seeing a 12x gain at 448.23 Mbps.
Users in Bahrain and Saudi Arabia would have experienced less significant gains at 4.6x and 6.3x, respectively. These two countries have the lowest reported median download speeds, so many users upgrading from Wi-Fi 5 to Wi-Fi 6 are less likely to perceive a difference in their home network performance.
Gains when upgrading to newer Wi-Fi standards are also observed for upload speeds, but are less pronounced than with download speeds. Wi-Fi 6 samples deliver an upload speed 7 times faster than Wi-Fi 4.
Fiber Network Performance, by Wi-Fi Generation, Bahrain, Jordan, Qatar, Saudi Arabia, and the U.A.E.
Source: Speedtest Intelligence | Q2 2025
Fiber Network Performance, by Wi-Fi Generation, Bahrain, Jordan, Qatar, Saudi Arabia, and the U.A.E.
Analyzing the fastest 10% samples in Q2 2025 can reveal more clearly the potential speed uplift for demanding customers when using modern Wi-Fi standards. Top-tier Wi-Fi 6 samples from Qatar and the U.A.E. had a 90th percentile download speed that exceeded 800 Mbps, more than nine times the performance of the best 10% Wi-Fi 4 samples.
Fixed Network Performance of Top 10% of Speedtest Samples, by Wi-Fi Generation, Bahrain, Jordan, Qatar, Saudi Arabia, and the U.A.E.
Source: Speedtest Intelligence | Q2 2025
Fixed Network Performance of Top 10% of Speedtest Samples, by Wi-Fi Generation, Bahrain, Jordan, Qatar, Saudi Arabia, and the U.A.E.
Looking at the distribution of Wi-Fi 4 Speedtest samples by CPE manufacturer, we find that Huawei and TP-Link are the top router brands across the reviewed countries. However, their popularity varies vastly by market, depending on the equipment bundled by ISPs with their broadband offerings and consumers’ ability to use third-party routers (some ISPs allow only their own fiber routers).
Our data shows that Bahrain had the highest proportion of samples connected to a Huawei CPE in Q2 2025, at 58.50%. Around a third of the Jordan and Saudi Arabia samples are also from this brand. TP-Link routers are most common in Qatar (39.28%), the U.A.E. (33.23%), and Saudi Arabia (33.22%). We have identified 66 other router/mesh brands that used Wi-Fi 4 in these markets, with Saudi Arabia and the U.A.E. being the most fragmented markets. The high diversity of the networking equipment gives less room for the ISPs to address any performance issues related to routers, or to convince their customers to upgrade to new models. ISPs should therefore direct their efforts to upgrading Huawei and TP-Link routers, upgrading their firmware, or adjusting their configurations to increase the likelihood of using Wi-Fi 5 and Wi-Fi 6 standards.
Distribution of Wi-Fi 4 Speedtest Samples by Manufacturer, Bahrain, Jordan, Qatar, Saudi Arabia, and the U.A.E.
Source: Speedtest Intelligence | Q1-Q2 2025
Distribution of Wi-Fi 4 Speedtest Samples by Manufacturer, Bahrain, Jordan, Qatar, Saudi Arabia, and the U.A.E.
Our research showed that most commercial CPEs introduced in the region since 2020 likely support Wi-Fi 5 (if not Wi-Fi 6). Therefore, many users are capable of using Wi-Fi 5 but are still on Wi-Fi 4. Misconfigured routers and the continued use of legacy CPEs and old devices at home could be the primary causes of the prevalence of legacy Wi-Fi 4 Speedtest samples in these countries.
Across all Wi-Fi technologies, the 2.4 GHz spectrum band provides coverage, while the 5 GHz band is only available in Wi-Fi 5 and more recent standards, providing more capacity at the cost of limited reach. When users move around the home or the office, away from the CPE, the connection might shift from 5 GHz to 2.4 GHz because it offers better coverage. However, in some cases, when users get closer to the CPE, they continue to camp on the 2.4 GHz if the router does not have an automatic function to push the users back onto 5 GHz. ISPs could work with device manufacturers to enable this functionality by default through a firmware update.
Wi-Fi 5 and 6 routers operate primarily on the 5 GHz band but include a separate mode to connect to the 2.4 GHz band using the older Wi-Fi 4 standard. This dual-band (or triple-band in the case of Wi-Fi 6E routers) capability allows for better performance and reduced interference compared to only using a single band. Speedtest data confirms that the 5 GHz band consistently offers higher speeds because it is less congested by using more channels and wider bandwidth per channel, making it a preferred option in most cases. Note that 6 GHz is not included in the charts below due to the low sample size.
Fiber Network Performance of Top 10% of Speedtest Samples, by Frequency Band, Bahrain, Jordan, Qatar, Saudi Arabia, and the U.A.E.
Source: Speedtest Intelligence | Q2 2025
Fiber Network Performance of Top 10% of Speedtest Samples, by Frequency Band, Bahrain, Jordan, Qatar, Saudi Arabia, and the U.A.E.
Operators have launched multiple initiatives to encourage customers to upgrade to packages with gigabit speed and improve indoor connectivity.
Most ISPs have been offering Wi-Fi 6-compatible CPEs for new broadband customers and free upgrades to those extending their contracts—some operators, such as Ooredoo Qatar, even bundle Wi-Fi 7 CPEs with their gigabit broadband packages. Furthermore, some ISPs bundle gigabit packages with mesh Wi-Fi nodes that support Wi-Fi 6 at discounts or no additional cost to improve indoor coverage and speed, or smart home services like security.
More recently, ISPs have been exploring FTTR technology, which consists of deploying and extending fiber connectivity to each room, usually through transparent cables, to provide ubiquitous gigabit wireless access. Countries spearheading this trend include Jordan (Umniah and Zain), Qatar (Ooredoo), Saudi Arabia (Salam, stc), and the U.A.E. (e& UAE). For example, Ooredoo Qatar includes FTTR for free with its top two packages to connect up to five rooms. Other operators either offer dedicated fiber packages that bundle FTTR (e.g., Umniah, Zain), or charge an extra monthly fee for this feature (e.g., stc, e&).
Another factor that can drive gigabit internet adoption is affordability. For example, a 1 Gbps fiber line in Hong Kong or Singapore could cost as little as $30 per month, and in Jordan it starts at $38 per month. Gulf ISPs have started lowering the prices of gigabit packages to make them more accessible. For example, the U.A.E.’s prices start at $100 per month, a 33% reduction compared to late 2023. Prices have also been revised down in Saudi Arabia (for example, Mobily offers a 1 Gbps plan for SAR736 ($196)) and in Bahrain (the entry price is down from $345 in late 2023 to $117 now). Such efforts will make gigabit plans more accessible and contribute to boosting the countries’ median download speeds.
Gulf countries and Jordan are leading the Middle East region in fiber network deployment and adoption, and gigabit home broadband services are becoming increasingly common. Access to such speeds increases the importance of an indoor Wi-Fi solution that supports them. To address this bottleneck, ISPs have introduced mesh solutions, upgraded CPEs to support Wi-Fi 6 and 7, and deployed FTTR. Such approaches ensure that ISPs can meet consumers’ expectations throughout their homes and provide a competitive edge to differentiate their gigabit services.
For more information about Speedtest Intelligence data and insights, please contact us.
Ookla retains ownership of this article including all of the intellectual property rights, data, content graphs and analysis. This article may not be quoted, reproduced, distributed or published for any commercial purpose without prior consent. Members of the press and others using the findings in this article for non-commercial purposes are welcome to publicly share and link to report information with attribution to Ookla.
Karim Yaici is the Lead Industry Analyst at Ookla covering the Middle East and Africa (MEA) region. Previously, he directed Analysys Mason's MEA research program, where he was responsible for telecoms forecasts, market reports, consumer surveys, and custom research.
Gulf countries improved fiber coverage and adoption by investing in fixed infrastructure, raising entry-level speeds, and making fiber services more affordable. Their efforts paid off, as evidenced by their improved position in Ookla’s Speedtest Global Index™. However, the persistent use of legacy and underperforming Wi-Fi standards in home networks can hamper efforts to provide the best network experience to customers.
Key messages
Wi-Fi 4 is still prevalent in the region which limits fiber’s potential. Many customers cannot get close to headline fixed broadband speeds because of the widespread use of Wi-Fi 4. Indeed, more than one-third of Speedtest® samples during Q2 2023 were using this old Wi-Fi standard. That means that a sizable proportion of users are not utilizing broadband services to their full potential.
Migrating to modern Wi-Fi standards can bring significant speed gains. On average, customers who used Wi-Fi 5 had a median download speed that was more than five times higher than those on Wi-Fi 4 in Q2 2023. Likewise, the speed over Wi-Fi 6 was 1.2 times faster on average than with Wi-Fi 5. Therefore, fixed broadband subscribers in the Gulf (most of whom use fiber services) with routers that only support Wi-Fi 4 would benefit the most from a CPE (Customer Premise Equipment) upgrade.
ISPs should do more to ensure their customers’ routers and smartphones are configured correctly. Even if consumers in the Gulf region own modern smartphones and Wi-Fi routers, they may still unknowingly use Wi-Fi 4 due to device misconfiguration and coverage constraints. ISPs can help educate consumers about how to correctly set up their home Wi-Fi routers and offer solutions to improve their indoor connectivity in order to use the more efficient 5 GHz spectrum band.
Most Gulf countries improved their global fixed broadband speed ranking since 2020
The GCC (Gulf Cooperation Council) region which comprises Bahrain, Kuwait, Oman, Qatar, Saudi Arabia, and the U.A.E. leads the Middle East in fiber coverage and adoption. Local ISPs, backed by the government, accelerated fiber roll-outs to keep pace with the demand for data services and to ensure universal access to high-speed internet as part of national broadband development strategies. According to the FTTH Council industry body, the U.A.E. topped the global rankings for fiber household coverage, reaching 98.1% in September 2022, a position it has maintained since 2016. Qatar closely followed in the second position with 97.8% coverage.
These two GCC countries ranked ahead of Singapore (96.5%), Hong Kong (91.6%), and China (89.4%). In Bahrain, meanwhile, more than 88% of households were connected to the fiber infrastructure, whereas fiber coverage exceeded 60% in Saudi Arabia and reached 52% in Oman.
According to Speedtest Intelligence®, the U.A.E. leads the Gulf region in median download speeds at 236.67 Mbps in Q2 2023, a number that doubled since Q2 2022. Bahrain saw another story of improvement, with its median download speed reaching 70.17 Mbps, an increase of 46% year-on-year since Q2 2023. ISPs also saw significant improvements in upload speeds. Fixed upload speeds increased by 61% and 40% in Oman and Qatar, respectively, reaching 29.27 Mbps and 73.21 Mbps. Users in Bahrain experienced the biggest jump in median upload speed, which doubled between Q2 2022 and Q2 2023 to 20.37 Mbps.
As a result, most Gulf countries boosted their ranking in the Ookla Speedtest Global Index™. The U.A.E was ranked second in the Speedtest Global Index™ for median download speeds over fixed broadband in June 2023. Other GCC countries improved their rankings as well but trailed the U.A.E.
The telecom regulatory regimes and policies also helped, to different degrees, stimulate competition in the market, raise minimum broadband speeds, and reduce broadband tariffs. For example, in April 2023, Bahrain’s Telecommunications Regulatory Authority (TRA) approved an offer from BNET, the wholesale fixed infrastructure provider, to double the speed of entry-level fiber packages while maintaining the same wholesale prices. In the U.A.E., Etisalat by e& and du increased minimum download speeds to 500 Mbps and offered discounts on higher-tier fiber plans in 2022.
Wi-Fi 4 is still prevalent in the region which limits fiber’s potential
The choice of Wi-Fi standards and spectrum bands has a direct impact on connectivity quality, throughput, and network coverage. Indeed, Wi-Fi 5 (802.11ac) significantly increases the maximum theoretical throughput speed of the access point to 3.5 Gbps, compared to 600 Mbps supported by the old Wi-Fi 4 (802.11n) standard.
Wi-Fi 6/6E (802.11ax) supports even faster maximum data rates (up to 9.6 Gbps) and lower latency than earlier generations. It also combines 2.4 GHz, 5 GHz, and 6 GHz spectrum bands and wider channels for better throughput and less interference. Note that achievable speeds in real life will be much lower than these theoretical limits because of signal attenuation, interference, and the hardware and software variety of connected devices.
The rest of the analysis focuses on the most penetrated fiber markets in the region: Bahrain, Qatar, Saudi Arabia, and the U.A.E. We used the percentage of samples that used a particular Wi-Fi standard and frequency band when connecting to the CPE as a proxy for their adoption by wired broadband customers in each country. We assume that most of the results reflect the performance of fiber services given that fiber represents the majority of fixed broadband connections in these four markets.
Our results show that more than one-third of test samples reported using Wi-Fi 4 to connect to the fixed CPE, but this varies considerably by country. Bahrain has the highest incidence of samples that use Wi-Fi 4 and the lowest proportion of Wi-Fi 6. Wi-Fi 4 was more prevalent in the U.A.E. than Wi-Fi 6 (30.8% compared to 17.2% in Q2 2023). This suggests that the ISPs have an opportunity to improve the network experience for nearly a third of their customer base and extend their lead in the speed leaderboard if they can address that CPE speed bottleneck.
The distribution of samples by Wi-Fi standard is largely similar between the U.A.E and Saudi Arabia. The minimum broadband speed currently offered by ISPs in Saudi Arabia is 100 Mbps, while the median download speed on fixed broadband measured by Speedtest Intelligence data was 93.85 Mbps in Q2 2023. This suggests that many customers might still be on legacy, lower-speed plans, but the more likely case is that home Wi-Fi CPEs are limiting speeds in users’ homes. Indeed, 40.2% of Speedtest samples used Wi-Fi 4 in Saudi Arabia, limiting maximum achievable speeds.
Migrating to modern Wi-Fi standards can bring significant speed gains
Consumer-initiated speed tests confirm that users’ experience of network speed is significantly affected by how their devices connect to Wi-Fi access points. The chart below shows the median download speed distribution by Wi-Fi standard used.
Median download speeds for devices that use Wi-Fi 4 topped out at 37.18 Mbps in Bahrain, and dropped to a low of 28.47 Mbps in Saudi Arabia. Contrary to what some might think, speed improvements were far more pronounced when looking at results on Wi-Fi 4 compared to those on Wi-Fi 5, rather than comparing speeds on Wi-Fi 5 and Wi-Fi 6. Users who connected to Wi-Fi 5 had a median download speed that was more than five times higher on average than those on Wi-Fi 4. While download speeds over Wi-Fi 6 were 1.2 times faster than with Wi-Fi 5.
Wi-Fi 5 users in the UAE had the largest speed lead over Wi-Fi 4 users (6.5x). With Wi-Fi 6, median download speeds more than doubled to 251.68 Mbps for users in Qatar compared to those on Wi-Fi 5. Bahrain and Saudi Arabia were outliers, with speeds largely similar regardless of whether test samples were with Wi-Fi 5 or Wi-Fi 6. This is because these three countries have the lowest reported median download speeds (below 100 Mbps), and many users who consider upgrading from Wi-Fi 5 to Wi-Fi 6 are unlikely to see a difference in their home network performance.
Looking at the performance of the fastest 10% samples in Q2 2023 reveals a more significant potential speed uplift for data-heavy users when using modern Wi-Fi standards. Users in the top 10% of our results experience the best performance, so it is possible to gauge from their results what speeds are achievable with each Wi-Fi standard. To that end, the median download speed of the 10th percentile results on Wi-Fi 4 users across Bahrain, Qatar, Saudi Arabia, and the U.A.E. was 71.60 Mbps, compared to 330.91 Mbps on Wi-Fi 5 and 693.48 Mbps on Wi-Fi 6. Wi-Fi 5 was 2.7x faster than Wi-Fi 4 in Bahrain and 5.9x faster in Qatar, while the speed ratios of Wi-Fi 6 to Wi-Fi 5 ranged from 1.2 in Saudi Arabia to 1.9 in the UAE.
Given the clear performance advantages of Wi-Fi 5, ISPs should encourage customers to migrate from Wi-Fi 4 to Wi-Fi 5 because it will significantly impact the end-user network experience. It’s also important to note that our data confirms that fiber broadband subscribers who continue using Wi-Fi 4 are the most penalized, especially if they subscribe to a service that is advertised as offering hundreds of megabits per second.
The persistent usage of legacy Wi-Fi is likely due to incorrectly configured routers
Huawei and TP-Link are the top router brands reported by Gulf users utilizing Wi-Fi 4. However, their popularity can vary vastly by market depending on the equipment bundled by ISPs with their broadband offerings, as well as the ability of consumers to use third-party routers (some ISPs allow only their own routers). Our data shows that Bahrain and Saudi Arabia have the highest proportion of samples connected to a Huawei CPE. TP-Link routers are most common in Qatar and the U.A.E.
The U.A.E. has the highest proportion of routers from D-Link, Cisco, and less popular brands used with Wi-Fi 4 (nearly 64% of samples reported using ‘other’ manufacturers). This high level of market fragmentation is likely due to users replacing routers provided by their ISP or installing refurbished routers to extend coverage indoors. Such fragmentation complicates the task of ISPs to ensure that their customers use more recent routers or that they configure them correctly to use more modern Wi-Fi standards.
Our research showed that most commercial CPEs in the region introduced since 2020 likely support Wi-Fi 5 (if not Wi-Fi 6). Further, tests also showed that most Android-based smartphones that used Wi-Fi 4 were equipped with Wi-Fi 5-capable chipsets. Therefore, many users in the region are capable of using Wi-Fi 5 but are still on Wi-Fi 4. We believe that misconfigured routers could be the primary cause of such a high prevalence of legacy Wi-Fi 4 technology among Gulf countries.
ISPs can address the factors that favor Wi-Fi 4 and 2.4 GHz spectrum usage, for example, by working more closely with device manufacturers, supporting customers to acquire newer Wi-Fi routers, and correctly configuring them, as shown in the table below.
Factors that lead to Wi-Fi 4 usage and how ISPs can address them
Legacy equipment
Some fixed broadband customers are locked into long service contracts and are not eligible for router upgrades
ISPs may not offer newer routers to existing customers whose contracts are automatically renewed
Solutions
Encourage existing broadband customers to upgrade to faster fiber packages to benefit from modern Wi-Fi routers
Offer customers the option to replace their old Wi-Fi routers for free or for a small fee during their contract
Configuration issues
Routers may, by default, use older Wi-Fi standards or diactivate the 5 GHz band
Some routers are pre-configured to use the same network name for both the 2.4 GHz and 5 GHz bands, and some devices may not handle this well
Some old mobile devices latch to 2.4 GHz (which is more likely used by Wi-Fi 4) on first-run but do not switch back to 5 GHz due to firmware limitations or a hardware/software setting in the router/end-user devices
Solutions
Work with OEMs to push firmware and software updates to prioritize newer Wi-Fi standards and the use of 5 Ghz over 2.4 GHz
Educate customers about the importance of updating the router’s firmware and smartphone software
Preconfigure the routers to have separate names for the 2.4 GHz and the 5 GHz bands
Offer routers that can automatically select the optimal Wi-Fi channel and band to improve performance
Coverage and performance issues
Distance from CPE, physical obstruction, and interference in the crowded 2.4 GHz band
Solutions
Offer Wi-Fi extenders to improve indoor coverage
Share best practices with customers on the configuration and placement of the router
Gulf-based IPSs have managed to rapidly grow their fiber footprint and migrate their customers to faster broadband services. However, a substantial portion of subscribers may not benefit from these speed increases due to the prevailing usage of Wi-Fi 4. As many ISPs in the region already offer a minimum fiber speed of 250 Mbps, they should, as a priority, migrate existing customers with legacy Wi-Fi routers to more modern models and educate customers with newer routers on how to correctly configure them. ISPs’ efforts to introduce newer CPEs will help improve the end-user experience, boost global speed rankings in the region, and ensure that their routers are more future-proof as gigabit speeds become more widespread.
Ookla retains ownership of this article including all of the intellectual property rights, data, content graphs and analysis. This article may not be quoted, reproduced, distributed or published for any commercial purpose without prior consent. Members of the press and others using the findings in this article for non-commercial purposes are welcome to publicly share and link to report information with attribution to Ookla.
Karim Yaici is the Lead Industry Analyst at Ookla covering the Middle East and Africa (MEA) region. Previously, he directed Analysys Mason's MEA research program, where he was responsible for telecoms forecasts, market reports, consumer surveys, and custom research.
Malaysia successfully deployed its 5G network using a unique Multi-Operator Core Network (MOCN) model, with several major providers operating on a single 5G network overseen by Digital Nasional Berhad (DNB). This strategic approach has yielded significant initial outcomes, including high median 5G speeds and extensive population coverage. This report analyzes Malaysia’s current 5G landscape and its impact on the user experience as the country shifts toward a Dual Network (DN) strategy, which aims to introduce competition and meet the growing capacity demands of a maturing 5G market.
Key Takeaways
Malaysia’s unique 5G deployment model, overseen by DNB, has achieved high population coverage and high initial median 5G speeds, but performance has since shown a downward trend. The median download speed for all providers combined decreased from 451.79 Mbps in Q4 2023 to 242.92 Mbps by Q3 2025. This decline coincided with an increase in 5G device adoption and contrasts with speed stability observed in comparable multi-operator markets in neighboring countries.
Malaysia is experiencing an increase in 5G-capable device adoption, indicating an expanding 5G-ready subscriber base. Based on Speedtest Intelligence® data, the proportion of all tests conducted on 5G-capable devices jumped from 58.6% in Q4 2023 to 79.5% in Q3 2025, with those connected to a 5G network making up 55.0% of all test samples in Q3 2025.
Despite high consumer readiness for 5G adoption, maximizing the technology’s potential faces challenges, as 5G-capable devices spend 65.8% of their connected time on 4G networks. This gap is primarily driven by persistent coverage issues, particularly the lack of ubiquitous indoor 5G coverage and inconsistent service in rural areas.
Controlled testing shows Digital Nasional Berhad’s (DNB) existing 5G network currently provides the dominant 5G coverage in the Klang Valley, forming the essential footprint for all operators’ 5G coverage.Speedtest Drive™ controlled network testing showed U Mobile, the second 5G network provider, still primarily camped on DNB’s frequencies (83.2% of test samples) despite its own active network deployment. In comparison, Yes, acting as a proxy for DNB’s 5G network coverage, camped on DNB’s 3500 MHz mid-band frequency in 77.9% of test samples.
Malaysia’s unique 5G model performance trending downwards while neighbouring countries hold steady
Malaysia’s 5G network performance declined from Q4 2023 to Q3 2025, a trend that directly contrasts with the stable or relatively improving performance seen in several neighboring markets. This decrease followed an initial high benchmark; our previous report noted Malaysia’s 5G median download speed as one of the world’s top performers, ranking third globally in Q3 2023. The median 5G download speed subsequently declined from 451.79 Mbps in Q4 2023 to 242.92 Mbps in Q3 2025. Over the same period, the median 5G upload speed also decreased, falling from 49.87 Mbps in Q4 2023 to 29.52 Mbps.
5G Performance Trend Across Selected Markets in Asia Pacific
Speedtest Intelligence® | Q4 2023 – Q3 2025
Up until early 2025, Malaysia deployed its 5G network using a distinct Multi-Operator Core Network (MOCN) architecture through DNB, a government-owned entity. This approach aimed to accelerate national coverage and optimize infrastructure investment. The subsequent speed decline suggests network maturation, as the focus shifted from initial high-speed urban deployment to wider geographic coverage. This expansion led to increased user adoption and usage, which placed higher demands on network capacity. Furthermore, as user adoption of 5G increases, the demand for high-capacity applications like streaming and IoT devices rises, driving the need for more assigned spectrum bandwidth to maintain and improve network performance, speed, and reliability. By channeling all operators’ 5G radio traffic through a single provider, the network is subject to speed degradation when demand rapidly increases across the entire infrastructure.
This contrasts with regional peers operating under multi-operator frameworks where market competition and segmented spectrum allocation may offer better resilience and capacity planning against traffic surges. South Korea, a long-established 5G leader, consistently reports median 5G download speeds above 528 Mbps, peaking at 564.14 Mbps by Q3 2025. Singapore demonstrates stability, with speeds reaching 349.19 Mbps in Q3 2025. Conversely, Vietnam and Brunei showed significant increases. Vietnam’s median 5G download speed reached 350.28 Mbps in Q3 2025, and Brunei also showed an overall upward trend despite some fluctuation. The observed increase in 5G performance in Vietnam and Brunei is likely attributable to their status as newer 5G markets, where initial deployments cater to a smaller, less congested subscriber base. This initial strong performance should stabilize as adoption increases in these countries.
Despite the decline, Malaysia’s Q3 2025 download speed remains competitive with several neighboring markets, notably outperforming the Philippines (120.16 Mbps), Japan (124.11 Mbps), and Thailand (169.35 Mbps), the latter of which operates predominantly on low-band and lower-mid frequency bands, naturally limiting peak speeds compared to regional peers.
Malaysia sees significant 5G-capable device adoption growth
Based on GSMA Intelligence data, 5G accounts for almost 40% of consumer connections in Malaysia, while 4G makes up nearly 60%. Analysis of the data on the proportion of devices taking Speedtests in Malaysia clearly indicates the significant growth in 5G-capable device adoption over the period from Q4 2023 to Q3 2025 . The rising proportion of users conducting Speedtests on 5G-capable devices suggests the 5G subscriber base is expanding, driven by greater device compatibility and compelling operator 5G service offerings.
Proportion of Devices Taking Speedtest in Malaysia
Speedtest Intelligence® | Q4 2024 – Q3 2025
According to Speedtest Intelligence® data, 79.5% of all tests conducted in Malaysia in Q3 2025 were carried out on 5G-capable devices. This total includes 55.0% of tests connected directly to a 5G network and 24.5% conducted by 5G-capable devices using non-5G networks. This marks a significant increase from Q4 2023, when 5G-capable devices accounted for 58.6% of all tests, with only 35.4% connected to the 5G network.
Despite the growth, users spend majority of their connected time on 4G network
Despite the growing number of 5G-capable devices, data from Q3 2025 shows that users on 5G-capable devices still spend the majority of their connected time on the 4G network. For all 5G-capable devices, 65.8% of their connected time is spent on the 4G network, compared with 29.8% on 5G.
5G-Capable Devices Spend Most of Their Connected Time On 4G
Speedtest Intelligence® | Q3 2025
This heavy reliance on 4G is strongly linked to two key factors. The first is the lack of comprehensive 5G indoor coverage nationwide. 5G typically relies on high-frequency bands, which penetrate walls and building materials less effectively, even though an estimated 70% to 80% of all mobile usage occurs indoors. DNB actively addresses this constraint by deploying 5G In-Building Solutions (IBS) at high-footfall sites. As of January 2025, DNB installed 5G IBS at 73 strategic sites, including major airports, hospitals, and transportation hubs.
Second, while DNB achieved its 80% coverage of populated areas (COPA) mandate, with recent reports stating coverage is around 82.4%, 5G service remains intermittent in many rural and non-urban areas. In our previous report, we analyzed how more rural states in Malaysia reported lower 5G Availability. This indicates that infrastructure deployment in these states often targets only the state’s capital city and major towns. The lower density of sites outside these major hubs forces devices to fall back to the 4G network, contributing to the higher time spent on the older technology
Transitioning to a dual 5G network to drive the next phase of competition
Malaysia is currently transitioning from its initial 5G network deployment model, operated by DNB, to a Dual Network (DN) approach. This policy shift marks a significant turning point in the country’s telecommunications strategy, moving away from a government-led monopoly structure toward one based on competition. The government mandated that the transition would begin once DNB achieved 80% coverage of populated areas (COPA), a target DNB hit by the end of December 2023.
In November 2024, the government announced U Mobile, the country’s third-largest mobile network operator, as the selected provider to implement the second 5G network provider. In March 2025, U Mobile stated that it had begun rolling out 5G service using standalone access (SA) technology to customers in stages. U Mobile aims for 80% coverage in populated areas within the first year of operation and 95% by the third year. DNB will continue to deploy and operate its network in parallel with U Mobile’s rollout. Managing the transition requires addressing complex considerations, including spectrum allocation for the second network, DNB’s financial viability, and the efficient operation of two parallel 5G networks.
Controlled testing shows DNB’s established network currently provides the dominant, most available 5G footprint
DNB, the incumbent 5G network provider, retained its initial spectrum allocation (F1) across the 700 MHz, 3.5 GHz, and 28 GHz bands. U Mobile, conversely, received specific blocks (F2) for the second 5G network rollout in the 700 MHz and 3.5 GHz bands.
To assess the end-user’s real-world 5G mobile experience under this structure, Ookla® used the Speedtest Drive™ controlled network testing methodology in October 2025. The testing focused on five primary clusters within the Klang Valley—Bukit Bintang, Bukit Jalil, Sunway Damansara, Tasik Batu, and Setia Alam. The controlled testing team was equipped with the latest 5G-capable handsets featuring SIM cards from major operators in the country. Among the five operators included, both Yes and U Mobile are currently implementing 5G Standalone (5G SA) technology. Yes delivers 5G SA services via the DNB infrastructure, integrating its own 5G Core. In contrast, U Mobile employs a dual strategy: it leverages the DNB network for base coverage while rapidly deploying its own second 5G network, which is fully 5G SA by design.
Using Yes as a proxy for DNB’s 5G network coverage along the data collection routes, the controlled network testing results provide unique insight into the network coverage comparison between the two 5G network providers. Analysis of the combined data across all clusters reveals that DNB’s established mid-band 3500 MHz spectrum (F1) provides the dominant 5G SA coverage footprint, effectively acting as the essential anchor for all service providers. The data from U Mobile SIMs showed they camped on DNB’s frequency bands for a combined 83.2% of the test samples. The DNB-managed 3500 MHz spectrum (F1) accounted for the largest share at 67.9%. Conversely, the U Mobile SIM camped on its own network for only 16.8% of test samples, despite U Mobile actively deploying this infrastructure . In comparison, 77.9% of Yes’s test samples camped on DNB’s 3500 MHz band.
DNB vs U Mobile 5G Standalone Frequency Band Camping Ratio
Speedtest Drive® | 4-8 October 2025
As Malaysia’s telecom market transitions to a Dual Network model, we will continue to track its progress. This shift is anticipated to foster competition, leading to a more resilient and performance-driven 5G experience for consumers. For more information about Speedtest Intelligence data and insights, please contact us.
Ookla retains ownership of this article including all of the intellectual property rights, data, content graphs and analysis. This article may not be quoted, reproduced, distributed or published for any commercial purpose without prior consent. Members of the press and others using the findings in this article for non-commercial purposes are welcome to publicly share and link to report information with attribution to Ookla.
Affandy Johan is the Industry Analyst at Ookla Research. He utilizes Ookla's data to develop insightful analyses covering various factors and aspects impacting the market. Affandy has extensive experience in the telecom industry, having worked for major vendors and operators in the Asia Pacific region.
Internet speeds keep getting faster and faster and Speedtest is ready to measure the fastest speed available — the 10 Gbps connection.
If you can’t see the above video, please check your Adblock settings.
Most of us don’t need a 10 Gbps test, yet…
Ten gigabits per second is 10 times faster than the gigabit connection your techie friend has been bragging about. For most of us, a connection this fast is overkill (right now), as you can watch a 4K Ultra streaming movie with just 25 Mbps. But there are some ISPs around the globe that are already offering 10 Gbps service.
10 Gbps opens the doors
People who upload and download huge files will love 10 Gbps. Whether you’re uploading large videos to share with clients, downloading 100 videos in the final seconds before leaving for your trip, waiting on huge game patches, or hosting the world’s largest LAN party at your house, 10 Gbps will change your life.
Having a 10 Gbps Speedtest means that organizers of huge events like Mobile World Congress (MWC) can use Speedtest to ensure that their infrastructure is fast enough to serve thousands of attendees.
Achieving a 10 Gbps Speedtest result
To get a 10 Gbps Speedtest result, you need a connection that fast and devices that are capable of handling those speeds. We tested between two Mac Minis with 9000 byte jumbo frames.
Web browsers max out around 3 Gbps, so we used our our desktop app. The test is data- intensive — our multi-thread test used over 17 GB to measure the download speed and nearly 13 GB to measure upload. We have many servers that can handle tests this large, so if you are trying to replicate our result and think your test is being limited by the server you’re using, try another.
Again, this is what a 10 Gbps Speedtest result looks like:
You’ll note that the test doesn’t quite hit 10 Gbps. This is because any connection is subject to overhead. So a 1 Gbps payload usually loses 6-9% to overhead and a 10 Gbps connection loses about the same percentage.
To see a 10 Gbps Speedtest in action, schedule a meeting at MWC or come see us in Hall 2 at Booth 2i25.
Ookla retains ownership of this article including all of the intellectual property rights, data, content graphs and analysis. This article may not be quoted, reproduced, distributed or published for any commercial purpose without prior consent. Members of the press and others using the findings in this article for non-commercial purposes are welcome to publicly share and link to report information with attribution to Ookla.
MarioDraghi has flirted with a radical restructuring of Europe’s telecoms market, seeking to cultivate pan-European scale and reinvigorate innovation and investment in telecoms. But is consolidation the answer?
Europe’s telecoms sector is at an inflection point. After a decade of stagnant revenues, lacklustre innovation and fierce competition, policymakers in Brussels are scrutinising the fundamental structure of the market. Earlier this year, a landmark report by Mario Draghi reignited discussions on consolidation, championing the creation of pan-European operators and calling for a decisive regulatory shift from proactive competition oversight (ex ante) to a reactive focus on enforcement after issues arise (ex post).
The proposed shift in policy comes as concerns over Europe’s telecoms sector’s ability to compete on a global stage reach a crescendo. A central tenet of the Draghi report is that the bloc’s fragmented telecoms market—a morass of dozens of small operators compared to just a handful in similarly sized regions elsewhere—has triggered a race to the bottom in pricing, eroding profitability and leaving Europe ill-equipped to compete with the more unified and dynamic markets of North America, the Middle East and Asia.
Mobile network quality is a key factor in the European telecoms competitiveness equation, shaping both consumer satisfaction and the bloc’s attractiveness for investment. Proponents of consolidation argue that fewer, larger operators could enhance network performance and better position the bloc to achieve the European Commission’s ambitious Digital Decade 2030 goals. The simple argument is that by cultivating market dynamics that prioritise service quality over price wars, consolidation would create stronger incentives for investment in capital-intensive mobile networks.
Critics, however, challenge this narrative that favours consolidation. Instead, they argue that network quality is not solely a function of market concentration or structure and emphasise that other factors such as pricing also play an important role in shaping Europe’s overall telecoms competitiveness. In contrast to Draghi’s position, they propose that similar outcomes could be achieved without reducing competition by deploying other policy tools, such as providing targeted funding for infrastructure rollouts or incentivising network sharing initiatives.
This white paper aims to provide independent, informed insights to support the ongoing policy discourse in Europe. It explores whether empirical evidence supports the arguments for and against consolidation in the bloc’s telecoms sector, analysing network quality, investment and pricing outcomes across the EU and a sample of other high-income countries to assess the impact of varying market structures (e.g., three or four players) and levels of market concentration.
Key takeaways
Three-player mobile markets in the EU and other high-income countries exhibit better network performance and consumer sentiment outcomes.
This trend is consistent across all technologies and at similar levels of market concentration. Among the top ten European countries ranked by median download speed in Q2-Q3 2024, seven are three-player markets. The other three — Denmark, Sweden, and France — are four-player markets where operators engage in network sharing, whether in spectrum, site infrastructure or multi-operator core networks. This suggests that the level of network sharing in these countries is more extensive than in most other four-player markets. Overall, the studied three-player markets in the EU delivered median download speeds that were 56% higher than those in four-player markets during Q2-Q3, according to Speedtest Intelligence® data.
Market concentration is not a robust predictor of 5G coverage outcomes.
Socio-economic factors such as population distribution and economic development impart a greater impact on metrics relating to overall network reach, with wealthier, more urbanised countries enjoying investment conditions that are more conducive to the attainment of very high levels of service coverage and network availability. In four-player markets, however, disparities in overall 4G availability between the best- and worst-performing operators tend to be more pronounced than their three-player counterparts.
Intense price-based competition leads to markedly lower mobile data pricing outcomes in four-player markets over time.
The median consumer cost per gigabyte in highly concentrated markets — often seen in countries with the three-player structure — is nearly five times higher than in low-concentration markets. In four-player, lower-concentration markets, depressed ARPU and higher median capital intensity may result more from limited absolute revenues constraining reinvestment than from increased competition spurring greater investment. Conversely, in some highly concentrated non-EU high-income countries, greater market concentration is associated with lower capital intensity per operator, as larger players may face reduced incentives to invest.
There is no one-size-fits-all concentration profile that uniformly optimises network quality and consumer pricing outcomes in every country.
Exceptional outcomes in countries such as Denmark — a four-player market with low concentration but very high median download speed — and the Netherlands — a three-player market with high concentration and also high median download speed — suggest a targeted policy toolkit, rather than the blunt instrument of consolidation, is needed to achieve balanced outcomes across a bloc with highly diverse market contexts.
Ookla retains ownership of this article including all of the intellectual property rights, data, content graphs and analysis. This article may not be quoted, reproduced, distributed or published for any commercial purpose without prior consent. Members of the press and others using the findings in this article for non-commercial purposes are welcome to publicly share and link to report information with attribution to Ookla.
Luke Kehoe leads Ookla’s research and thought leadership efforts in Europe.
An electronic engineering alumnus of University College Dublin, Luke has extensive experience collaborating with mobile operators, telecoms vendors, and government agencies in research and advisory roles across Europe. He has contributed to internationally recognised thought leadership publications in areas such as 5G, IoT, open RAN, and edge computing, working with prestigious organisations like the Telecom Infra Project and the World Economic Forum.
SpaceX’s Starlink internet service is the clear leader among consumer-oriented satellite internet providers in Latin America. Indeed, the company accounted for 98.2% of all consumer-oriented, satellite-based Speedtests conducted throughout the region in the third quarter of 2025.
But success invites competition. Starlink continues to push against established satellite internet providers Viasat and HughesNet. And soon it will face even more competition when Amazon Leo commercially launches service later this year.
Regardless, rural internet users throughout Latin America stand to benefit: The median download speed available through a satellite internet connection – across all consumer-oriented satellite internet providers – rose from 29.12 Mbps in the first quarter of 2023 to 72.01 Mbps in the third quarter of 2025.
Key takeaways:
Starlink consistently provided faster download and upload speeds throughout Latin America when compared with other satellite operators offering internet services to consumers between the first quarter of 2023 and the third quarter of 2025. Starlink’s median download speeds across the region reached 82.54 Mbps in the third quarter of 2025, above Viasat’s 32.73 Mbps and 15.93 Mbps from HughesNet. In some cases, Starlink’s median download speeds were also competitive with those from local fixed internet providers, such as in the Dominican Republic. But in other countries, like Chile, Starlink’s median download speeds were around a third of those provided by local fixed internet providers in the third quarter of 2025.
Starlink’s network performance has improved across many different Latin American countries. For example, its median download speeds have been on the upswing in Chile, Mexico, Brazil, and the Dominican Republic (the company’s first four Latin American markets) since the beginning of 2025. And in the third quarter of 2025, the company’s latency speeds improved in countries like Costa Rica, Guatemala, El Salvador, and Honduras, likely due to the installation of new ground stations and other terrestrial infrastructure in that specific region.
Competition is poised to rise in the Latin American market for consumer-oriented satellite internet service. While Starlink plans upgrades to its own system, so too are existing providers like Viasat and HughesNet. Meanwhile, newcomers like Amazon Leo promise to provide alternatives.
Starlink lands in Latam
According to the GSMA’s Mobile Connectivity Index, significant portions of Latin America’s residents live in rural areas. In Brazil, the region’s largest country by population, 12% of residents lived in such areas in 2024. In Mexico, that figure was 18%. In Colombia and Peru, it was 21%. And in Bolivia, it was 29%.
Obviously this can create challenges for Latin Americans on the hunt for high-speed internet access. For example, one study from the Inter-American Development Bank (IDB) and the International Telecommunication Union (ITU) found that 2,817 schools in Guatemala lacked adequate connectivity. The groups acknowledged that satellites are the only feasible technological option that could bring all of those schools online.
That said, satellites still represent a tiny fraction of the overall market for broadband services in Latin America. According to one estimate, satellite internet services in the region generated $562 million in revenues in 2024 – or around 1% of the estimated $56 billion generated by the region’s broadband services (including fiber and mobile) in 2024. That figure dovetails with recent numbers from the Organisation for Economic Co-operation and Development (OECD), which calculated that satellites accounted for 1% of fixed broadband subscriptions across all OECD countries at the end 2024.
Starlink and other satellite internet providers could help grow these numbers. Already Starlink’s Speedtest samples across Latin America have increased by more than 4x during the past 11 quarters.
Starlink’s Latin American growth is underpinned by the 10,000 low Earth orbit (LEO) Starlink satellites launched via SpaceX rockets since 2019. In 2025 alone, SpaceX has conducted more than 100 Starlink satellite launch missions. According to the GSMA, Starlink now controls up to 90% of the world’s communication satellites (excluding the three major Chinese constellations).
In early November 2025, Starlink said it provided connections to a total of 8 million people globally. That’s up from the 7 million mark Starlink reported at the end of August 2025 – a 14% increase in its customer base in just 69 days.
According to local telecom regulators, Starlink counted a total of 425,514 customers across Brazil and Mexico (Latin America’s two most populous countries) toward the end of last year. That would account for around 10% of the 4 million people Starlink counted in its global customer base at that time.
Starlink first began offering services in Latin America in 2021, starting with Chile (in September 2021) and then quickly expanding to Mexico (November 2021), Brazil (January 2022) and the Dominican Republic (July 2022).
Starlink's First Four Latin American Markets
Ookla Speedtest data, starting after market launch | Q4 2021 – Q3 2025
In general, Starlink’s median download speeds dipped in the months after its initial launch in each market, as the company loads more users onto its network. This is a consequence of multiple users sharing a finite resource (Starlink’s network and spectrum) and it can also be seen in Starlink’s performance on other continents as well as during events that bring together large numbers of Starlink users. As the company’s network speeds slow, Starlink can then tailor its pricing and offerings in order to moderate the addition of new customers onto its network – the company’s coverage map currently shows locations where its services are “sold out.”
The overall competitiveness of Starlink’s network performance can vary dramatically by country. In Chile, for example, Starlink’s median download speeds in the third quarter of 2025 (106.38 Mbps) significantly trailed those available from the country’s fixed internet providers at 354.53 Mbps. Chile, after all, is where 50 Gbps service plans are beginning to emerge.
Meanwhile, in the Dominican Republic, Starlink’s median download speeds of 55.01 Mbps in the third quarter of 2025 were very close to the 53.71 Mbps median download speeds provided by the country’s fixed internet providers.
Starlink accelerates across Latin America
This, however, is just the beginning. Since the start of 2023, Starlink has introduced its satellite internet services in a total of 11 new Latin American markets, countries that account for around one out of every four Latin Americans.
Market
Starlink launch date
Peru
January 2023
Colombia
January 2023
El Salvador
April 2023
Panama
May 2023
Guatemala
July 2023
Costa Rica
November 2023
Honduras
December 2023
Paraguay
December 2023
Argentina
March 2024
Uruguay
May 2024
Guyana
April 2025
In general, Starlink’s median upload and download speeds in these newer markets have been rising since the beginning of this year, likely due to the additional satellites Starlink has been adding to its constellation.
Starlink Latin American Market Launches, Q1 2023 – Q3 2025
Ookla Speedtest data for each of Starlink's new markets in Latin America, starting after the market launch
Starlink’s latency measurements – particularly in neighboring Central American countries like Costa Rica, Guatemala, El Salvador, and Honduras – showed improvement in the third quarter of 2025. That may be due to the installation of new ground stations and other terrestrial infrastructure in that specific region. Such equipment can more quickly route user traffic from Starlink’s satellite network and onto the public internet backbone via physically shorter, more direct paths to users’ internet destinations.
Along these lines, Starlink’s own network performance map shows Guyana (Starlink’s newest Latin American market) with higher latency speeds than any other location in Latin America. A third-party map of Starlink’s terrestrial infrastructure indicates a possible reason: The nearest Starlink terrestrial infrastructure is in Manaus, Brazil, some 350 miles away from Guyana.
Starlink isn’t the only game in town
Starlink is a relatively new player in the market for satellite internet services across Latin America.
Viasat, founded in the 1980s, counts around 157,000 satellite internet subscribers in the U.S., down from around 228,000 a year ago. The company does not disclose the number of customers it has outside of the U.S. And HughesNet, owned by EchoStar, was founded in the 1990s and counts roughly 783,000 satellite internet customers globally. That too is down from the 912,000 it counted a year ago. HughesNet doesn’t break out its Latin American customer figures, but around a year ago it told one publication that it had 400,000 subscribers across Brazil, Chile, Colombia, Ecuador, Mexico, and Peru (which would account for about 44% of the company’s global customer base at the time).
Like Starlink, both Viasat and HughesNet sell satellite internet services directly to consumers. And like Starlink, both companies also operate their own satellites. However, Viasat and HughesNet maintain a handful of large, geostationary orbit (GEO) satellites whereas Starlink’s satellites are smaller, much more plentiful, and orbit closer to the Earth.
This design difference in satellite constellations is the main reason for the disparity in performance between Starlink and Viasat and HughesNet in Latin America and elsewhere.
Latin American Consumer-Oriented Satellite Internet Providers
Ookla Speedtest data | Latin America | Q1 2023 – Q3 2025
Satellite market on course to become more complex and diverse
Starlink, Viasat and HughesNet aren’t the only companies flying satellites over Latin America.
For example, OneWeb Eutelsat also operates a global LEO constellation of 600 satellites. The company, originally founded in 2012, eventually filed for bankruptcy protection and, later, merged with European GEO satellite operator Eutelsat to become OneWeb Eutelsat. Today, it focuses on wholesale connectivity rather than direct-to-consumer sales. OneWeb Eutelsat connections occasionally show up in Ookla data for Latin America but not in statistically relevant numbers.
SES also targets the market for wholesale satellite internet services in Latin America. The company, founded in the 1980s, operates both GEO and medium Earth orbit (MEO) satellites. Like OneWeb Eutelsat, SES connections occasionally show up in Ookla data for Latin America with speeds generally below those provided by the likes of Viasat and HughesNet.
Finally, Andesat and Hispasat are also worth mentioning in a discussion of satellite internet because both companies are based in Latin America and both operate a handful of their own satellites. Both companies target the business-to-business sector, like SES and OneWeb Eutelsat. Hispasat connections occasionally show up in Ookla data for Latin America, and speeds are similar to those of SES.
Nonetheless, Andesat and Hispasat are important because they both dovetail with ongoing geopolitical sensitivities concerning national satellite sovereignty. For example, Starlink is not currently authorized in Bolivia, reflecting that country’s specific regulatory environment. On the opposite side of such issues, Starlink cannot sell services in Venezuela due to U.S. embargoes.
Starlink’s coverage map reflects these ongoing geopolitical realities, showing coverage gaps across Latin American countries like Cuba and Nicaragua.
That said, much may change in the future. Amazon Leo’s pending launch of commercial satellite internet service is perhaps the clearest signal of this change. Last year, Latin American media and telecom provider Vrio announced plans to sell Amazon Leo connections to consumers in Argentina, Brazil, Chile, Uruguay, Peru, Ecuador, and Colombia through DirecTV Latin America and Sky Brasil.
Meanwhile, Viasat and HughesNet are planning to launch additional satellites in support of their own offerings. Other satellite companies – such as Telesat in Canada – are also planning to join the fray.
But Starlink isn’t standing still. The company is planning a major upgrade to its satellite constellation – via its bigger V3 satellites – that could further improve its network speeds and capacity. That effort may be bolstered by SpaceX’s bigger Starship rocket, which promises to launch more Starlink satellites than the company’s current rockets.
To find out more about Speedtest Intelligence® data and insights, visit our website.
Starlink enciende la fiesta de internet en la América Latina rural
El servicio de internet por satélite de SpaceX está registrando un crecimiento en toda América Latina, justo cuando otras compañías intensifican las alternativas.
El servicio de internet Starlink de SpaceX es el líder claro entre los proveedores de internet por satélite orientados al consumidor en América Latina. De hecho, la compañía representó el 98,2% de todos las muestras de Speedtest por satélite hechas por consumidor registradas en toda la región en el tercer trimestre de 2025.
Pero el éxito atrae a la competencia. Starlink continúa presionando a los proveedores de internet por satélite establecidos Viasat y HughesNet. Y pronto se enfrentará a aún más competencia cuando Amazon Leo lance comercialmente su servicio a finales de este año.
En cualquier caso, los usuarios rurales de internet en toda América Latina se beneficiarán: la velocidad media de descarga disponible a través de una conexión a internet por satélite —en todos los proveedores de internet por satélite— aumentó de 29,12 Mbps en el primer trimestre de 2023 a 72,01 Mbps en el tercer trimestre de 2025.
Principales conclusiones:
Starlink proporcionó de manera constante velocidades de descarga y subida más rápidas en toda América Latina en comparación con otros operadores de satélite que ofrecen servicios de internet a los consumidores entre el primer trimestre de 2023 y el tercer trimestre de 2025. Las velocidades medianas de descarga de Starlink en la región alcanzaron 82,54 Mbps en el tercer trimestre de 2025, por encima de los 32,73 Mbps de Viasat y los 15,93 Mbps de HughesNet. En algunos casos, las velocidades medianas de descarga de Starlink también fueron competitivas con las de los proveedores de internet fijos locales, como en la República Dominicana. Pero en otros países, como Chile, las velocidades medianas de descarga de Starlink fueron alrededor de un tercio de las proporcionadas por los proveedores de internet fijos locales en el tercer trimestre de 2025.
El rendimiento de la red de Starlink ha mejorado en muchos países diferentes de América Latina. Por ejemplo, sus velocidades medianas de descarga han ido en aumento en Chile, México, Brasil y la República Dominicana (los primeros cuatro mercados latinoamericanos de la compañía) desde principios de 2025. Y en el tercer trimestre de 2025, la latencia de la compañía mejoró en países como Costa Rica, Guatemala, El Salvador y Honduras, probablemente debido a la instalación de nuevas estaciones terrestres y otras infraestructuras terrestres en esa región específica.
La competencia está a punto de aumentar en el mercado latinoamericano de servicios de internet por satélite orientados al consumidor. Mientras Starlink planea mejoras en su propio sistema, también lo están haciendo los proveedores existentes como Viasat y HughesNet. Mientras tanto, los recién llegados como Amazon Leo prometen proporcionar alternativas.
Starlink aterriza en Latam
Según el Índice de Conectividad Móvil de la GSMA, una parte significativa de los residentes de América Latina vive en zonas rurales. En Brasil, el país más grande de la región por población, el 12% de los residentes vivía en dichas áreas en 2024. En México, esa cifra era del 18%. En Colombia y Perú, era del 21%. Y en Bolivia, era del 29%.
Obviamente, esto puede generar desafíos para los latinoamericanos en la búsqueda de acceso a internet de alta velocidad. Por ejemplo, un estudio del Banco Interamericano de Desarrollo (BID) y la Unión Internacional de Telecomunicaciones (UIT) descubrió que 2.817 escuelas en Guatemala carecían de la conectividad adecuada. Los grupos reconocieron que los satélites son la única opción tecnológica viable que podría conectar todas esas escuelas.
Dicho esto, los satélites todavía representan una ínfima parte del mercado global de servicios de banda ancha en América Latina. Según una estimación, los servicios de internet por satélite en la región generaron 562 millones de dólares en ingresos en 2024, o alrededor del 1% de los 56 mil millones de dólares estimados generados por los servicios de banda ancha de la región (incluyendo fibra y móvil) en 2024. Esa cifra concuerda con los números recientes de la Organización para la Cooperación y el Desarrollo Económicos (OCDE), que calculó que los satélites representaban el 1% de las suscripciones de banda ancha fija en todos los países de la OCDE a finales de 2024.
Starlink y otros proveedores de internet por satélite podrían ayudar a aumentar estas cifras. Las muestras de Speedtest de Starlink en toda América Latina ya se han multiplicado por más de 4 durante los últimos 11 trimestres.
El crecimiento de Starlink en América Latina se sustenta en los 10.000 satélites Starlink de órbita terrestre baja (LEO) lanzados mediante cohetes SpaceX desde 2019. Solo en 2025, SpaceX ha llevado a cabo más de 100 misiones de lanzamiento de satélites Starlink. Según la GSMA, Starlink ahora controla hasta el 90% de los satélites de comunicaciones del mundo (excluyendo las tres principales constelaciones chinas).
A principios de noviembre de 2025, Starlink dijo que proporcionaba conexiones a un total de 8 millones de personas a nivel mundial. Eso es un aumento con respecto a la marca de 7 millones que Starlink reportó a finales de agosto de 2025, un aumento del 14% en su base de clientes en sólo 69 días.
Según los reguladores locales de telecomunicaciones, Starlink contaba con un total de 425.514 clientes entre Brasil y México (los dos países más poblados de América Latina) hacia finales del año pasado. Eso representaría alrededor del 10% de los 4 millones de personas con las que Starlink contaba en su base de clientes global en ese momento.
Starlink comenzó a ofrecer servicios en América Latina por primera vez en 2021, empezando por Chile (en septiembre de 2021) y luego expandiéndose rápidamente a México (noviembre de 2021), Brasil (enero de 2022) y la República Dominicana (julio de 2022).
Primeros cuatro mercados de Starlink en Latinoamérica
Datos de Speedtest de Ookla, desde el lanzamiento en el mercado / 4º trim. 2021 – 3er trim. 2025
En general, las velocidades medianas de descarga de Starlink disminuyeron en los meses posteriores a su lanzamiento inicial en cada mercado, a medida que la empresa incorporaba más usuarios a su red. Esta es una consecuencia de que múltiples usuarios compartan un recurso finito (la red y el espectro de Starlink) y también se puede observar en el rendimiento de Starlink en otros continentes, así como durante eventos que reúnen a un gran número de usuarios de Starlink. A medida que la velocidad de la red de la compañía se ralentiza, Starlink puede ajustar sus precios y ofertas para moderar la adición de nuevos clientes a su red. El mapa de cobertura de la compañía actualmente muestra ubicaciones donde sus servicios están “agotados” (sold out).
La competitividad general del rendimiento de la red de Starlink puede variar drásticamente según el país. En Chile, por ejemplo, las velocidades medianas de descarga de Starlink en el tercer trimestre de 2025 (106,38 Mbps) quedaron significativamente por detrás de las disponibles a través de los proveedores de internet fijos del país, con 354,53 Mbps. Después de todo, Chile es donde los planes de servicio de 50 Gbps están comenzando a surgir.
Mientras tanto, en la República Dominicana, las velocidades medianas de descarga de Starlink de 55,01 Mbps en el tercer trimestre de 2025 estuvieron muy cerca de las velocidades medias de descarga de 53,71 Mbps proporcionadas por los proveedores de internet fijos del país.
Starlink acelera en América Latina
Sin embargo, esto es sólo el principio. Desde el comienzo de 2023, Starlink ha introducido sus servicios de internet por satélite en un total de 11 nuevos mercados latinoamericanos, países que representan aproximadamente a uno de cada cuatro latinoamericanos.
Mercado
Fecha lanzamiento Starlink
Perú
Enero 2023
Colombia
Enero 2023
El Salvador
Abril 2023
Panamá
Mayo 2023
Guatemala
Julio 2023
Costa Rica
Noviembre 2023
Honduras
Diciembre 2023
Paraguay
Diciembre 2023
Argentina
Marzo 2024
Uruguay
Mayo 2024
Guyana
Abril 2025
En general, las velocidades medianas de subida y descarga de Starlink en estos mercados más nuevos han ido en aumento desde principios de este año, probablemente debido a los satélites adicionales que Starlink ha estado añadiendo a su constelación.
In general, Starlink’s median upload and download speeds in these newer markets have been rising since the beginning of this year, likely due to the additional satellites Starlink has been adding to its constellation.
Lanzamiento Starlink en Latinoamérica. 1er trim. 2021 – 3er trim. 2025
Datos de Speedtest de Ookla para cada uno de los nuevos mercados en Latinoamérica, desde el lanzamiento en el mercado
Las mediciones de latencia de Starlink —particularmente en países vecinos de Centroamérica como Costa Rica, Guatemala, El Salvador y Honduras— mostraron una mejora en el tercer trimestre de 2025. Esto puede deberse a la instalación de nuevas estaciones terrestres y otras infraestructuras terrestres en esa región específica. Dicho equipo puede encaminar más rápidamente el tráfico de los usuarios desde la red satelital de Starlink hacia la red troncal de internet pública a través de rutas físicamente más cortas y directas hacia los destinos de internet de los usuarios.
En esta línea, el propio mapa de rendimiento de la red de Starlink muestra a Guyana (el mercado latinoamericano más reciente de Starlink) con menores latencias que cualquier otra ubicación en América Latina. Un mapa de terceros de la infraestructura terrestre de Starlink indica una posible razón: la infraestructura terrestre de Starlink más cercana se encuentra en Manaus, Brasil, a unas 350 millas (aproximadamente 563 kilómetros) de Guyana.
Starlink no es el único actor en el mercado
Starlink es un actor relativamente nuevo en el mercado de servicios de internet por satélite en América Latina.
Viasat, fundada en la década de 1980, cuenta con alrededor de 157.000 suscriptores de internet por satélite en EE. UU., una cifra inferior a los aproximadamente 228.000 de hace un año. La compañía no revela el número de clientes que tiene fuera de EE. UU. Y HughesNet, propiedad de EchoStar, fue fundada en la década de 1990 y cuenta con aproximadamente 783.000 clientes de internet por satélite a nivel mundial. Esta cifra también es inferior a los 912.000 que tenía hace un año. HughesNet no desglosa sus cifras de clientes en América Latina, pero hace aproximadamente un año declaró a una publicación que tenía 400.000 suscriptores entre Brasil, Chile, Colombia, Ecuador, México y Perú (lo que representaría alrededor del 44% de la base global de clientes de la compañía en ese momento).
Al igual que Starlink, tanto Viasat como HughesNet venden servicios de internet por satélite directamente a los consumidores. Y al igual que Starlink, ambas compañías también operan sus propios satélites. Sin embargo, Viasat y HughesNet mantienen un puñado de satélites grandes en órbita geoestacionaria (GEO), mientras que los satélites de Starlink son más pequeños, mucho más numerosos y orbitan más cerca de la Tierra.
Esta diferencia de diseño en las constelaciones de satélites es la razón principal de la disparidad en el rendimiento entre Starlink, Viasat y HughesNet, tanto en América Latina como en otros lugares.
Proveedores de satélite al consumidor final en Latinoamérica
Datos de Speedtest de Ookla / Latinoamérica / 1er trim 2023 – 3er trim. 2025
El mercado del satélite rumbo a ser más complejo y diverso
Starlink, Viasat y HughesNet no son las únicas compañías que tienen satélites sobre América Latina.
Por ejemplo, OneWeb Eutelsat también opera una constelación LEO global de 600 satélites. La compañía, fundada originalmente en 2012, finalmente se declaró en bancarrota y, más tarde, se fusionó con el operador europeo de satélites GEO Eutelsat para convertirse en OneWeb Eutelsat. Hoy en día, se centra en la conectividad mayorista (wholesale) en lugar de las ventas directas al consumidor. Las conexiones de OneWeb Eutelsat aparecen ocasionalmente en los datos de Ookla para América Latina, pero no en números estadísticamente relevantes.
SES también se dirige al mercado de servicios de internet satelital mayoristas en América Latina. La compañía, fundada en la década de 1980, opera satélites tanto GEO como de órbita terrestre media (MEO). Al igual que OneWeb Eutelsat, las conexiones de SES aparecen ocasionalmente en los datos de Ookla para América Latina, con velocidades generalmente inferiores a las proporcionadas por empresas como Viasat y HughesNet.
Finalmente, también vale la pena mencionar a Andesat e Hispasat en una discusión sobre internet satelital, porque ambas compañías tienen su sede en América Latina y ambas operan un puñado de sus propios satélites. Ambas compañías se dirigen al sector business-to-business (de empresa a empresa), al igual que SES y OneWeb Eutelsat. Las conexiones de Hispasat aparecen ocasionalmente en los datos de Ookla para América Latina, y las velocidades son similares a las de SES.
No obstante, Andesat e Hispasat son importantes porque ambas encajan con las sensibilidades geopolíticas actuales relativas a la soberanía satelital nacional. Por ejemplo, Starlink no está actualmente autorizado en Bolivia, lo que refleja el entorno regulatorio específico de ese país. En el lado opuesto de tales cuestiones, Starlink no puede vender servicios en Venezuela debido a los embargos de EE.UU.
El mapa de cobertura de Starlink refleja estas realidades geopolíticas actuales, mostrando lagunas de cobertura en países latinoamericanos como Cuba y Nicaragua.
Dicho esto, mucho puede cambiar en el futuro. El inminente lanzamiento del servicio comercial de internet por satélite Amazon Leo es quizás la señal más clara de este cambio. El año pasado, el proveedor latinoamericano de medios y telecomunicaciones Vrio anunció planes para vender conexiones de Amazon Leo a consumidores en Argentina, Brasil, Chile, Uruguay, Perú, Ecuador y Colombia a través de DirecTV Latin America y Sky Brasil.
Mientras tanto, Viasat y HughesNet están planeando lanzar satélites adicionales en apoyo de sus propias ofertas. Otras compañías satelitales, como Telesat en Canadá, también planean unirse a la contienda.
Pero Starlink no se queda quieto. La compañía está planeando una actualización importante de su constelación de satélites, a través de sus satélites V3 más grandes, que podría mejorar aún más la velocidad y capacidad de su red. Ese esfuerzo puede verse reforzado por el cohete Starship, más grande de SpaceX, que promete lanzar más satélites Starlink que los cohetes actuales de la compañía.
Para obtener más información sobre los datos y la información de Speedtest Intelligence®, visite nuestro sitio web.
Ookla retains ownership of this article including all of the intellectual property rights, data, content graphs and analysis. This article may not be quoted, reproduced, distributed or published for any commercial purpose without prior consent. Members of the press and others using the findings in this article for non-commercial purposes are welcome to publicly share and link to report information with attribution to Ookla.
Mike Dano is a Lead Industry Analyst in Ookla’s research and content team. He covers the North and South American markets, and global technology trends. Previously, Mike was a journalist covering the global telecom industry for 25 years at publications including RCR Wireless News, Fierce Network and Light Reading.
The Era of Connectivity Has Changed: As customer expectations increase and high-speed internet access matures,the new No. 1 battleground for ISP customer satisfaction and retention is the “last 50 feet”—the in-building Wi-Fi experience. For enterprises, the move to wireless-first has made Wi-Fi the backbone of employee productivity and operational continuity.
There is a Massive Market Gap: The industry’s current two-tiered support model relies on either low-visibility guesswork without specialized tools that leads to costly repeat truck rolls, or unscalable expert devices that are too expensive and complex to deploy fleetwide.
Speedtest Pulse™ Fills This Gap: We built Speedtest Pulse to solve this specific, costly problem. Pulse is a new, professional-grade diagnostic tool, precision-engineered at a disruptive price point. It empowers every frontline technician—for the first time—to definitively validate installs, resolve Wi-Fi issues on the first visit, and provide proof of performance.
The Connectivity Landscape Today
Wi-Fi is now the primary lens through which residential and business customers experience and judge their internet service. For Internet Service Providers (ISPs), controlling the quality of that experience has become a critical battleground for customer satisfaction and retention. For enterprises, Wi-Fi is the backbone of employee productivity and a critical component of core operations.
The internet’s evolution is driven by a constant cycle between infrastructure and applications. When ISPs build faster networks, they create new capacity. Application developers fill that capacity with more demanding experiences, such as the shift from standard-definition to 4K streaming. These new, richer applications quickly become the standard, raising user expectations and creating demand for even more network speed and quality. This virtuous circle in which infrastructure enables innovation, innovation raises consumer expectations, and together those create demands for better infrastructure, is the engine that pushes our digital world forward.
For the last two decades, ISPs have viewed their greatest challenge as the last mile—the final leg of the network connecting their infrastructure to the subscriber’s premises. This became the industry’s primary focus, the biggest driver of capital expenditure (CapEx), and the main competitive battleground.
And now, that last-mile challenge is fundamentally changing, largely becoming a problem of execution and investment—not capability. The industry has multiple, powerful paths to deliver speed—from fiber and DOCSIS 4.0 to innovations in low-Earth-orbit (LEO) satellite and fixed wireless access (FWA). While the competition to deploy these solutions is immense, the raw speed to the doorstep is less of a problem for a majority of customers in advanced markets.
For an increasing number of ISPs and their customers, the challenge is no longer about getting the necessary speed to the building, but about what happens once it gets inside. By delivering all that speed to the modem, ISPs have also shined a massive spotlight on a new bottleneck: the in-building Wi-Fi experience—the “last 50 feet.” The entire digital experience, from the enterprise to the living room, is now wireless. For example, the average U.S. internet household has about 17 connected devices, and the Macbook Pro hasn’t had an ethernet port in over a decade.
Rising Consumer Expectations
This new in-building bottleneck—where weak Wi-Fi coverage, interference, congestion, or device issues can cause slow speeds or other issues—hasn’t just created a technical problem; it has exposed a massive gap between what customers now expect and what most ISPs efficiently deliver. While Ookla data confirms broadband speeds are rising, the customer sentiment of fiber customers is actually declining. New benchmarks from the American Customer Satisfaction Index show every single one of 14 key satisfaction metrics—from reliability to streaming quality—declined from 2024 to 2025 among fiber customers.
Consumer expectations have fundamentally changed, shifting away from just speed and towards whole-home or business connectivity. In fact, consumers now see their ISP as the single point of responsibility for their entire connected experience. The proof is in the data: a 2025 Techsee report based on a survey of nearly four thousand U.S. households found that 77% of consumers expect providers to test coverage during installation and verify that every room is connected. They don’t just want a promise of speed; they want trusted proof of coverage.
This new expectation comes with a severe, high-stakes penalty for failure: customer churn. Customer loyalty is no longer tied to the last-mile cable, but to the quality of the in-home experience. The same Techsee study found that 51% of consumers would switch providers if their Wi-Fi issues aren’t resolved quickly. This is the new battleground for customers, fought across the entire in-home experience, from the living room to the back bedroom to every corner where users expect flawless connectivity.
The problem is that ISPs are being held accountable for an environment they can’t see, which poses a significant reputational risk. This gap between customer expectations and reality is already at a breaking point.
68% of households reported Wi-Fi problems in the past 12 months.
39% of those households required a technician to be dispatched, a process commonly known as a “truck roll.”
Worse, about 20% of those costly truck rolls failed to resolve the issue on the first visit—a classic “No Fault Found” scenario where the tech proves the speed to the modem is good, but the customer’s problem remains unsolved.
Based on these figures, common connectivity issues can cost a typical ISP with one million subscribers up to $140 million annually in customer churn and technician costs.
This crisis of rising expectations, however, hides a massive opportunity. Data shows that customers aren’t unreasonable; they just want proof. In fact, 56% of consumers said they would purchase additional equipment, like mesh systems, if a technician presented them with clear evidence of coverage gaps.
The findings from the Techsee study create a clear mandate for ISPs: solve the top customer complaint (in-home Wi-Fi issues), reduce repeat truck rolls, stop churn, and turn a costly service call into a new revenue stream by giving technicians the proof they need to recommend upgrades or additional equipment that improve the in-home experience.
Gap in Current ISP Solutions
The industry has been actively trying to gain visibility into the in-home experience for years. The problem is that the available tools were either not purpose-built or not scalable for this new, complex, and highly variable environment. This critical mismatch has forced providers into a largely broken, two-tiered operational model.
The first tier is the default model for the vast majority of subscribers, and relies on low-visibility guesswork. When a customer calls their ISP with a Wi-Fi complaint, the ISP’s diagnostics stop at the modem, providing an “inside-out” view, using CPE-embedded tools. This approach, which Ookla also provides, is valuable for getting a performance baseline from the router, or for proving service levels to the router. However, it cannot measure the true customer experience, which happens on a device two rooms away. This inside-out view is also completely blind the moment a customer plugs in their own router, leaving support teams with little or zero visibility.
This process inevitably results in a “No Fault Found” truck roll. A frontline technician is dispatched—at significant operational cost—without the tools needed to definitively diagnose the in-building problem. Instead, the technician is limited to confirming whether the service to the home is working, leaving the customer’s problem unsolved and increasing the risk of churn.
The second tier is the expert escalation model, reserved for high-value accounts where the cost of failure is too great to risk customer loss or reputational damage. When all else fails, the ISP is forced to escalate. This requires dispatching an expert network engineer equipped with highly specialized, enterprise-grade hardware.
While this specialist approach can eventually find the root cause, the model itself is operationally and financially unsustainable. These specialized devices cost thousands of dollars each and require significant training for thousands of ISP troubleshooting technicians and installation teams, making them economically unfeasible to deploy at scale. More importantly, they are what we call ‘data-rich, but insight-poor.’ Many of these tools provide complex RF data that requires an expert to interpret—not a simple, actionable recommendation.
Furthermore, these tools are not designed for autonomous testing of network performance; they are only useful when a technician is physically on-site, making it nearly impossible to diagnose the intermittent problems that frustrate customers and generate the most repeat truck rolls.
The fundamental challenges of large enterprise connectivity
ISPs aren’t the only ones struggling with the in-building connectivity problem. Enterprise faces a parallel challenge, where the stakes are measured in operational continuity and employee productivity. For large enterprises, this connectivity challenge is no longer just an IT issue—it’s a C-suite business problem, with a recent study finding that 70% of CEOs claim their network is slowing business growth.
Wi-Fi is now the backbone for enterprise environments. New network installations have moved to either wireless-first or wireless-only. This move concentrates all operational risk onto the Wi-Fi network, which is why visibility into the end-user experience is absolutely vital. This isn’t just about employee laptops and video calls; it’s about mission-critical systems: logistics scanners in a warehouse, medical devices in a hospital, and point-of-sale systems in retail. When Wi-Fi fails, business stops.
The shift to wireless-first and wireless-only networks has created a set of immense operational hurdles for IT leaders, both for their internal teams and their external partners:
The Scale Challenge: Managing network performance across hundreds or thousands of distributed sites is an immense operational challenge.
The Visibility Challenge: Central IT teams lack visibility into the real user experience at each site.
The Expertise Challenge: IT directors face a constant, unsustainable choice: pull their highest-skilled network engineers into routine troubleshooting, or let frontline problems pile up and drag down productivity.
This leaves IT leaders and their partners grappling with critical, unanswered questions. They are left struggling to ensure a consistent quality of experience across all their locations and service providers. Without objective, real-world wireless throughput and RF performance data, enterprises are forced to guess which locations to prioritize for network upgrades. All the while, they must reckon with the true, and often uncalculated, cost of pulling their senior engineers—both internally and at their partner organizations—away from strategic projects.
Introducing Speedtest Pulse™
This new era of connectivity, rising consumer expectations, and the gap in current solutions is precisely why we built Speedtest Pulse. Pulse solves these fundamental industry challenges at a disruptive and scalable price point.
To bring that vision to life, we at Ookla looked to the unique combination of core capabilities across our business and solutions. We’ve combined the unmatched Wi-Fi expertise of Ekahau—the creators of the market-leading Sidekick 2 Wi-Fi diagnostic device—with the powerful performance and experience validation, and iconic ease-of-use of Speedtest.
We packed decades of network intelligence into a single device that fits in the palm of your hand. The result is Speedtest Pulse, a professional, pocket-sized device and software application built for ISP technicians and Enterprise IT teams who need a simple way to validate network installs, resolve Wi-Fi issues, and guarantee network performance.
For ISPs, Pulse makes every technician their first line of defense against churn. It validates new installs and provides trusted proof to close trouble tickets on the first visit. This results in drastically reduced operational costs, fewer repeat truck rolls, and new sales opportunities.
For IT teams across large enterprises, hospitals, universities, and more, Pulse provides a simple way to validate network health across complex environments without immediately escalating to specialist teams.
We built Pulse from the ground up as a next-generation diagnostic platform, precision-engineered for today’s Wi-Fi-centric environment. Our goal is simple: to provide technicians and IT teams with simple, actionable recommendations that help them quickly identify and fix in-home and enterprise Wi-Fi performance issues—all at a price point that enables fleetwide adoption.
Active Pulse: Validating New Installs and Resolving Trouble Tickets
Active Pulse mode is the technician’s primary tool for guaranteeing performance on every site visit, whether it’s a new installation or a service call. Active Pulse provides one-tap, smartphone-based validation that translates complex network data into clear, actionable recommendations. The workflow is designed to eliminate guesswork and provide definitive proof of performance:
Step 1: Verify the inbound service
Before assessing the customer’s Wi-Fi, the technician’s first step is to isolate the service delivery from the local network. The technician is guided to connect the Speedtest Pulse device directly to the customer’s modem or router using an Ethernet cable.
The technician then runs an initial test to verify the performance of the inbound wired connection, up to 1 Gbps. This establishes a trusted performance baseline, confirming the inbound ISP service is functioning properly before any potential Wi-Fi issues are investigated.
Step 2: Test the wireless network performance
Once the wired service is validated, the technician disconnects the Ethernet cable and uses the Pulse mobile app to verify and/or diagnose the Wi-Fi environment. The technician can verify wireless performance in multiple areas of a home or business.
Using the app, technicians tap to initiate a test that measures key wireless throughput performance metrics using the trusted Speedtest server network. Then, Pulse scans the RF environment to identify common Wi-Fi problems like channel congestion or weak coverage and can analyze client-specific connectivity issues.
Instead of showing raw data, the Speedtest Pulse app provides easy-to-understand results and recommendations.
If an issue is detected, the Pulse software analyzes the network’s KPIs holistically and provides clear instructions for improvement, such as, “Reduce Wi-Fi Contention. Your network is on Channel 36, which is crowded…Action: Change radio setting to channel 149.”
This empowers technicians to diagnose and fix problems on the spot—quickly and efficiently, even for those without Wi-Fi expertise.
Step 4: Provide definitive proof of install performance or issue resolution
After addressing a customer’s issues, the technician can generate a standardized install performance or issue resolution report to provide the proof that consumers today are seeking.
For new installs, this report serves as an internal “Day-One Performance Baseline” and provides data-driven confidence that the network is deployed consistently. It also directly addresses the growing number of customers who expect providers to prove whole-home or whole-business coverage, building customer trust and creating a positive first impression.
For troubleshooting tickets, this report provides definitive, trusted proof that the source of the customer complaint has been pinpointed and the issue has been resolved. It equips the technician with the actionable data needed to close the ticket in minutes, ending costly disputes and validating for the customer that their network is now performing correctly.
A technician can typically complete a full diagnostic workflow—which includes an initial wired test to baseline the inbound service and multiple subsequent Wi-Fi tests in key locations—in approximately 5-10 minutes.
Continuous Pulse: Autonomous Testing Capabilities
When a technician visits a home or business to troubleshoot connectivity, that visit captures only a single moment in time. This leaves ISPs and IT teams struggling with a two-part visibility gap: they lack the real-world data to proactively assess long-term network health, and they struggle to diagnose problems they cannot replicate on site.
This gap has forced the industry into a reactive, “squeaky wheel” support model, where resources are only dispatched after a customer is already frustrated. This drives up costs with repeat truck rolls, leaves tickets unresolved, and damages customer confidence.
Intermittent issues that can’t be reproduced during a site visit are among the toughest challenges ISPs and IT teams face. They drive repeat truck rolls, unresolved tickets, and lead to even more frustrated customers. Historically, there hasn’t been a cost-effective way to capture and resolve these elusive problems.
Speedtest Pulse’s Continuous mode, slated for release in 2026, solves this problem directly. As an affordable leave-behind testing tool, Pulse’s Continuous mode captures performance data over time and provides the conclusive evidence needed to finally close lingering tickets and restore customer confidence. Unlike internal monitoring tools that only show the network’s perspective, Pulse measures performance from the client device’s perspective, providing the trusted real-world data needed to measure service quality. With Continuous Pulse, organizations can:
Leave the device behind: Continuous Pulse is a “leave-behind” mode that operates as a standalone device for long-term, autonomous data collection without requiring a mobile app for ongoing operation.
Capture long-term trends: Continuous mode establishes clear performance baselines and makes it possible to detect degradation before it impacts end users.
Diagnose elusive problems: By running consistent tests over time, Pulse provides the evidence needed to identify and address intermittent problems that traditional tools can miss.
Integrate with existing systems: Data from Continuous Pulse feeds directly into Speedtest Insights™ and can be incorporated into existing network performance and assurance platforms.
Continuous Pulse mode provides the long-term, client-side visibility needed to catch intermittent issues early and cut down on repeat visits. In effect, Speedtest Pulse acts as the canary in the coal mine to identify underperforming networks. For large organizations, this allows IT leaders to stop guessing and deploy their expert resources (like senior engineers and specialized tools) only to the locations where their expertise will have the greatest impact. For customers using Speedtest Certified—our data-driven network certification for properties—Continuous mode will further enrich the certification by providing ongoing performance measurements.
The Power of the Ookla Ecosystem
The launch of Speedtest Pulse marks the start of a new chapter in how organizations approach network troubleshooting and validation. For ISPs, Pulse provides the scalable, easy-to-use, and insight-driven tool they need to fix the broken, two-tiered operational support model currently in place. Pulse empowers every technician to solve top wireless complaints on the first visit and drastically lower operational costs. And for Enterprises, Pulse delivers the outside-in visibility needed to solve scale and expertise challenges, empowering frontline IT personnel to validate network health across distributed sites.
Data from Speedtest Pulse will seamlessly integrate with Speedtest Insights, our centralized network intelligence platform, and/or can be integrated with existing experience and performance management systems. To build a truly comprehensive picture, data from Pulse can be used in conjunction with other products, including:
Speedtest Certified: The data-driven network certification for properties that proves on-site network excellence.
Speedtest: Leverage insights from 11 Million daily consumer-initiated tests.
Downdetector: Real-time problem and outage monitoring for early alerting on service issues.
Speedtest Embedded: Integrate Speedtest functionality into on-premise CPEs and other connected devices for network monitoring.
Speedtest SDK: Integrate Speedtest testing into any mobile application for performance insights.
Speedtest Pulse is the new, crucial piece of our holistic vision to collect and analyze data from all sources in the Ookla data ecosystem. Together, they provide a 360-degree view of the connected experience that is unmatched in the industry. Contact us to learn how Speedtest Pulse can help your organization.
Ookla retains ownership of this article including all of the intellectual property rights, data, content graphs and analysis. This article may not be quoted, reproduced, distributed or published for any commercial purpose without prior consent. Members of the press and others using the findings in this article for non-commercial purposes are welcome to publicly share and link to report information with attribution to Ookla.
Ookla® is a global leader in connectivity intelligence that provides consumers, businesses, and other organizations with data-driven insights to improve networks and connected experiences.


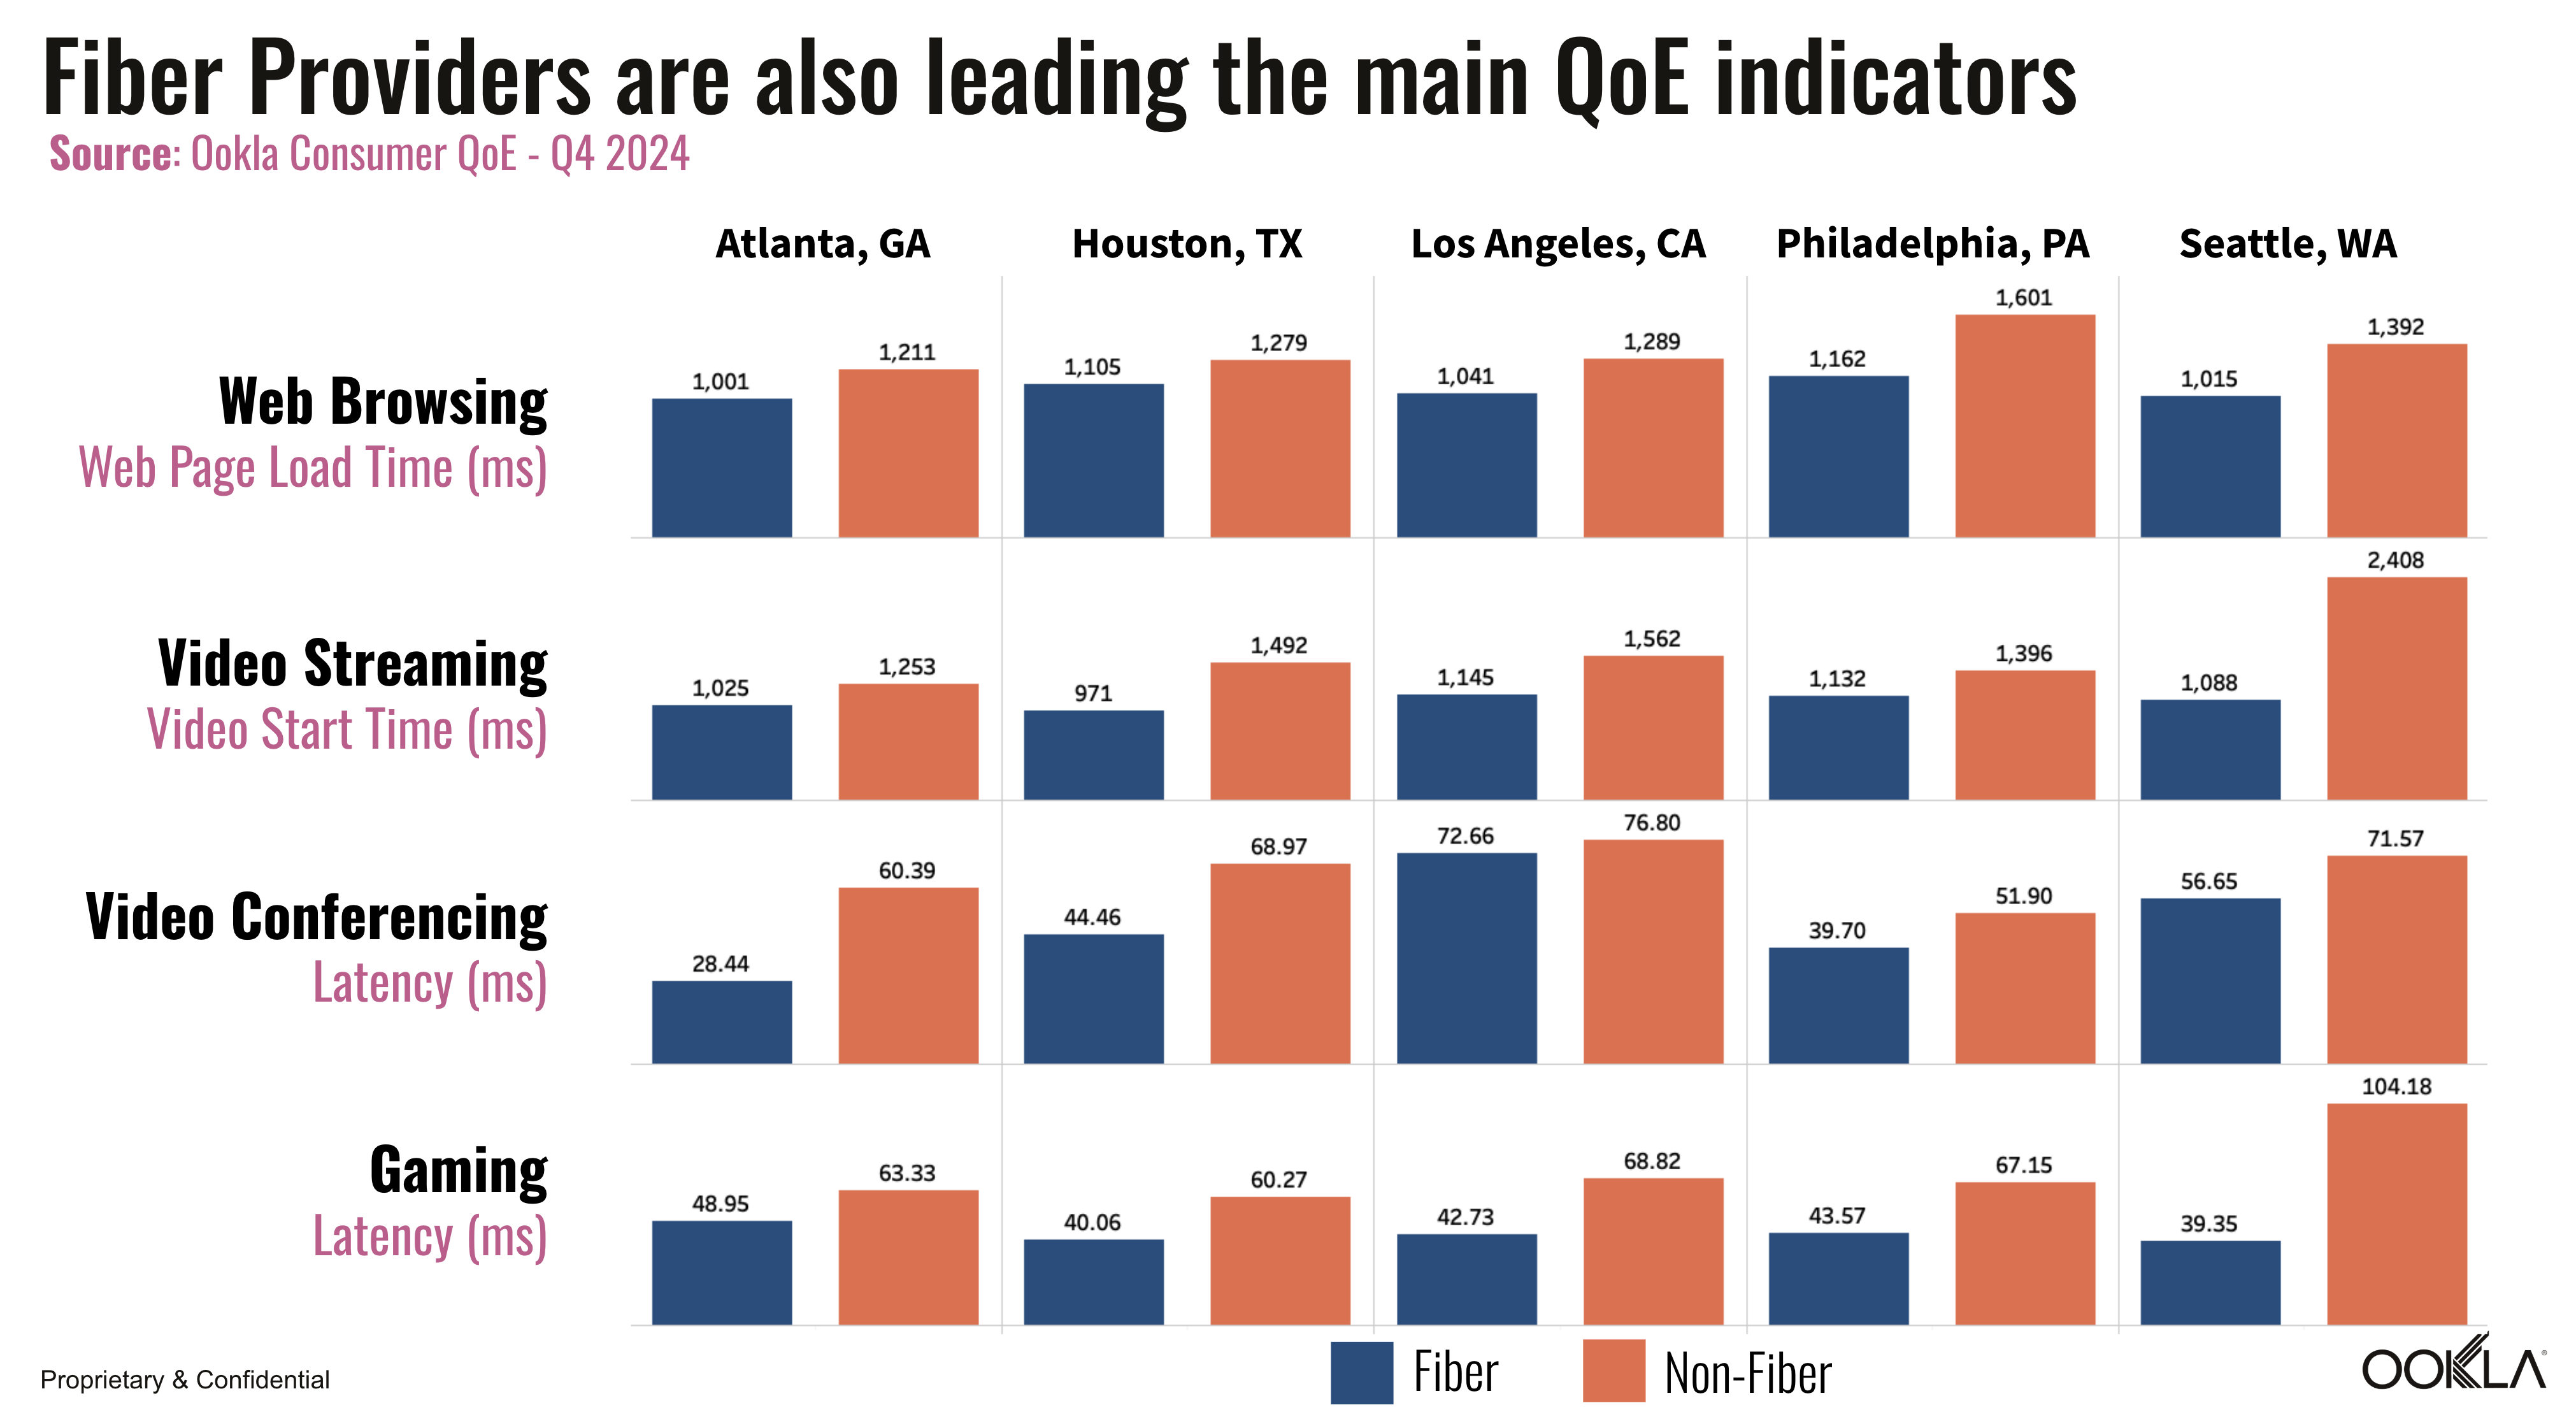


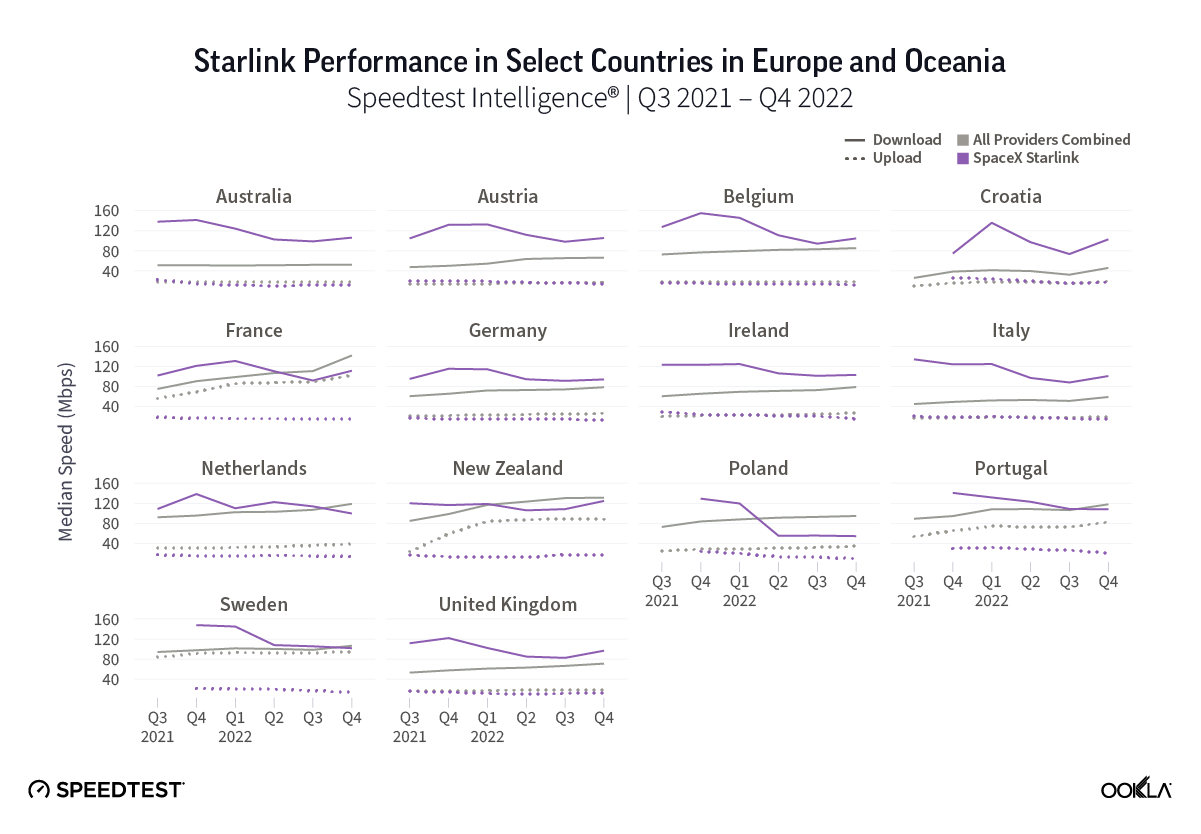
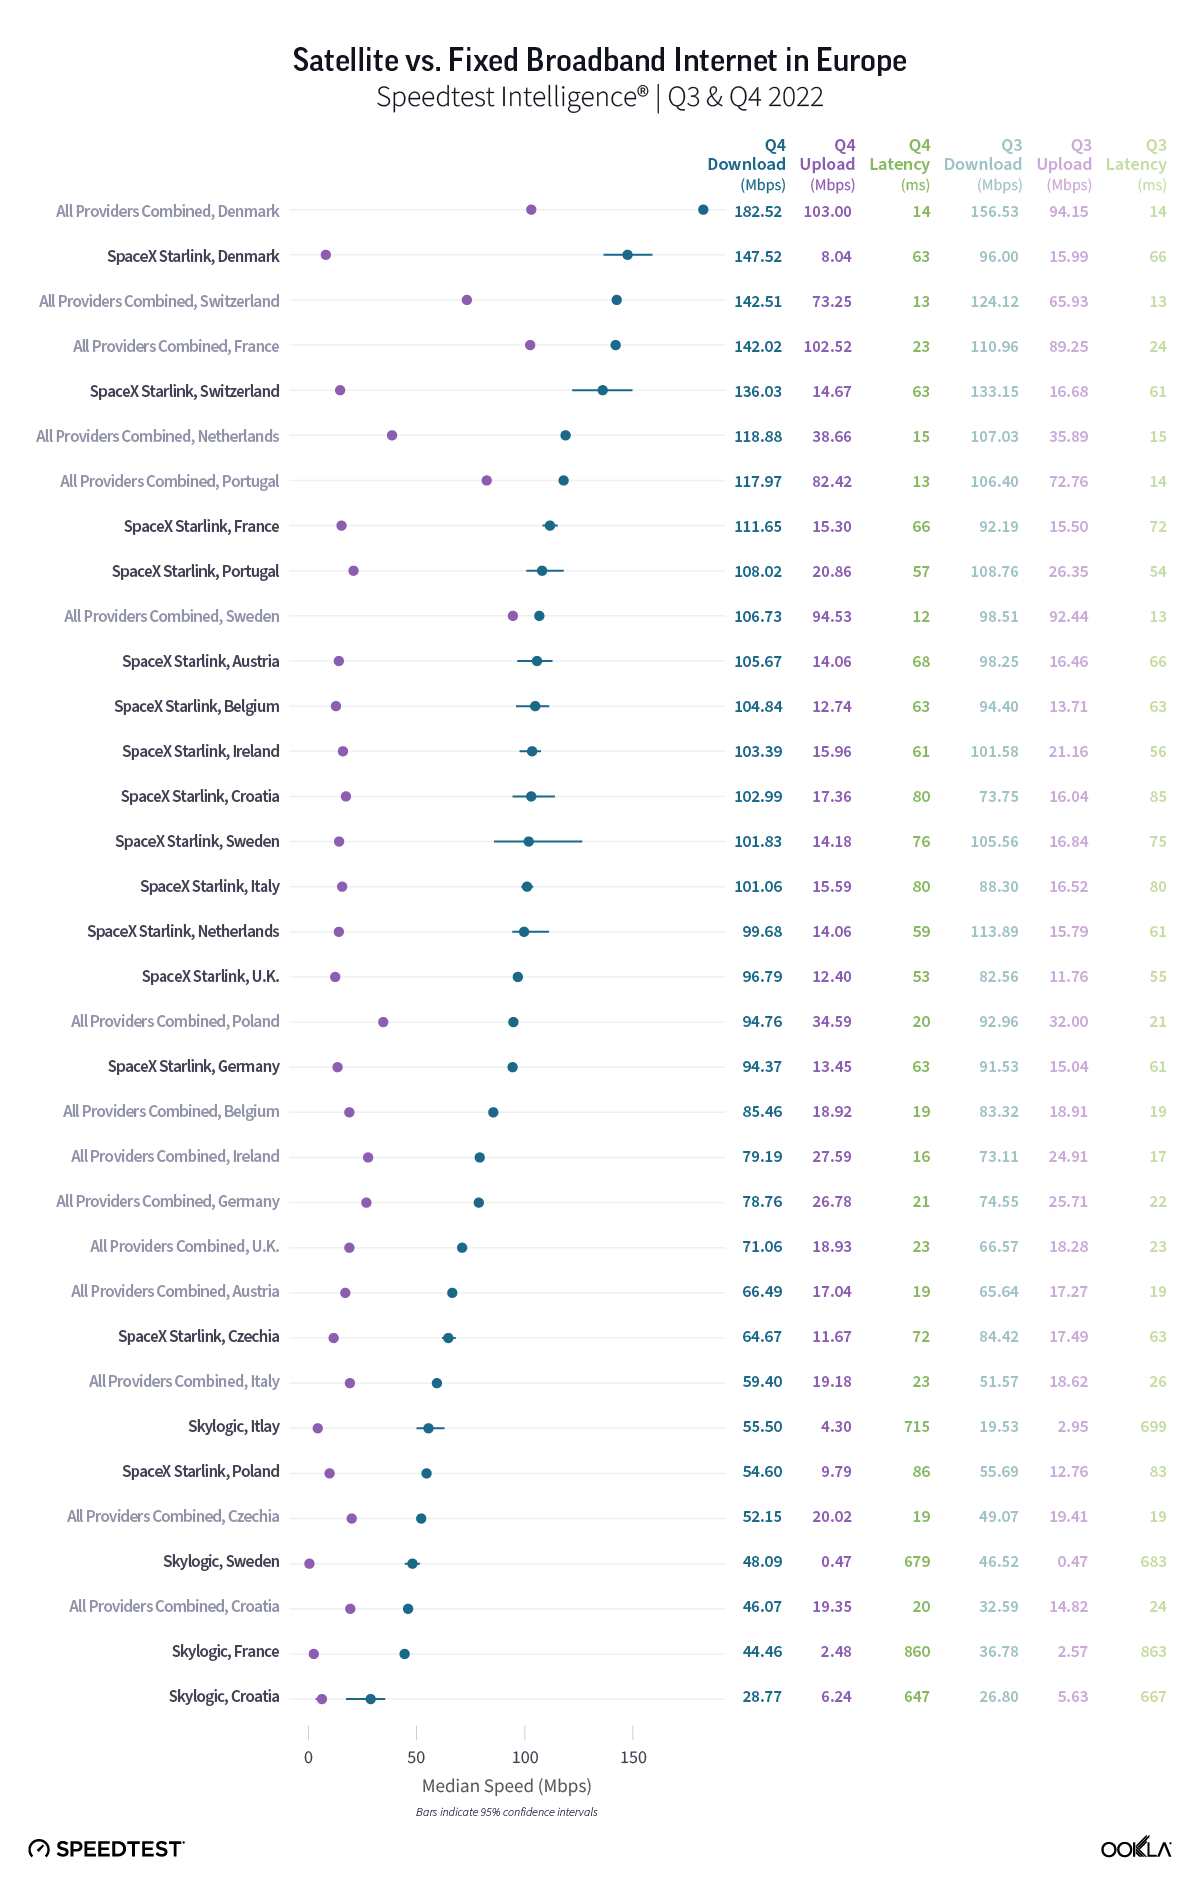
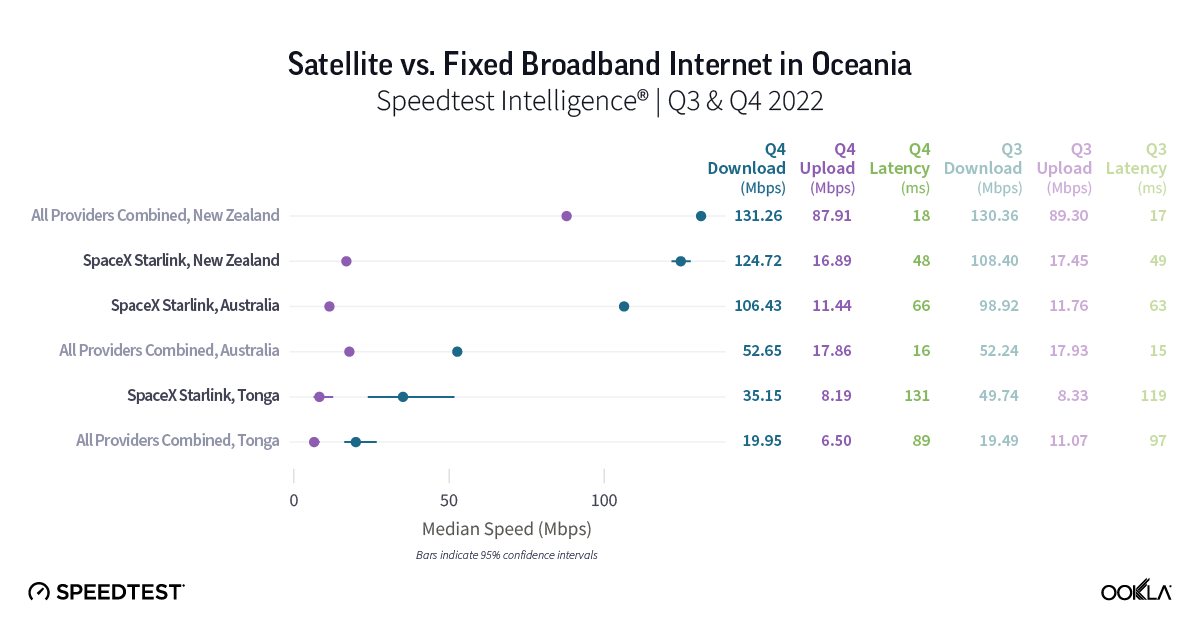
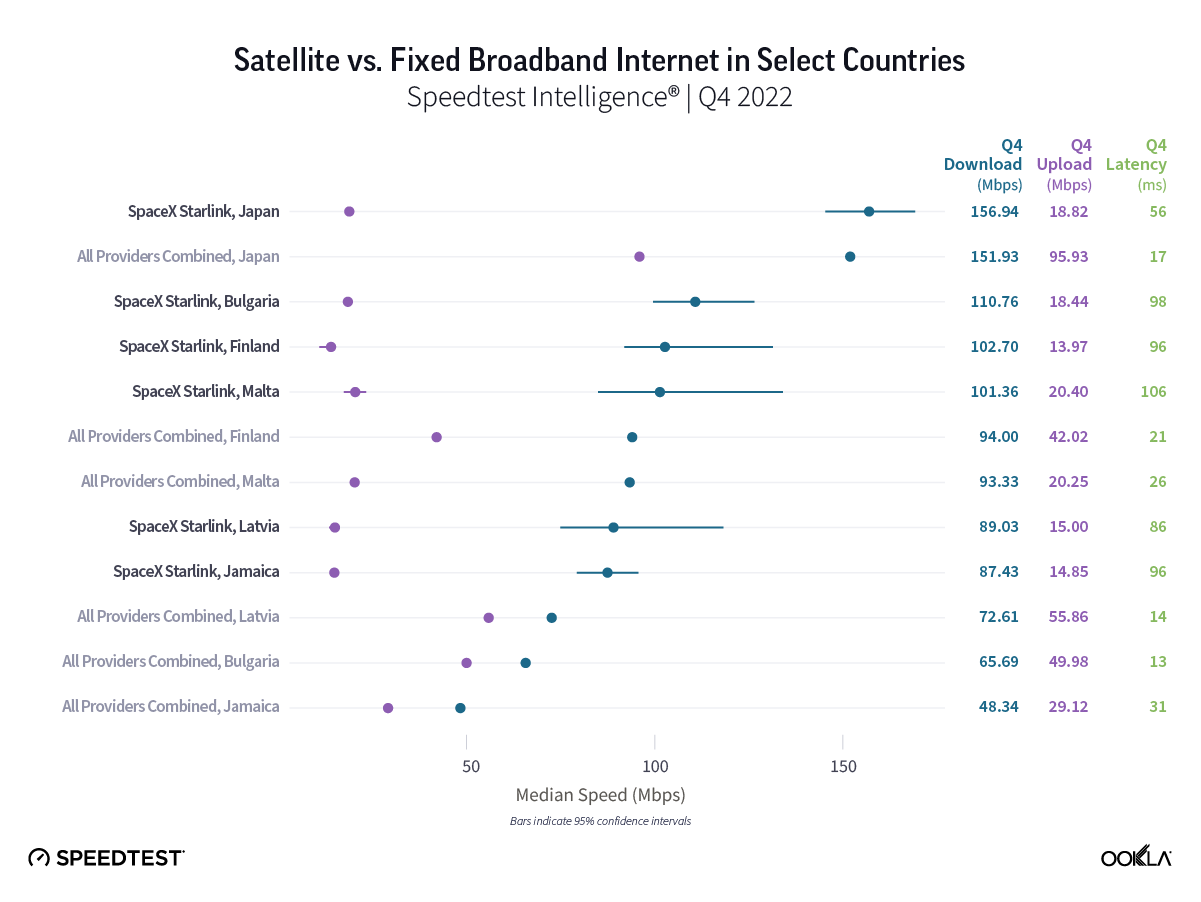


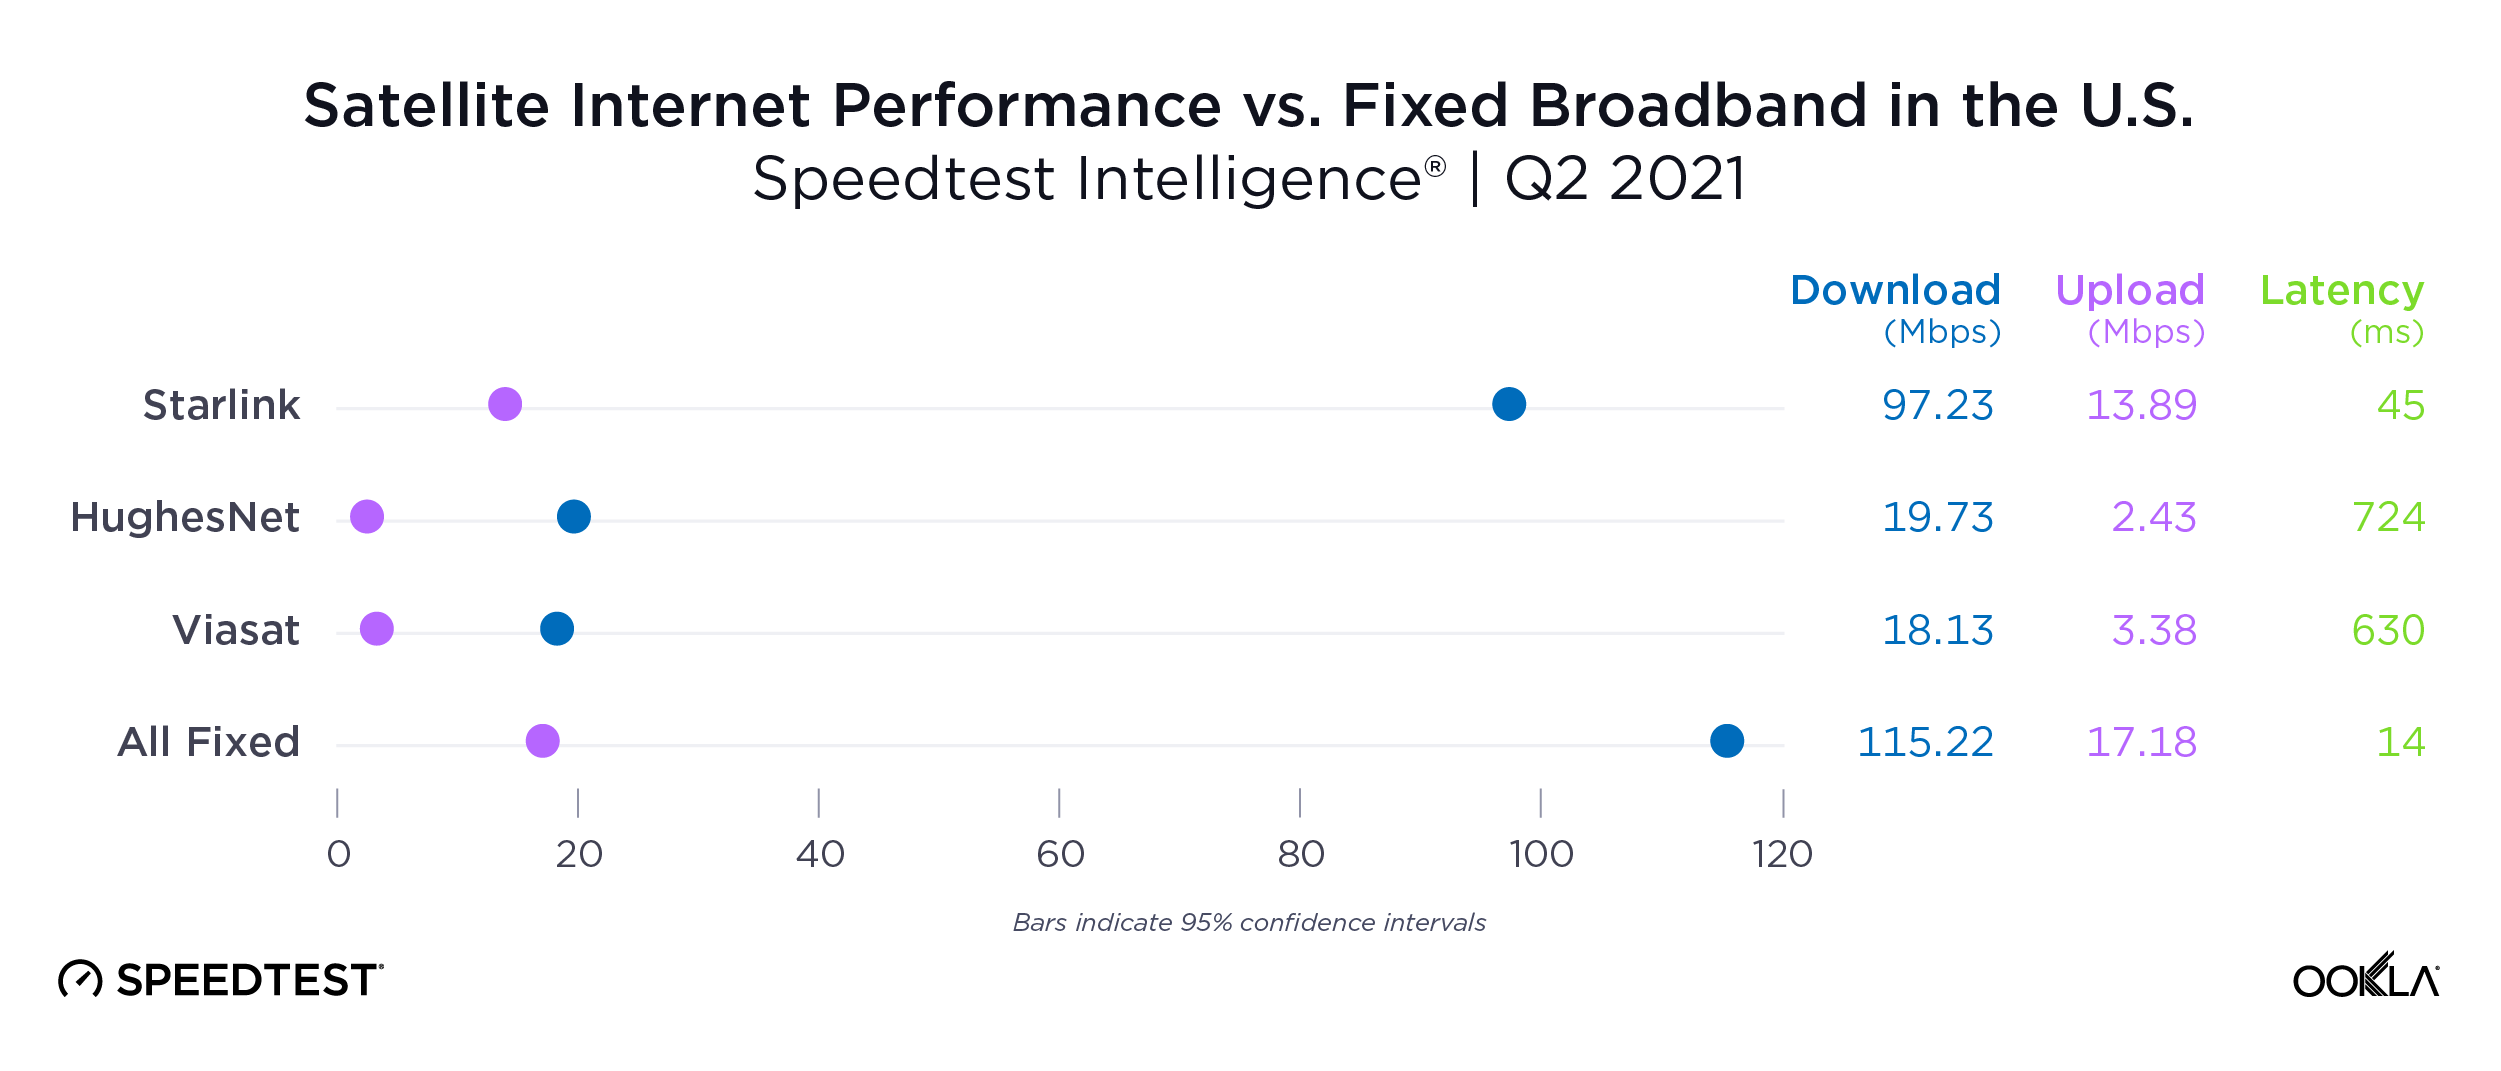

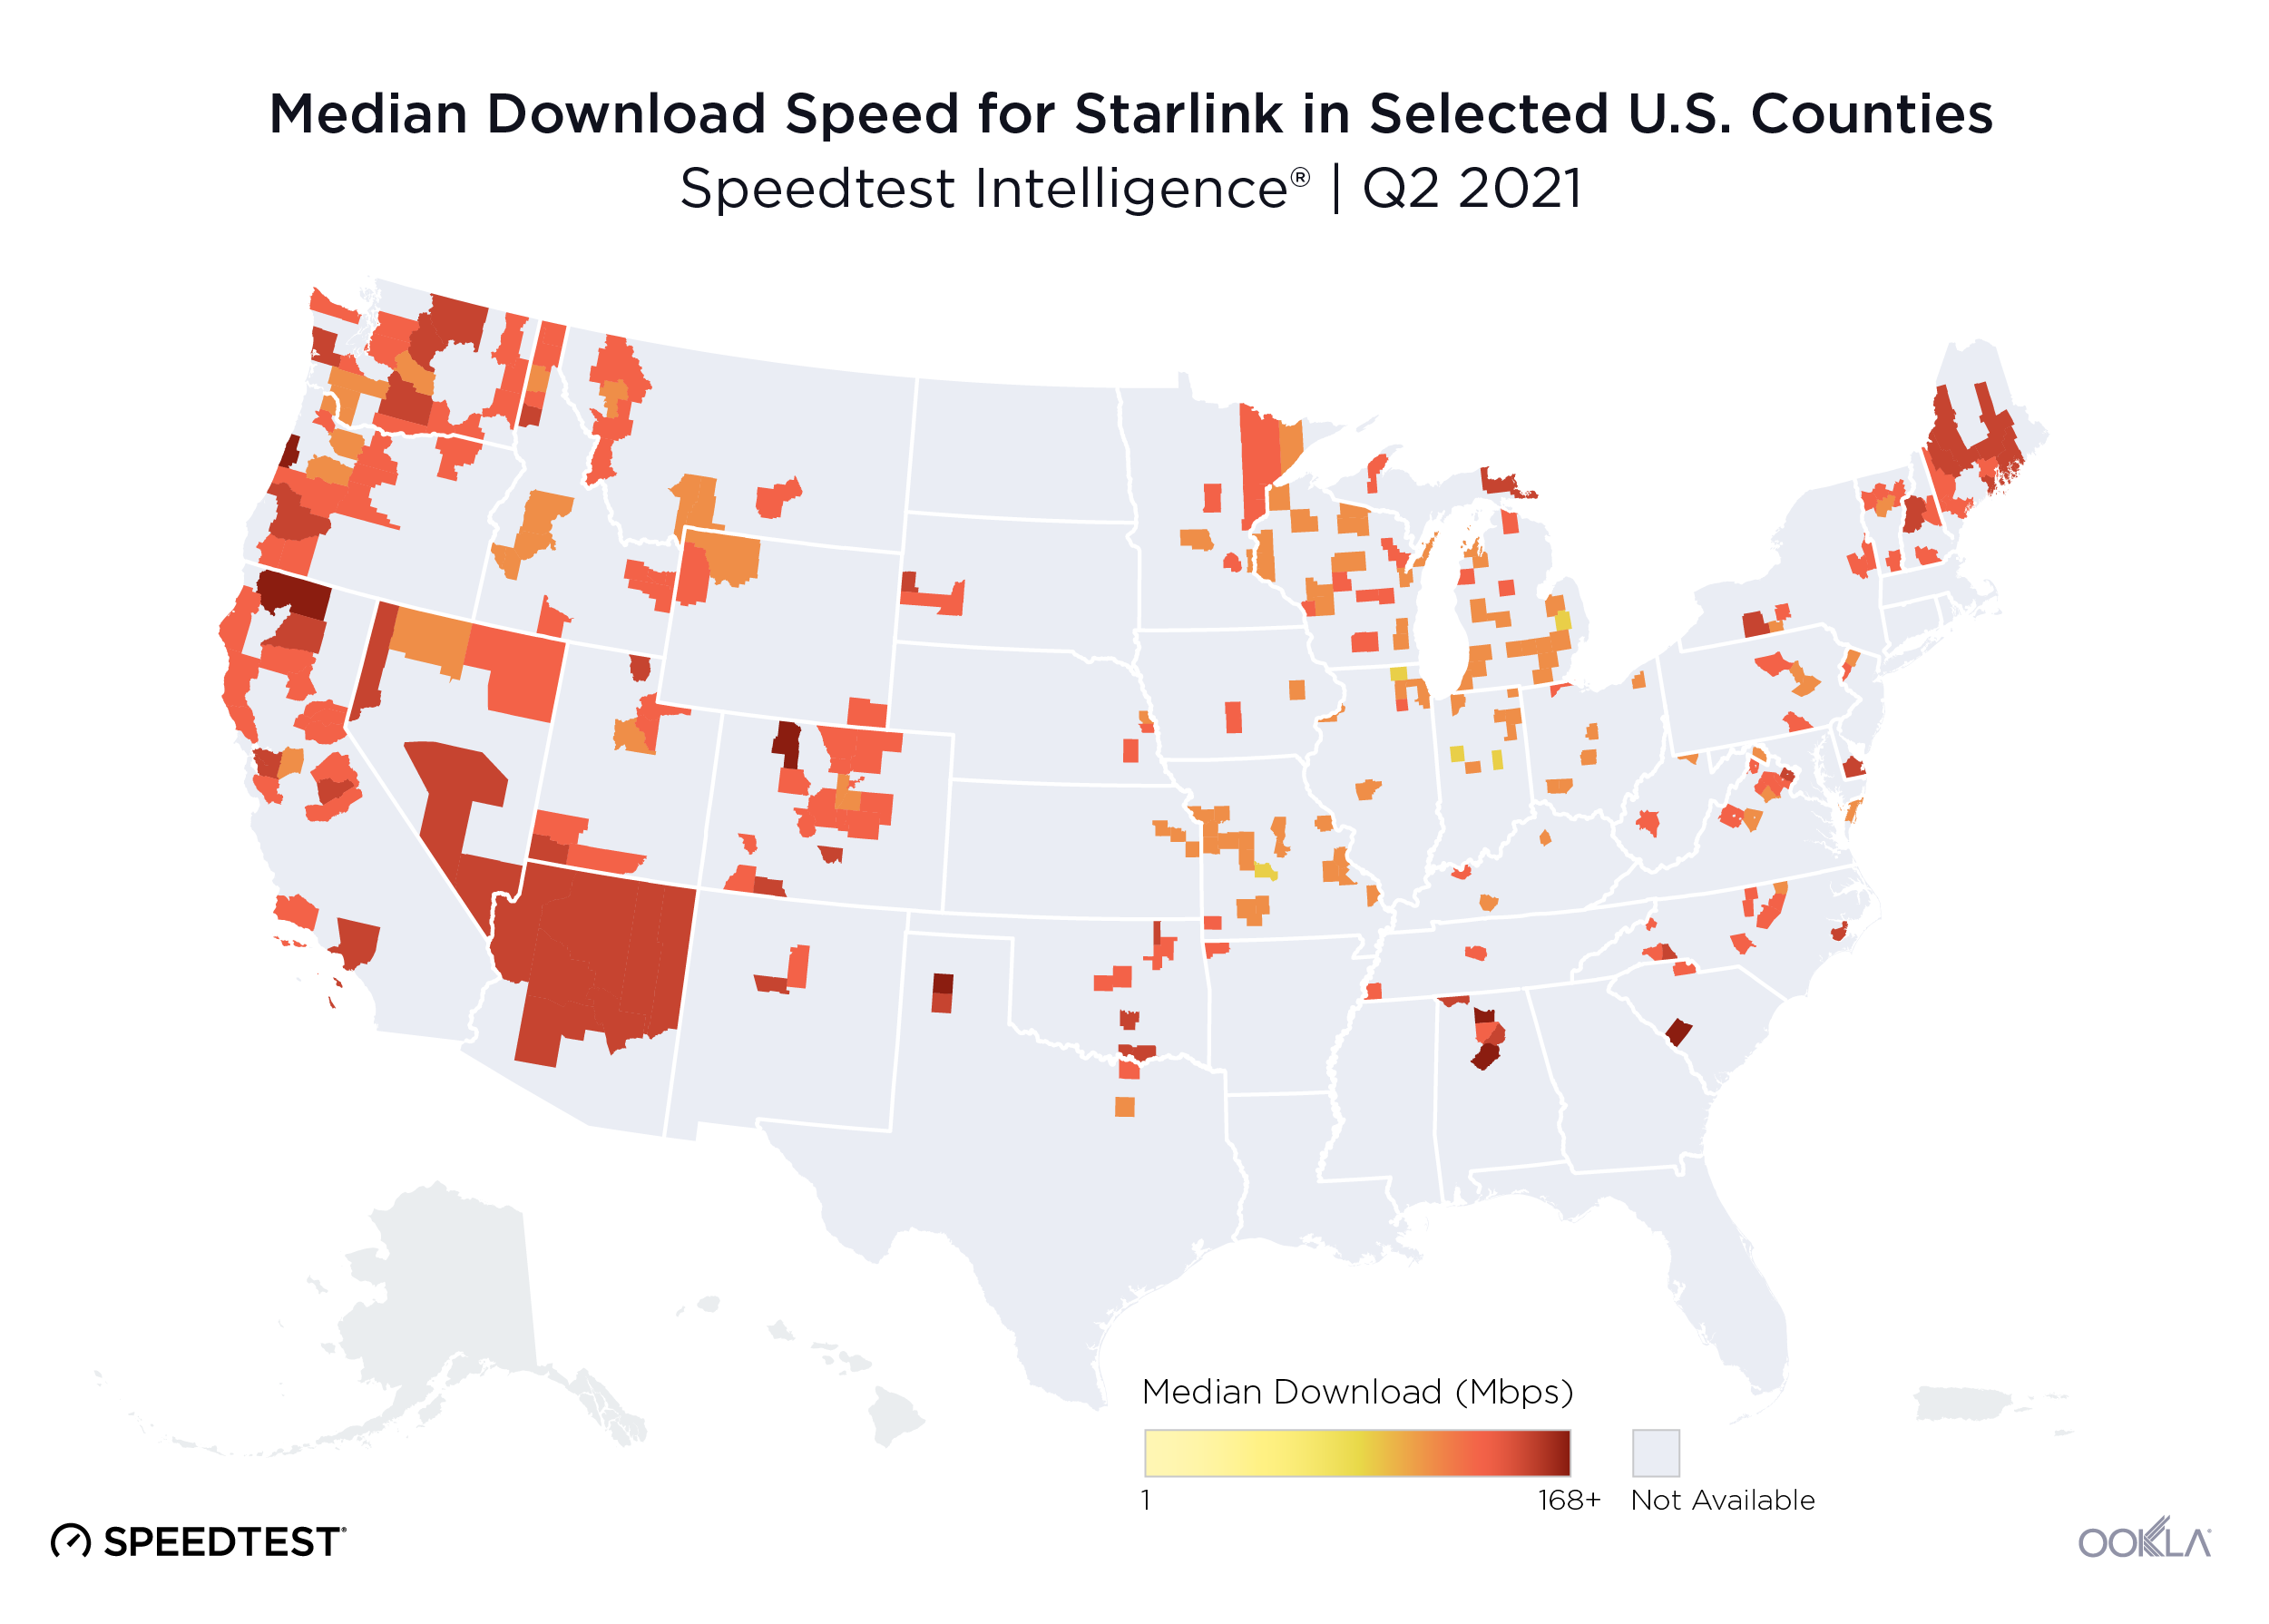
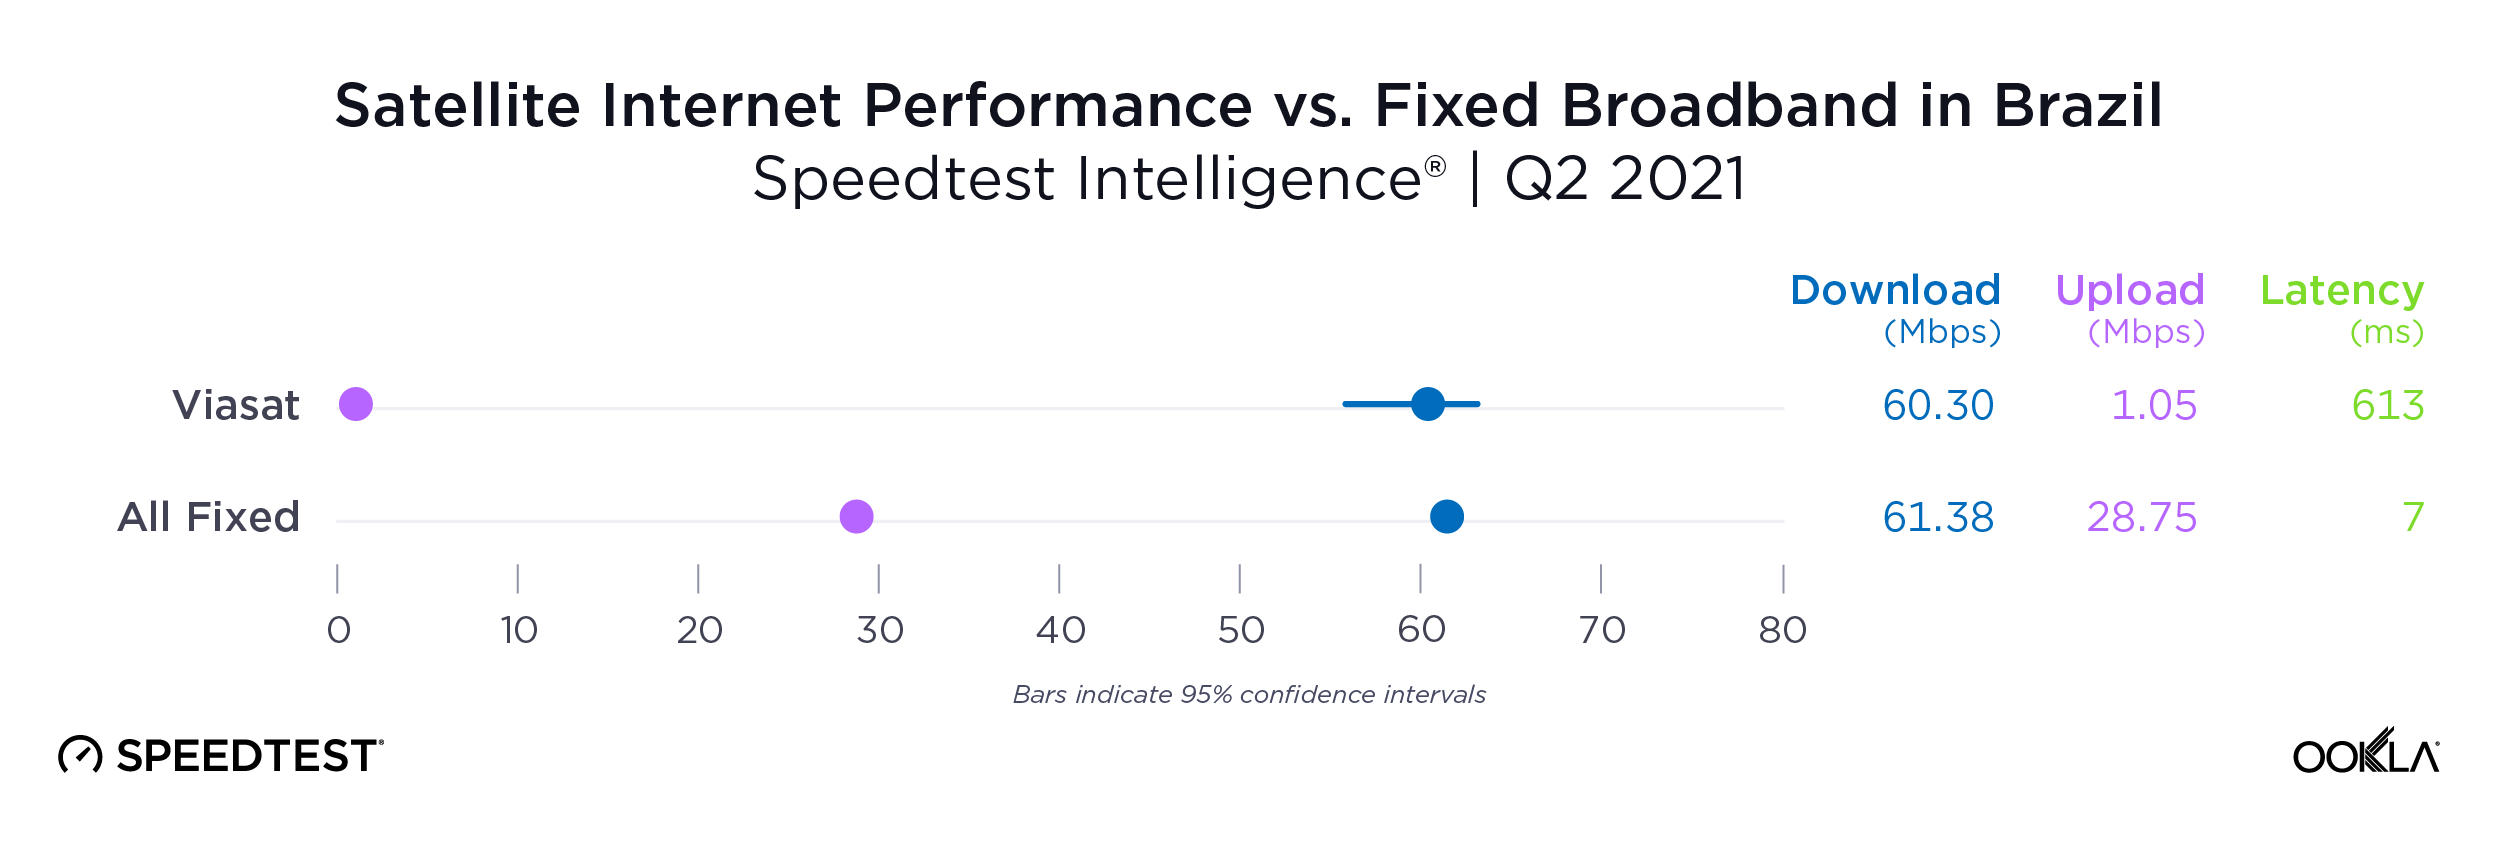
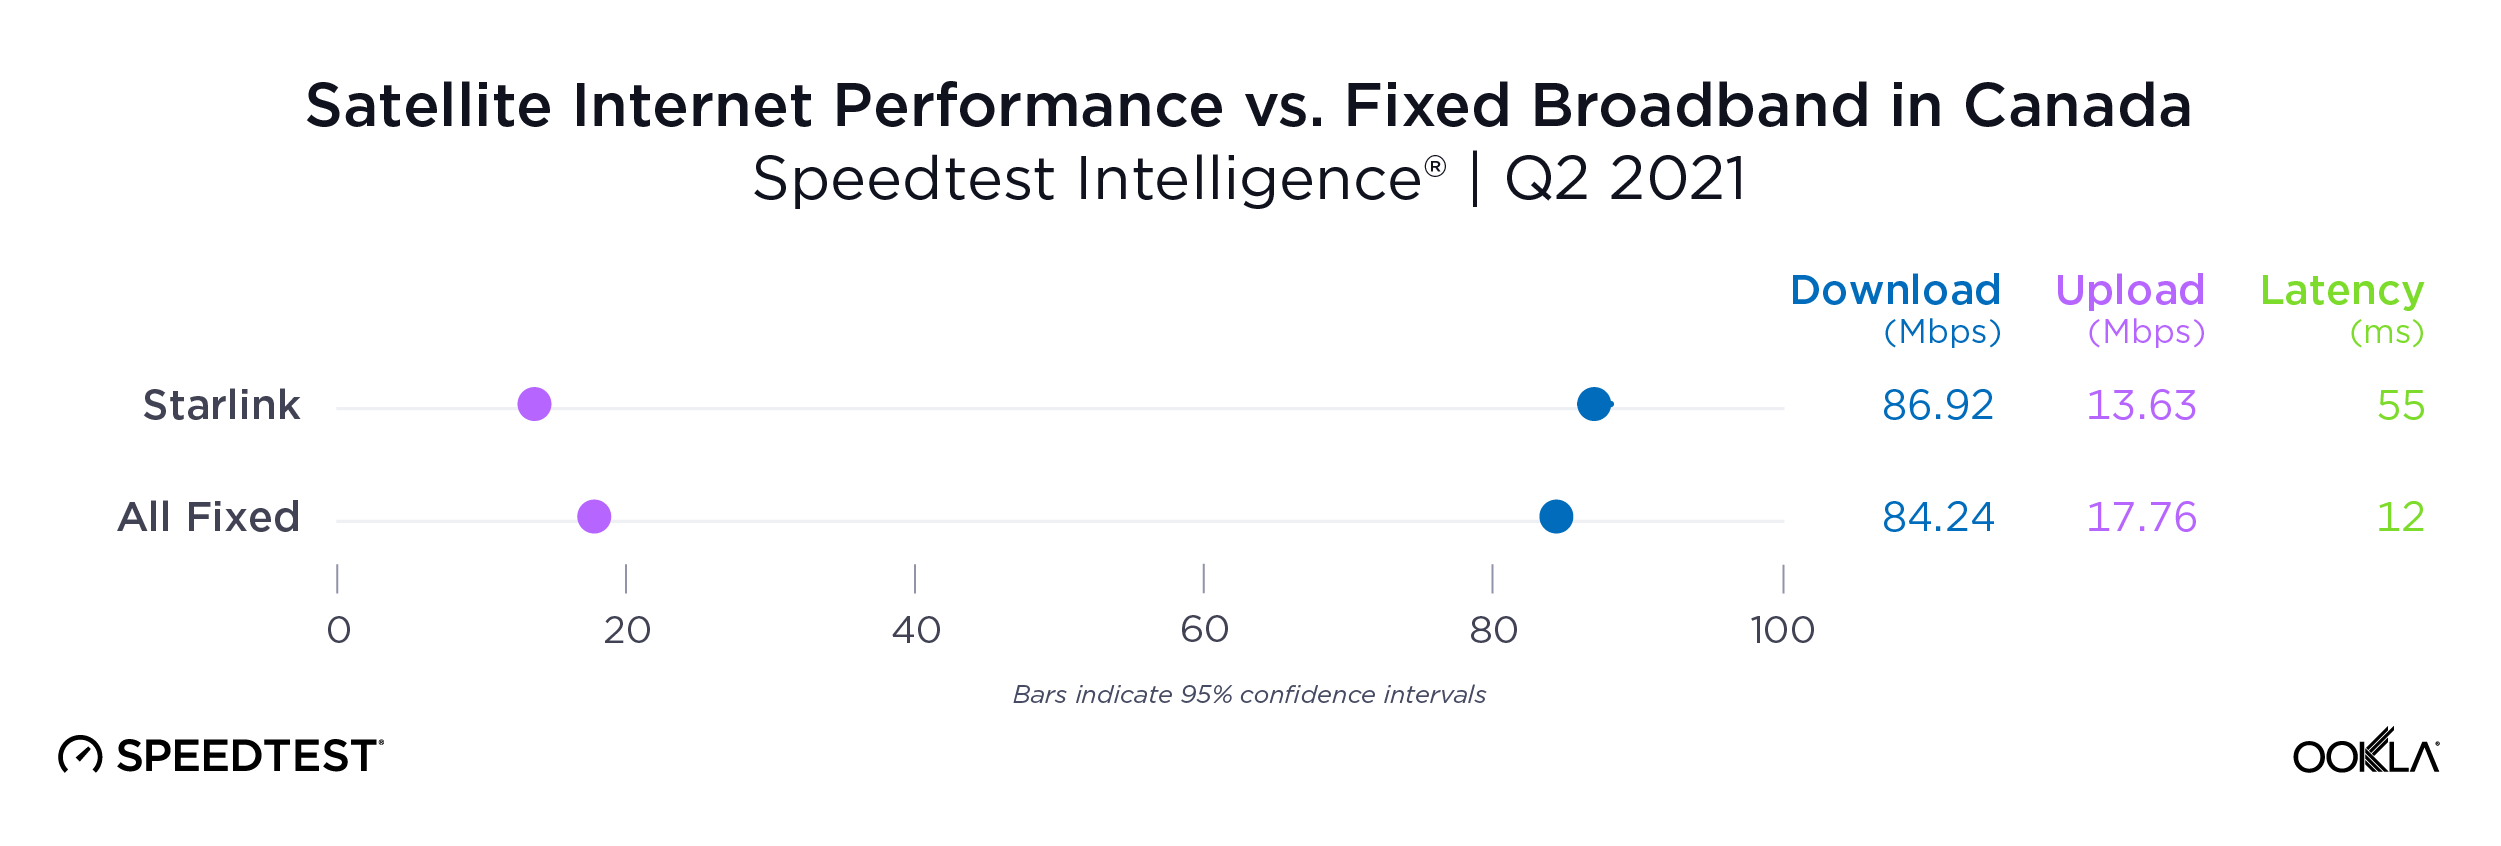
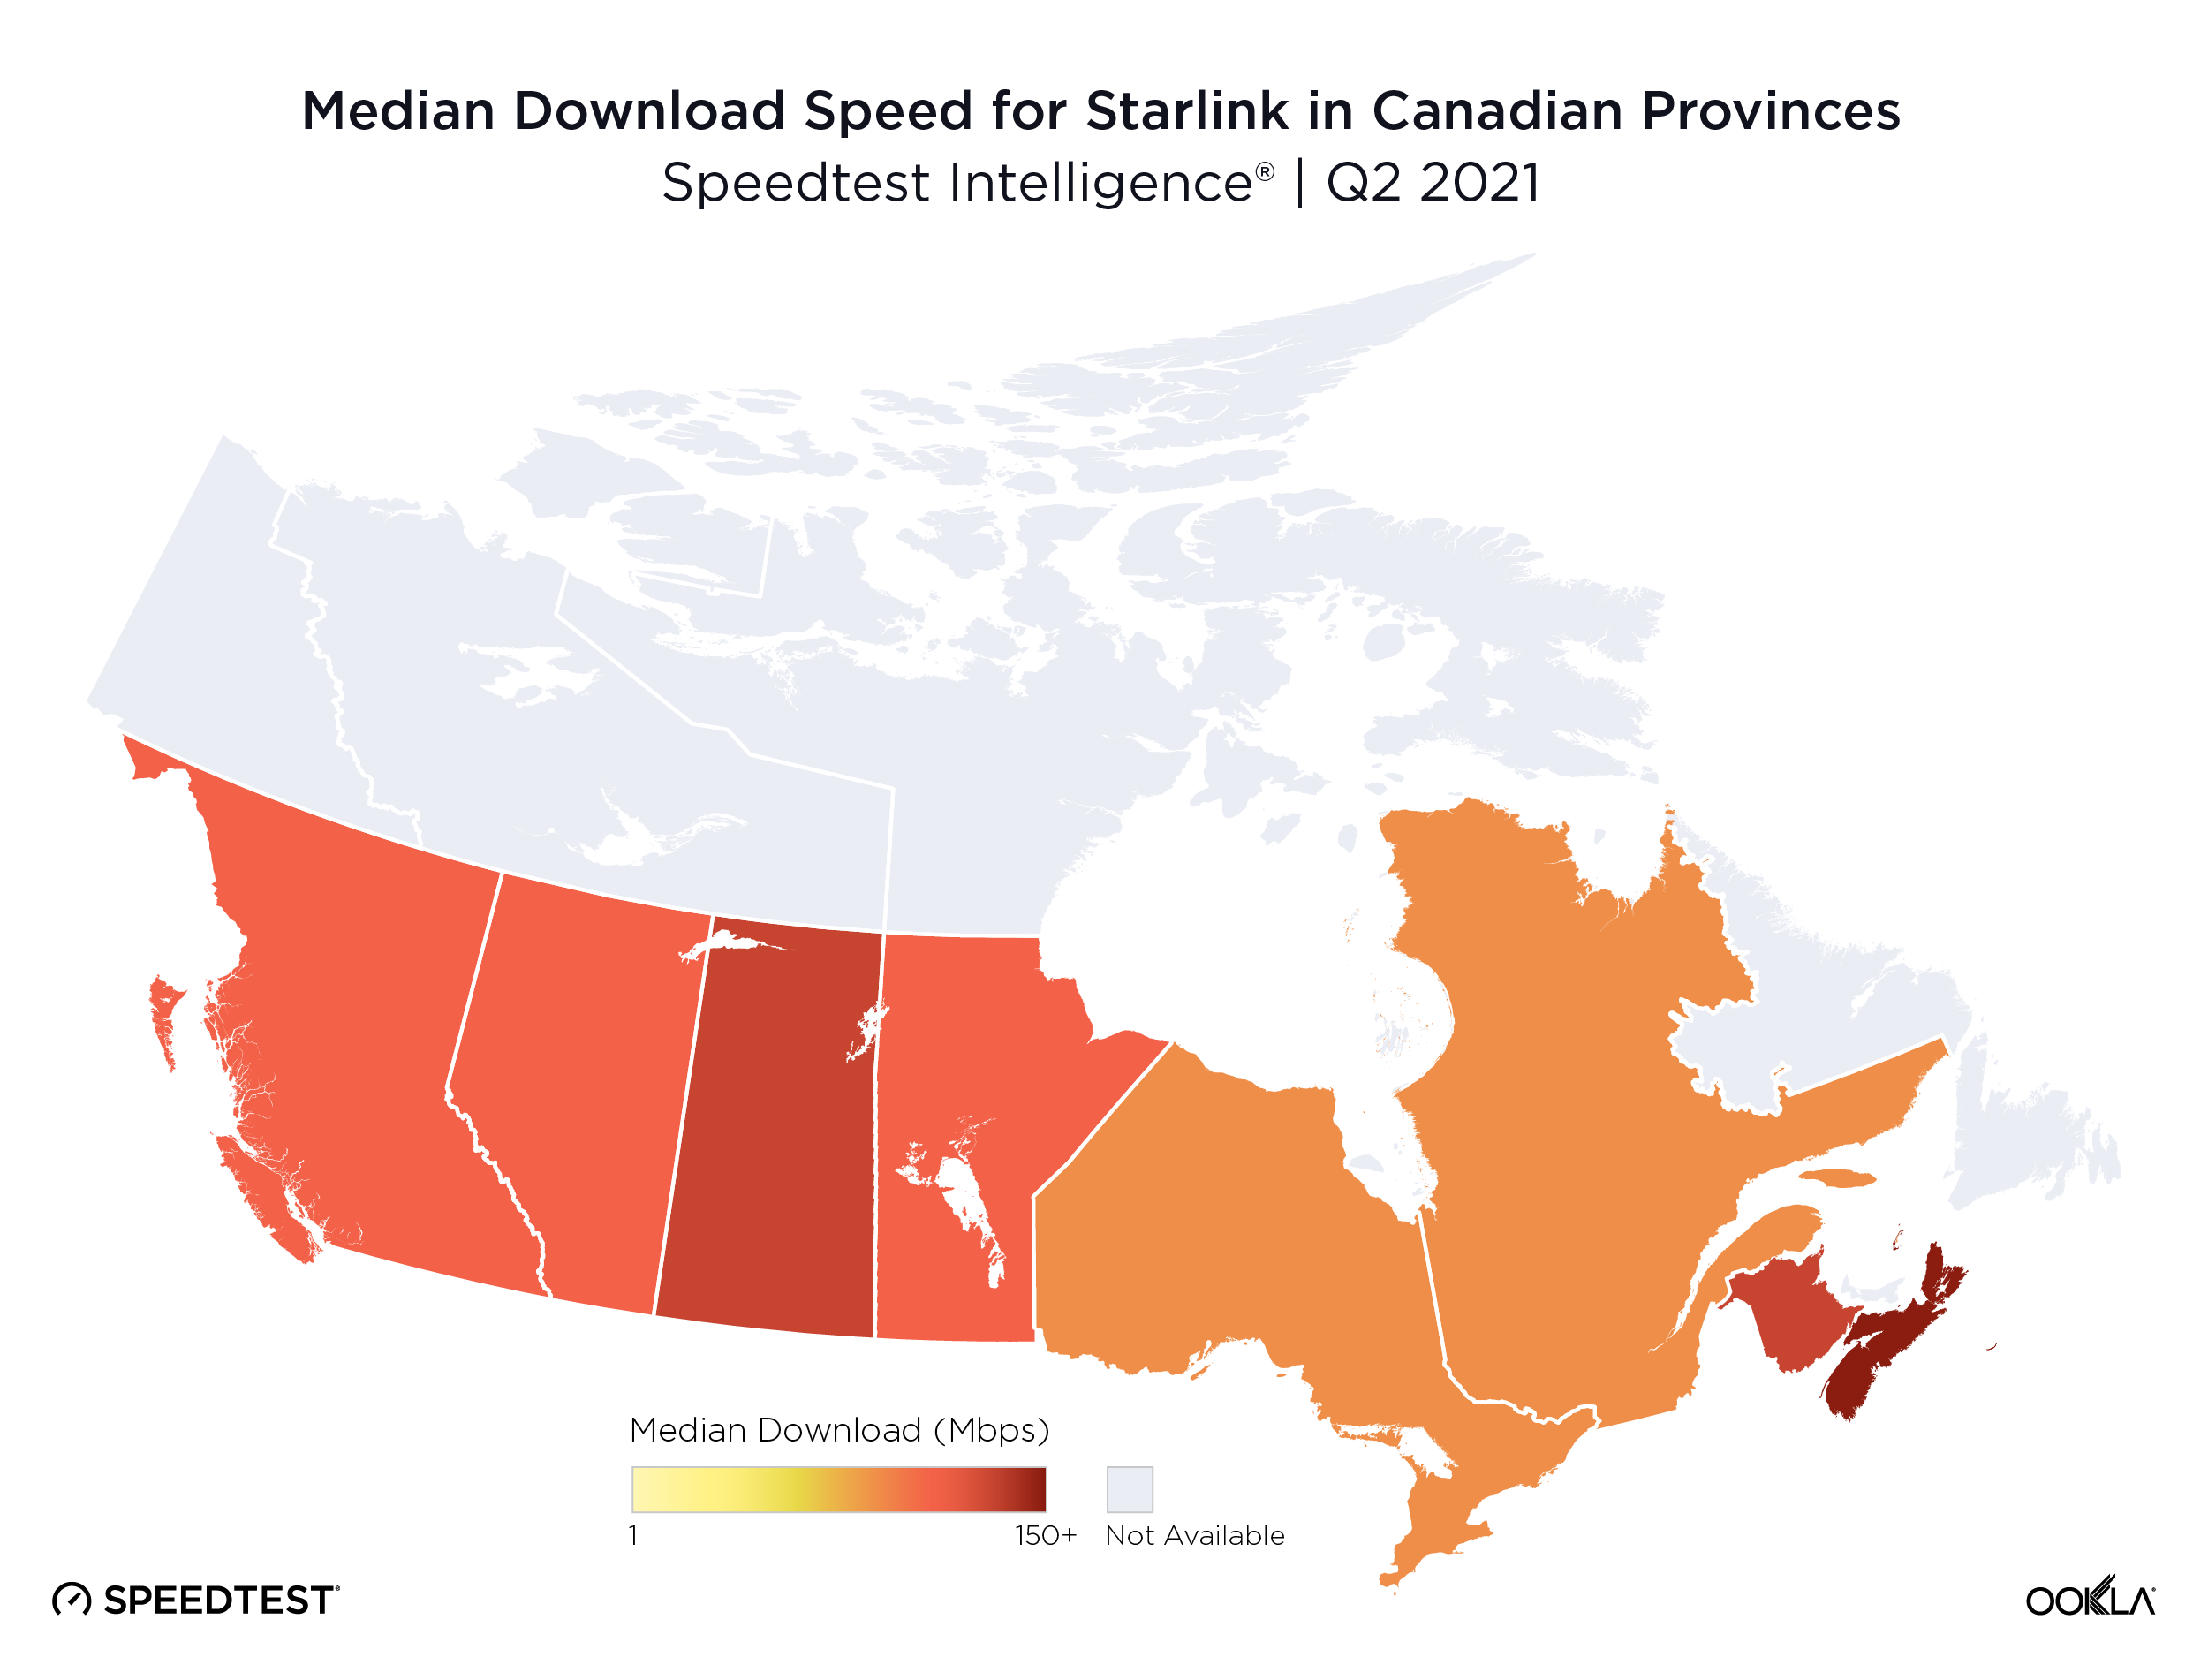
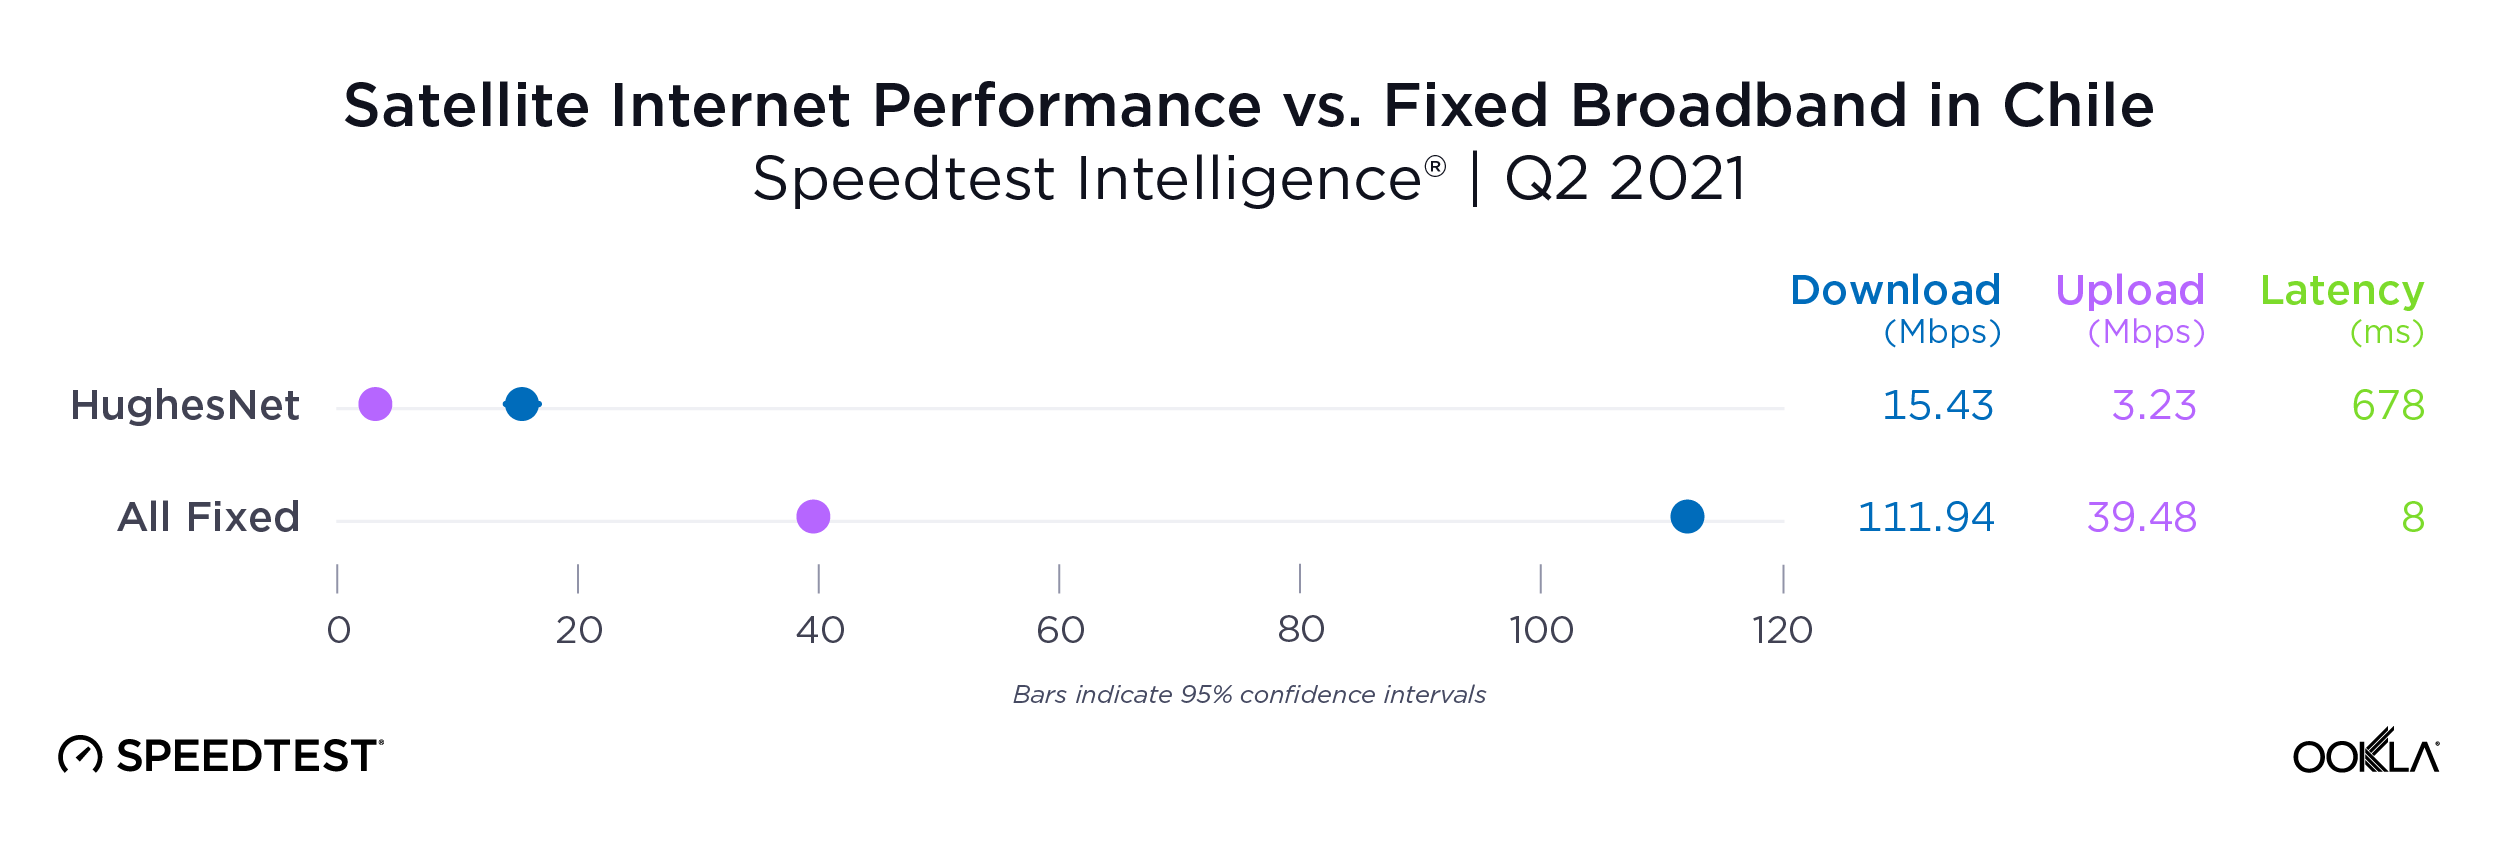
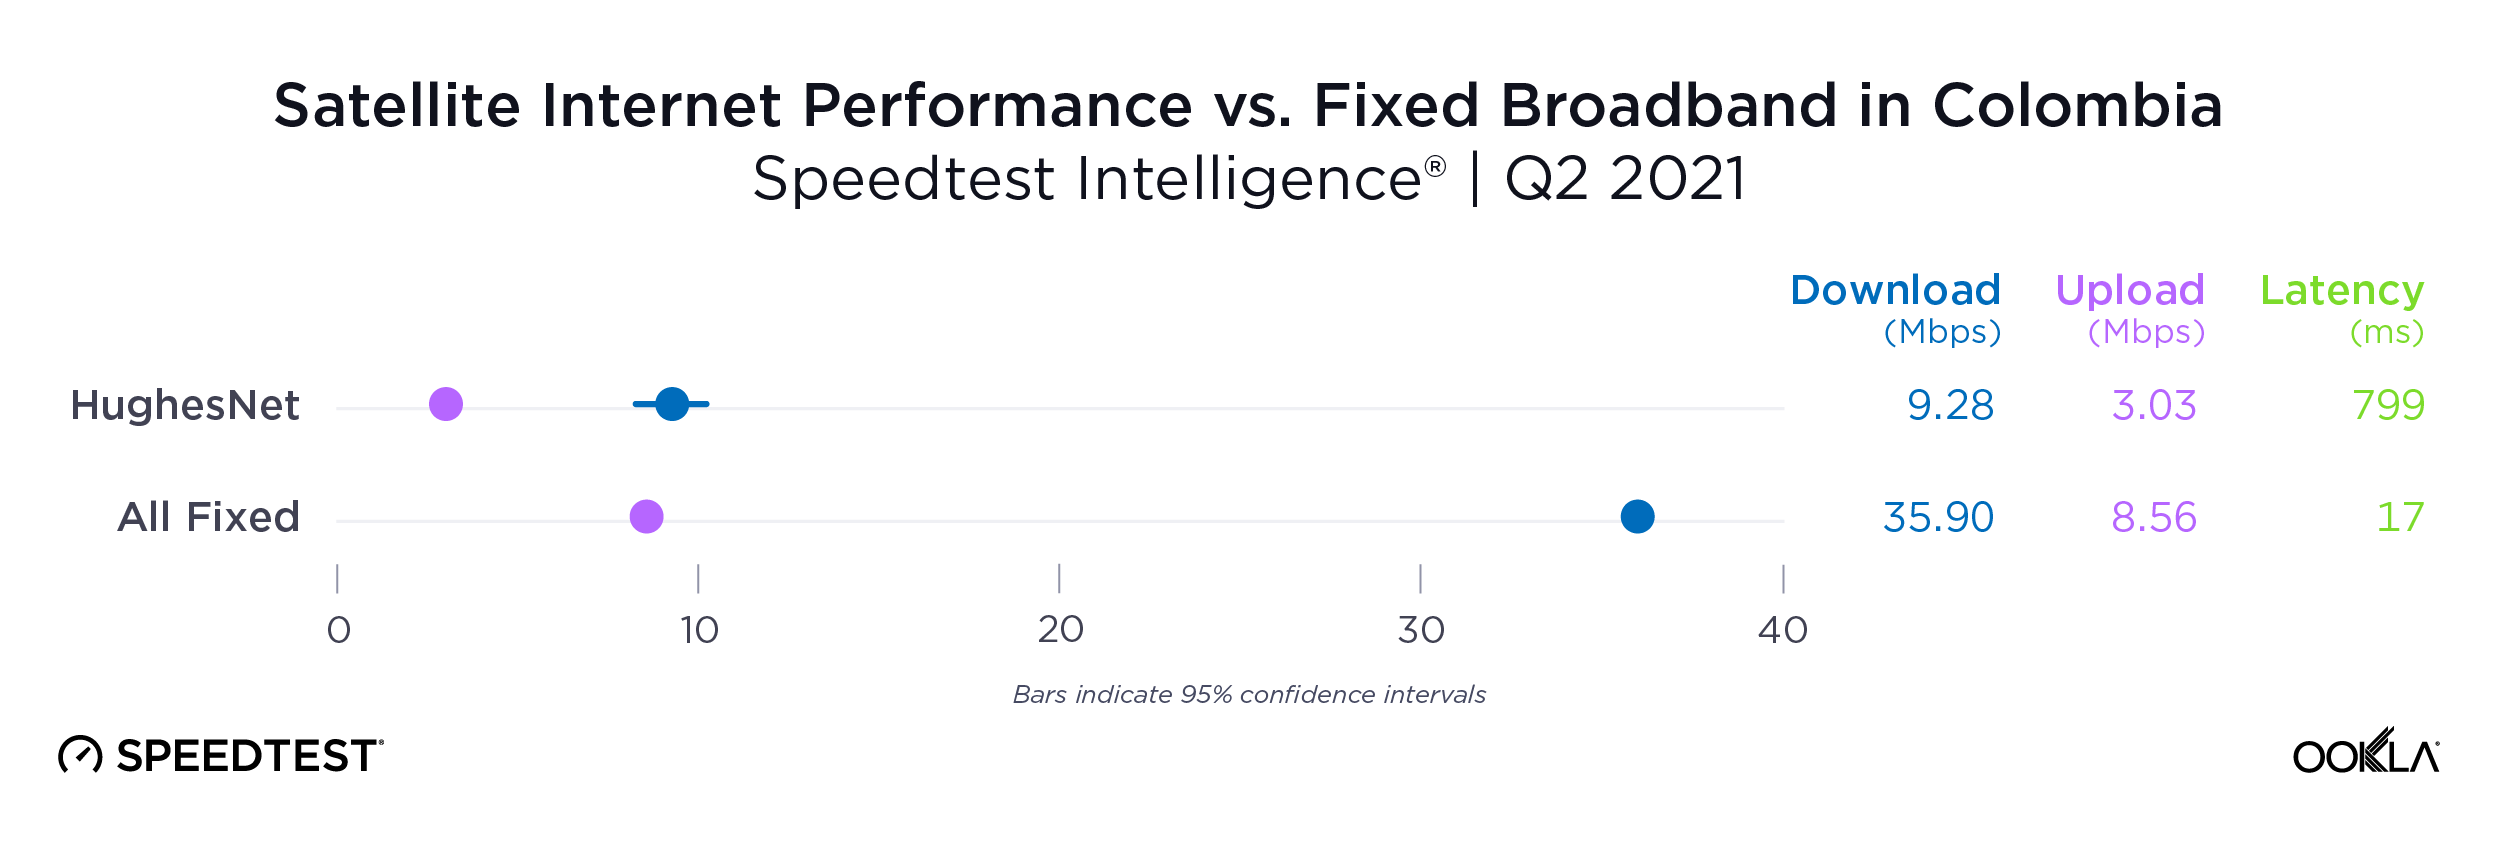
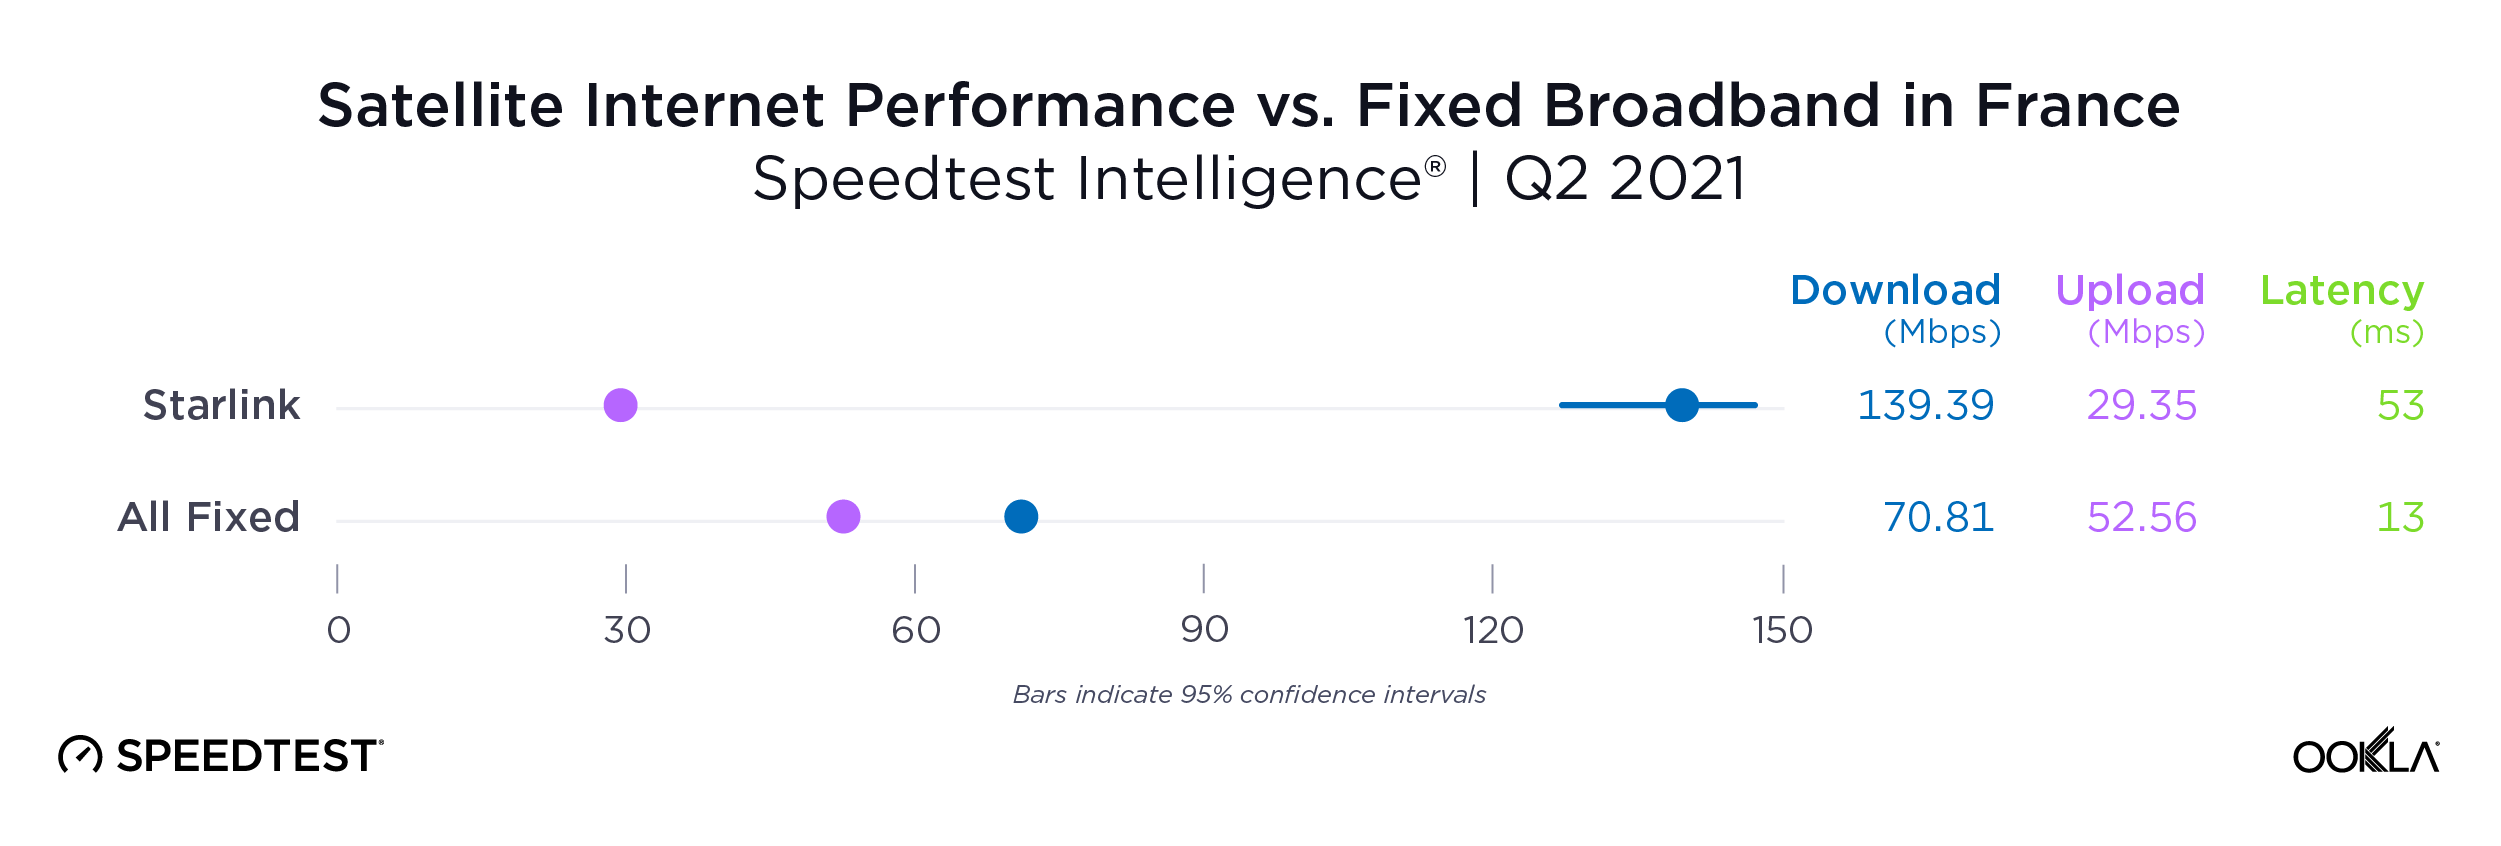
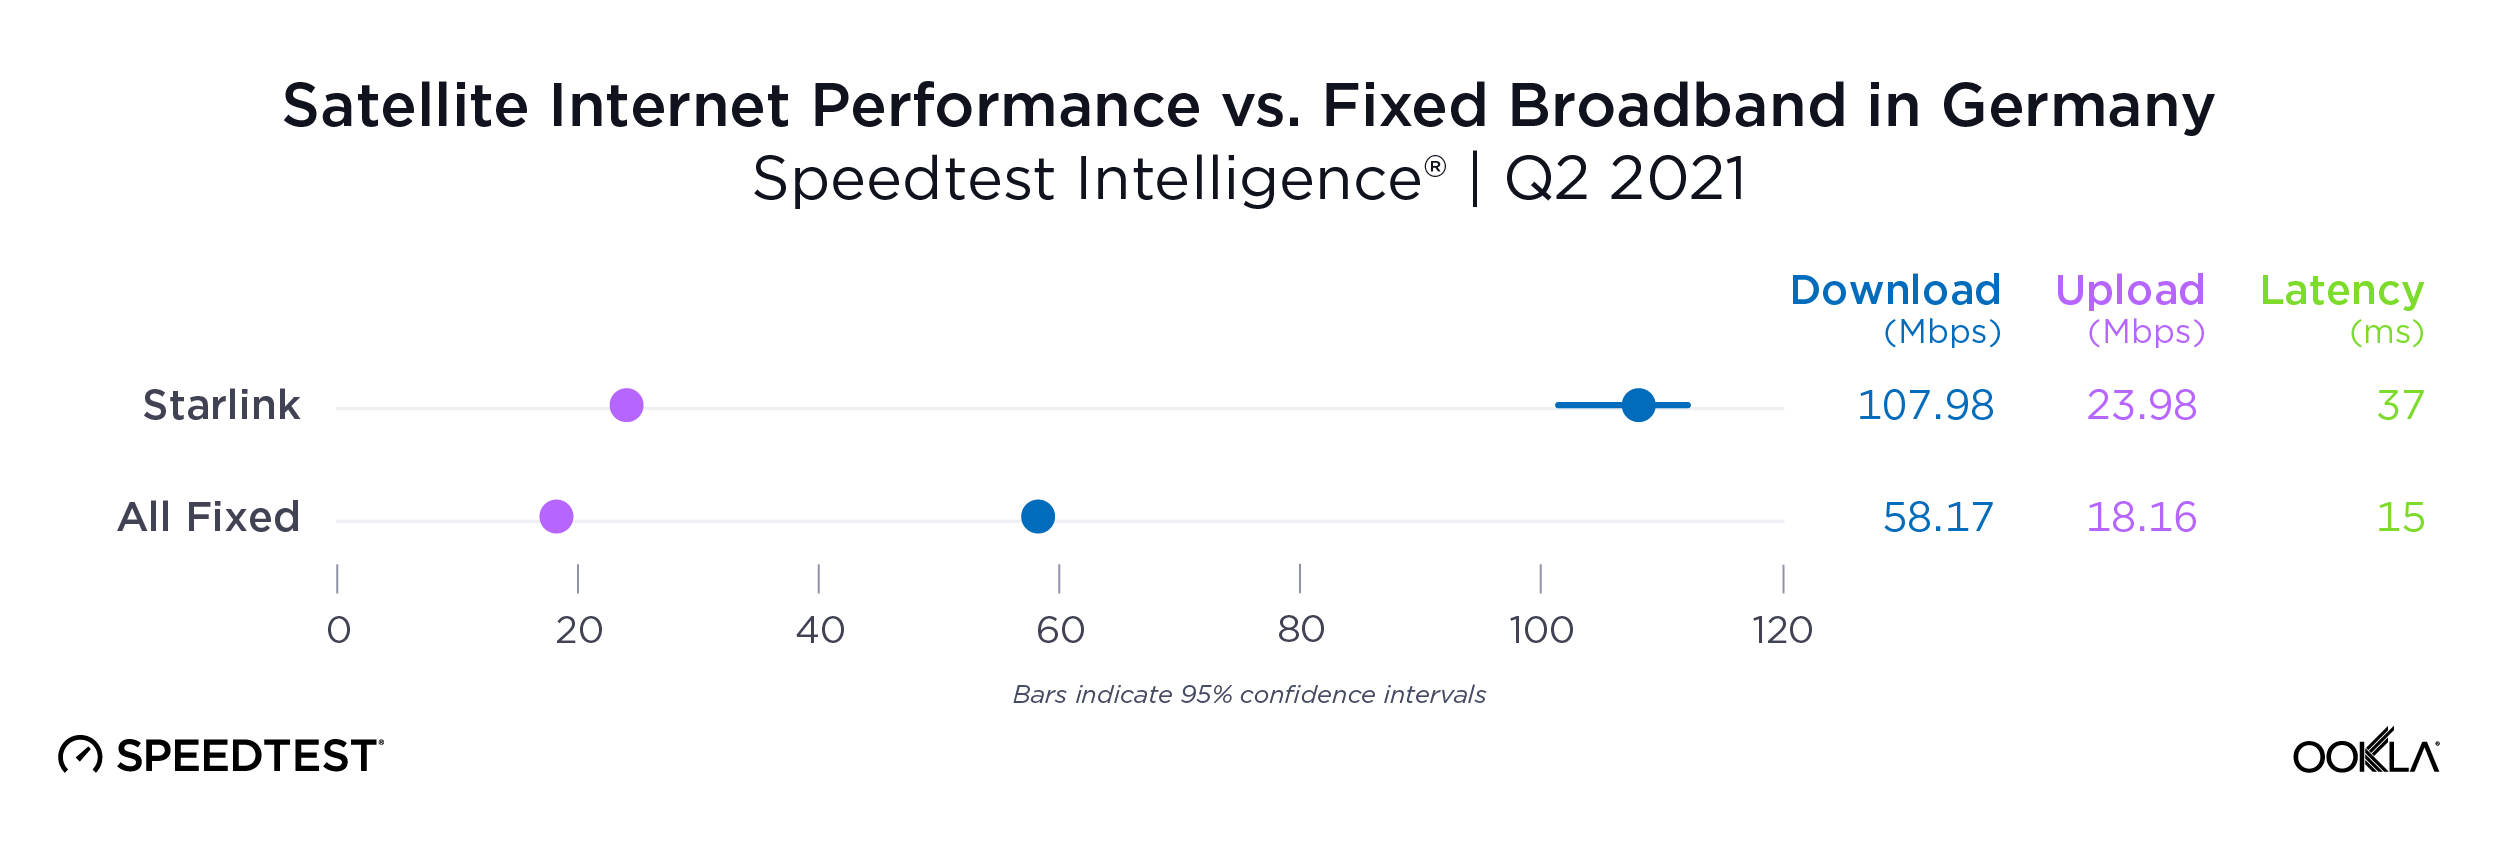
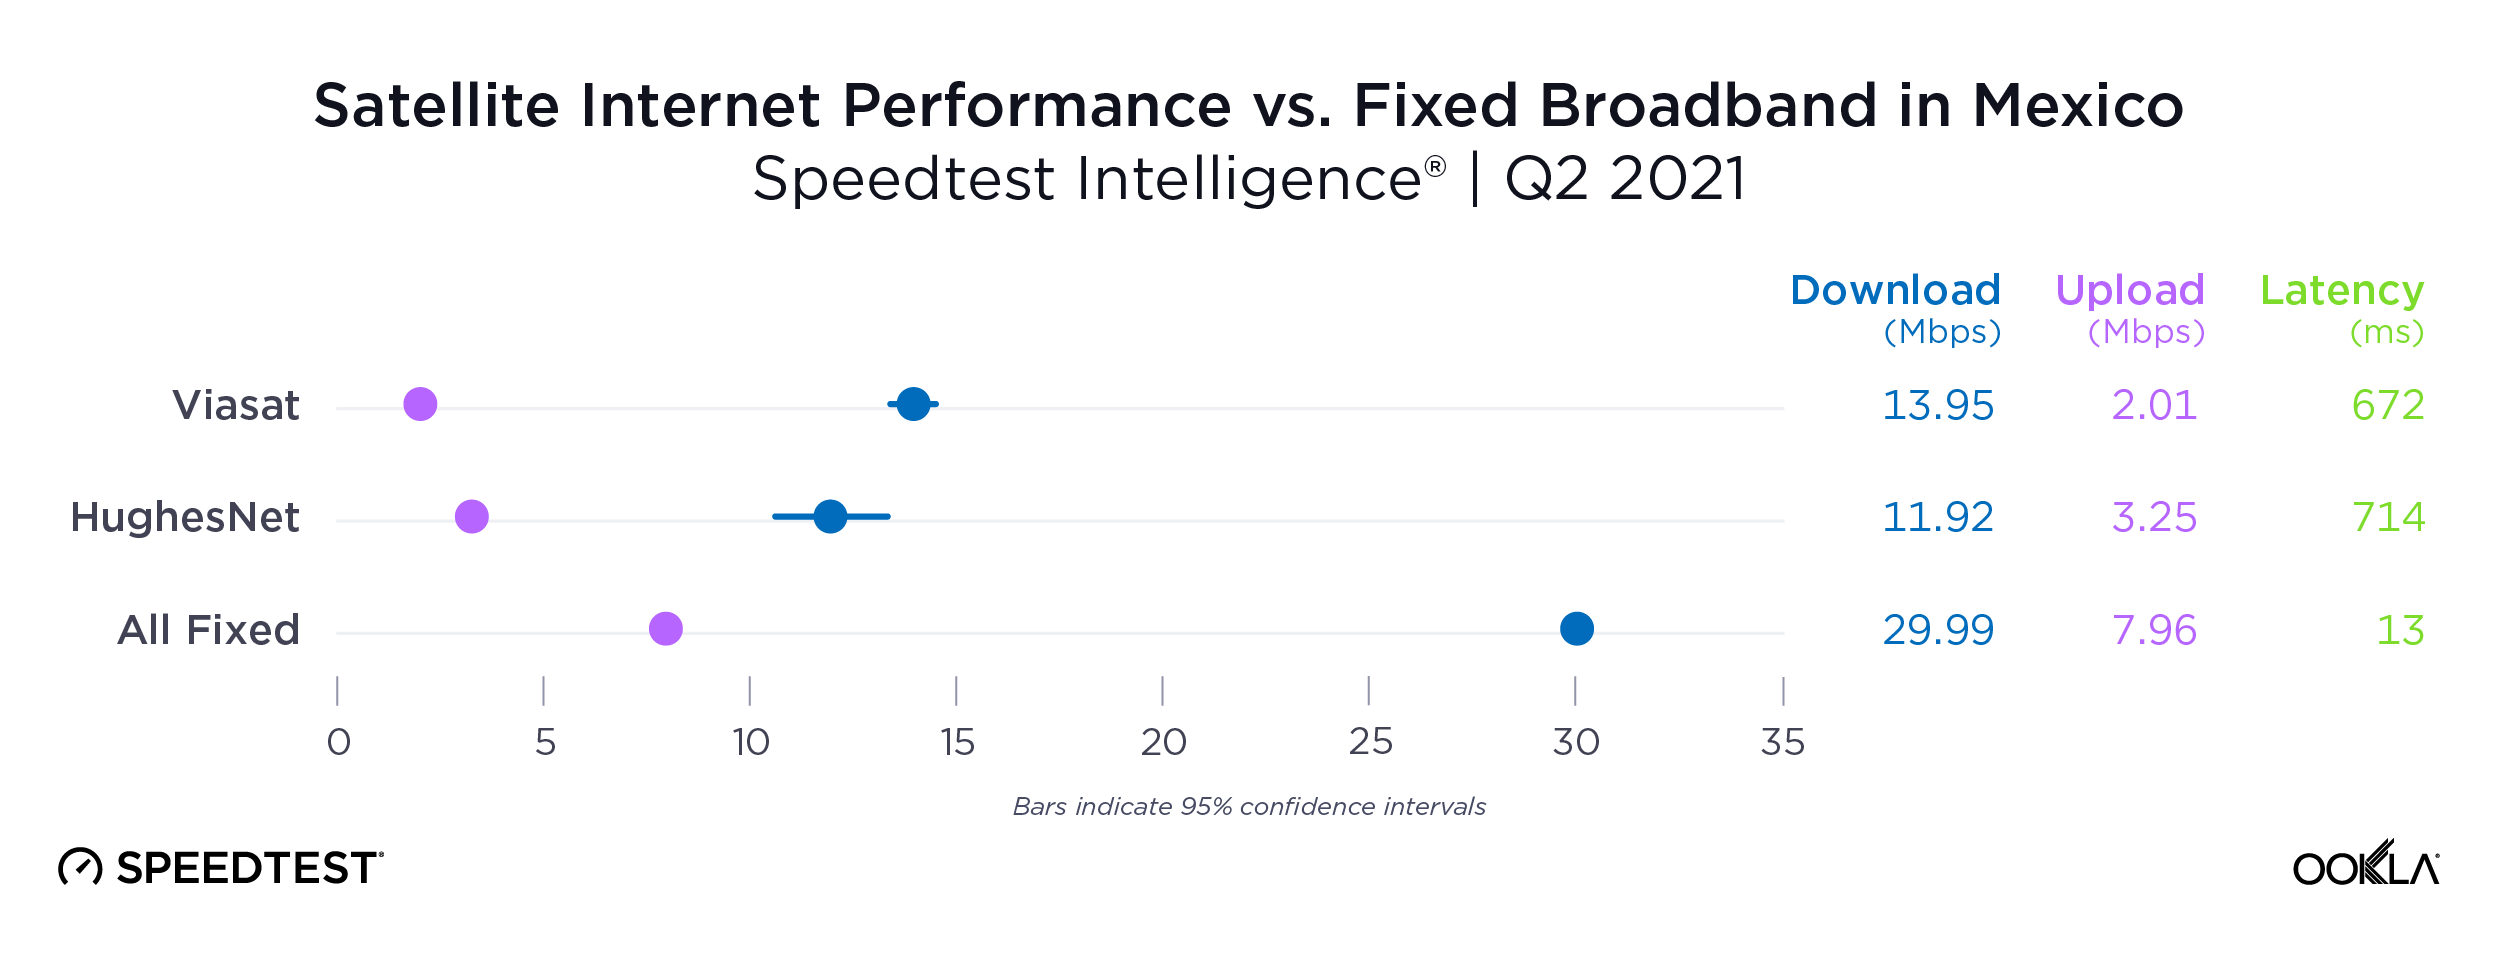
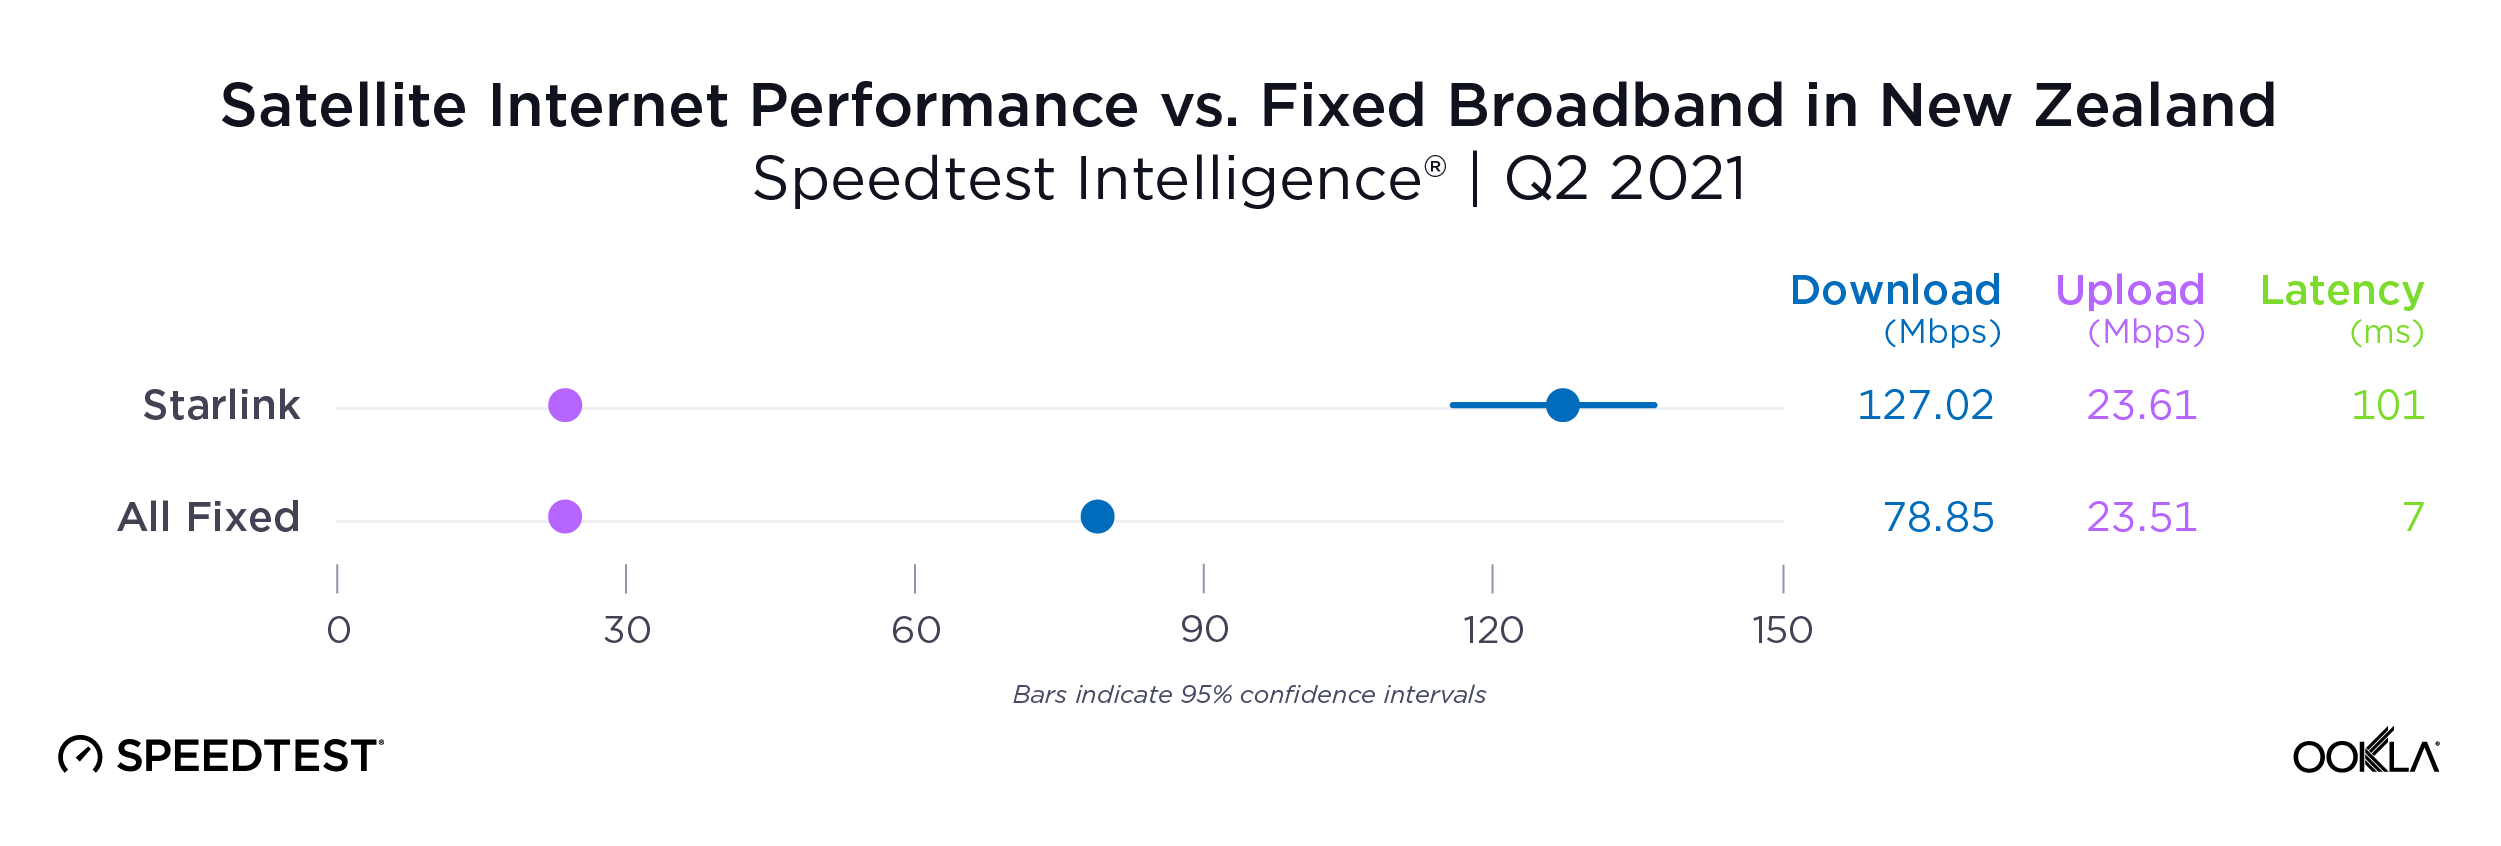


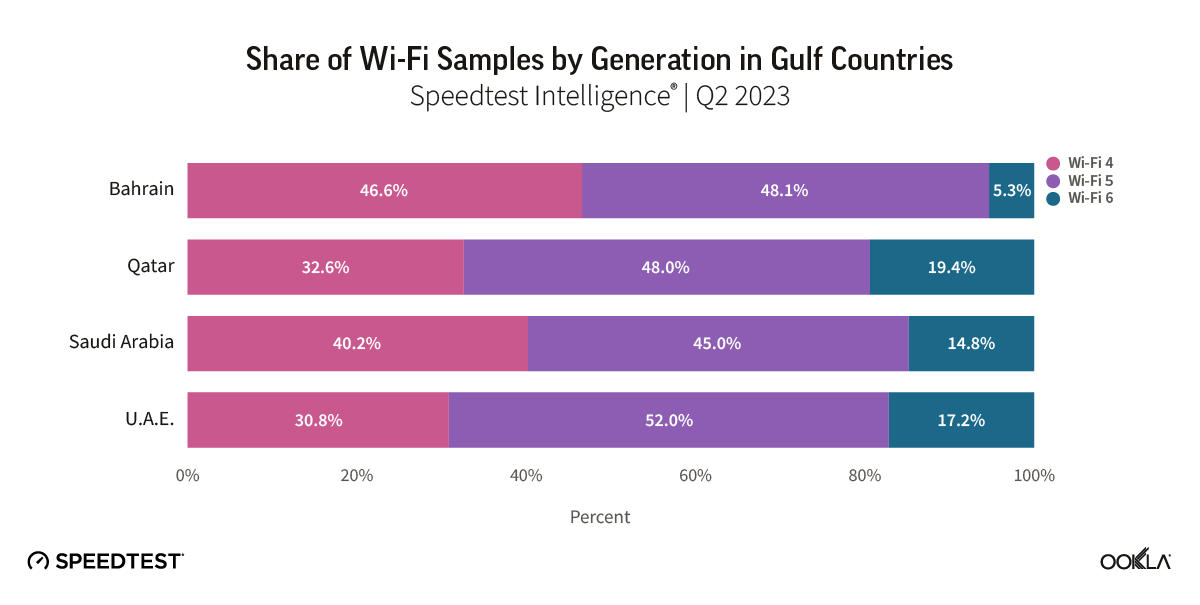

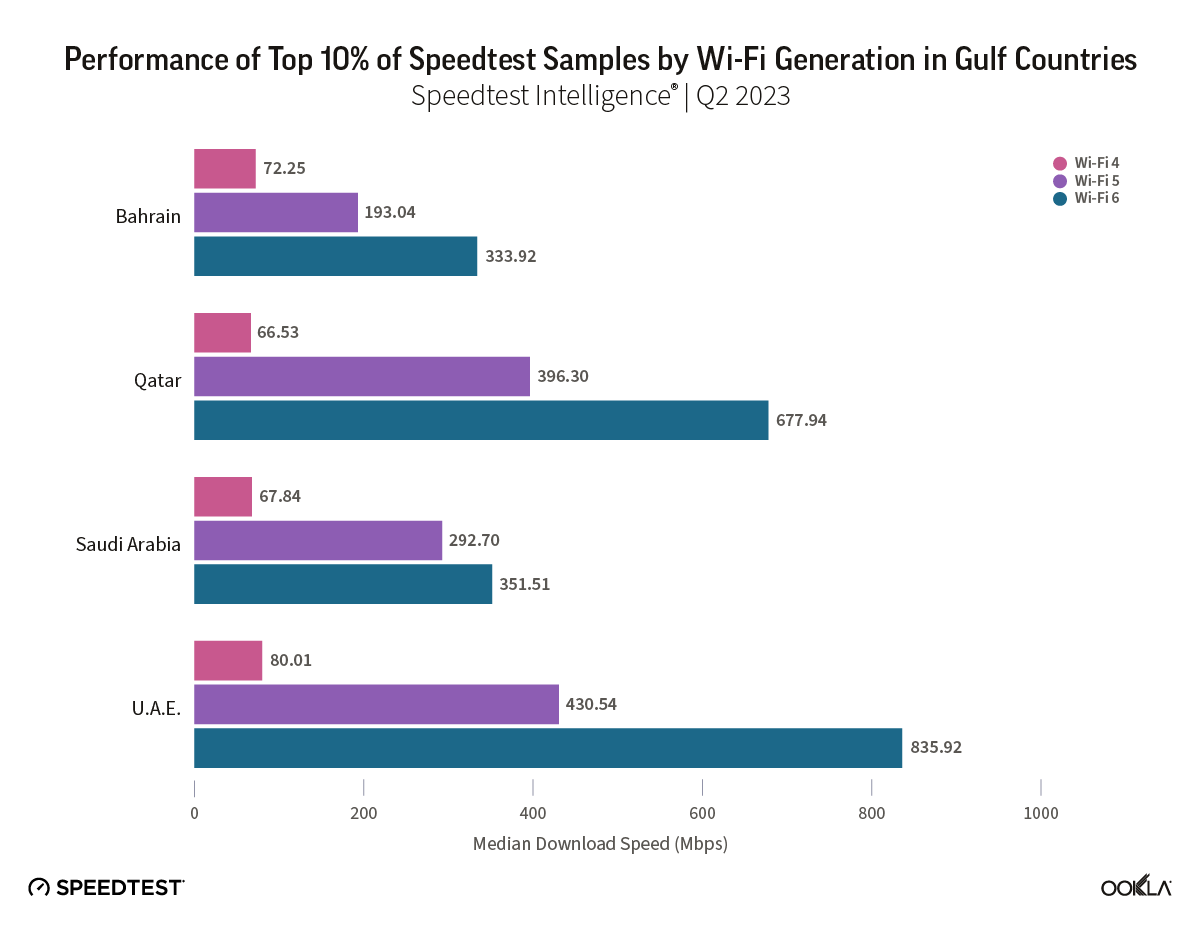


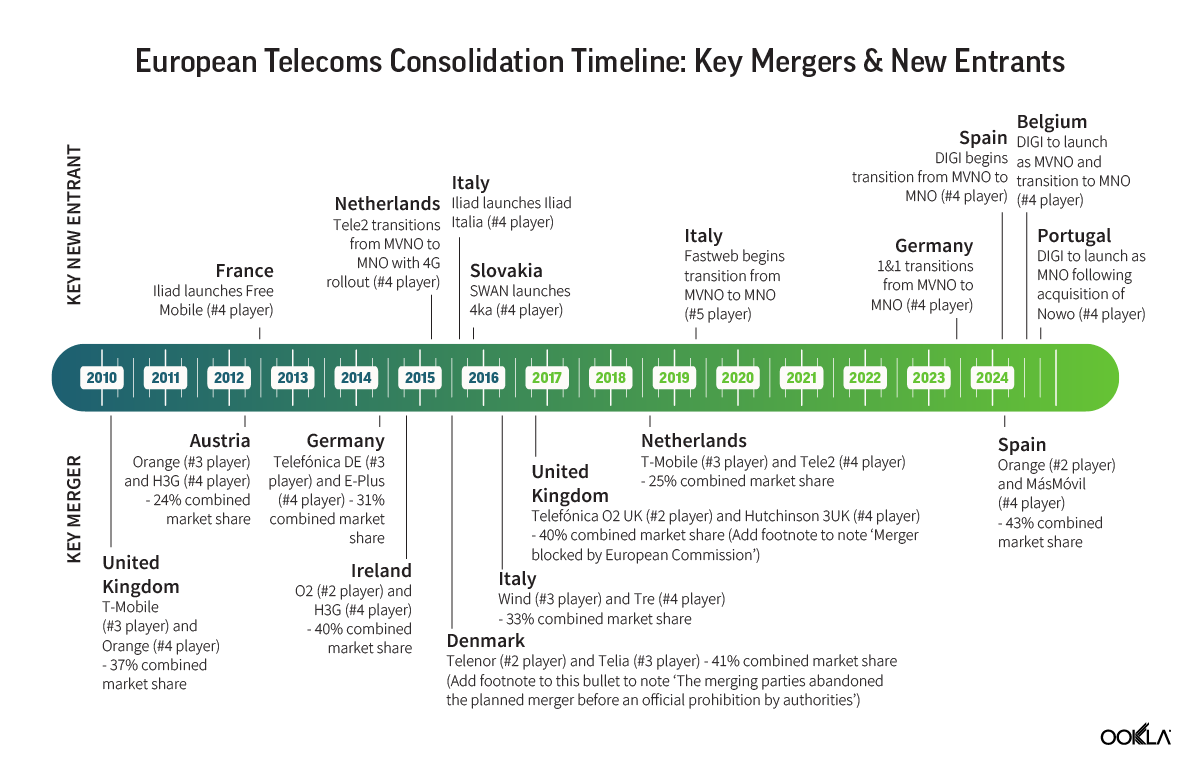

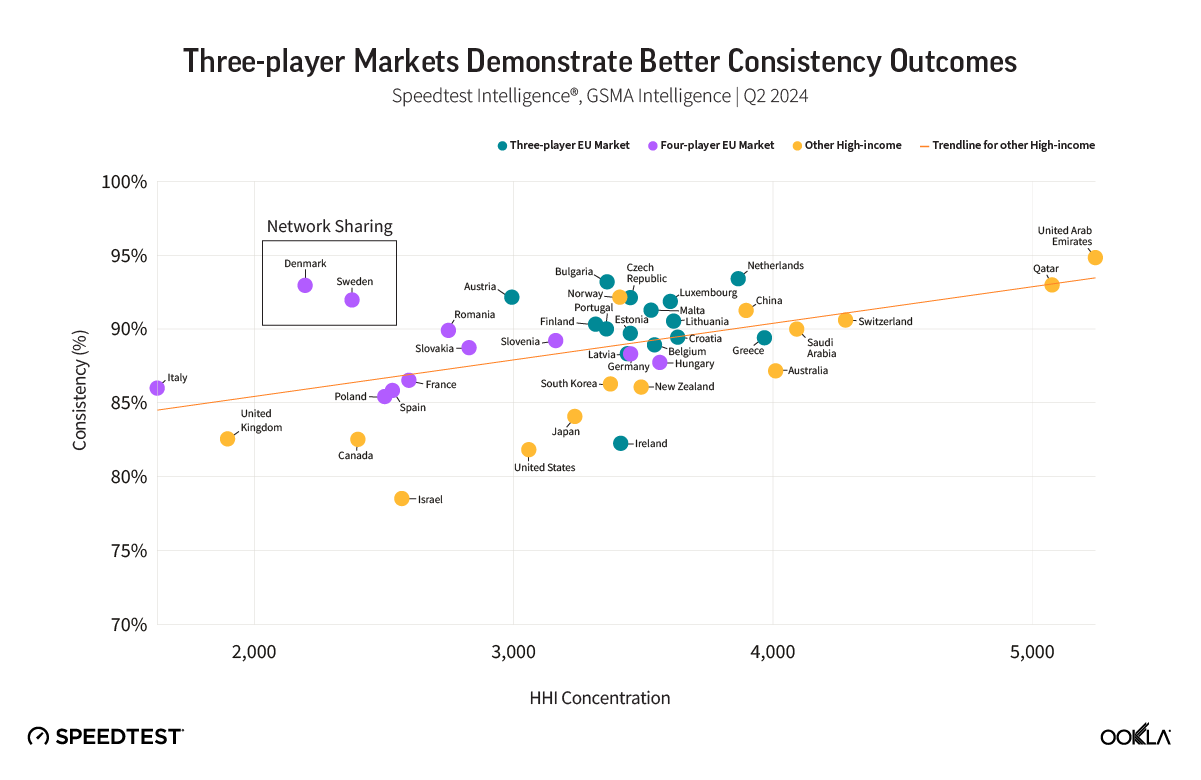
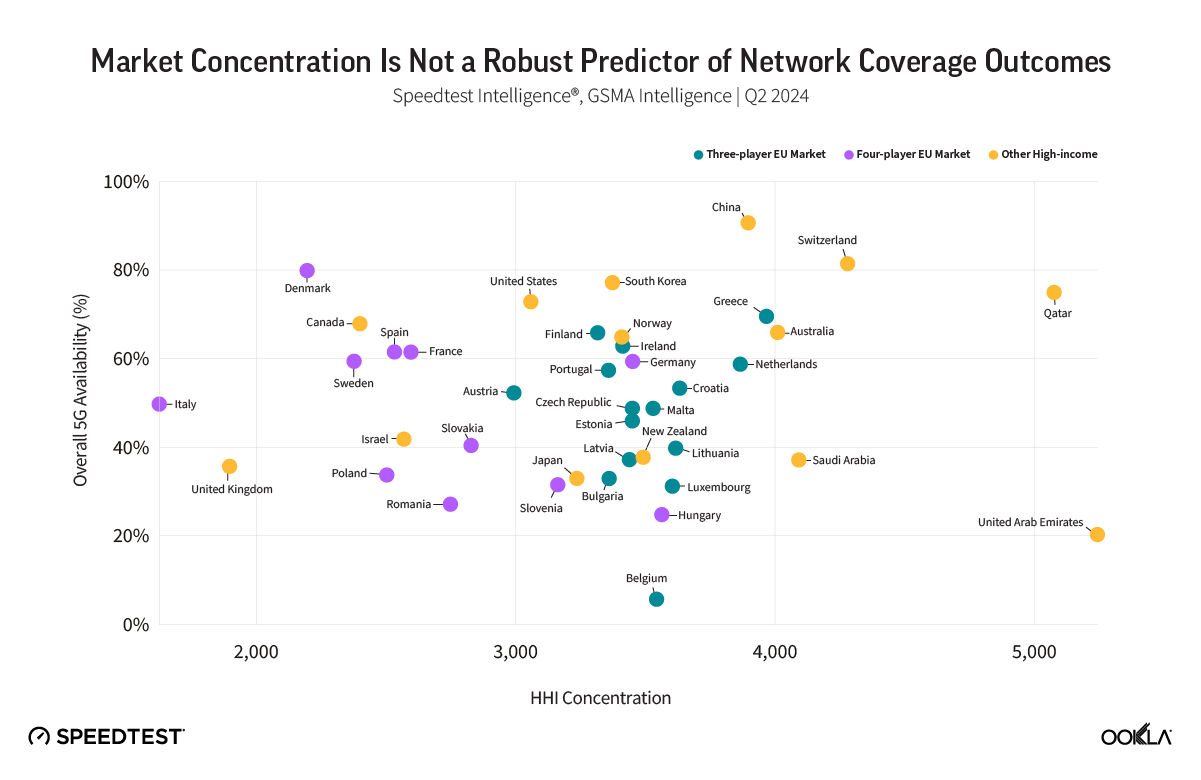
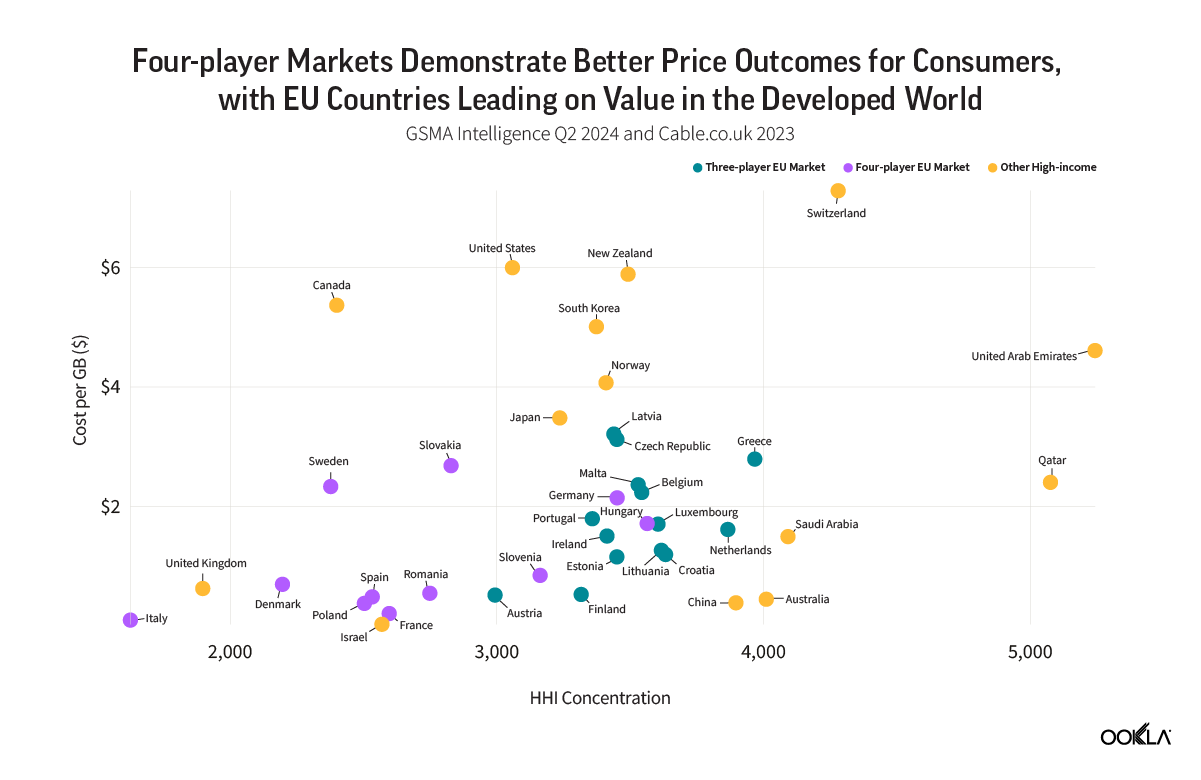


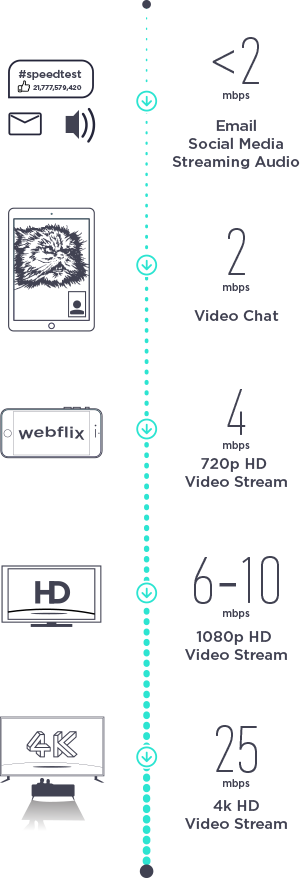