
Consumers care less about speed than they do about the actual connected experiences they’re having, and throughput alone doesn’t provide a full picture into those connected experiences. At Ookla, we’ve been defining network performance standards for nearly two decades. Over the last few years, we’ve adjusted our test collection methods to meet consumers where demand is, which is why our SDK collects user experience metrics for video streaming, video conferencing, gaming, and web browsing.
Through combining RF and user experience data, operators can get unparalleled insight into a network’s quality of experience (QoE) and quality of service (QoS), at the times and locations consumers care about most. Register for our February 14 webinar to learn more about combining crowdsourced QoS and QoE metrics to get a comprehensive picture of your customers’ network experience.
Why do user experience metrics matter?
QoS, often defined by RF measurements like RSRQ and RSRP, is about providing the baseline network performance that customers expect. QoE measures the quality that customers are experiencing in the applications they are using; these metrics focus on end user experiences with a network and connected services, and can help push networks to meet the use cases of tomorrow. Many operators are still defining QoE as they are working to get a better understanding of their customers’ experience making video calls, playing games, streaming entertainment, and accessing their favorite content from mobile devices.
With Net Promoter Score™ (NPS) tied closely to customer network experience, providing great QoE is a huge opportunity for operators to improve customer satisfaction and reduce customer churn.
Good signal quality doesn’t equal good user experience
What do you do when probes, network counters, walk tests, and drive tests show good results, but customers are still experiencing problems? A network can look great internally but otherwise hidden factors can create a poor user experience.
In the example below, we compare RF KPIs with video streaming KPIs for two operators in Indonesia.
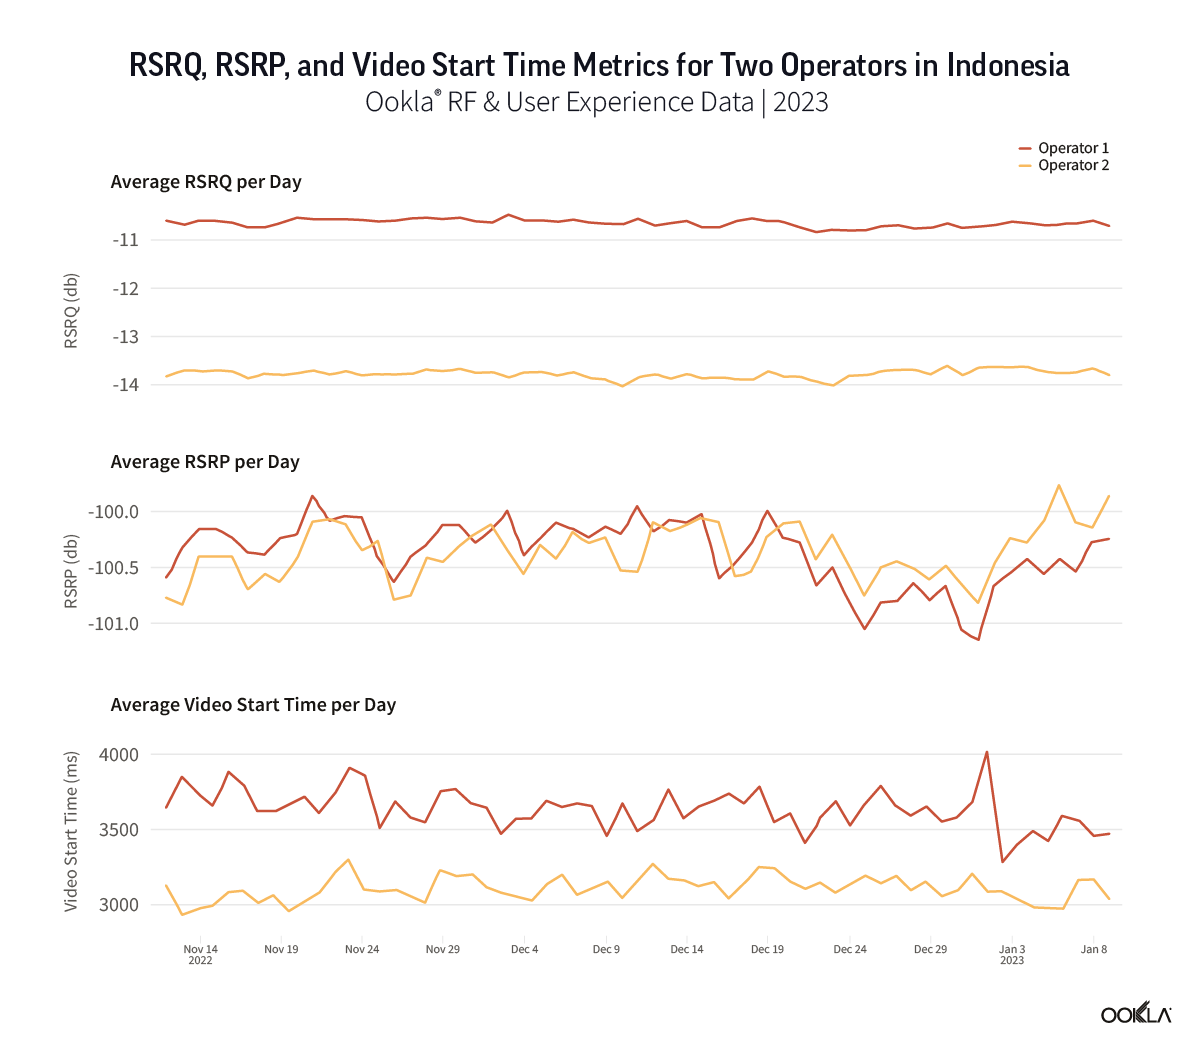
Operator 1 has much better RSRQ and about equal RSRP compared to Operator 2. However, Operator 1 has a significantly slower video start time, resulting in a worse user experience for video streaming. Operator 1 appears to have a hidden problem, such as capacity or provision problems, causing the poor video streaming experience on their network.
Tune into the webinar at 8 a.m. PST / 11 a.m. EST / 4 p.m. GMT on Tuesday, February 14 to see more real-world examples of how QoS and QoE data can be used to discover hidden network problems. A recording will be provided for registrants who can’t join the live presentation. Register now.
Ookla retains ownership of this article including all of the intellectual property rights, data, content graphs and analysis. This article may not be quoted, reproduced, distributed or published for any commercial purpose without prior consent. Members of the press and others using the findings in this article for non-commercial purposes are welcome to publicly share and link to report information with attribution to Ookla.
