Two years ago, LinkNYC set out to provide New Yorkers with free Wi-Fi using a network of Links that offer “superfast, free public Wi-Fi, phone calls, device charging and a tablet for access to city services, maps and direction.” The experiment worked, and we’re here to report on how fast the network really is, whether it holds up to heavy use and which parts of the city are seeing the most benefit.
What is LinkNYC?
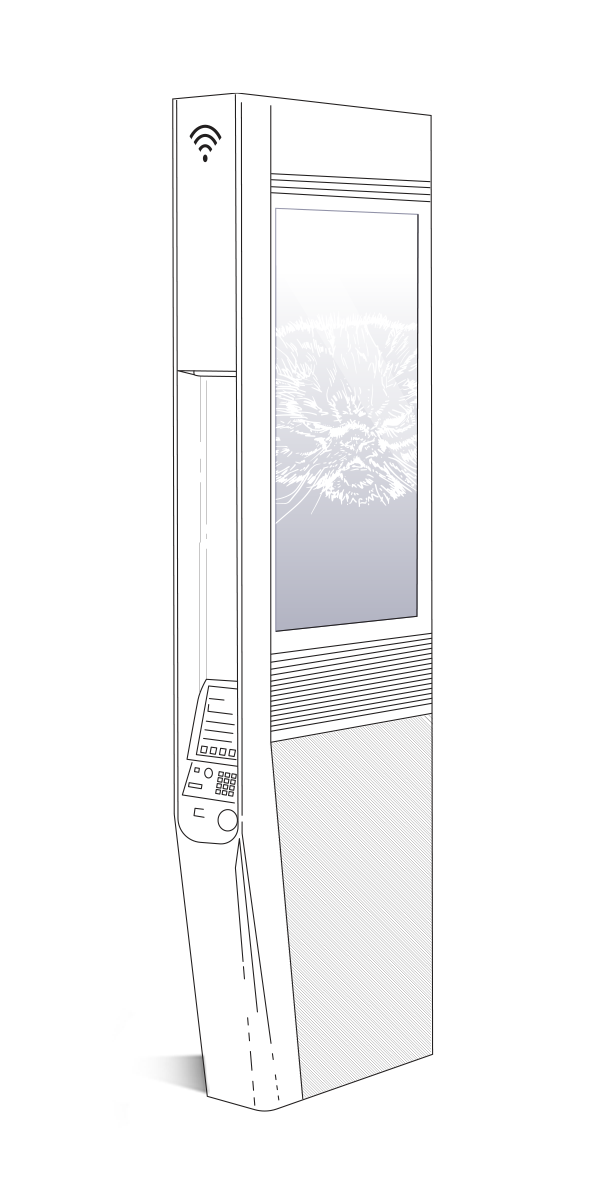
LinkNYC uses kiosks (“Links”) to provide internet connectivity to the five boroughs (Manhattan, Brooklyn, Queens, the Bronx, and Staten Island). The project resulted from a competition initiated by the New York City government to find a new use for the City’s payphones. Service at the first 500 Links was available by the end of 2015. One thousand, one hundred and sixty-four are active as of this writing with another 215 installed and awaiting final connection. The project aims to have 7,500 Links online by the end of 2023. Each link is connected to the LinkNYC fiber network and is capable of speeds up to 1 Gbps. The Links use 802.11ac Wave 2 access points with support for 4×4:4 MU-MIMO.
LinkNYC was created by CityBridge, a consortium of companies including Intersection (a portfolio company of Alphabet Inc.’s Sidewalk Labs), Qualcomm and CIVIQ Smartscapes. Beyond a $300 million capital investment from CityBridge, LinkNYC is funded through advertising revenues from ads shown on screens on the Links themselves and is projected to create more than $500 million in revenue for the City of New York.
How fast is fast?
Speedtest data reveals LinkNYC offered up a mean download speed of 158.98 Mbps and a mean upload of 123.01 Mbps in September 2017. This free network is faster by 74% and 165%, respectively, than New York City’s average download and upload speeds over mobile Wi-Fi. New York’s mobile Wi-Fi download and upload speeds for all networks combined are respectively 249% and 312% faster than those over cellular networks. That means LinkNYC users are seeing download speeds 511% faster than they would be if they were connecting on cellular networks. LinkNYC’s mean upload speed was 996% faster than cellular.
| Connection Type | Mean Download (Mbps) | Mean Upload (Mbps) |
|---|---|---|
| LinkNYC Mobile Wi-Fi | 158.98 | 123.01 |
| Mobile Wi-Fi | 90.89 | 46.27 |
| Cellular | 25.98 | 11.22 |
Even better, we can see that the speeds available on LinkNYC are improving rapidly. Though the Speedtest results fluctuate somewhat on a day-by-day basis, on January 1, 2017, the average download speed was 95.70 Mbps and the upload was 81.50 Mbps. On September 30, the daily average download speed peaked at 201.00 Mbps and the upload speed was 177.10 Mbps.
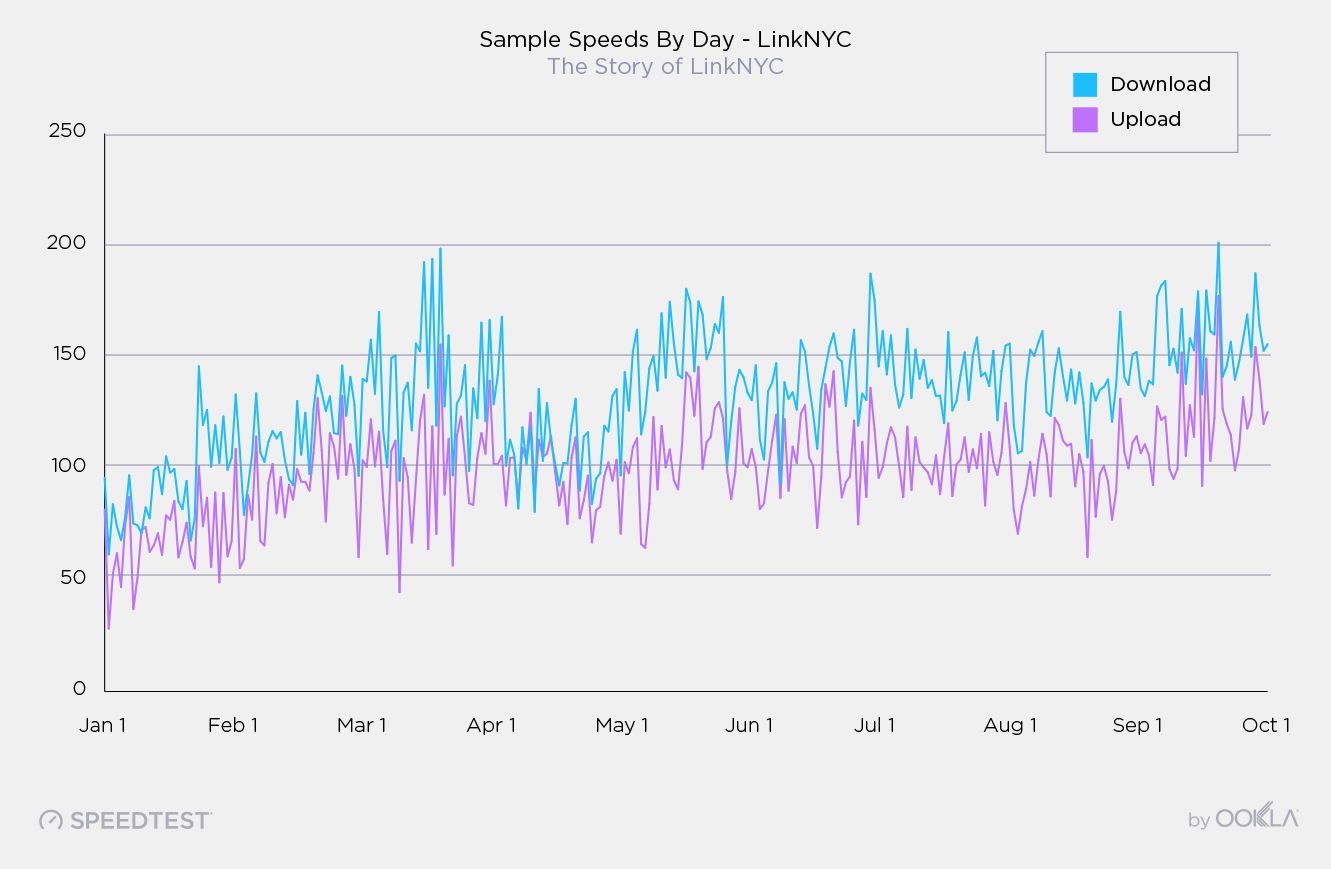
These daily speeds likely reflect limitations of mobile devices, not those of the LinkNYC network.
One thing to note is that while the LinkNYC network is reportedly capable of 1 Gbps speeds, most mobile devices are not. The Speedtest results graphed above are likely limited by a world where the peak achievable speed for an iPhone 5 maxes out at around 100 Mbps and an iPhone 7 at around 560 Mbps.
To top it off, LinkNYC’s daily speeds are faster still than the averages for the U.S. as a whole. In September, we saw a mean download speed over mobile Wi-Fi of 66.25 Mbps in the U.S., while cellular came in at 23.98 Mbps. Mean upload speed over mobile Wi-Fi for the U.S. was 23.59 Mbps, while cellular was 8.38 Mbps.
Is it secure?
LinkNYC actually has two networks — one called “LinkNYC Free Wi-Fi” that’s open and available to all and “LinkNYC Private.” Hotspot 2.0-compatible devices are automatically prompted to join this second network which is protected using WPA2 encryption and Hotspot 2.0 technology which facilitates cellular-like roaming on capable devices. That means that once a phone joins the “LinkNYC Private” network, the phone’s connection to the network is handed off from access point to access point as a user moves throughout the city. Most carriers have offered Hotspot 2.0-capable phones since 2014 (T-Mobile has for much longer).
We can’t say for certain that the private network is secure, but the fact that it is encrypted likely makes it more secure than your average coffee shop connection. In light of the recently discovered global WPA2 vulnerability, we asked LinkNYC how vulnerable their network was. The response was: “The Link private network is not at risk. The combination of access point firmware and the network configuration assure the integrity of encrypted WPA2.”
Speeds over the two networks are similar with downloads over “LinkNYC Private” Hotspot 2.0 network just 9.4% faster than those on “LinkNYC Free Wi-Fi”. This could be due to the fact that newer phones are both more likely to offer faster speeds and to be Hotspot 2.0-ready as well as the fact that fewer users are accessing this second network.
| Connection Type | Mean Download (Mbps) | Mean Upload (Mbps) |
|---|---|---|
| LinkNYC Free Wi-Fi | 131.84 | 100.97 |
| LinkNYC Private | 144.21 | 106.98 |
Do speeds hold up during peak periods?
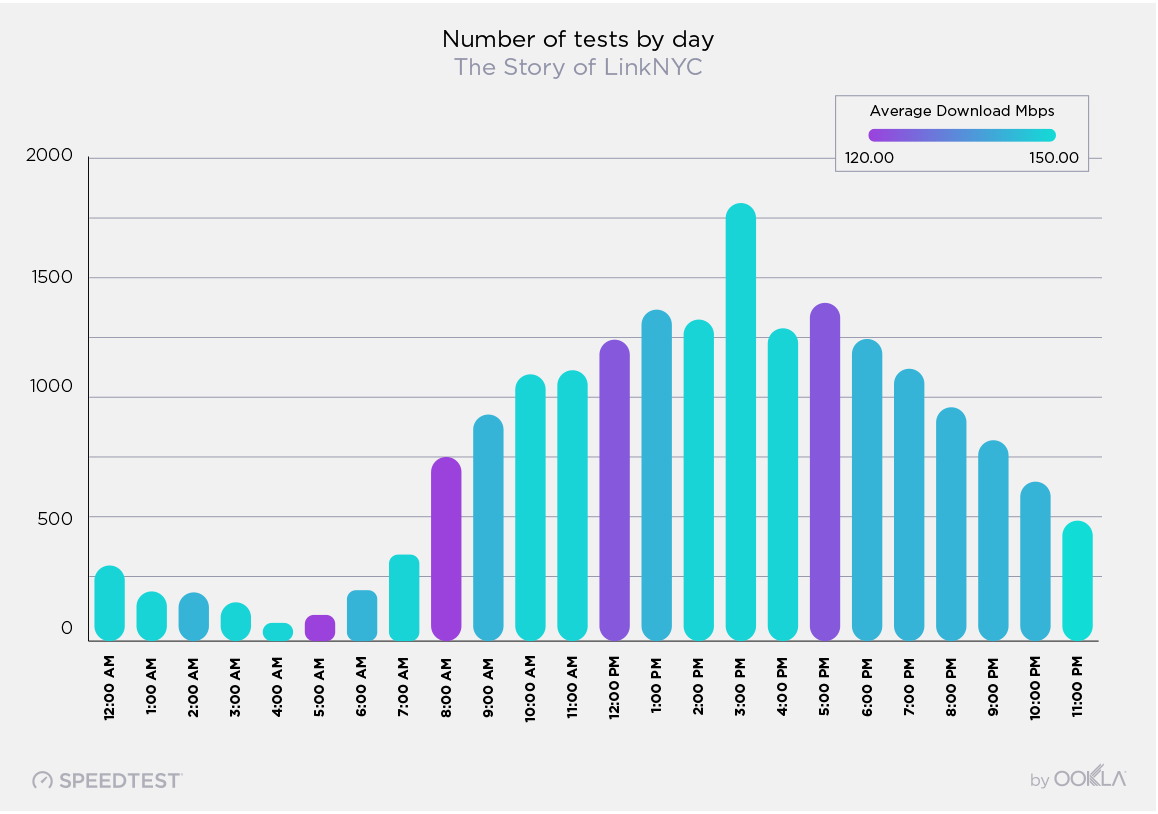
Yes, yes they do. The graph below shows that even during periods with the highest volume of tests (from 3-4 p.m.), the LinkNYC network maintains peak download speeds. The slowest download speeds, seen from 5-6 a.m. and 8-9 a.m., still maintain an average download speed over 120 Mbps.
The far-reaching impact of LinkNYC
How many people are using it?
According to LinkNYC, the network sees 300,000 users per day. We saw 19,289 Speedtest tests taken with Speedtest over the LinkNYC network from 7,594 unique users from January 1, 2017 through October 11, 2017. This compares with the 2,436,040 Speedtest results from 322,851 users on all mobile Wi-Fi networks in New York City during the same period.
Where can you get it?
As described above, Links are rolling out rapidly. You can see the current map of available Links here, but we found that the map at today’s writing corresponds closely with the map of Speedtest results we’ve seen over the past year.
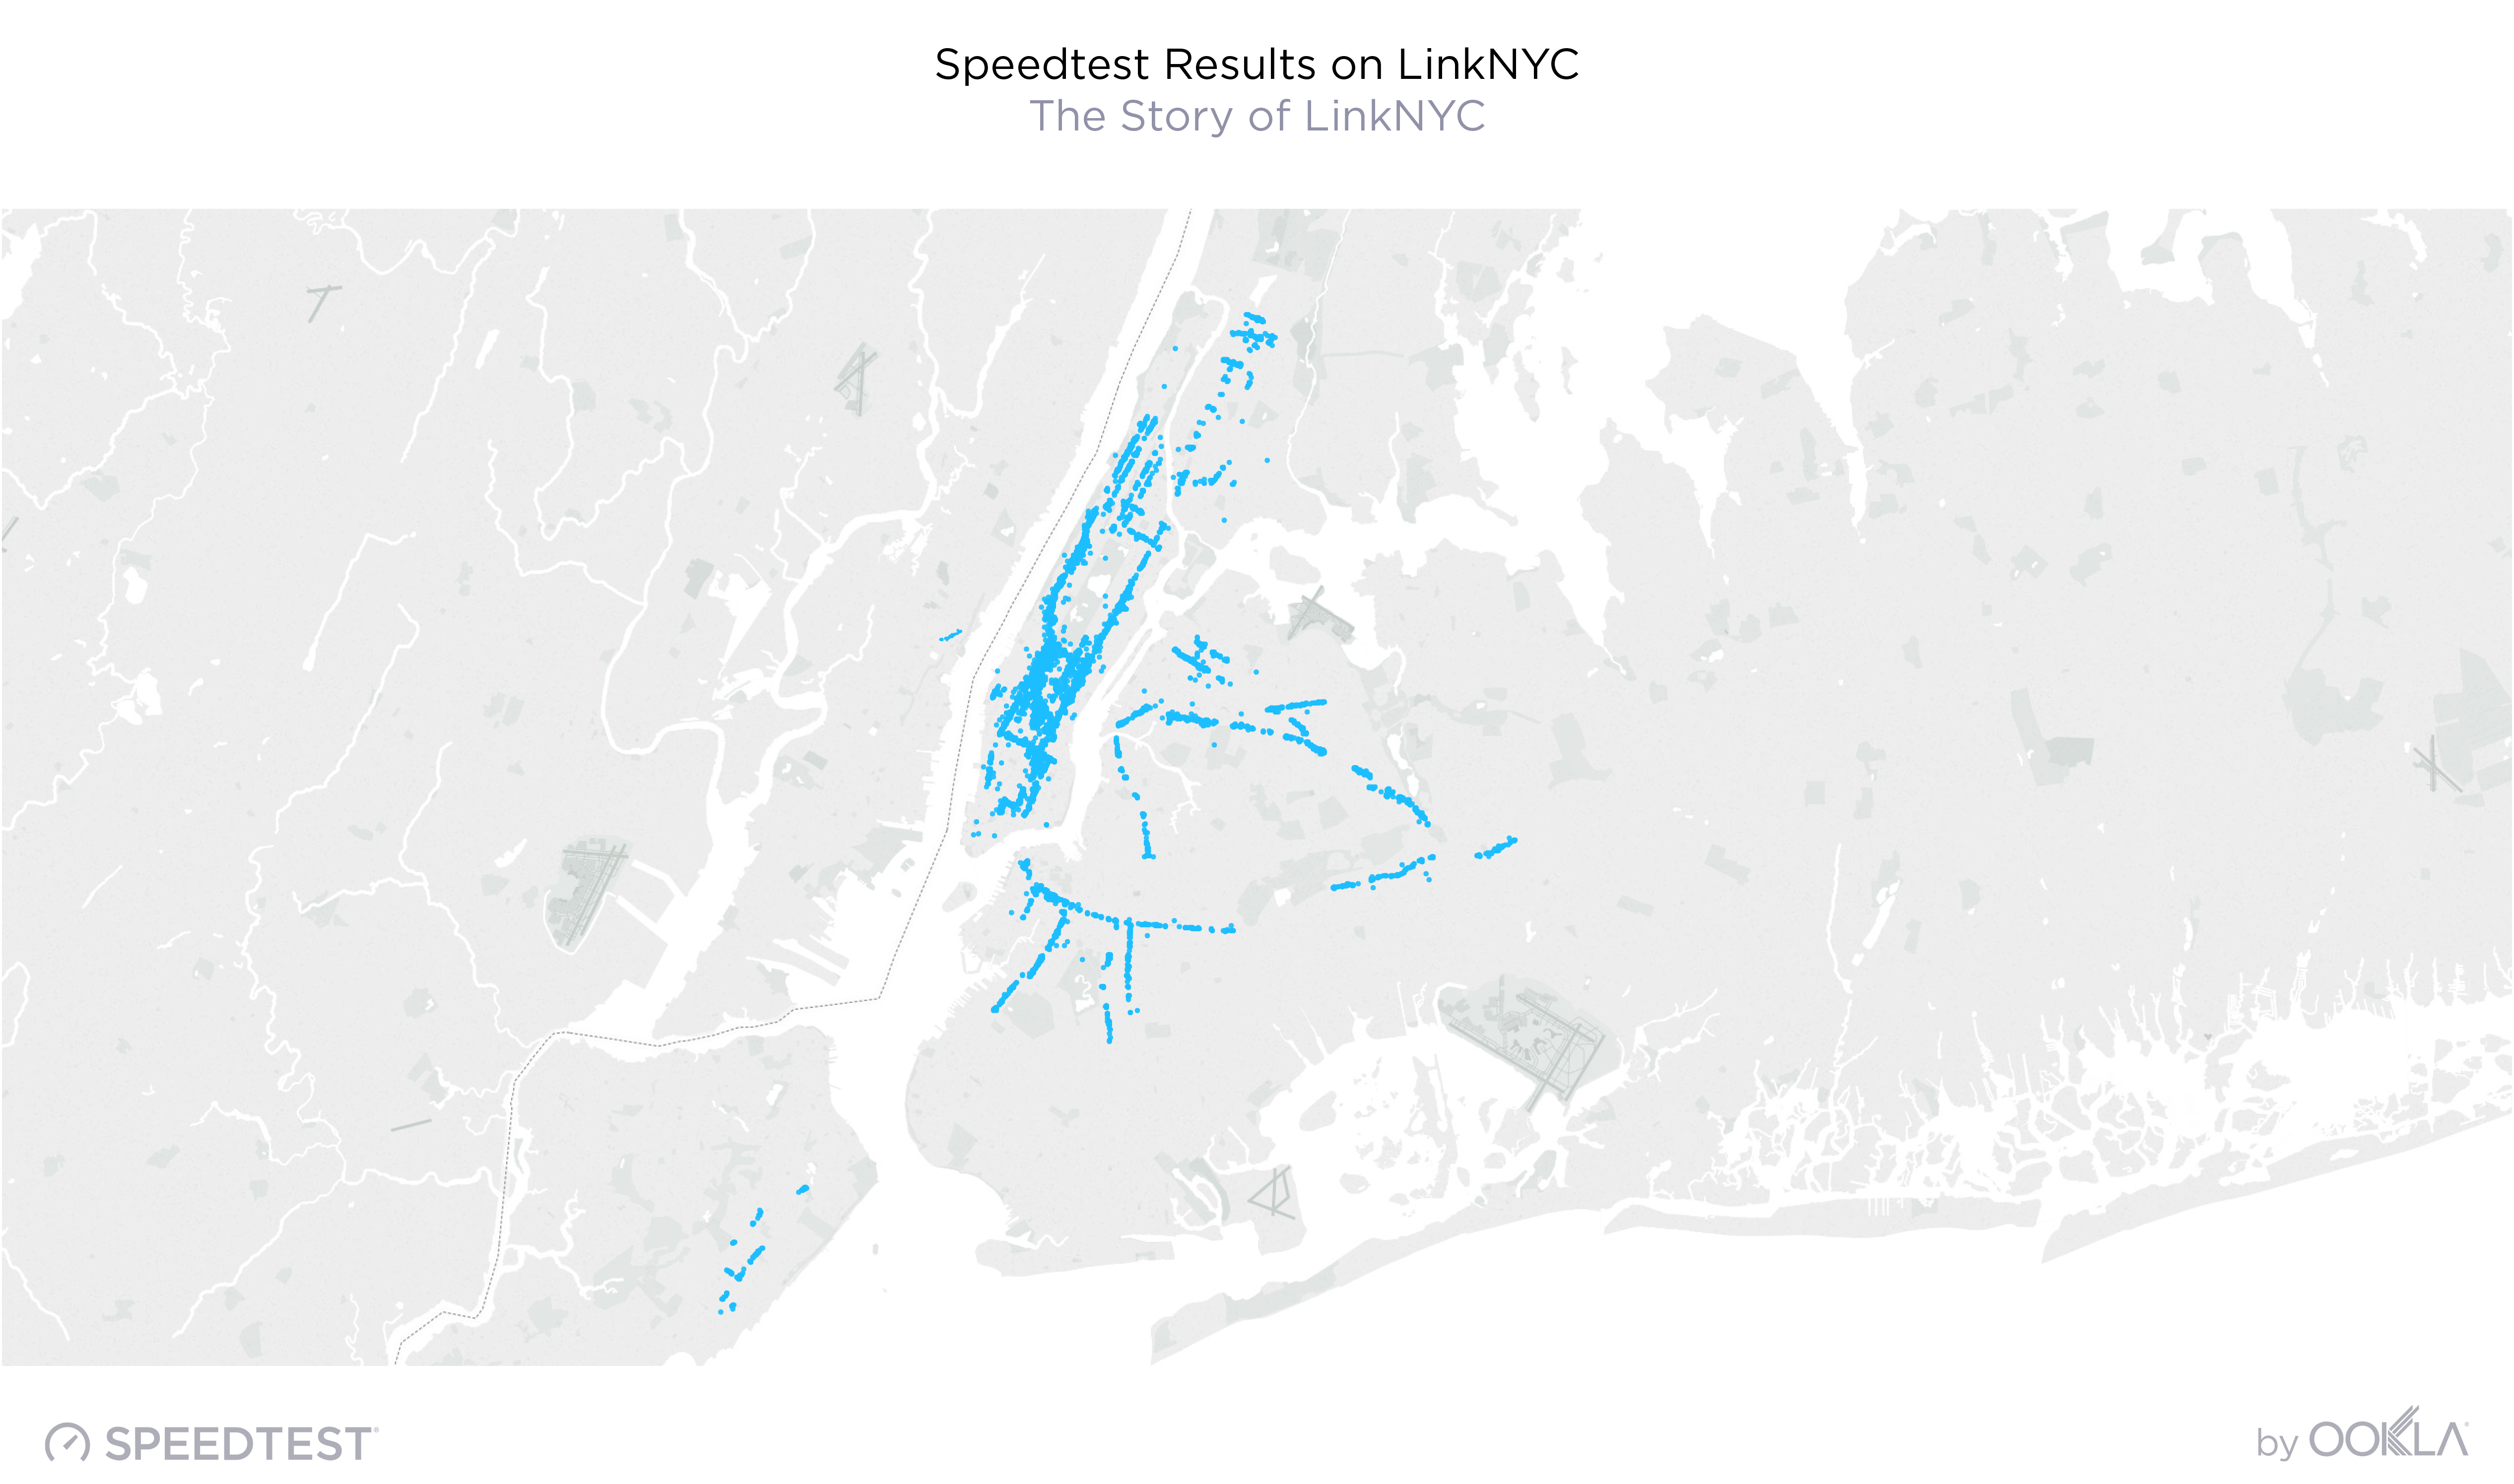
Much of Manhattan is covered by Links, with the exception of Washington Heights north of the George Washington Bridge and lower Manhattan below Worth St. Links are sparser in the Bronx with nothing north of West Kingsbridge Road or east of Webster Ave. (north of 161st) and Third Ave. (south of 161st).
The alignment of Links along major thoroughfares becomes more obvious in Queens and Brooklyn. In this area, we see a large gap around Bushwick and Ridgewood with nothing south of 39th St. and Clarendon Rd. A whole swath of northeast Queens (bordered by Grand Central Parkway) also exists in a Link-free zone.
Meanwhile, in Staten Island you’ll find Links on sections of Hylan Blvd. and Richmond Rd. with a few scattered in between.
Links are required to have a range of at least 150 feet, although a spokesperson for LinkNYC reported a Speedtest result as fast as 80 Mbps at 400 feet. At either distance, people living in neighborhoods with a more sparse Link distribution may not have access near home.
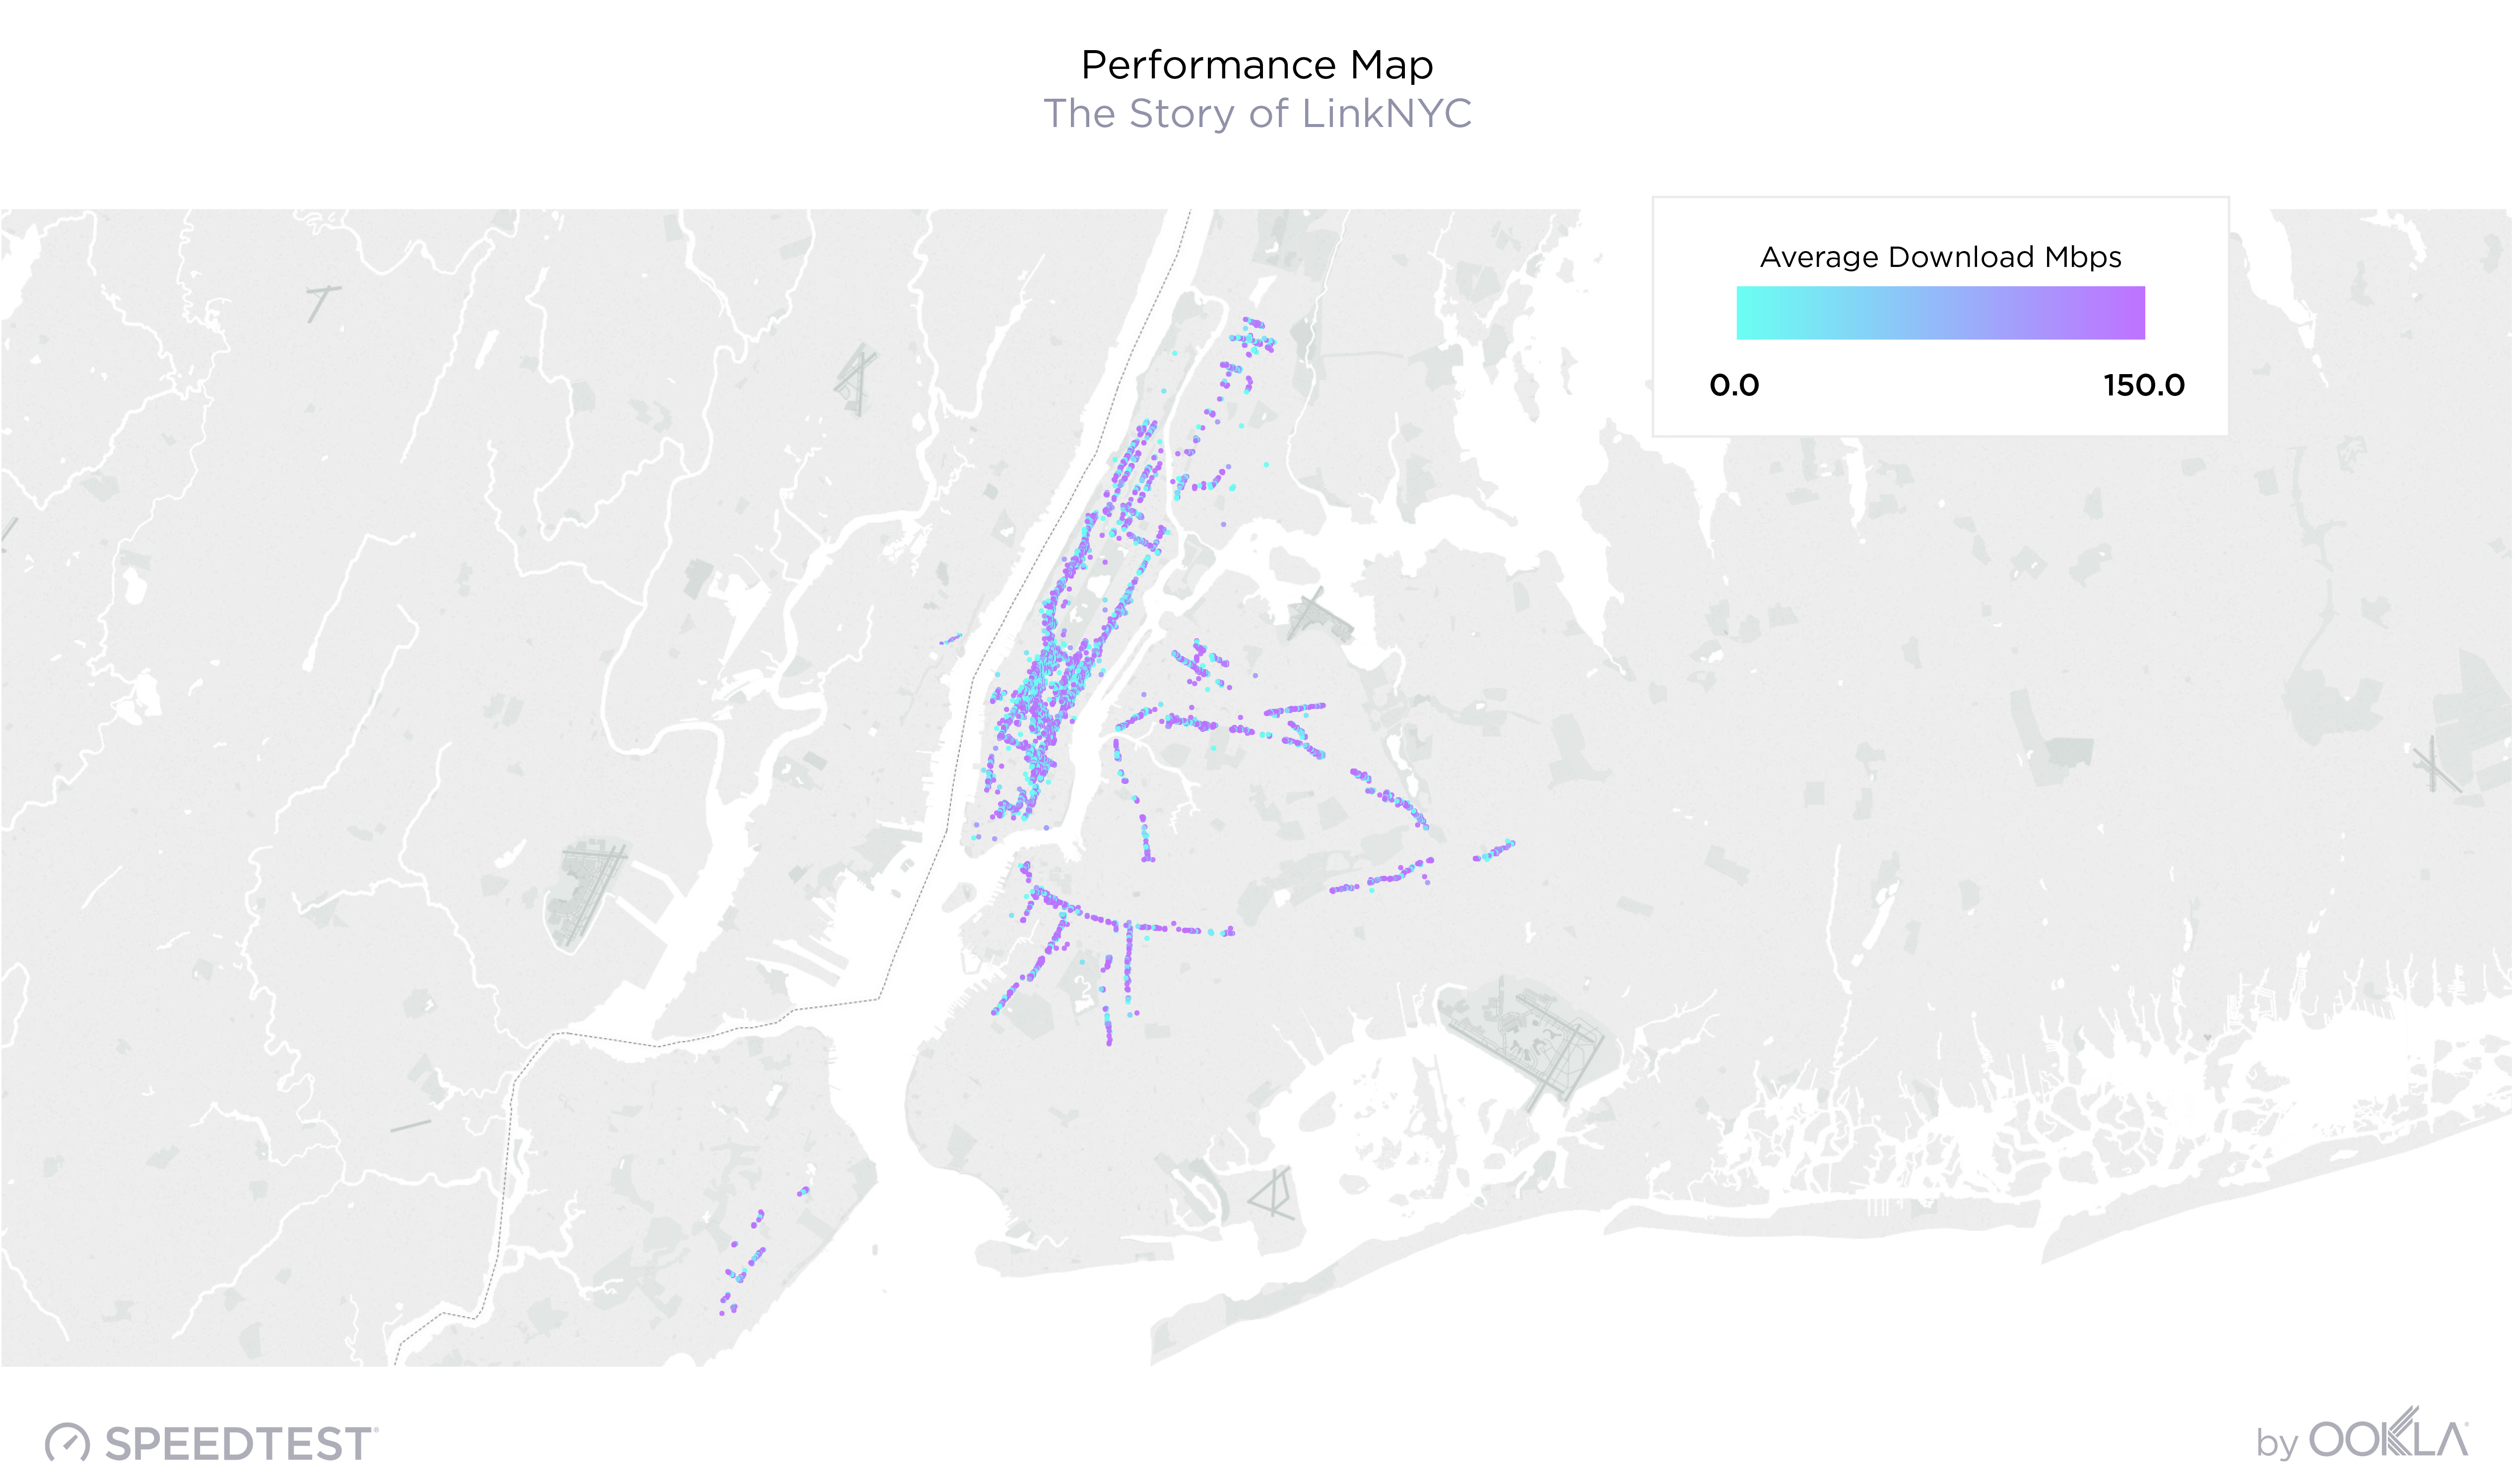
The map above shows that speeds vary not by neighborhood but by distance from a Link.
Can I use it at home?
If you’re lucky enough to live near a Link, you actually can use it for your home internet; there’s nothing in the terms of service to say otherwise. But, unless you’re sitting within the unassisted range of a Link, we wouldn’t recommend it.
We were able to identify Speedtest results that were using extenders and/or repeaters to rebroadcast the service farther into a building, and those tests showed speeds 57% slower than New York’s 90.89 Mbps average for downloads over mobile Wi-Fi.
| Connection Type | Mean Download (Mbps) | Mean Upload (Mbps) |
|---|---|---|
| Unsampled Results from Extenders and Repeaters | 38.87 | 30.71 |
| Overall LinkNYC Results | 158.98 | 123.01 |
Approaches to municipal Wi-Fi
LinkNYC’s ad-based, public-private partnership is only one approach to municipal Wi-Fi. In Leiden, Netherlands, a non-profit organization set up an independent, community-based network run by volunteers. Venice offers free Wi-Fi to all residents and Longmont, Colorado offers free municipal Wi-Fi in several locations, mostly parks, as part of their Gig City initiative.
LinkNYC isn’t the first free Wi-Fi network, but it’s one of the largest. And, despite some bumps along the way, it’s successfully bringing fast, free public Wi-Fi to the masses. The project is so successful that CityBridge has just extended the same model to London as InLinkUK.
Are you enjoying free mobile Wi-Fi on either LinkNYC or InLinkUK? Take a Speedtest on Android or iOS so we can share details about the performance of these networks over the long haul. Select the CityBridge server when taking your test to get the most accurate results.
Ookla retains ownership of this article including all of the intellectual property rights, data, content graphs and analysis. This article may not be quoted, reproduced, distributed or published for any commercial purpose without prior consent. Members of the press and others using the findings in this article for non-commercial purposes are welcome to publicly share and link to report information with attribution to Ookla.