| March 19, 2025

A First Look at How Apple’s C1 Modem Performs With Early Adopters


The 16e is the first iPhone to feature the Apple-designed C1 modem.

Key Takeaways:

  • AT&T and Verizon Speedtest® users experienced better median download speeds on the iPhone 16e than iPhone 16. However, the opposite was true for T-Mobile users. 
  • Verizon Speedtest users with the iPhone 16e and the iPhone 16 experienced median download speeds that lagged behind that of both AT&T and T-Mobile. 
  • iPhone 16e Speedtest users on Verizon’s network and AT&T’s network saw higher upload speed performance than those using the iPhone 16. However, T-Mobile users experienced the opposite and had slightly higher upload speeds on the iPhone 16 compared to the iPhone 16e.

Apple’s new iPhone 16e made its commercial debut in late February with much fanfare because it’s the first device to include the Apple-designed C1 modem. Historically, Apple relied upon Qualcomm to provide most of its iPhone modems so its decision to use the C1 modem in the iPhone 16e is considered a significant move.  

Although it’s early in the adoption curve for the iPhone 16e, we analyzed the performance of the new device from March 1st through March 12th, and compared it to the performance of iPhone 16, which has a similar design and the same 6.1” screen. Both devices run on the same Apple-designed A18 SoC. However, it’s important to note that unlike the iPhone 16, the iPhone 16e does not support mmWave spectrum. This is the first iPhone available in the U.S. without mmWave support but we expect future iterations of the C1 modem will include it. 

iPhone 16 offers higher top-end performance than the iPhone 16e 

iPhone 16e Offers Better Worst-Case Speeds, but iPhone 16 Has a Higher Top-End Performance
Speedtest Intelligence® | 1-12 March, 2025

When we compare Speedtest Intelligence® data from the top 90th percentile (those with the highest performance experience) of iPhone 16e and iPhone 16 users  from all three of the top U.S. operators, we see the iPhone 16 performing better in download speeds. However, at the opposite end, with the 10th percentile of users (those who experience the lowest performance) we see the iPhone 16e performing better than the iPhone 16. 

iPhone 16e outperforms on download speeds for AT&T and Verizon, but not T-Mobile

Speedtest data shows the iPhone16e recorded faster median download speeds than the iPhone 16 on both AT&T and Verizon’s networks, but was markedly slower on T-Mobile’s network. 

iPhone 16e users on T-Mobile’s network experienced median download speeds of 264.71 Mbps, which is at least 47% faster than iPhone 16e users on Verizon’s network that experienced median download speeds of 140.77 Mbps. The download speed performance for iPhone 16e users on AT&T’s network was 226.90 Mbps, closer to that of T-Mobile users. 

However, when comparing median download speeds for T-Mobile users with the iPhone 16e (264.71 Mbps) to T-Mobile users with the iPhone 16 device (357.47 Mbps), the iPhone 16 outperformed the iPhone 16e by at least 24%.

The iPhone 16e’s underperformance in median download speed compared to the iPhone 16 on T-Mobile’s network is most likely due to the fact that T-Mobile is the only US carrier to have a nationwide commercialized 5G standalone network (SA) and one of the few operators globally to deploy significant spectrum depth and advanced features like carrier aggregation (CA) on the new 5G architecture. 

The C1 modem’s more limited capabilities on 5G SA networks compared to the Qualcomm modem in the iPhone 16 may be a key factor contributing to the larger performance gap between device models observed on T-Mobile’s network in early testing.

Verizon’s download performance lags on both devices

While much has been made of the lack of mmWave support on the iPhone 16e, which will have some impact on performance, particularly for users that are in range of these higher bands, both Verizon Speedtest users with the iPhone 16e and the iPhone 16 experienced median download speeds that lagged behind that of both AT&T and T-Mobile.

iPhone 16e Outperforms iPhone 16 on AT&T & Verizon Despite Lacking mmWave, but Trails on T-Mobile's 5G SA
Speedtest Intelligence® | 1-12 March, 2025

iPhone 16e beats the 16 among those in the 10th percentile

When we examine Speedtest Intelligence® data for the bottom 10th percentile  (those with the lowest overall download speeds) of iPhone 16e vs. iPhone 16 users, we see that iPhone 16e users experienced better download speeds compared to iPhone 16 users across all three mobile providers.  

For example, T-Mobile iPhone 16e users in the bottom 10th percentile are experiencing speeds of 57.34 Mbps compared to T-Mobile iPhone 16 users that are experiencing speeds of just  27.27 Mbps.

The Worst Outcomes on iPhone 16e Are Significantly Better Than on iPhone 16
Speedtest Intelligence® | 1-12 March, 2025

At the other end of the scale at the 90th percentile (those with the fastest overall download speeds), we saw the reverse with the iPhone 16 outpacing the iPhone 16e for each mobile provider. For example, T-Mobile iPhone 16 users in the 90th percentile experienced blazing fast median download speeds of 889.83 Mbps compared to T-Mobile iPhone 16e users that are experiencing median download speeds of 627.01 Mbps.

iPhone 16 Outperforms iPhone 16e in Peak Performance Scenarios
Speedtest Intelligence® | 1-12 March, 2025

Performance at the lowest 10th percentile often provides a more accurate reflection of overall quality of experience (QoE) than the fastest 90th percentile, which can be skewed by deployments in mmWave-covered locations and is subject to declining marginal returns.

iPhone 16e is higher in upload speeds

Interestingly, in upload speeds, we saw iPhone 16e users on Verizon and AT&T experiencing higher upload speed performance than those using the iPhone 16. T-Mobile users, however, experienced just slightly higher upload speeds on the iPhone 16e compared to the iPhone 16. The gap was the biggest with AT&T iPhone 16e customers, who experienced median upload speeds of 14.63 Mbps, which is at least a 38% increase over AT&T iPhone 16 users who experienced median upload speeds of 8.60 Mbps. 

iPhone 16e Leads iPhone 16 on Upload Speed across AT&T, T-Mobile and Verizon
Speedtest Intelligence® | 1-12 March, 2025

Apple’s departure from Qualcomm

Apple has historically sourced its iPhone modems from Qualcomm but in 2019 the company purchased Intel’s modem business with the goal of designing its own in-house modems. 

Apple’s iPhone 16e with the C1 modem supports all the low and mid-band 5G spectrum but, as mentioned above, it doesn’t support mmWave spectrum. It also supports Wi-Fi 6 with 2×2 MIMO and Bluetooth 5.3, but lacks Wi-Fi 7 support unlike the rest of the iPhone 16 series of devices. 

Apple claims that the C1 is more power-efficient than any modem ever used in an iPhone and said that the 16e has a new internal design, which allows it to give the device a bigger battery.  In its 16e specifications Apple claims that the 16e has a battery life of up to 26 hours with video playback and up to 21 hours with streaming video playback. This compares to the Apple 16 which Apple claims has a battery life of up to 22 hours with video playback and up to 18 hours with streaming video playback. 

Some of the performance differences that Speedtest data picked up between the iPhone 16e and the iPhone 16 may also be attributed to the fact that the C1 modem doesn’t have all the same capabilities that are featured in Qualcomm’s modems. 

According to a Qualcomm comparison of the C1 and its mid-tier and premium modems, Qualcomm’s mid-tier modems support 4CA downlink carrier aggregation and its top of the line x80 and x85 modems support 6CA downlink carrier aggregation compared to the C1 which supports just 3x downlink carrier aggregation. Qualcomm’s mid-tier, x80 and x85 modems also support uplink carrier aggregation and uplink MIMO and the Apple C1 does not. 

We will continue to monitor the performance of the iPhone 16e as adoption of the device increases around the world and we plan to publish a more comprehensive comparison across the entire iPhone 16 portfolio of devices. While we have not analyzed the iPhone 16 Pro Max’s performance here because it is in the premium device category, we do see it leading over the iPhone 16e in most performance metrics. 

Ookla analysts Mark Giles, Luke Kehoe and Kerry Baker contributed to this piece. 

To find out more about Speedtest Intelligence® data and insights, please contact us here.

Ookla retains ownership of this article including all of the intellectual property rights, data, content graphs and analysis. This article may not be quoted, reproduced, distributed or published for any commercial purpose without prior consent. Members of the press and others using the findings in this article for non-commercial purposes are welcome to publicly share and link to report information with attribution to Ookla.
| December 20, 2021

Growing and Slowing: The State of 5G Worldwide in 2021


5G continues to offer new and exciting ways of rethinking everything from streaming video to performing remote surgery. However, not everyone shares equally in these possibilities as many countries do not have access to 5G and even those that do, do not experience the same level of performance from their 5G connections. We examined Speedtest Intelligence® data from Q3 2021 Speedtest® results to see how 5G speeds have changed, where download speeds are the fastest at the country and capital level, where 5G deployments have increased and what worldwide 5G Availability looked like in Q3 2021. We also looked at countries that don’t yet have 5G to understand where consumers are seeing improvements in 4G access.

5G slowed down at the global level

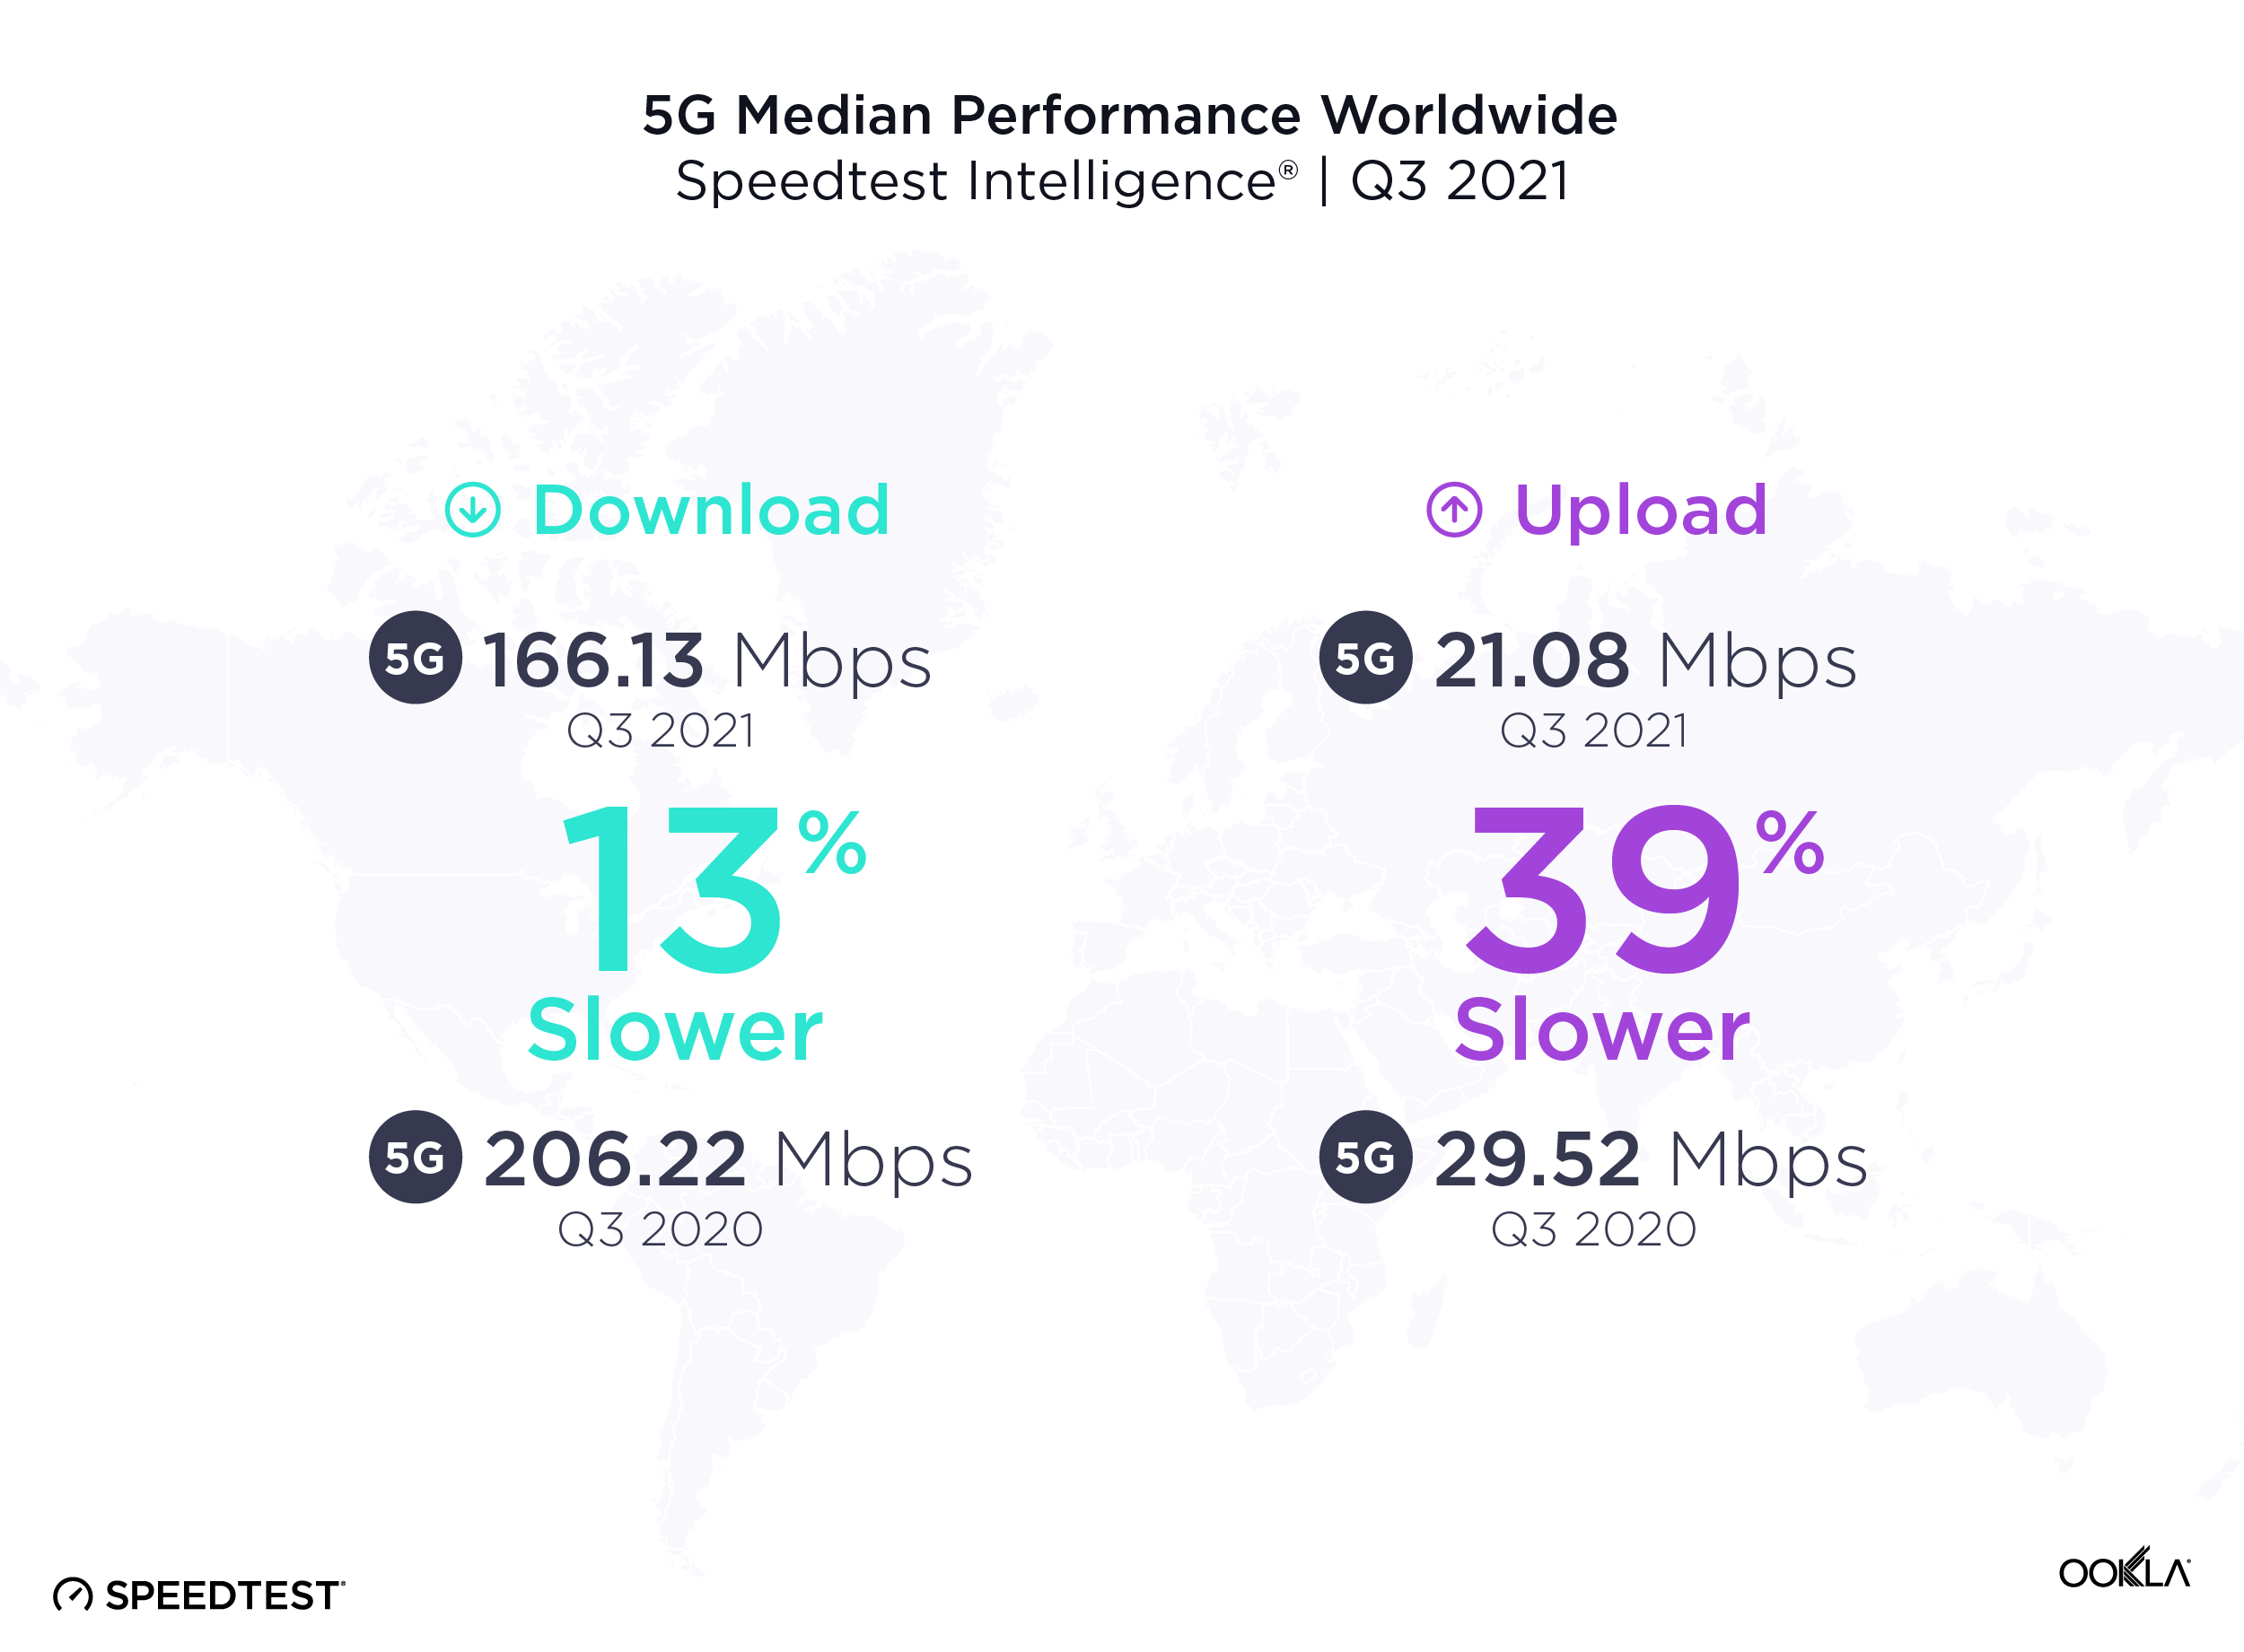
Median-Speeds-Worldwide_1221-01

It’s common to see new mobile access technologies slow down as adoption scales, particularly early on in the tech cycle. Over the past year from Q3 2020 to Q3 2021, the median global 5G download speed fell to 166.13 Mbps, down from 206.22 Mbps in Q3 2020. Median upload speed over 5G also slowed to 21.08 Mbps (from 29.52 Mbps) during the same period.

More users are logging on to existing 5G networks, and we’re also at the stage in the evolution of 5G where countries that have historically had slower speeds are starting to offer 5G. In addition, the widespread use of dynamic spectrum sharing that has been used to boost early 5G coverage weighs on 5G download speeds. While the dip in speeds looks like a letdown, it’s more of a compromise to enable broader access. With additional spectrum and further deployments slated for 2022, we anticipate speeds will begin to pick up again.

South Korea had the fastest 5G in the world

ookla_5g-download_performance_countries_1221-01-1

South Korea had the fastest median download speed over 5G during Q3 2021, leading a top 10 list that included Norway, United Arab Emirates, Saudi Arabia, Qatar, Kuwait, Sweden, China, Taiwan and New Zealand. Sweden, China, Taiwan and New Zealand were new to the top 10 in 2021 while South Africa (whose 5G was brand new last year), Spain and Hungary fell out of the top 10.

5G expanded to 13 additional countries

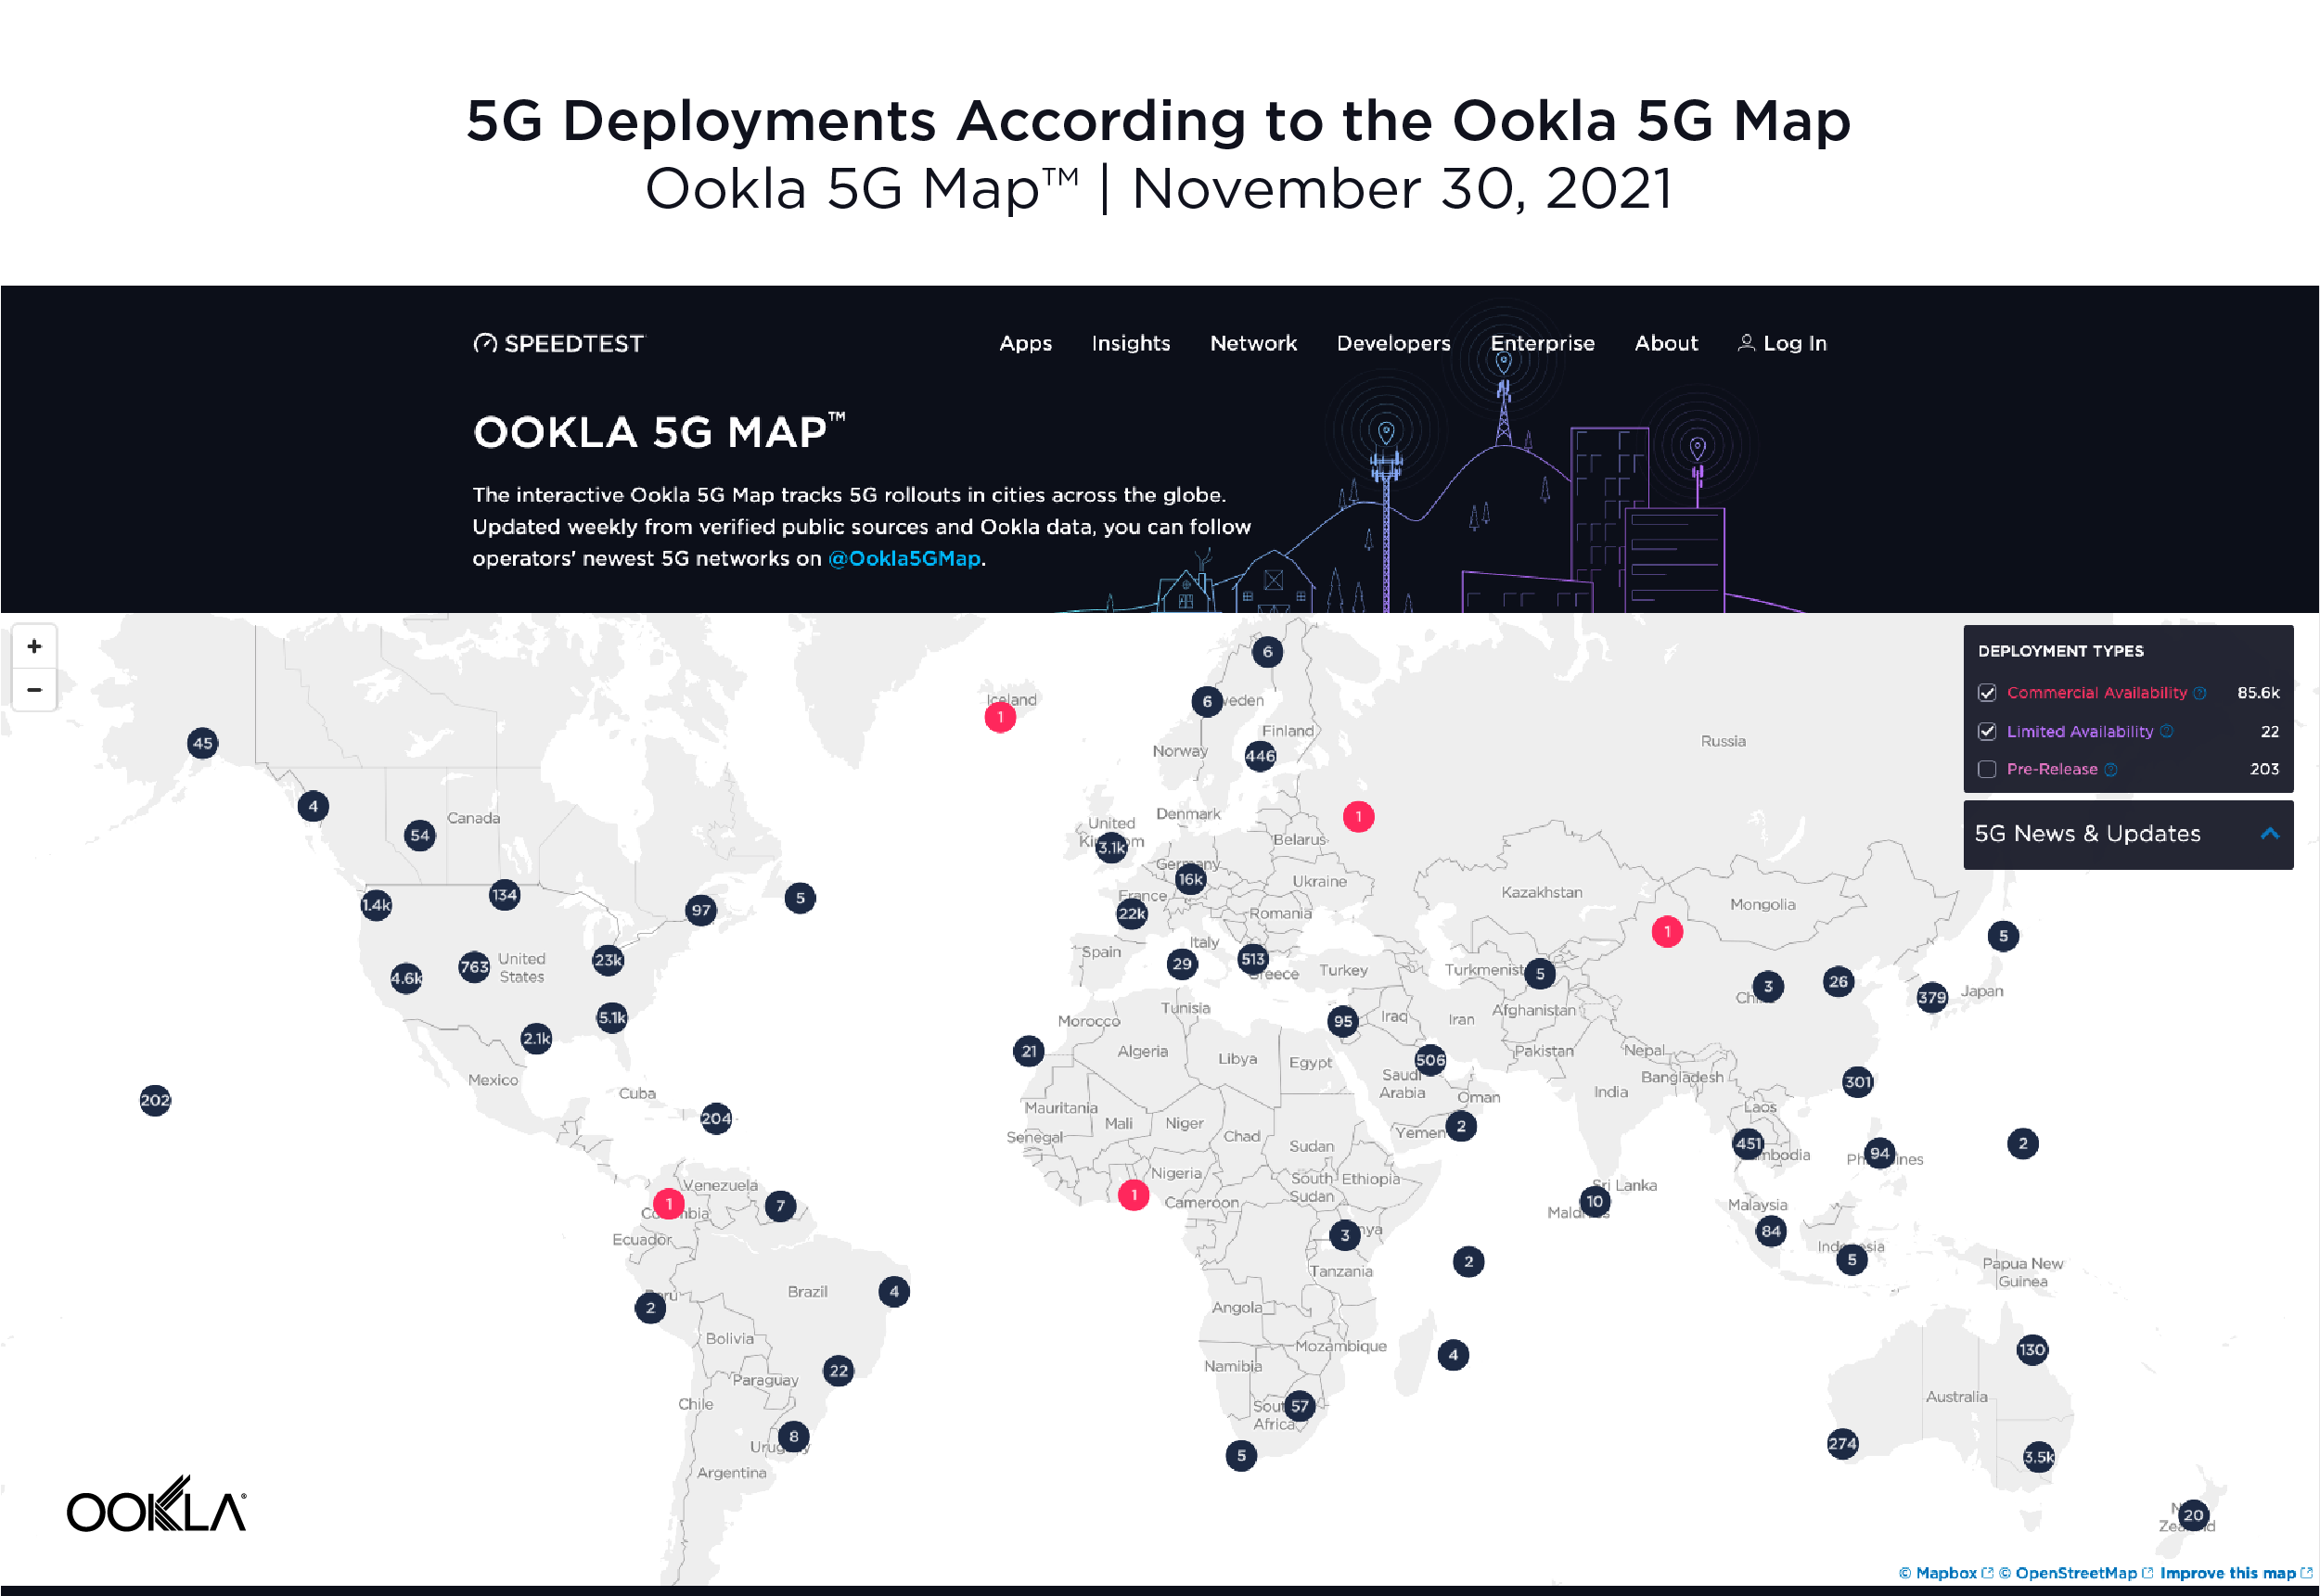
ookla_5G-map_1221-01

According to the Ookla® 5G Map, there were 5G deployments in 112 countries as of November 30, 2021. That’s up from 99 countries on the same date a year ago. The total number of deployments increased dramatically during the same time period with 85,602 deployments on November 30, 2021 compared to 17,428 on November 30, 2020, highlighting the degree to which 5G networks scaled during the year. Note that there are often multiple deployments in a given city.

Seoul and Oslo lead world capitals for 5G

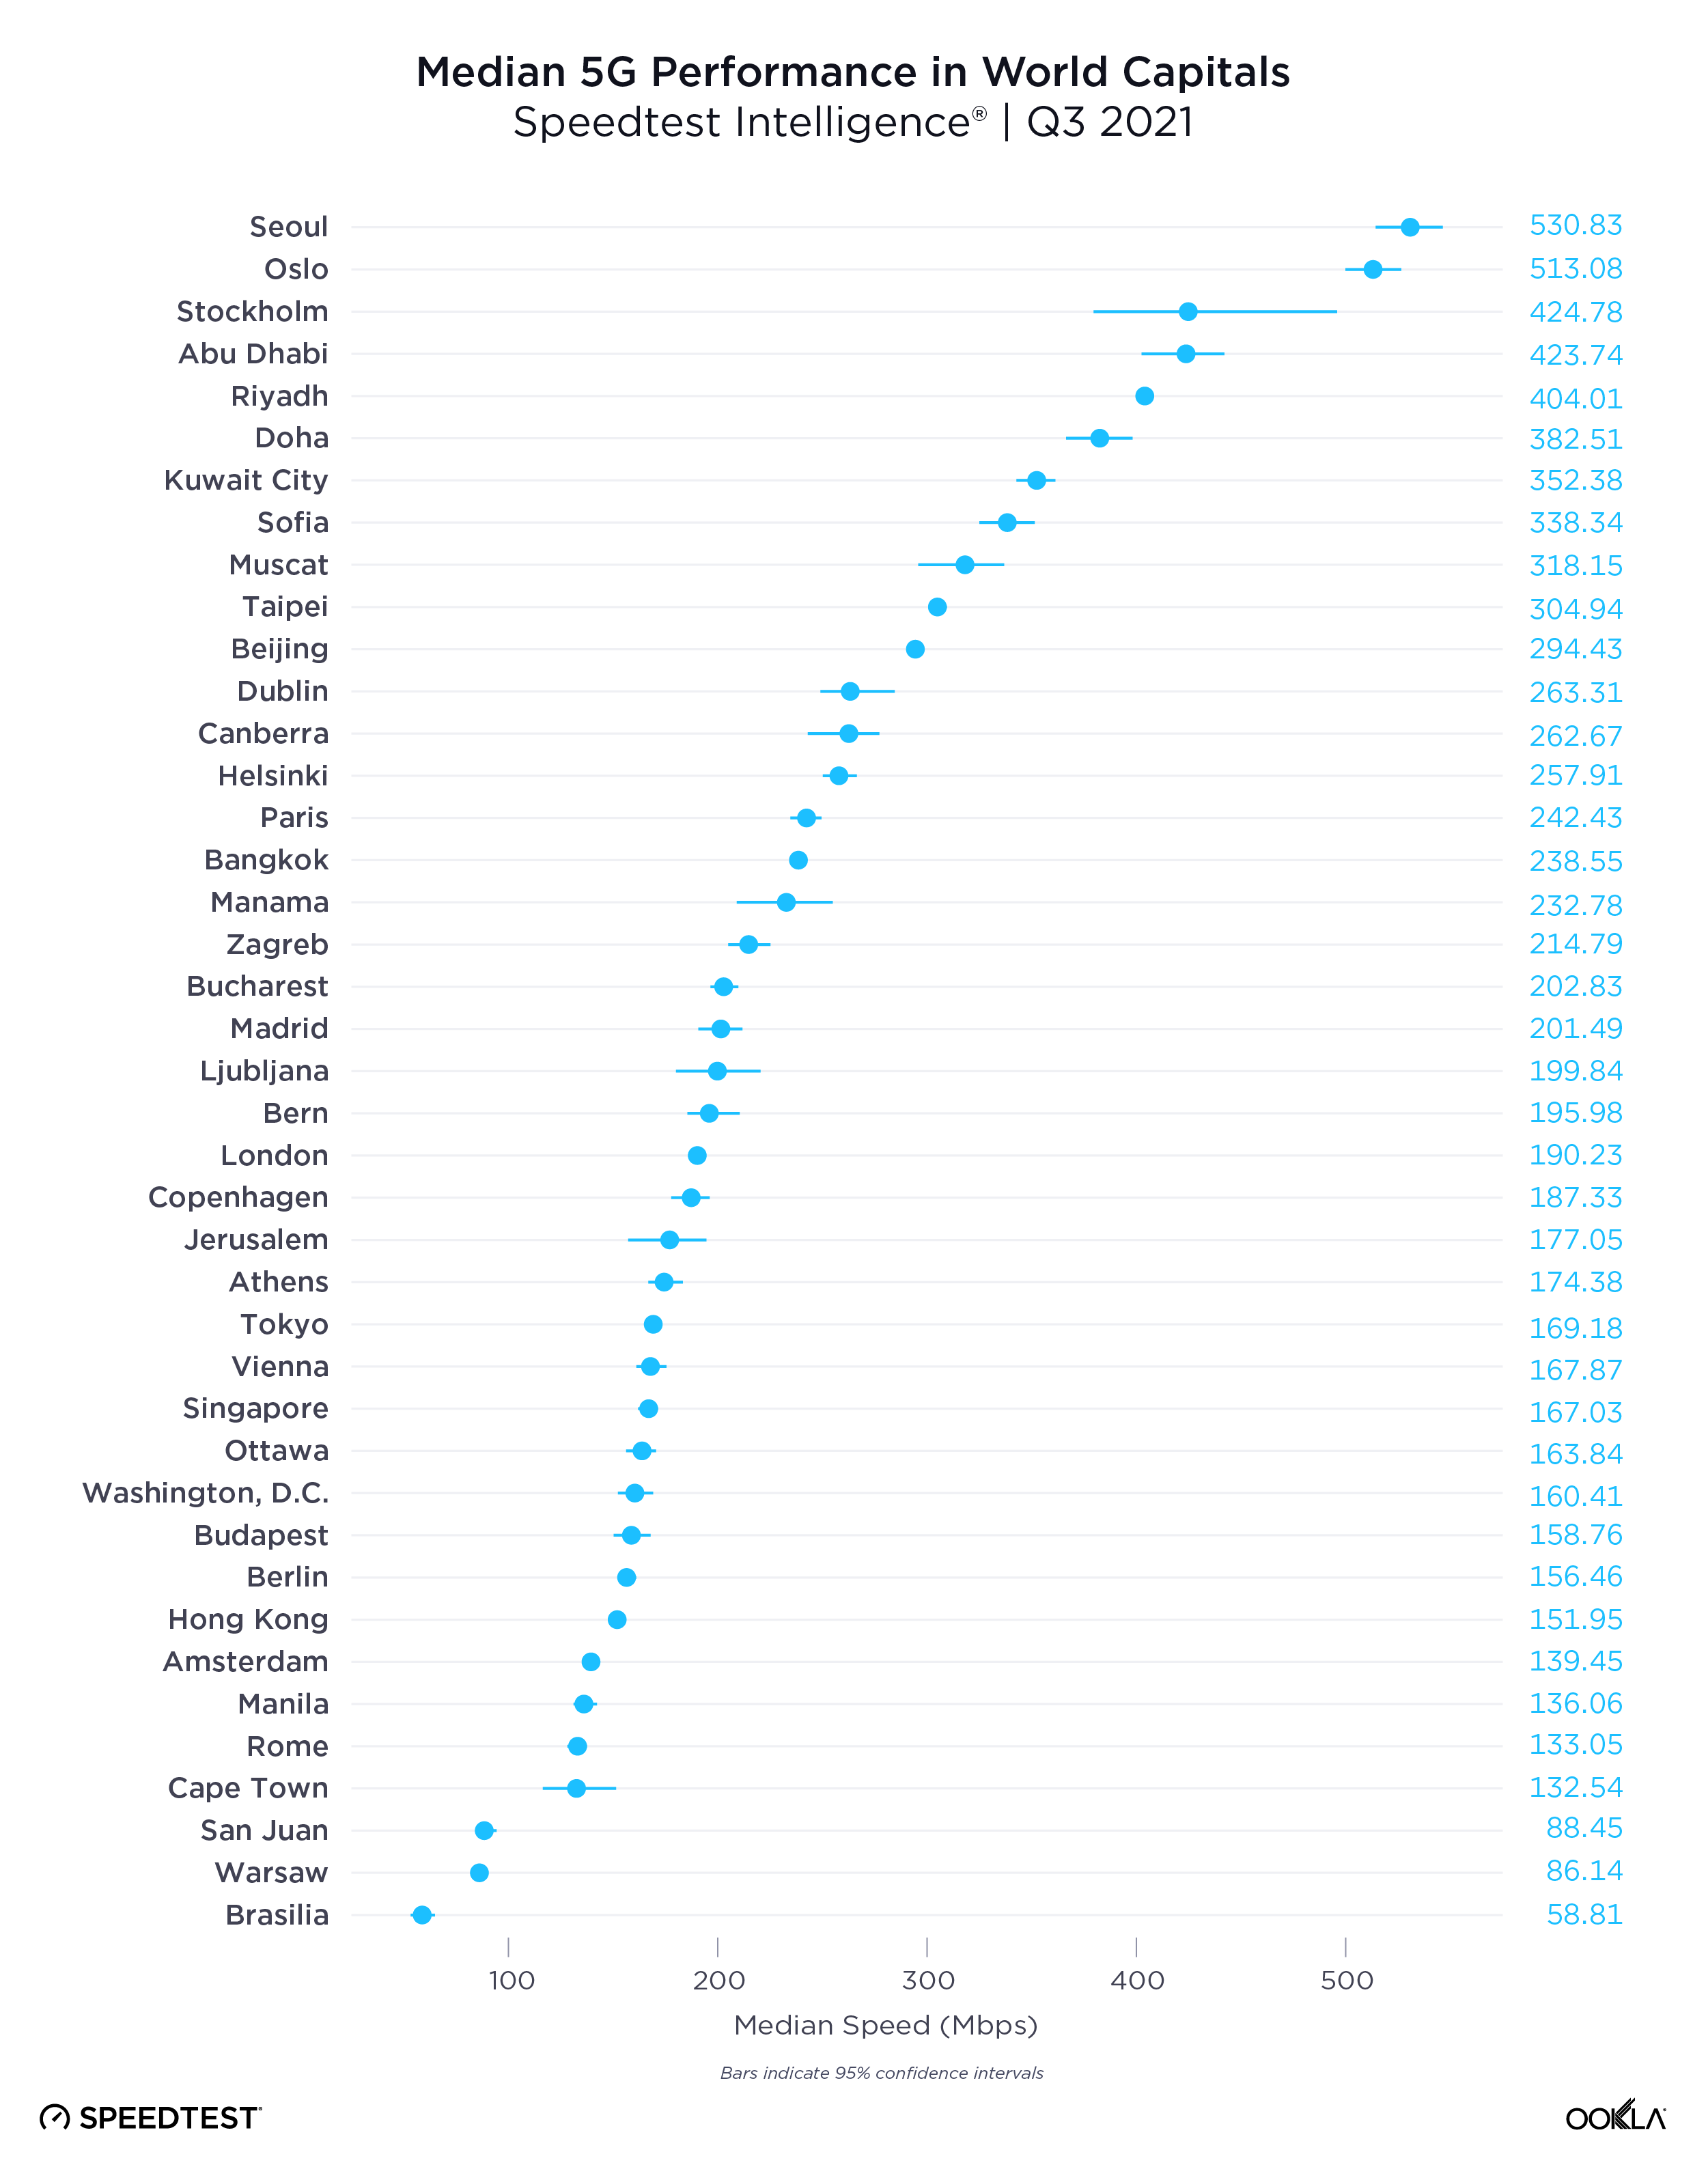
ookla_5g-download_performance_capitals_1221-01

Speedtest Intelligence data from Q3 2021 shows a wide range of median 5G speeds among global capitals. Seoul, South Korea and Oslo, Norway were in the lead with 530.83 Mbps and 513.08 Mbps, respectively; Abu Dhabi, United Arab Emirates; Riyadh, Saudi Arabia and Doha Qatar followed. Brasilia, Brazil had the slowest median download speed over 5G on our list, followed by Warsaw, Poland; Cape Town, South Africa and Rome, Italy. Stockholm, Sweden and Oslo, Norway had some of the the fastest median upload speeds over 5G at 56.26 Mbps and 49.95 Mbps, respectively, while Cape Town had the slowest at 14.53 Mbps.

The U.S. had the highest 5G Availability

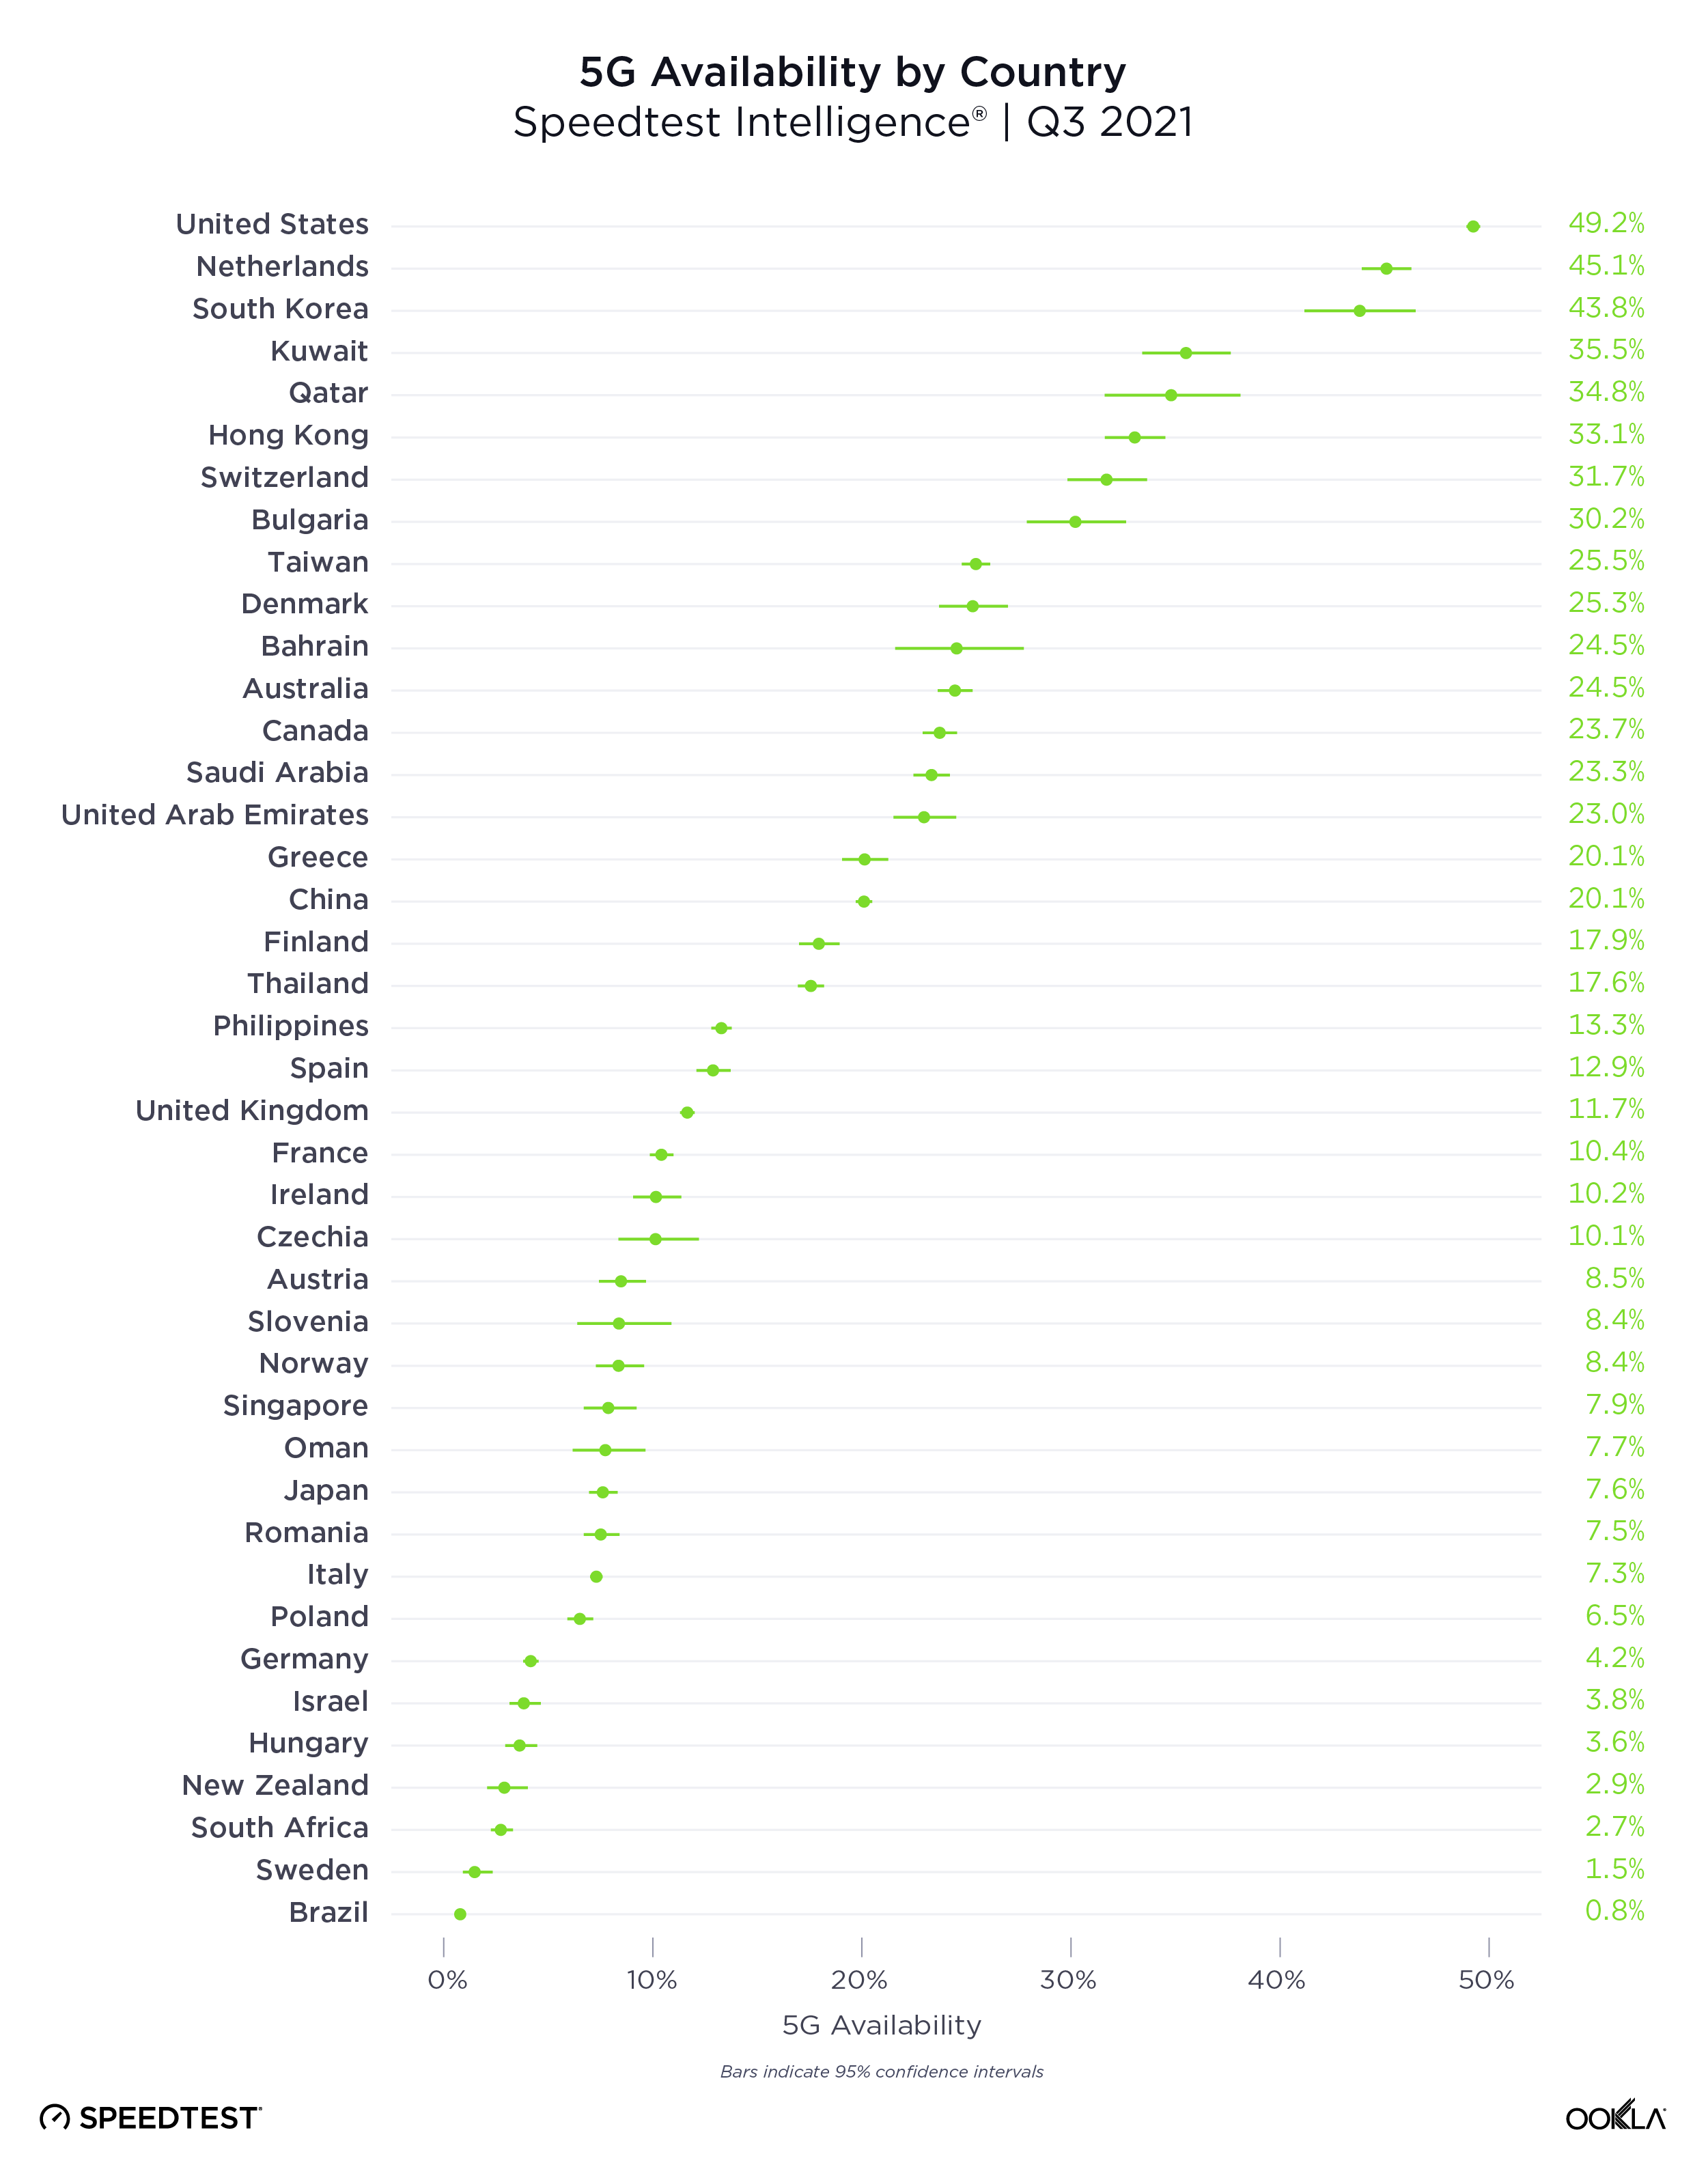
The presence of 5G is only one indicator in a market, because even in markets where 5G has launched, coverage and adoption can be pretty low. We analyzed 5G Availability to see what percent of users on 5G-capable devices spent the majority of their time on 5G, both roaming and on-network during Q3 2021.

ookla_5g-availability_countries_1221-01

The United States had the highest 5G Availability at 49.2%, followed by the Netherlands (45.1%), South Korea (43.8%), Kuwait (35.5%) and Qatar (34.8%). Brazil had the lowest 5G Availability on our list at 0.8%, followed by Sweden (1.5%), South Africa (2.7%), New Zealand (2.9%) and Hungary (3.6%).

Not all 5G networks are created equal

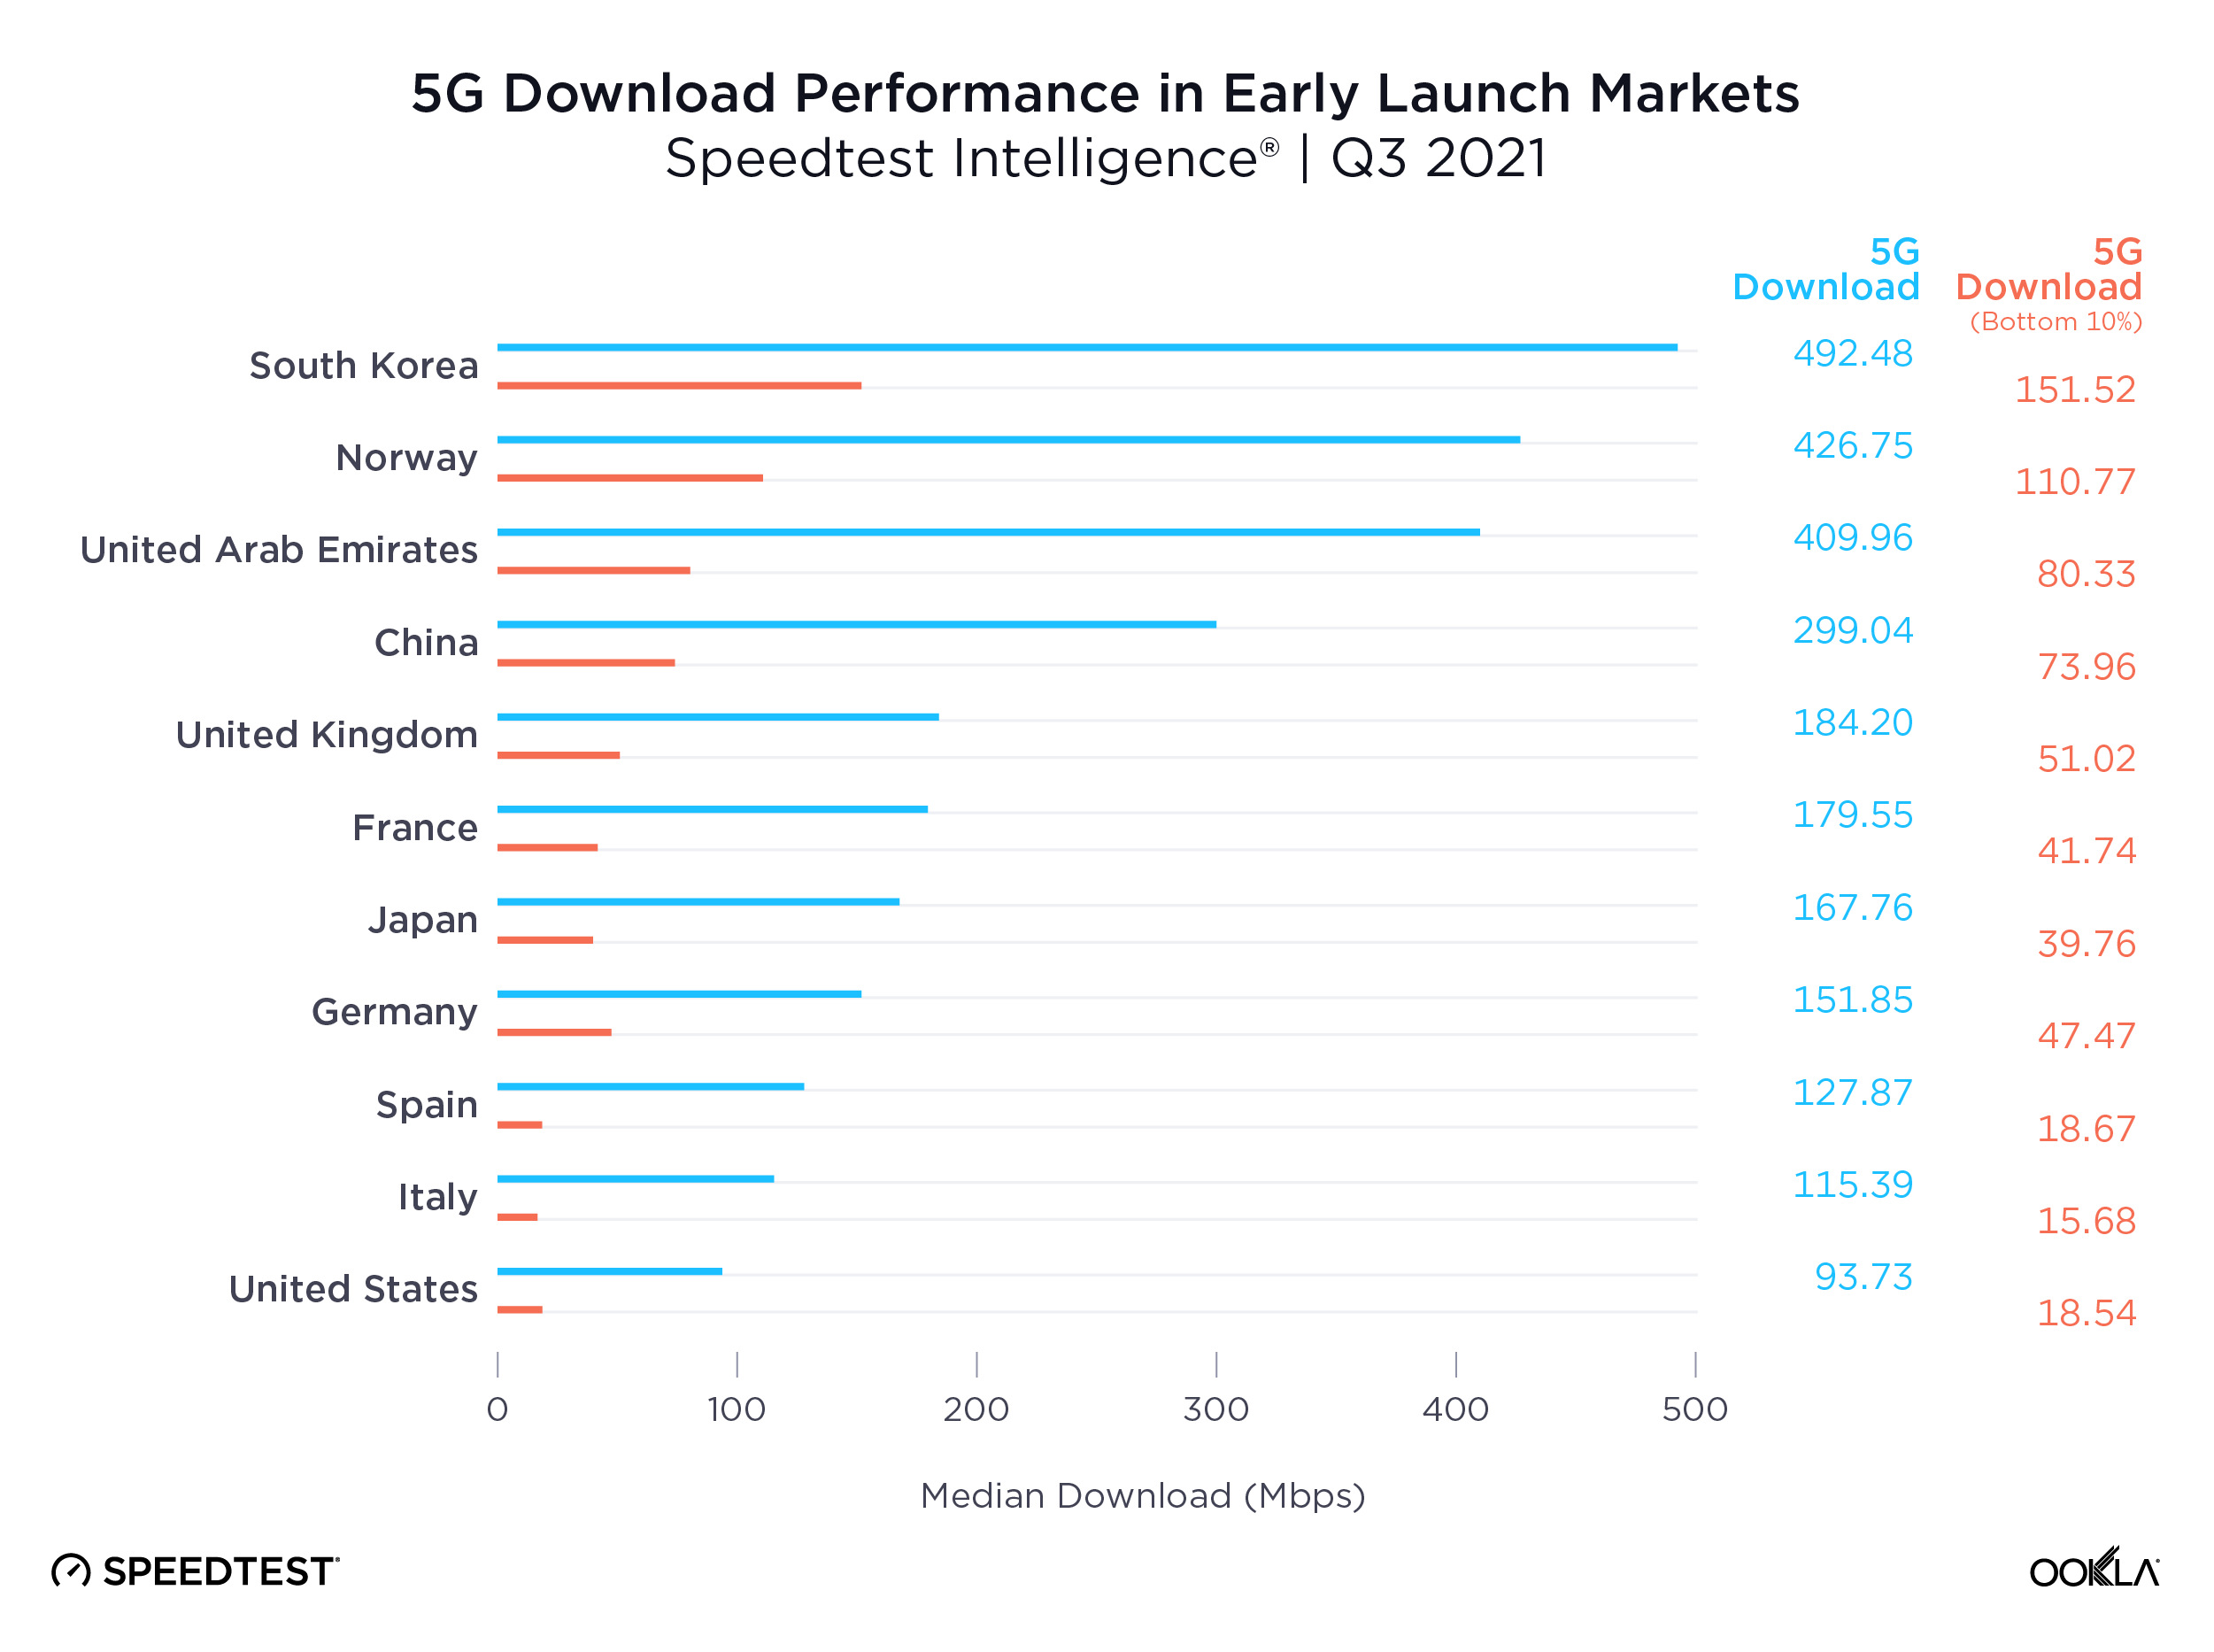
Ookla Speedtest Intelligence data shows a growing disparity in the performance of 5G networks worldwide, even among the pioneer markets who were among the first to launch the new technology. We see leading markets such as South Korea, Norway, the UAE and China pulling well ahead of key European markets, the U.S. and Japan on 5G download speeds, creating what increasingly looks like two tiers of 5G markets.

ookla_5g-download_performance_1221-01

Part of the reason for this divergence is access to key 5G spectrum bands, with Verizon and AT&T in the U.S. for example, soon to deploy their C-band spectrum holdings for 5G use. However, what really seems to separate these markets is the level of 5G network densification. The number of people per 5G base station ranges from 319 in South Korea and 1,531 in China, to 4,224 in the EU and 6,590 in the US, according to the European 5G Observatory’s International Scoreboard during October 2021.

Despite the noise around 6G, 5G still has a long way to run

Median 5G mobile download speeds across these markets are respectable relative to the International Telecommunication Union’s (ITU) IMT-2020 target of 100 Mbps for user experienced download data rates. However, 5G Speedtest® results in each market demonstrate significant variability, with the bottom 10th percentile only recording speeds in excess of the IMT-2020 target in South Korea and Norway, and falling significantly short in many other markets, with Spain, Italy and the U.S. below 20 Mbps.

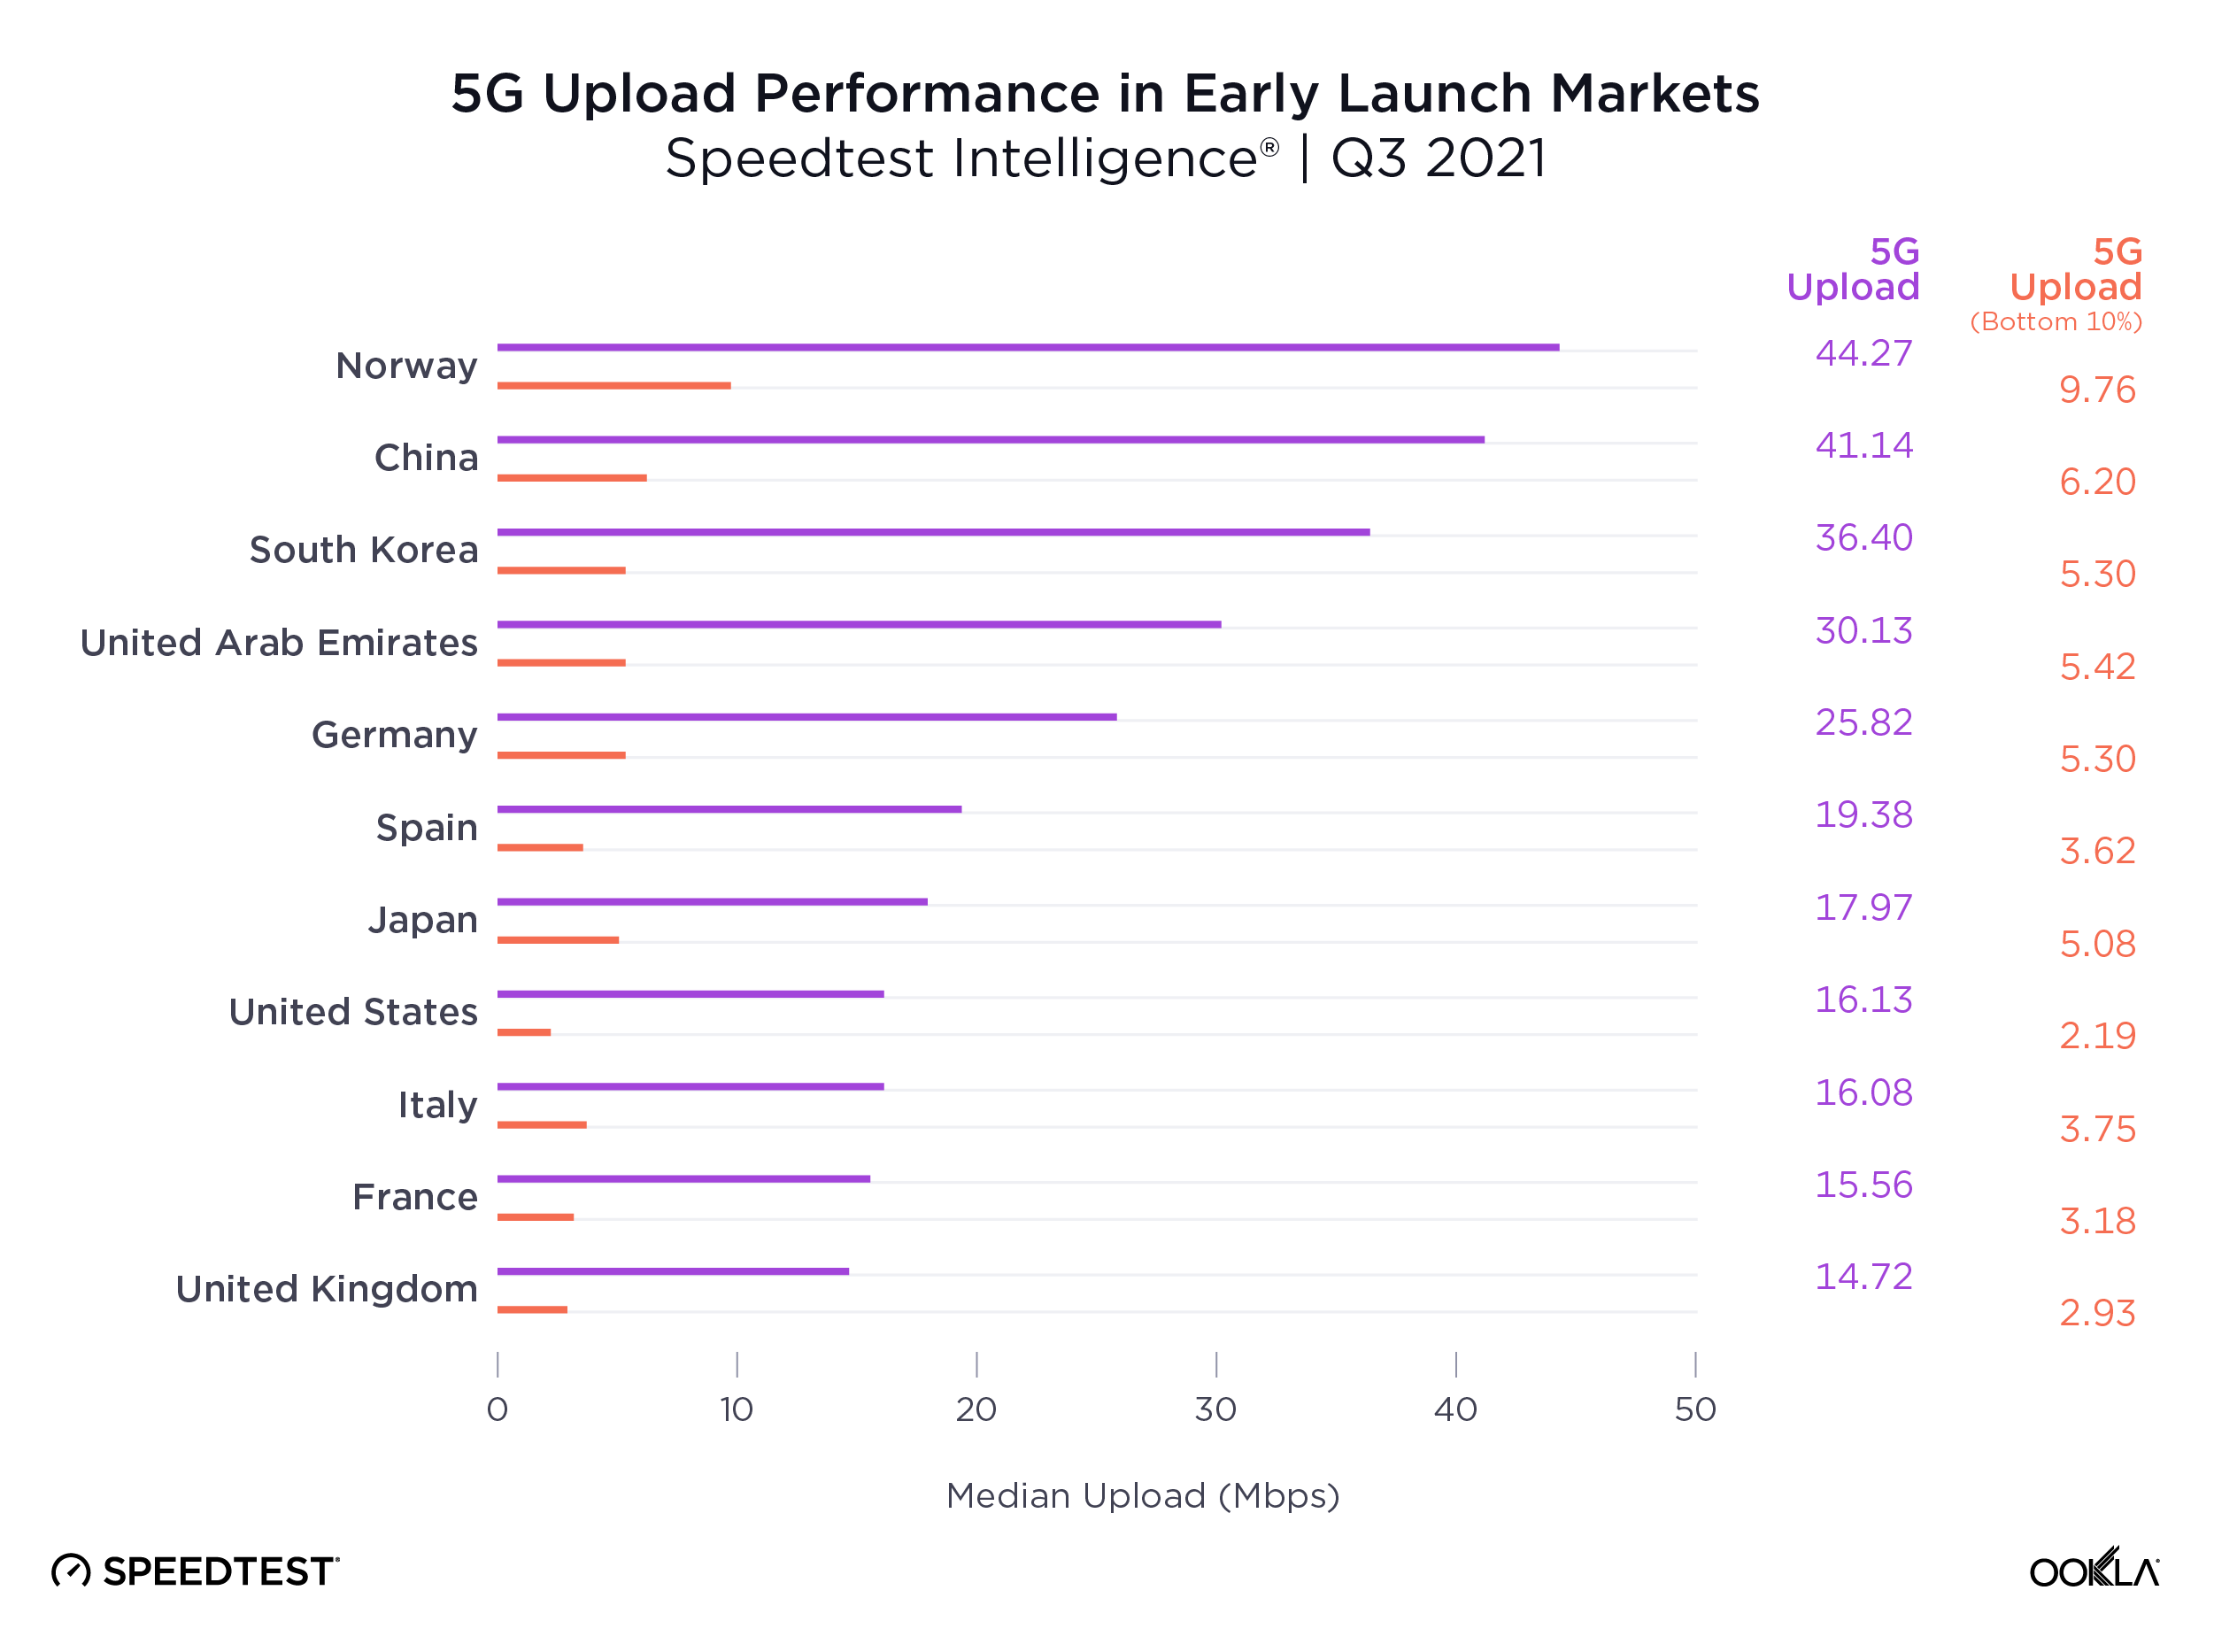
The story gets worse for upload speeds, where no market’s median speed broke the IMT-2020 recommended 50 Mbps, and where the bottom 10th percentile lay in single digits across the board. Operators are clearly prioritizing download speeds over upload, which makes sense given the asymmetric nature of demand, with most consumer applications requiring higher download speeds. However, as operators increasingly look to target the enterprise market with 5G connectivity and consumer demand for services such as video calling and mobile gaming continues to rise, operators will need to boost upload speeds.

ookla_5g-upload_performance_1221-01-1

Demand for mobile internet bandwidth continues to grow, up 43% year-on-year in Q3 2021 according to Ericsson’s latest mobility report. Looking ahead to 2022, operators will need to increase the capacity of their 5G networks to tackle this growing demand while driving network speeds to new heights. We’ve seen the impact the deployment of new spectrum can have on congested networks during 2021, with Reliance Jio witnessing a bump in 4G LTE performance and consumer sentiment following its acquisition of additional spectrum in India.

Where 5G still fails to reach

Speedtest Intelligence showed 70 countries in the world where more than 20% of samples were from 2G and 3G connections (combined) during Q3 2021 and met our statistical threshold to be included. These are mostly countries where 5G is still aspirational for a majority of the population. As excited as we are about the expansion of 5G, we do not want to see these countries left behind. Not only are 2G and 3G decades old, they are only sufficient for basic voice and texting, social media and navigation apps. To deliver rich media experiences or video calling, users need access to 4G or higher. Having so many consumers on 2G and 3G also prevents mobile operators from refarming that spectrum to make 4G and 5G networks more efficient.

Countries That Still Rely Heavily on 2G and 3G Connections
Speedtest IntelligenceⓇ | Q3 2021
Country 2G & 3G Samples
Central African Republic 89.9%
Palestine 84.7%
Yemen 72.4%
Turkmenistan 71.8%
Micronesia 56.3%
Madagascar 55.0%
Belarus 53.2%
Rwanda 51.7%
Kiribati 48.4%
Equatorial Guinea 47.6%
Afghanistan 44.4%
South Sudan 43.4%
Guyana 42.3%
Guinea 37.0%
Angola 36.8%
Cape Verde 35.9%
Tajikistan 35.6%
Zimbabwe 34.7%
Benin 34.4%
Togo 33.8%
Ghana 33.0%
Sierra Leone 31.7%
Antigua and Barbuda 30.2%
Vanuatu 30.1%
Lesotho 30.0%
Syria 29.6%
Moldova 29.4%
Saint Kitts and Nevis 28.9%
Mozambique 28.8%
Sudan 28.4%
Palau 28.3%
Grenada 28.1%
Tanzania 27.6%
Uganda 27.5%
Niger 27.5%
Gabon 27.5%
Haiti 27.4%
Suriname 27.4%
Tonga 27.3%
Liberia 27.0%
Namibia 26.7%
Swaziland 26.5%
The Gambia 26.3%
Saint Vincent and the Grenadines 26.3%
Dominica 26.3%
Somalia 26.1%
Cook Islands 26.0%
Zambia 25.9%
Barbados 25.7%
Armenia 25.5%
Algeria 25.4%
Papua New Guinea 25.2%
Jamaica 24.5%
Venezuela 24.2%
Ethiopia 24.1%
Uzbekistan 24.0%
El Salvador 23.5%
Honduras 23.1%
Nigeria 23.0%
Solomon Islands 22.8%
Caribbean Netherlands 22.7%
Botswana 22.3%
Anguilla 21.7%
Mauritania 20.6%
Saint Lucia 20.5%
Bosnia and Herzegovina 20.3%
Burundi 20.3%
Ecuador 20.2%
Ukraine 20.1%
Trinidad and Tobago 20.0%

We were pleased to see the following countries come off the list from last year, having dropped below the 20% threshold: Azerbaijan, Bangladesh, Belize, Burkina Faso, Cameroon, Costa Rica, Côte d’Ivoire, DR Congo, Iraq, Kenya, Laos, Libya, Maldives, Mali, Mauritius, Mongolia, Nicaragua, Paraguay and Tunisia. While countries like Palestine, Suriname, Ethiopia, Haiti and Antigua and Barbuda are still on this list, they have improved the percentage of their samples on these outmoded technologies when compared to last year (dropping 10-15 points, respectively), 2G and 3G samples in Belarus increased 6.7 points when comparing Q3 2021 to Q3 2020.

We’re excited to see how performance levels will normalize as 5G expands to more and more countries and access improves. Keep track of how well your country is performing on Ookla’s Speedtest Global Index.

Ookla retains ownership of this article including all of the intellectual property rights, data, content graphs and analysis. This article may not be quoted, reproduced, distributed or published for any commercial purpose without prior consent. Members of the press and others using the findings in this article for non-commercial purposes are welcome to publicly share and link to report information with attribution to Ookla.
| May 2, 2022

Introducing Speedtest Maps™ for iOS

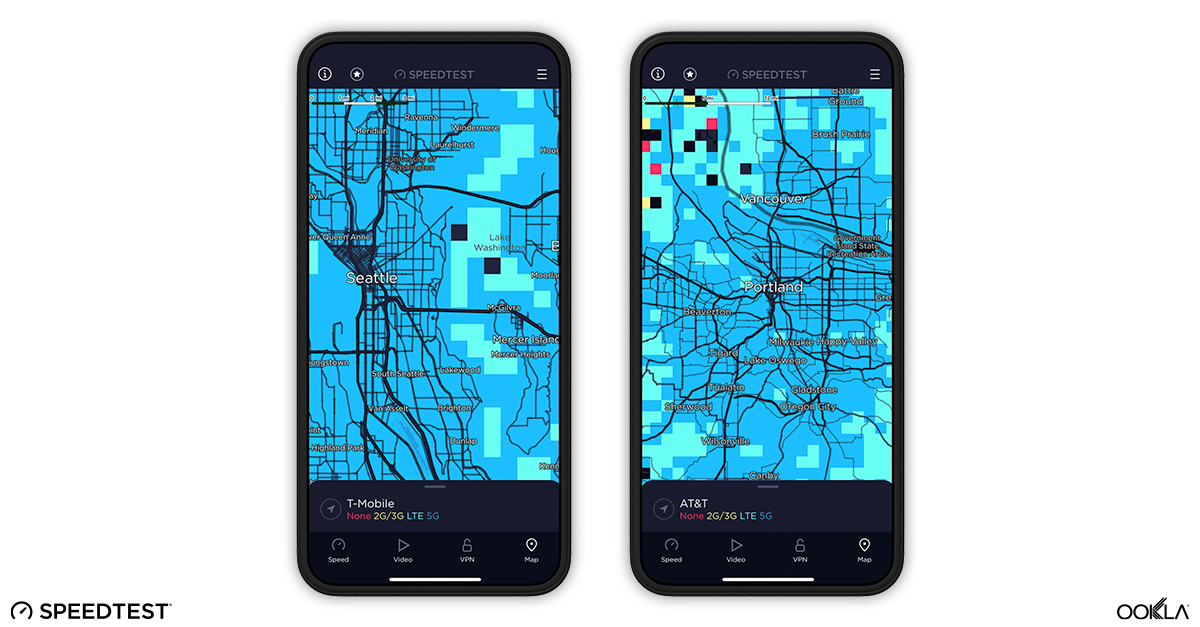
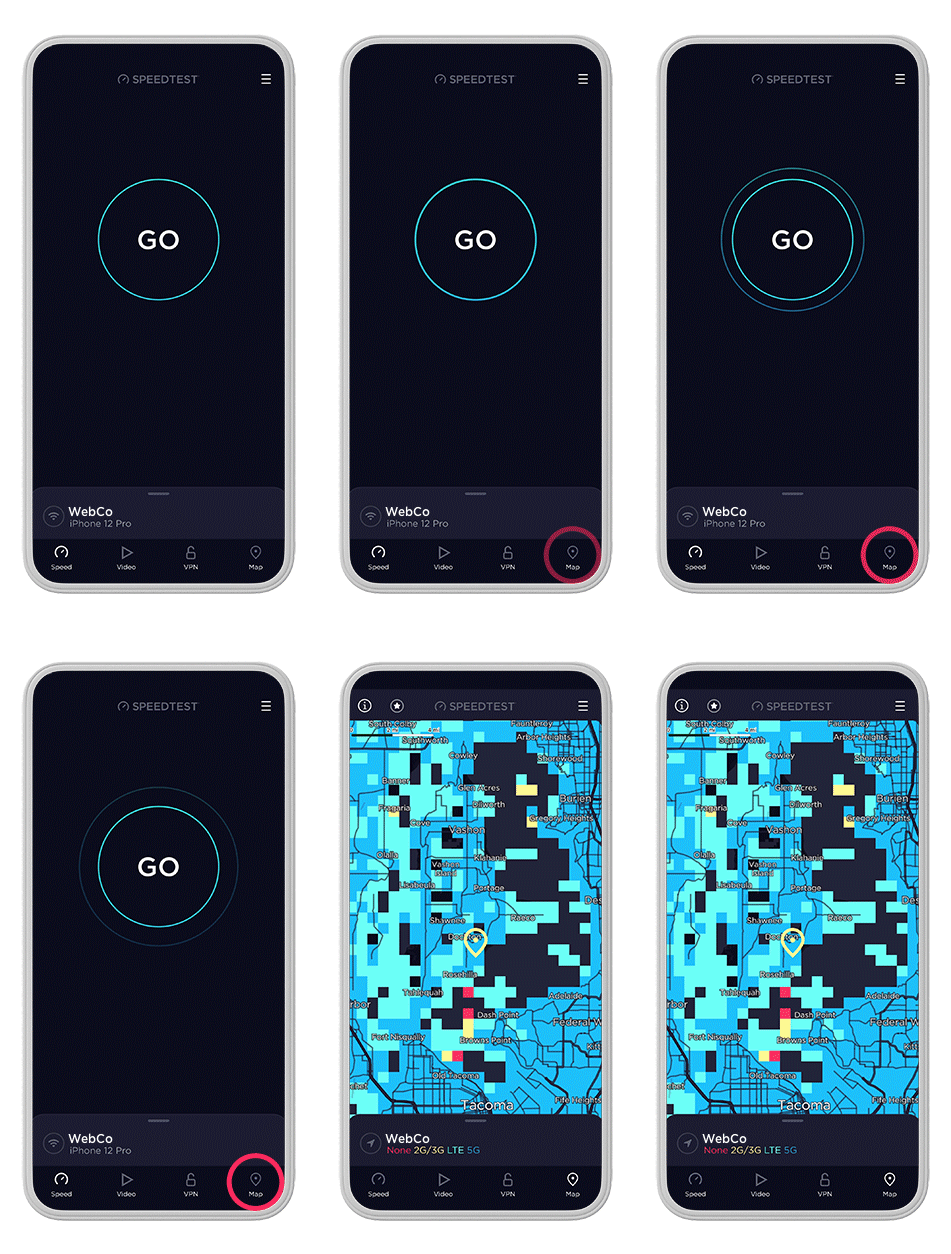
You asked and we listened. Speedtest® fans who use Apple devices have long been requesting access to our Maps feature, and we are happy to report that this feature is now available for Android and iOS. So if you’ve been looking for a map of coverage that highlights which mobile providers have what level of service in the areas that matter most to you, open your Speedtest app today and check out the tab marked “Maps.”

How Speedtest Maps help you

Two Maps Side by Side

Speedtest Maps give you access to information about where you will and will likely not have access to different levels of service in a particular area. For example:

  • If you’re looking to use your brand new 5G phone on an upcoming vacation, you can check the map to see if your operator had 5G service in that location.
  • If you consistently find yourself dropping calls in the same spot on your daily walk, you can check our map to see if others who use the same provider are experiencing the same thing in the same area. Then you can take that information to your operator to ask them to improve service in that area.
  • If you’re looking to change operators, you can check to see who has the kind of service you need in the locations you visit most often.

Find and use your Speedtest Map today

If you already have Speedtest on your mobile device, you now have access to Speedtest Maps for both Android and iOS for free within our existing app. If you don’t see the Maps tab in the bottom right of your screen with the map open, simply update the app. And if you don’t have the Speedtest app, download it today for Android or iOS.

Explore maps for a variety of providers

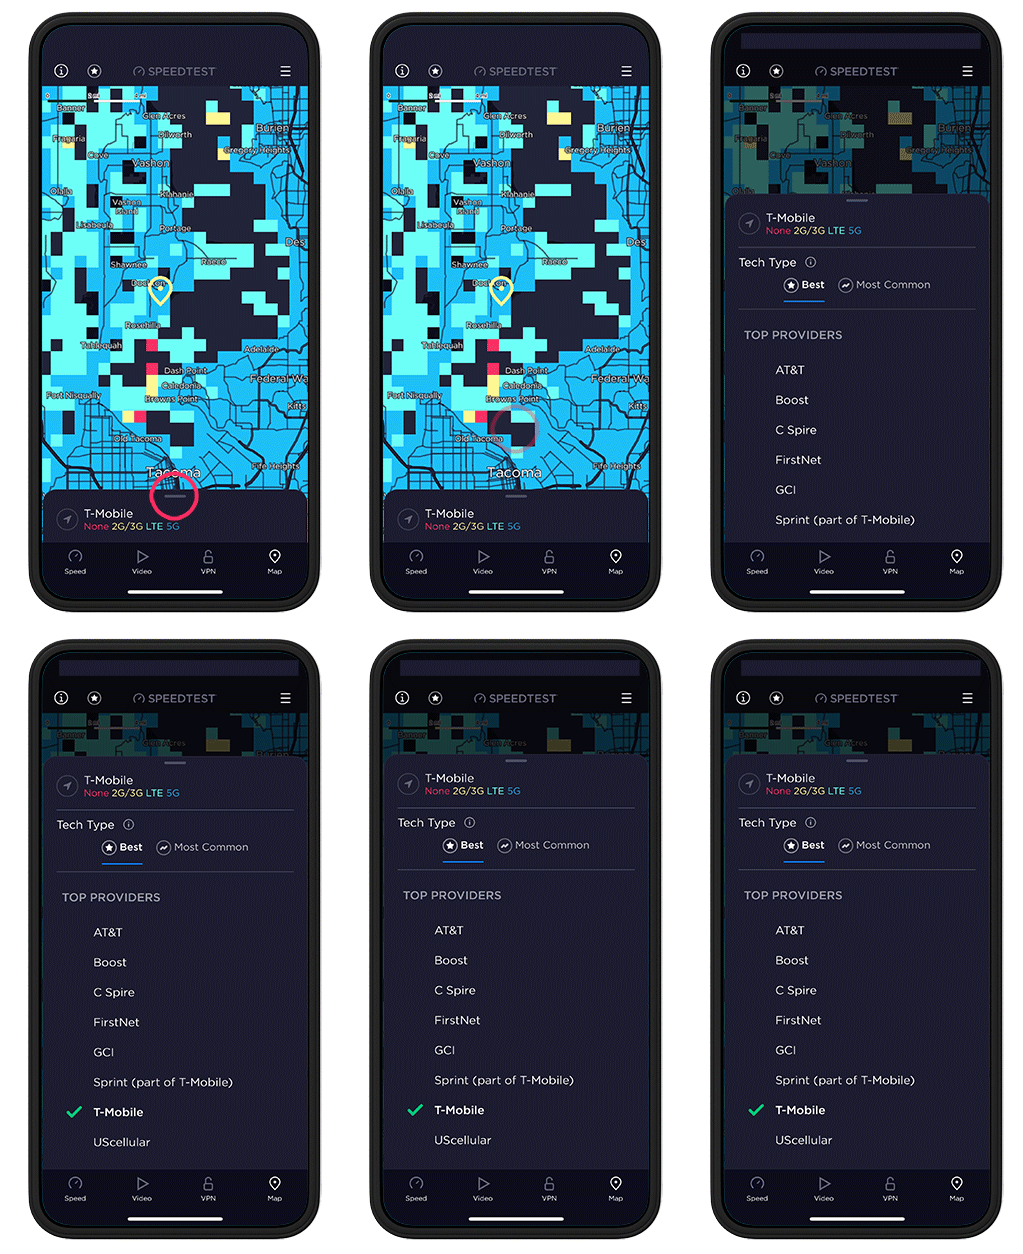
Carrier Selection

Slide the bar up to select which provider you want to see detailed information for using the slider within the Map. You can use this to compare the service you’re subscribed to with that of other operators.

Access details on the best tech type available and the most common

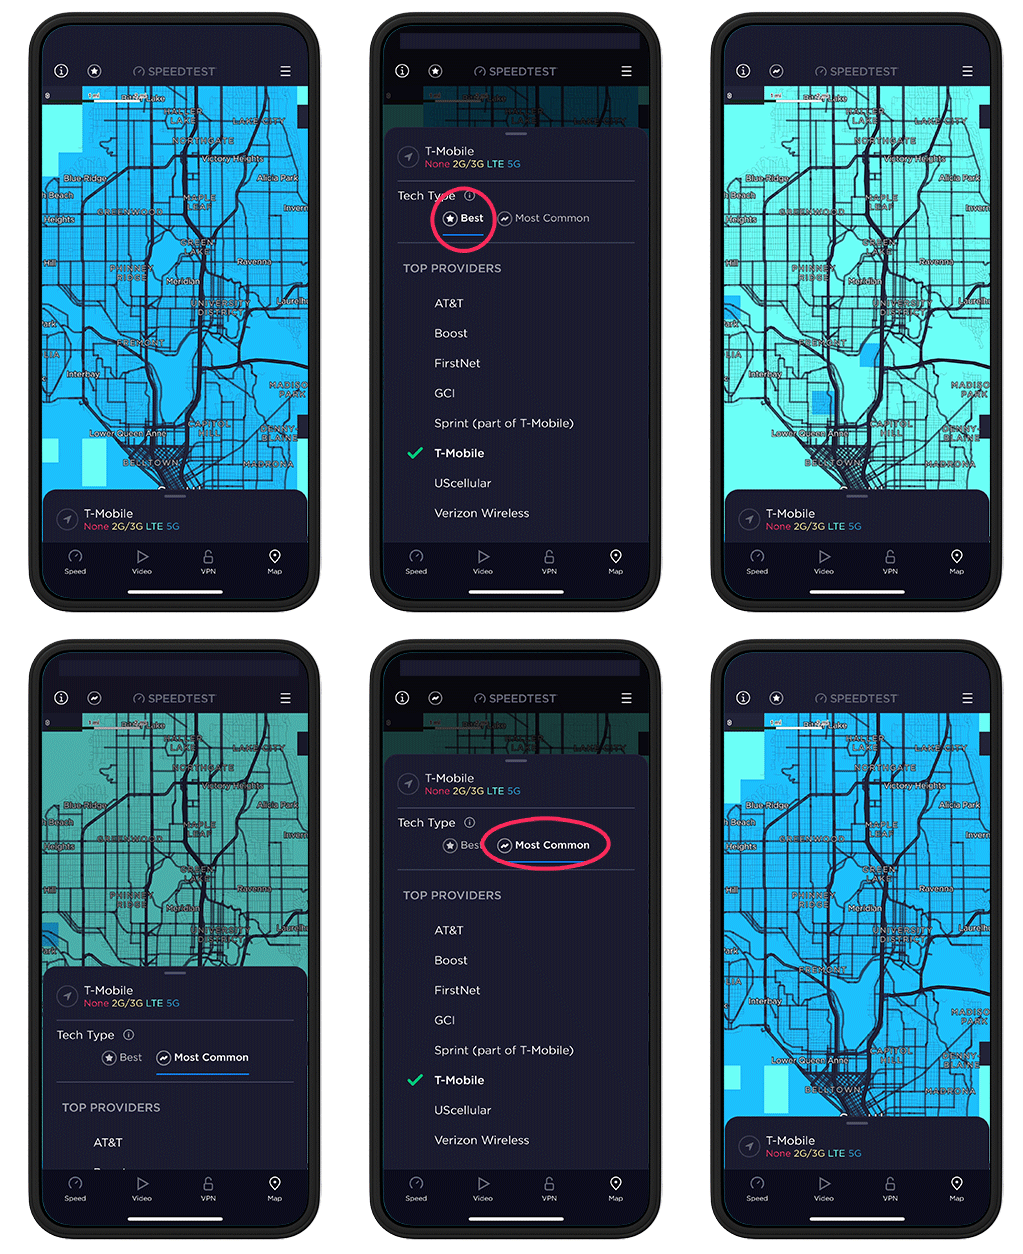
Tech Type Selection

Use the bar at the top of the slider to choose whether you want to see the best available technology in an area or the most common. For example, there may be some 5G available in a certain area (Best) but LTE might be the “most common” tech type you’ll find there. The most common technology type layer in Speedtest Maps shows the technology type we saw at that location most frequently across all device types. This includes devices that are incapable of connecting to a 5G network (devices that support only 2G, 3G, and 4G LTE). If you are measuring whether 5G is available, use the “Best” layer.

Speedtest Maps are built using data from consumers who have opted in to location sharing in the Speedtest app. If you’d like to add valuable data to the maps and help to improve the feature, turn on location sharing in the settings of your device.

Our mission at Ookla is to empower consumers across the globe to understand and optimize their internet experience. Access to Speedtest Maps helps you find detailed information on coverage in the locations that matter most to you. Open the Speedtest app on your mobile device to check your map today or download Speedtest for Android or iOS.

Editor’s note: This article was updated on May 20 to clarify the uses of the “Best” and “Most Common” layers.

Ookla retains ownership of this article including all of the intellectual property rights, data, content graphs and analysis. This article may not be quoted, reproduced, distributed or published for any commercial purpose without prior consent. Members of the press and others using the findings in this article for non-commercial purposes are welcome to publicly share and link to report information with attribution to Ookla.
| December 2, 2024

Too Big to Fail? The Largest Outages in 2024 According to Downdetector

Our reliance on technology is so total that for many it feels like the world is ending when a popular site or service on the internet is inaccessible, and 2024 saw many outages that reminded us how much one such interruption can disrupt the daily lives of millions. We analyzed Downdetector® data from Q1-Q3 2024 to see where that pain of disconnection was felt most acutely. Read on to revisit the largest outages of 2024 at a global level and sorted by region.

Note that while some companies experienced more than one large outage during this time period, we’ve listed only the largest incident per company in each chart.

The world’s biggest outages this year

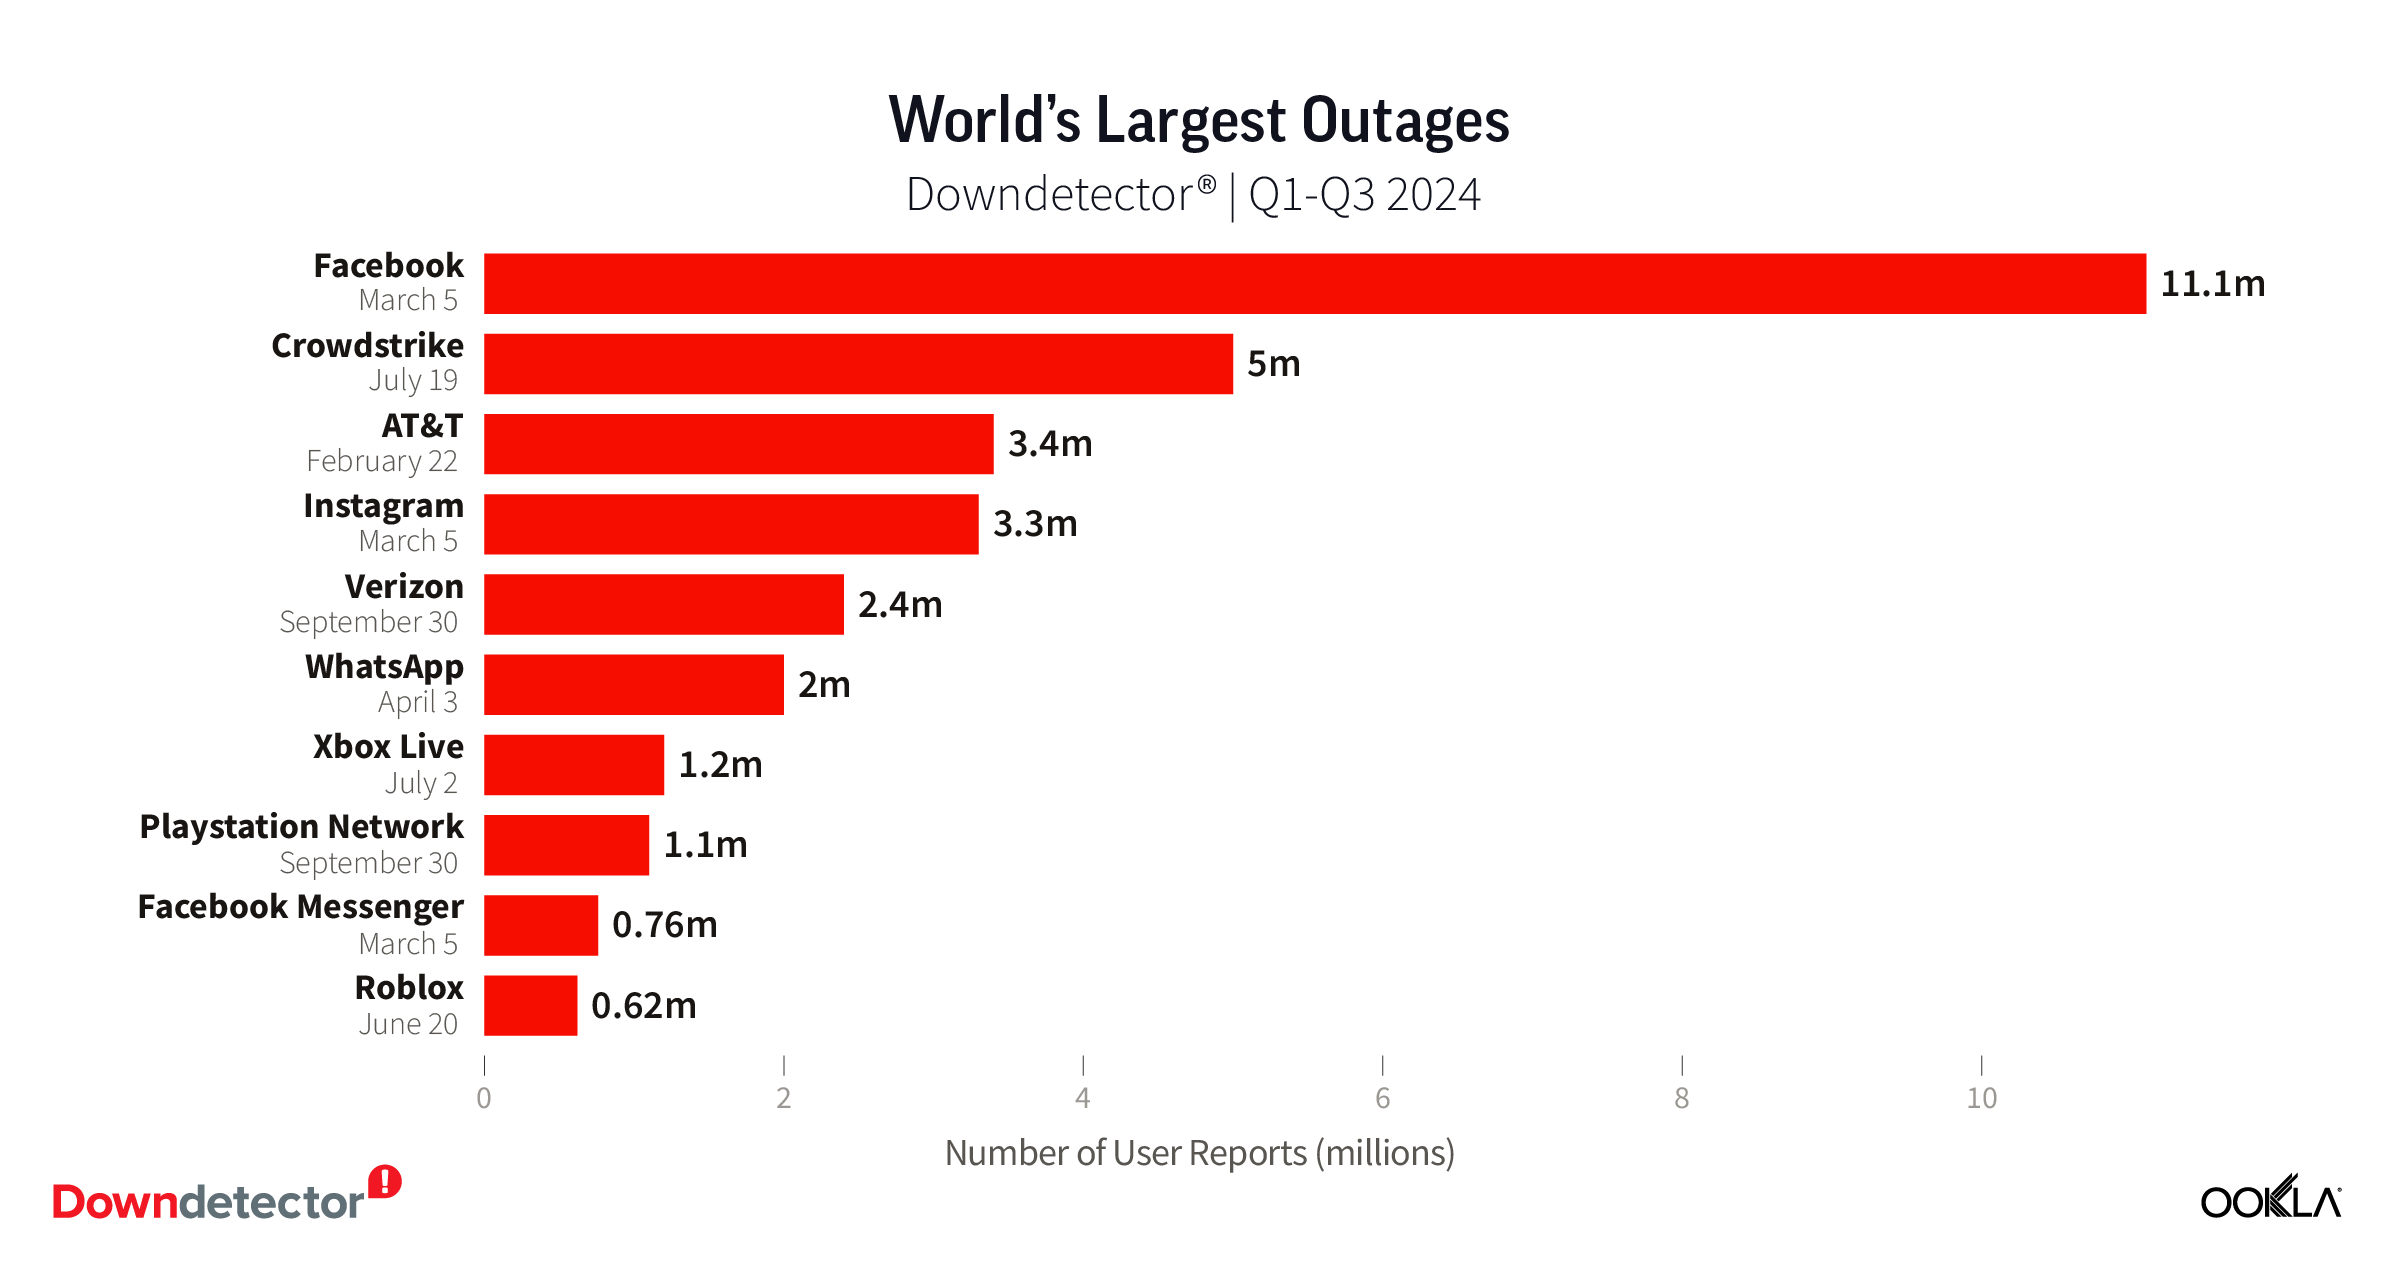
Chart of World's Largest Outage i, Downdetector, Q1-Q3 2024

Users of social media sites, internet providers, and gaming sites and services suffered the most disruptions this year according to Downdetector data on the world’s biggest outages. Facebook had the largest outage on our list. On March 5, over 11.1 million people across the world reported issues with the popular social media site.

The second largest global outage may be the most memorable. While CrowdStrike is not a service most people think of, we saw nearly 5 million reports to services that rely on it (or rely on Microsoft which relies on Crowdstrike), including emergency services, airlines, and ride sharing apps when a routine software update went bad on July 19.

AT&T suffered the third largest outage in the world, according to Downdetector data, when an equipment configuration error caused customers across the entire United States to lose network access for over 12 hours.

Biggest outages in each region

Asia Pacific region hit by global outages

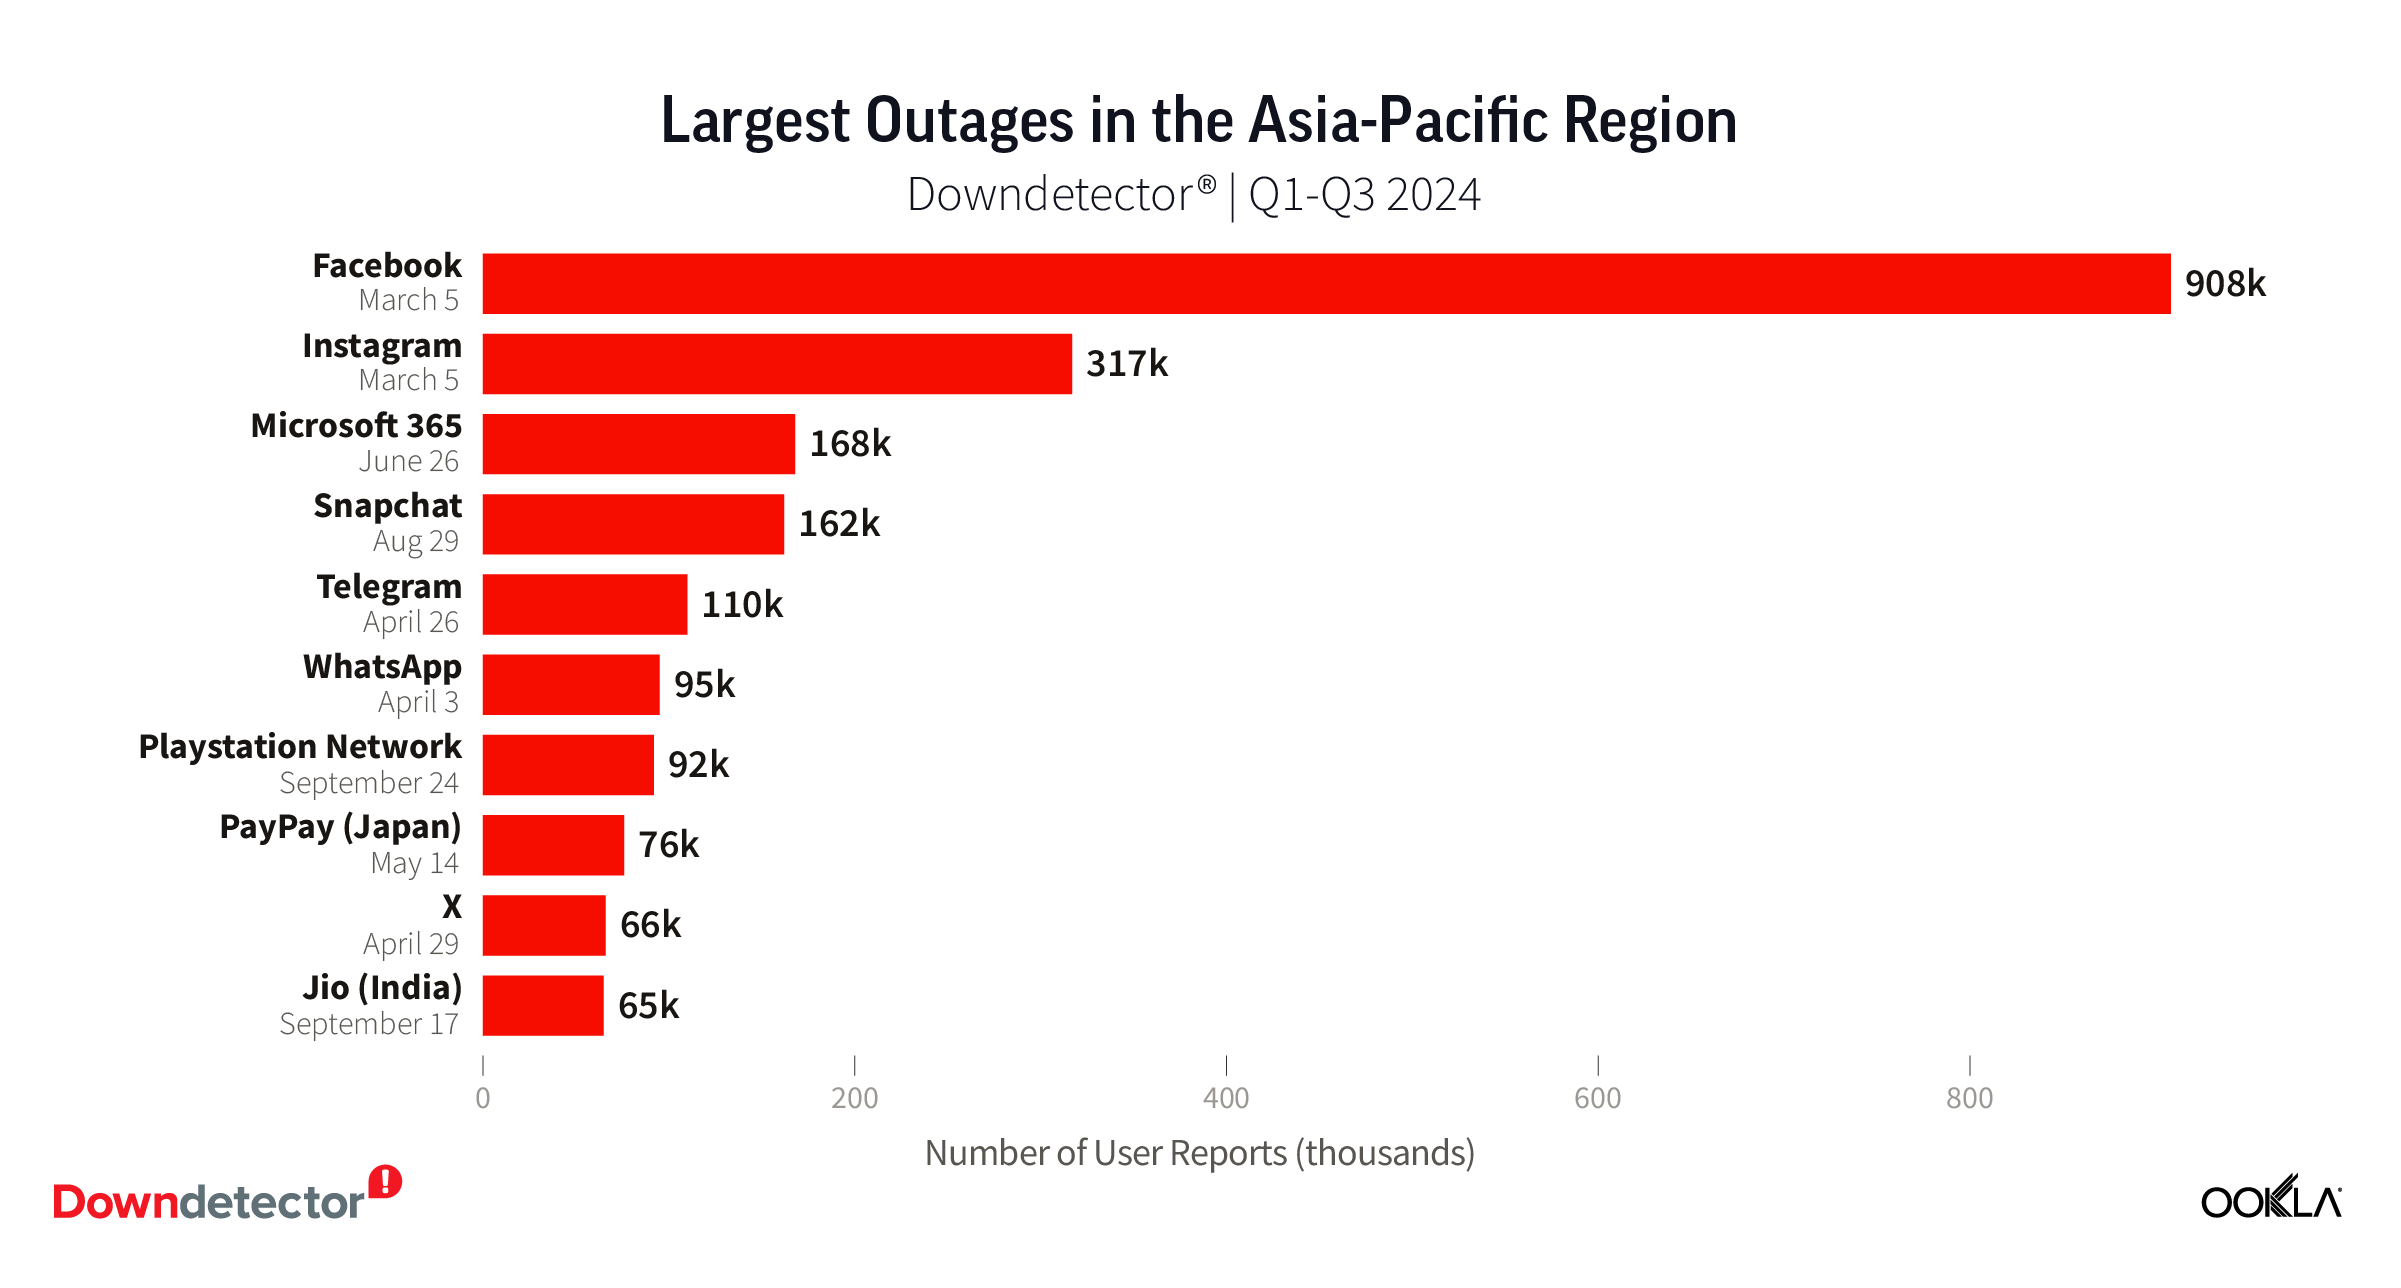
Chart of Largest Outage in Asia-Pacific Region, Downdetector, Q1-Q3 2024

The March 5 Facebook outage also topped the list of outages in the Asia-Pacific region, instigating over 908k user reports to Downdetector and taking Instagram down with it as the second largest outage. The third largest outage happened on June 26 when over 168k Microsoft 365 users in the Asia-Pacific region reported service disruptions on the service. Japan was especially hard hit with over 139k user reports from that country alone.

People in the Asia-Pacific region were also affected by local outages, with over 76k users reporting issues with Japanese payment system PayPay in May, and 65k users in India reported issues with Jio during a September service disruption.

Europe struggles with social media sites

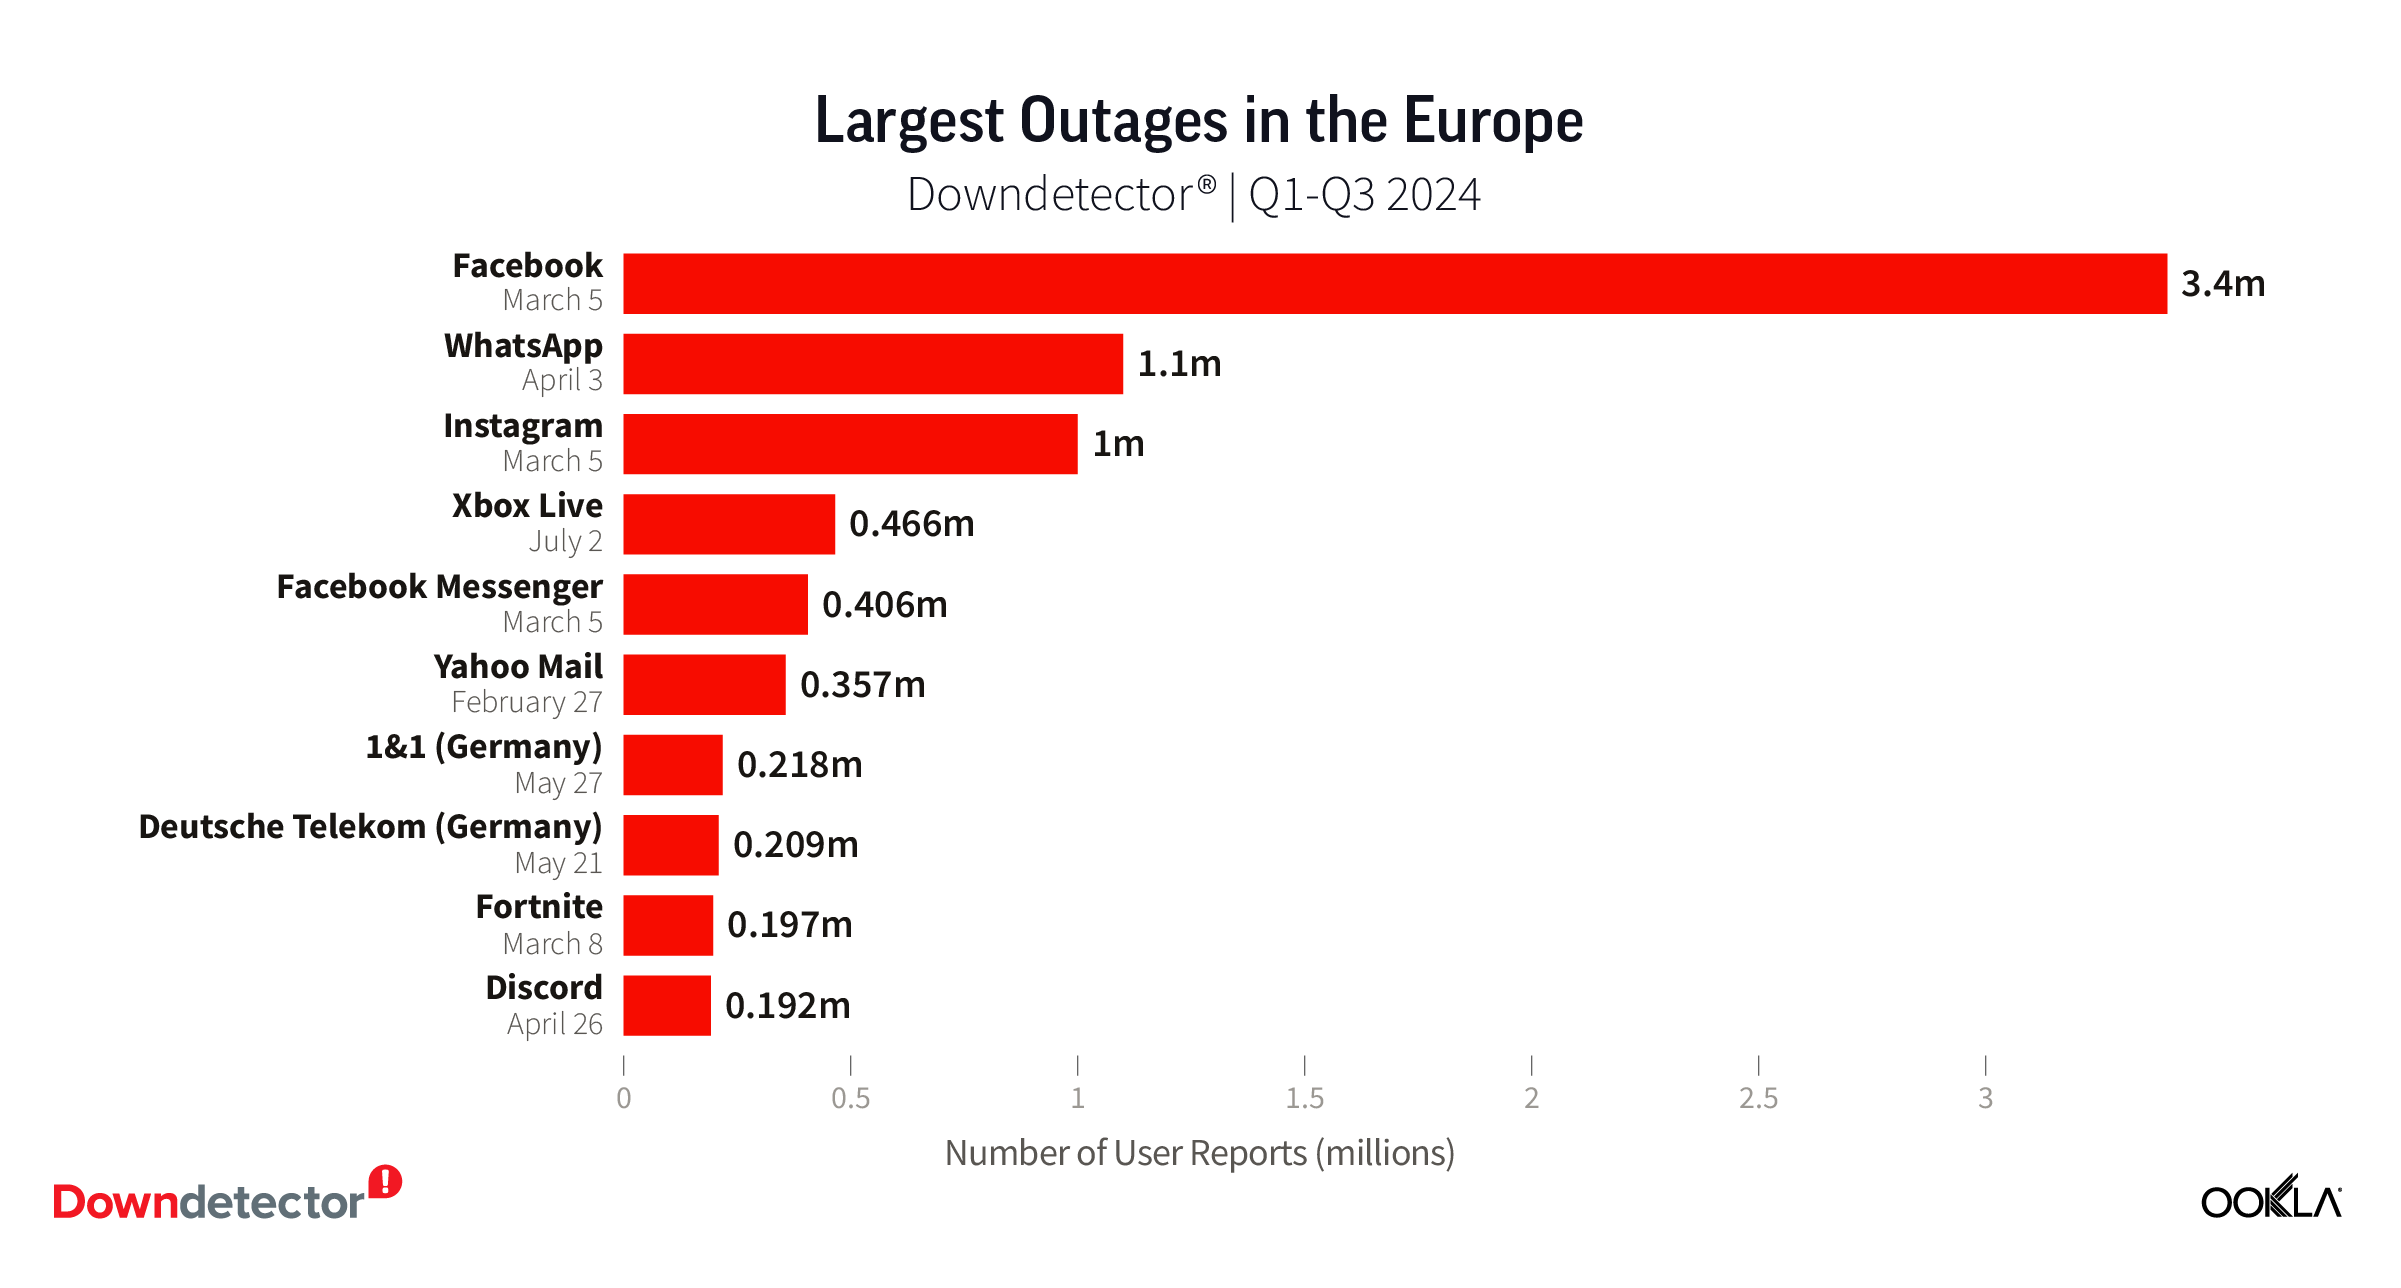
Chart of Largest Outage in Europe, Downdetector, Q1-Q3 2024

Social media sites were the main source of disconnection in Europe according to data from Downdetector. Over 3.4 million European users reported issues with Facebook during the March 5 outage, making that the largest outage in Europe during Q1-Q3 2024. WhatsApp users suffered the second largest outage in Europe with over 1.1 million people reporting issues during an outage in early April.

Two German companies also showed up on our list of largest outages in Europe with over 218k reports of issues with 1&1 and over 209k reports of issues with Deutsche Telekom when the two companies experienced service disruptions almost a week apart in late May.

Latin America feels pain from global social outages

Chart of Largest Outage in Latin America, Downdetector, Q1-Q3 2024

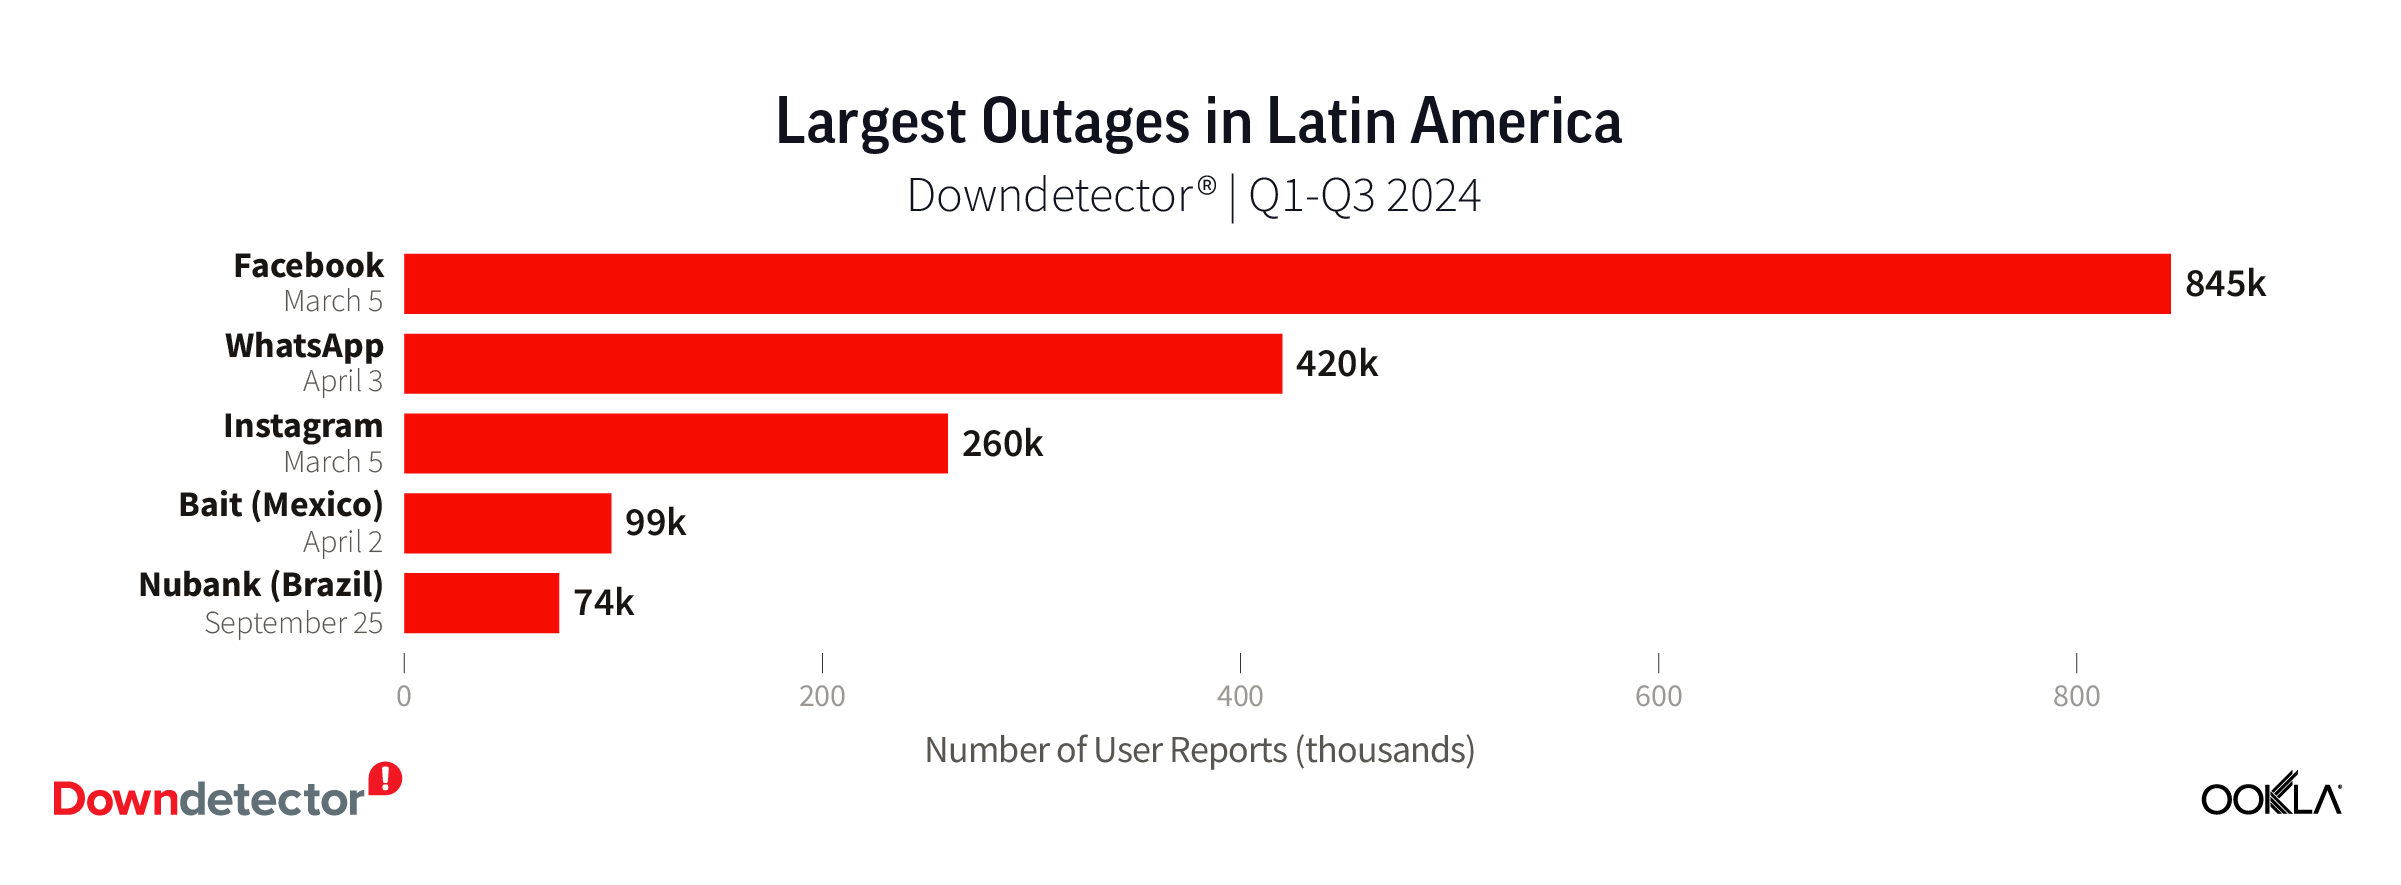
Latin America’s top three outages mirrored those in Europe with social media sites causing the most pain for users according to data from Downdetector. The March 5 Facebook outage was felt profoundly with almost 850k user reports on Downdetector in Latin America for issues related to Facebook and over 260k related to Instagram. WhatsApp had the second largest outage in the region with almost 420k user reports during the two hours the service was down on April 3.

Bait, a Mexican Mobile Virtual Network Operator (MVNO) owned by Walmart, suffered an outage on April 2 where almost 99k users reported issues to Downdetector. And on September 24, over 74k users reported issues with Brazilian fintech bank Nubank.

Middle East and Africa experience mix of local and global outages

Chart of Largest Outage in the Middle East and Africa, Downdetector, Q1-Q3 2024

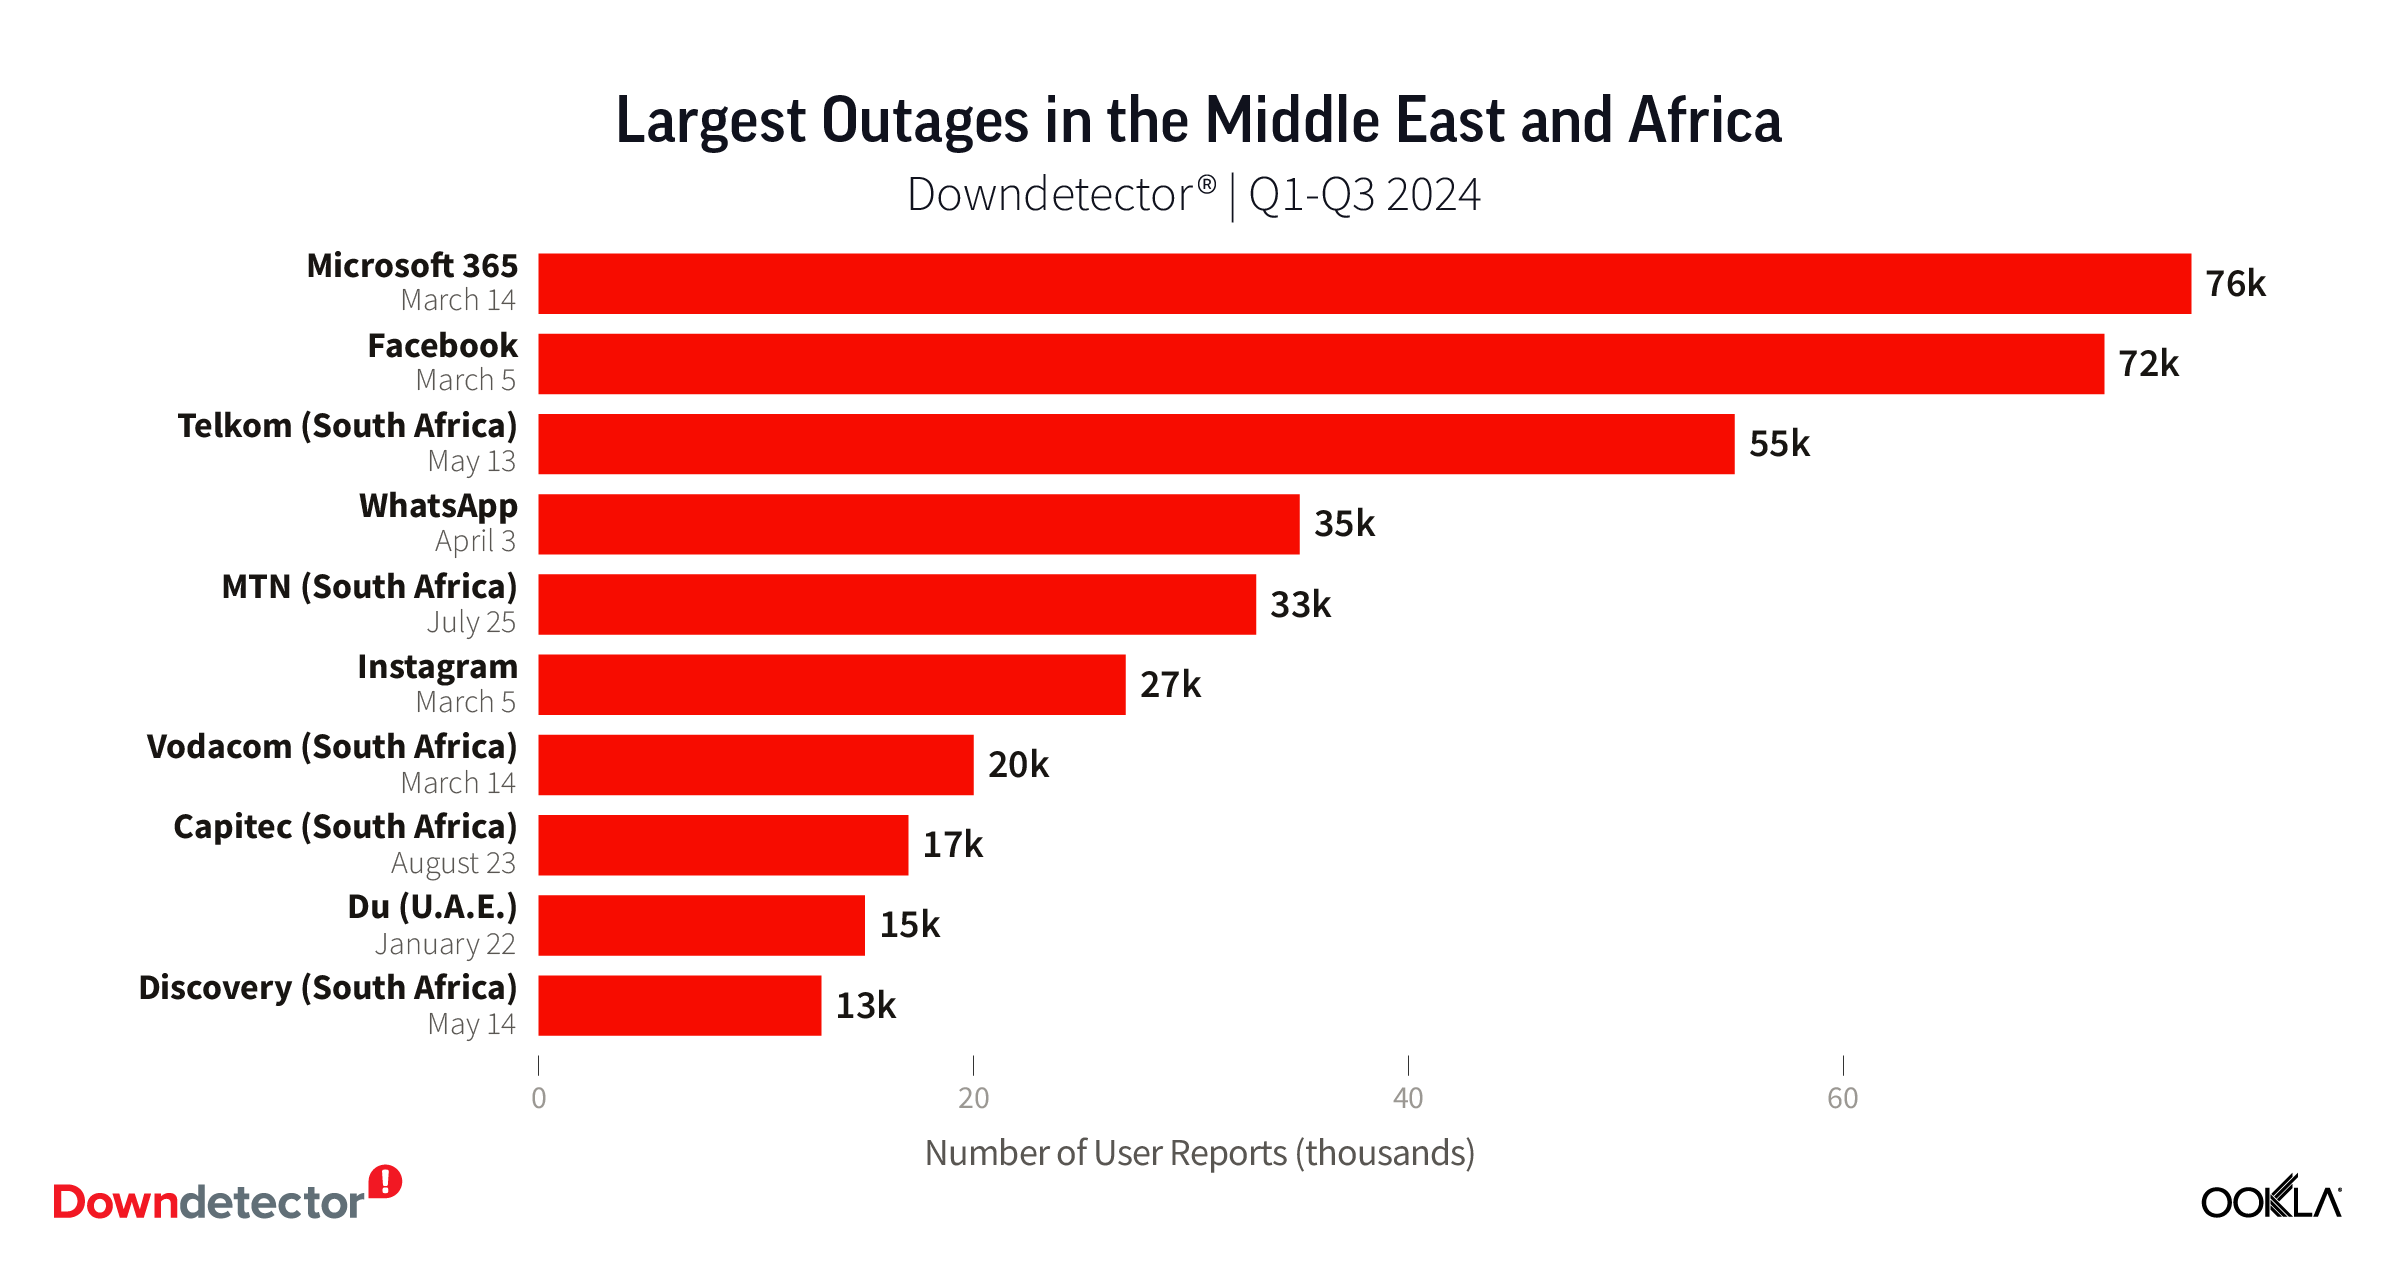
Outage patterns in the Middle East and Africa differed from those in other regions with users reporting about as many issues with local sites and services as global ones. The two largest outages, Microsoft 365 on March 14 and Facebook on March 5, were part of global events.

The third largest outage in the region was with South African telecommunications provider Telkom. Almost 55k users across Africa reported issues to Downdetector when Telkom experienced an outage on May 13. MTN, Vodacom, and du are other telecom providers that made our list of top outages in the Middle East and Africa during Q1-Q3 2024.

United States and Canada

Chart of Largest Outage in U.S. and Canada, Downdetector, Q1-Q3 2024

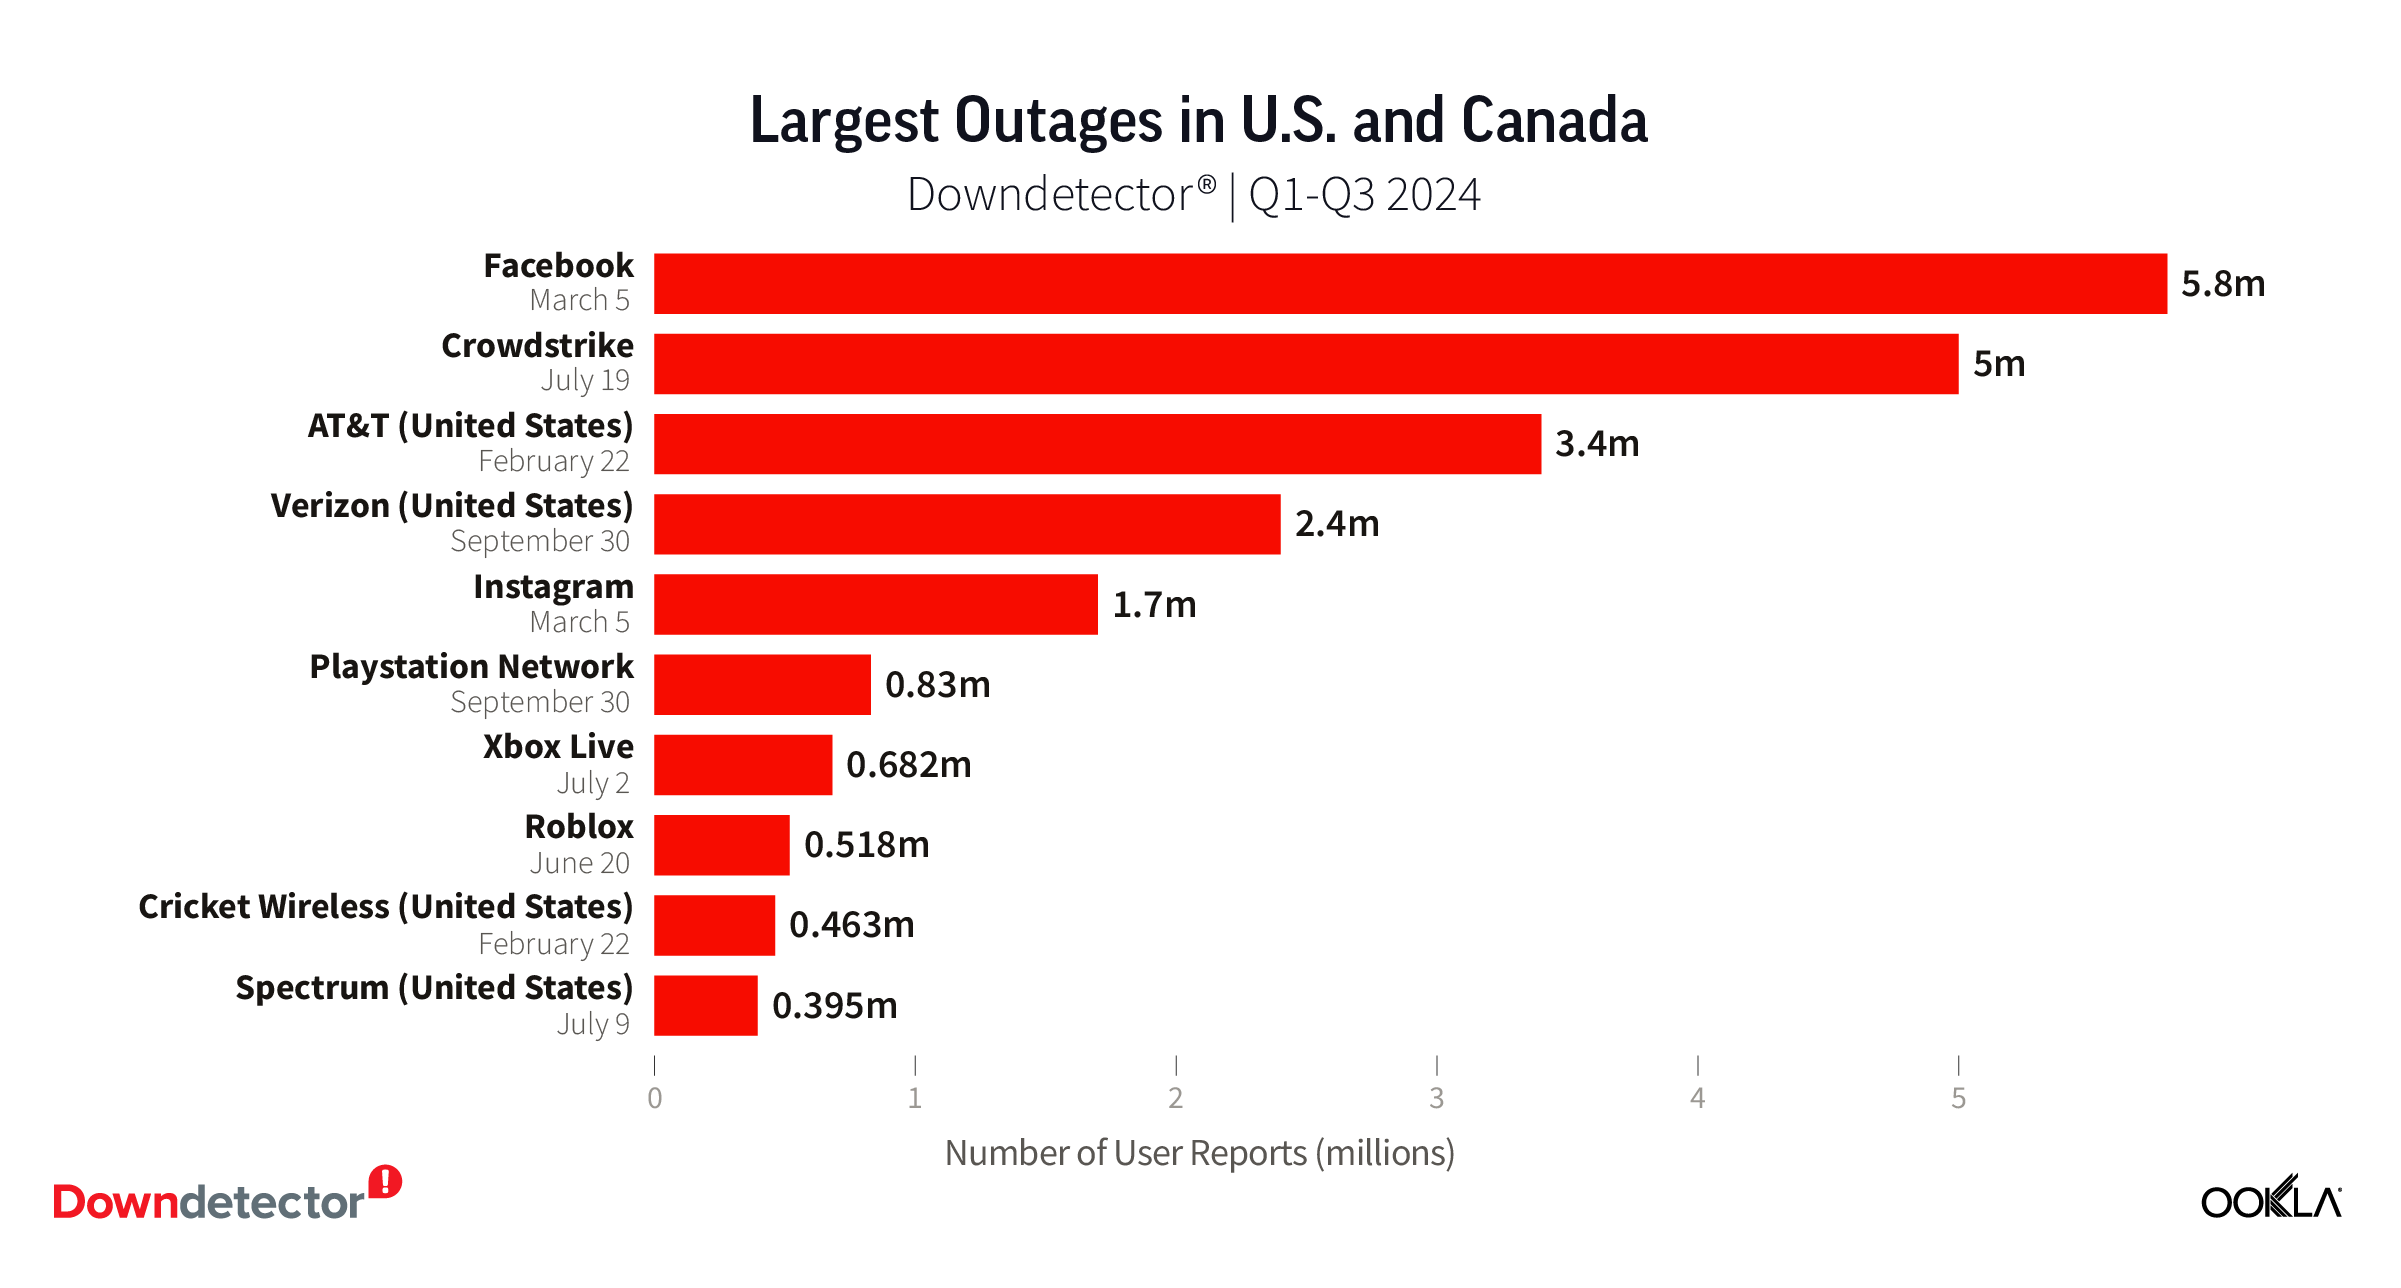
As we saw with much of the rest of the world, Facebook topped the list of outages in the U.S. according to Downdetector with over 5.8 million users reporting issues with the service during its outage on March 5. The Crowdstrike and AT&T outages also hit the U.S. hard with almost 5 million and over 3.4 million user reports, respectively. Gaming sites and services and telecom providers filled out the rest of the list in the U.S.

Downdetector is your source for information about service disruptions, monitoring real-time performance for thousands of popular web services globally. Find Downdetector on the web or in the free Speedtest app for Android or iOS. We’ve recently introduced push notifications so you can learn about outages as soon as they happen. Businesses looking for early alerting on service issues may be interested in Downdetector ExplorerTM.

Ookla retains ownership of this article including all of the intellectual property rights, data, content graphs and analysis. This article may not be quoted, reproduced, distributed or published for any commercial purpose without prior consent. Members of the press and others using the findings in this article for non-commercial purposes are welcome to publicly share and link to report information with attribution to Ookla.
| April 9, 2025

Speedtest Experience Ratings: A New Way to Understand Your Internet Performance

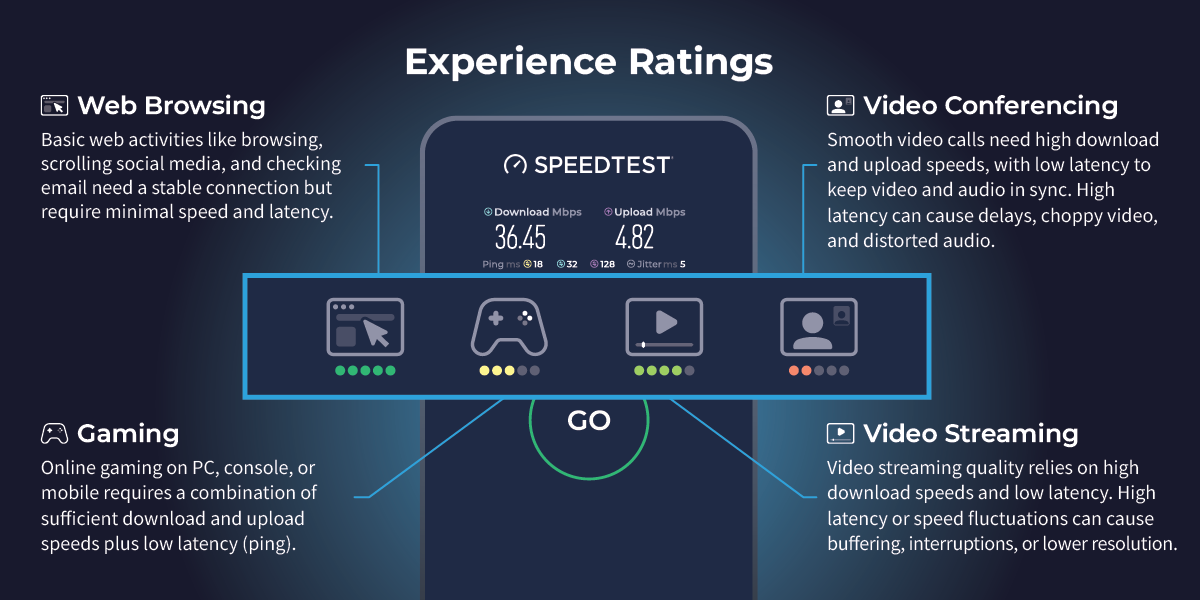
We are excited to introduce Speedtest Experience Ratings, a new beta feature in the Speedtest app and website designed to help you better understand how your Speedtest results translate into real-world performance. These ratings provide insights on four key online activities: Web Browsing, Online Gaming, Video Streaming, and Video Conferencing. Each metric is given a score on a 1 to 5 scale (1 = Poor, 5 = Excellent) to indicate expected performance.

Metrics Impacting Your Ratings

While Speedtest primarily displays download speed, upload speed, and ping, our Experience Ratings account for additional factors like jitter, loaded latency, and packet loss. All of these metrics can impact real-world performance, even if your speed results look strong.

  • Download Speed: How quickly you can pull data from a server on the internet to your device
  • Upload Speed: How quickly you can send data from your device to the internet
  • Latency (or Ping): The reaction time of your connection — how quickly your device gets a response after you’ve sent out a request
  • Jitter: Also called Packet Delay Variation (PDV), jitter is a measure of the variability in ping over time
  • Loaded Latency Increase: Calculates the excess latency by finding the higher value between download and upload latency and subtracting a baseline latency
  • Packet Loss: Packet loss occurs when a packet of data being sent over the internet is not received or is incomplete

Understanding Experience Ratings

Web Browsing

Web browsing includes activities like visiting websites, scrolling social media, and checking emails. This is one of the least demanding activities in terms of speed and latency, but stability is key.

  • Relevant Metrics: Download speed, Ping, Packet Loss, Jitter, and Loaded Latency Increase
  • Recommended Speeds:
    • Download: At least 1-5 Mbps
  • Latency Considerations: Latency is not typically an issue for basic browsing
  • Estimated Data Usage:
    • General browsing & social media: ~60 MB per hour
    • Email (without large attachments): ~1 MB per email
    • Email (with attachments): Varies based on file size

Online Gaming

A smooth gaming experience requires a combination of sufficient download and upload speeds as well as low latency. High latency can cause lag, delays in player actions, and an overall poor experience.

  • Relevant Metrics: Ping, Packet Loss, and Loaded Latency Increase
  • Recommended Speeds:
    • Download: 3-10 Mbps per player (higher for modern, high-resolution games)
    • Upload: 1-3 Mbps
  • Latency Considerations:
    • Ideal Ping: Below 50ms
    • Moderate Ping: 50-100ms (may experience minor lag)
    • High Ping: Over 100ms (noticeable lag and delay in gameplay)
  • Estimated Data Usage:
    • Casual gaming: ~40 MB per hour
    • Competitive online gaming: ~100 MB per hour
    • Game downloads/updates: Varies significantly (e.g., AAA games can be 50-150 GB)

Video Streaming

The quality of your video streaming experience depends primarily on high download speeds and low latency. If latency is too high or speeds fluctuate, you may experience buffering, interruptions, or a reduction in video resolution.

  • Relevant Metrics: Download, Ping, Packet Loss, and Loaded Latency Increase
  • Recommended Speed:
    • Standard Definition (SD, 480p): 3-4 Mbps
    • High Definition (HD, 720p-1080p): 5-10 Mbps
    • 4K Ultra HD: 25 Mbps or higher
  • Latency Considerations:
    • Low latency helps ensure smooth playback without buffering.
  • Estimated Data Usage:
    • SD (480p): ~700 MB per hour
    • HD (1080p): ~1.5-3 GB per hour
    • 4K UHD: ~7-10 GB per hour

Video Conferencing

For smooth video calls, both high download and upload speeds are important. Low latency is crucial for keeping video and audio in sync, whereas excessive latency can lead to delays, choppy video, and distorted or out-of-sync audio.

  • Relevant Metrics: Ping, Packet Loss, Jitter, and Loaded Latency Increase
  • Recommended Speeds:
    • Standard Definition (480p): 1 Mbps download / 1 Mbps upload
    • High Definition (720p-1080p): 3-6 Mbps download / 2-3 Mbps upload
    • 4K Video Conferencing: 10-15 Mbps download / 5-10 Mbps upload
  • Latency Considerations:
    • Low latency helps ensure smooth playback without buffering.
  • Estimated Data Usage:
    • SD (480p): ~700 MB per hour
    • HD (1080p): ~1.5-3 GB per hour
    • 4K UHD: ~7-10 GB per hour

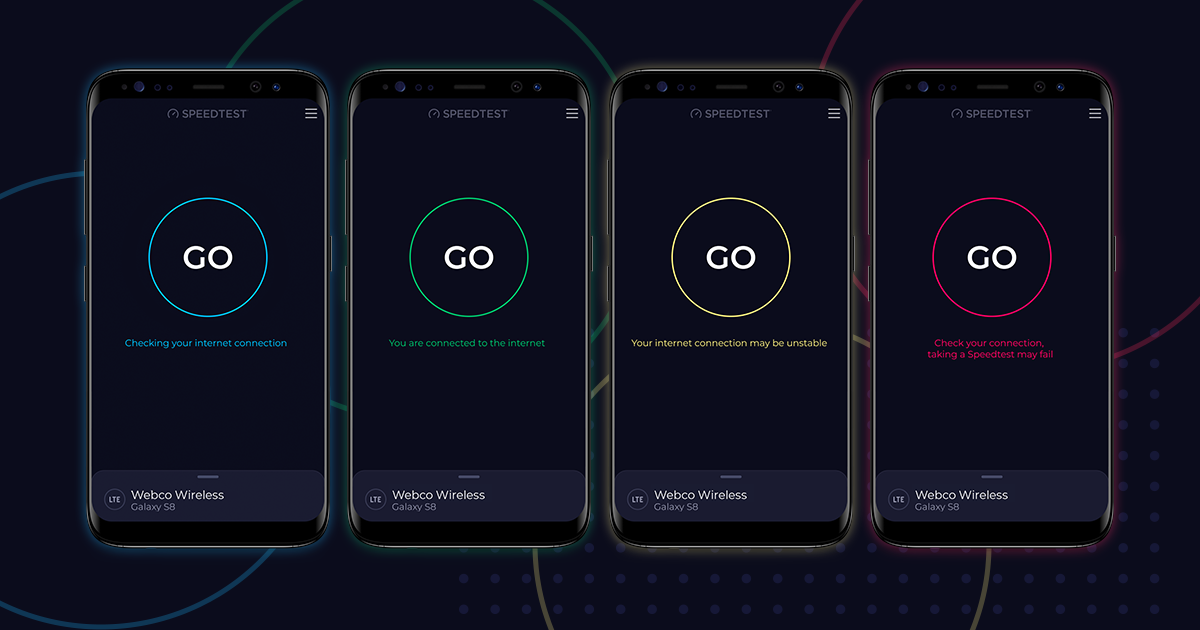
Speedtest Experience Ratings in Action

Here’s a look at Experience Ratings during a Speedtest:

Want to know your Experience Ratings? Take a Speedtest!

Ookla retains ownership of this article including all of the intellectual property rights, data, content graphs and analysis. This article may not be quoted, reproduced, distributed or published for any commercial purpose without prior consent. Members of the press and others using the findings in this article for non-commercial purposes are welcome to publicly share and link to report information with attribution to Ookla.
| December 20, 2022

Downdetector Presents the 10 Largest Internet Outages of 2022

For the past 10 years, Downdetector® has provided critical insights on real-time status and outage information for all kinds of services. We’ve seen huge, widespread outages over the years and 2022 was no exception. While no outage in 2022 eclipsed the biggest outage we’ve ever seen, which Meta experienced on October 4, 2021 when Facebook, Messenger, WhatsApp, and Instagram all went down, 2022 still saw some big worldwide outages. We put together a list of the 10 biggest global outages of 2022, so read on to learn how outages affected users: 

graph showing the top 10 global reported outages on downdetector

10. TikTok, September 15, 2022

chart of TikTok outage in 2022

U.S. TikTok users looking to find the latest dance crazes on TikTok awoke early in the morning on September 15 to some tough news: TikTok was down globally. Nearly 300,000 users flocked to Downdetector to report issues with accessing the website, but luckily the issue seemed to be resolved in a few hours.

9. Snapchat, July 12, 2022

chart of Snapchat outage in 2022

Snapchat users looking to send friends some photo updates were in for a rude reality on July 12, when they experienced a nearly four-hour service issue. While users couldn’t send pictures of themselves with Snapchat’s newest filters, they did record over 300,000 reports on Downdetector.

8. Reddit, April 3, 2022

chart of Reddit outage in 2022

Reddit users flocking to the website to post their newest r/speedtest results found out they wouldn’t be able to brag about how fast their speeds were on April 3, with Reddit having major issues for roughly two hours. Downdetector recorded over 300,000 user reports during this period to land on our top 10 biggest outages list. Unlucky users had to sit with themselves during this outage and ponder, “AITA?”

7. Call of Duty, August 16, 2022

chart of Call of Duty outage in 2022

Gamers in Europe hoping to unwind their day with some Call of Duty rounds tried to log in without any luck for roughly four hours. During this issue, frustrated users around the world recorded over 350,000 issues with the game while they waited for the service to come back online.

6. Twitter, July 14, 2022

chart of Twitter outage in 2022

Global Twitter users saw a huge service disruption on July 14, 2022, with over 500,000 users recording issues on Downdetector. Users couldn’t load tweets, scroll through the latest news, or let Speedtest® know what download speeds they were experiencing for roughly an hour before services got back up and running.

5. Instagram, July 14, 2022

chart of Instagram outage in 2022

July 14, 2022 was a busy day for social media companies. A few hours after the Twitter outage, Instagram went down for people around the globe, with users recording nearly 600,000 issues over three hours. During the disruption, users couldn’t access the service or scroll through influencer’s photos or slide into any DMs.

4. Roblox, May 4, 2022

chart of Roblox outage in 2022

Global Roblox users had a rough day on May 4, 2022. Around midnight UTC, Roblox, which is one of the most popular multiplayer games in the world, saw a massive spike in players’ ability to access the game. That issue seemed to linger for some users for many hours, with users recording over 700,000 reports on Downdetector over the course of the incident.

3. Discord, March 8, 2022

chart of Discord outage in 2022

March 8 marked a giant worldwide outage for both Discord and Spotify going down around the same time. While the outage only lasted about two hours, Discord users logged over 1.1 million reports on Downdetector while they waited patiently for the messaging service to come back online. During that period, folks had to resort to voice calls to catch up.

2. WhatsApp, October 25, 2022

chart of WhatsApp outage in 2022

Meta-owned WhatsApp is one of the most important global messaging services friends, families, and businesses use to keep in touch and connect to the world. But on October 25, WhatsApp’s 2 billion users found they were incommunicado and could not send any messages. Lasting for roughly two hours, the WhatsApp outage notched nearly 2.9 million issue reports on Downdetector, placing it as runner-up on our list for Downdetector’s biggest outage of the year.

1. Spotify, March 8, 2022

chart of Spotify outage in 2022

Competition for the largest worldwide outage was extremely tight this year, with Spotify edging out Meta-owned WhatsApp by about 20,000 reports on Downdetector at just over 2.9 million reports. As previously mentioned, March 8 was a big day of downed services. Spotify, the popular music streaming portal, had the biggest outage of the year that day, with users unable to stream their favorite music and podcasts for nearly two hours.

Honorable mention: “It’s me, hi, I’m the problem, it’s me”

Notably, but not on this list of biggest outages, Taylor Swift broke the internet a couple of times with the launch of her new album, Midnights. She first disrupted services on Spotify with the October 21 midnight launch of her album for a very brief moment. And then later in the year, to many fans’ frustration and anger, Ticketmaster became inaccessible on November 15 to would-be concert goers who sadly missed out on affordable tickets to her upcoming tour. 

Another year, another Downdetector top 10 outages list

Downdetector will continue to leverage over 25 million monthly reports from individual users, real-time analysis, and verification of outage reports, and make sure you have reliable information about the status of services that are important to you. We’ll continue monitoring the world’s largest service disruptions, and be back this time next year with 2023’s largest outages.

Until then, if you want to keep up to date on the latest outages or want quick updates on what’s going on in your country, download the Speedtest app (which has Downdetector integration) for iOS or Android

Ookla retains ownership of this article including all of the intellectual property rights, data, content graphs and analysis. This article may not be quoted, reproduced, distributed or published for any commercial purpose without prior consent. Members of the press and others using the findings in this article for non-commercial purposes are welcome to publicly share and link to report information with attribution to Ookla.
| November 1, 2022

How to Fix Your Family's Slow Internet: A Basic Troubleshooting Guide 

If you secretly suspect your parents invited you home to not only see your darling face but also because they’re waiting for you to fix their computers or mobile devices, you aren’t alone. Adult children of baby boomers are frequently tasked with tech support and a visit home is the perfect time for your family to capture your attention (and time!).

While this may seem like a chore because the internet feels so obvious to you, you probably have some untapped skills that could save your family a lot of time and frustration. If you want to give your family the gift of faster internet (and maybe show off a little), try this simple DIY home internet audit at the old homestead.

Step 1: Diagnose the Problem with a Speedtest

Before you dive in with fancy fixes and shiny new equipment, it helps to get the lay of the land. After all, you need to know what you’re working with before you can fix it. For a quick diagnosis of your connection, find out if there’s actually a speed problem and how severe it is:

  • Visit Speedtest.net or use the Speedtest app for iOS or Android
  • Run a test to check speeds on their phone, tablet, or laptop while connected to the home Wi-Fi to get an accurate reading
  • Then compare their download speeds to these general guidelines — or check the image below to see if their speeds are up to the task.
    • 0-20 Mbps: Suitable for basic browsing and video streaming
    • 20-40 Mbps: Good for 4K streaming and basic online gaming
    • 40-100 Mbps: Handles multiple devices streaming HD/4K content
    • 100+ Mbps: Best for households with gamers, multiple streamers, or large file downloads
  • To learn more about what level of internet speed you need for a variety of online tasks, check out our full Speedtest guide
  • Visit the Speedtest Global Index for median speeds in your country to see how your speeds compare.
  • Compare your test results against typical speeds in your country — and in many cases, even at the city level — for both mobile and fixed broadband connections.
  • Find out what service you’re actually paying for, and if your speeds aren’t meeting your needs, check our Performance Directory™ to see which ISPs offer better options in your area (it’s U.S.-only and doesn’t cover every ZIP code, but it’s a great place to start!)

Step 2: Check What Internet Service They’re Paying For

The first culprit in slow internet is often simply an outdated or insufficient service plan. Many people pay for basic service without realizing it’s not enough for modern internet use:

  • If your parents’ internet bill says they’re paying for anything less than 25 Mbps, you’ve probably just found the source of slow speeds
  • Most streaming platforms require about 20 – 40 Mbps download speeds to stream smoothly, with higher speeds required for 4K videos and especially when multiple people are using the same network

Step 3: Inspect Their Router and Network Equipment

Chances are that your parents have a modem/router combination that’s either leased from their ISP or, if they purchased it themselves, potentially very outdated. You want equipment that is:

  • New(ish)
    • Most modems and routers only have a 2-3 year lifespan for optimal performance
    • Latest routers use Wi-Fi 6 or newer standards, which handle more devices simultaneously and provide better coverage
    • Latest modems use DOCSIS 3.1 or 4.0 technology
    • A new router makes a great gift (especially if you set it up).
  • Centrally located
    • Router placement matters A LOT
    • Keep within 30 feet of where family members use Wi-Fi
    • Avoid basement closets, thick walls, and chimneys
    • Consider a mesh network for larger homes.
  • Password-protected
    • Prevent neighbors from using your bandwidth
    • Protect your family’s privacy
    • Consider setting up a guest network for visitors.
  • Check connection type.
    • Confirm if they have traditional broadband, 5G, Fixed Wireless, or satellite
    • Each connection type has different troubleshooting methods
  • Watch for problematic repeaters
    • Wi-Fi extenders can slow speeds while extending range
    • Position strategically – put your router where it’s needed most
    • Use extenders in less critical areas

Step 4: Check the Age of Their Connected Devices

Computers, tablets, and phones are like cars – after a few years on the road, they just can’t keep up with the latest models, especially when it comes to internet connections. Older devices often can’t support newer Wi-Fi standards, no matter how advanced your router is. 

Most devices made before 2019 can’t support Wi-Fi 6 or newer standards, which means they’ll be limited in speed even with the newest router. Even if you upgrade your router, these older devices will still connect at their maximum supported speeds. 

If all the devices you encounter are showing their age, consider these options:

  • Designate one newer device as the “speed champion” for any internet tasks that require faster connections
  • Focus router upgrades on improving coverage rather than just speed
  • Consider wired connections for older devices that need better performance

Step 5: Perform the Classic “Router-Restart”

This classic line you often hear from customer support exists for a reason — it works surprisingly often. A simple restart can clear temporary glitches and restore connectivity:

  • Unplug both modem and router
  • Wait 60 seconds
  • Plug modem back in first
  • Wait for it to fully reboot (1-2 minutes)
  • Then plug in the router

Step 6: Check for Network Outages

Sometimes the internet just isn’t working properly, and it’s not your parents’ equipment at fault. A service can be down, there may be a localized outage, or a host of other issues beyond their control. If you can get any kind of connection (either on your phone or internet browser):

  • Check Downdetector® to see if your parent’s ISP is experiencing issues
  • You can now access Downdetector data directly in the Speedtest app, making it easier to check if a problem is widespread without visiting a separate website
  • Look for patterns – if multiple services are down in the same area, that points to an ISP or regional issue
  • No point troubleshooting hardware if the entire network is down

Step 7: Call the ISP

You’ve done your best, but some issues require professional intervention. Having followed the previous steps, you’ll be much better prepared to deal with your ISP:

  • Having done your troubleshooting, you’re better prepared to explain the issue
  • Try to schedule a service window before you leave town
  • The ISP might need to check issues outside your home

Set Yourself Up to Monitor Home Internet Performance Over Time

Before you leave, give your family a way to monitor their internet connection and track any problems that pop up. This makes it easier for them to tell if something’s actually wrong — and gives you proof if you ever need to escalate things with the ISP:

  • Install the free Speedtest app for:
    • Windows and Mac computers
    • iOS and Android devices
    • You can even create a free account that allows you to monitor your results over time! 
  • The app allows you to:
    • Check your internet speed anytime, from any device
    • Monitor your connection over time to spot recurring issues
    • Document outages and slowdowns using test history
    • View live outage reports with built-in Downdetector data

The Gift of Better Connectivity

Helping your family fix their slow internet isn’t just about the technical benefits – it’s about making their daily digital lives easier. By taking the time to diagnose and solve connectivity issues, you’re giving them more than just faster streaming or smoother video calls; you’re providing peace of mind and showing them you care. 

Plus, with a properly optimized home network, you might even get fewer tech support calls until your next visit! Remember that internet technology continues to evolve, so checking in on their setup every year or two is a good habit that keeps everyone connected and happy.

Editor’s Note: This article was updated in 2025 to provide the most current information on home internet troubleshooting.

Ookla retains ownership of this article including all of the intellectual property rights, data, content graphs and analysis. This article may not be quoted, reproduced, distributed or published for any commercial purpose without prior consent. Members of the press and others using the findings in this article for non-commercial purposes are welcome to publicly share and link to report information with attribution to Ookla.
| April 14, 2024

Early 5G Results for the Samsung Galaxy S24 Family: How do New S24 Models Stack up to Previous Generations and iPhone 15’s on 5G? 

Consumers around the world eagerly awaited Samsung’s release of the latest line of its flagship Galaxy S series of smartphones on February 1, 2024. Was the wait worth it? In this article, we analyze how the Samsung Galaxy S24 family measures up against its predecessors in terms of 5G speed and latency during its first several weeks on the market (February 1 – March 24, 2024). 

With new chipsets and technologies alongside plenty of other cool new features in Galaxy S24 devices, we examined early results from Speedtest® users in 15 select countries around the world to see whether the Galaxy S24 lineup — comprising the S24, S24+, and S24 Ultra models — outpaced Samsung’s earlier S22 and S23 families for 5G performance. Additionally, we’ve compared the 5G speeds and latency of Apple’s iPhone 15 family — including the iPhone 15, 15 Pro, and 15 Pro Max — against Samsung’s offerings.

It’s important to note that device performance metrics can vary significantly from one country to another. Factors such as government and mobile operator investments in 5G infrastructure, spectrum allocations, and the extent of 5G network deployment all contribute to these variations.

Key takeaways:

  • The Samsung Galaxy S24 family showed a statistically significant lead for median 5G download speeds in seven out of 15 countries in this study. On the other hand, the Apple iPhone 15 family posted the fastest 5G speeds in only one country. It’s worth noting, however, that speed differences between Galaxy S24 devices and iPhone 15’s were relatively minor in some of the countries analyzed (see the charts below for details). 
  • The S24 family recorded the lowest median 5G multi-server latency in 10 of 15 countries, whereas iPhone 15 devices offered the highest median 5G latency in 10 markets.
  • Samsung Galaxy S22 models unsurprisingly offered the slowest median 5G download speeds in eight countries, while the Galaxy S23 family was slowest in four countries. 
  • Devices in the Galaxy S24 family experienced the fastest median 5G upload speed in 13 of the 15 countries examined for this analysis. However, upload speeds were much slower than 5G download speeds, ranging from 11.83 Mbps to Mbps to 66.52 Mbps, with median 5G upload speeds of 50 Mbps or better found in only three countries (South Korea, Qatar, and the U.A.E.). 

To learn more about what speeds mean in real-world terms, check out our article looking at how much speed users need for a variety of daily mobile activities.

Take me straight to the data!

Asia Pacific | Middle East & Africa | Europe | North America 

New chipsets and modems in the Galaxy S24 family 

Everyone wants to know if the newest technology is worth the upgrade when they’re investing in an expensive new smartphone. Each device within the Galaxy S24 family has various upgrades (including new AI features), but when it comes to features that impact speed and latency performance, here’s a look at the chipsets and modems for each line of smarthpones in our study:

  • Samsung Galaxy S24 Ultra models use Qualcomm’s Snapdragon 8 Gen 3 chipset globally, while the S24 and S24+ use it only in Canada, China, Hong Kong, Taiwan, and the United States. The Samsung Exynos 2400 is used elsewhere for the S24 & S24+.
  • The Galaxy S23 series uses Qualcomm’s Snapdragon 8 Gen 2 worldwide, while Samsung S22 models use an Exynos 2200 chipset in Europe and the Snapdragon 8 Gen 1 elsewhere. 
  • Galaxy S24 devices utilize the Snapdragon X75 5G modem, S23 models have a Qualcomm Snapdragon X70 modem, while S22 models have a Qualcomm Snapdragon X65 modem.
  • Apple iPhone 15 models use Apple’s A16 Bionic chipset, while iPhone 15 Pro and Pro Max models use the A 17 Pro chip. All devices in the Apple iPhone 15 family utilize Qualcomm’s Snapdragon X70 5G modem. 

Do you own one of these devices? See how your speeds compare by taking a quick Speedtest. And to learn more about mobile and fixed broadband performance in cities and regions across the world, visit the Speedtest Performance Directory, where you’ll find ISP recommendations, insights on mobile and fixed broadband performance, and more. 

Digging into the Data: Where does the Samsung Galaxy S24 Family Lead its S22, S23, and iPhone 15 Counterparts Around the Globe? 

Early findings from Speedtest Intelligence® reveal that the latest Galaxy S24 family outperformed its predecessors — especially S22 models — in terms of 5G speed across several of the countries we analyzed. While differences in speed between devices were minimal in some countries, S24 models showed significant speed advantages over previous generation Samsung devices in markets like Qatar, the United Arab Emirates, and others. 

Does that mean users in those locations should upgrade immediately? Not necessarily. The decision to upgrade depends on various factors, from price to features to performance and more. However, if speed is your primary concern, the Galaxy S24 series is a compelling option, especially for consumers currently utilizing devices from the Galaxy S22 lineup, which is now over two years old.

Read on to see our complete analysis of all 15 countries in this study or select a region below to dig into more localized results. 

Asia Pacific | Middle East & Africa | Europe | North America 

Asia Pacific

Consumers in Hong Kong who want new features might want to upgrade

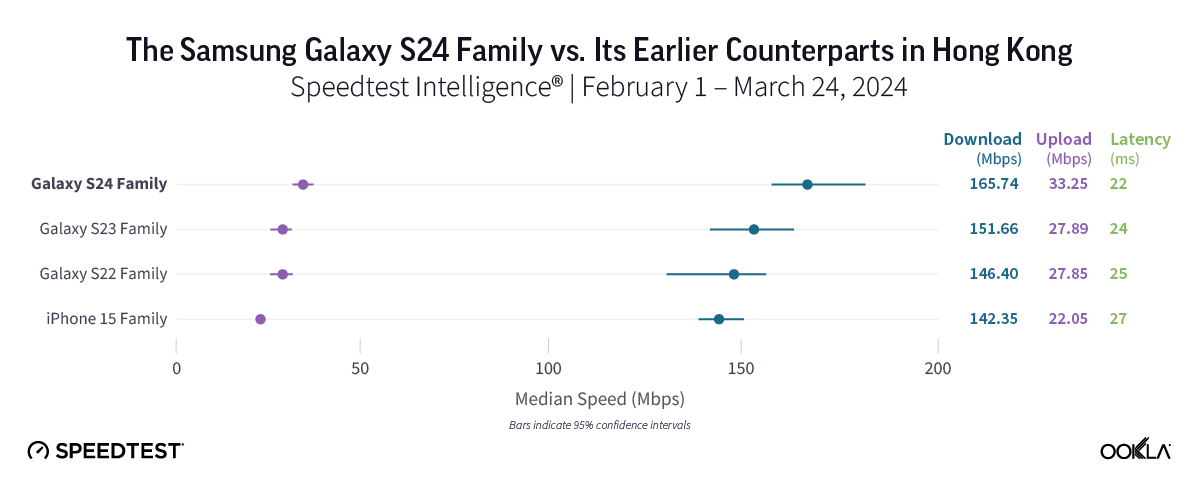
Speedtest Intelligence data revealed strong performance for all device families in Hong Kong, with the new Galaxy S24 family performing particularly well, boasting a median 5G download speed of 165.74 Mbps and the lowest median 5G multi-server latency in the market at 21.74 ms. However, the S24’s median 5G download speed was statistically comparable to that of its older Samsung and iPhone 15 peers, making the choice to upgrade currently more about new features than about performance.

Bottom line: With strong — and similar — 5G download speeds across all device families in Japan, upgrading to a new Galaxy device isn’t a must just yet, unless you want to enjoy the S24 family’s new features.

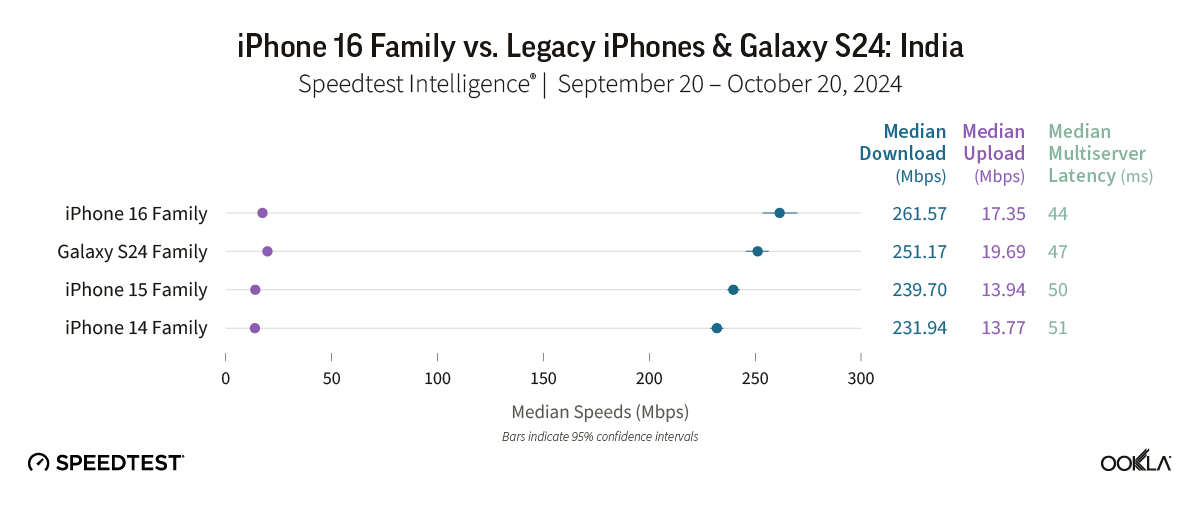
5G speeds were fast across the board in India, where the Samsung Galaxy 24 family held a slight edge 

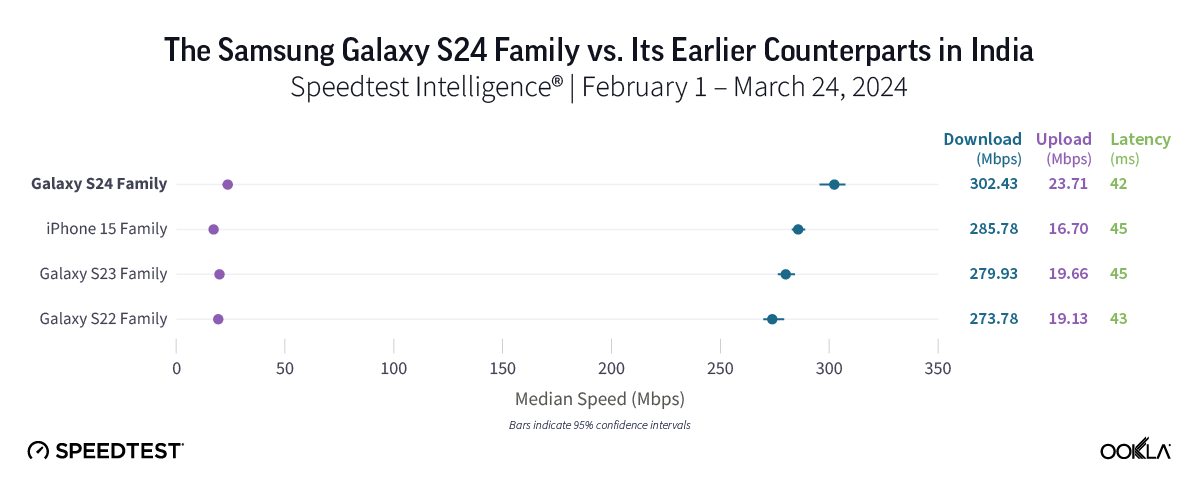
In the early days following the release of the Galaxy S24 series in India, the latest Samsung models led for both 5G download speeds and 5G multi-server latency. While 5G speeds impressed across all device families in India — all notched speeds of at least 273.78 Mbps — Galaxy S24 models posted the top median 5G download speed at 302.43 Mbps and the lowest median 5G multi-server latency at 41.56 ms. On the other hand, Galaxy S22 devices showed the slowest — but still impressive — speeds in India at 273.78 Mbps, while the Samsung Galaxy S23 was just a tick behind at 279.93 Mbps. The iPhone 15 family, meanwhile, clocked in with a median 5G download speed of 285.78 Mbps.

Bottom line: Consumers in India currently using S22 devices might want to upgrade to an S24 model, given the nearly 30 Mbps speed advantage the new devices provided in this study. However, with excellent 5G speeds across all device families and similar speeds for devices in the S22, S23, and iPhone 15 families, users might not feel a huge difference in their 5G experience from one device to another. 

Samsung Galaxy enthusiasts in Indonesia needn’t rush to upgrade to an S24 device — yet

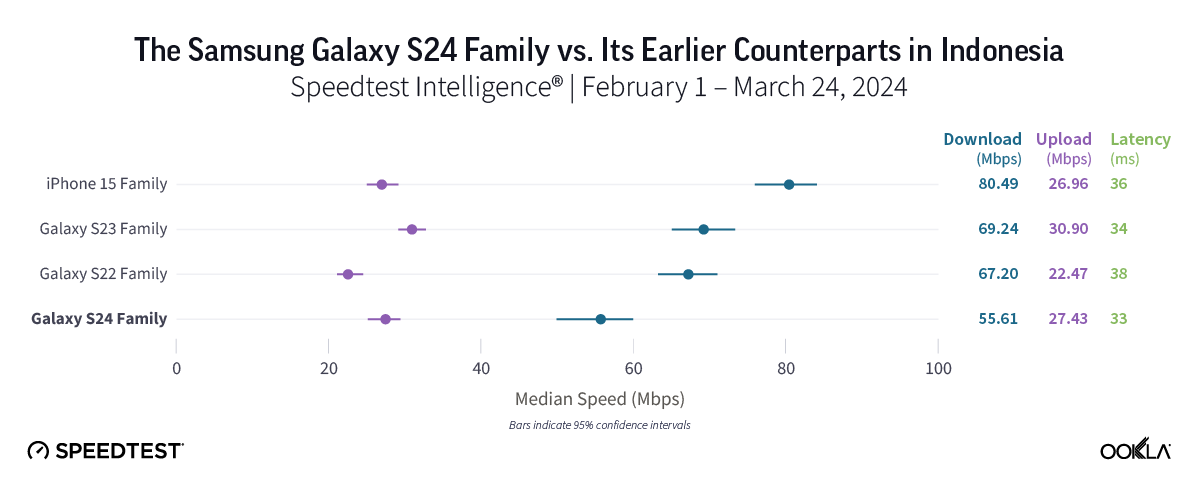
In contrast with what our results showed in most countries, the iPhone 15 family emerged as the leader in Indonesia with a median 5G download speed of 80.49 Mbps. All three Samsung Galaxy families trailed with speeds ranging from 55.61 Mbps for the S24 family to 69.24 Mbps for S23 models. While the iPhone 15 family’s 5G speed was nearly 25 Mbps faster than that of S24 devices, it’s worth noting that the difference among all three Samsung Galaxy models was only about 14 Mbps, and our results revealed no statistical difference in median 5G download speeds between the S22 and S23 families. 

Bottom line: Despite the iPhone 15 providing the top speeds in the market, the Galaxy S24 could hold greater long-term potential for consumers in Indonesia, especially when compared to older Samsung models. Equipped with a newer processor and modem, the S24 could see quicker speeds over time as Indonesia’s 5G networks evolve. In the meantime, users shouldn’t experience notable disparities in speed or latency among all three Samsung device families analyzed. 

No clear advantage to upgrading to a new Galaxy S24 in Japan

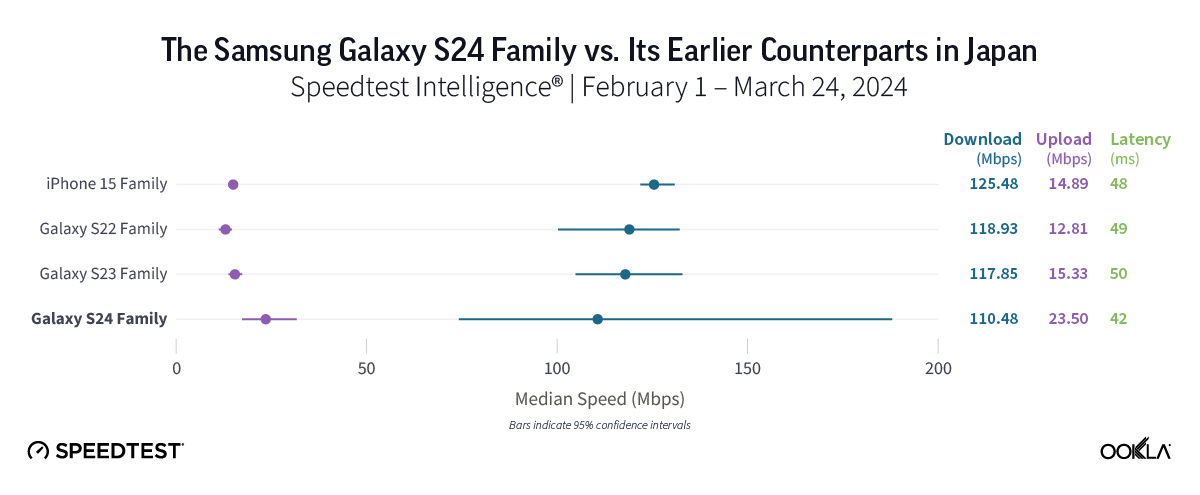
People in Japan who upgraded to a Galaxy S24 device likely haven’t seen a performance boost just yet. While all four device families performed similarly well in Japan, there was no statistical difference in the median 5G download speeds offered by all three Galaxy families, with speeds ranging from 110.48 Mbps to 118.93 Mbps across all three Galaxy devices. The iPhone 15 lineup also had a strong speed at 125.48 Mbps. 

Bottom line: With generally similar median 5G download speeds across all device families in Japan, users who are considering upgrading to a new Galaxy smartphone might want to wait. While we anticipate the S24’s speeds to surpass those of its predecessors over time, 5G speeds in the market were quite close across all three Galaxy device families in the early days of the S24’s release. 

For users in the Philippines who want the fastest 5G, Galaxy S22 users may want to upgrade. 

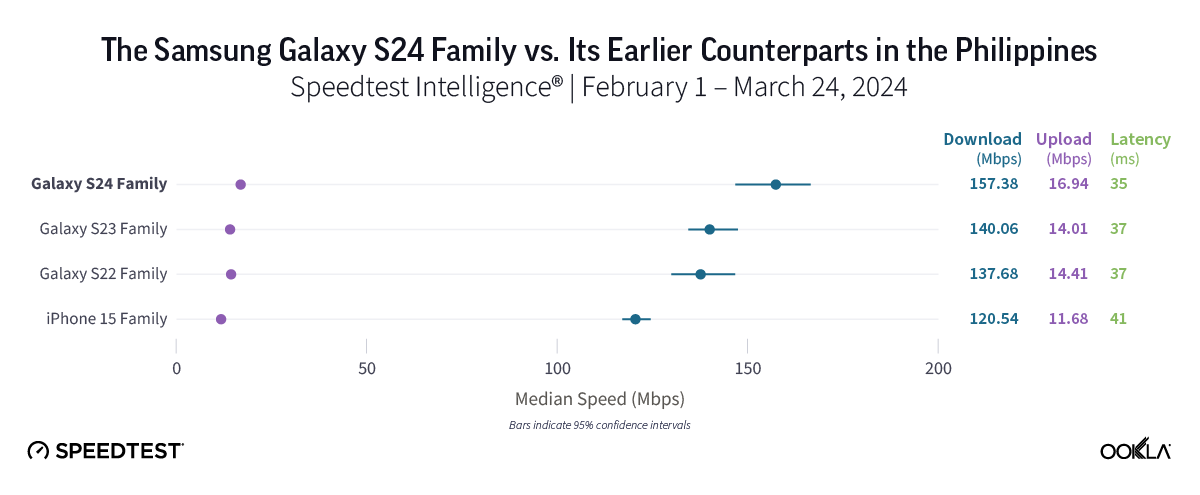
Samsung Galaxy S24 users in the Philippines might have noticed a modest improvement to their 5G speeds compared to those on older S23 and S22 models since they upgraded, as the Galaxy S24 family’s median 5G download speed of 157.38 Mbps was about 20 Mbps faster than that of Galaxy S22’s (137.68 Mbps) and a little over 15 Mbps faster than the Galaxy S23 family (140.06 Mbps). Meanwhile, the iPhone 15 family’s median 5G download speed of 120.04 Mbps trailed all three Samsung Galaxy families in the market.

Bottom line: For users in the Philippines seeking the fastest possible 5G experience, upgrading to an S24 device is worth considering. However, it’s worth noting that the differences in speed between devices wasn’t as stark as that in some other countries, and upgrading likely isn’t for everyone just yet.

Samsung Galaxy S24 and iPhone 15 much faster on 5G in South Korea than S22 devices 

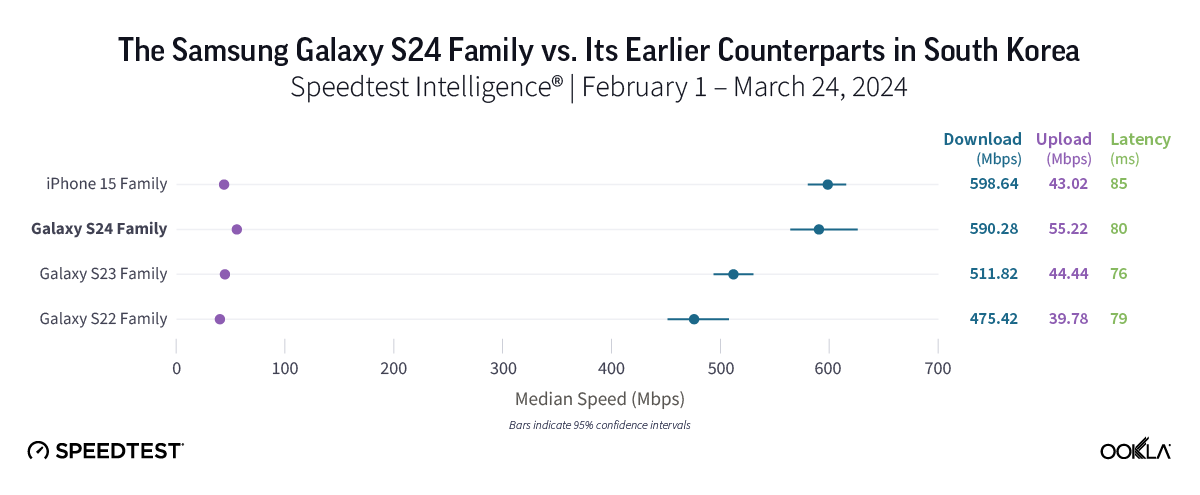
In South Korea, home to the first widespread 5G launch in the world, our results reflected outstanding 5G speeds, with the iPhone 15 and Samsung Galaxy S24 families posting similar median 5G download speeds of 598.64 Mbps and 590.28 Mbps, respectively. The S22 family, meanwhile, offered the “slowest” 5G speeds in South Korea, posting an excellent median 5G download speed of 475.42 Mbps, while Galaxy S23 devices came in at 511.82 Mbps.

Bottom line: 5G users in South Korea can expect remarkable 5G speeds across the board, regardless of their device. However, Samsung Galaxy loyalists who currently use S22 models might want to consider moving to an S24 model, given that the S24 family was over 100 Mbps faster than Galaxy S22’s, while also offering the top median 5G upload speed in the market at 55.22 Mbps. For users who prioritize the fastest 5G experience, Galaxy S24’s and iPhone 15’s are both worth a look.

Samsung Galaxy S24 family provides top 5G download speeds in Thailand 

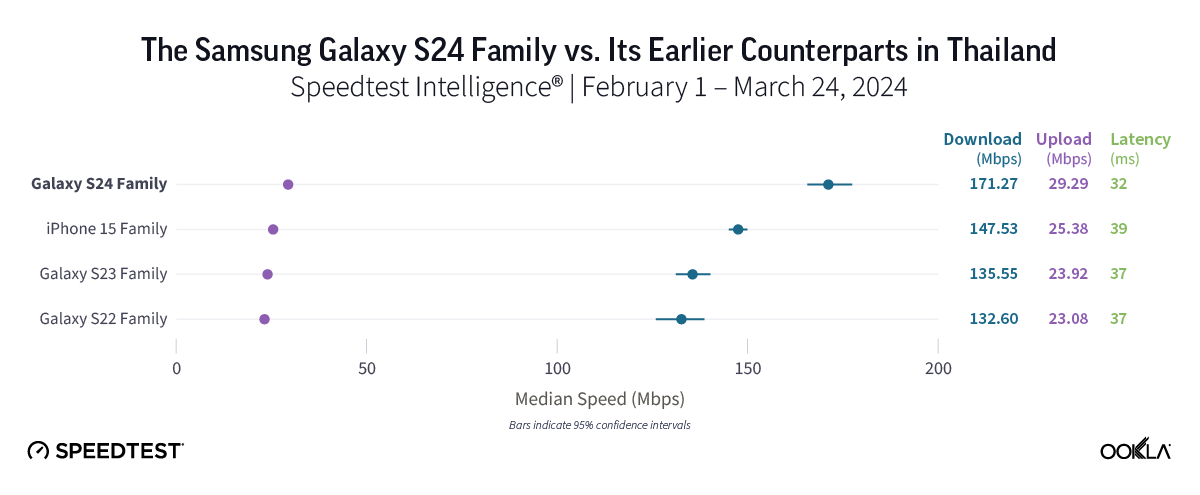
In Thailand, Speedtest Intelligence showed that the Galaxy S24 family delivered the fastest median 5G download speed in the market at 171.27 Mbps. That speed marks a notable improvement of roughly 35 Mbps over the S22’s 132.60 Mbps and the S23’s 135.55 Mbps. The Galaxy S24 family also offered the lowest median 5G multi-server latency in Thailand at 32.46 ms. The iPhone 15 family provided the second-fastest median 5G download speed in the market at 147.53 Mbps.

Bottom line: If you’re thinking of upgrading from an S22 or S23 device, our findings suggest that the Galaxy S24 might be the right choice. With faster 5G speeds compared to previous generations, coupled with low latency, smartphones in the Galaxy S24 family should allow for quick content downloads and smooth connectivity overall.

Middle East and Africa 

Excellent 5G speeds in Nigeria, but too soon to tell if you should upgrade for performance 

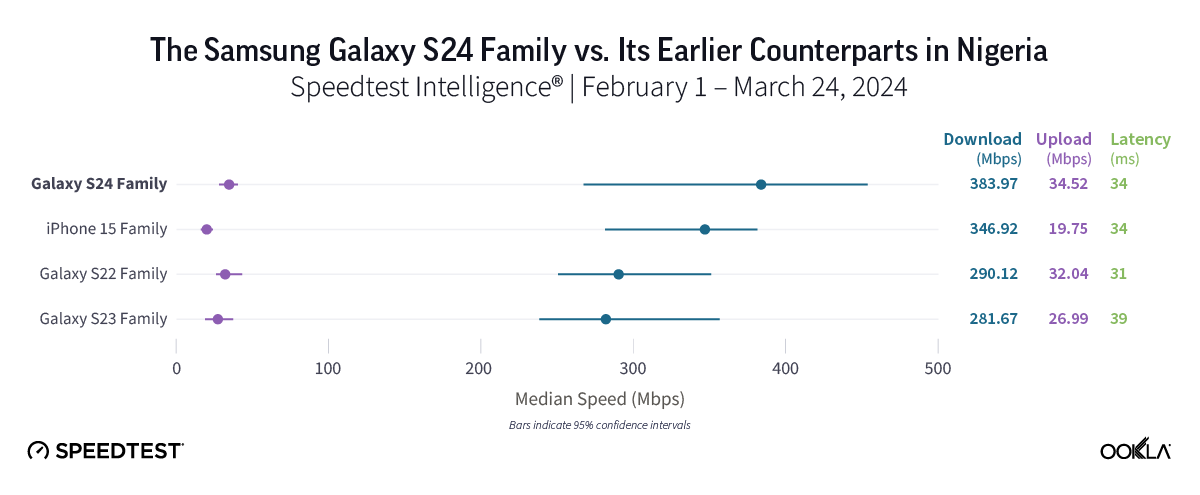
In Nigeria, 5G speeds were impressive overall, from the Galaxy S23 family’s median 5G download speed of 281.67 Mbps to the new Galaxy S24’s speed of 383.97 Mbps. However, in these early days of the S24 lineup’s release, we are still waiting to see how things stabilize in the market before we can make a firm recommendation on whether to upgrade. 

Bottom line: For users who like to have the latest gear and/or want the new features offered by the S24 lineup, upgrading is certainly worth considering. But with fast 5G speeds in general, users on any of the device families we looked at should see a quick download experience in general. 

Samsung Galaxy S24 by far the fastest 5G in Qatar 

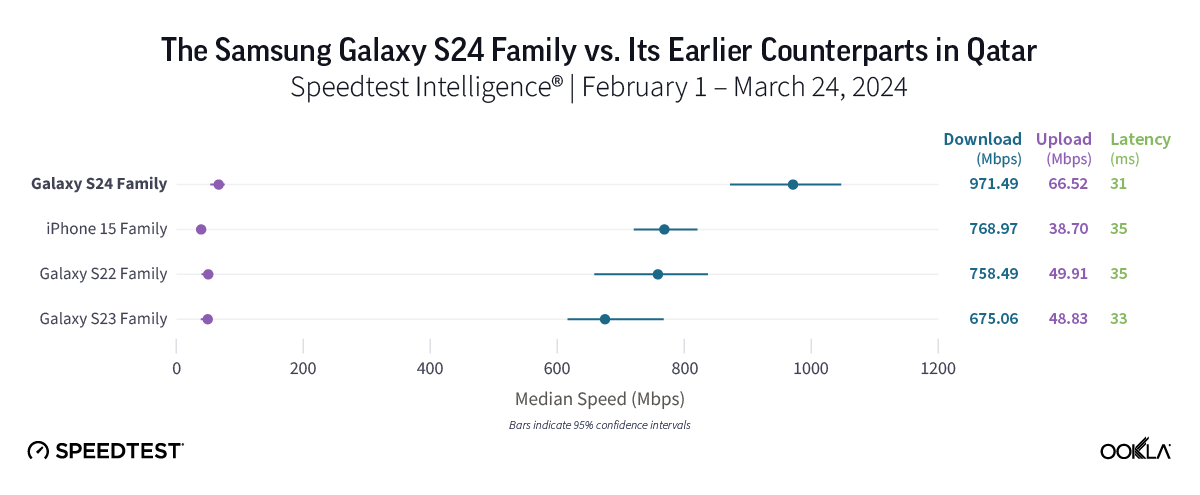
Home to some of the fastest 5G speeds in the world, Qatar showcased impressive median 5G download speeds across all three device families analyzed. The Galaxy S24 family led the pack with a jaw-dropping median 5G download speed of 971.49 Mbps and the top median 5G upload speed in the market at 66.52 Mbps. The Galaxy S22 and S23 families trailed, albeit with great median 5G download speeds of 675.06 Mbps and 758.49 Mbps, respectively. The iPhone 15 family also had a strong showing in Qatar, posting a median 5G download speed of 788.97 Mbps. 

Bottom line: Consumers in Qatar with older Galaxy S22 or S23 devices might want to make the switch, given that the S24 family’s remarkable median 5G download speed of nearly 1 Gbps was much faster than those of either the Galaxy S23 or especially S22 families.

Galaxy S24 a good option for Samsung fans in the U.A.E.

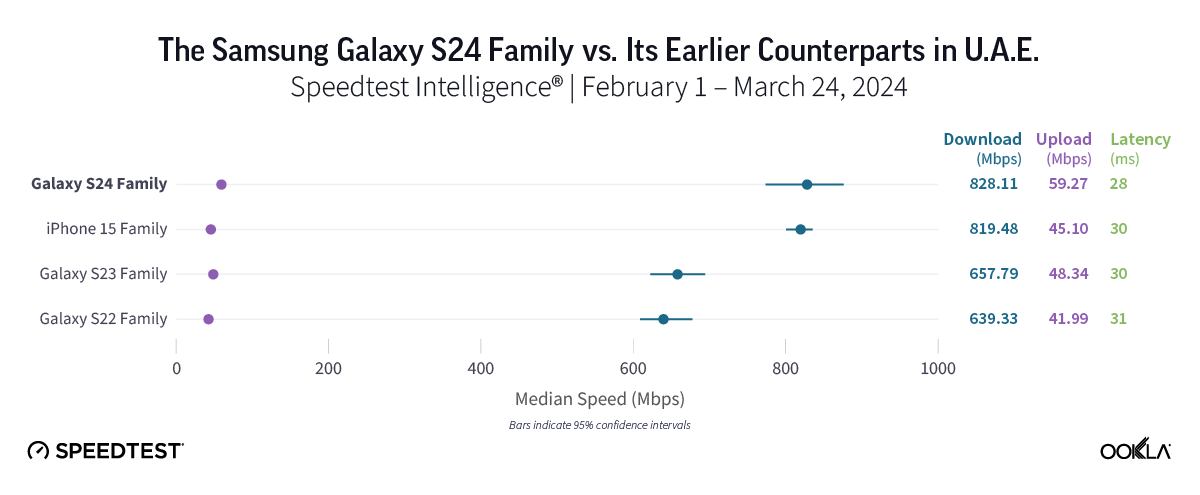
In the U.A.E., which is home to outstanding 5G speeds in general, the Samsung Galaxy S24 and iPhone 15 families delivered the top median 5G download speeds in the market at 828.11 Mbps and 819.48 Mbps, respectively. When compared to its earlier generation Samsung predecessors, the S24 family held a commanding speed advantage, boasting speeds that were at least 170 Mbps higher than those of either the S22 (639.33 Mbps) or S23 (657.79 Mbps) families. 

Bottom line: With median 5G download speeds ranging from 639.33 Mbps to 828.11 Mbps, consumers in the U.A.E. will likely enjoy fantastic speeds regardless of device model. However, for current S22 or S23 users hoping to boost their speeds, the Galaxy S24 family stands out as a good choice.

Europe

Galaxy 24 family clocked 5G speeds over 80 Mbps faster than those on S22 devices in France

In France, the Galaxy S24 family was the frontrunner, delivering the fastest median 5G download speed among all device families in the market at 292.15 Mbps. That marks a significant improvement of over 80 Mbps compared to the S22 family’s speed of 211.32 Mbps, along with a jump of more than 60 Mbps compared to the S23’s speed of 229.78 Mbps. Meanwhile, iPhone 15 users experienced the second-fastest median 5G download speed in the market at 257.15 Mbps, with 5G latency nearly identical to that of the S22 and S23 families.

Bottom line: For consumers currently using an S23 or especially an S22 model, upgrading to an S24 device is worth considering. Our results in France showed that the latest Samsung lineup delivered a superior 5G speed experience over older Galaxy models, especially those in the Galaxy S22 family.

Galaxy S24’s a good choice over S22 models in Spain

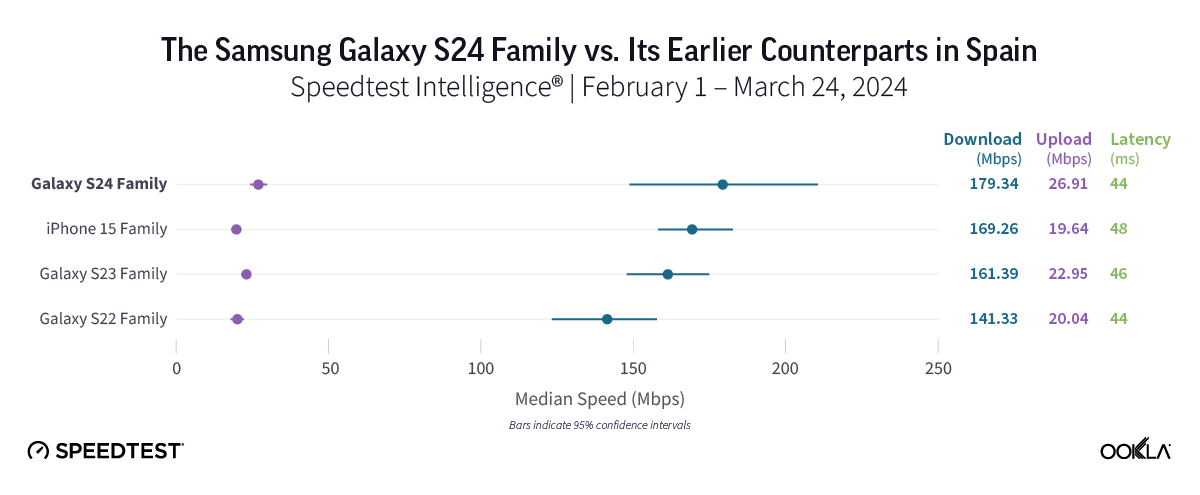
All four device families in Spain provided good 5G speeds, ranging from the S22’s median 5G download speed of 141.33 Mbps to the S24 family’s speed of 179.34 Mbps. While speeds recorded on S24, S23, and iPhone 15 devices were statistically similar, the difference in speed between the S24 and S22 was much starker, with the S24 nearly 40 Mbps faster than the S22. 

Bottom line: The decision to upgrade should be more straightforward for S22 users in Spain compared to those with S23 or iPhone 15 models, as the S24’s median 5G download speed of 179.34 Mbps was almost 40 Mbps faster than that of the S22 family. 

Samsung Galaxy S24 likely worth an upgrade from S22 in the U.K. 

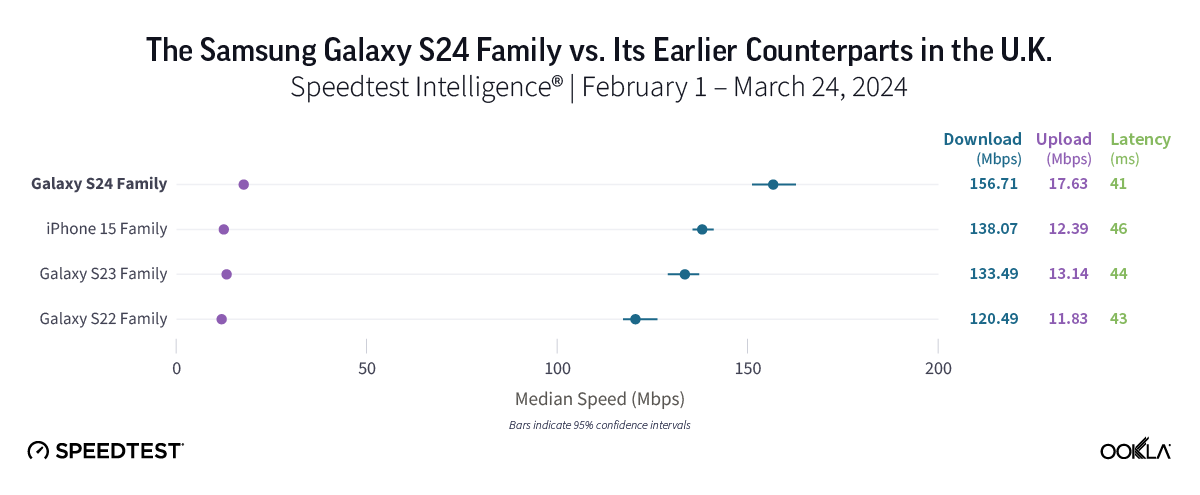
In the U.K., Samsung Galaxy S24 models were the fastest in the market, with the S24’s median 5G download speed of 156.71 Mbps offering a speed gain of nearly 40 Mbps compared to the Galaxy S22 family. Galaxy S24 models also posted faster speeds than both the Galaxy S23 and iPhone 15 families, but the difference was less stark than it was with the S22 family, with Galaxy S22 models clocking in at 120.49 Mbps, Galaxy S23’s at 133.49 Mbps, and iPhone 15’s at 138.07 Mbps. 

Bottom line: U.K. consumers using either S22 or S23 models may want to look into upgrading to the S24 to enjoy faster speeds. That’s especially true for S22 users, given that the S24’s median 5G download speed was nearly 40 Mbps faster than that of S22 devices.

North America

No major 5G speed boost for users in Mexico who upgraded to a Galaxy S24 

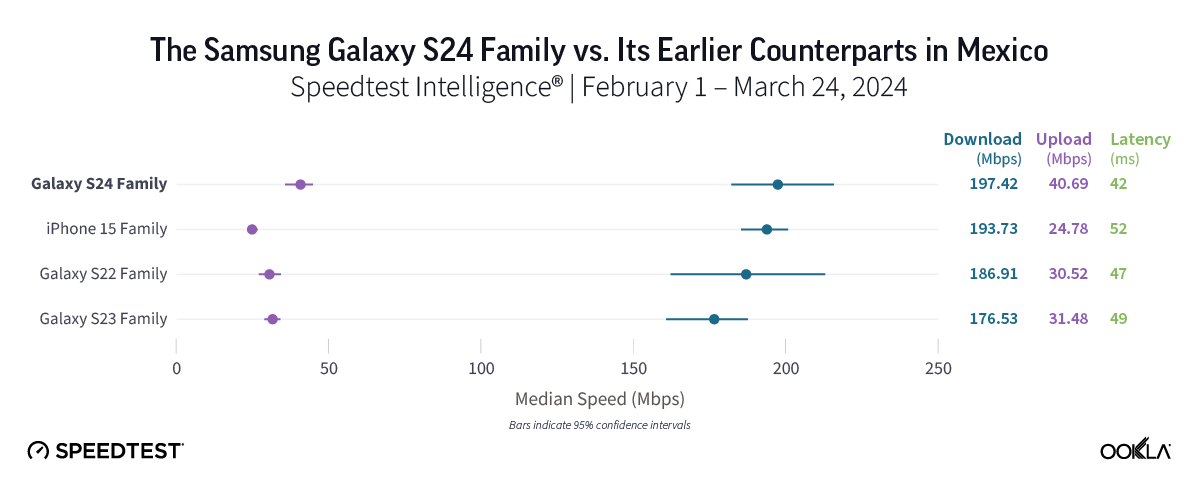
5G speeds in Mexico were impressive, with all device families posting median 5G download speeds of 176.53 Mbps or better. While Speedtest users of the Galaxy S24 family experienced the fastest median 5G download speed in the market at 197.42 Mbps, that speed marked only a modest improvement compared to Galaxy S22 devices (186.51 Mbps) and iPhone 15 models (193.73 Mbps). The Galaxy S23 family showed the slowest 5G speed in the market at 176.53 Mbps, coming in about 20 Mbps slower than Galaxy S24 models

Bottom line: For users eager to embrace the new features offered by Galaxy S24 devices or move on from S23 devices, an upgrade might be worthwhile. However, with fast 5G speeds across all device families in Mexico and only about 20 Mbps separating all four device families in our study, users likely won’t see a major change in their 5G experience by upgrading. 

Galaxy S22 users in the U.S. could get faster 5G with the S24 family. 

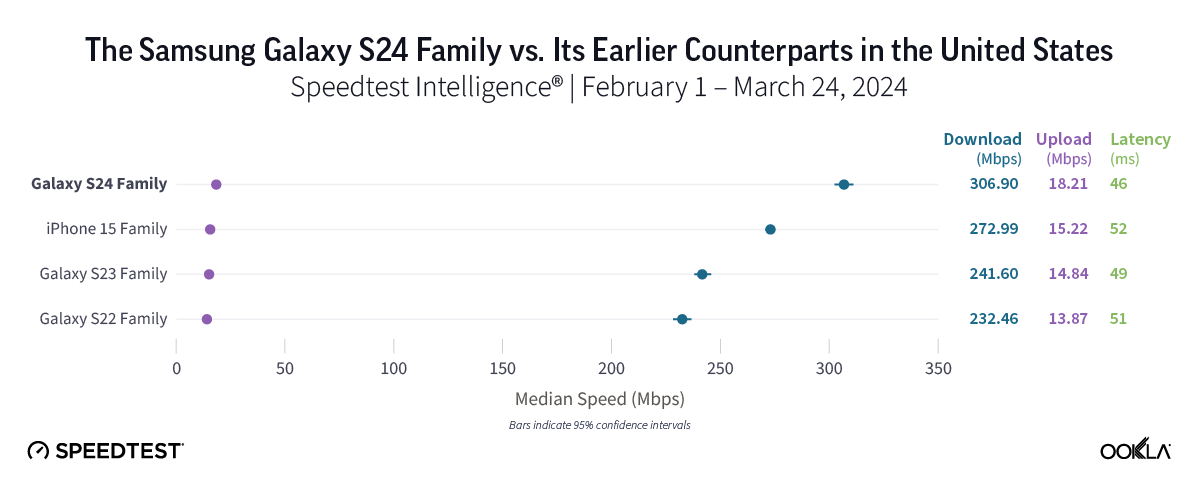
5G speeds in the U.S. had an impressive showing across the board, with median 5G download speeds of at least 232.46 Mbps across all device families. The Samsung Galaxy S24 family led the way with an excellent median 5G download speed of 306.90 Mbps and the lowest median 5G multi-server latency at 45.71 ms. Users of the Galaxy S24 family enjoyed speeds roughly 75 Mbps faster than those on S22 models (232.46 Mbps) and approximately 65 Mbps faster than those on S23 devices (241.60 Mbps). Meanwhile, the iPhone 15 family also offered a strong performance, with a median 5G download speed of 272.99 Mbps. 

Bottom line: Users of older Samsung device models in the United States may want to switch to one of the newer models to capitalize on the faster 5G speeds offered by S24 devices, though speeds were strong for all device families in this study. 

Ookla will continue monitoring how devices are performing 

We’ll continue to check in on device performance as new models enter the market, so stay tuned for further insights into mobile and fixed broadband performance in countries around the world. 

If you’ve recently made the switch to an S24 device, make sure you’re getting the speeds you need by downloading the iOS or Android Speedtest® app.

Ookla retains ownership of this article including all of the intellectual property rights, data, content graphs and analysis. This article may not be quoted, reproduced, distributed or published for any commercial purpose without prior consent. Members of the press and others using the findings in this article for non-commercial purposes are welcome to publicly share and link to report information with attribution to Ookla.
| November 12, 2024

More Fast, Free Airport Wi-Fi Just in Time for the Holidays

Airports in the United States have seen record-breaking numbers of travelers this year, and the always-busy Thanksgiving weekend could put even more stress on airport services. Including free Wi-Fi. We took a careful look at recent performance at the 50 largest airports by passenger volume in the U.S. as part of our ongoing series to help you plan ahead. Speeds have slipped at some of the top airports, but two more airports have free Wi-Fi download speeds over 150 Mbps than last year. Read on for details.

10 airports have free fixed broadband Wi-Fi over 150 Mbps

Fixed Broadband Internet Download Speeds Over Free Wi-Fi at U.S. Airports
Speedtest Intelligence® | Q3 2024
A map showing fixed broadband speeds in selected airports in the United States.

Chart of Fixed Broadband Internet Speeds Over Free Wi-Fi at U.S. Airports

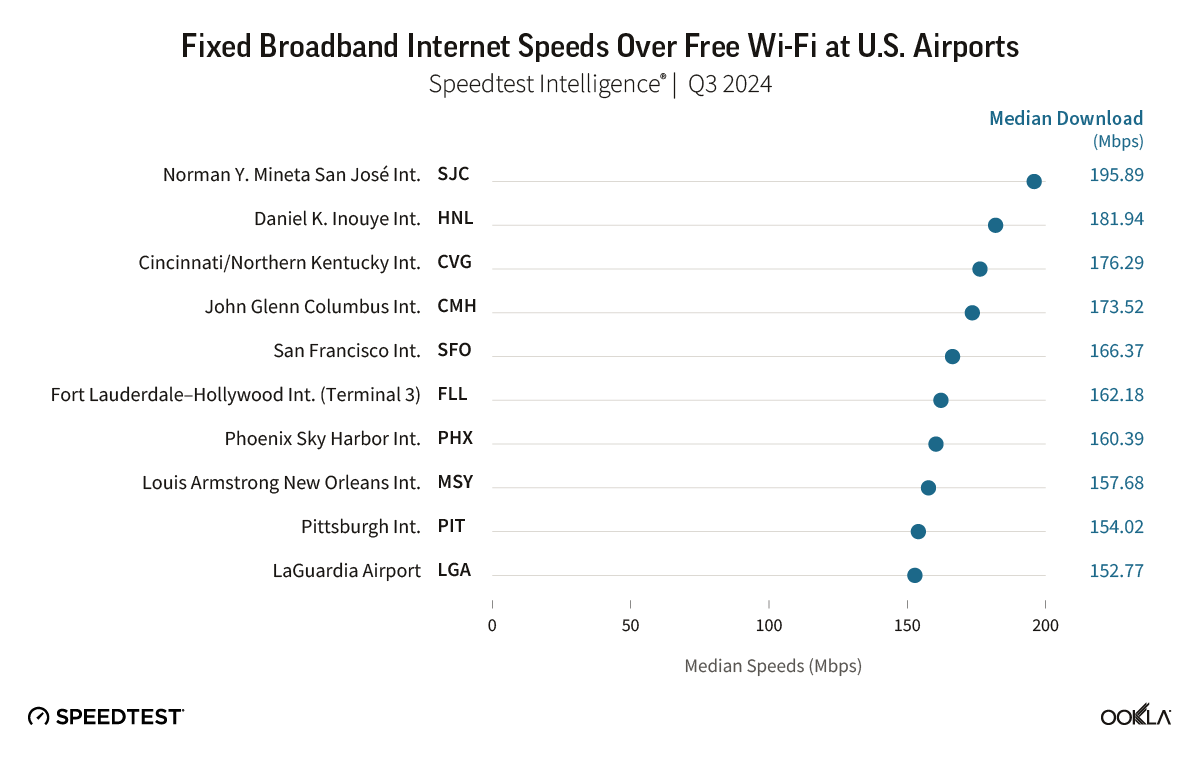
Speedtest Intelligence® shows Norman Y. Mineta San José International Airport, Daniel K. Inouye International Airport, and Cincinnati/Northern Kentucky International Airport were once again home to some of the fastest free airport Wi-Fi among the country’s busiest airports, with median download speeds of 195.89 Mbps (down from 259.37 Mbps last year), 181.94 Mbps (down from 187.58 Mbps), and 176.29 Mbps (down from 210.09 Mbps), respectively, during Q3 2024.  

Rounding out the top 10 were:

  • John Glenn Columbus International Airport (173.52 Mbps),
  • San Francisco International Airport (166.37 Mbps), 
  • Fort Lauderdale–Hollywood International Airport (162.18 Mbps in Terminal 3), 
  • Phoenix Sky Harbor International Airport (160.39 Mbps), 
  • Fort Lauderdale–Hollywood International Airport (158.38 Mbps), 
  • Louis Armstrong New Orleans International Airport (157.68 Mbps), 
  • Pittsburgh International Airport (154.02 Mbps), and LaGuardia Airport (152.77 Mbps). 

Keep in mind that 150 Mbps is more than fast enough for 4K streaming and multi-player gaming

Ekahau®, our Wi-Fi solution, helps airports and other large-scale businesses ensure the networks you depend on are meeting your needs. Unfortunately, some airports are still not meeting the Wi-Fi optimization challenge. Specifically, two airports (William P. Hobby Airport and George Bush Intercontinental Airport) showed median download speeds over Wi-Fi of less than 25 Mbps. However, we are heartened that this is down from five last year with Raleigh-Durham International Airport, Philadelphia International Airport (Free PHL Airport WiFi-24), and Logan International Airport graduating by improving their speeds.

There was one change to our airport list this year, which is based on passenger volume: Kahului Airport was removed and John Glenn Columbus International Airport added. We have not included Kansas City International Airport, San Francisco Bay Oakland International Airport, San Antonio International Airport, or San Diego International Airport because there were insufficient samples.

Fort Lauderdale-Hollywood International Airport splits their free airport Wi-Fi among four separate SSIDs for different terminals, which we have listed separately in these results. While terminals 2 and 3 have a slight edge, the performance does not vary widely enough between them to intentionally hang out in the wrong terminal just to get a minor bump in speed, but if you’re in Philadelphia you definitely want to choose “Free PHL Airport WiFi” when possible, rather than “Free PHL Airport WiFi-24” if your device supports 5 GHz.

Mobile performance at 24 airports beats 150 Mbps

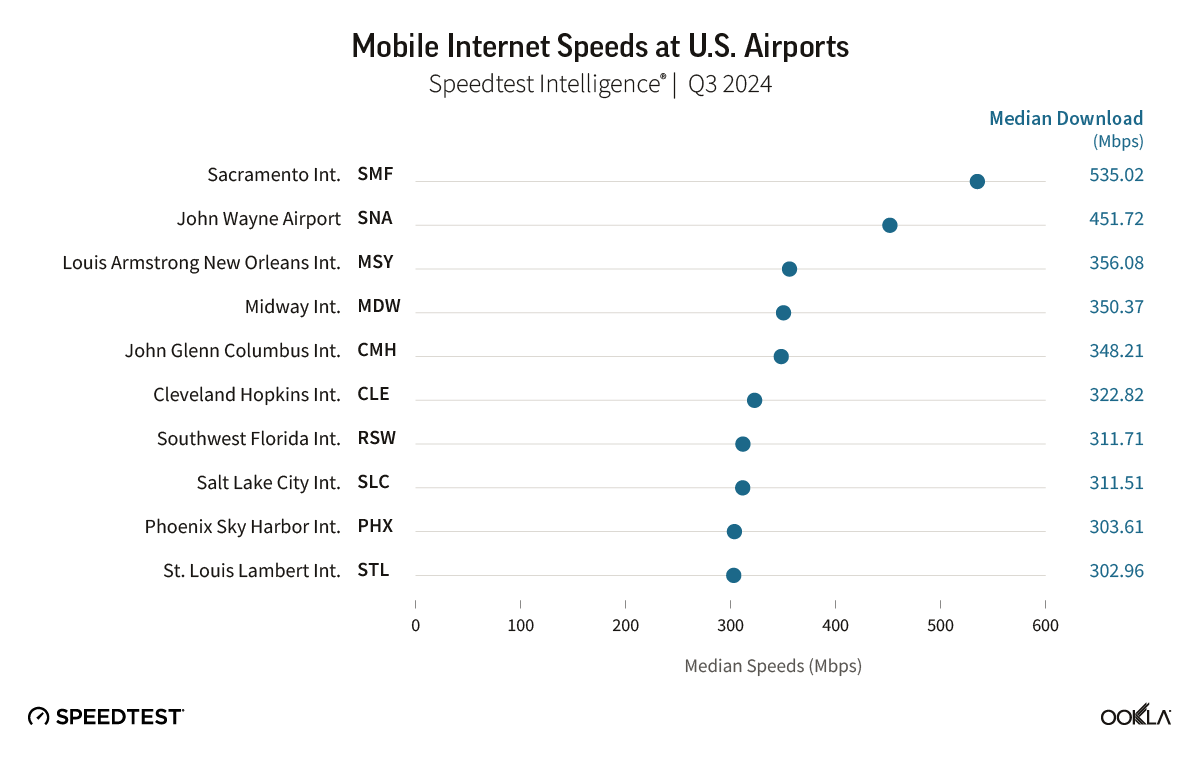
Mobile Internet Download Speeds at U.S. Airports
Speedtest Intelligence® | Q3 2024

Chart of Mobile Internet Speeds at U.S. Airports

Speedtest Intelligence® shows Sacramento International Airport and John Wayne Airport were the fastest airports on our list for mobile download speed during Q4 2024 at 535.02 Mbps and 451.72 Mbps, respectively. In all, 24 airports in our study had median download speeds over 150 Mbps, up from 18 in 2023. Fifteen of the airports showed median download speeds over 200 Mbps in 2024. 

We’re happy to report that no airport on our list showed median mobile download speeds of less than 25 Mbps.

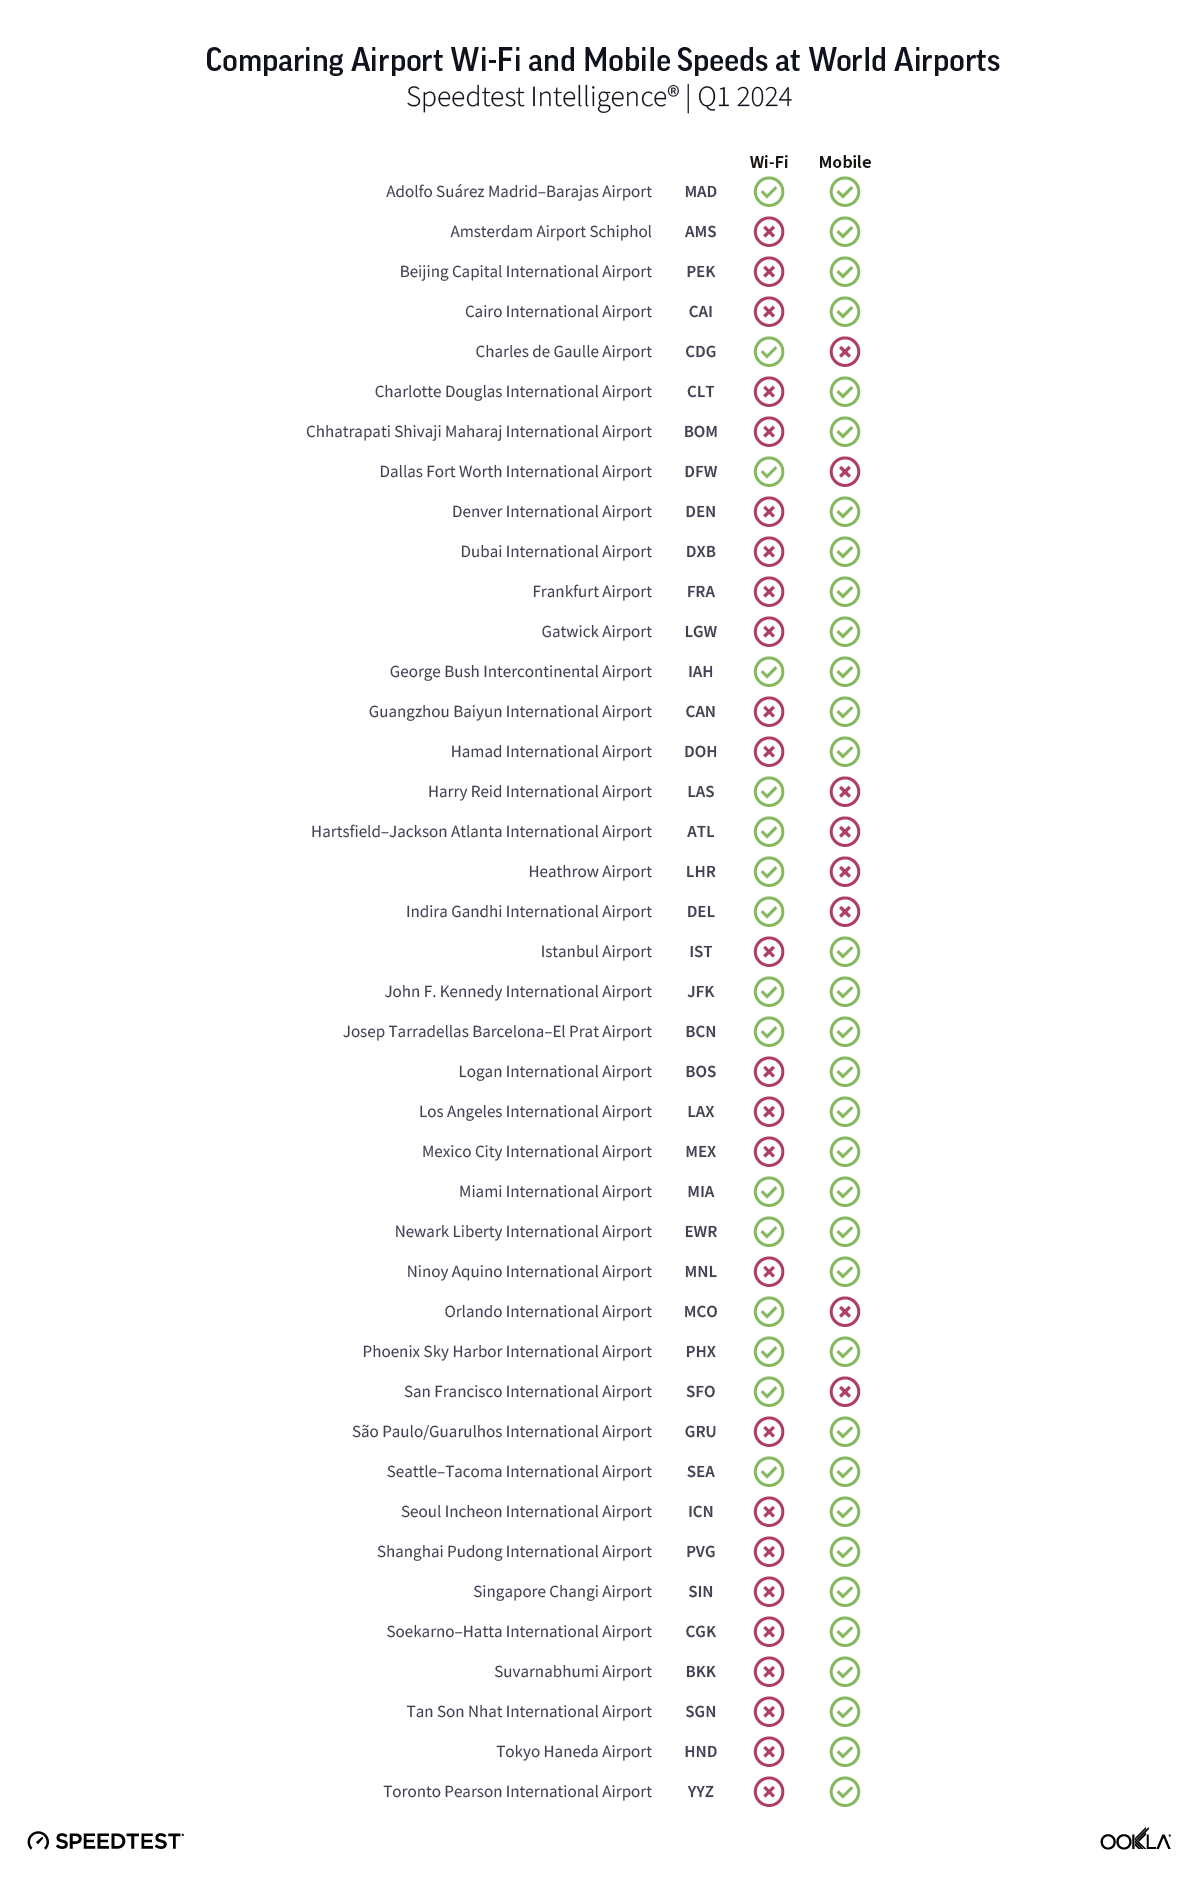
Wi-Fi or mobile? The airports where it makes a difference

Where Wi-Fi wins

Wi-Fi is the fastest choice at 10 airports where download speed over mobile network service is significantly slower than the free airport Wi-Fi. Details on how much faster the Wi-Fi is than mobile are as follows:

  • 102% at Hartsfield–Jackson Atlanta International Airport, 
  • 90% at Orlando International Airport, 
  • 82% at San Francisco International Airport, 
  • 77% at Dallas/Fort Worth International Airport, 
  • 70% at Seattle-Tacoma International Airport, 
  • 42% at Baltimore/Washington International Airport, 
  • 28% at John F. Kennedy International Airport, 
  • 25% at Harry Reid International Airport, and 
  • 10% at Daniel K. Inouye International Airport. 

It’s important to note that many of these differences are smaller than last year as mobile speeds are catching up to Wi-Fi capabilities.

Places to choose mobile service instead

Twenty-nine airports had faster download speeds over mobile than over free airport Wi-Fi during Q3 2024. Special mention goes to the following airports with massive improvements:

  • Southwest Florida International Airport showed mobile service 635% faster than airport Wi-Fi,
  • Mobile at Tampa International Airport was 528% faster than Wi-Fi, and 
  • Mobile was 341% faster than airport Wi-Fi at Sacramento International Airport. 

Mobile service was 4X faster than airport Wi-Fi at:

  • Salt Lake City International Airport, Logan International Airport, and 
  • Cleveland Hopkins International Airport. 

Mobile was 3X faster than airport Wi-Fi at: 

  • Philadelphia International Airport, 
  • Indianapolis International Airport, 
  • John Wayne Airport, 
  • Denver International Airport, 
  • Detroit Metropolitan Airport, and 
  • George Bush Intercontinental Airport. 

Mobile service was 2X faster at: 

  • Raleigh-Durham International Airport, 
  • Midway International Airport, 
  • Portland International Airport, 
  • St. Louis Lambert International Airport, 
  • Austin–Bergstrom International Airport, 
  • William P. Hobby Airport, 
  • Minneapolis–Saint Paul International Airport, 
  • Los Angeles International Airport, 
  • Louis Armstrong New Orleans International Airport, 
  • Phoenix Sky Harbor International Airport, 
  • John Glenn Columbus International Airport, 
  • Ronald Reagan Washington National Airport, and 
  • Miami International Airport. 

And mobile service was 1X faster than airport Wi-Fi at: 

  • Charlotte Douglas International Airport, 
  • Washington Dulles International Airport, 
  • LaGuardia Airport, and 
  • Nashville International Airport.

All in all, it looks like your airport internet will probably be faster than the security line, and in many airports, faster than your mobile service. Set yourself up for success by downloading a few of your favorite shows along with the Speedtest apps for Android and iOS before you leave the house. And while you’re waiting for that flight, help out travelers next year by taking a Speedtest at the airport to share your experience. 

Ookla retains ownership of this article including all of the intellectual property rights, data, content graphs and analysis. This article may not be quoted, reproduced, distributed or published for any commercial purpose without prior consent. Members of the press and others using the findings in this article for non-commercial purposes are welcome to publicly share and link to report information with attribution to Ookla.
| March 6, 2024

Introducing Speedtest® Network Status

You know Ookla® Speedtest as a powerful tool to diagnose and troubleshoot your internet connection, and we know sometimes you simply need a quick look at whether or not you’re connected. We’ve improved the Speedtest app to give you just that. With our new Network Status feature, you can open the Speedtest app and quickly see whether your device is online or not. This immediately tells you if you need to focus your troubleshooting on getting connected – or if you can dig deeper to fine-tune your network connection.

How Network Status works

Animated gif of blue status "checking your internet connection" screen within mobile Speedtest appFirst, a blue circle

You’ll see a blue circle around the Go button when you open the Speedtest app, along with a “Checking your internet connection” message. During this time we are sending multiple requests to multiple services to check your online status. The Speedtest app determines your device connectivity strength based on the success rate of these requests. You’ll see the circle change to green, yellow, or red, depending on the state of your connection.

Animated gif of green status "you are connected to the internet" screen within mobile Speedtest appA green circle confirms you’re connected

If the initial check is successful, the circle around the Go button will change to green and you’ll see a “You are connected to the internet” message. Hooray! This means you’re ready to run a Speedtest to get the full picture of your internet performance or a video test to see if your connection is streaming ready. You can also check out the Downdetector tab to see if the services and sites you want to connect to are experiencing difficulties or click on the map tab for a look at coverage in your area.
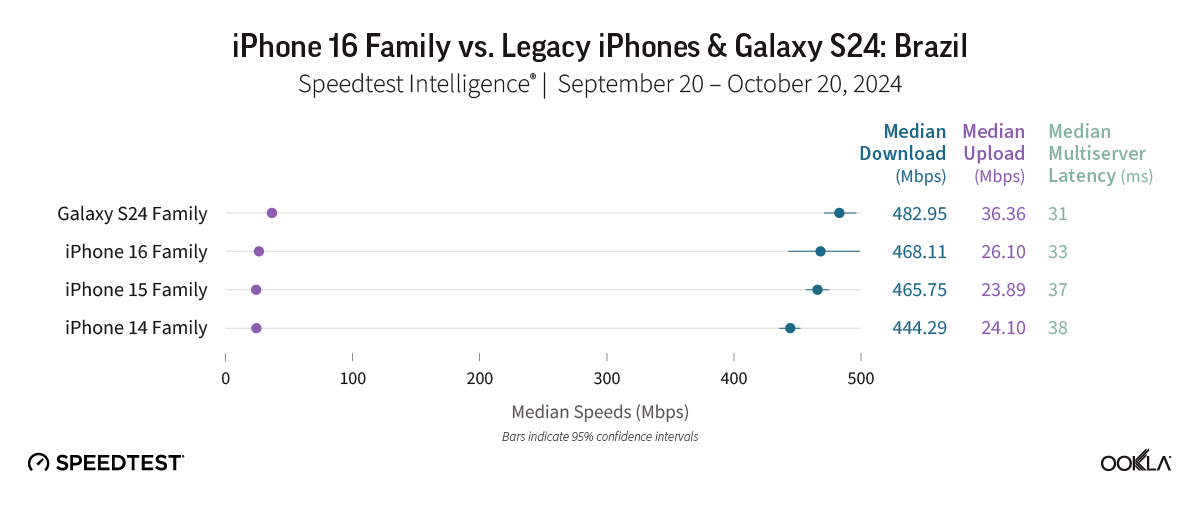
Animated gif of yellow status "Your internet connection may be unstable" screen within mobile Speedtest appA yellow circle means something isn’t quite right

You’ll see a yellow circle and a “Your internet connection may be unstable” message if the response rate to the initial check is lower than expected. You can still proceed with using the Speedtest app or the internet at large, but you may not get the performance you are hoping for.
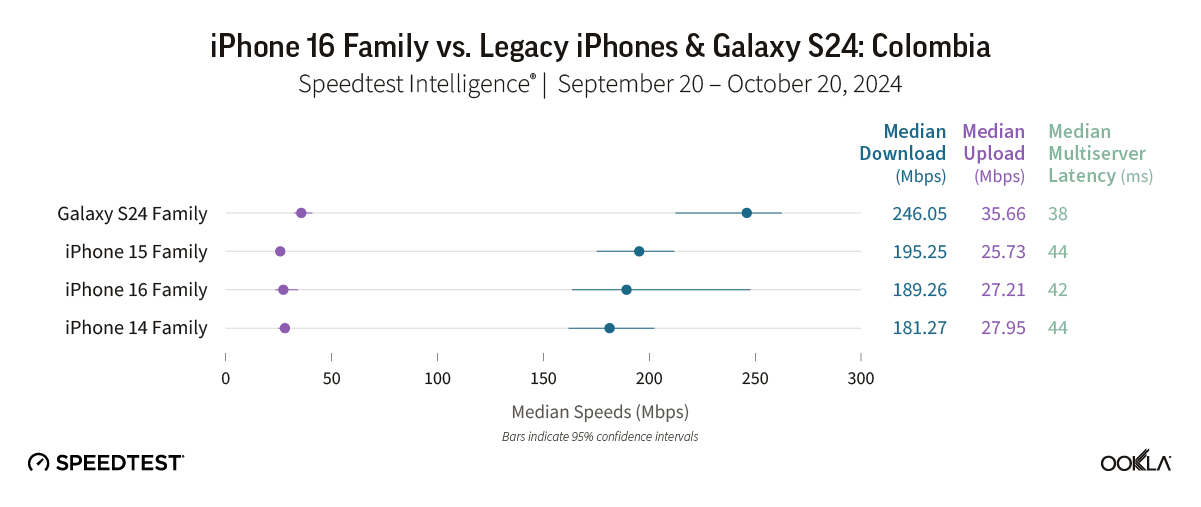
Animated gif of red status "Check your connection, taking a Speedtest may fail" screen within mobile Speedtest appA red circle indicates you’re probably disconnected
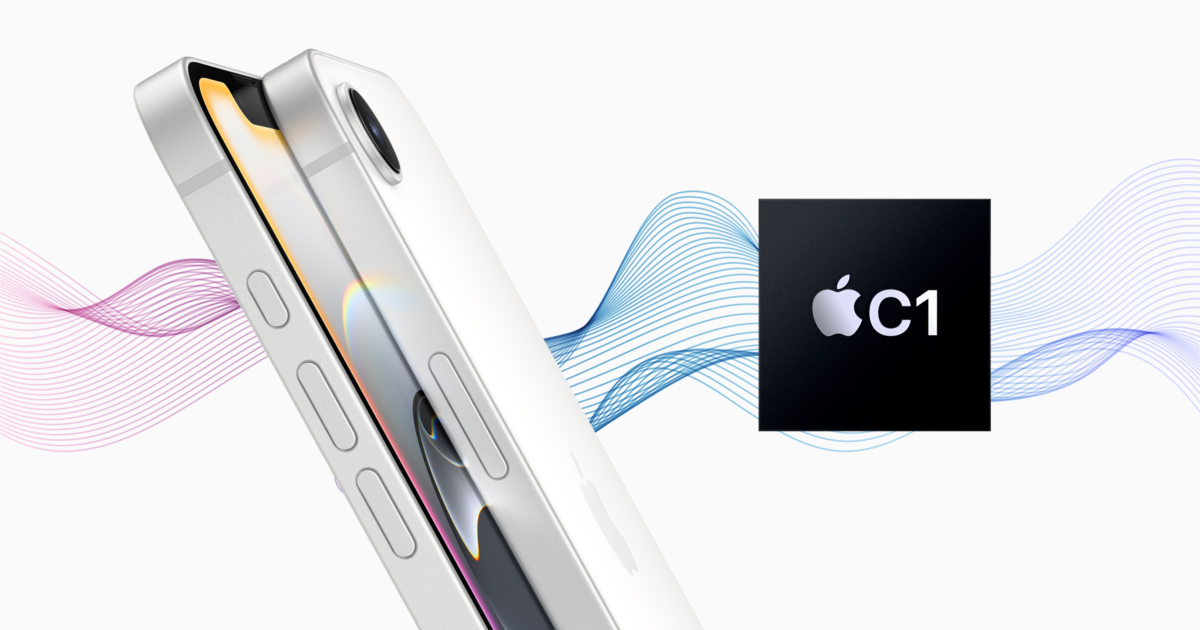
The circle around the Go button will turn red if there is a really poor response rate (or no response) to the initial check. You’ll also get a “Check your connection, taking a Speedtest may fail” message. This is a good time to see if your device is in airplane mode or if you might need a restart. It could also indicate that you have no coverage if you’re on a mobile network or that your Wi-Fi is experiencing difficulties if you’re trying to use Wi-Fi.

Network Status offers a quick check for users who need it

We know you don’t always need the full performance evaluation Speedtest provides, and we know that data is sometimes limited and usage can be expensive in some parts of the world. Network Status gives you a lightweight peek at what’s happening with your network just by opening the Speedtest app. You’ll have real-time information about whether you’re connected to a network and then you can take a Speedtest to get the full view of your network’s performance if you need it.

Network Status is already available in the Speedtest app for Android and iOS. Open the Speedtest app on your device to try it today or download the app using Google Play or the Apple App Store. If you don’t see the new Network Status feature, update your app to the latest version.

Ookla retains ownership of this article including all of the intellectual property rights, data, content graphs and analysis. This article may not be quoted, reproduced, distributed or published for any commercial purpose without prior consent. Members of the press and others using the findings in this article for non-commercial purposes are welcome to publicly share and link to report information with attribution to Ookla.