Mobile networks are entering a new phase in 2026. The focus has shifted from headline speed gains to how networks perform under pressure. Operators and regulators are asking a more practical question: can networks deliver reliable, low-latency, resilient connectivity under real-world stress?
The stakes of that question become clear in high-pressure moments. A packed stadium where thousands of users try to upload video at the same time. A busy city center during peak commuting hours. An industrial facility running latency-sensitive robotics. A regional power outage where mobile networks become the last remaining communications layer. In each case, peak throughput matters less than consistency, responsiveness, and continuity.
5G Standalone (5G SA) sits at the center of the shift toward latency, resilience, and real-world performance. The standalone 5G architecture promises lower latency, stronger quality-of-service controls, and a foundation for 5G Advanced. Yet global rollout remains uneven, monetization remains challenging, and policy debates around resilience and sovereignty are reshaping how telecom infrastructure is governed. The state of 5G SA in 2026 reflects all of those tensions at once.
For a deeper look at how these forces are playing out globally, watch our on-demand webinar, 5G Standalone in 2026: Global Performance, Monetization Momentum, and the New Era of Infrastructure Sovereignty.
5G SA Is Expanding, but the Global Gap Is Growing
5G Standalone removes the LTE anchor used in non-standalone (NSA) deployments and connects devices directly to a 5G core. That architectural shift reduces signaling overhead and gives operators greater control over latency, traffic management, and quality-of-service enforcement. In practical terms, it enables capabilities such as network slicing, uplink prioritization, and more predictable responsiveness.
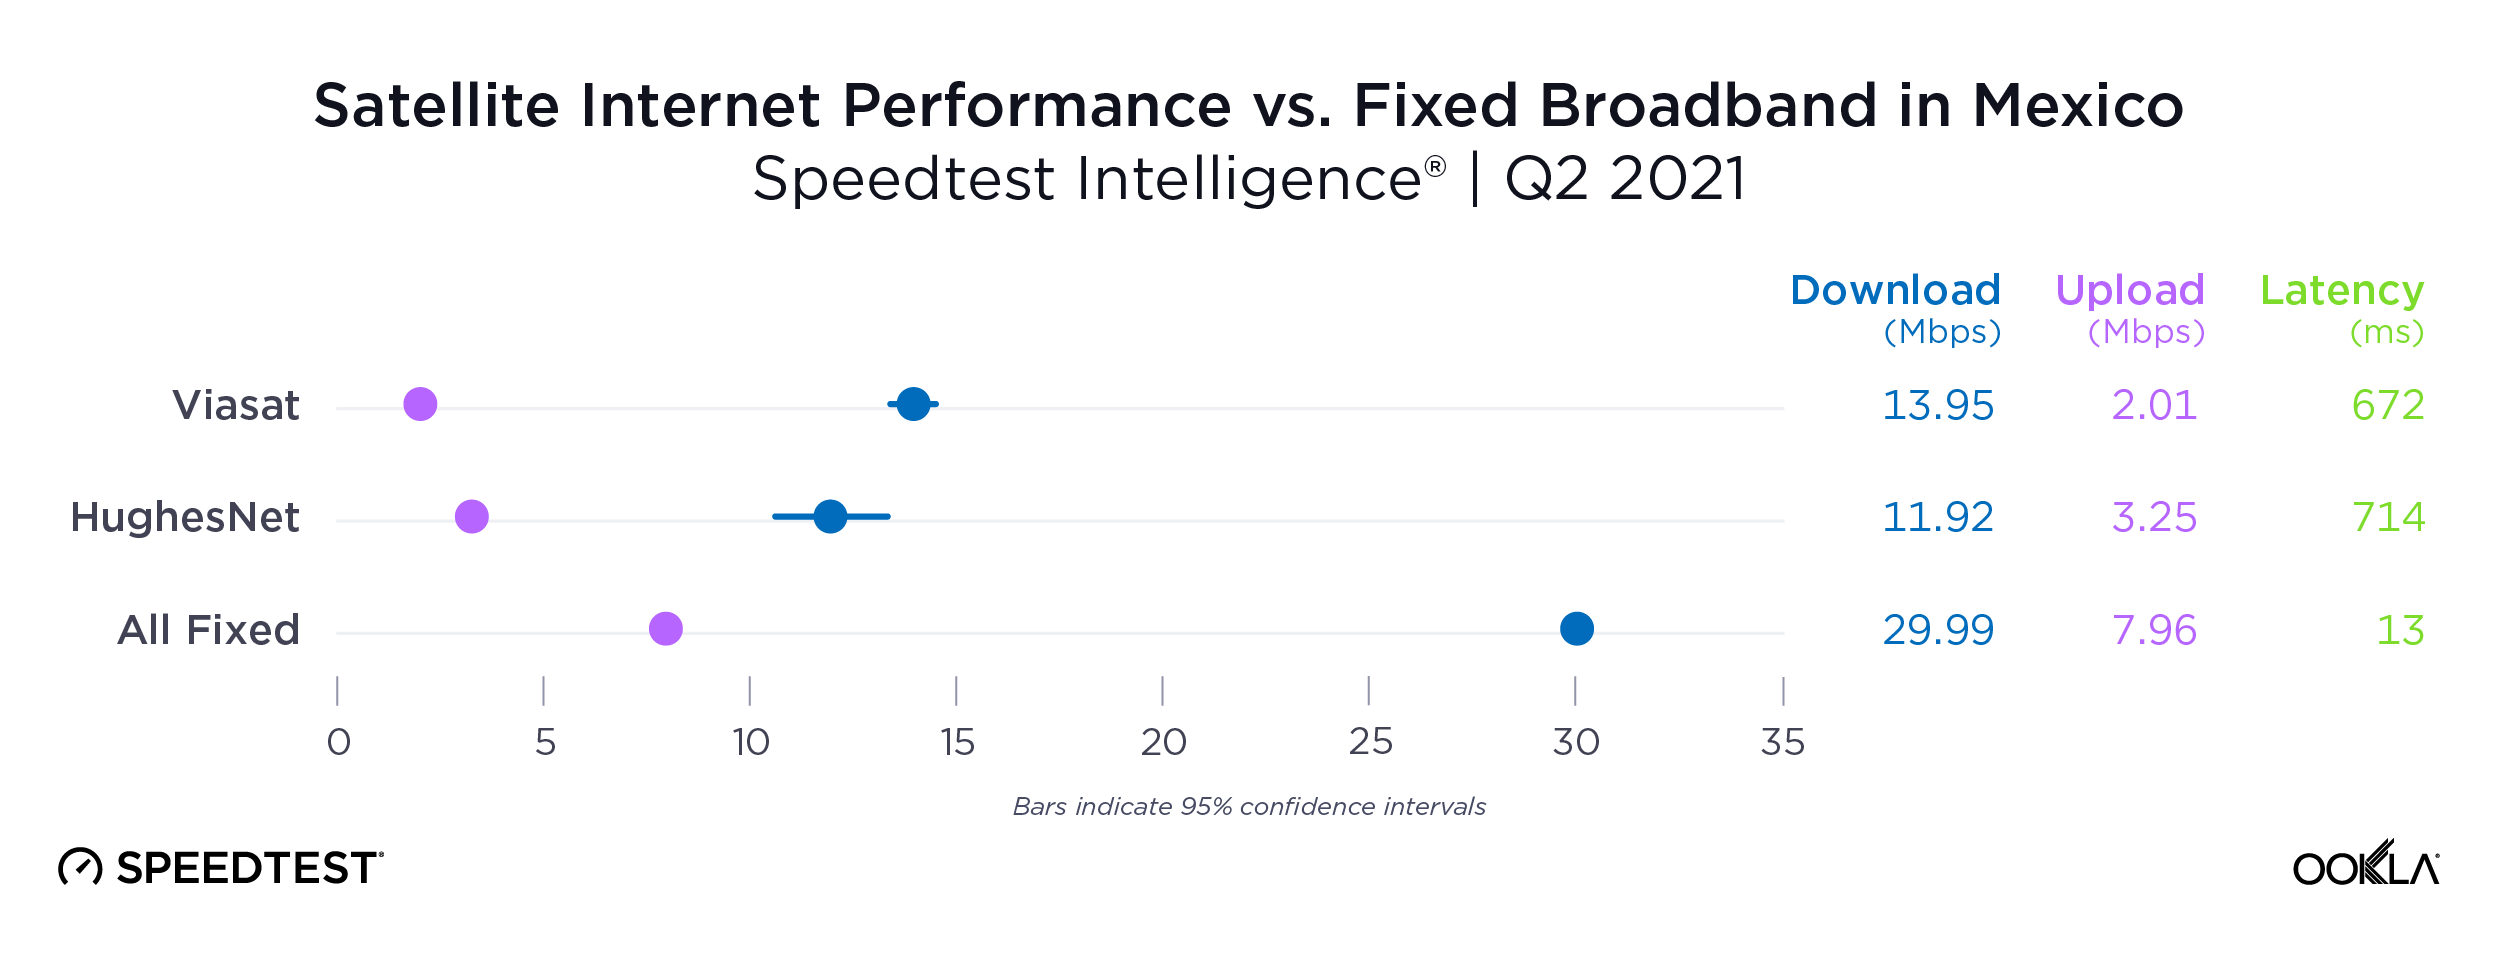
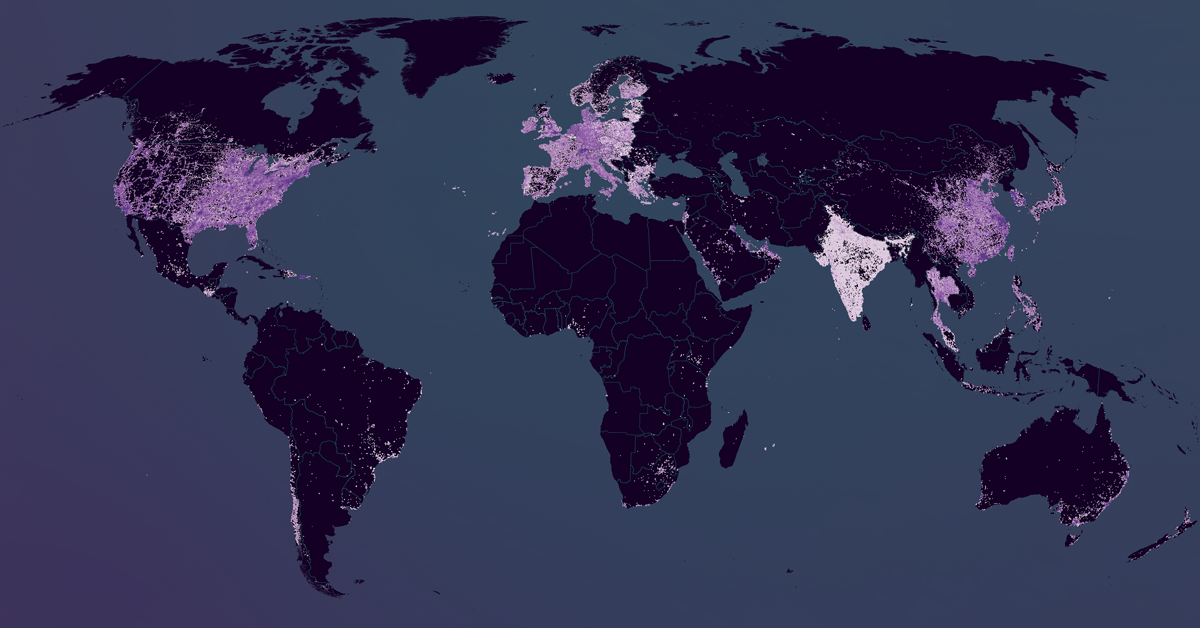
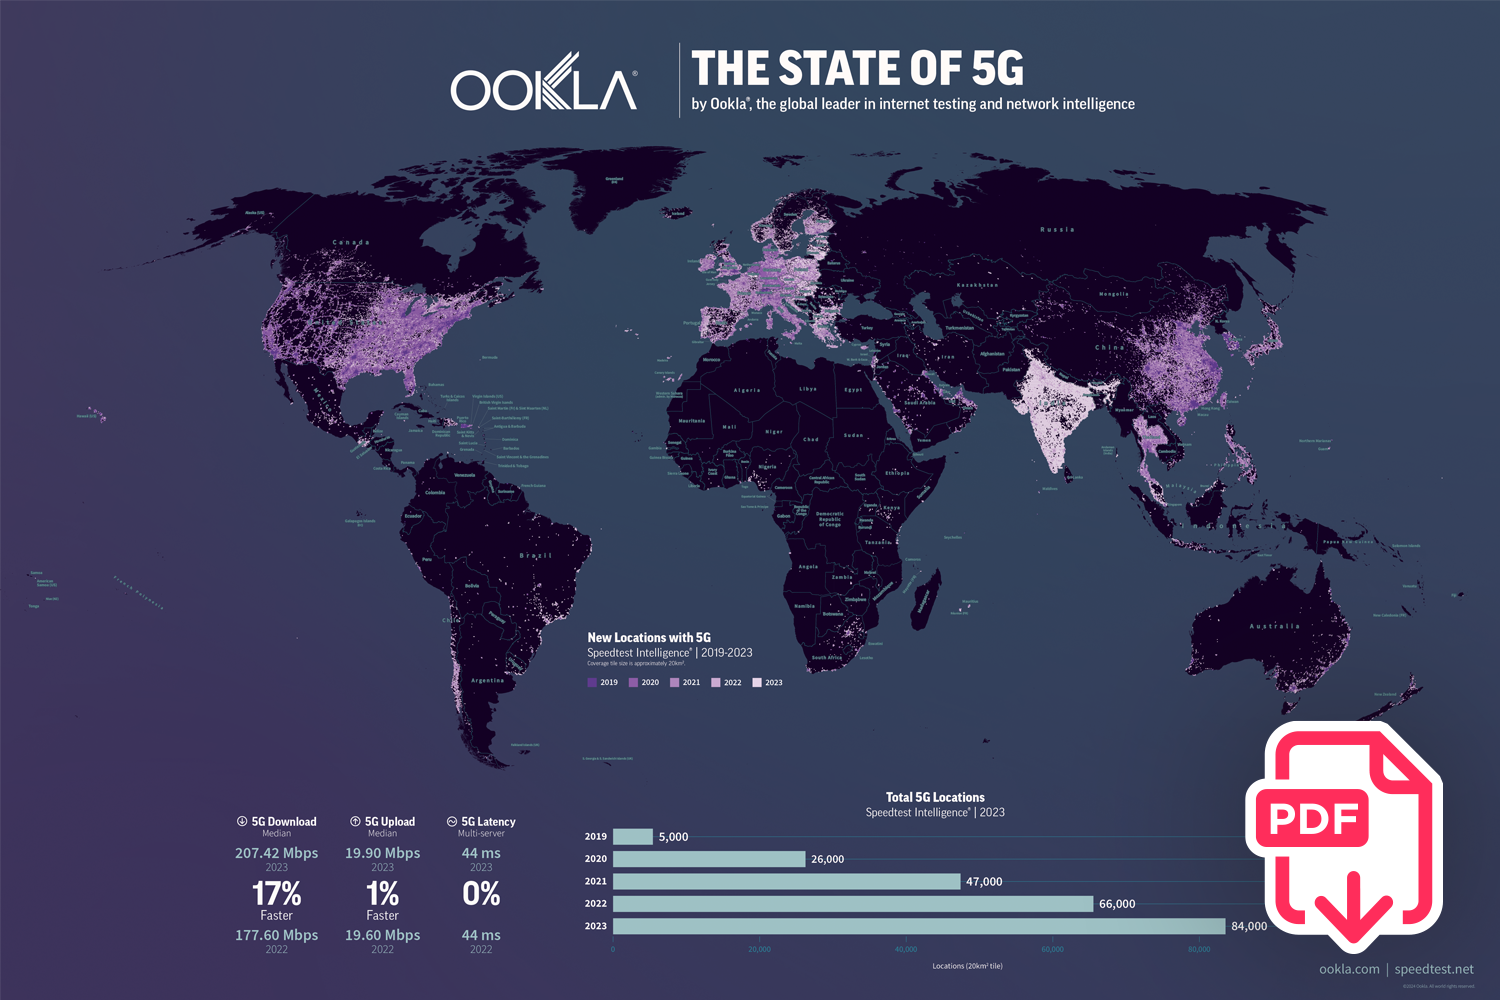
Adoption levels, however, vary dramatically by region, and those differences have real performance and competitive consequences. According to Speedtest Intelligence data, China, for instance, has reached roughly 80% 5G SA sample share, reflecting nationwide commercial cores across major operators. India is approaching 50% penetration, though adoption is concentrated within one large operator.
Meanwhile, the United States is nearing one-third SA share as carriers expand commercialization, while much of Europe remains in the low single digits, as operators continue prioritizing returns on earlier NSA investments.
Several structural factors shape SA adoption:
- Core deployment complexity: Moving to a standalone core involves integration across cloud infrastructure, vendors, and operations—it is not as simple as switching on new software.
- Device configuration: Even when handsets are SA-capable, firmware activation and carrier provisioning can delay actual SA usage.
- Plan migration: Commercial rollout depends on operators actively migrating subscribers onto SA-enabled plans, which does not happen automatically.
- Spectrum mix and aggregation: The balance between low-band spectrum for coverage and mid-band spectrum for capacity—combined with effective carrier aggregation—determines whether SA delivers meaningful performance gains.
Real-world penetration ultimately depends on how much subscriber traffic actually migrates onto standalone networks. While standalone 5G is clearly expanding, the gap between leading and lagging markets is widening—and that fragmentation will shape competitive dynamics heading into 2026.

Latency Is Where 5G SA Makes Its Most Meaningful Difference
Latency is where the benefits of 5G SA become most visible. Fast download speeds remain critical for everyday experiences like streaming high-resolution video, downloading large files, or loading rich web content. But many emerging and mission-critical applications depend on responsiveness as well—often referred to in technical standards as Ultra-Reliable Low-Latency Communications (URLLC)— including real-time cloud collaboration, remote control of industrial equipment, interactive gaming, and AR-assisted workflows. In those environments, lower and more consistent latency can matter as much as, or more than, peak throughput.

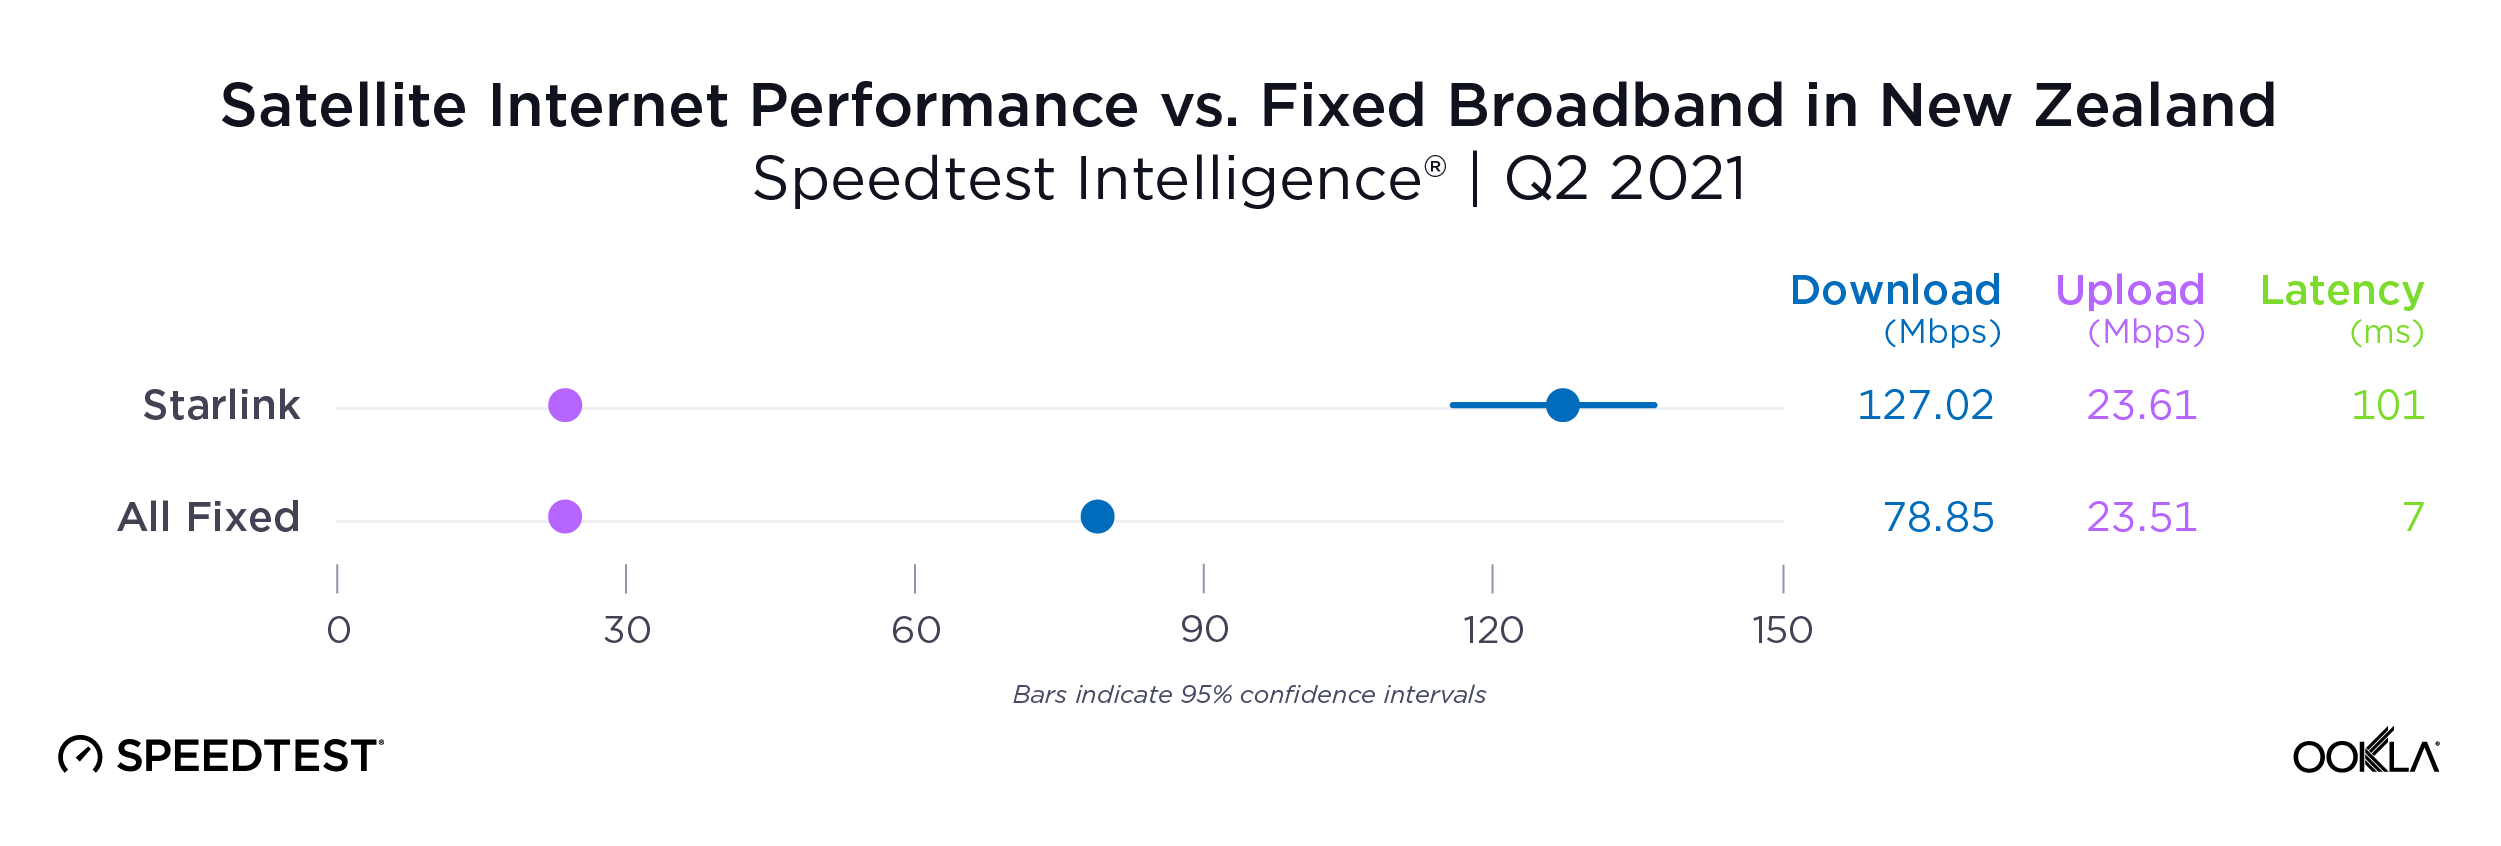
Globally, 5G SA delivered roughly a 23% reduction in median latency compared with NSA deployments. In some markets, the improvement was even more pronounced:
- Hong Kong (~43% improvement vs. NSA): The standalone architecture reduced signaling overhead and delivered materially faster multi-server responsiveness.
- France (~31% improvement vs. NSA): Routing traffic fully through the 5G core improved latency levels and consistency compared with NSA.

Download performance also remained strong on 5G SA, although speed gains often reflect spectrum strategy (i.e., carrier aggregation and mid-band usage) as much as architecture. In Q3 2025, several markets stood out:
- UAE (~1.2 Gbps median SA download): Aggressive mid-band deployment and strong carrier aggregation pushed median speeds above 1 Gbps.
- South Korea (>700 Mbps median SA download): Mature 3.5 GHz mid-band deployment continued to deliver strong, sustained throughput.
- United States (>300 Mbps median SA download): Expanded multi-band standalone rollout translated into steady, measurable download improvements year-over-year.

However, architecture alone does not guarantee superior user experience. Performance outcomes still depend heavily on deployment decisions and optimization. Several factors explain why results can vary across operators and markets:
- Spectrum mix and coverage balance: Heavy mid-band deployments boost capacity but can struggle indoors without complementary low-band support. Low-band improves reach but limits peak speed.
- Carrier aggregation strategy: Without effective aggregation and uplink tuning, standalone gains can level off under heavier traffic loads.
- Core placement and routing efficiency: CDN proximity, User Plane Function placement, and peering strategy directly affect end-to-end latency—sometimes more than radio conditions do.

In some markets, latency to major cloud-hosted services improved significantly under SA, while gaming latency showed little change in Europe. That gap highlights an important reality: improvements in the radio network do not automatically translate into consistent gains across every application unless optimized.
5G SA delivers measurable performance improvements—particularly in latency. The strongest results appear when core architecture, spectrum strategy, and routing decisions are aligned with real-world usage patterns.
Monetization Remains the Central Question
5G SA’s technical case continues to grow stronger: latency improves, uplink performance becomes more predictable, and download speeds increase. Core-level control becomes more granular. But technical progress does not automatically translate into commercial returns. The monetization challenge heading into 2026 varies sharply between consumer and enterprise segments

Consumer Monetization
For most consumers, network architecture is invisible. They notice when streaming buffers, downloads drag, or apps feel sluggish, but they also notice whether their everyday connectivity feels stable or unreliable. Speed matters, but stability and predictability shape trust over time.
5G SA slices or 5QI configurations can support experiences that users already value:
- Stable uplink performance: Creators uploading high-resolution video or backing up large files expect transfers to complete without mid-stream drops.
- Reliable hotspot use in congested venues: Travelers tethering laptops in airports or conferences need connections that remain usable under load.
- Automatic continuity during broadband outages: 5G backup for home Wi-Fi provides tangible value when fiber or cable service fails, and standalone architecture can help operators manage those connections more predictably.
Improved uplink scheduling, congestion management, and quality-of-service controls can enable these outcomes. However, consumers rarely pay a premium specifically for “standalone” architecture. Monetization is typically attached to reliability features, backup services, or tier differentiation rather than to core network branding.
Enterprise Monetization
Enterprise buyers evaluate networks differently. The question is less about peak speed and more about operational impact. When latency spikes disrupt automated workflows or when connectivity drops affect distributed operations, the cost is measurable.
5G SA aligns more directly with enterprise requirements for URLLC, where industrial automation and robotics depend on consistent, predictable responsiveness:
- Predictable low latency: Industrial automation and robotics depend on consistent responsiveness.
- Network slicing and traffic isolation: Critical applications require guaranteed resources and separation from general network congestion.
- Integration with private and hybrid deployments: Enterprises need interoperability with on-prem systems and edge infrastructure.
- Defined accountability: Service-level guarantees and monitoring matter more than only speed metrics.
Enterprise buyers focus on performance guarantees and operational continuity—not on the underlying network architecture. They pay for performance commitments that protect their operations from outages and instability. In several markets, enterprise deployments are contributing a larger share of 5G revenue growth than consumer plans, particularly in private and hybrid network use cases.
For operators, the question heading into 2026 is how to translate standalone’s technical gains into repeatable revenue streams.
Infrastructure Sovereignty Is Reshaping Telecom Strategy
In 2025, telecom infrastructure was increasingly treated as strategic national infrastructure, alongside energy, transport, and cloud computing. A series of resilience events reinforced that shift. Regional power outages showed how quickly cellular uptime can degrade when grid supply fails. Subsea cable disruptions exposed transport vulnerabilities. Cloud outages demonstrated that software-layer failures can affect network availability even when radio sites remain operational.
Resilience now spans multiple layers:
- Site-level power autonomy: Backup batteries and generators determine how long networks operate during outages.
- Transport redundancy: Multi-path routing reduces single points of failure.
- Core and orchestration reliability: Software resilience affects service continuity.
- Cloud infrastructure dependencies: Hyperscale outages can cascade into network degradation.
Policy frameworks are evolving accordingly. In Europe, proposals such as the Digital Networks Act emphasize coordination, resilience, and infrastructure security. Cybersecurity reforms are tightening vendor scrutiny, and broader industrial strategies increasingly link telecom policy to AI competitiveness and supply chain stability. Other major markets are pursuing parallel strategies, though with different emphases:
- China continues integrating domestic AI development with telecom infrastructure, reinforcing alignment between network deployment and national technology priorities.
- India is accelerating efforts to build local network stack capabilities, reducing reliance on foreign vendors while expanding 5G coverage.
- The United States remains focused on reshoring initiatives and supply chain security, particularly in core infrastructure and semiconductor ecosystems.
- Gulf markets are linking AI readiness and national digitization goals to rapid 5G Advanced deployment timelines.
Telecom strategy increasingly intersects with national resilience planning, industrial policy, and long-term economic competitiveness.
5G Advanced Builds on SA—6G Remains Under Scrutiny
5G SA provides the architectural foundation for 5G Advanced, which expands capabilities through software-driven enhancements. Early commercial deployments are emerging across China and parts of the Gulf, with additional announcements expected in 2026.
5G Advanced aims to extend:
- Stronger uplink performance: As AI tools, cloud collaboration, and content creation generate more upstream traffic, networks need to handle sustained uploads, not just fast downloads, with enhanced carrier aggregation in the uplink
- Better energy efficiency: Operators face mounting cost and sustainability pressure as traffic grows and networks densify.
- Deeper automation and analytics: More advanced network intelligence supports faster optimization, fault detection, and capacity planning.
At the same time, 6G discussions are accelerating. Standards work continues, with commercial deployments projected closer to 2030.
However, many operators are still navigating SA migration and monetization challenges. For several regions, 6G may represent an efficiency-driven evolution rather than a headline speed revolution.
The central 6G question may not be peak performance. It may be whether future networks align effectively with a broader ecosystem that now includes hyperscale cloud providers, neutral host operators, private wireless deployments, and non-terrestrial networks.
Tying It All Together
The mobile market heading into 2026 is shaped less by headline speed claims and more by how networks perform in real-world conditions. 5G SA has delivered measurable technical gains, particularly in latency, but commercial and operational outcomes now depend on how effectively operators deploy, optimize, and position those capabilities.
Performance consistency, resilience under disruption, and alignment with enterprise and national infrastructure priorities are increasingly central to how networks are evaluated. The next phase of competition will be determined not just by faster radios, but by how well operators translate architectural progress into durable value.

For a deeper discussion of standalone performance trends, monetization tradeoffs, and the policy shifts shaping 2026, watch the full webinar on-demand.
Ookla retains ownership of this article including all of the intellectual property rights, data, content graphs and analysis. This article may not be quoted, reproduced, distributed or published for any commercial purpose without prior consent. Members of the press and others using the findings in this article for non-commercial purposes are welcome to publicly share and link to report information with attribution to Ookla.