Every day, millions of people rely on Speedtest® to get the most accurate, trusted view of their real-world internet performance. Whether streaming 4K content out and about, looking for a reliable connection to work remotely, or managing a smart home hub of devices, people need to know if their connection can keep up with their needs.
But end users aren’t the only ones that benefit from accurate, real-world connectivity testing information. Businesses, universities, healthcare facilities, and even the leading Internet service providers (ISPs) all use Speedtest to optimize their own networks.
At Ookla®, we sit at the intersection between the service providers tasked with designing and optimizing networks and the consumers that make use of those networks every day. Our insights not only help people choose a mobile or Wi-Fi service provider, we help organizations of every type optimize the networks and services they provide.
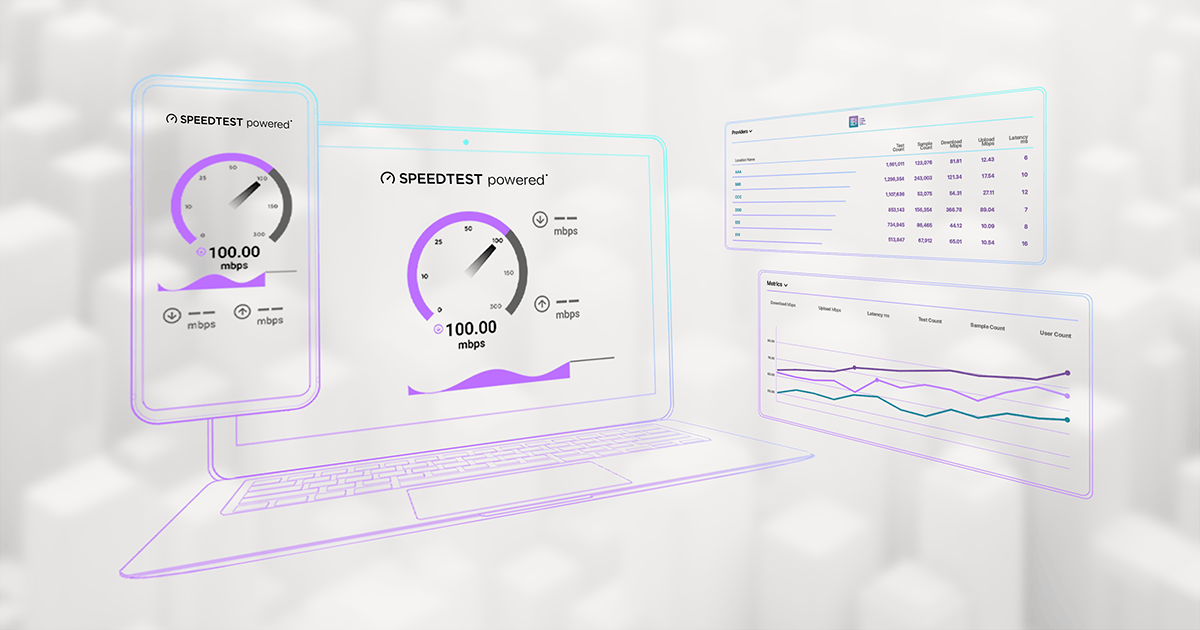
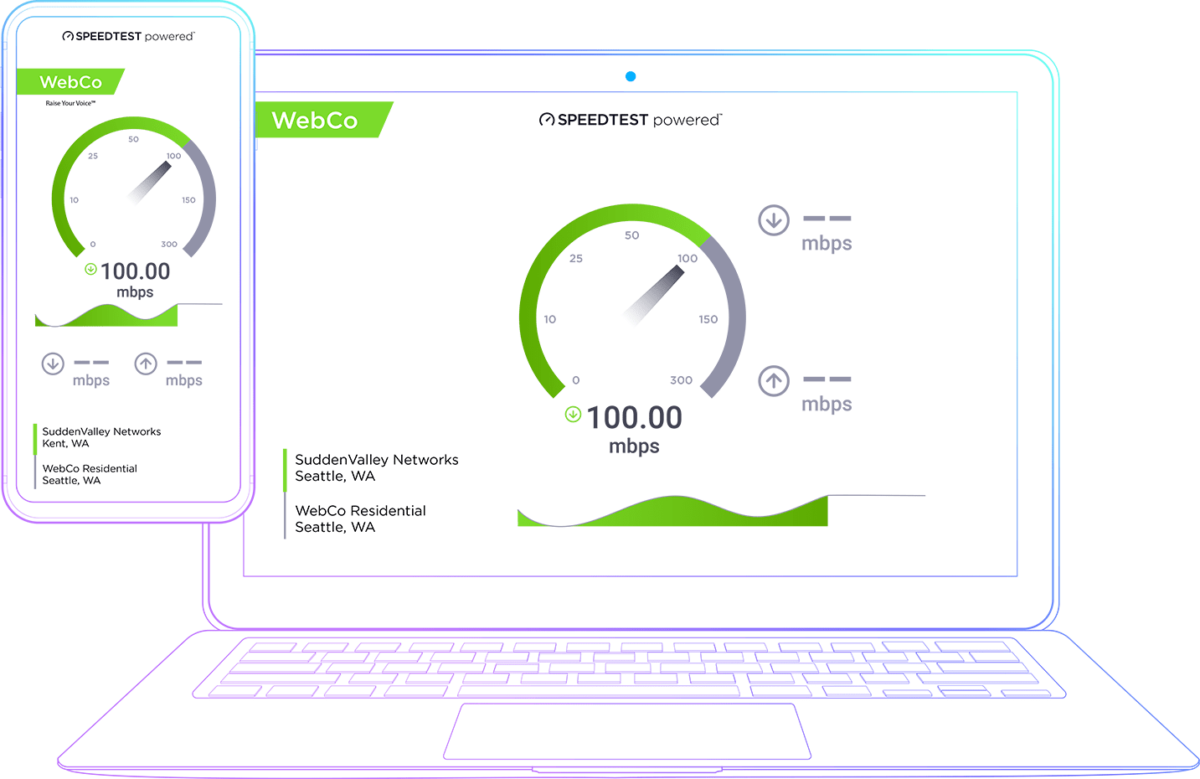
Speedtest Powered™ bridges the gap between these two worlds. As part of the enterprise side of Speedtest that most users never see, it encompasses three solutions: Speedtest Custom, Speedtest SDK, and Speedtest Embedded. These tools allow organizations to leverage the trusted testing capabilities that have made Speedtest the global standard for internet performance measurement while maintaining their unique brand identity. Enterprises rely on these solutions to solve connectivity challenges and deliver reliable service across every network touchpoint.
For a deeper look at how organizations are integrating Speedtest Powered across apps, websites, and connected devices, explore our latest white paper. Here’s how different enterprises are putting these tools to work:
Real-World Data Making a Real-World Impact
From education to aviation, organizations are integrating Speedtest capabilities directly into their systems to solve critical connectivity challenges. Here’s how they’re putting Speedtest Powered tools to work:
Enhanced Customer Experience for Airline In-Flight Connectivity
Many airlines offer in-flight Wi-Fi as a way for passengers to work or just consume some entertainment during their journey. Some even offer upgraded experiences with faster speeds or longer durations at an additional cost. To ensure the highest level of customer experience, airlines use Speedtest Embedded to consistently monitor Wi-Fi performance across their entire fleet. This solution enables real-time performance tracking and SLA verification, ensuring passengers receive the connectivity they expect (and at many times, pay for) at 35,000 feet. Airline IT teams can quickly identify and address connectivity issues, while flight crews have immediate visibility into network performance.
Remote Testing Solutions for Schools and Enhanced Work-from-Home Efficiency
A school district in a major city integrated Speedtest SDK into their student devices to support remote learning initiatives. With this capability, IT teams can monitor student connectivity without requiring manual testing, ensuring educational continuity and compliance with federal remote learning programs. The solution also helps the school district quickly identify and address connectivity challenges, enhancing both student success and operational efficiency. Similarly, enterprises use Speedtest Embedded to monitor connectivity performance across their remote workforce, enabling both automatic and on-demand testing to their private servers to ensure reliable work-from-home experiences.
Healthcare Innovation
A major healthcare system integrated Speedtest solutions across their operations to ensure reliable connectivity for critical medical services and remote staff. By implementing Speedtest Custom in their facilities, medical teams can verify network performance for bandwidth-intensive tasks like medical image transfers. Healthcare providers also use Speedtest Embedded to monitor connectivity for remote employees, ensuring their IT infrastructure supports seamless operations whether staff are on-site or working from home. This approach helps maintain operational efficiency while supporting the high-performance network demands of modern healthcare delivery.
5G Network Optimization
A major 5G provider integrated Speedtest SDK into their customer-facing mobile app to gain comprehensive insights into network performance. The solution enables periodic measurements across consumer devices while allowing both customers and support teams to run on-demand tests. This allows the provider to collect over 200 data points — including device information, Wi-Fi details, connection metrics, and location data — helping optimize their 5G network deployment and identify areas needing coverage improvements.
Customer Care Evolution
Relaying experiential information to a customer care rep can be challenging for invisible mediums like cellular and Wi-Fi services. Terms like “slow,” “stuttery,” “sometimes not great,” are instantly cleared up with a simple Speedtest. A leading ISP integrated Speedtest Custom into their support workflow, empowering customers to verify their connection speeds while providing valuable data to internal support teams. This has reduced the need for on-site technician visits and enhanced customer satisfaction through more efficient problem diagnosis and troubleshooting.
Telecom Compliance and Optimization
A mobile operator in Europe integrated Speedtest SDK into their mobile and web platforms to meet new regulatory requirements for subscriber speed reporting. The solution enabled users to test and report their speeds while providing the operator with comprehensive network performance insights. This breadth and depth of data, including device types, connection quality, and location information, helps the operator optimize their network, diagnose customer issues efficiently, and provide stakeholders with actionable information while meeting regulatory requirements.
Conclusion
Speedtest isn’t just the tool millions use to check their home internet speeds; it’s also powering network measurement and optimization behind the scenes across multiple industries.
Through Speedtest Powered solutions—Speedtest Custom, SDK, and Embedded—organizations can integrate trusted performance testing directly into their platforms while maintaining brand consistency. The result? Better data, better insights, and better customer experiences.
Ready to bring the power of Speedtest to your organization? Visit our product page for a deeper look into our solutions, or check out our latest white paper to explore real-world implementations.
Ookla retains ownership of this article including all of the intellectual property rights, data, content graphs and analysis. This article may not be quoted, reproduced, distributed or published for any commercial purpose without prior consent. Members of the press and others using the findings in this article for non-commercial purposes are welcome to publicly share and link to report information with attribution to Ookla.
Dave Andersen is a Marketing Program Manager at Ookla, where he creates enterprise and consumer content across Ookla’s brands. Dave got his start in the telco space in 2012, producing content for RootMetrics. Dave has a bachelors in marketing from Washington State University and studied creative writing in Oklahoma State’s MFA program.
Ookla® has formed a partnership with Arcep, France’s telecommunications regulator, to integrate Speedtest® crowdsourced data into Arcep’s “Mon Réseau Mobile” mapping platform, giving French consumers richer, more up-to-date insight into mobile network quality across the country.
Arcep’s Mon Réseau Mobile helps users identify the best mobile operator wherever they go in France, from home and work to vacation destinations and everywhere in between. With this partnership, Arcep’s platform now incorporates speed data (both download and upload) and latency drawn from Speedtest, supplementing Arcep’s existing coverage data with real-world, user-generated measurements. This quarter alone, Arcep published more than 420,000 Ookla measurements, with each French department represented by between 300 and 80,000 test points.
Ookla’s anonymized and aggregated data methodology upholds Arcep’s code of conduct, which promotes transparency in how mobile data is collected. Results will be published quarterly for the duration of the one-year partnership, and will also be available as open data on data.gouv.fr.
Speedtest data complements Arcep’s annual mobile service quality survey, which covers 1,700,000 test points, providing users with additional and more up-to-date information. The partnership supports Arcep’s broader data-driven regulation philosophy, reaffirmed under its Ambition 2030 strategy and based on two key principles:
Making regulator-collected data publicly available so consumers can make informed choices about their operator
Incentivizing operators to compete not just on price, but on the quality of service and coverage they offer
The approach also draws on data collected from users themselves—who are often the first to detect market malfunctions—to identify early warning signs and better tailor regulation to their needs. For Arcep and the nation’s consumers, data from the partnership is particularly valuable in rural areas, which have historically had fewer measurement points.
Arcep is not alone in turning to trusted third-party data to inform policy and empower consumers. Ookla works with telecommunications regulators around the world, including the FCC in the United States, the CRTC in Canada, ComReg in Ireland, and IMDA in Singapore, among others, providing the kind of independent, crowdsourced intelligence that helps shape better connectivity outcomes for users everywhere.To learn how Ookla’s data can support your organization, reach out to our team.
Ookla retains ownership of this article including all of the intellectual property rights, data, content graphs and analysis. This article may not be quoted, reproduced, distributed or published for any commercial purpose without prior consent. Members of the press and others using the findings in this article for non-commercial purposes are welcome to publicly share and link to report information with attribution to Ookla.
Dave Andersen is a Marketing Program Manager at Ookla, where he creates enterprise and consumer content across Ookla’s brands. Dave got his start in the telco space in 2012, producing content for RootMetrics. Dave has a bachelors in marketing from Washington State University and studied creative writing in Oklahoma State’s MFA program.
A new Ookla report found that the digital divide has narrowed in 33 states during the first half of 2025.
Key Takeaways
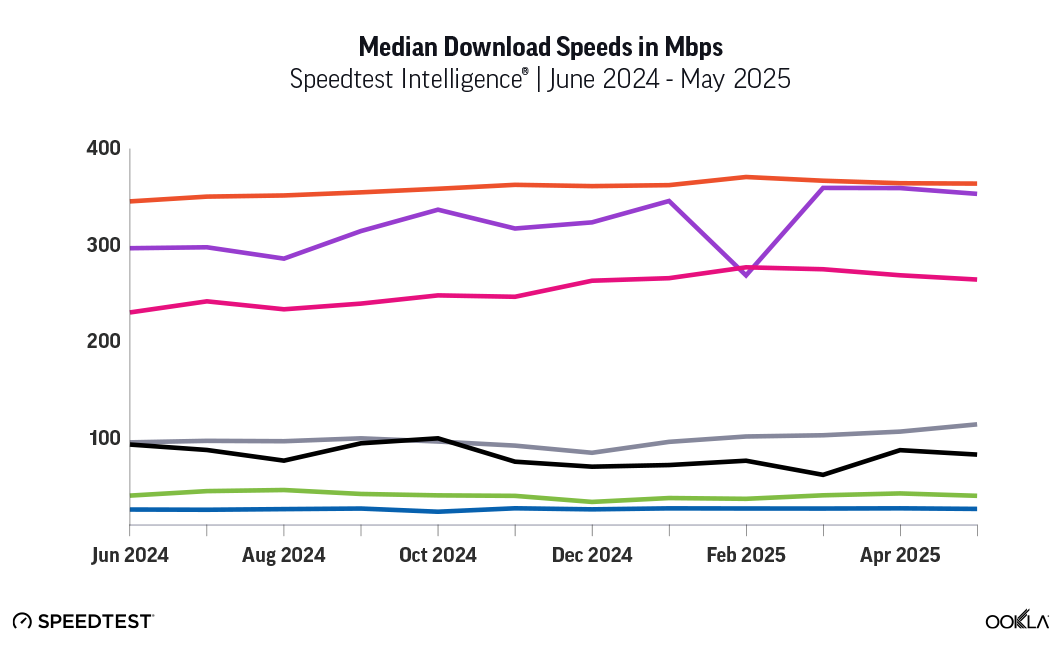
The number of states with 60% or more of Speedtest users experiencing the FCC’s minimum standard for fixed broadband speeds of 100 Mbps downstream and 20 Mbps upstream jumped from 22 states and the District of Columbia in the 2H of 2024 to 38 states and the District of Columbia in 1H of 2025.
The digital divide between urban and rural users improved in the first half of 2025 with 33 states seeing the gap between the percentage of fixed urban users and fixed rural users that receive the minimum required FCC broadband speeds lessen during that time while 17 states saw that gap grow in the first half of 2025 compared to the second half of 2024. Ookla uses the Census Bureau’s urban-rural classification to determine which users are urban vs. rural.
The digital divide doesn’t exist for many Starlink users. In 26 out of the 50 states and the District of Columbia, rural users get better broadband speeds than their urban counterparts. This is likely due to Starlink’s ability to overcome the geographic and cost barriers that make delivering fixed rural broadband so difficult.
U.S. broadband speeds are on the uptick, and more users are getting better performance than ever from their broadband connectivity. However, there are still some states (particularly those with lower population density and vast terrain) that are struggling to deliver broadband services to their residents.
Ookla Speedtest Intelligence® data found that the number of states that are able to deliver fixed broadband services (fiber, cable and DSL) to the minimum standard of broadband speeds (100 Mbps download and 20 Mbps upload) to 60% or more of Speedtest users in their state grew dramatically from 22 states and the District of Columbia in the second half of 2024 to 38 states and the District of Columbia in the first half of 2025.
In addition, there are now five states—Connecticut, Delaware, New Jersey, North Dakota and Rhode Island —delivering speeds of 100/20 Mbps to more than 70% of their users.
Not only are broadband speeds improving, Speedtest data from the first half of 2025 also revealed that 33 states narrowed the gap between how many rural users vs. urban users were able to achieve the FCC’s minimum broadband speeds of 100/20 Mbps.
This is a fairly dramatic turnaround from the second half of 2024 when Speedtest data showed that 32 states had increased their digital divide instead of decreasing it. Ookla uses the Census Bureau’s urban-rural classification to determine which users are urban vs. rural.
South Dakota No. 1 in Starlink-delivered broadband speeds
As a result of NTIA’s June decision to allow other technologies such as LEO satellites to compete for BEAD funding, at least 32 states and territories have decided to include LEO satellite systems in their final proposals (not all final BEAD proposals have been submitted as some states received extensions). While many states are still prioritizing fiber, LEO services such as SpaceX’s Starlink and Amazon’s Kuiper are appearing in many of the revised proposals.
We looked at Speedtest data on SpaceX’s Starlink service in every state and the District of Columbia to see what percentage of Starlink users received the FCC’s minimum standard for broadband of 100/20 Mbps. South Dakota is the No. 1 state with 37.1% of Starlink users getting access to 100/20 Mbps speeds followed by Maine with 35.3% of users and Wyoming with 34.5% of users.
Download the full report
To find your state’s standing and how it compares to the rest of the country in broadband connectivity, download this free report here.
Ookla retains ownership of this article including all of the intellectual property rights, data, content graphs and analysis. This article may not be quoted, reproduced, distributed or published for any commercial purpose without prior consent. Members of the press and others using the findings in this article for non-commercial purposes are welcome to publicly share and link to report information with attribution to Ookla.
Sue Marek is Ookla’s editorial director and part of the company’s analyst team. She oversees the company’s thought leadership and editorial content. Sue is a journalist with more than 30 years of experience covering the telecom industry and her work has appeared in Fierce Network, Light Reading, and SDxCentral. She is a frequent speaker at industry events and has moderated panels at Mobile World Las Vegas, Connect(x), the Consumer Electronics Show, the Competitive Carriers’ Show and 5G North America. Sue has a B.S. in journalism from the University of Colorado.
Connectivity failures are inconvenient for most people, but for public safety agencies they can be catastrophic. Whether coordinating evacuations, dispatching first responders, or keeping hospitals online, resilient networks are essential to saving lives and protecting communities.
Real-world disasters highlight the stakes. From wildfires in Maui and California to hurricanes across the Southeast, connectivity has been disrupted when agencies needed it most. In those moments, responders face delays, residents lose access to critical information, and hospitals struggle to coordinate care. The risks are clear: without resilient communications, every aspect of emergency response becomes harder and more dangerous.
Agencies need visibility into how networks perform in the real world. Ookla’s ecosystem—Speedtest, Downdetector, and Ekahau—provides the tools to strengthen preparedness, improve response, and accelerate recovery.
Disasters often strike in chaotic conditions where infrastructure is already damaged or failing. Responders may be rushing into wildfires, floods, or tornadoes with limited visibility and unreliable networks. Hospitals and shelters may suddenly find themselves overwhelmed, with communications buckling under the weight of demand. In these situations, reliable communication can often determine whether help arrives on time.
Communication breakdowns ripple outward. A single dead zone can cut a fire crew off from dispatch. If hospitals can’t access patient records or coordinate ambulance arrivals, patients may not get the care they need in time. When dispatchers can’t relay caller details in real time, teams enter dangerous situations without critical information—and communication breakdowns can affect every group involved in an emergency response:
First responders: Without reliable coverage, teams may lose contact with dispatch or lack access to real-time data
Dispatchers: Disrupted networks hinder the ability to gather details from callers, delaying information for crews in the field
Fire teams: Loss of radio or mobile service can force reliance on hand signals or runners, slowing response when every second matters
Healthcare and EMS: Connectivity failures prevent hospitals and ambulances from accessing patient records or coordinating care, directly affecting outcomes
Loss of service and communication blackouts are not hypothetical risks. From Chief Barry Hutchings of the Western Fire Chiefs Association describing a fire scene with no portable radio coverage, to hurricanes and wildfires cutting off entire regions, the consequences are well documented. Reliable communications across response routes, hospitals, and community centers can mean the difference between a timely response and catastrophic outcomes.
Key Connectivity Challenges for Agencies
Agencies are often asked to deliver flawless communication in the most challenging environments. Rural areas stretch networks thin, mountains block signals, and older government facilities can block wireless coverage. During a disaster, even modern infrastructure can be compromised by fire, flood, or wind damage.
The problem goes beyond poor coverage or inadequate capacity; agencies also often lack detailed insight into how networks perform in specific areas. An agency may know a dead zone exists, but they often lack the data needed to demonstrate the problem and secure funding for improvements. In other cases, they may be flying blind during an outage, without real-time visibility into what has failed or how widespread the issue is. Without the right tools, even well-prepared teams can struggle to manage the connectivity challenges emergencies present:
Coverage and reliability gaps: Rural areas, mountainous terrain, and dense building materials can create persistent dead zones
In-building connectivity gaps: Older or secure government facilities often block signals and limit network upgrades
Outdated infrastructure and regulatory hurdles: Aging infrastructure and regulatory hurdles slow tower deployments and upgrades
Situational blind spots: Without real-time network data, agencies can often lack the visibility needed to pinpoint outages, understand their scope, and coordinate an effective response
Infrastructure vulnerabilities: Natural disasters can often damage physical infrastructure, creating extended blackouts
Funding constraints: Without concrete evidence of where and how networks are falling short, agencies can struggle to secure federal or state support for upgrades
These challenges leave agencies vulnerable. Without reliable coverage and visibility, response times slow, public trust erodes, and communities face greater risk during emergencies.
A Framework for Preparedness, Response, and Recovery
Public safety cannot be purely reactive. Agencies must plan in advance, monitor conditions as crises unfold, and evaluate how well systems recover once the danger passes. The emergency management lifecycle—preparedness, response, recovery—ensures that agencies are not just reacting, but instead building long-term resilience.
In practice, responsibilities for each stage of that lifecycle are typically split across different teams. One group may focus on planning coverage improvements, another may monitor outages as they occur, and another might validate in-building Wi-Fi performance. Without a unified view, important gaps can go unnoticed.
To close those gaps, agencies need integrated solutions that connect every stage, from pre-disaster planning through post-disaster recovery. A complementary mix of network performance data from Speedtest Intelligence®, website and service outage insights from Downdetector®, and wireless survey capabilities from Ekahau help ensure that each phase of the emergency management lifecycle is supported with the right visibility and intelligence:
Preparedness: Agencies use Speedtest Intelligence® data to identify coverage gaps, assess high-risk zones, and validate network upgrades. Public safety IT teams also use Ekahau tools to conduct wireless surveys and verify network performance in critical locations such as hospitals, command centers, and shelters
Response: Downdetector® detects website and service outages in real time, giving agencies early awareness of issues. Meanwhile, Speedtest provides immediate visibility into performance changes, while Ekahau validates temporary networks in shelters or mobile command posts.
Recovery: Agencies measure restoration speed, validate coverage improvements, and document outcomes to inform future investments. Downdetector and Speedtest data help secure funding by showing where networks fail during emergencies and measuring how quickly they recover.
The emergency management lifecycle—preparedness, response, recovery—ensures agencies are not only reacting in the moment but building more resilient systems for the future.
Lessons from Lahaina
When wildfires tore through Lahaina, Hawaii in August 2023, connectivity collapsed when residents and emergency managers needed it most. Evacuees had little information about safe routes, and responders struggled to understand whether networks were down locally or across entire islands. Without visibility into network conditions, emergency responders could not determine where they could reach people and where communications had already failed.
Tools like Downdetector and Speedtest provided critical real-time visibility into network conditions. By combining outage reports with performance data, agencies gained the situational awareness they needed to prioritize limited resources and focus on areas most in need.
The insights revealed a clear picture of how the crisis was unfolding and how that visibility informed response decisions. Downdetector tracked sudden spikes in outage reports, while Speedtest Intelligence revealed steep declines in network performance. Together, those insights allowed responders to distinguish between isolated disruptions and broader failures, helping prioritize key resources. The Lahaina fires show how connectivity insights can be as essential as water or fuel when disaster strikes.
The lesson from Lahaina is clear: visibility into connectivity provides essential intelligence during disasters. Identifying where networks fail and how they recover enables agencies to coordinate more effectively with providers, support first responders, and keep communities informed as conditions evolve.
Conclusion
Public safety and emergency management agencies cannot afford uncertainty in communication. Reliable networks are the foundation of preparedness, response, and recovery—and the consequences of failure are too great to ignore.
Ookla’s ecosystem of Speedtest, Downdetector, and Ekahau gives agencies the visibility, reliability, and security they need to protect communities. With better data, decision-makers can plan smarter, respond faster, and restore service more effectively when disaster strikes.
Ookla retains ownership of this article including all of the intellectual property rights, data, content graphs and analysis. This article may not be quoted, reproduced, distributed or published for any commercial purpose without prior consent. Members of the press and others using the findings in this article for non-commercial purposes are welcome to publicly share and link to report information with attribution to Ookla.
Dave Andersen is a Marketing Program Manager at Ookla, where he creates enterprise and consumer content across Ookla’s brands. Dave got his start in the telco space in 2012, producing content for RootMetrics. Dave has a bachelors in marketing from Washington State University and studied creative writing in Oklahoma State’s MFA program.
A new report from Ookla found that the digital divide increased for 32 states between 1H 2024 and 2H 2024, indicating that much of the broadband expansion is occurring in urban areas instead of rural areas.
Key Takeaways
The number of states with 60% or more of users experiencing the FCC’s minimum standard for fixed broadband speeds of 100 Mbps downstream and 20 Mbps upstream increased from 10 states in the 1H of 2024 to 22 states (and the District of Columbia) in the 2H of 2024.
New Jersey, Connecticut, Delaware, North Dakota, and Maryland are the top five states with the highest percentage of Speedtest users with 100/20 Mbps.
32 states saw their digital divide increase between the 1H of 2024 and the 2H of 2024 and 17 states saw their digital divide decrease.
Many U.S. states made sizable gains in their broadband infrastructure during 2024 and much of that growth was fueled by private equity financing, mergers and acquisitions, capex investments, and government funding.
According to Ookla Speedtest Intelligence® data, the number of states in the U.S. delivering the minimum standard for fixed broadband speeds as designated by the Federal Communications Commissions (FCC) of 100 Mbps downstream and 20 Mbps upstream is growing. In fact, in our latest U.S. State Broadband Report, we found that states with 60% or more of Speedtest users receiving 100/20 Mbps dramatically increased between the first half and the second half of 2024.
However, that increase didn’t result in sweeping improvements to the digital divide. Instead, 32 states saw their gap between the percentage of urban users and rural users that receive the minimum required broadband speeds grow during this time period. Ookla uses the Census Bureau’s urban-rural classification to determine which users are urban vs. rural.
New Jersey is No. 1
Seven states now have 65% or more of Speedtest users experiencing the FCC’s minimum standard for broadband of 100/20 Mbps. New Jersey is No. 1 with 68.97% of Speedtest users experiencing the FCC’s minimum requirement followed closely by Connecticut with 68.35%. Delaware moved up from the No. 5 slot in the first half of the year to the No. 3 ranking in the second half of 2024.
On the opposite end of the spectrum, Montana and Alaska have fewer than 40% of Speedtest users that receive the minimum broadband speeds of 100/20 Mbps so it’s no surprise that Montana and Alaska are also two of the least densely populated states in the country.
Digital Divide Grows
While the number of states with 60% or more of users experiencing 100/20 Mbps more than doubled from the first half of 2024 to the second half of 2024, it appears that much of that progress occurred in urban areas because the digital divide, which is the gap between urban and rural users in a state, became much more prominent in 32 states during that time period.
Washington state leads the nation with the biggest digital divide in the second half of 2024 and it was also at the top of the list in the first half of the year. Oregon and Illinois are also top states with the biggest digital divide in the second half of the year.
The lack of affordable broadband is known to exacerbate the digital divide and some of this increase in the digital divide is likely due to the demise of the Affordable Connectivity Plan (ACP), which provided discounted broadband services to more than 23 million low-income U.S. households. The FCC ended the ACP program on June 1, 2024, because of a lack of Congressional funding.
Download the Full Report
To find your state’s standing and how it compares to the other 49 states in broadband connectivity, download this free report here.
Ookla retains ownership of this article including all of the intellectual property rights, data, content graphs and analysis. This article may not be quoted, reproduced, distributed or published for any commercial purpose without prior consent. Members of the press and others using the findings in this article for non-commercial purposes are welcome to publicly share and link to report information with attribution to Ookla.
Sue Marek is Ookla’s editorial director and part of the company’s analyst team. She oversees the company’s thought leadership and editorial content. Sue is a journalist with more than 30 years of experience covering the telecom industry and her work has appeared in Fierce Network, Light Reading, and SDxCentral. She is a frequent speaker at industry events and has moderated panels at Mobile World Las Vegas, Connect(x), the Consumer Electronics Show, the Competitive Carriers’ Show and 5G North America. Sue has a B.S. in journalism from the University of Colorado.
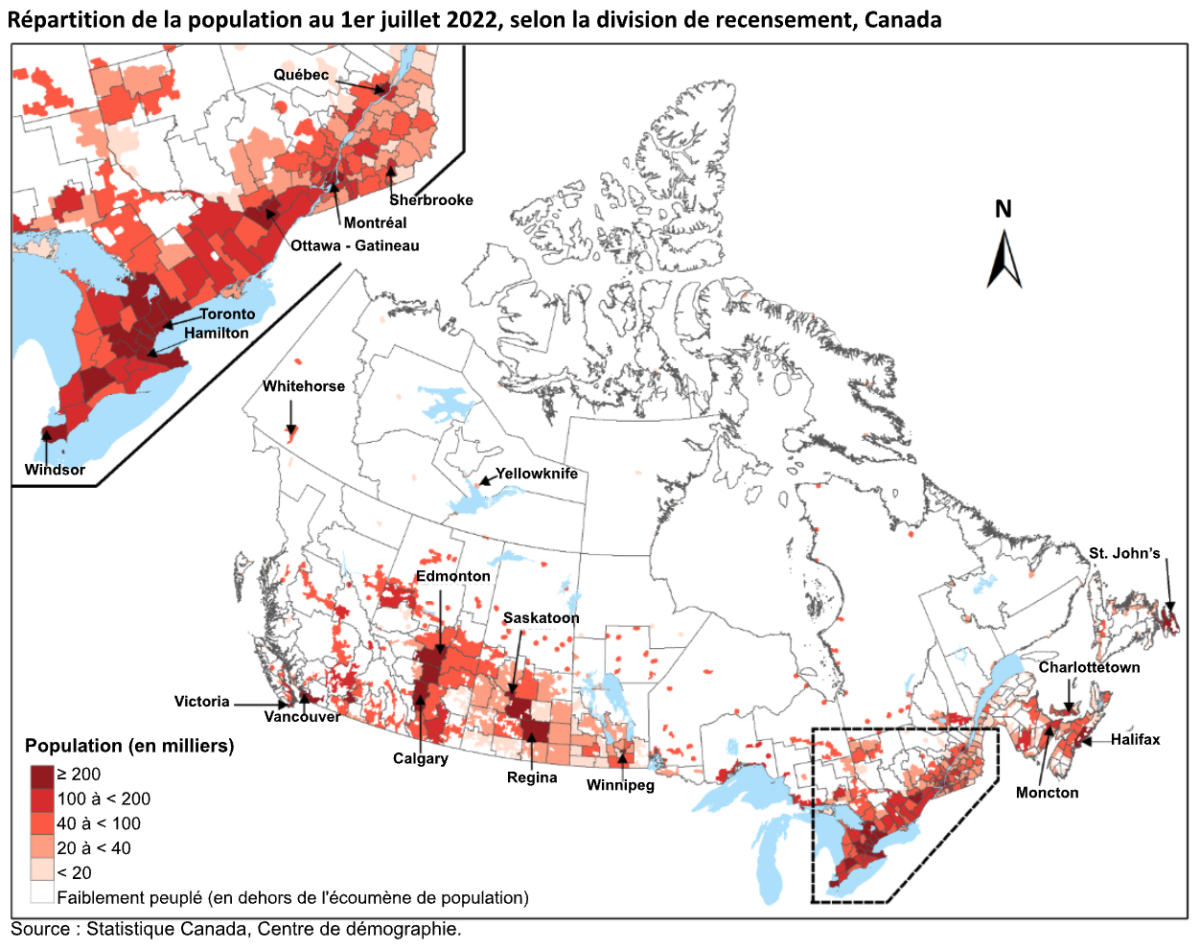
More than 80% of Canadians have access to fixed broadband networks, but for rural Canadians that figure drops to just 60%. Yet, this gap between who has broadband access and who doesn’t is closing in rural areas at a rate nearly three times faster than in urban areas. Canada is narrowing its rural broadband divide thanks to a clearly articulated and well-funded connectivity strategy to ensure high-speed internet access for all.
Using Speedtest Intelligence® data, this report identifies Canada’s Provinces and Territories that are delivering the minimum standard for fixed broadband speeds, as established by the Canadian Radio-television and Telecommunications Commission (CRTC). Based on data from the 1H 2024 (and compared to 1H 2023), it also analyzes performance in other geographic splits, including Urban-vs-Rural and the Remoteness Index.
Key Takeaways
As many as 2 million more Canadians enjoyed broadband speeds in the first half of 2024 compared to the first half of 2023.
Rural Canadian Speedtest users saw a 23% increase in those with broadband speeds in 1H 2024over 1H 2023.
Satellite internet service plays a key role in closing the broadband divide for Canada’s vast geography. In the U.S., regulators were ambivalent about allowing satellite internet to qualify for government broadband funding (this attitude has recently begun to change in favor). Canada knew many years ago that satellite internet was critical.
Broadband in the Spotlight
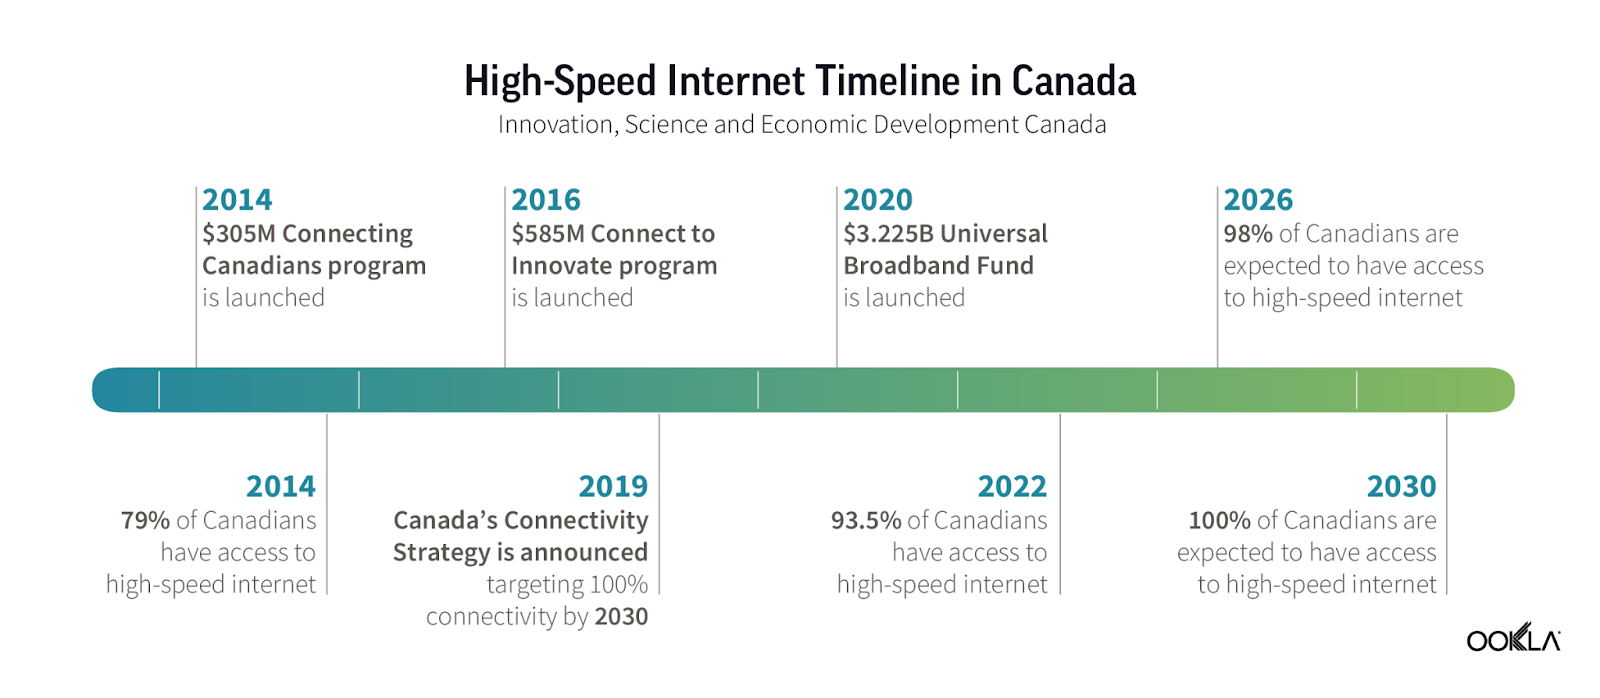
While the COVID-19 pandemic shined a light on the digital divide, the government of Canada has long been investing in broadband deployments to close the gap. In 2014 it established the Connecting Canadians program (CCP), allocating C$305M to improve connectivity for 300,000 underserved households.
The Connect to Innovate (CTI) program was launched in December 2016 with C$500M (and C$85M added to CTI in 2019) to expand high-speed Internet in communities underserved by the private sector. The CTI aimed to improve access for over 380,000 homes.
Deepening its investments in 2020, perhaps in response to COVID-19 lockdowns, the Canadian government launched the C$3.225B Universal Broadband Fund (UBF).
UBF
Universal Broadband Fund (2020)
$3.225B
CTI
Connect To Innovate (2016)
$585M
CCP
Connecting Canadians Program (2014)
$305M
With over C$4B from these programs alone, the CRTC has a goal of connecting 98% of Canadians to high-speed internet (broadband) delivering at least 50 Mbps download (DL) and 10 Mbps upload (UL) speeds (50/10 Mbps) by 2026, and 100% by 2030.
Conquer Divide
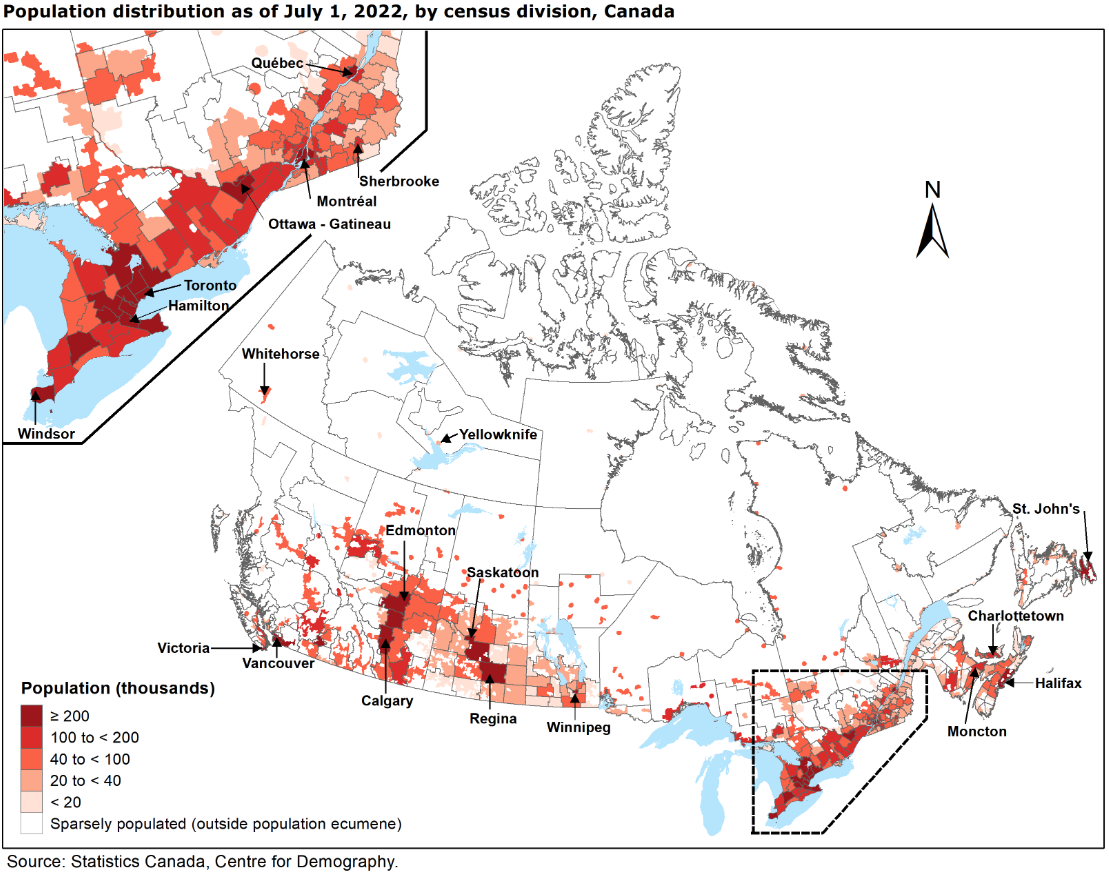
Canada’s population of 41 million is concentrated in a handful of large, urban metropolitan areas near the U.S. border. However, despite the country’s large land mass, it is highly urbanized. Approximately two-thirds, or 27 million, of Canadians live within 100 kilometers of the U.S. border —about the distance from the border to Winnipeg —yet this is only 4% of Canada’s land mass.
Imagine a line across lower Canada, 100 km north of Canada’s southern border – crossing Winnipeg in the middle of the population distribution map. In the area below the line and above the border with the U.S., 82.2% of Speedtest users are getting the CRTC’s minimum standard for fixed broadband speeds (50/10 Mbps). For Speedtest users north of the 100 km line, 76.3% met (or exceeded) the standard. Just a 5.9 percentage points gap.
However, the 100 km line is rather blunt and unsophisticated (and imaginary). Instead let’s look at the Urban-vs-Rural division as well as a more-granular designation based on the Remoteness Index.
Compared with the 100 km line’s gap, the Urban-vs-Rural digital divide aligns more closely with expectations of a larger disparity between these geographic areas. Specifically, 83.8% of Urban users meet the 50/10 Mbps standard, compared to 60.0% of Rural users resulting in a 23.8 percentage point gap.
The good news is the gap has closed from the prior year with Rural users seeing a 23% improvement compared to 5% for Urban users. To emphasize this further, in the first half of 2023 fewer than 50% of Rural users were able to get broadband speeds of 50/10 Mbps. This indicates that efforts to address this gap (i.e., UBF) were targeting the right places.
Continuing across the table, median download and upload speeds are roughly three times faster among urban than rural Speedtest users (DL 251.62 Mbps vs 90.76 Mbps and UL 64.82 Mbps vs 18.88 Mbps, respectively). Comparing the rural median speeds to the 50/10 Mbps threshold shows that half of Speedtest users in rural Canada enjoy download speeds that are 40.76 Mbps (i.e., 90.76 minus 50) and upload speeds that are 8.88 Mbps (i.e., 18.88 minus 10) faster than the target. (This is not to say that an individual Speedtest user experiences both upload and download speeds over the threshold, which is required for the target.)
The difference in Urban and Rural latency literally demonstrates the difference in physical distances (which not only means farther, but also more hops or switching; even buffering time based on the capacity of the data transport) .
The Remoteness Index presents a similar picture in finer geographic slices. (As one would expect, since the underlying data is the same.) Not surprisingly, the percentage of Speedtest users that meet the 50/10 Mbps threshold decreases as their location moves from least remote to most remote. Here too, speed and latency degrade at each step of remoteness, correlating with those meeting the 50/10 Mbps threshold percentages.
The percentage change from the prior year tells a similar story of greater improvement in the more remote geographies, but with some nuance. While we might expect Most Remote to demonstrate even more improvement and be greater than More Remote, deployment challenges and associated costs to deliver telecommunications infrastructure in the most remote geographies can be exponentially prohibitive. Thus, this extreme lack of population density coupled with difficult topography explain why government programs like CTI are needed, and why other solutions like satellite are viable.
The Provinces and The Territories
In the above analysis, broadband speeds were assessed using an imaginary 100 km demarcation, illustrating the concentration of population along Canada’s southern border. Before examining broadband performance and the digital divide among Canada’s provinces and territories, here are additional facts about Canada’s relative sparseness of people in its vast geography.
Landmass: The combined land area of the territories (Yukon, Northwest, Nunavut) is larger than the land area of India, the world’s 7th largest (and most populous) country
Population: The population of the territories is equivalent to the total number of births across Canada every four months.
The territories hold just 0.3% of Canada’s population on 39% of its land. Canada is often compared to the U.S., but Australia is a better comparison, with both Canada and Australia ranking among the least densely populated countries in the world.
Now let’s examine the 50/10 Mbps threshold in the provinces and territories.
Province / Territory
% Meeting 50/10 Mbps 1H 2024
Change from 1H 2023
Urban-Rural Gap 1H 2024, %pts
Newfoundland and Labrador
81.7
6%
22.5
British Columbia
79.8
4%
21.9
New Brunswick
78.1
2%
14.0
Nova Scotia
77.8
9%
8.2
Québec
76.5
8%
9.8
Ontario
76.0
8%
33.9
Alberta
75.7
5%
30.0
Manitoba
71.7
11%
20.8
Prince Edward Island
71.2
14%
18.5
Saskatchewan
64.7
17%
33.0
Northwest Territories
57.3
8%
-7.1
Yukon Territory
53.2
14%
6.7
Nunavut
36.2
94%
Not meaningful
In this table, by geography, percentage of Speedtest users achieving the CRTC broadband speed targets in 1H 2024, compared with the same period in prior year, and the digital divide.
Following the logic of the Remoteness Index, the territories have the fewest Speedtest users meeting the 50/10 Mbps threshold. The percentage changes in the territories from 2023 do not follow the same pattern seen in the Urban-vs-Rural chart and Remoteness Index because these geographies are a mix of these geographic definitions (as it is in the provinces). Similarly, the Urban-vs-Rural gap result is confounded by sparse population. In Nunavut, more than half of the population is defined as rural.
On the top of the table, Newfoundland and Labrador, New Brunswick, and Nova Scotia may be unexpected leaders in meeting the 50/10 Mbps threshold. New Brunswick and Nova Scotia have relatively higher population density among the provinces and territories which (economically) encourages the deployment of telecommunications infrastructure. This appears to play out in the Urban-vs-Rural gap as well, ranking among the lowest gaps in the provinces.
The exceptional performance of Newfoundland and Labrador (81.7% meeting 50/10 Mbps) can partly be attributed to the vast majority of its population residing on the island of Newfoundland, and half of them, in turn, residing on the Avalon peninsula (see the population distribution map above and St. John’s in the east). This concentration of population underscores the fundamental reality of economics in telecommunications deployment. And in the opposite direction, the Urban-vs-Rural gap (22.5%pts) also makes this same point for the need for the funding programs like UBF to address the digital divide.
Breaking Down the Digital Divide
Percentage of Urban and Rural Speedtest users in each Province/Territory with broadband speeds of at least 50/10 Mbps, 1H 2024, Nunavut: Urban n too small; Rural 43.6%
Look, Up in the Sky
As addressed in the discussion about Most Remote, because of Canada’s topographical challenges, fiber and electricity are cost prohibitive in many deployment cases. In 2019, Canada added C$85M to its CTI program because it recognized that it needed support for low-Earth orbit (LEO) satellites to reach its connectivity goals (50/10 Mbps connectivity to 95% of Canadians by 2026, and the hardest-to-reach Canadians by 2030).
Briefly looking across Canada for Speedtest users of satellite internet services during the first half of 2024, over half saw download speeds of 72.90 Mbps or greater, and upload speeds of 12.47 or greater. Moreover, in the territory of Nunavut the speeds were basically identical (75.16 Mbps and 12.50 Mbps, respectively), which makes sense since Nunavut is equally Urban or Rural (or More Remote or Less Remote) to an orbiting satellite a few hundred miles overhead. Clearly LEO is a viable solution technically and economically.
Whether fiber or satellite, broadband connectivity means nothing without power. The cost of electricity in the north can be ten times more expensive than in southern cities. In some cases, diesel fuel burned for both heat and electricity is flown, shipped by sea, or by tanker over frozen lakes and rivers in the winter. As with broadband, the Canadian government has a plan to invest in Rural and Northern Communities to make available affordable and clean energy.
Another barrier to fully-connected communities that affects Urban as well as the Most Remote is digital literacy (though the latter faces compounding factors). Here again the Canadian government is addressing the issue with initiatives such as its Digital Literacy Exchange Program.
No matter the geographic lens – Urban-vs-Rural, Remoteness Index, or Provinces and Territories – the goal is to get to 100% in 2030. But even 100% broadband connectivity from a purely technical perspective, would not be 100% in spirit without other programs and initiatives like these. Communication is achieved when the signal is received, not just sent.
Recently, Ookla also looked at the broadband and digital divide in the U.S. – How the 50 U.S. States Stack up in Broadband Speed Performance: 1H 2024 | Ookla®. We look forward to providing more updates on the U.S. and Canada’s progress to provide high-speed internet connectivity for all. For more information about Speedtest Intelligence data and insights, please get in touch.
Le Rétrécissement de la Fracture Numérique au Canada
Plus de 80 % des Canadiens ont accès à des réseaux fixes à large bande, mais pour les Canadiens des régions rurales, ce chiffre tombe à seulement 60 %. Pourtant, cet écart entre ceux qui ont accès à la large bande et ceux qui n’en ont pas se rétrécit dans les régions rurales à un rythme près de trois fois plus rapide que dans les zones urbaines. Le Canada réduit la fracture numérique dans les régions rurales grâce à une stratégie de connectivité clairement articulée et bien financée pour assurer l’accès à l’Internet haute vitesse pour tous.
À l’aide des données de Speedtest Intelligence®, le présent rapport identifie les provinces et les territoires du Canada qui fournissent la norme minimale pour les vitesses à large bande fixes, telle qu’établie par le Conseil de la Radiodiffusion et des Télécommunications Canadiennes (CRTC). Sur la base des données du 1er semestre 2024 (et par rapport au 1er semestre 2023), il analyse également les performances dans d’autres catégories géographiques, y compris les catégories urbaine et rurale ainsi que l’indice d’éloignement (Remoteness Index).
Principaux points à retenir
Pas moins de 2 millions de Canadiens supplémentaires ont bénéficié de l’accès à Internet haute vitesse au premier semestre 2024 par rapport au premier semestre 2023.
Les utilisateurs ruraux canadiens de Speedtest ont vu une augmentation de 23 % de ceux qui ont accès à Internet haute vitesse au cours du premier semestre 2024par rapport au premier semestre 2023.
Le service Internet par satellite constitue un levier essentiel pour réduire la fracture numérique et améliorer l’accès à la large bande sur l’immense territoire canadien. Aux États-Unis, les organismes de réglementation étaient ambivalents quant à autoriser le financement par le gouvernement de l’Internet par satellite (cette attitude a récemment commencé à changer). Le Canada savait il y a de nombreuses années que l’Internet par satellite était essentiel.
La large bande sous les feux de la rampe
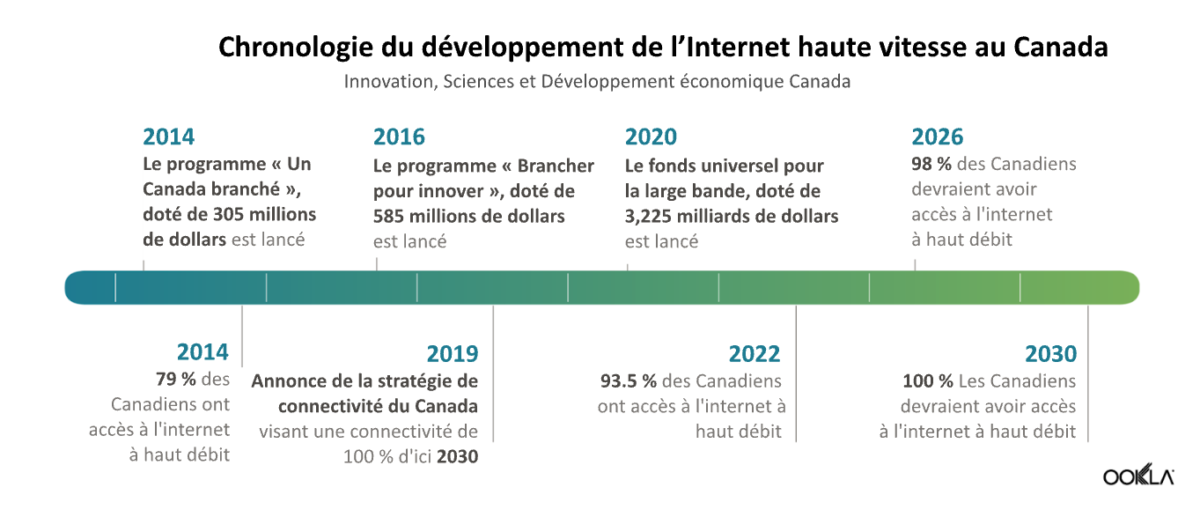
Alors que la pandémie de COVID-19 a mise en lumière la fracture numérique, le gouvernement du Canada investit depuis longtemps dans le déploiement de la large bande pour réduire cet écart. En 2014, il a mis sur pied le programme Un Canada branché, allouant 305 millions de dollars canadiens pour améliorer la connectivité de 300 000 ménages mal desservis.
Le programme Brancher pour innover a été lancé en décembre 2016 avec 500 millions de dollars canadiens (85 millions de dollars canadiens supplémentaires alloués en 2019) pour étendre l’accès a l’Internet à haut débit dans les communautés mal desservies par le secteur privé. Ce programme visait à améliorer l’accès à plus de 380 000 foyers.
Renforçant ses investissements en 2020, peut-être en réponse aux confinement lié au COVID-19, le gouvernement canadien a lancé le Fonds universel pour la large bande, doté de 3,225 milliards de dollars canadiens.
UBF
Fonds universel pour la large bande (2020)
3,225 milliards de dollars
CTI
Brancher pour innover (2016)
585 M$
CCP
Programme « Un Canada branché » (2014)
305 M$
Avec plus de 4 milliards de dollars canadiens provenant de ces programmes uniquement, le CRTC a pour objectif de connecter 98 % des Canadiens à l’Internet haute vitesse (large bande) offrant des vitesses d’au moins 50 Mbps en téléchargement (DL) et 10 Mbps en téléversement (UL) (50/10 Mbps) d’ici 2026, et 100 % d’ici 2030.
Vaincre la fracture
La population de 41 millions d’habitants du Canada est concentrée dans une poignée de métropoles près de la frontière américaine. Malgré l’immensité du pays, le Canada est fortement urbanisé. Environ les deux tiers, soit 27 millions, des Canadiens vivent à moins de 100 kilomètres de la frontière américaine, soit environ la distance entre la frontière et Winnipeg; mais cette zone ne représente que 4 % de la superficie du Canada.
Imaginez une ligne traversant le Canada, à 100 km au nord de sa frontière méridionale, et traversant Winnipeg au milieu de la carte de répartition de la population. Dans la zone située sous la ligne de démarcation et au-dessus de la frontière avec les États-Unis, 82,2 % des utilisateurs de Speedtest obtiennent la norme minimale du CRTC pour les vitesses des services à large bande fixe (50/10 Mbps). Pour les utilisateurs du Speedtest au nord de la ligne des 100 km, 76,3 % respectent (ou dépassent) la norme. Soit un écart de seulement 5,9 points.
Cependant, la ligne des 100 km reste une mesure assez simpliste, peu sophistiquée et, de surcroît, imaginaire. Examinons plutôt la division entre les zones urbaines et rurales, ainsi qu’une classification plus détaillée basée sur l’indice d’éloignement.
Comparée à celle définie par la ligne des 100 km, la fracture numérique entre les zones urbaines et rurales correspond davantage aux attentes, reflétant une disparité plus marquée entre ces zones géographiques. Plus précisément, 83,8 % des utilisateurs urbains respectent la norme de 50/10 Mbps, comparativement à 60,0 % des utilisateurs ruraux, ce qui donne un écart de 23,8 points.
La bonne nouvelle est que l’écart s’est réduit par rapport à l’année précédente, les utilisateurs ruraux ayant constaté une amélioration de 23 %, contre 5 % pour les utilisateurs urbains. Pour souligner davantage ce point, au cours du premier semestre de 2023, moins de 50 % des utilisateurs ruraux ont pu obtenir des vitesses à large bande de 50/10 Mbps. Cela indique que les efforts déployés pour combler cette lacune (c’est-à-dire le Fonds universel pour la large bande) ont été utilisés à bonne fin.
Si l’on poursuit la lecture du tableau, les vitesses médianes de téléchargement et de téléversement sont environ trois fois plus élevées chez les utilisateurs urbains que chez les utilisateurs ruraux de Speedtest (DL 251,62 Mbps contre 90,76 Mbps et UL 64,82 Mbps contre 18,88 Mbps, respectivement). La comparaison des vitesses médianes en milieu rural avec le seuil de 50/10 Mbps montre que la moitié des utilisateurs de Speedtest dans les régions rurales du Canada bénéficient de vitesses de téléchargement de 40,76 Mbps (c.-à-d. 90,76 moins 50) et de vitesses de téléversement de 8,88 Mbps (c.-à-d. 18,88 moins 10) plus rapides que l’objectif fixé. (Cela ne signifie pas pour autant qu’un utilisateur individuel de Speedtest bénéficie à la fois de vitesses de téléchargement et de téléversement dépassant le seuil requis, ce qui est nécessaire pour atteindre l’objectif.)
La différence entre les temps de latence en milieu urbain et en milieu rural illustre littéralement la différence entre les distances physiques (ce qui signifie non seulement des distances plus grandes, mais aussi un plus grand nombre de sauts de traffic).
L’indice d’éloignement présente une image similaire dans des tranches géographiques plus fines. (Comme on pouvait s’y attendre, puisque les données sous-jacentes sont les mêmes.) Il n’est pas surprenant de constater que le pourcentage d’utilisateurs Speedtest qui atteignent le seuil de 50/10 Mbps diminue au fur et à mesure que cette indice augmente. Ici aussi, la vitesse et la latence se dégradent avec l’augmentation de l’indice, en corrélation avec le pourcentage d’utilisateurs atteignant de seuil de 50/10 Mbps.
La variation (en pourcentage) par rapport à l’année précédente offre des similarités, avec une amélioration dans les zones géographiques les plus éloignées, mais avec tout en apportant une certaine nuance. On pourrait s’attendre à ce que les régions les plus éloignées s’améliorent, mais les difficultés de déploiement et les coûts associés à la mise en place d’une infrastructure de télécommunications dans les zones géographiques les plus reculées peuvent être exponentiellement prohibitifs. Ainsi, ce manque extrême de densité de population, associé à une topographie difficile, explique pourquoi des programmes gouvernementaux sont nécessaires et pourquoi d’autres solutions comme l’accès par satellite sont viables.
Les provinces et les territoires
Dans l’analyse ci-dessus, les vitesses à large bande ont été évaluées à l’aide d’une démarcation imaginaire de 100 km, illustrant la concentration de la population le long de la frontière sud du Canada. Avant d’examiner les performances de la large bande et la fracture numérique parmi les provinces et territoires du Canada, voici quelques faits supplémentaires concernant la relative faiblesse de la densité de population dans l’immensité géographique du pays.
Masse continentale : La superficie terrestre combinée des territoires (Yukon, Nord-Ouest, Nunavut) est plus grande que la superficie de l’Inde, le 7e pays le plus grand (et le plus peuplé) du monde
Population : La population des territoires équivaut au nombre total de naissances au Canada tous les quatre mois.
Les territoires ne représentent que 0,3 % de la population du Canada mais 39 % de son territoire. Le Canada est souvent comparé aux États-Unis, mais l’Australie est une meilleure comparaison; le Canada et l’Australie se classant parmi les pays les moins densément peuplés du monde.
Examinons maintenant le seuil de 50/10 Mbps dans les provinces et les territoires.
Province / Territoire
% Atteignant l’objectif 50/10 Mbps 1H 2024
Changement par rapport à 1H 2023
Écart entre les zones urbaines et rurales 1H 2024, %pts
Terre-Neuve-et-Labrador
81,7
6 %
22,5
Colombie-Britannique
79,8
4 %
21,9
Nouveau-Brunswick
78,1
2 %
14,0
Nouvelle-Écosse
77,8
9 %
8,2
Québec
76,5
8 %
9,8
Ontario
76,0
8 %
33,9
Alberta
75,7
5 %
30,0
Manitoba
71,7
11 %
20,8
Île-du-Prince-Édouard
71,2
14 %
18,5
Saskatchewan
64,7
17 %
33,0
Territoires du Nord-Ouest
57,3
8 %
-7,1
Territoire du Yukon
53,2
14 %
6,7
Nunavut
36,2
94 %
Pas significatif
Pourcentage d’utilisateurs de Speedtest atteignant les objectifs de vitesse de large bande du CRTC au premier semestre 2024 par région par rapport à la même période de l’année précédente.
Suivant la logique de l’indice d’éloignement, les territoires ont le moins d’utilisateurs Speedtest répondant au seuil de 50/10 Mbps. Les variations en pourcentage dans les territoires à partir de 2023 ne suivent pas la même tendance que celle observée dans le graphique urbain/rural et l’indice d’éloignement, car ces géographies sont un mélange de ces définitions géographiques (comme c’est le cas dans les provinces). De même, le résultat de l’écart entre les zones urbaines et les zones rurales est faussé par la faible densité de population. Au Nunavut, plus de la moitié de la population est définie comme rurale.
En haut du tableau, Terre-Neuve-et-Labrador, le Nouveau-Brunswick et la Nouvelle-Écosse pourraient être des chefs de file inattendus dans la réalisation du seuil de 50/10 Mbps. Le Nouveau-Brunswick et la Nouvelle-Écosse ont une densité de population relativement plus élevée parmi les provinces et les territoires, ce qui encourage (économiquement) le déploiement de l’infrastructure de télécommunications. Cela semble également se jouer dans l’écart entre les régions urbaines et rurales, qui se classe parmi les écarts les plus faibles dans les provinces.
La performance exceptionnelle de Terre-Neuve-et-Labrador (81,7 % atteignant 50/10 Mbps) peut en partie être attribuée au fait que la grande majorité de sa population réside sur l’île du Terre Neuve, dont la moitié vit sur la péninsule d’Avalon (voir la carte de répartition de la population ci-dessus et la ville de St. John’s à l’est). Cette concentration de population souligne la réalité fondamentale de l’économie dans le déploiement des télécommunications. Et dans la direction opposée, l’écart entre les zones urbaines et rurales (22,5 % de points) souligne également la nécessité de programmes de financement pour combler la fracture numérique.
Briser la fracture numérique
Pourcentage d’utilisateurs de Speedtest fixe en milieu urbain et rural dans chaque province et territoire ayant accès à des vitesses à large bande de 50/10 Mbps, 1H 2024, Nunavut: Urbain n trop petit; Rural 43.6%
Regardez vers les étoiles
Comme mentionné précédemment, en raison des défis topographiques du Canada, la fibre et l’électricité peuvent avoir des coûts de déploiement prohibitifs dans de nombreux cas. En 2019, le Canada a ajouté 85 millions de dollars canadiens à son programme Brancher pour innover (CTI), car il a reconnu qu’il avait besoin de satellites en orbite basse (LEO) pour atteindre ses objectifs en matière de connectivité (connectivité de 50/10 Mbps pour 95 % des Canadiens d’ici 2026, et pour les Canadiens les plus difficiles à atteindre d’ici 2030).
En examinant brièvement les utilisateurs de Speedtest des services Internet par satellite à travers le Canada durant la première moitié de 2024, plus de la moitié ont enregistré des vitesses de téléchargement de 72,90 Mbps ou supérieures, ainsi que des vitesses de téléversement de 12,47 Mbps ou supérieures. De plus, dans le territoire du Nunavut, les vitesses étaient pratiquement identiques (75,16 Mbps et 12,50 Mbps, respectivement), ce qui est logique, puisque le Nunavut est à la fois urbain et rural (ou plus éloigné et moins éloigné) pour un satellite en orbite à quelques centaines de kilomètres au-dessus. Il est clair que le LEO est une solution viable techniquement et économiquement.
Qu’il s’agisse de fibre ou de satellite, la connectivité à large bande ne signifie rien sans électricité. Le coût de l’électricité dans le nord peut être dix fois plus élevé que dans les villes du sud. Dans certains cas, le carburant diesel utilisé pour le chauffage et l’électricité est transporté par avion, par bateau ou par camion-citerne sur des lacs et des rivières gelés en hiver. Comme pour la large bande, le gouvernement canadien a un plan pour investir dans les collectivités rurales et nordiques afin de rendre disponible une énergie propre et abordable.
Un autre obstacle à des communautés pleinement connectées, qui touche tant les zones urbaines que les régions les plus éloignées, est la maîtrise des outils numériques (bien que ces dernières fassent face à des facteurs aggravants). Là encore, le gouvernement canadien s’attaque au problème avec des initiatives comme son Programme d’échange en matière de littératie numérique.
Peu importe la perspective géographique – urbain par rapport à rural, indice d’éloignement ou provinces et territoires – l’objectif est d’atteindre 100 % en 2030. Mais même une connectivité à large bande à 100 %, d’un point de vue purement technique, ne serait pas à 100 % dans l’esprit sans d’autres programmes et initiatives comme ceux-ci. La communication est réalisée lorsque le signal est reçu, pas seulement envoyé.
Récemment, Ookla a également examiné la fracture numérique et l’accès à la large bande aux États-Unis. – Comment les 50 États américains se positionnent en matière de vitesse de la large bande : 1H 2024 | Ookla®. Nous sommes impatients de fournir d’autres mises à jour sur les progrès réalisés par les États-Unis et le Canada pour fournir une connectivité Internet haute vitesse pour tous. Pour plus d’informations sur les données et les analyses de Speedtest Intelligence, veuillez prendre contact.
Ookla retains ownership of this article including all of the intellectual property rights, data, content graphs and analysis. This article may not be quoted, reproduced, distributed or published for any commercial purpose without prior consent. Members of the press and others using the findings in this article for non-commercial purposes are welcome to publicly share and link to report information with attribution to Ookla.
Kerry Baker leads Ookla's research and content efforts in North America. He has over 20 years experience in the telecom industry, primarily at T-Mobile studying network performance benchmarking and customer experience. Kerry also has founder’s experience with four technology-related startups. Kerry holds masters degrees from the University of Washington in Business and International Political Economics.
Check out the full report available now with the complete results for all 50 states.
Affordable, reliable, high-speed broadband is considered a necessity in the U.S. because it enables people to access online classes, secure health care assistance, register for basic government services, handle their banking needs and participate in many other essential services.
It’s also critical to the economic viability of every state because it supports remote workers, enables businesses to operate more efficiently and attracts new enterprises to an area.
But many states have struggled to make broadband service available to 100% of their residents primarily because service providers are focused on providing it to areas where it’s most profitable. Using Ookla’s Speedtest Intelligence® data, this report identifies the states that are currently delivering the minimum standard for fixed broadband speeds as established by the Federal Communications Commission (FCC) to the highest percentage of Speedtest users. It also singles out the states that need the most improvement when it comes to delivering the minimum standard for broadband to their residents.
Key takeaways
Connecticut, North Dakota, Delaware and six other states are the top performing states because they have the highest percentage of Speedtest users that meet the FCC’s minimum standard for fixed broadband speeds of 100 Mbps downstream and 20 Mbps upstream. While comparing small, densely populated states with larger, sparsely populated states may seem unfair, we thought it was important to note the current performance of each state so we can track their progress in future reports.
New Mexico, Arizona and Minnesota saw the biggest improvement in the percentage of Speedtest users getting the FCC’s minimum standard for fixed broadband speeds (100 Mbps down/20 Mbps up) between the first half of 2023 and the first half of 2024.
Washington, Alaska, Illinois and Oregon have the most prominent digital divide of all the 50 states. These four states have the biggest gap between the percentage of rural Speedtest users vs. the percentage of urban Speedtest users that get FCC’s minimum standard of broadband speeds of 100 Mbps downstream/20 Mbps upstream.
Not surprisingly, less than 40% of the Speedtest users of Alaska, Montana and Wyoming (which are three of the least densely populated states in the U.S.), are receiving the minimum broadband speeds of 100 Mbps downstream/20 Mbps upstream.
Broadband in the spotlight
The COVID-19 pandemic put a spotlight on the importance of having broadband access and the role it played in allowing people to continue working and receiving access to healthcare as well as keeping students in school. The American Rescue Plan Act of 2021 provided $3.2 billion to help low-income households in the U.S. pay for broadband access during the COVID-19 pandemic.
This sudden focus on broadband accessibility, also prompted Congress to pass the Infrastructure Investment and Jobs Act of 2021 which set aside $42.5 billion for the Broadband, Equity, Access and Deployment (BEAD) program and provided funding for every state to expand its broadband services. The National Telecommunications and Information Administration (NTIA) runs the BEAD program and the funding is being used for planning, infrastructure, and adoption programs in all 50 states, Washington, DC and several U.S. territories.
BEAD initially provided $100 million to every state with the remainder of the funding to be divided among the 50 states based upon their unserved and underserved populations. As of September 18, 2024, 44 eligible entities have been approved for both the Volume 1 and Volume 2 phases of BEAD. Volume 1 of the state’s proposal details the list of locations that are eligible for BEAD funding as well as a description of how certain entities can dispute the eligibility status of the various locations. Volume 2 includes each state’s description of how it plans to select ISPs and its overall broadband objectives. Once approved for both phases, states can then get access to the money that has been allocated for them.
To help manage these federal funds every state and territory established a broadband office that is tasked with determining the extent of their broadband coverage problems and draft broadband strategies that will resolve the problem.
The FCC in March 2024 decided to revise its current definition of broadband as 100 Mbps downstream and 20 Mbps upstream, which is a substantial upgrade from its previous benchmark of 25 Mbps download and 3 Mbps upload speed that was first established in 2015.
This is the first time in nearly a decade that the FCC raised the speed requirement. Although this new benchmark is being used throughout the U.S., many households still lack basic broadband services.
Top performing states
Using Ookla’s Speedtest Intelligence® data collected in the first half of 2024 we were able to compare the median download and upload speeds in all 50 states and identify the states that currently doing the best job of delivering the FCC’s minimum standard for fixed broadband speeds (100 Mbps downstream/20 Mbps upstream) to the highest percentage of Speedtest users.
At least 60% or more of the Speedtest users in Connecticut, North Dakota, Delaware, Maryland, New Hampshire, North Dakota, Rhode Island, Tennessee, Utah and Virginia are getting the FCC’s minimum standard for fixed broadband speeds of 100 Mbps downstream and 20 Mbps upstream. In Connecticut, which is the top state, 65.8% of Speedtest users are receiving the minimum broadband standard. But at just 65.8% that indicates that there is much more work ahead for states.
Interestingly, all nine of the states in this list have received final approval for both phases of BEAD funding. However, it’s unlikely that BEAD funding approval played any role in these nine states leading the rest of the country in delivering the minimum standard for broadband because BEAD funding isn’t expected to start impacting broadband deployment projects until 2025 at the earliest, with some states having to wait longer depending on their proposal status with NTIA.
Top performing U.S. states with over 60% of Speedtest users achieving broadband speeds
Rank
State
Percentage of Speedtest users achieving broadband speeds
BEAD funding approval
1
Connecticut
65.8
Yes
2
North Dakota
65.5
Yes
3
Maryland
63.7
Yes
4
Delaware
63.3
Yes
5
Rhode Island
62.7
Yes
6
Tennessee
62.2
Yes
7
Utah
61.8
Yes
8
New Hampshire
60.5
Yes
9
Virginia
60.1
Yes
Source: Ookla Speedtest data. *Note NTIA approval of BEAD funding is changing rapidly. While BEAD funds haven’t likely played a role in broadband deployments yet, they will in the future.
Southwestern US sees big improvements in broadband
New Mexico, Arizona and Minnesota saw the biggest improvement in the percentage of their residents getting the FCC’s minimum standard for fixed broadband speeds (100 Mbps down/20 Mbps up) between the first half of 2023 and the first half of 2024.
New Mexico leads the rest of the states with its gains in broadband in the past year. Ookla data indicates that New Mexico saw a 50% increase in the percentage of its population with access to the FCC’s minimum broadband speeds of 100 Mbps/20 Mbps. Arizona also saw a 45% jump in the percent of its population with access to the FCC’s minimum broadband speeds of 100 Mbps/20 Mbps.
Arizona, and specifically, the city of Mesa, AZ, has been a hotbed of activity for fiber deployments. In 2022 Google Fiber decided to deploy fiber to Mesa, AZ after the city council approved plans to bring a data center to the area. In addition, AT&T also announced plans to bring its fiber service to Mesa in 2023. These new fiber entrants are competing with existing broadband providers Cox Communications and Lumen.
U.S. states with largest year-on-year increase in Speedtest users achieving broadband speeds
Rank
State
Increase in Speedtest users obtaining broadband speeds (1H 2023 vs 1H 2024)
BEAD funding approval
1
New Mexico
50%
Yes
2
Arizona
45%
Yes
3
Nevada
37%
Yes
4
Minnesota
38%
No
5
Colorado
35%
Yes
6
Washington
35%
Yes
7
Oregon
32%
Yes
8
Wyoming
32%
Yes
9
Maine
30%
Yes
10
Utah
29%
Yes
Source: Ookla Speedtest data. *Note NTIA approval of BEAD funding is changing rapidly. While BEAD funds haven’t likely played a role in broadband deployments yet, they will in the future.
Sparse population equals inferior broadband
Not surprisingly, the most sparsely populated states in the U.S. tend to also have the smallest percentage of their population receiving the FCC’s minimum broadband speeds. Building broadband networks in rural states is incredibly expensive, and in some areas the terrain can make it nearly impossible. For example, in Alaska, where the ground may be frozen for many months out of the year, it’s difficult to dig trenches to install fiber.
Ookla’s Speedtest data collected in the first half of 2024 found that less than 40% of the residents of Alaska, Montana and Wyoming (which are three of the most sparsely populated states in the U.S.), receive the minimum broadband speeds of 100 Mbps downstream/20 Mbps upstream.
The digital divide is still evident in many states
A big part of the impetus behind the federal government’s BEAD program is to finally close the gap between those with and without access to broadband, or what is commonly referred to as the digital divide.
But there are still many states that have a prominent gap between the number of rural and urban residents that have access to the FCC’s minimum standard of broadband speeds of 100 Mbps downstream/20 Mbps upstream.
Using the Census Bureau’s urban-rural classification and Ookla data compiled in the 1H of 2024, Washington, Alaska, Illinois and Oregon have the biggest digital divide compared to the other 50 states. For example, while 61.1% of urban Speedtest users in Washington state receive broadband speeds of 100 Mbps/20 Mbps, only 28.7% of its rural Speedtest users receive those same speeds.
Breaking Down the Digital Divide
Percentage of urban and rural Speedtest users in each state with access to broadband speeds of 100/20 Mbps.
Broadband speeds are improving but more work is needed
U.S. broadband networks offer faster and more reliable connectivity to more people today than they did just a few years ago, however there’s still a large percentage of the U.S. population without adequate access to broadband connectivity.
Thanks to new funding such as the BEAD program, there are many efforts underway to improve modern broadband networks. We expect to see these advancements in 2025 as more states start to put their BEAD funding into action.
We will provide semi-annual updates on the broadband speed performance of providers in the 50 states and also to track the improvements that states are making to bridge the digital divide. For more information about Speedtest Intelligence data and insights, please get in touch.
Ookla retains ownership of this article including all of the intellectual property rights, data, content graphs and analysis. This article may not be quoted, reproduced, distributed or published for any commercial purpose without prior consent. Members of the press and others using the findings in this article for non-commercial purposes are welcome to publicly share and link to report information with attribution to Ookla.
Sue Marek is Ookla’s editorial director and part of the company’s analyst team. She oversees the company’s thought leadership and editorial content. Sue is a journalist with more than 30 years of experience covering the telecom industry and her work has appeared in Fierce Network, Light Reading, and SDxCentral. She is a frequent speaker at industry events and has moderated panels at Mobile World Las Vegas, Connect(x), the Consumer Electronics Show, the Competitive Carriers’ Show and 5G North America. Sue has a B.S. in journalism from the University of Colorado.
Ensuring reliable and competitive broadband performance across Azerbaijan is critical for the country’s digital transformation. Fast, accessible internet plays a central role in education, economic growth, public services, and everyday life. As the national regulatory authority, the Information Communication Technology Agency (ICTA) is tasked with overseeing the performance, fairness, and transparency of the telecommunications market — particularly internet service providers (ISPs).
To effectively monitor this ecosystem, ICTA relies not only on official declarations from providers — such as subscriber counts and regional coverage areas submitted through the Data Collection System (DCS) — but also on independent, real-world testing data from Ookla.
Situation
While ISP-reported figures are foundational for regulatory oversight, there is always a risk of overstated or understated service availability, especially in remote or underserved regions. Such discrepancies can lead to distorted planning, inefficient infrastructure development, and regulatory blind spots.
Moreover, with dozens of ISPs operating at different performance levels, it’s not feasible to demand equal improvements across the board. Regulatory capacity and resources are limited, and not all providers have the same impact on national service quality. A targeted, data-driven strategy is needed to identify which providers can most significantly influence nationwide internet performance.
Under the framework of National ISP Performance Monitoring, ICTA faced four challenges in ensuring fair, efficient, and data-driven oversight of internet service providers:
Monitoring Provider Performance Objectively: ISP-reported data on service quality lacks independent verification. ICTA needed a consistent method to track monthly performance trends across providers, highlight underperformers, and drive QoS improvements across the sector.
Validating Regional Coverage Declarations: ISPs declare their regional subscriber presence via the Data Collection System (DCS). However, without real-world validation, these declarations could misrepresent actual service distribution — especially in rural or underserved areas — distorting planning and policy decisions.
Prioritizing Impactful Improvements: With limited regulatory resources, ICTA needed a tool to identify which ISPs provide poor services, thus, hindering achieving the country’s internet speed objectives. A scalable, simulation-based approach was essential to target high-impact providers rather than applying blanket requirements.
Road-Level Signal Monitoring: Mobile service quality often fluctuates along roads and transport corridors, disrupting calls and data connectivity. Manual drive tests to detect such issues are costly and limited in scope. Using Ookla Cell Analytics, ICTA now monitors signal strength continuously across major roads in Baku, with GPS-tagged results from real users highlighting weak spots and guiding more effective infrastructure planning.
Download the full case study
Check out our full case study to learn more about how ICTA how ICTA uses independent, real-world testing data from Ookla to monitor connectivity in Azerbaijan.
Ookla retains ownership of this article including all of the intellectual property rights, data, content graphs and analysis. This article may not be quoted, reproduced, distributed or published for any commercial purpose without prior consent. Members of the press and others using the findings in this article for non-commercial purposes are welcome to publicly share and link to report information with attribution to Ookla.
Ookla® is a global leader in connectivity intelligence that provides consumers, businesses, and other organizations with data-driven insights to improve networks and connected experiences.
States across the U.S. are in a race against the clock. Following new guidance from the National Telecommunications and Information Administration (NTIA), states have until September 3, 2025 to revise and resubmit their proposals for the $42.5 billion Broadband Equity, Access, and Deployment (BEAD) program, which is designed to fund high-speed internet buildouts in unserved and underserved areas across the country. It’s a tight timeline, especially given the difficult task ahead: evaluating which internet service providers (ISPs) can truly deliver reliable broadband, and which ones may be overpromising.
While the latest guidance for BEAD is new, the challenge of verifying provider claims isn’t. Federal programs have long struggled with network performance data that looks solid on paper but falls short in practice. Now that states are making the calls, broadband offices need dependable ways to tell which networks can truly deliver.
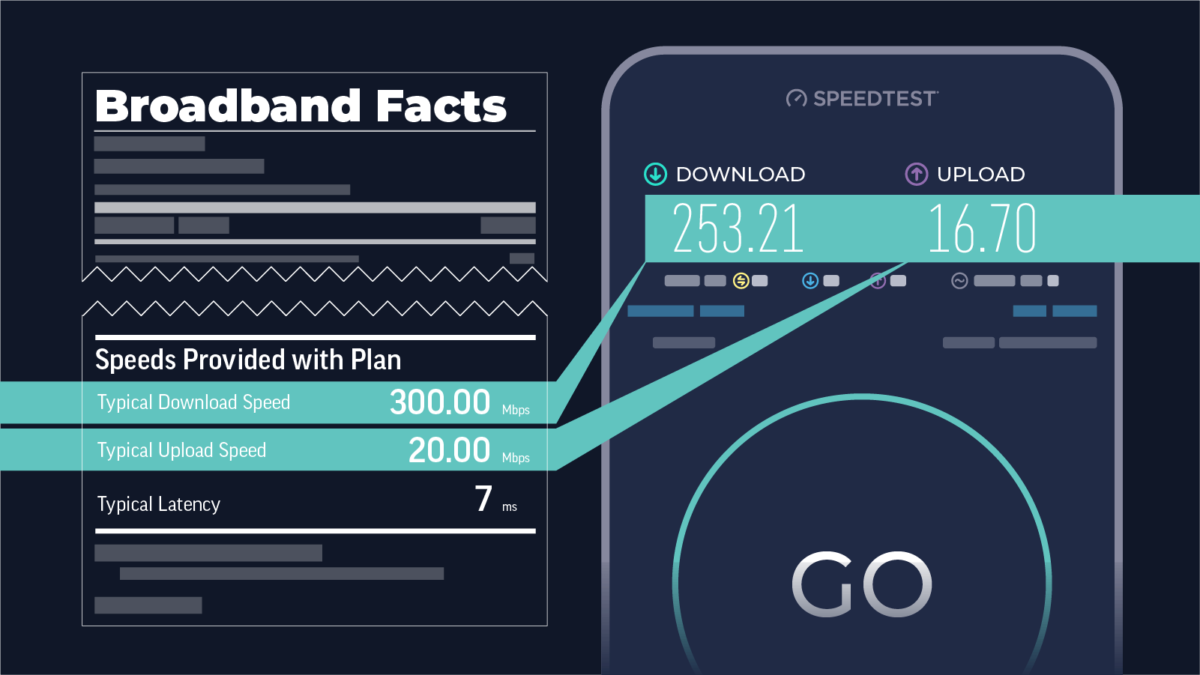
To qualify for BEAD funding, providers must demonstrate the ability to deliver speeds of at least 100 Mbps download and 20 Mbps upload and latencies below 100 ms. A wave of new ISPs is eager to meet that mark and be included in state proposals. But some rely on technologies that have sometimes struggled to meet speed requirements with current network and infrastructure deployments.
Whether new applicants can meet the required performance metrics consistently when real users are online, particularly during peak hours, is a question many officials will be asking as they are weighing the options before them. For broadband offices already juggling community needs, infrastructure gaps, and political pressure, validating these claims isn’t just a technical challenge — it’s a logistical one.
The Challenge: Sorting Real-World Performance From Wishful Claims
One of the most urgent tasks states now face is verifying whether ISPs can truly meet the FCC’s broadband speed standard of 100 Mbps download and 20 Mbps upload. On paper, many providers may qualify — but real-world performance often tells a different story.
That’s where Ookla can help. Our data offers a real-world view into actual user experiences — not marketing promises or theoretical models. By mapping where service consistently meets the FCC’s broadband benchmark, states can make faster, more informed decisions about which providers and which technologies are ready to meet BEAD’s requirements. Whether evaluating rural deployments or contested service areas, objective performance data helps broadband offices focus their proposals on providers that can truly deliver.
New guidance from the NTIA now requires states to treat all broadband technologies equally — including fixed wireless and LEO satellite — and prioritize the lowest-cost proposals. That shift opens the door to more providers and deployment types, but also makes it harder to assess which ones can actually meet BEAD requirements. Ookla’s data gives states the ability to evaluate these newer technologies with the same level of rigor as traditional fiber and cable options.
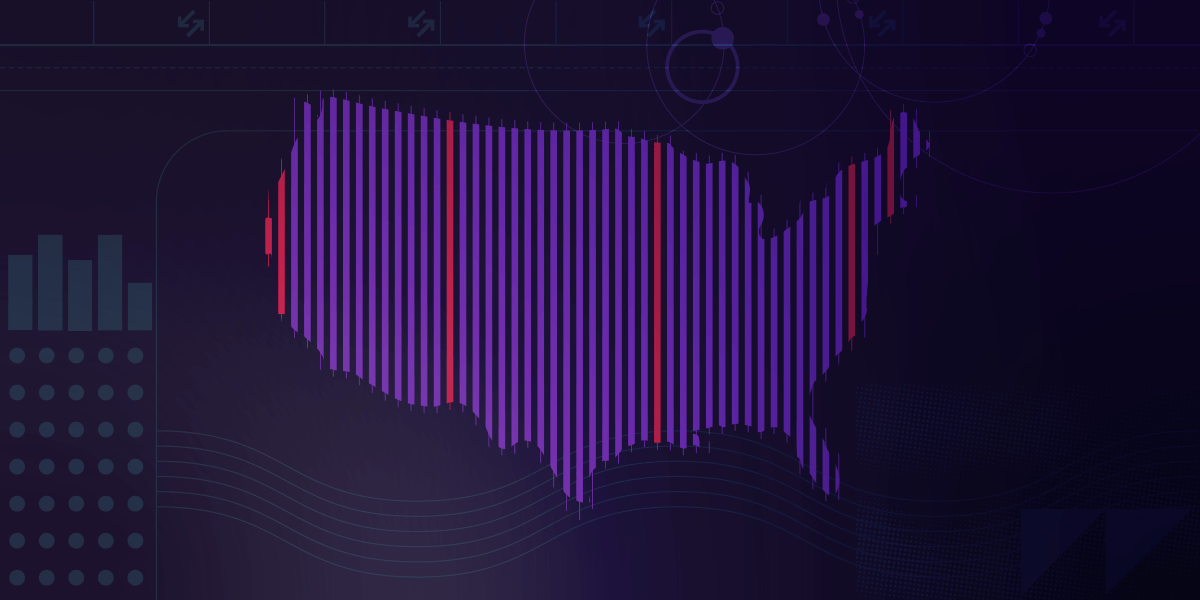
Anonymized chart above of sample operators from a single state shows median download speeds in Mbps from companies using virtually all widely used internet technologies including Cable, DSL, Fiber, FWA, Satellite, and WISP.
Conclusion
Better data supports better decisions — and helps ensure that BEAD funding goes to networks that can support the communities they’re meant to serve, not just on paper but in the real world. With proposals due by September 3, states need every advantage they can get.
The funding choices broadband offices make in the coming weeks will shape internet access for years to come, especially in areas that have historically been overlooked or underserved.
Discover how Ookla’s broadband data can enhance your BEAD program proposals. For inquiries, please reach out to us at us-government@ookla.com.
Ookla retains ownership of this article including all of the intellectual property rights, data, content graphs and analysis. This article may not be quoted, reproduced, distributed or published for any commercial purpose without prior consent. Members of the press and others using the findings in this article for non-commercial purposes are welcome to publicly share and link to report information with attribution to Ookla.
Bryan Darr is the V.P. of Government Affairs at Ookla. He coordinates Ookla’s outreach to local, state and federal governments and serves on CTIA’s Smart Cities Business & Technology Working Group.
Internet service has joined the ranks of essential utilities; it’s foundational to economic development, public services, and everyday life. But when it comes to understanding which areas have fast, reliable internet—and which don’t—many public sector teams are still relying on outdated information, especially federal coverage maps. Accurate, location-based performance data has been hard to come by, and even harder to put to use.
That’s where Ookla’s new ArcGIS-based dashboards come in. Built for use at every level of government—from state agencies to local broadband offices—these tools combine Ookla’s rolling 12-month Speedtest Intelligence data with powerful visualization capabilities inside Esri’s ArcGIS environment. Because they’re built on hosted layers that integrate directly with ArcGIS Online, agencies can access up-to-date connectivity data without manual uploads or custom integrations—saving time and fitting into workflows many teams already use.
From there, users can explore broadband performance by state, county, or block group (a U.S. Census-defined area used for broadband funding decisions), track monthly and year-over-year changes, and compare progress across regions—all without needing deep GIS expertise.
In this article, we’ll explore what the dashboards offer, how they’re helping public-sector teams move beyond static maps, and what early adopters like Hawaii and West Virginia are already doing with them. We’ll also look at how the dashboards are evolving to support mobile data and more flexible reporting options.
Why Better Data Visualization Matters for Broadband Planning
Public sector broadband teams—whether overseeing a small town or an entire state—face growing pressure to show where funding is needed and where progress is happening. Speedtest Intelligence provides rich, real-world performance data, and the ArcGIS dashboards help teams tap into that depth more efficiently. By simplifying access and visualization, the dashboards make it easier to explore trends, spot gaps, and communicate insights across geographies and time periods.
Here’s a closer look at how the dashboards are structured and what they include:
Hosted in ArcGIS Online: Dashboards are delivered through ArcGIS Online and built on Ookla’s rolling 12-month median Speedtest data
Core metrics included: Download and upload speeds, latency, jitter, test counts, and device counts
Flexible geographic views: Users can explore data across state, county, and block group geographies, depending on their needs
Updated monthly: Dashboards provide near-real-time insights into performance trends
Custom filtering and breakdowns: Visualizations support comparisons and speed breakouts by percentile (e.g., 90th, median, 10th percentile download and upload speeds)
FCC threshold analysis: Clients can easily identify which areas meet (or fall short of) the FCC’s 100/20 Mbps benchmark for download and upload speeds.
Together, these tools help government teams to monitor broadband conditions, identify gaps, and support data-driven decisions for stakeholders and legislators.
Drilling Into the Details: Four Dashboards That Work Together
Broadband offices and policy makers need more than just numbers—they need clarity around where things are working, where they’re not, and how performance aligns with goals that matter for their communities. Understanding broadband performance means more than looking at speed metrics alone—it requires a holistic view of how connectivity performance varies across regions, how it changes over time, and whether it meets the goals tied to funding and planning.
That’s why the ArcGIS dashboards include four focused views that help teams across all levels of government track progress, compare regions, and evaluate service against meaningful benchmarks.
Monthly Trends Dashboard: View median speeds, latency, jitter, test counts, and device counts across a rolling 12-month window. Users can filter by state, county, or block group.
Year-over-Year Change Dashboard: Compare current performance to previous years to see where speeds, latency, or jitter have improved—or declined. Data is broken out by geography and metric.
State Comparison Dashboard: Benchmark one state’s connectivity against others in the same region, division, or across the U.S. This view is especially useful for supporting economic development and funding decisions.
FCC Comparison Dashboard: Overlay Ookla Speedtest data with FCC broadband coverage data to flag areas where federal maps may overstate service availability.
Each view is designed to answer specific questions quickly: How are we trending? How do we compare to other states? And where do we see discrepancies that might affect funding or reporting? These supporting dashboards turn complex performance data into actionable insights for states, cities, and counties alike.
Spotting the Gaps: Where FCC Maps and Real-World Performance Don’t Align
Accurate broadband coverage data is critical when millions in funding are on the line. For broadband offices tasked with allocating those dollars, having trusted information is essential, but government maps don’t always reflect what people are actually experiencing. One of the most powerful features of Ookla’s ArcGIS dashboards is their ability to highlight the gaps between reported coverage and real-world performance in a clear, actionable way.
The dashboards make it easy to spot those discrepancies and dig into the details at a granular level:
Hexagon-based overlays: Dashboards use hex-shaped grids to show which areas meet or fall below the FCC’s 100/20 Mbps threshold
Drill-down insights: Users can click into individual hexes to view Speedtest performance and test counts
Custom filters: Teams can isolate areas by number of tests, performance thresholds, or number of Broadband Serviceable Locations (BSLs)
Flagging discrepancies: Differences between reported coverage and actual Speedtest results can help identify areas for ISP follow-up or further investigation
Exportable data: Insights can be shared in reports or integrated into state systems for further analysis
FCC broadband data still plays a central role in determining where federal funds are allocated—but it’s not always accurate. By layering Speedtest Intelligence data on top of government coverage maps, the dashboards give broadband teams a clearer way to validate service claims and advocate for resources where they’re truly needed.
Early Adoption in the Real-World
Hawaii and West Virginia are already testing these dashboards, marking the start of broader adoption. For states working to identify coverage gaps, benchmark performance, and clearly communicate broadband progress, these tools make it easier to explore the data, surface key insights, and share results with the people who need to see them.
Feedback from Hawaii and West Virginia is already shaping product development, with updates underway to support mobile datasets and more flexible, exportable reporting options:
Fixed data available now: Fixed broadband data dashboards are already in use; mobile versions are in development
Geography-based filtering: Dashboards are delivered pre-filtered to each state’s geography
No advanced GIS skills needed: Designed for ease of use by teams without dedicated GIS staff
Public-facing options: Results can be embedded into websites or shared with lawmakers and stakeholders
Exportable reports coming soon: PDF and Word formats can help teams share insights without needing a full ArcGIS license
The dashboards are powered by Speedtest’s hosted layers—monthly-updated datasets that plug directly into ArcGIS Online. These hosted layers make it easier for agencies to access and visualize Speedtest data without dealing with manual uploads or complex integrations. For teams already using ArcGIS to track broadband or demographic data, it’s a faster path to meaningful insight.
Looking ahead
Access to accurate, actionable broadband data has always been a challenge. With these ArcGIS dashboards, states and local governments finally have a clear view of connectivity across their communities, grounded in real-world performance data they can explore and use.
Whether the goal is identifying underserved areas, tracking progress over time, or communicating results to legislators and stakeholders, Ookla’s ArcGIS dashboards give teams the tools to act with confidence.
As more states adopt the platform and new capabilities roll out, these dashboards are quickly becoming a go-to resource for building broadband strategies that reflect what’s really happening on the ground. The dashboards were also recently featured during the 2025 Esri UC Plenary Session, underscoring their growing role in public-sector broadband planning (Esri account required to view).
To learn how our ArcGIS dashboards can support your broadband planning efforts—whether you’re running a statewide program or managing broadband efforts in a single community—reach out to our team.
Ookla retains ownership of this article including all of the intellectual property rights, data, content graphs and analysis. This article may not be quoted, reproduced, distributed or published for any commercial purpose without prior consent. Members of the press and others using the findings in this article for non-commercial purposes are welcome to publicly share and link to report information with attribution to Ookla.
Dave Andersen is a Marketing Program Manager at Ookla, where he creates enterprise and consumer content across Ookla’s brands. Dave got his start in the telco space in 2012, producing content for RootMetrics. Dave has a bachelors in marketing from Washington State University and studied creative writing in Oklahoma State’s MFA program.