A new report from Ookla found that the digital divide increased for 32 states between 1H 2024 and 2H 2024, indicating that much of the broadband expansion is occurring in urban areas instead of rural areas.
Key Takeaways
The number of states with 60% or more of users experiencing the FCC’s minimum standard for fixed broadband speeds of 100 Mbps downstream and 20 Mbps upstream increased from 10 states in the 1H of 2024 to 22 states (and the District of Columbia) in the 2H of 2024.
New Jersey, Connecticut, Delaware, North Dakota, and Maryland are the top five states with the highest percentage of Speedtest users with 100/20 Mbps.
32 states saw their digital divide increase between the 1H of 2024 and the 2H of 2024 and 17 states saw their digital divide decrease.
Many U.S. states made sizable gains in their broadband infrastructure during 2024 and much of that growth was fueled by private equity financing, mergers and acquisitions, capex investments, and government funding.
According to Ookla Speedtest Intelligence® data, the number of states in the U.S. delivering the minimum standard for fixed broadband speeds as designated by the Federal Communications Commissions (FCC) of 100 Mbps downstream and 20 Mbps upstream is growing. In fact, in our latest U.S. State Broadband Report, we found that states with 60% or more of Speedtest users receiving 100/20 Mbps dramatically increased between the first half and the second half of 2024.
However, that increase didn’t result in sweeping improvements to the digital divide. Instead, 32 states saw their gap between the percentage of urban users and rural users that receive the minimum required broadband speeds grow during this time period. Ookla uses the Census Bureau’s urban-rural classification to determine which users are urban vs. rural.
New Jersey is No. 1
Seven states now have 65% or more of Speedtest users experiencing the FCC’s minimum standard for broadband of 100/20 Mbps. New Jersey is No. 1 with 68.97% of Speedtest users experiencing the FCC’s minimum requirement followed closely by Connecticut with 68.35%. Delaware moved up from the No. 5 slot in the first half of the year to the No. 3 ranking in the second half of 2024.
On the opposite end of the spectrum, Montana and Alaska have fewer than 40% of Speedtest users that receive the minimum broadband speeds of 100/20 Mbps so it’s no surprise that Montana and Alaska are also two of the least densely populated states in the country.
Digital Divide Grows
While the number of states with 60% or more of users experiencing 100/20 Mbps more than doubled from the first half of 2024 to the second half of 2024, it appears that much of that progress occurred in urban areas because the digital divide, which is the gap between urban and rural users in a state, became much more prominent in 32 states during that time period.
Washington state leads the nation with the biggest digital divide in the second half of 2024 and it was also at the top of the list in the first half of the year. Oregon and Illinois are also top states with the biggest digital divide in the second half of the year.
The lack of affordable broadband is known to exacerbate the digital divide and some of this increase in the digital divide is likely due to the demise of the Affordable Connectivity Plan (ACP), which provided discounted broadband services to more than 23 million low-income U.S. households. The FCC ended the ACP program on June 1, 2024, because of a lack of Congressional funding.
Download the Full Report
To find your state’s standing and how it compares to the other 49 states in broadband connectivity, download this free report here.
Ookla retains ownership of this article including all of the intellectual property rights, data, content graphs and analysis. This article may not be quoted, reproduced, distributed or published for any commercial purpose without prior consent. Members of the press and others using the findings in this article for non-commercial purposes are welcome to publicly share and link to report information with attribution to Ookla.
Reliable wireless connectivity is crucial for ensuring public safety, especially during emergencies. First responders and civilians alike depend on uninterrupted communication to coordinate efforts, gather critical information, and ultimately save lives.
Wireless infrastructure providers play a vital role in ensuring this connectivity, and many are turning to crowdsourced insights to help identify and address coverage gaps. One such organization is Public Safety Towers Company (PSTC), which has been using Ookla’s Cell Analytics® solution for years to make data-driven decisions to improve public safety connectivity.
This article will explore the critical role of consistently strong connectivity in public safety, the challenges facing public safety communication, and how Public Safety Towers Company uses Ookla Cell Analytics data to identify and address coverage gaps to help emergency responders.
Connectivity in Public Safety: Critical Role and Challenges Faced
With over 80% of 911 calls originating from mobile devices, the need for robust cellular coverage has never been greater. Reliable, uninterrupted communications are essential for fire, police, and EMS personnel to effectively coordinate and respond to emergencies. When first responders experience poor coverage, they may face severe consequences, such as:
Inability to communicate with dispatch or other team members
Limited access to critical data and pre-arrival intelligence
Hindered situational awareness and decision-making capabilities
Dispatchers play a crucial role in gathering information from callers to provide first responders with a comprehensive understanding of the situation they are about to face. However, when connectivity is poor, this process can be disrupted, leaving first responders with incomplete or inaccurate information, potentially compromising public safety.
Chief Barry Hutchings, Senior Operations Advisor at The Western Fire Chiefs Association, shared an example during our recent webinar of arriving on scene and having no portable radio or cell coverage, forcing him to rely on a 100-watt radio in his engine for communication. Such situations highlight the critical need for reliable wireless connectivity in emergency responses.
Despite the critical importance of reliable wireless connectivity, several challenges hinder the development of comprehensive coverage:
Historical gaps in coverage due to narrowed communication bands have left many areas with inadequate service, making it difficult for first responders to communicate effectively
Difficulties in building new towers to address coverage gaps, including identifying optimal locations, navigating regulatory hurdles, and securing funding
Growing importance of pre-arrival intelligence for first responders, which requires expansive coverage and reliable data connections
Addressing these challenges requires collaborative efforts between public safety organizations and wireless infrastructure providers. By leveraging crowdsourced insights and innovative solutions such as Ookla Cell Analytics, stakeholders can work together to identify coverage gaps, prioritize improvements, and ultimately build more resilient and responsive networks that better serve our communities.
Using Ookla Cell Analytics to Identify Coverage Gaps
Ookla Cell Analytics has proven to be an invaluable tool for public safety organizations and wireless infrastructure providers looking to improve connectivity. By leveraging crowdsourced data, Cell Analytics provides accurate and unbiased insights on wireless network performance and coverage, enabling data-driven decision-making. The platform is powered by billions of daily network samples from Speedtest® users, offering information on:
Service quality and performance
RF conditions
Data usage
User density
Cell site locations
And more!
This easy-to-navigate platform enables wireless infrastructure providers to:
Identify locations for new cell sites and tower colocation
Find viable sites to lease to operators
Monitor RF and performance of networks
Identify buildings with poor indoor coverage
Assess the impact of disasters on infrastructure
Ookla’s data has been a game-changer for PSTC. Before using Cell Analytics, PSTC had trouble getting a clear picture of connectivity, and their decision-making process was slow and relied on limited, anecdotal evidence. The tools they were using previously had no numerical data, no multi-carrier views, and was less accurate overall.
However, Ookla’s “data with no agenda” (as Chief Hutchings noted) approach revolutionized PSTC’s methodology, significantly accelerating their ability to identify coverage gaps and make informed decisions.
How PSTC Leverages Cell Analytics Insights
PSTC has developed a comprehensive approach to leverage the insights provided by Ookla Cell Analytics. Their step-by-step process involves:
Visualizing signal strength, user density, and existing infrastructure to identify areas of concern and potential sites for improvement
Collaborating with public safety partners — like the Western Fire Chiefs Association — to pinpoint optimal tower placement and develop targeted solutions that address the specific needs of each community
Using the visuals from Cell Analytics to show internal and external stakeholders exactly where coverage gaps exist
PSTC uses insights from Cell Analytics both Internally and externally. For internal stakeholders, the data drives decision-making processes, helping PSTC prioritize projects and allocate resources effectively. Externally, the information is used to communicate with stakeholders, including public safety organizations and local government officials, to build consensus and secure support for infrastructure improvements.
PSTC’s data-driven approach has already led to significant improvements in wireless connectivity for public safety. In Washington state, for example, PSTC’s efforts resulted in the construction of a new tower that addressed a critical coverage gap, enabling first responders to communicate effectively and access vital information during emergencies.
Lessons for Improving Wireless Networks
The success of PSTC in using Ookla Cell Analytics data to improve connectivity for public safety offers valuable lessons for other organizations looking to enhance their wireless networks:
Identify coverage gaps using crowdsourced data to make data-driven decisions
Benchmark network performance, quality, and availability to prioritize improvements
Strategically place new cell sites or pursue tower colocation opportunities
Foster collaboration between public safety organizations and wireless infrastructure providers
By applying these lessons and working together, organizations can stay ahead of evolving challenges and leverage emerging technologies to build safer, more connected communities.
Conclusion & Looking Ahead
Consistently reliable wireless connectivity is critical for ensuring public safety. As the reliance on mobile devices and data keeps growing, comprehensive coverage and strong connectivity will continue to become even more essential.
Looking ahead, the potential for leveraging crowdsourced data to improve public safety connectivity is immense. In the future, for example, public safety teams responding to emergencies may be able to access critical information from crashed vehicles, such as Teslas, including speed, the number of occupants, and the status of airbag deployments – but only if good connectivity is available.
Wireless infrastructure providers and public safety organizations must work together to identify and address coverage gaps, leveraging crowdsourced insights to make data-driven decisions. By exploring how solutions like Ookla Cell Analytics can help improve public safety connectivity, we can build more resilient and responsive networks that better serve our communities.
To learn more, watch our webinar on-demand and discover how Ookla’s solutions can help you improve wireless connectivity in your community.
Ookla retains ownership of this article including all of the intellectual property rights, data, content graphs and analysis. This article may not be quoted, reproduced, distributed or published for any commercial purpose without prior consent. Members of the press and others using the findings in this article for non-commercial purposes are welcome to publicly share and link to report information with attribution to Ookla.
Londoners spend more time in mobile signal not-spots, or coverage gaps, and experience slower 5G speeds than residents of other UK cities—resulting in poorer performance in everyday tasks such as web browsing.
London is the sprawling metropolis at the heart of the UK economy, home to one of the world’s largest and most lucrative service hubs, supporting a vast network of finance and technology firms. Beyond its strategic time zone and English-language advantage for accessing both American and Asian markets, London’s prosperity has been founded on the availability of world-class infrastructure that facilitates doing business.
The city’s reputation for international competitiveness has not, however, been matched by the quality of its telecommunications infrastructure. In recent years, a flurry of media reports has highlighted the frustrations of Londoners—and visitors alike—that experience frequent issues using mobile devices indoors, underground, and in busy areas. These problems, reported as being more pronounced than in other UK and European cities, typically manifest as poor quality of experience in everyday tasks such as web browsing, video streaming, and gaming.
This article is the first and a high-level prelude to a series exploring the competitiveness of mobile networks in European towns and cities—starting in the UK with city-level comparisons to London, and followed by a deeper, more comprehensive analysis among international peers coming in research later this year.
Key Takeaways:
London lags behind the UK’s largest cities across key 5G performance indicators, and the gap to top-performing Glasgow is widening. In Q1 2025, London trailed other UK cities in 5G network consistency—a key indicator of performance at the lower end of the user experience—as well as in median download and upload speeds. Mobile users in London and Belfast experienced the weakest outcomes among UK cities, with median 5G download speeds of approximately 115 Mbps in both cities, significantly behind Glasgow’s 185 Mbps. London’s marked underperformance makes the UK unique in Western European terms—not only are the disparities between its major cities wider, but it is also unusual for the capital to be the primary laggard.
Mobile users in London spend more time in signal not-spots with no service than residents of other UK cities, reflecting lingering coverage gaps indoors and across key transport routes. The proportion of Londoners spending the majority of their time in locations with no service (0.7%) remained higher than in other UK cities in Q1 2025, but has improved significantly from 3.7% in Q1 2023. This progress reflects operator investments in network densification through small cells and the ongoing rollout of mobile coverage across the London Underground—historically one of the city’s largest mobile not-spots—which have together enhanced overall network availability in the capital. Time spent on 2G networks increased, however, across several UK cities over the last year, including Birmingham and Manchester, as the advancement of the 3G sunset in the UK contributed to greater propensity for 2G fallback.
The gap in 5G availability between the UK’s major cities and the national average has significantly narrowed over the past year. In Q1 2024, Leeds led UK cities in 5G availability, with a 21 percentage point gap above the national average. By Q1 2025, London had taken the lead in 5G availability among major UK cities, and that gap above the national average had narrowed to 13 percentage points. This trend reflects progress in 5G network expansion in smaller UK towns and rural areas in recent months, which has moved at a faster pace than coverage improvements in larger cities. Overall, median 5G download speeds fell by more than 7% on average across major UK cities between Q1 2024 and Q1 2025, likely reflecting the impact of shifting network load from older technologies onto 5G, which contributed to broader improvements in overall mobile network performance in most UK cities in the same period.
A confluence of factors has created unique headwinds for mobile network deployments in UK cities in recent years, particularly in dense urban settings like London
The deployment of 5G networks in higher-frequency spectrum—most commonly the 3.5 GHz band—continues to present significant challenges for operators globally. Like their counterparts across Europe, UK mobile operators have had to invest heavily in network densification during the 5G cycle. The widespread deployment of small cells at street level across UK cities illustrates the scale of effort required to increase network capacity and overcome the more limited propagation attributes of mid-band spectrum.
Over time, the city environment itself has become increasingly hostile to the operation of high-performing mobile networks. Across developed markets, advancements in building design and stricter regulations have led to a proliferation of highly insulated, airtight structures. These developments often incorporate low-E glass, metal cladding, and reinforced concrete—materials that, collectively, turn new and retrofitted buildings into de facto Faraday cages. London, in particular, presents unique challenges among UK cities, with a high concentration of high-rise buildings featuring deep floorplates.
Indoor Mobile Not-Spots Have Proliferated Across Central London, Particularly in Dense Settings with New and Retrofitted Builds (Image: Ookla Cell Analytics)
While the UK’s Part L Building Regulations are not unique or unusually stringent by European standards, they have evolved alongside a set of factors particular to the UK context that have significantly hindered mobile operators’ ability to deliver high-performing 5G networks in dense urban environments. The roots of these factors stem as far back as 2017, well before the commercialization of the country’s first 5G networks, when the UK government introduced changes to the Electronics Communications Code (ECC) in an effort to accelerate mobile network rollouts and reduce costs by streamlining access to land for telecommunications deployments.
The Digital Economy Act, which reformed the ECC, granted mobile operators and tower companies greater rights to access land on more favorable financial terms in the UK. The intention was to curb inflated lease costs, particularly in cases where landowners appeared to demand “ransom rents.” However, rather than accelerating network rollouts, the reforms triggered widespread legal disputes, uncertainty in lease negotiations, and delays in site access and upgrades.
The impact of these land access reforms has been especially acute in dense urban settings such as London, where rooftop deployments play a disproportionate role due to limited ground-level space for mobile equipment. In London, the sheer number of individual property owners—including private landlords, commercial building managers, and housing associations—results in highly fragmented land ownership, making rooftop sites significantly more complex to manage, both legally and logistically, than rural ground leases.
The Combination of Increasing Building Density, Use of New Insulation Materials, and Decline in Rooftop Site Availability Has Resulted in More Frequent Fallback to Less Capable Low-Band Spectrum in UK Cities like London (Image: Ookla Cell Analytics)
The EEC further compounded this complexity by disrupting long-standing rooftop leasing arrangements in cities like London, leading to thousands of disputes since 2017 over issues such as ransom rents, blocked site upgrades, and non-renewals. The regulation reduced potential rental income by as much as 80% to 90% for some landlords, significantly discouraging the availability of rooftop space for mobile network deployments. This effect was particularly pronounced in London, where building owners have seen greater commercial value in alternative uses for scarce rooftop space, such as bars, gardens, or solar panel installations, hindering the ability of operators to densify their networks.
The UK is the only European country to have adopted such a unilateral price-cutting approach to site access during the 5G cycle. To ease tensions between operators and land owners, the UK government introduced further changes in the “2022 Product Security and Telecommunications Infrastructure Act.” These updates aimed to encourage alternative dispute resolution, simplify lease renewals, and extend the provisions from the EEC to agreements signed before 2017. However, the reforms retained the reduced rental model, meaning while procedural barriers were reduced, incentives for property owners to host rooftop sites remained weak, failing to stem the decline in rooftop site availability in cities like London in recent years.
Combined with the UK’s decision to impose stricter controls on the use of telecom equipment from non-European vendors than those seen elsewhere in Europe, which diverted time and resources toward network rebuilds rather than expansion and upgrades, UK operators have faced significant headwinds in deploying mobile network infrastructure during the 5G cycle.
Progress in the 5G rollout belies lingering performance disparities among the UK’s major cities
Despite significant progress countrywide in improving 5G networks with additional sites, more spectrum availability (some of it from the refarming of 3G), and an expanded 5G standalone (SA) footprint, disparities continue to exist among the UK’s cities. The gap between the best- and worst-performing major cities in median 5G download and upload speeds, for example, widened between Q1 2024 and Q1 2025, based on analysis of Speedtest Intelligence® data.
The Gap in 5G Download Speeds Between Glasgow and Other UK Cities Has Widened
Speedtest Intelligence® | Q1 2024 – Q1 2025
In Q1 2025, Glasgow led the UK with median 5G download speeds reaching 185 Mbps, which was as much as 47% higher than in London, the slowest major city, and 24% higher than in Birmingham, the next best performer. This ranking profile extended to 5G network consistency, which measures the proportion of Speedtest samples that meet a minimum download and upload speed threshold of 25 Mbps and 3 Mbps. While more than 85% of Speedtest samples met this threshold in Glasgow, fewer than 75% did in London, which exhibited the lowest consistency rate among major UK cities and was the only one aligned with the national average that includes both rural and urban areas.
London’s underperformance at the lower percentiles of measures like download speeds is particularly notable, as it strongly reflects the experience of mobile users in more challenging conditions—such as at the network edge, during peak hours, or in congested areas. The city’s lower consistency score and weaker 10th percentile download and upload speeds suggest that Londoners are more likely to encounter poor mobile performance compared to residents of other major UK cities.
Londoners Experience Less Consistent 5G Performance Than Residents of Other UK Cities
Speedtest Intelligence® | Q1 2025
The UK stands out in Western Europe for both the scale of the performance gap between its major cities and the unusual fact that its capital is the lagging city. Most regional peers more closely resemble the profile of neighboring France, where Paris ranks among the top three cities nationally for 5G network consistency, as well as median download and upload speeds. In France, the gap in 5G network consistency between the best- and worst-performing cities was as narrow as 5 percentage points in Q1 2025—a disparity that is half that of the UK.
The UK's Cities Exhibit a Greater Range in 5G Consistency Than Other Western European Countries
Speedtest Intelligence® | Q1 2025
In practical terms, London’s underperformance in metrics like 5G download speed and consistency translates into poorer QoE outcomes in everyday tasks like web browsing. In Q1 2025, for example, median web page load times to popular global websites were higher in London than in nine out of ten other major UK cities.
Londoners Spend More Time Waiting on Popular Websites to Load
Speedtest Intelligence® | Q1 2025
Mobile not-spots continue to be a fixture of everyday life in UK cities, particularly in London
The combination of factors outlined earlier, including the shift toward insulation materials that inhibit signal propagation, the collapse in rooftop rental fees reducing access to mobile sites, and the use of higher-frequency spectrum for 5G, has posed challenges for mobile operators across all UK cities seeking to reduce the prevalence of mobile not-spots. These challenges have been particularly pronounced in the cities with the highest levels of density, most notably London.
Deep indoor and underground spaces (e.g., transport systems like the London Underground network) remain the primary contributors to time spent with no mobile signal or fallback to 2G networks. These cell edge scenarios are highly disruptive for the end-user, resulting in limited access to basic telephony features like texting and calling and a substantial increase in device-side power consumption.
Londoners Spend More Time in Mobile Not-Spots Than the UK Average
Speedtest Intelligence® | Q1 2024 – Q1 2025
The proportion of mobile users in London spending the majority of their time in locations with no network access at all (0.7%) was higher than in other major UK cities in Q1 2025 (an observation related to the capital city that again defies Western European norms). By contrast, less than 0.3% of mobile users in Belfast, Bristol and Sheffield spent the majority of their time in not-spots in the same period. Overall, time spent with no service accounted for as much as 2.6% of quarterly network usage in Q1 2025 in London, significantly higher than the national average.
Despite the disproportionate scale of mobile not-spots lingering in London, recent operator investments in network densification and progress in the ongoing rollout of 4G and 5G coverage throughout the London Underground network are driving dramatic improvements in outcomes. The proportion of Londoners spending the majority of their time in locations with no service has more than halved over the last two years, reflecting a much more pronounced pace of improvement than other UK cities and putting the capital on course to fall into line with other large cities like Birmingham and Manchester.
The Proportion of Mobile Users Spending the Majority of Their Time on 2G Has Increased in Several UK Cities
Speedtest Intelligence® | Q1 2024 – Q1 2025 (Including Roaming Samples)
The advancement of the UK’s 3G sunset, which is set to be substantially complete by the end of this year, is reflected in a sharp reduction in the proportion of mobile users spending the majority of their time on 3G networks. In London, for example, this proportion fell from over 4.5% in Q1 2023 to less than 0.7% in Q1 2025.
The 3G sunset has, however, contributed to an increase in 2G fallback in UK cities at the cell edge where 4G and 5G networks are unavailable. Time spent on 2G increased across several UK cities over the last year, including Liverpool, where this trend has resulted in a larger share of users spending the majority of their time on 2G than in areas with no service at all (a rarity among UK cities).
The Decline in 3G Usage Has Been Similarly Rapid Across UK Cities
Speedtest Intelligence® | Q1 2023 – Q1 2025
Cities that take a proactive approach to telecoms feature the best 5G outcomes
Glasgow’s position as the leading UK city in key 5G performance indicators is unlikely to be an outcome achieved by mere chance. Beyond the contribution of inherent structural factors related to building composition, such as a lower prevalence of high-rise developments relative to other major UK cities, Glasgow’s 5G leadership is also likely rooted in its early and proactive approach to supporting telecoms infrastructure.
The city was among the first in Europe to establish a dedicated “Telecoms Unit”, which streamlined access to city-owned assets for telecom deployments, provided standardized agreements for rental fees, and consolidated telecoms functions within the local authority to reduce departmental siloes. This proactive approach facilitates inward investment in network infrastructure and better 5G outcomes.
Ookla retains ownership of this article including all of the intellectual property rights, data, content graphs and analysis. This article may not be quoted, reproduced, distributed or published for any commercial purpose without prior consent. Members of the press and others using the findings in this article for non-commercial purposes are welcome to publicly share and link to report information with attribution to Ookla.
As Morocco gears up for the summer festivities and the Africa Cup of Nations (AFCON) at the end of 2025, the spotlight is on the performance and hospitality of its top hotels. With cities like Rabat, Casablanca, Marrakech, and Agadir ready to welcome tourists and football fans, these hotels are expected to provide seamless Wi-Fi connectivity to meet their guests’ needs. This article explores how these cities and their premier hotels compare in terms of fixed broadband and Wi-Fi experience.
Key Takeaways:
Rabat and Casablanca are leading the pack in terms of fixed broadband speed. According to Speedtest Intelligence® data, these two key cities boasted median broadband speeds of 36.55 Mbps and 35.57 Mbps, respectively, in Q4 2024. Maroc Telecom’s extensive fiber coverage allows it to consistently outperform its competitors, inwi and Orange, across the cities reviewed.
Luxury hotels in Agadir and Marrakesh offer some of the fastest Wi-Fi networks in Morocco. Our analysis reveals that elite hotels like The View and Hotel Riu Palace Tikida in Agadir, along with La Mamounia in Marrakesh deliver excellent Wi-Fi performance. However, other five-star hotels, particularly those in Casablanca and Rabat, are lagging, highlighting opportunities for network optimization even among top-rated venues.
The broadband market is poised for rapid expansion, driven by fiber deployment and 5G launch plans. These advancements promise to strengthen the telecom sector, enhance visitor experiences, and boost Morocco’s appeal as a top tourist destination.
Morocco’s tourism boom and rapid telecom expansion ahead of Africa Cup of Nations
Morocco, renowned for its rich culture and stunning landscapes, is experiencing a surge in visitor numbers. By the end of February 2025, the country recorded 2.7 million tourists, a 24% increase from the previous year. As Morocco gears up to the summer holiday season and will host the Africa Cup of Nations from December 21, 2025, to January 18, 2026, attention is on its infrastructure, particularly its fixed network performance, to support guests and football fans during their stay. With the influx of tourists and the upcoming international sporting event, it’s crucial to examine the Wi-Fi performance in hotels across Morocco.
The country’s fixed telecom sector has been growing rapidly and is driven by fiber deployment. According to the Moroccan telecom regulator (ANRT), the fixed broadband market increased from just over 1.6 million in 2019 to nearly 2.6 million connections in September 2024 (out of around 8 million households). This includes 1.6 million ADSL subscribers and 990,000 fiber-to-the-home (FTTH) subscribers.
Maroc Telecom holds a 62% market share of the ADSL segment and 50% in the FTTH segment. Competitors inwi and Orange offer more limited fiber coverage but provide cheaper entry-level fiber packages. This disparity in network coverage impacts the speed experienced in different cities, as we will see next.
Rabat and Casablanca are at the forefront of fixed broadband speed among hosting cities
In a recent article, we discussed fixed broadband performance in North Africa, including Morocco, and how fiber deployment has helped lift these countries in the Speedtest Connectivity Index. Morocco secured the second spot in the region for Q4 2024 and saw a 32% year-on-year improvement in median fixed broadband download speed, reaching 35.57 Mbps. It also surpassed Egypt in median upload speed in Q3 2022 to reach 31.86 Mbps in the last quarter of 2024.
Broadband performance varies across regions. The top tourist cities hosting the AFCON show different median and upload speeds. Rabat leads with a median download speed of 36.55 Mbps and a median upload speed of 32.56 Mbps in Q4 2024, slightly above the national median of 35.57 Mbps. Casablanca follows closely with download and upload speeds of 35.57 Mbps and 29.42 Mbps, respectively. Meanwhile, Marrakesh, Agadir and Tangier trail, with median download speeds of 28.96 Mbps, 23.64 Mbps and 20.57 Mbps.
Fixed Network Performance by City, Morocco
Speedtest Intelligence® | Q4 2024
Fixed Network Performance In by City, Morocco
These city-level results hide large disparities between Maroc Telecom and its competitors. Maroc Telecom leads with median download speeds ranging from over 43 Mbps in Agadir to nearly 60 Mbps in Casablanca in Q4 2024. In contrast, Orange’s speeds range from 14.1 Mbps in Marrakech to 20.36 Mbps in Casablanca. inwi is slightly behind, showing download speeds from 12.72 Mbps in Tangier to 15.64 Mbps in Rabat. The disparity could be attributed to Maroc Telecom’s extensive fiber coverage and service availability in more areas, reinforcing its leading position in all reviewed cities. In fact, Moroc Telecom was the fastest ISP at the country level in H2 2024, according to Ookla’s Speedtest® Connectivity Report, while Orange recorded the best video streaming experience among ISPs.
Fixed Network Performance per City and per Operator, Morocco
Speedtest Intelligence® | Q4 2024
Fixed Network Performance per City and per Operator, Morocco
Luxury hotels in Agadir and Marrakesh have among the fastest Wi-Fi networks in Morocco
Using Speedtest Intelligence® data, we analyzed Wi-Fi performance in 10 top-rated five-star hotels and resorts in Morocco shortlisted based on their popularity and quality. We reviewed median download and upload speeds over 18 months (August 2023 to February 2025). This period helps gauge the performance and stability of the Wi-Fi network with different hotel occupancy levels and guest profiles.
The View and Hotel Riu Palace Tikida in Agadir, along with La Mamounia in Marrakesh, top the list with median download speeds of 72.27 Mbps, 55.72 Mbps, and 54.64 Mbps, respectively. Their upload speeds are similarly impressive, with The View exceeding its download speed at 92.10 Mbps.
The second tier of hotels, including Sofitel-branded venues in Agadir, Rabat, and Casablanca, and the Royal Mansour Marrakech, deliver good Wi-Fi performance, with speeds between 25 Mbps and 50 Mbps. Hotels based in Agadir and Marrakesh have a slight edge, averaging download speeds of around 46 Mbps. Royal Mansour Marrakech stands out again with a high upload speed of 72.93 Mbps, the second highest in this survey. The higher upload speeds relative to download speeds suggest that the hotels’ Wi-Fi networks might not be optimally managed.
The third group struggles, with median download speeds of just over 10 Mbps at Rabat Marriott Hotel and around 19 Mbps at two Four Seasons-branded hotels in Marrakesh and Casablanca, the latter having symmetrical download and upload speeds.
Despite lower broadband median download speeds in the cities of Agadir and Marrakesh, the Wi-Fi in their top local hotels outperforms their peers in cities with higher speeds. Conversely, hotels in Casablanca and Rabat, which excel in citywide broadband download and upload speeds, fall short in Wi-Fi performance. These five-star venues likely connect to the fiber network, yet poor Wi-Fi network performance may stem from limited, outdated, or misconfigured access points. Optimizing equipment placement and upgrading systems could enhance performance and reduce congestion.
Fiber and 5G rollout paving the way for a boost in Morocco’s tourism experience
The government has set ambitious targets for fiber deployment under the “Maroc Digital 2030” program. With a budget of US$1 billion, it aims to connect 4.4 million households with fiber by 2025 and reach 5.6 million fiber-connected households and 6,300 government institutions by 2030.
Morocco is also gearing up for 5 G technology in preparation for the 2025 Africa Cup of Nations and the 2030 FIFA World Cup. The ANRT is expected to auction the 5G spectrum in early 2025, enabling operators to offer high-speed 5G fixed wireless access (FWA) services in regions not yet covered by fiber.
At the end of March 2025, Maroc Telecom and inwi have also forged a strategic partnership to accelerate the deployment of fiber optic and 5G technologies. The collaboration involves creating two joint ventures: FiberCo, which aims to expand fiber connections to 1 million in two years and 3 million in five years, and TowerCo, which plans to build 2,000 new towers in three years and 6,000 in ten years to support 5G rollout.
These advancements promise to significantly enhance internet connectivity across Morocco. For the tourism sector, this translates to improved online experiences for visitors, as hotels and other accommodations will be better equipped to meet growing demands for high-speed, reliable internet access. Enhanced connectivity could boost Morocco’s appeal as a tourist destination, especially for travelers who prioritize seamless online access for leisure and business.We will continue to track network performance in North Africa and report on infrastructure readiness for major sporting events in the region. If you are interested in Ookla’s solutions and services for network intelligence and management, get in touch.
Ookla retains ownership of this article including all of the intellectual property rights, data, content graphs and analysis. This article may not be quoted, reproduced, distributed or published for any commercial purpose without prior consent. Members of the press and others using the findings in this article for non-commercial purposes are welcome to publicly share and link to report information with attribution to Ookla.
In a boost of confidence for FWA, both T-Mobile and Verizon announced plans to expand their service beyond their initial subscriber targets
Editor’s note: This report was revised on April 11 to reflect updates to AT&T’s median upload and download speeds.
Key Takeaways:
As of Q4 2024, T-Mobile’s fixed wireless access (FWA) subscriber base now tops 6.43 million. However, that growth in FWA subscribers hasn’t impacted the company’s download speeds. T-Mobile’s FWA median download speeds increased more than 50% from 134.99 Mbps in Q4 2023 to 205.44 Mbps in Q4 2024.
A late entrant into the FWA space because it launched service in August 2023, AT&T’s Internet Air FWA customers experience strong median download speeds of 125.93 Mbps (as of Q4 2024).
T-Mobile consistently outpaces the competition when it comes to median upload speeds.
Verizon and T-Mobile have both recently increased their goals for the number of FWA subscribers they plan to attract by 2028. Verizon increased its goal to 8 million to 9 million by 2028 and T-Mobile increased its goal to 12 million by 2028.
5G fixed wireless access (FWA) has steadily gained popularity in the U.S. over the past four years and now the service has more than 11.5 million subscribers —and that’s just counting the FWA subscribers from the big three nationwide operators. Today FWA is considered a viable broadband competitor, and its traction with customers has caused many cable operators to lose customers to FWA.
Download Speeds on the Rise
Although there have been concerns about traffic from FWA subscribers causing congestion and negatively impacting the performance of both mobile and FWA customers because the same 5G spectrum is being used to deliver both services, Ookla® Speedtest® data found that hasn’t been the case. T-Mobile’s FWA subscriber base, which now tops 6.43 million actually saw its median download speeds increase more than 50% from a median download speed of 134.99 Mbps in Q4 2023 to a median download speed of 205.44 Mbps in Q4 2024. This increase in speed isn’t surprising, as T-Mobile executives told investors during the company’s Capital Markets Day last October that they have seen a 3x increase in customers FWA speeds since the service was launched in Q1 2021.
But T-Mobile isn’t the only operator seeing an increase in FWA speeds. Verizon, which has more than 4.3 million FWA subscribers, saw its median download speed rise more than 12% from 132.55 Mbps in Q4 2023 to 150.47 Mbps in Q4 2024. AT&T, which only launched its Internet Air service in August 2023, ended the year with a median download speed of 125.93 Mbps.
T-Mobile CEO Mike Sievert addressed questions about congestion negatively impacting performance during the company’s recent Q4 2024 earnings call with investors by saying that the company studies algorithms that can determine its network capacity levels in such detail that they know when certain sectors of specific towers are becoming congested. “When approving applicants for fixed [wireless] in the first place we study our algorithm,” Sievert said, adding that if the algorithm says that the sector will continue to have excess capacity, then T-Mobile will approve an applicant for home broadband.
“We don’t see sectors or towers becoming saturated due to fixed wireless,” he added.
T-Mobile’s FWA download speeds steadily increased from Q4 2023 until Q4 2024.
Minimizing Capacity Constraints with Speed Caps
Taking a cue from its cable counterparts, Verizon has started managing its network capacity by capping its FWA download speeds at 300 Mbps. When we looked at the 90th percentile of Download Speeds for Verizon, T-Mobile and AT&T, it appears that Verizon is enforcing those data speed caps, which it spells out in its 5G Home broadband price plan disclosures. The company has three tiers of service for its FWA service. There’s a top-tier 5G Home Plus that provides up to 1 Gbps download speeds using its 5G Ultra Wideband or mmWave spectrum and a mid-tier 5G Home Plus plan that provides up to 300 Mbps download speeds that uses just 5G Ultra Wideband spectrum. The lower tier 5G Home plan provides up to 300 Mbps download speeds using 5G Ultra Wideband or mmWave spectrum. Currently Verizon has the 5G Home Plus plans priced at $55 per month and the lower tier 5G Home plan priced at $35 per month.
Similar to Verizon, T-Mobile offers three tiers of service: All-In Home Internet plan priced at $70 per month (or $55/mo. with a voice line) that features typical download speeds of 133 Mbps to 415 Mbps and includes streaming services Hulu+ and Paramount+; Amplified Home Internet that costs $60 per month (or $45/mo. With a voice line) and features typical download speeds of 133 Mbps to 415 Mbps; and Rely that costs $50 per month (or $35/mo. With a voice line) and features typical download speeds of 87 Mbps to 315 Mbps).
Although Speedtest data doesn’t indicate that T-Mobile is slowing down the speeds or capping the speeds of its FWA customers at this time, T-Mobile does say on its web site that during times of congestion, Home Internet customers that use more than 1.2 TB of data per month might see their speeds reduced due to data prioritization. T-Mobile said it started implementing this soft cap on its new FWA subscribers in January 2024 and expanded it to all its FWA subscribers later that year.
When looking at the 90th percentile of Speedtest users download speeds, it’s evident that Verizon is capping its download speeds slightly above 300 Mbps.
FWA Upload Speeds Are Improving
Upload speeds are becoming increasingly important to consumers and remote workers for activities such as conducting live video calls without lag or doing online collaboration and sharing of files without having hiccups in the workflow.
Our data shows that median FWA upload speeds increased from Q4 2023 to Q4 2024 with T-Mobile’s upload speeds consistently outpacing the competition. T-Mobile’s upload speed increased 9.05% from 19.88 Mbps in Q4 2023 to 21.68 Mbps in Q4 2024.
Verizon saw its median upload speeds increase over 7% from 12.84 Mbps in Q4 2023 to 13.88 in Q4 2024. AT&T’s Internet Air median upload speeds dropped 17.16% from 15.89 Mbps in Q4 2023 to 13.17 Mbps in Q4 2024.
T-Mobile’s upload speeds surpass that of AT&T and Verizon.
Latency Ebbs and Flows
Unlike FWA upload and download speeds that have improved from Q4 2023 until Q4 2024, latency figures have remained somewhat static for Verizon and AT&T while T-Mobile’s latency has declined. Latency is a key measurement because higher latency will impact real-time applications such as online gaming and video conferencing.
AT&T’s latency of 74 milliseconds (ms) in Q4 2023 and 73 ms in Q4 2024 was consistently higher than both T-Mobile and Verizon. T-Mobile saw its latency decline from 61 ms in Q3 2023 to 52 ms in Q4 2024 and Verizon saw its latency rise slightly from 52 ms in Q4 2023 to 53 ms in Q4 2024.
AT&T’s latency was consistently higher than T-Mobile and Verizon.
Moving the Subscriber Goal Post
T-Mobile and Verizon executives are both so bullish on FWA (and the revenue it’s generating for the companies) that both recently increased their FWA subscriber goals.
Verizon doubled the number of FWA subscribers that it plans to acquire to between 8 million to 9 million by 2028, up from the initial goal of attracting 4 million to 5 million customers by the end of this year.
Likewise T-Mobile executives said during the company’s Capital Market Days in October 2024 that they were increasing their FWA customer target to 12 million by 2028, up from its initial goal of providing FWA service to 7 million to 8 million customers by 2025. T-Mobile is planning to continue with its same strategy, which is to deliver FWA in areas where there is fallow spectrum and the network isn’t constrained. This is particularly applicable in rural areas where T-Mobile has spectrum and towers but also fewer mobile users.
AT&T is a bit of a newcomer to the FWA, having just launched its 5G FWA service in August 2023. The company said it ended Q4 2024 with more than 650,000 Internet Air subscribers. However, AT&T CEO John Stankey has publicly stated that the company views FWA as a stopgap tool for capturing customers who don’t have a satisfactory broadband connection, including those using AT&T’s DSL service. FWA allows AT&T to keep those customers but its long-term goal is to eventually upsell them to fiber when it’s available.
Consumers keen on FWA
Since T-Mobile and Verizon first launched their FWA offerings in 2021 they’ve steadily grown their customer base. In fact, FWA is a popular choice for consumers, often because it’s slightly less expensive than fiber or cable but also because it’s easy for them to purchase, install and return if it doesn’t meet their expectations.
According to Recon Analytics, which conducted interviews with 288,490 Americans between July 2023 and December 2024, 44% of respondents said they would choose an FWA provider for their next broadband provider if they had to make that choice, 25% said they would pick a fiber provider and 17% said they would select a cable provider. The remaining said they would choose DSL or a satellite provider.
Likewise, an April 2024 report from JD Power found that 5G FWA users have the highest satisfaction of all broadband providers, with fiber coming in second place.
But even though overall satisfaction for FWA is high, when we look at the download speeds of the 10th percentile of Speedtest users by hour of day we see that customers in this category are experiencing some unsatisfactory speeds, particularly in the afternoon and evening when the network is the busiest. According to our data, T-Mobile Speedtest users in the 10th percentile saw their speeds dip to 13.50 Mbps at 8 p.m. while Verizon Speedtest users saw their speeds dip to 15.81 Mbps at that time and AT&T users saw their speeds drop to 15.99 Mbps.
FWA Performance is Evolving
Although T-Mobile, Verizon and AT&T were the focus of this FWA report because they have the most FWA customers, there are smaller regional operators that also offer FWA service such as USCellular, which reported having 150,000 FWA customers at the end of Q4 2024. In addition, Cspire recently launched FWA service to customers in Mississippi and fiber provider BrightSpeed recently said it plans to launch an FWA service in partnership with Verizon. There are many small wireless ISPs also offering FWA using unlicensed spectrum throughout the country.
We expect the FWA market to continue to grow and evolve and we will continue to measure their performance, particularly with these new FWA subscriber goals from T-Mobile and Verizon coupled with AT&T’s FWA growth in the market. Verizon also revealed that it plans to commercially launch an FWA product using millimeter wave (mmWave) spectrum to deliver 1 Gbps speeds to multi-dwelling units (MDUs). That FWA product is currently in customer trials and is expected to launch soon.
It will be interesting to see if U.S. operators are able to continue to deliver strong download and upload speeds to FWA customers and still grow their customer base as rapidly as they have over the past few years.
If you are interested in learning about how 5G FWA is reshaping the broadband market in the Gulf region, please check out this other FWA report from Ookla. To find out more about Speedtest Intelligence® data and insights, please contact us here.
Ookla analyst Kerry Baker contributed to this report.
Ookla retains ownership of this article including all of the intellectual property rights, data, content graphs and analysis. This article may not be quoted, reproduced, distributed or published for any commercial purpose without prior consent. Members of the press and others using the findings in this article for non-commercial purposes are welcome to publicly share and link to report information with attribution to Ookla.
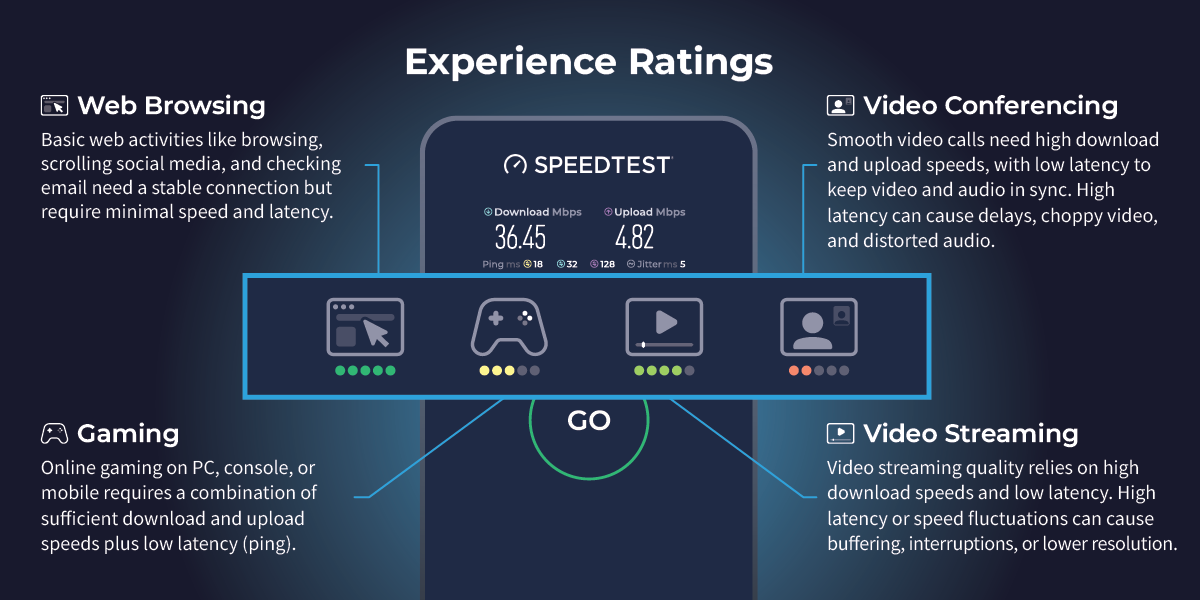
We are excited to introduce Speedtest Experience Ratings, a new feature in the Speedtest app and website designed to help you better understand how your Speedtest results translate into real-world performance. These ratings provide insights on four key online activities: Web Browsing, Online Gaming, Video Streaming, and Video Conferencing. Each metric is given a score on a 1 to 5 scale (1 = Poor, 5 = Excellent) to indicate expected performance.
Metrics Impacting Your Ratings
While Speedtest primarily displays download speed, upload speed, and ping, our Experience Ratings account for additional factors like jitter, loaded latency, and packet loss. All of these metrics can impact real-world performance, even if your speed results look strong.
Download Speed: How quickly you can pull data from a server on the internet to your device
Upload Speed: How quickly you can send data from your device to the internet
Latency (or Ping): The reaction time of your connection — how quickly your device gets a response after you’ve sent out a request
Jitter: Also called Packet Delay Variation (PDV), jitter is a measure of the variability in ping over time
Loaded Latency Increase: Calculates the excess latency by finding the higher value between download and upload latency and subtracting a baseline latency
Packet Loss: Packet loss occurs when a packet of data being sent over the internet is not received or is incomplete
Understanding Experience Ratings
Web Browsing
Web browsing includes activities like visiting websites, scrolling social media, and checking emails. This is one of the least demanding activities in terms of speed and latency, but stability is key.
Latency Considerations: Latency is not typically an issue for basic browsing
Estimated Data Usage:
General browsing & social media: ~60 MB per hour
Email (without large attachments): ~1 MB per email
Email (with attachments): Varies based on file size
Online Gaming
A smooth gaming experience requires a combination of sufficient download and upload speeds as well as low latency. High latency can cause lag, delays in player actions, and an overall poor experience.
Relevant Metrics: Ping, Packet Loss, and Loaded Latency Increase
Recommended Speeds:
Download: 3-10 Mbps per player (higher for modern, high-resolution games)
Upload: 1-3 Mbps
Latency Considerations:
Ideal Ping: Below 50ms
Moderate Ping: 50-100ms (may experience minor lag)
High Ping: Over 100ms (noticeable lag and delay in gameplay)
Estimated Data Usage:
Casual gaming: ~40 MB per hour
Competitive online gaming: ~100 MB per hour
Game downloads/updates: Varies significantly (e.g., AAA games can be 50-150 GB)
Video Streaming
The quality of your video streaming experience depends primarily on high download speeds and low latency. If latency is too high or speeds fluctuate, you may experience buffering, interruptions, or a reduction in video resolution.
Relevant Metrics: Download, Ping, Packet Loss, and Loaded Latency Increase
Recommended Speed:
Standard Definition (SD, 480p): 3-4 Mbps
High Definition (HD, 720p-1080p): 5-10 Mbps
4K Ultra HD: 25 Mbps or higher
Latency Considerations:
Low latency helps ensure smooth playback without buffering.
Estimated Data Usage:
SD (480p): ~700 MB per hour
HD (1080p): ~1.5-3 GB per hour
4K UHD: ~7-10 GB per hour
Video Conferencing
For smooth video calls, both high download and upload speeds are important. Low latency is crucial for keeping video and audio in sync, whereas excessive latency can lead to delays, choppy video, and distorted or out-of-sync audio.
Relevant Metrics: Ping, Packet Loss, Jitter, and Loaded Latency Increase
Recommended Speeds:
Standard Definition (480p): 1 Mbps download / 1 Mbps upload
High Definition (720p-1080p): 3-6 Mbps download / 2-3 Mbps upload
4K Video Conferencing: 10-15 Mbps download / 5-10 Mbps upload
Latency Considerations:
Low latency helps ensure smooth playback without buffering.
Estimated Data Usage:
SD (480p): ~700 MB per hour
HD (1080p): ~1.5-3 GB per hour
4K UHD: ~7-10 GB per hour
Speedtest Experience Ratings in Action
Here’s a look at Experience Ratings during a Speedtest:
Want to know your Experience Ratings? Take a Speedtest!
Ookla retains ownership of this article including all of the intellectual property rights, data, content graphs and analysis. This article may not be quoted, reproduced, distributed or published for any commercial purpose without prior consent. Members of the press and others using the findings in this article for non-commercial purposes are welcome to publicly share and link to report information with attribution to Ookla.
Every telecommunications provider faces the challenge of customer churn — the rate at which subscribers cancel or switch providers over a given time period. While churn is inevitable, it isn’t cheap. Industry studies consistently show that acquiring a new customer costs 5 to 25 times more than keeping an existing one. Despite this economic reality, many internet providers struggle to identify the specific factors that drive customers to switch services.
As new technologies like 5G and Fiber to the Home (FTTH) transform the telecommunications landscape, providers need to look beyond traditional metrics like download speed to understand and improve customer satisfaction. Network responsiveness and the quality of everyday connected experiences – like video conferencing, streaming movies, and online gaming – play crucial roles in retaining customers. But without access to granular data and insights into these actual user experiences, providers risk misallocating resources and missing opportunities to address the true drivers of churn.
Ookla’s crowdsourced data provides these key insights by capturing both Quality of Experience (QoE) and Quality of Service (QoS) metrics, along with provider ratings and Net Promoter Scores (NPS), to reveal the reasons behind customer churn. In this article, we’ll explore how these comprehensive measurements help providers pinpoint churn factors, improve retention strategies, and optimize user experiences. For a deeper dive, check out our webinar “Why Customers Leave: Preventing Churn with Crowdsourced Data.”
The Connection Between Network Performance and Customer Retention
Customer decisions to stay or leave are heavily influenced by network performance. While promotional offers and pricing strategies play a role in these decisions, long-term retention also depends on delivering a fast, consistent, and responsive experience. Providers that fall short risk losing subscribers to competitors that consistently meet customer expectations.
A recent Ookla analysis revealed a striking pattern across the United States: providers with higher percentages of low-latency connections consistently achieve better customer satisfaction scores and higher retention rates than those with slower, less responsive networks. The impact of low latency on customer loyalty is particularly clear when looking at customer satisfaction for users on fiber compared to those on non-fiber networks:
Fiber networks averaged a 3.84 customer rating (on a 5-point scale) versus 3.17 for non-fiber connections.
Net Promoter Score (NPS) — a standard customer loyalty metric that measures willingness to recommend a company on a scale from 0-10 — showed an even more dramatic difference, with fiber networks achieving positive scores of around +20 while non-fiber networks averaged -16.5.
While providers have traditionally emphasized download speed in their marketing and performance assessments, our data shows that latency may play an even bigger role in keeping customers happy and reducing churn.
Beyond Speed: Understanding QoS and QoE Metrics
For decades, the telecommunications industry has typically focused on a single metric — download speed — as the primary measure of network quality. With download speed often viewed as a proxy for overall bandwidth, the assumption was that more bandwidth would generally lead to a better user experience.
However, speed alone doesn’t fully explain why customers with objectively fast connections can still experience issues like slow video buffering, delays in real-time applications, or inconsistent app performance. Other network factors — particularly latency — can significantly contribute to these problems, often leading to user frustration and, in some cases, prompting them to switch providers.
That’s why it’s crucial for providers to gain a more holistic view of performance that reflects how customers actually experience their network in daily life. Ookla collects this comprehensive data through two complementary approaches:
Quality of Service (QoS): Measuring What Networks Deliver
Quality of Service measures the technical aspects of network performance that affect user experience, including speed and latency, which influence how well a network can deliver a smooth, consistent connection.
QoS is measured when users actively run a Speedtest. These tests capture key network performance metrics, including:
Download and upload speeds (measuring network capacity)
Latency and jitter (measuring network responsiveness)
Network provider identification and connection type (mobile, fixed, Wi-Fi)
Quality of Experience (QoE): Measuring Real-World User Experiences
Quality of Experience metrics examine how users actually experience the network during everyday digital activities. These metrics provide insights into how various network types perform across key performance indicators that directly impact user satisfaction. From streaming Netflix and video chatting with colleagues to competing in online games, network performance plays a significant role in shaping the user experience.
QoE metrics are primarily collected through Ookla’s embedded SDK across hundreds of applications in the digital ecosystem, measuring performance across various network types, including fiber and non-fiber connections. Here are some notable performance differences observed between fiber and non-fiber networks based on QoE metrics:
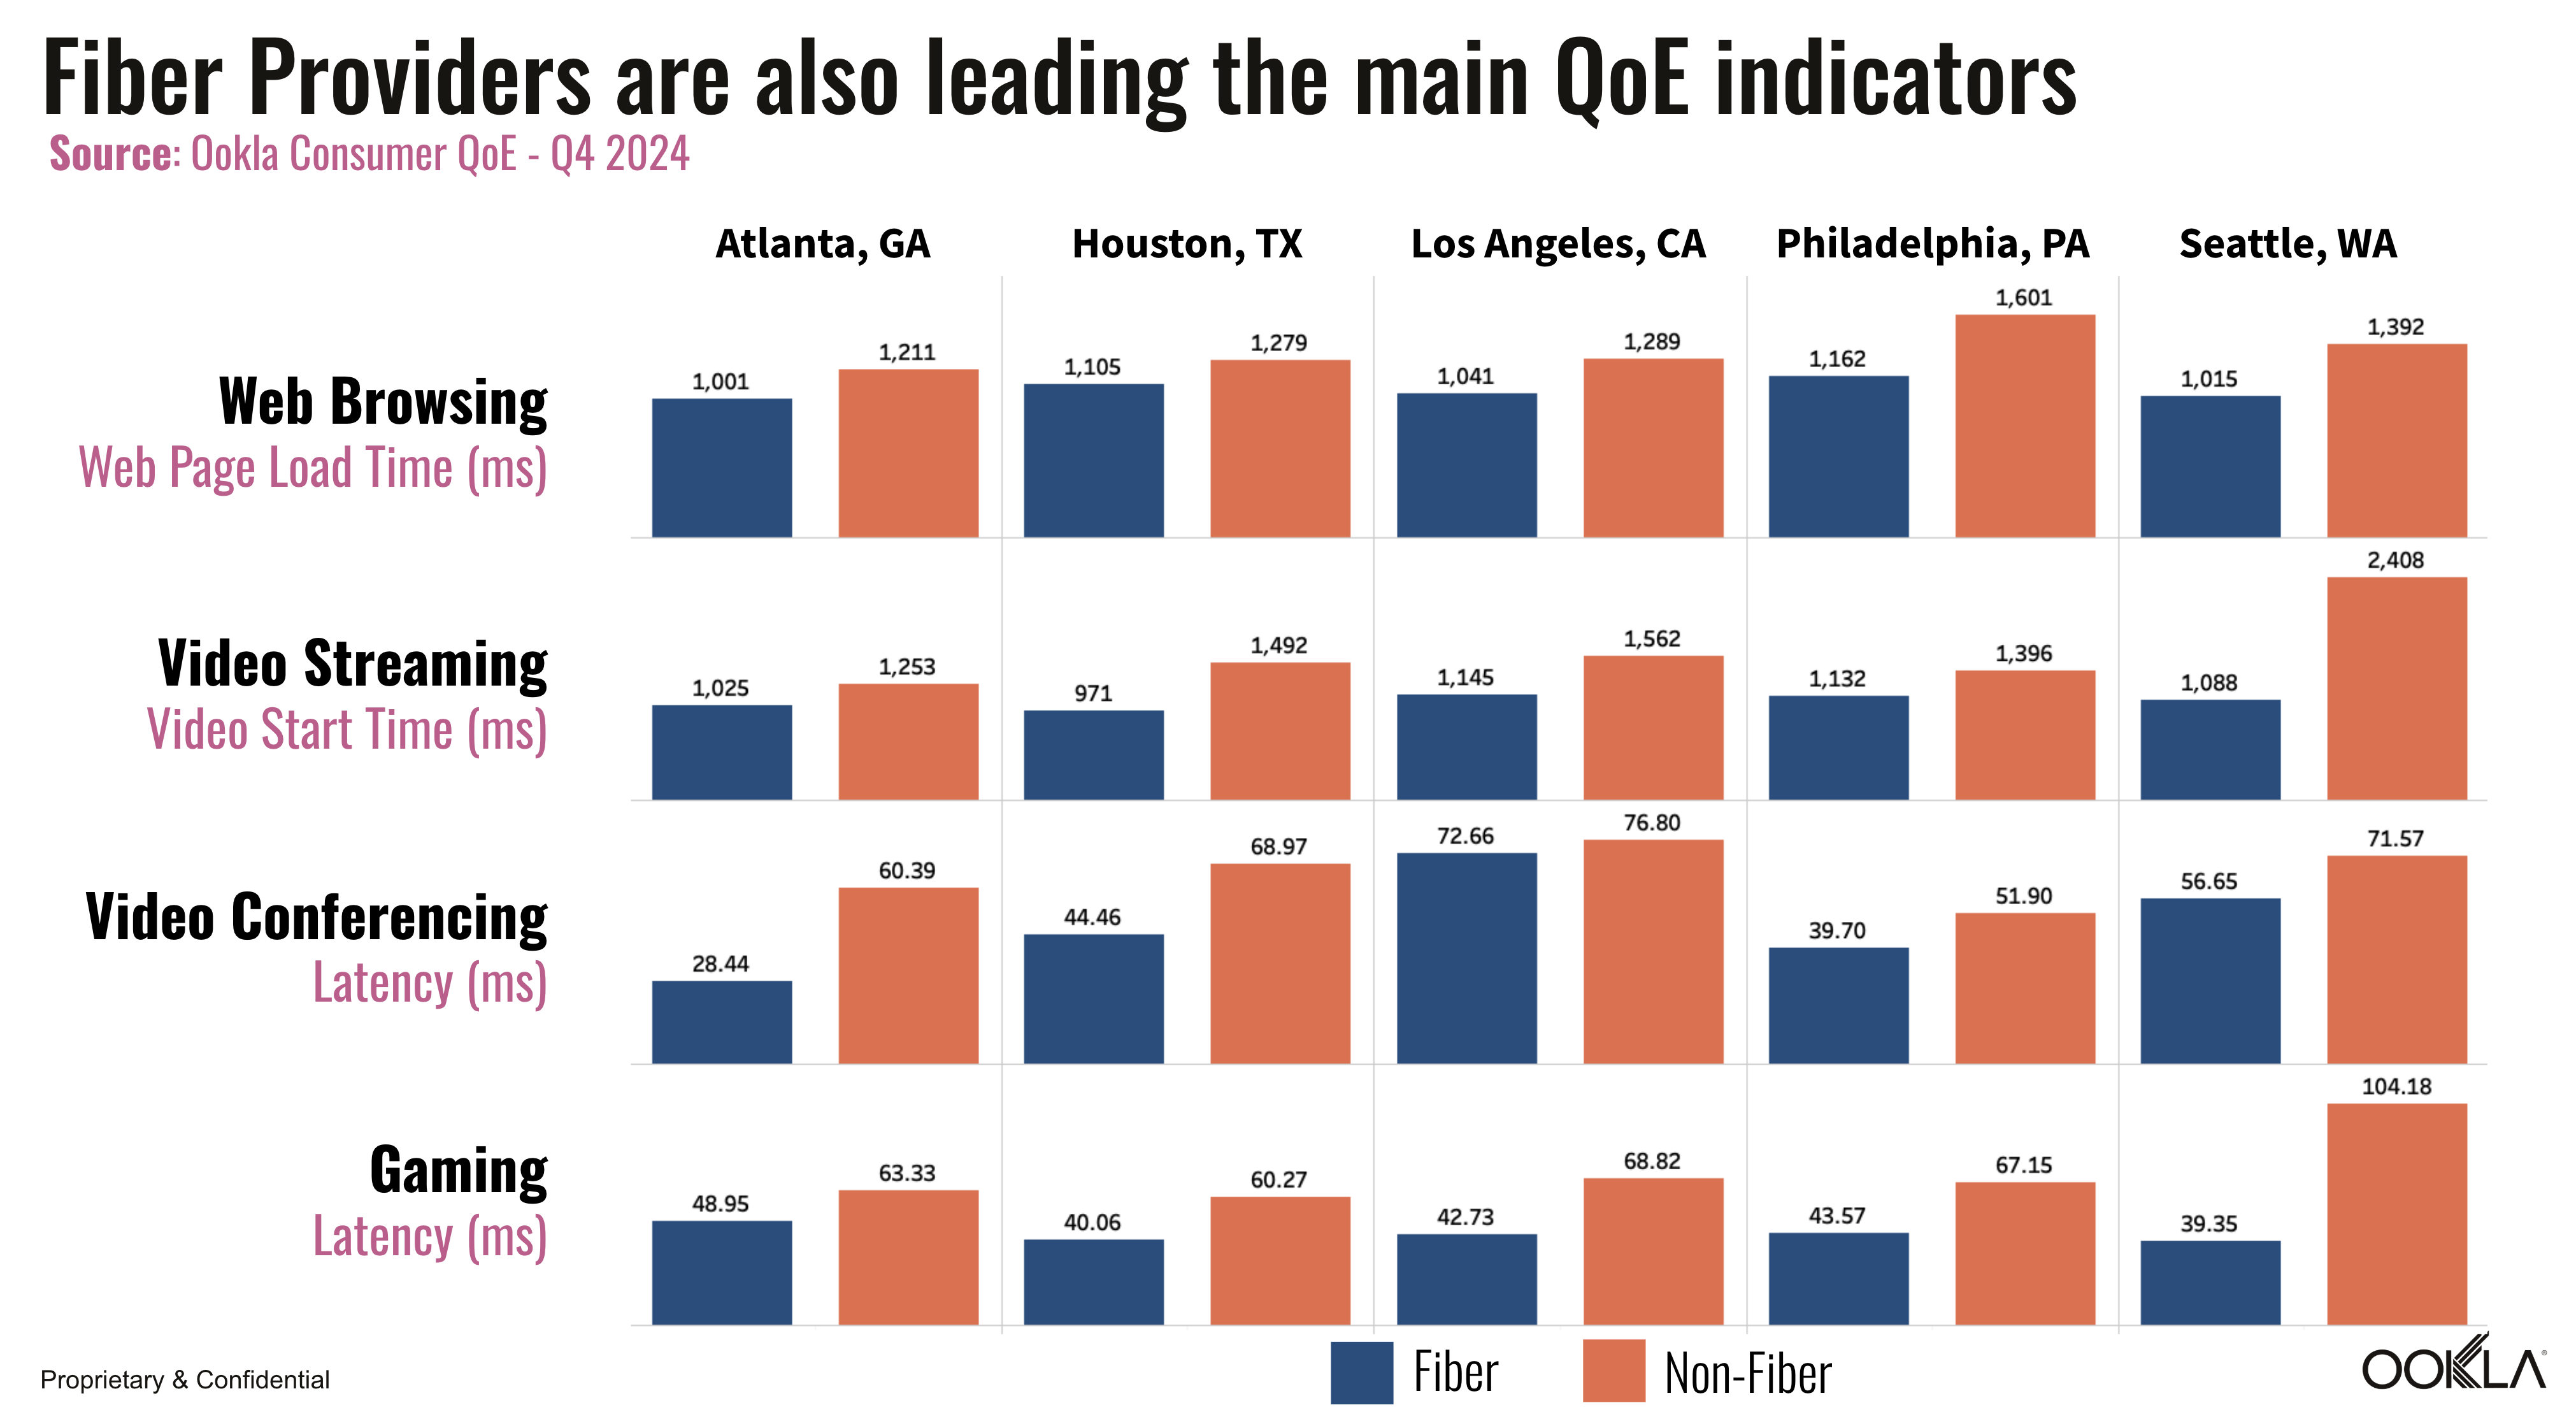
Video streaming: Metrics like video start time show significant differences between network types, with fiber connections averaging 1.47 seconds versus 1.76 seconds for non-fiber, a 16% improvement that reduces buffering when starting videos or changing resolutions.
Web browsing: Page load times on fiber networks averaged 1.12 seconds compared to 1.35 seconds for non-fiber, a 17% faster experience that adds up to significant time savings during extended browsing sessions.
Video conferencing: Across Zoom, Google Meet, Microsoft Teams, and WhatsApp, fiber networks delivered conferencing latency of 51.56 ms versus 79.43 ms for non-fiber, a 35% improvement that, combined with other network factors, contributes to more consistent video and audio quality.
Gaming: Lower latency in fiber networks can create substantial competitive advantages in gaming. Ookla data shows fiber networks deliver gaming latency improvements ranging from 22.8% in Atlanta (48.95 ms vs 63.33 ms) to 62.2% in Seattle (39.35 ms vs 104.18 ms). For gamers, milliseconds matter – faster network response means more immediate reactions to controls, giving players a smoother experience and potential edge.
No one likes a laggy game, a frozen video call, or a sluggish webpage — and when frustration piles up, customers often start looking for a better option. Ookla’s QoE and QoS insights can help providers stay ahead of customer experience issues and make the kinds of improvements that keep users happy.
Understanding Churn: Where Customers Go and Why They Leave
It’s not enough to know that customers are leaving — providers need to know where they’re going and why. Traditional churn metrics only tell you that subscribers are switching, but they typically don’t reveal which competitors are gaining them or which locations are most affected.
That’s where Ookla’s Net Flow Percentage analysis comes in. By tracking aggregated, anonymized user data, providers can pinpoint exactly where they’re losing customers, find patterns in subscriber movement, and see how network performance correlates with subscriber losses or gains. Net Flow Percentage analysis helps providers:
Identify location patterns by analyzing service areas with changing usage trends
Observe provider transitions to understand shifts in market share over time
Calculate Net Flow percentage as the difference between users gained and users lost in a given area
When combined with performance metrics, Net Flow Percentage analysis offers key correlations that can guide targeted technical improvements where they’ll have the greatest impact on retention, while also revealing potential reasons behind churn.
How ISPs Can Prevent Churn
Providers can no longer afford to simply react to customer churn; they must be proactive in staying ahead of potential issues and actively fostering loyalty. Strategies that focus on continuously enhancing the customer experience are now essential. Ookla’s data provides valuable competitive benchmarking and insights to help identify and prioritize areas for optimization. Using this information, providers can deliver a high-quality user experience that minimizes churn and strengthens long-term customer relationships.
With data-driven insights, ISPs can focus on strategies to improve customer retention:
Fiber Deployment (FTTH) Expansion: High-performing fiber networks consistently deliver faster speeds and more reliable performance compared to non-fiber alternatives, providing a superior experience that helps reduce churn.
Low Latency: Providing users with consistently low latency is crucial for ensuring a smooth and responsive network experience, particularly for activities like video conferencing, gaming, and web browsing. Providers that deliver low latency tend to see higher customer satisfaction and reduced churn.
Quality of Experience Optimization and Proactive Monitoring: QoE metrics track critical user experience factors like video start times and service stability, allowing providers to monitor and address issues proactively, preventing dissatisfaction and minimizing churn risks.
Implementing proactive strategies to reduce churn enables ISPs to enhance customer satisfaction and build lasting loyalty, providing a strong competitive edge in the fast-evolving telecom industry.
Turning Insights into Action: Real-World Examples of Churn Prevention
Understanding why and where customers leave is only valuable if it leads to proactive, targeted action. Ookla’s analysis has pinpointed several examples where granular insights into network performance, user behavior, and technology gaps directly guided providers to address the root causes of churn:
Tackling Performance Issues: Small performance degradations can drive major customer losses. One provider observed that a 25% increase in YouTube and Google loading times coincided with significant customer departures. After network infrastructure upgrades at key connection points, web performance improved and customer retention stabilized.
Addressing Network Technology Gaps: Disparities in technology can significantly impact customer decisions. Data from Houston showed fiber networks delivering 10x faster speeds than non-fiber alternatives (477 Mbps vs. 47 Mbps), while users in Seattle experienced dramatically higher latency on non-fiber networks.
Leveraging Early Infrastructure Investments: Providers who deployed fiber early captured significant market share that continues to grow. This underscores the importance of timely network upgrades and the need for providers to accelerate fiber deployments, optimize latency, and consistently enhance the quality of experience to maintain competitive advantage.
While customer churn remains a major concern among telecom providers, those who leverage crowdsourced data to identify specific performance issues and technology gaps gain a decisive advantage. The key is targeting investments with precision, creating a virtuous cycle — better performance drives higher satisfaction, reduced churn, and ultimately stronger returns on infrastructure investments.
Conclusion: Using Data-Driven Insights Reduce Churn
The bottom line is that keeping customers is much cheaper than replacing them. That’s why understanding why they leave — and taking steps to prevent it — is so critical. By leveraging insights from Ookla’s QoS and QoE data, providers can gain a comprehensive understanding of both network performance and its impact on real-world user satisfaction.
With a clearer picture of the factors that drive churn, providers can address issues like slow speeds, high latency, and inconsistent experiences. Providers that invest in fiber, consistently deliver low latency, and proactively monitor QoE are better positioned to keep their customers happy — and prevent churn.
Ookla retains ownership of this article including all of the intellectual property rights, data, content graphs and analysis. This article may not be quoted, reproduced, distributed or published for any commercial purpose without prior consent. Members of the press and others using the findings in this article for non-commercial purposes are welcome to publicly share and link to report information with attribution to Ookla.
Airport network connectivity has evolved from a luxury service to critical infrastructure, powering essential operations throughout airport terminals across the world. Boingo Wireless, a global leader in airport distributed antenna systems (DAS), Wi-Fi, and private 5G networks, understands this better than anyone. With a customer portfolio spanning over 130 airports and transportation hubs worldwide, Boingo is transforming the travel experience for both passengers and operations through cutting-edge wireless technologies.
As airports have evolved into smart, hyper-connected hubs, the demand for reliable, high-speed connectivity has skyrocketed. Passengers expect to stream, work, and stay connected during their entire time at an airport, from check-in to takeoff. Additionally, airport operations teams rely on wireless networks to power critical security infrastructure, check-in kiosks, and logistics systems.
Download the full case study
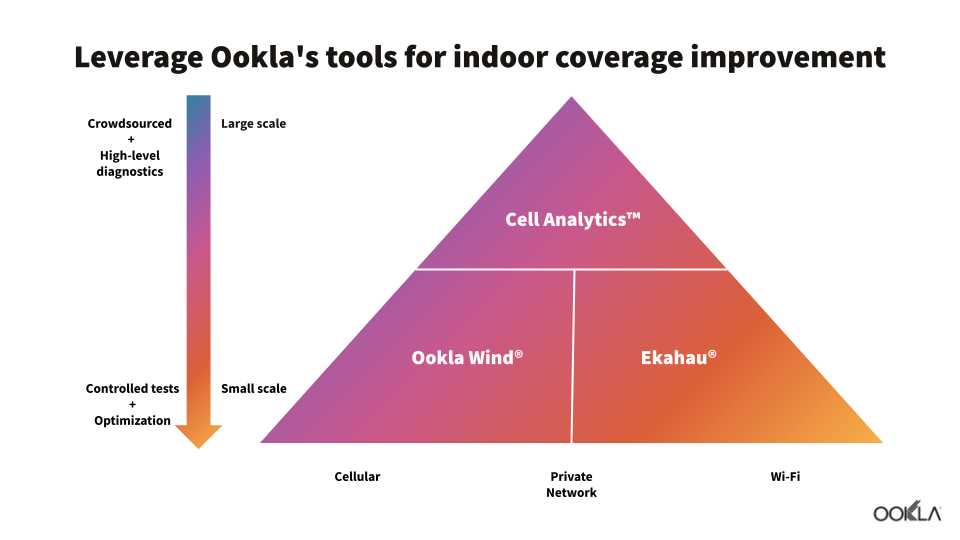
Check out our full written and video case study to discover how Boingo leverages Ookla’s connectivity insights—including Cell Analytics® for cellular planning and Ekahau® for Wi-Fi design and optimization—to deliver fast, reliable wireless solutions in complex, high-density airports.
Ookla retains ownership of this article including all of the intellectual property rights, data, content graphs and analysis. This article may not be quoted, reproduced, distributed or published for any commercial purpose without prior consent. Members of the press and others using the findings in this article for non-commercial purposes are welcome to publicly share and link to report information with attribution to Ookla.
Ookla®, the global leader in connectivity intelligence, is pleased to announce it has joined the European Telecommunications Standards Institute (ETSI). This strategic partnership reinforces Ookla’s commitment to advancing global network testing standards and methodologies.
“As a member of ETSI, Ookla and Rootmetrics look forward to bringing our expertise in controlled drive testing to ETSI and helping to enhance testing methodologies that enable more effective collaboration with customers seeking alignment with ETSI standards.” – Chris Miller, VP, Service Product Manager, Ookla.
RootMetrics by Ookla® delivers real-world mobile network insights through controlled drive and walk testing with off-the-shelf smartphones purchased from carrier stores. With over a decade of experience in controlled testing methodology, RootMetrics’ holistic testing approach is designed to replicate the end-user’s experience in the real world.
Ookla will actively participate in the ETSI community to help shape standards for next-generation controlled testing, particularly as networks evolve through Open Radio Access Network (O-RAN), 5G Standalone (5G SA), and 6G technology.
This membership represents Ookla’s commitment to advancing the telecommunications industry through standardization and collaboration.
Ookla retains ownership of this article including all of the intellectual property rights, data, content graphs and analysis. This article may not be quoted, reproduced, distributed or published for any commercial purpose without prior consent. Members of the press and others using the findings in this article for non-commercial purposes are welcome to publicly share and link to report information with attribution to Ookla.
Replay the 2024 season and playoffs according to Ookla Speedtest Intelligence® data
Big league baseball is back! And like baseball, Ookla® Speedtest has lots of stats. So we’re taking the opportunity to replay 2024 through the lens of our Speedtest Connectivity reports for the United States and Canada from the second half of 2024. We use the mobile results for the baseball teams’ respective cities, as presented in these reports.
Here’s the framework:
Speedtest Season standings are based on our Consistency Score, because, over the course of 162 games in the regular season, consistency is certainly the key to success.
Playoffs Wild Card games are where teams can suddenly catch lightning in a bottle, so we determine the winners based on multi-server Latency.
Playoffs Quarterfinals winner is determined by median Upload Speed, because we have to save Download Speed for the next one…
Playoff Semifinals is won by the main workhorse network metric of median Download Speed
Speedtest Finals reaches outside of the Connectivity Report to identify the all-star Top 10% Download Speeds in each city. (Note: this metric is not in the Connectivity Report, but comes from the same Speedtest Intelligence data source.)
Speedtest Season – Consistency
As noted in our framework, Consistency is key to winning the regular season. Boston, Cleveland, Arlington (Texas), Philadelphia, Pittsburgh, and San Francisco are moving on.
But before starting our playoffs, let’s indulge in a little Inside Speedtest. It’s interesting to note how the Consistency metric for cities in the East tended to outperform cities in the West, particularly over California cities. Consistency is a minimum performance floor, measuring the percentage of Speedtest samples meeting or exceeding a threshold of 5 Mbps download and 1 Mbps upload throughput.
One reason to explain this is that older cities in the East developed to have more dense populations, and therefore the cellular networks are built accordingly. As a result, the opportunity for a given smartphone user to be closer to a cell site and better signal strength is more likely.
To highlight this with examples of opposites, vertiginous New York City has a population density over twenty-nine thousand (29,303) people per square mile. The sprawling city of Los Angeles, on the other hand, has over eight thousand (8,304) people per square mile (per 2020 US Census). Checking Speedtest Intelligence® mobile network quality data – not included in our Speedtest Baseball – the signal quality (RSRP) in the second half of 2024 for New York City was -93 dBm and for Los Angeles was -98 dBm. Like a pitcher’s ERA, lower is better for RSRP. A difference of 5 dBM may not sound like much, but it can be what is needed to have a cell signal indoors or be able to stream the baseball game. Likewise, Consistency for New York City was 90.6% and Los Angeles was 87.1%. A difference of 3.5% points may not sound like much, unless you are one of the 3.5% with balky network data speeds.
Advancing to the Speedtest Playoffs
Boston, Cleveland, Philadelphia, and Pittsburgh earn the bye, setting up the Wild Card matches for the rest of the cities.
Speedtest Playoff Wild Cards – Latency
For Speedtest Playoffs Round 1, the metric is Latency and, like RSRP and ERA, lower is better. New York edges out Arlington (Texas), Toronto sweeps Baltimore, and San Francisco squeaks past Washington. New York (again, but different) and Atlanta tied, so using Consistency for the tie breaker, New York (90.6%) is just able to move on past Atlanta (89.9%).
Speedtest Quarterfinals – Upload Speed
In actual big league baseball, the top regular season teams that earned the bye past the first round Wild Card often have found the time off not to their liking, with the break in their baseball routine blunting their competitive edge. Speedtest Baseball is similar, with Cleveland and Philadelphia both exiting versus Toronto and New York, respectively, based on Upload Speed. Upload Speed is great for posting your social media from the ballpark. Boston moves on over New York in that great rivalry, and Pittsburgh tops San Francisco.
Speedtest Semifinals – Download Speed
For measuring network performance, Download Speed is the champion. It’s not just about the individual’s data speed they see when running a Speedtest, it also indicates the network capacity available for everyone. Most people individually don’t need hundreds of megabits per second on their smartphone, but having that much speed available helps ensure a good network experience for all. Boston and Pittsburgh bring out their brooms to sweep their way into the Speedtest Finals.
Speedtest Finals – Fastest Download Speeds (top 10% of results)
Continuing from the Speedtest Semifinals, download speed is still on the field, but this time it’s just the all-star speeds – the top 10% – used to decide the winner. And with this, we have a change up in cities from the Speedtest Semifinals, where Pittsburgh was faster than Boston. Instead here in the Finals, Boston’s top speeds top Pittsburgh’s top speeds.
We didn’t see that coming, but an intrigue of baseball is that one can watch hundreds or even thousands of games, and still see something they had never seen before.
Congratulations to Boston, the victor of our Speedtest Baseball Finals.
Now, let’s Play Ball!
Ookla retains ownership of this article including all of the intellectual property rights, data, content graphs and analysis. This article may not be quoted, reproduced, distributed or published for any commercial purpose without prior consent. Members of the press and others using the findings in this article for non-commercial purposes are welcome to publicly share and link to report information with attribution to Ookla.