Replay the 2024 season and playoffs according to Ookla Speedtest Intelligence® data
Big league baseball is back! And like baseball, Ookla® Speedtest has lots of stats. So we’re taking the opportunity to replay 2024 through the lens of our Speedtest Connectivity reports for the United States and Canada from the second half of 2024. We use the mobile results for the baseball teams’ respective cities, as presented in these reports.
Here’s the framework:
-
- Speedtest Season standings are based on our Consistency Score, because, over the course of 162 games in the regular season, consistency is certainly the key to success.
- Playoffs Wild Card games are where teams can suddenly catch lightning in a bottle, so we determine the winners based on multi-server Latency.
- Playoffs Quarterfinals winner is determined by median Upload Speed, because we have to save Download Speed for the next one…
- Playoff Semifinals is won by the main workhorse network metric of median Download Speed
- Speedtest Finals reaches outside of the Connectivity Report to identify the all-star Top 10% Download Speeds in each city. (Note: this metric is not in the Connectivity Report, but comes from the same Speedtest Intelligence data source.)
Speedtest Season – Consistency
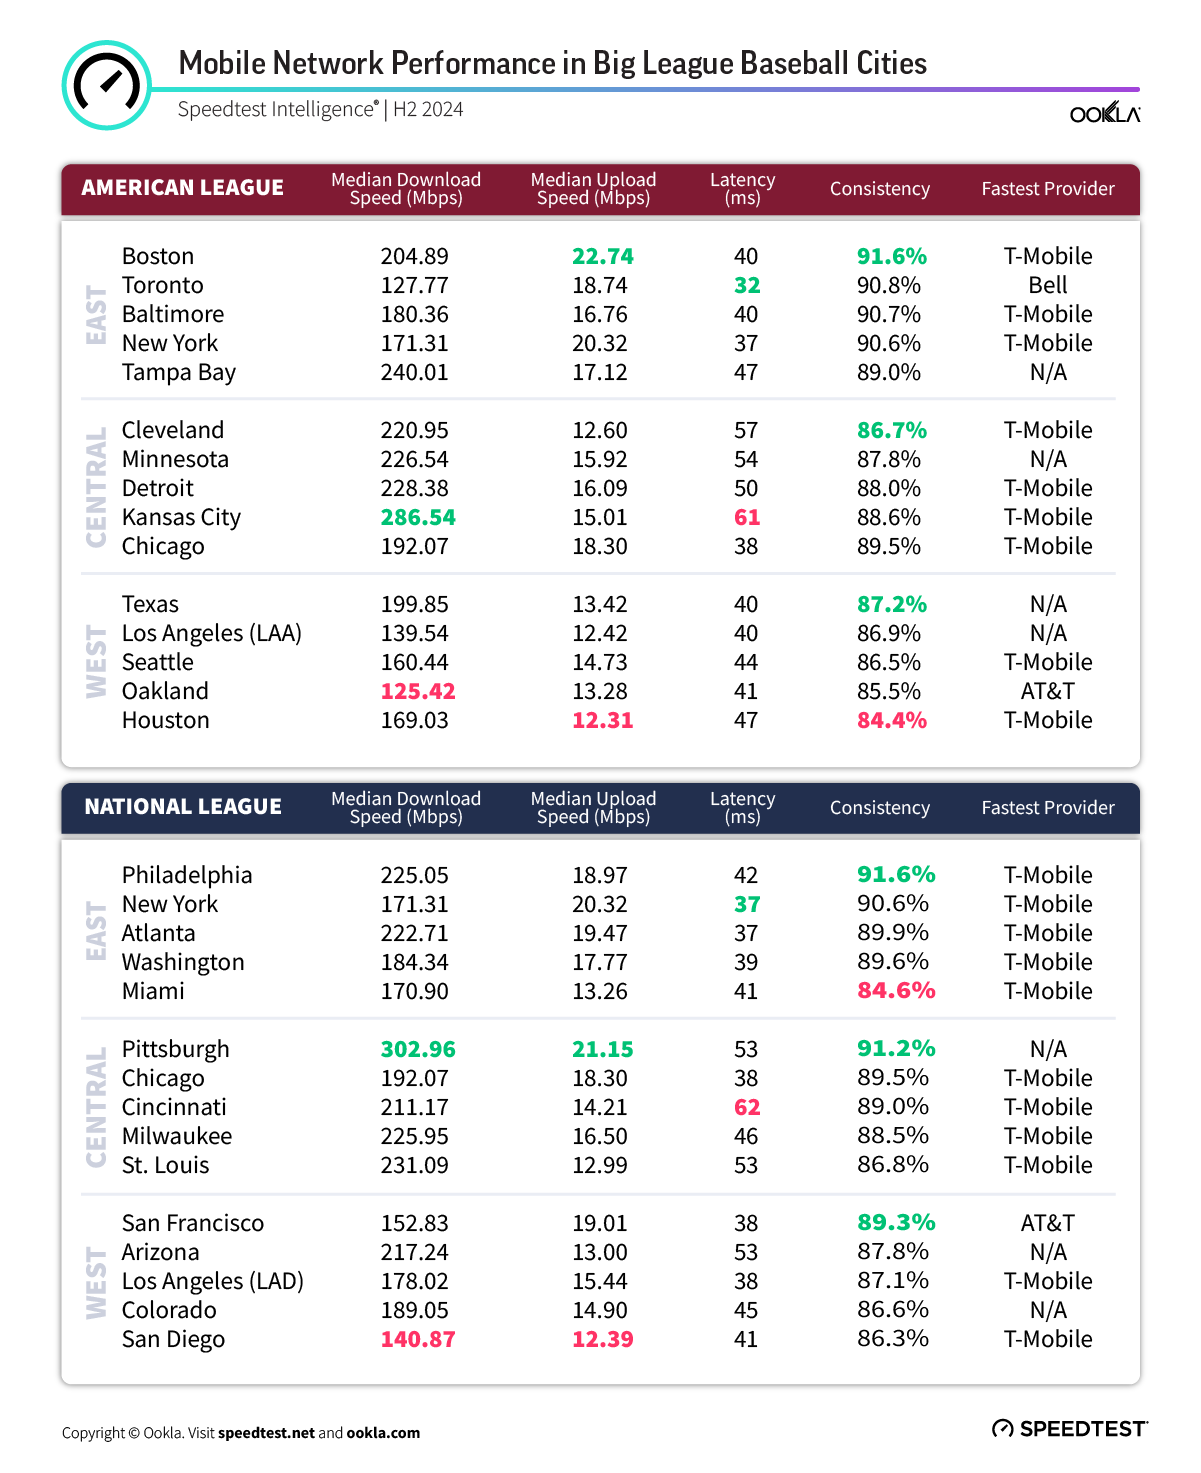
As noted in our framework, Consistency is key to winning the regular season. Boston, Cleveland, Arlington (Texas), Philadelphia, Pittsburgh, and San Francisco are moving on.
But before starting our playoffs, let’s indulge in a little Inside Speedtest. It’s interesting to note how the Consistency metric for cities in the East tended to outperform cities in the West, particularly over California cities. Consistency is a minimum performance floor, measuring the percentage of Speedtest samples meeting or exceeding a threshold of 5 Mbps download and 1 Mbps upload throughput.
One reason to explain this is that older cities in the East developed to have more dense populations, and therefore the cellular networks are built accordingly. As a result, the opportunity for a given smartphone user to be closer to a cell site and better signal strength is more likely.
To highlight this with examples of opposites, vertiginous New York City has a population density over twenty-nine thousand (29,303) people per square mile. The sprawling city of Los Angeles, on the other hand, has over eight thousand (8,304) people per square mile (per 2020 US Census). Checking Speedtest Intelligence® mobile network quality data – not included in our Speedtest Baseball – the signal quality (RSRP) in the second half of 2024 for New York City was -93 dBm and for Los Angeles was -98 dBm. Like a pitcher’s ERA, lower is better for RSRP. A difference of 5 dBM may not sound like much, but it can be what is needed to have a cell signal indoors or be able to stream the baseball game. Likewise, Consistency for New York City was 90.6% and Los Angeles was 87.1%. A difference of 3.5% points may not sound like much, unless you are one of the 3.5% with balky network data speeds.
Advancing to the Speedtest Playoffs
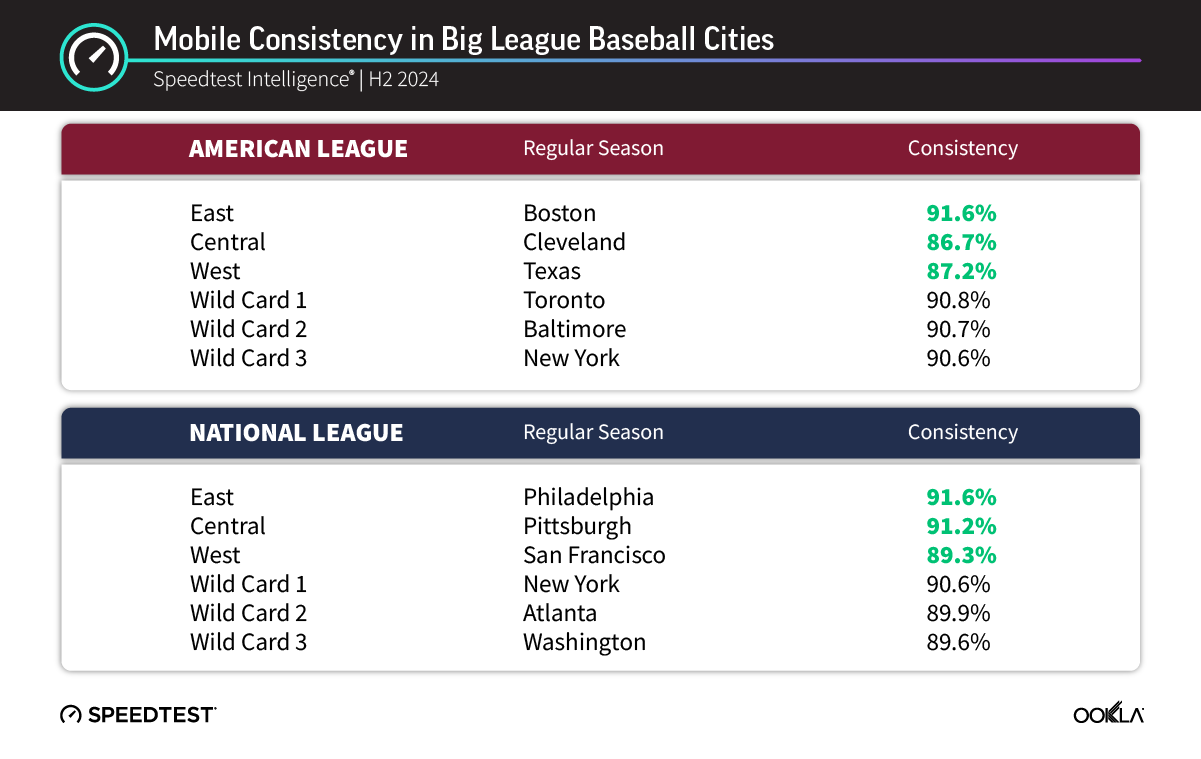
Boston, Cleveland, Philadelphia, and Pittsburgh earn the bye, setting up the Wild Card matches for the rest of the cities.
Speedtest Playoff Wild Cards – Latency
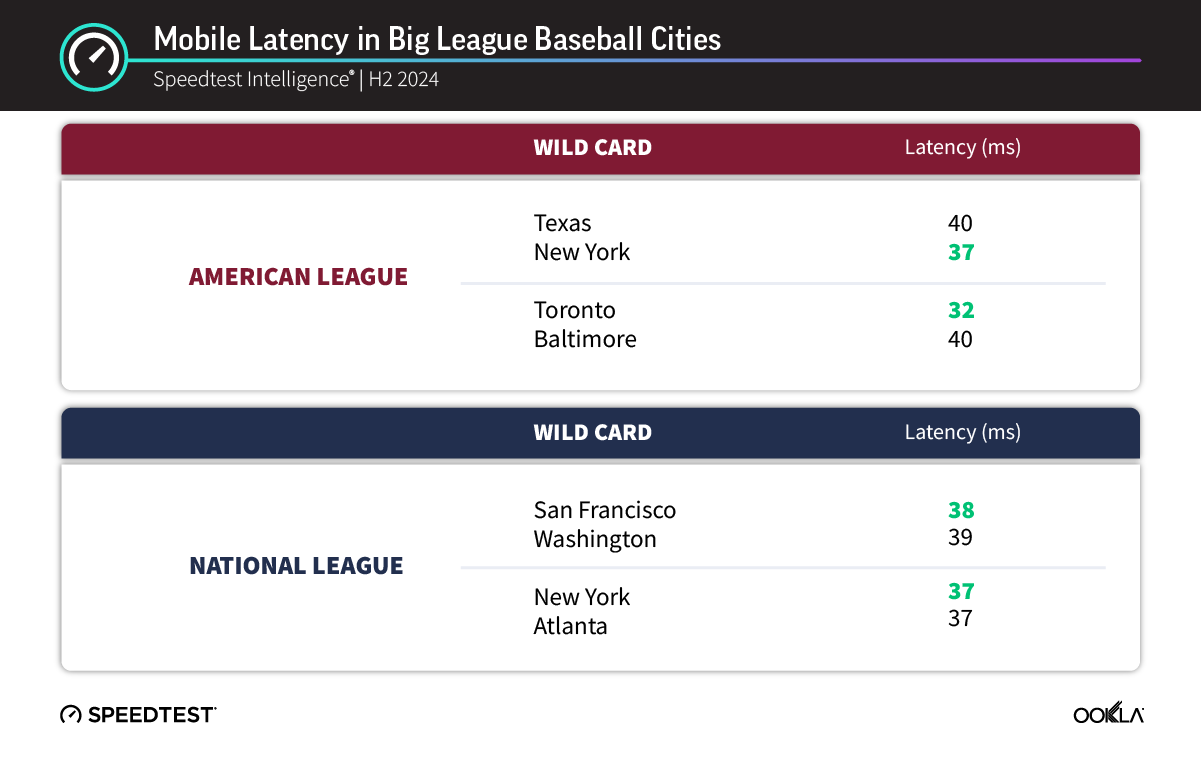
For Speedtest Playoffs Round 1, the metric is Latency and, like RSRP and ERA, lower is better. New York edges out Arlington (Texas), Toronto sweeps Baltimore, and San Francisco squeaks past Washington. New York (again, but different) and Atlanta tied, so using Consistency for the tie breaker, New York (90.6%) is just able to move on past Atlanta (89.9%).
Speedtest Quarterfinals – Upload Speed
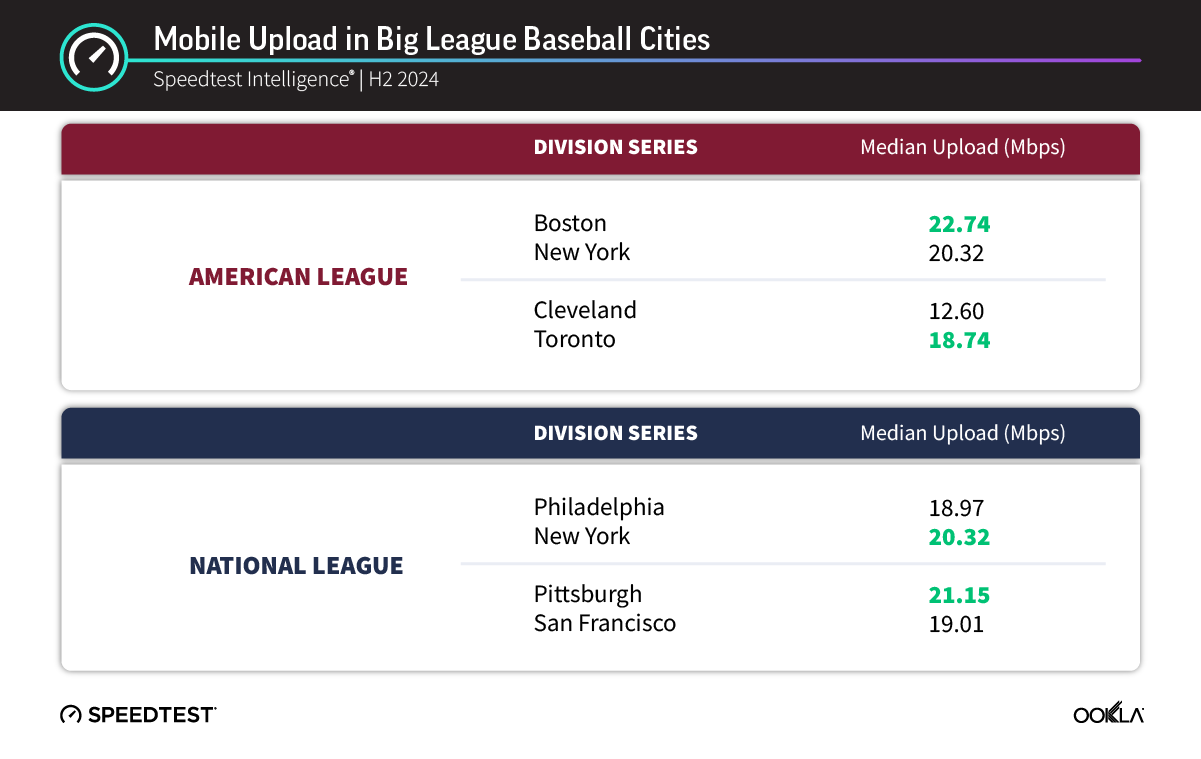
In actual big league baseball, the top regular season teams that earned the bye past the first round Wild Card often have found the time off not to their liking, with the break in their baseball routine blunting their competitive edge. Speedtest Baseball is similar, with Cleveland and Philadelphia both exiting versus Toronto and New York, respectively, based on Upload Speed. Upload Speed is great for posting your social media from the ballpark. Boston moves on over New York in that great rivalry, and Pittsburgh tops San Francisco.
Speedtest Semifinals – Download Speed
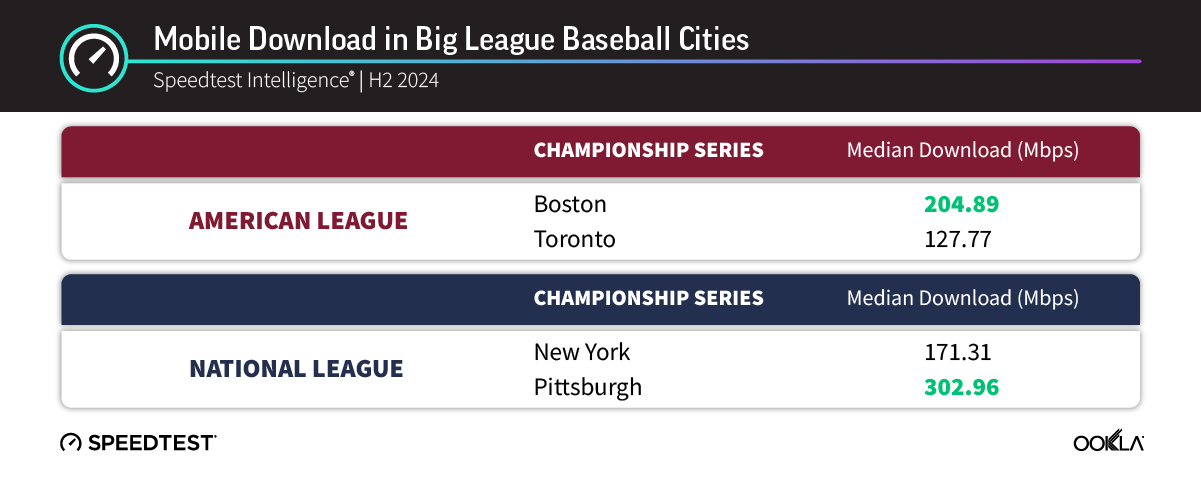
For measuring network performance, Download Speed is the champion. It’s not just about the individual’s data speed they see when running a Speedtest, it also indicates the network capacity available for everyone. Most people individually don’t need hundreds of megabits per second on their smartphone, but having that much speed available helps ensure a good network experience for all. Boston and Pittsburgh bring out their brooms to sweep their way into the Speedtest Finals.
Speedtest Finals – Fastest Download Speeds (top 10% of results)

Continuing from the Speedtest Semifinals, download speed is still on the field, but this time it’s just the all-star speeds – the top 10% – used to decide the winner. And with this, we have a change up in cities from the Speedtest Semifinals, where Pittsburgh was faster than Boston. Instead here in the Finals, Boston’s top speeds top Pittsburgh’s top speeds.
We didn’t see that coming, but an intrigue of baseball is that one can watch hundreds or even thousands of games, and still see something they had never seen before.
Congratulations to Boston, the victor of our Speedtest Baseball Finals.
Now, let’s Play Ball!
Ookla retains ownership of this article including all of the intellectual property rights, data, content graphs and analysis. This article may not be quoted, reproduced, distributed or published for any commercial purpose without prior consent. Members of the press and others using the findings in this article for non-commercial purposes are welcome to publicly share and link to report information with attribution to Ookla.
