Kerry Baker leads Ookla's research and content efforts in North America. He has over 20 years experience in the telecom industry, primarily at T-Mobile studying network performance benchmarking and customer experience. Kerry also has founder’s experience with four technology-related startups. Kerry holds masters degrees from the University of Washington in Business and International Political Economics.
Still downloading shows over airport Wi-Fi before your flight? Here’s where you should consider your mobile provider
Many passengers’ pre-boarding ritual remains that of jumping on the free airport Wi-Fi to download the latest shows from Netflix, Hulu, or Amazon Prime Video for guilt-free binging during the flight. This is despite the improving performance of in-flight Wi-Fi and airlines hosting oodles of content — movies, games, shopping – accessible by fingertip through the screens on the back of the seat inches from one’s eyeballs.
If you are still logging into the airport Wi-Fi to download season 21 of One Piece (197 episodes) or have been saving the season 5 four-episode drop of Stranger Things for your flight home for the holidays (before three more episodes on December 25th), using your mobile service provider might be the faster option if you’re about to board your plane.
Key Takeaways
Mobile providers had a faster median download speed than Wi-Fi in most airports and more than twice as fast on average (219.24 Mbps, 101.39 Mbps).
Verizon was fastest in the most airports comparing among all mobile providers and airport Wi-Fi including ties, and even with T-Mobile considering outright results.
Among only mobile providers in airports, Verizon also led the airports count of outright fastest results.
Airport Wi-Fi was faster than mobile providers in just over one-third of head-to-head comparisons (including ties), and faster than all mobile providers in five airports.
Older Wi-Fi technologies may be holding back internet speed in airports with 72.9% of Speedtest samples on Wi-Fi 5 and older generation versus 46.0% in the U.S. overall.
Approach
In the past year, Ookla reported on airport Wi-Fi and mobile service together. However, mobile service together, in aggregate, does not represent the actual choice the most mobile consumers have before them. That is, the options for online connectivity are Wi-Fi and my mobile service provider.
Across the top 50 U.S. airports by passengers, we examined Speedtest user data for median download speed across the airport Wi-Fi (based on SSID; two airports’ network management policy excludes our tests) and by each of the big three mobile providers – AT&T, T-Mobile, Verizon – in the first half of 2025. Download speed is understandable to the individual, especially for our cherished Speedtest users, and directly appropriate to the use case of downloading content. And, more significantly, it is a representation of network capacity for everyone. That said, network design requirements and performance objectives of the Wi-Fi and mobile providers may not be to maximize throughput speeds, versus handling more connected devices or optimizing connection stability, for example.
Altitude: Highest and Lowest Five Airports for Mobile and Wi-Fi Download Speeds
All of the airport results are available in the map above, and here are the fastest and slowest five airport median download speeds (in Mbps) for each mobile provider and Wi-Fi.
Arrivals
The mobile providers held an edge overall and individually compared with Wi-Fi in terms of the number of airports with the fastest median download speed. Verizon had the most with 34 where it was faster than Wi-Fi, including two airports that were tied with Wi-Fi. T-Mobile was faster than Wi-Fi in 32 airports, and AT&T faster in 28 airports, including one tie.
Mobile or Wi-Fi? Number of airports where faster
Speedtest Intelligence data, count of airports by service provider with fastest median download speed, 1H 2025
Comparing just the mobile providers (i.e., Wi-Fi excluded), Verizon had the fastest median download speed in 26 airports (including two ties), T-Mobile was fastest in 16 airports (including one tie), and AT&T was fastest in 8 airports (including one tie).
Fastest Mobile Provider | Number of airports where fastest
Speedtest Intelligence, based on median download speeds, 1H 2025
Wi-Fi was faster than any mobile provider in these five airports:
Cincinnati/Northern Kentucky International
San Francisco International
Orlando International
Hartsfield–Jackson Atlanta International
Baltimore/Washington International (tie)
Mobile and Wi-Fi Median Download Speeds at U.S. Airports
Speedtest Intelligence® | 1H 2025
Observation Deck
Houston’s problem
Appearing in AT&T’s, Verizon’s and Wi-Fi’s bottom five, the two airports serving the Houston metropolitan area had slow median download speeds for their airport Wi-Fi as well.
Airport
AT&T
T-Mobile
Verizon
Airport Wi-Fi
George Bush Intercontinental
4.77
242.29
15.79
21.36
William P. Hobby
19.97
108.65
43.74
21.67
Wi-Fi is better by the Bay
As shown in Wi-Fi’s fastest five airports, Oakland International and Norman Y. Mineta San José International made that list. Rounding out the Bay Area airportstrio, the Wi-Fi speed in San Francisco International comfortably topped the mobile providers.
Airport
AT&T
T-Mobile
Verizon
Airport Wi-Fi
Oakland International
229.70
28.58
103.90
194.23
Norman Y. Mineta San José International
103.83
211.40
251.06
176.59
San Francisco International
67.07
92.91
100.56
169.51
If you’re going to San Francisco, SFO was the only airport in our analysis with Speedtest samples using the 6 GHz band. This was on Wi-Fi 6E – too soon to expect Wi-Fi 7 in airports – with a median download speed of 364.74 Mbps (also remarkable were the median upload speed of 426.04 Mbps and an 8 ms multi-server latency).
Wi-Fi generations
Wi-Fi 6E is part of the Wi-Fi 6 standard (802.11ax) that has “extended” (hence the E) to include the 6 GHz band along with 2.4 GHz and 5 GHz bands.
Wi-Fi Generations | U.S. Airports and U.S. Overall
Speedtest sample mix, 1H 2025 and 1Q 2025
Examining the mix of Speedtest samples across Wi-Fi generations, an astonishing share (70.1%) were on Wi-Fi 5 (802.11ac), which was introduced in 2013. Wi-Fi 6, introduced in 2019, offers numerous benefits:
Speed and capacity
Higher theoretical maximum speeds
Sends data to multiple devices simultaneously in a single transmission (versus one device at a time)
Handles more connected devices
Performance and latency
Manages traffic more efficiently for lower latency
More effective interference mitigation for better performance in crowded environments
Improved uplink technology means faster uploads
These are many good reasons for an airport to upgrade to Wi-Fi 6. However, the cost and effort needed for upgrading an airport is undoubtedly magnitudes beyond that of swapping out the home router. Most homes don’t have capital budget planning cycles for upgrading technology infrastructure, but judging by the overall U.S. Wi-Fi 6 at 44.2% (versus 26.2% in airports), more passengers are carrying devices capable of using the upgrade.
Boingo-es faster
Boingo, a connectivity solutions company, frequently appears in this research as the airport’s Wi-Fi service provider – 29 times in this analysis. Boingo-served airports averaged download speeds of 110.30 Mbps compared to non-Boingo airports at 88.38 Mbps. This difference in speed suggests that Boingo’s know-how is scalable and portable.
Baggage Claim
For the millions of passengers traveling through U.S. airports, this analysis offers a clear strategy: don’t assume the free Wi-Fi is your best option. This isn’t to denigrate Wi-Fi’s performance, which in most airports is more than satisfactory, and again, free (well, ad supported, frequently). It’s a great value.
For mobile-first travelers, already paying for unlimited data, the sunk cost economics of downloading over cellular is also free. But also this isn’t a false-choice fallacy – both options are waiting for you to use. Run a Speedtest to see which to select. Luffy and Nancy Wheeler will be glad you did.
Ookla retains ownership of this article including all of the intellectual property rights, data, content graphs and analysis. This article may not be quoted, reproduced, distributed or published for any commercial purpose without prior consent. Members of the press and others using the findings in this article for non-commercial purposes are welcome to publicly share and link to report information with attribution to Ookla.
Kerry Baker leads Ookla's research and content efforts in North America. He has over 20 years experience in the telecom industry, primarily at T-Mobile studying network performance benchmarking and customer experience. Kerry also has founder’s experience with four technology-related startups. Kerry holds masters degrees from the University of Washington in Business and International Political Economics.
Staying connected at sea can enhance the voyage, for a price.
Wi-Fi connectivity is a consumer expectation throughout the travel industry. From airports and hotels to airplanes and trains, Ookla has examined all of these just this year alone. Now we walk the gangway to the cruise ship industry to see what type of connectivity is offered on the seas.
There are any number of reasons for needing to be connected online on the cruise ship. Staying in touch with people back home directly (messaging, video calls) and sharing the experience via social media are a given. Staying up on things – sports, news – seemingly antithetical to the spirit of taking a cruise, is certainly welcome as well, including access to one’s on-shore streaming habits.
On the cruise itself, the logistics and planning for on-board classes (Vinyasa Yoga) and on-shore activities (Top things to do in Cozumel in 6 hours) are managed online, and keeping in touch with travel companions on the same ship (wru). Of course, put-upon business professionals who are “working from helm” (shout out Virgin Voyages) appreciate a high-speed, stable connection to project their hopefully-convincing Zoom background images.
Key Takeaways
iPhones prevail. Over 60% of cruise passengers carry iPhones compared to 25% with Samsung Galaxy, based on Speedtest samples. This iPhone share, similar to that in the United States, reflects a relative mass-market, financially comfortable cruise line customer.
Older Wi-Fi limits customer experience. With 12.6% of access points on Wi-Fi 4, there is an instant opportunity to improve the quality of connectivity for passengers and crew by upgrading to a newer Wi-Fi generation.
Starlink is the provider of choice. Most cruise lines have equipped their ships’ connectivity with Starlink to take advantage of the speed and latency performance of low-Earth orbit satellites.
Phones and Tablets On Board
While the global market share of iPhones hovers around 20%, in the United States the Apple logo adorns just over half of the smartphones shipped in 2024 and 1H 2025, per Counterpoint Research. On cruise lines, the iPhone share of mobile device SpeedtestⓇ samples is a few ticks higher than that of its U.S. share. This makes sense, with iPhones and cruises being both simultaneously mass market and higher end.
Mobile Devices – iCruise
Speedtest sample shares on select cruise lines, 1H 2025
With over 500 different device models in this data set, a fair number of Chinese manufacturers make an appearance – Honor, Huawei, OnePlus, Oppo, realme, Vivo, Xiaomi, ZTE – though small in numbers. Farther out in the long tail is the Galaxy S8+ (0.03% of devices). Launched in 2017, it is a pre-5G hold over.
However, there are no surprises among the most popular devices being the iPhones and Galaxies released in the past couple of years.
Top 10 Devices Taking Cruises, 1H 2025 Speedtest data share of samples
Device
Share
Apple iPhone 16 Pro Max
10.2%
Apple iPhone 15 Pro Max
9.7%
Apple iPhone 16 Pro
5.5%
Apple iPhone 15 Pro
5.3%
Apple iPhone 14 Pro Max
5.1%
Samsung Galaxy S24 Ultra
4.7%
Apple iPhone 14 Pro
3.5%
Samsung Galaxy S23 Ultra
3.4%
Apple iPhone 13 Pro Max
3.1%
Apple iPhone 13
2.5%
Wi-Fi Doldrums
The eight-year old Samsung Galaxy S8+ from the 4G era illustrates a point about performance. Simply, old technology restricts the customer experience. The S8+ is not only on an older cellular technology, it is also an older Wi-Fi technology – Wi-Fi 5. In the meantime, Wi-Fi 6, Wi-Fi 6E and, last year, Wi-Fi 7 added new capabilities that enhance the speed and reliability of the Wi-Fi connectivity.
Among the cruise lines the mix of Wi-Fi generations is quite varied. Royal Caribbean has deployed the most Wi-Fi 6 with half (49.7%) of its Speedtest user samples on this standard. MSC and Princess are entrenched in Wi-Fi 5 (76.1% and 72.0%), while P&O has the most on older Wi-Fi.
802.11 Standard Bearers
Speedtest sample shares by Wi-Fi Generation, 2H 2024 – 1H 2025
There were no signs of the latest generation of Wi-Fi 7, which is gaining momentum in some countries like the United States. While there are significant technological advances that would improve the Wi-Fi customer experience of the passengers with this latest technology, when we consider the immense cost of adding thousands of access points and miles of cabling to upgrade the ship , the absence of Wi-Fi 7 is understandable.
However, swapping a Wi-Fi 4 access point for a Wi-Fi 6 access point can be done. Wi-Fi 6 median download speed was around twice as fast Wi-Fi 4 in Speedtest data. Newer technologies often bring faster speeds, and also the overall user experience is enhanced with more efficient spectrum utilization and traffic management, and an increased number of connected devices per access point. The complex infrastructure of a cruise ship and user density present a tall challenge for getting the most out of the Wi-Fi signal. (Expertise from Ookla can help with solutions found under our Ekahau business.)
Starlink Performance Floats the Boat
As mentioned, most cruise lines have moved to Starlink over the past few years for their internet connectivity. Indeed, the 1H 2025 Speedtest data results for Carnival, Costa, Holland America, P&O (all under the Carnival company), and MSC performed in such a similar range that it is clearest to present their results as a group average. This also allows us to easily compare to prior published research on in-flight Wi-Fi performance where Starlink is also the internet provider.
The Starlink cruise line Wi-Fi download speeds perform well, even though it doesn’t keep up with the Starlink in-flight Wi-Fi. Putting aside plans and policies, we can imagine that higher user density loads the cruise ship’s Wi-Fi network more than an airplane’s. Even the cruise line’s 10th percentile at 21.14 Mbps is a serviceable speed for most any application.
The upload speed story is more nuanced. While the median upload is proportional to the download comparison between the cruise lines and the airplanes, the story changes at the opposite ends. The 10th percentile at 1.74 Mbps on the cruise lines is not usable for video calling or posting the day’s images to social media. It is likely that this slow 10th percentile speed is reflecting time-of-day congestion, when heavy usage is occurring on the ships. (A topic for possible follow up investigation.) The 90th percentile for the cruise lines slightly outperforms the airplanes (42.55, 38.07 Mbps).
Latency is always interesting when it comes to satellite internet connectivity. Airplanes outperform cruise lines on the median (44, 87 ms) – literally being closer to the satellite may offer some advantage here. The 90th percentile is far worse on cruise lines, again possibly as a consequence of time-of-day congestion as well as more hops from the access point in the ship to the radio on the ship than with an airplane.
The cruise ship passenger’s Wi-Fi experience can be affected by the service package they select. There are a variety of prices and models (prepay or pay-as-you-go; for the day or for the trip) that offer increasing capabilities, such as basic, value and premium choice set. Many of these packages can cost more than a monthly mobile phone service. For example, for one of the leading cruise lines based on total passengers, the least expensive “Social” package is $18.70 per day. However, in hotels and, increasingly on airlines, the trend is toward offering free internet connectivity as an enhancement of the customer experience or loyalty perk. Norwegian Cruise Line even touts free Wi-Fi in one of its commercials, though, overall, the “free” Wi-Fi may have limited usage or it is only included only in the most expensive VIP packages.
There Once was a Princess…
…with a medallion. That is to say, Princess Cruise Lines offers MedallionNet® which it touts as “Unmatched Wi-Fi Experience at Sea – Fast. Reliable. Unlimited. Affordable. Now on all ships.” As we’ve noted and is stated on its site, the internet service is provided by Starlink.
And yet, links on the site connect to a press release from 2018 about another satellite provider, SES, and an explainer video about mid-earth and geo-stationary orbits (which has a major impact on performance) of which Starlink is neither. SES has been the long-time provider, and a more recent press release from August 2024 explains that the two satellite partners support tiered service offerings.
Noting this isn’t an attempt to call out Princess for confusing content, but instead to recognize that the cruise line industry is potentially in a phase change about how it delivers and manages customer experience on its cruises. Future generations of passengers (as in Gen-X or Millennials, not Wi-Fi 7 or 8) are digital natives with a different expectation of always-on, high-quality connectivity.
Sailing to the Other Side?
Hotels charged for poor Wi-Fi. Over the years, however, hotel Wi-Fi service went from an expensive customer pain point to a point of customer service expectation and loyalty. Airlines appear to be mid-flight on this same journey, also realizing they have a captive audience that they can entertain and monetize. When will cruise lines also reach the point of no return?
Methodology Remarks
The basic building block of this analysis is identifying Speedtest data tests related to the SSIDs (the name of the Wi-Fi network) of the cruise lines and ships. Comparing the counts of Speedtest samples in 1H 2025 with the cruise line market shares based on passenger totals found at Cruise Market Watch, we are capturing Wi-Fi performance on 80% of the cruise line market. In fact, Speedtest samples correlate with passenger market share (r = 0.75). Furthermore, where we have Speedtest samples identified on a per ship basis, these correlate with ship passenger capacity as well (r = 0.71). Netting this out, the Speedtest samples offer a strong representation based on these anchors of market share and ship size.
Still, as with in-flight Wi-Fi, cruise ships present fresh complexity different from Speedtest’s bread-and-butter fixed broadband and mobile service providers because of ships’ mobility, variety of SSID approaches (ie, one cruise line uses the same SSID on all its ships, while most use SSIDs unique to the ship), changing of internet service providers (fleet-wide upgrades to Starlink), and policies inhibiting high-data usage applications. Thus, this analysis is offered in the context of “here’s what we see” rather than a definitive census of cruise ship Wi-Fi performance.
Ookla retains ownership of this article including all of the intellectual property rights, data, content graphs and analysis. This article may not be quoted, reproduced, distributed or published for any commercial purpose without prior consent. Members of the press and others using the findings in this article for non-commercial purposes are welcome to publicly share and link to report information with attribution to Ookla.
Kerry Baker leads Ookla's research and content efforts in North America. He has over 20 years experience in the telecom industry, primarily at T-Mobile studying network performance benchmarking and customer experience. Kerry also has founder’s experience with four technology-related startups. Kerry holds masters degrees from the University of Washington in Business and International Political Economics.
Charter, Comcast, Rogers, others show off step-change performance improvements
Cable is in a pitched battle for broadband subscribers in the U.S.. It has been losing. On one side of cable, fixed wireless access (FWA) from mobile providers, with its “good enough” value proposition, has captured the bulk of broadband customers growth the past three years. On cable’s other flank, fiber-to-the-home (FTTH) outperforms cable, according to Ookla’s Speedtest® Connectivity Report for the United States in H1 2025, and fiber providers are holding their ground on subscribers.
What’s cable to do? Fight back. Cable operators are deploying newer cable technology and reallocating frequency bands to differentiate their performance from FWA and close the gap with fiber, particularly in uplink speed and latency. The jargon of these efforts includes terms like DOCSIS 3.1, DOCSIS 4.0, mid-splits, and high-splits.
Key takeaways
The upgrades are real and consumers can tell. Speedtest Intelligence® data confirms that major cable operators are actively upgrading their networks. The fingerprint of these upgrades is a clear, often multi-step, increase in median upload speeds, which is visible in market-by-market data from 2024 to 2025.
Divergent strategies in the U.S. Operators are taking different paths. Comcast is pursuing a broad, nationwide rising tide mid-split upgrade to prepare its entire footprint for DOCSIS 4.0, with upload speed improvement everywhere. Charter is executing targeted, high-impact “surgical strikes” with high-split upgrades in specific markets yielding dramatic speed leaps.
In Canada Rogers showcases two systems. The legacy Shaw network in Western Canada was already upgraded, while Rogers is now actively bringing its Eastern Canada footprint up to that same high standard, creating a harmonized, next-generation network.
The path forward. These mid-split and high-split upgrades are not the final destination but the crucial foundation. They re-engineer the network’s capacity, paving the way for the symmetrical, multi-gigabit speeds promised by DOCSIS 4.0.
Methodology
Using Ookla’s Speedtest® Intelligence data, we analyzed the performance of U.S. and Canadian cable providers, looking for evidence of these deployments. In particular, we focused on changes in median uplink speed, year-over-year, from Q2 2024 to Q2 2025 across each provider’s larger markets. This analysis revealed a shift in upstream capacity that is a result of of migrating from a legacy “sub-split” architecture to the more advanced “mid-split” or “high-split” configurations that are part of the DOCSIS 3.1 cable standard and prepare the network for the DOCSIS 4.0 standard.
What are DOCSIS and Splits?
Data Over Cable Service Interface Specification (DOCSIS) is a telecommunications standard for high-bandwidth data transfer across cable television systems. The technology was initially optimized for downlink traffic to deliver television programming. With the rise of cable broadband, uplink capabilities were introduced to support interactivity.
Splits refers to how much spectrum is allocated to upstream traffic (splitting the spectrum between uplink and downlink). The sub-split upstream path is 37 MHz wide; mid-split upstream path is more than double that at 80 MHz wide; and high-split upstream path is nearly 200 MHz wide. There are technology and investment trade-offs between a mid-split and high-split deployment strategy, but fundamentally a wider path provides faster upload speeds, foreshadowing the results of this analysis.
Today, competitive pressure from fiber for faster, symmetrical speeds and lower latency is pushing cable technology forward. At the same time, consumer demand for high-performance gaming, seamless video conferencing, and content creator streaming is pulling the technology to evolve.
United States
Comcast (Xfinity)
The Speedtest user data provides a clear picture of a nationwide network upgrade and a successful rollout of mid-split architecture across Comcast’s footprint. Unlike the market-by-market approach seen with other providers, our data for Comcast suggests a sweeping, uniform upgrade program that has boosted median upload performance for customers across the country. This is a foundational step that directly supports Comcast’s DOCSIS 4.0 strategy and is a key element of its Project Genesis network initiative.
The nationwide mid-split upgrade
In Q2 2024, nearly every city examined showed a median upload speed in the ~23-24 Mbps range, the signature of a network operating on a narrow frequency band of a legacy sub-split architecture.
By Q2 2025, the picture had completely changed. Almost every market showed a jump in median upload speed to the ~40-42 Mbps range, an increase of roughly 75-80%. This is the fingerprint of a mid-split upgrade, which expands the upstream spectrum. This upgrade not only provides an immediate boost to upload speeds for DOCSIS 3.1 customers, but also reconfigures the network for DOCSIS 4.0 technology.
Here is a sample of representative markets demonstrating this consistent upgrade:
City
Q2 2024 Upload (Mbps)
Q2 2025 Upload (Mbps)
Change
Chicago, IL
23.54
40.06
+70%
Denver, CO
23.83
42.03
+76%
Houston, TX
23.76
41.40
+74%
Seattle, WA
23.98
43.56
+82%
Washington, DC
23.63
40.54
+72%
San Francisco, CA
23.41
38.43
+64%
A first glimpse of Comcast DOCSIS 4.0?
While the mid-split upgrade is impressive in its breadth, the data for one city stands out:
Colorado Springs, CO: 36.42 Mbps -> 63.86 Mbps
Colorado Springs’ Q2 2024 starting point was already higher than others, suggesting it was an early recipient of the mid-split. The subsequent jump to nearly 64 Mbps by Q2 2025 deviates from the ~40 Mbps norm seen elsewhere and could be early evidence of Comcast’s DOCSIS 4.0 deployment. In late 2023, Comcast announced Colorado Springs as one of its first three launch markets for “X-Class” symmetrical multi-gigabit speeds, along with select areas of Atlanta and Philadelphia. The higher median upload speed in Colorado Springs indicates that a growing number of customers adopting DOCSIS 4.0, lifting the city-wide median beyond what a mid-split upgrade alone can provide.
The other X-Class initial launch markets, Atlanta (41.40 Mbps) and Philadelphia (40.09 Mbps), still fall in line with the standard mid-split results for now, which is expected given the limited “select areas” footprint of the DOCSIS 4.0 rollout in these markets, per Comcast’s press release.
Comcast is preparing its entire network to compete head-on with fiber and FWA by lifting all boats with a mid-split and then by launching a new class of multi-gig symmetrical service.
Charter (Spectrum)
Speedtest Intelligence data from Q2 2024 to Q2 2025 reveals a targeted and significant deployment of high-split network upgrades in specific markets, aligning with Charter’s publicly stated network evolution plans.
Upgraded markets: the high-split transformation
In several key metropolitan areas, the jump in median upload speed between 2024 and 2025 was a transformative leap, often by a factor of 5x to 9x. This is the definitive signature of a high-split upgrade, which reallocates spectrum to create a much larger pathway for upstream traffic.
City
Q2 2024 Upload (Mbps)
Q2 2025 Upload (Mbps)
Change
Arlington, TX
20.51
152.07
+641%
Dallas, TX
17.27
158.42
+817%
Fort Worth, TX
20.67
174.06
+742%
Frisco, TX
23.43
200.35
+755%
Irving, TX
21.05
177.65
+744%
McKinney, TX
21.88
202.14
+824%
Plano, TX
21.38
107.81
+404%
Lexington, KY
21.33
148.78
+597%
Louisville, KY
16.86
144.31
+756%
Reno, NV
109.32
224.08
+105%
The data for the Dallas/Fort Worth metroplex and the Kentucky markets align directly with Charter’s announcements listing them as completed high-split markets.
Reno, one of the earliest markets to be upgraded, already showed an upload speed over 100 Mbps in Q2 2024. In fact, examining the Speedtest data just prior to our Q2 2024 benchmark, we see that the upgrade came at the same time resulting in a 6x increase from February to June.
Markets awaiting upgrade
The majority of cities in the dataset, including Los Angeles (21.70 Mbps) and New York (21.06 Mbps), showed modest changes, suggesting they still operate on a legacy sub-split architecture. During Charter’s latest earnings call, President and CEO Chris Winfrey stated that “Step 1” of their upgrade plan was complete in approximately 15% of their footprint. This 15% figure suggests that the markets identified in our data with improved speeds are these “Step 1” locations. With 85% of Charter’s footprint remaining and upload speeds potentially ~7x faster, that’s a lot of upside.
Cox
The Speedtest Intelligence data for Cox Communications indicate a slightly more complex story than Charter’s, but with Cox not yet a public company (Charter merger is targeted for mid-2026), there isn’t a lot of publicly available information on the company’s deployment plans.. There appears to be a multi-stage upgrade strategy underway across their national footprint. Some markets are receiving initial mid-split upgrades, others are seeing those mid-splits mature, and a select few are now being pushed even further into high-split territory in preparation for DOCSIS 4.0.
Unlike the binary “upgraded or not” picture we saw with Charter, the changes in median upload speed for Cox reveals three distinct phases of network enhancement.
Phase 1: Initial mid-split deployment (sub-split to mid-split)
In some markets, there is a jump from the legacy sub-split baseline of ~10-15 Mbps, often doubling the median upload speed. This can represent the first step in modernizing the network by expanding the upstream spectrum.
Gainesville, FL: 16.47 Mbps -> 34.97 Mbps (+112%)
New Orleans, LA: 11.51 Mbps -> 23.76 Mbps (+106%)
These markets may be in the process of being upgraded, providing customers with a noticeable, though not yet final, improvement in upstream performance.
Phase 2: Mid-split maturation
The Speedtest Intelligence data for Cox indicates a multi-stage upgrade strategy with three phases of network enhancement.
Phase 1: Initial mid-split deployment. Some markets show a jump from a legacy sub-split baseline, often doubling the median upload speed. For example, Gainesville, FL, increased from 16.47 Mbps to 34.97 Mbps (+112%).
Phase 2: Mid-split maturation. Many cities, particularly in Arizona, California, and Nevada, were likely already operating with mid-split architecture in Q2 2024. By Q2 2025, these speeds saw a general uplift, with Phoenix, AZ, moving from 53.71 Mbps to 58.11 Mbps.
Phase 3: High-split jump. In several markets, there was a large jump from an already-upgraded mid-split baseline to speeds approaching or exceeding 100 Mbps. This is the clear signature of a high-split upgrade, a prerequisite for Cox’s DOCSIS 4.0 path.
City
Q2 2024 Upload (Mbps)
Q2 2025 Upload (Mbps)
Change
Buckeye, AZ
63.22
108.19
+71%
Queen Creek, AZ
79.80
101.71
+27%
San Tan Valley, AZ
56.90
99.30
+74%
Goodyear, AZ
57.78
96.30
+67%
Enterprise, NV
75.12
96.19
+28%
North Las Vegas, NV
57.89
83.96
+45%
Cox’s phased approach allows the company to manage its capital expenditures while improving its customer experience along its DOCSIS roadmap.
Altice (Optimum)
Instead of pursuing a comprehensive DOCSIS 4.0 upgrade, Altice is executing a dual-pronged strategy: maximizing its existing DOCSIS 3.1 network while simultaneously building out fiber-to-the-home (FTTH).
Speedtest Intelligence data for Optimum markets shows a network in a steady state. From Texas to New Jersey, median upload speeds remained consistently in the 25-35 Mbps range, with no significant jumps that would indicate mid-split or high-split upgrades. For example, New York, NY, moved from 25.14 Mbps to 29.13 Mbps.
In fact, in its 2Q 2025 earnings report, Altice stated, “Mid-split upgrades on DOCSIS 3.1 network continue, and are expected to enable multi-gig speeds to a portion of HFC passings in 2026.” The company’s goal is to offer multi-gigabit speeds across 65% of its total service area by the end of 2028, using this combination of upgraded cable and new fiber.
Altice is making a calculated decision to invest capital in building new, future-proof fiber in targeted areas, while making more modest, incremental upgrades to their existing cable plant.
Mediacom Communications (Xtream)
Regional provider Mediacom’s network appeared to be operating on a traditional low-split architecture as of Q2 2025. In Q2 2024, median upload speeds were consistently in the ~30-47 Mbps range. By Q2 2025, these speeds saw only minor changes, with Des Moines moving from 39.3 Mbps to 47.7 Mbps. There was no tell-tale jump to 60+ Mbps that would indicate a mid-split deployment.
This data suggests that while Mediacom has announced DOCSIS 4.0 trials, the foundational mid-split or high-split upgrades had not yet been deployed at scale.
However, in May 2025, Mediacom talked about deploying high-splits in Des Moines. While too early to move the city-wide median in Speedtest data, a number of faster upload speed samples are beginning to appear in the data, signaling that a broader rollout may be imminent.
Canada
Rogers
The Rogers Speedtest data reveals a tale of two networks: the legacy network in Eastern Canada that is being upgraded to the new standard, and the mature, already long-upgraded network in Western Canada (the former Shaw network).
Eastern Canada: the upgrade program
Cities in Rogers’ legacy Eastern Canada footprint show the clear signs of a network in the midst of an upgrade cycle, comparing data for Q2 2024 with Q2 2025:
Toronto, ON: 40.01 Mbps – 48.91 Mbps
Ottawa, ON: 37.54 Mbps – 51.67 Mbps
Mississauga, ON: 44.31 Mbps – 58.06 Mbps
Brampton, ON: 47.68 Mbps – 69.69 Mbps
Markham, ON: 45.91 Mbps – 75.96 Mbps
These Ontario markets in Q2 2024 demonstrated median upload speeds in the 35-50 Mbps range. While this is better than a legacy sub-split, it may indicate a mid-split deployment that is still in its early stages. The substantial and consistent growth across all these cities by Q2 2025 is the evidence of Rogers bringing its Eastern network up to the capabilities of the West.
Western Canada: the Shaw legacy
In cities that were part of the Shaw network prior to the acquisition, the Q2 2024 data shows a network that was already highly advanced.
Calgary, AB: 96.16 Mbps – 137.29 Mbps
Winnipeg, MB: 101.07 Mbps – 138.06 Mbps
Edmonton, AB: 96.71 Mbps – 125.68 Mbps
Vancouver, BC: 87.69 Mbps – 105.91 Mbps
Speedtest data for Q2 2024 for cities like Calgary, Edmonton, and Vancouver already reflected a post-upgrade network, indicating a very mature mid-split network. Shaw was proactive with its network enhancements well before the Rogers acquisition was finalized. According to Shaw’s Principal Network Engineer in October 2021, the company began its mid-split upgrade program back in 2017. By late 2021, more than 90% of that work was already finished, with the entire project slated for completion by early 2022.
Looking back to this time period in Calgary, Shaw more than tripled the median upload speed in one year:
Q2 2021: 19.93 Mbps
Q4 2021: 47.97 Mbps
Q2 2022: 70.99 Mbps
Calgary stands out as a top performer, which makes sense as it was the former headquarters for Shaw as well as the location for Rogers’ successful DOCSIS 4.0 trial that achieved 1 Gbps upload speeds.
The Rogers data provides an interesting textbook case of a post-merger network integration and upgrade strategy. That is, bringing its Eastern Canada plant up to the mid-split standard already established by Shaw in Western Canada. And, a future strategy directly informed by its technology partnership with Comcast. Rogers is establishing a nationwide mid-split foundation, which is the necessary prerequisite for DOCSIS 4.0 and symmetrical multi-gigabit speeds.
Cogeco
Operating in Ontario and Quebec, Cogeco is employing a market-by-market mid-split upgrade strategy. In Q2 2024, every city examined showed a median upload speed capped at approximately 30-34 Mbps, indicative of a low-split architecture. By Q2 2025, several cities showed a significant jump while others remained unchanged. Upgraded markets include:
Oakville: 34.5 Mbps – 70.6 Mbps (+104%)
Burlington: 34.2 Mbps – 59.9 Mbps (+75%)
This data provides an example of a phased network evolution. The cities with ~60-70 Mbps upload speeds are where Cogeco has performed the mid-split upgrade, creating the upstream capacity needed to eventually offer the performance of DOCSIS 4.0.
Videotron
Videotron’s performance in Québec and Ottawa reveals a different story. In Q2 2024, median upload speeds were between 34 Mbps and 47 Mbps. By Q2 2025, those speeds saw only a minor increase, with medians sitting between 42 Mbps and 49 Mbps.
The data suggests Videotron operated a high-performing DOCSIS 3.1 network on a traditional low-split architecture as of Q2 2025. This makes Videotron a possible “before” snapshot—a baseline of what a highly optimized low-split DOCSIS 3.1 network looks like just prior to initiating the mid-split or high-split evolution.
Summing uplink
The evidence from Speedtest Intelligence is that the cable industry in the U.S. and Canada is not standing still. Faced with fierce competition, operators are making significant commitments to evolve their cable networks. However, they are not all following the same blueprint.
The data reveals a strategic divergence. On one path, operators like Comcast and Charter are going all-in on DOCSIS, betting that multi-billion-dollar upgrades can extend the life of their networks for another decade and allow them to compete head-on with fiber. Yet even they differ in tactics, with Comcast pursuing a broad, foundational upgrade while Charter executes targeted, high-impact deployments.
On another path, operators like Altice in the U.S. and another operator in Mexico (examined in this research, though not presented here) are hedging their bets. They are choosing to invest capital in building new, future-proof fiber networks while performing more modest, incremental upgrades to their existing cable plants. This two-tiered approach suggests a financial calculation that, in some areas, a full DOCSIS 4.0 upgrade is less attractive than a long-term fiber overbuild.
These upgrades represent the most significant architectural change to the cable network in over a decade. They are the essential groundwork for DOCSIS 4.0, which promises to finally deliver the symmetrical, multi-gigabit speeds needed to achieve performance parity with fiber. The question is not if cable will respond to its competitors, but how effectively and how quickly. Can DOCSIS technologies truly compete with the speed of light?
Ookla retains ownership of this article including all of the intellectual property rights, data, content graphs and analysis. This article may not be quoted, reproduced, distributed or published for any commercial purpose without prior consent. Members of the press and others using the findings in this article for non-commercial purposes are welcome to publicly share and link to report information with attribution to Ookla.
Kerry Baker leads Ookla's research and content efforts in North America. He has over 20 years experience in the telecom industry, primarily at T-Mobile studying network performance benchmarking and customer experience. Kerry also has founder’s experience with four technology-related startups. Kerry holds masters degrees from the University of Washington in Business and International Political Economics.
Paradise Found, Signal Lost: a Patchwork of 5G Network Oases and Deserts
The deployment of 5G networks in the Caribbean remains limited and fragmented, concentrated in the region’s more economically developed islands and territories. Currently, 5G mobile services are commercially available in Puerto Rico, the U.S. Virgin Islands, Bermuda (included in the Caribbean for the purposes of this analysis), Aruba, the Cayman Islands, and parts of the Dominican Republic. In the French Antilles, initial 5G deployments are now live in Martinique, Guadeloupe, Saint Martin, and Saint-Barthélemy. Other nations are in various stages of spectrum allocation and trials, signaling a gradual, if uneven, trend toward broader 5G availability.
Key Takeaways:
A Multi-Tiered Landscape: 5G deployment in the Caribbean is fragmented, potentially contributing toward a digital divide between a handful of economically advanced, tourism-dependent, or geopolitically connected islands and the rest of the region.
ROI Over Ubiquity: Unlike national-scale rollouts in Puerto Rico and countries outside of the region, the rest of Caribbean 5G is driven by targeted return on investment. High per-capita income, competitive pressure, and dense tourist zones are the key predictors of deployment, not universal service goals.
The Performance Paradox: Early 5G performance metrics reveal a recurring theme: newly launched, empty networks deliver exceptional speeds (some over 400 Mbps median download speeds), while more mature markets trade some of that raw speed for much higher and more consistent network availability for users.
Caribbean 5G Patterns of Progress
Across the Caribbean, the pace and strategy for 5G deployments vary dramatically. With the possible exception of Puerto Rico, the primary driver for deployment is not universal service but a clear path to return on investment. This has created a multi-tiered landscape defined by economic strength, strategic priorities, and regulatory readiness.
High GDP. Dominican Republic, Puerto Rico
High Income. Bermuda, Cayman Islands
Uncle Sam. Puerto Rico, U.S. Virgin Islands
The French Connection. Guadeloupe, Martinique, Saint Martin, (Saint-Barthélemy shows signs of 5G testing, as does French Guyana which is not included in the Caribbean)
Outlier. Aruba
Planners. The Bahamas, British Virgin Islands, Jamaica
A key competitive dynamic fueling 5G deployment is when incumbents Digicel and Flow are forced to respond to a new competitor, as seen in Bermuda and the Caymans. This is also evident in markets not dominated by this duopoly, such as Aruba, Puerto Rico, the U.S. Virgin Islands, and the French Antilles. Meanwhile, many of the remaining Caribbean countries continue to prioritize their existing 4G LTE networks, where opportunities to expand coverage and improve capacity are more immediate.
Network Availability
(Please note, these charts are interactive. Hover the cursor over a line or bar to feature the subject. Deselect items from the legend to see the remaining subjects in detail.)
Caribbean Mobile Network Availability by Country
Speedtest Intelligence®, All Devices and 5G Devices, 1H 2025
PuertoRico and the U.S. Virgin Islands lead in 5G Availability for the first half of 2025 – 73.8% and 63.6% respectively – comparing favorably to the U.S. at 63.7%. They have benefited significantly from being part of T-Mobile U.S.’s aggressive 5G expansion and from AT&T’s 5G buildout before its operations were sold to Liberty Latin America in late 2020.
Bermuda (31.2%) and the CaymanIslands (6.2%) are well-suited for 5G. Their high residential incomes and demanding business sectors create strong demand for high-performance connectivity, which attracted a competitive third player in Paradise Mobile to accelerate 5G deployments.
Aruba (20.2%) exemplifies a tourism-first strategy, catering to high-spending international visitors who expect superior mobile service. Its small, flat terrain and concentrated infrastructure along the southern and western coasts lower the costs of 5G deployment. The rollout is also distinguished by being led by SETAR, the privatized national telecom owned by the Aruban government.
The Dominican Republic (8.5%) represents a large-scale Caribbean economy, similar to Puerto Rico, making an attractive business case for 5G capital expenditure. Rollouts have logically started in dense urban centers and key tourist corridors where population and economic activity justify the investment.
In the French Antilles, new commercial 5G services launched in early 2025 across SaintMartin (3.0%), Martinique (1.3%), and Guadeloupe (0.3%). These markets benefit from the technical expertise of French telecom subsidiaries like Orange Caraïbe and SFR Caraïbe. In Saint Martin, local operator Dauphin Telecom also launched 5G, contributing to its early Availability edge over the other two islands. Digicel, in partnership with Free (Iliad Group), also has a presence but has not yet launched 5G.
Two Perspectives on 5G Availability
By examining network technology availability from the perspective of all devices, we gain insight into the breadth of 5G deployments and the adoption of 5G-capable devices. However, looking from the perspective of only 5G-capable devices tells us how often those users can actually connect to a 5G network. The former is a network-centric view of all devices; the latter is a device-centric view of the 5G network.
Location
Year of 5G Launch
All Devices 5G Availability (%)
5G Devices 5G Availablity (%)
Point Change
% change
Puerto Rico
2019
73.8
87.4
13.6
18%
U.S. Virgin Islands
2020
63.6
75.5
11.9
19%
Dominican Republic
2021
8.5
34.7
26.2
307%
Bermuda
2023
31.2
82.1
51.0
164%
Aruba
2024
20.2
59.8
39.6
196%
Cayman Islands
2024
6.2
15.6
9.4
152%
Saint Martin
2025
3.0
23.5
20.5
687%
Martinique
2025
1.3
6.6
5.2
397%
Guadeloupe
2025
0.3
1.5
1.2
458%
As the earliest market to launch 5G, Availability leader PuertoRico sees its 5G devices connected to a 5G network (Claro, Liberty Mobile, T-Mobile) the vast majority of the time (87.4%)—a figure that surpasses even the mainland United States (74.1%). The U.S. VirginIslands follow closely in Puerto Rico’s wake with similarly high results.
Despite a relatively early 5G launch, the DominicanRepublic lags in adoption, with just 34.7% 5G Availability for 5G devices. Though its economy is similar in scale to Puerto Rico’s, its population is roughly triple while its per-capita income is one-third, appearing to limit the business case for broader 5G deployment and device uptake.
Bermuda shows the biggest percentage point (ppt) difference between these two perspectives (51.0 ppt). This is attributed to a favorable deployment environment (small, flat, wealthy populous) and a competitive three-player 5G market featuring One, Digicel, and the newly-launched Paradise Mobile.
From a small base, SaintMartin shows the biggest percentage increase between the two metrics (687%), ahead of Martinique (397%) and Guadeloupe (458%). Saint Martin’s competitive three-player market, where two of the three operators (Orange and Dauphin) have launched 5G, appears to be a key driver.
5G Network Speeds — Mixed Bag
5G versus 4G Speeds
Speedtest Intelligence®, All Providers, 1H 2025
With one notable exception (the U.S. Virgin Islands), 5G download and upload speeds unsurprisingly surpass those of 4G. We looked at countries based upon the length of time their 5G networks have been operational.
As a group with recently launched 5G networks, Guadeloupe, Martinique, and SaintMartin exhibit high median download and upload speeds. This is expected; their low 5G Availability percentages indicate these networks are carrying very little traffic. With just a few customers on the network, it is essentially a wide-open road.
Taking Aruba and the Cayman Islands as a pair that launched 5G in the same year (2024), Aruba’s higher rate of 5G devices on 5G than the Caymans (59.8% vs 15.6%) suggests more network traffic. This likely explains a slower median download speed for Aruba than the Caymans (144.70 Mbps vs 224.17 Mbps), taking the networks as equivalent on the whole (ie, site density and spectrum aside) in delivering the end-user experience. Conversely, Arubans (and tourists in Aruba) appear to leave the uplink more lightly utilized than Caymanians (and their tourists), leading all Caribbean countries with a median 5G download speed of 52.39 Mbps.
The DominicanRepublic’s lower 5G adoption has a silver lining for those who have upgraded: a relatively unloaded network delivering a fast median download speed of 367.78 Mbps. Compare this to PuertoRico, the most mature 5G market, which posts a still-respectable 129.23 Mbps under a much heavier load.
Bermuda’s competitive market presents another example where significant 5G device adoption is loading the 5G networks, keeping the median 5G download speed (86.27 Mbps) only modestly above its 4G median (60.55 Mbps).
Finally, the U.S. Virgin Islands stand apart. Despite a similar mobile market structure and 5G maturity to Puerto Rico, its much smaller scale may have limited commensurate capital investment, which would be consistent with performance results. In the USVI, T-Mobile’s competitors deliver faster 4G LTE speeds than T-Mobile’s 5G service.
Where Will 5G Launch Next?
The pattern of existing rollouts provides a model for predicting the next wave of 5G in the Caribbean. The most likely candidates are countries that fit the established “high-income” or “tourism-first” profiles but may currently be stalled by regulatory hurdles.
At the front of the line are The Bahamas (Nassau, in particular) and Barbados. Both boast strong tourism economies and high GDP per capita, and their network operators have declared their infrastructure “5G-ready.” Commercial launches are primarily contingent on final spectrum allocation from government regulators. Smaller, tourism-dense islands like Sint Maarten, which mirror the Aruba model, are also strong contenders pending local regulatory action.
Competitive dynamics will also trigger expansion. In Trinidad and Tobago, a market already served by 5G for fixed wireless, a pivot to mobile 5G is the logical next step, likely to be driven by one operator seeking an edge over its rivals. This dynamic is also pushing expansion across borders, as seen with Bermuda’s Paradise Mobile, which, after launching 5G at home, is already planning entry into the Cayman Islands 5G fray.
For many other Caribbean nations, however, expanding and fortifying existing 4G LTE networks remains a more pressing and pragmatic priority than investing in 5G. The high costs, challenging terrain, and risk from natural disasters present formidable barriers. This reality is creating a widening digital divide between the 5G pioneers and the rest of the region. The evolution of 5G in the Caribbean will continue to be a story of calculated investments, with future progress hinging on regulatory decisions, competitive strategy, and the emergence of new technologies that could lower the cost barrier for smaller markets.
Individual mobile network operator performance in the Caribbean will appear with the Speedtest Connectivity reports in the coming weeks and months (not available for all countries). See also this recent report on Caribbean Broadband Competition Picks Up. To find out more about Speedtest Intelligence® data and insights, please contact us here.
Ookla retains ownership of this article including all of the intellectual property rights, data, content graphs and analysis. This article may not be quoted, reproduced, distributed or published for any commercial purpose without prior consent. Members of the press and others using the findings in this article for non-commercial purposes are welcome to publicly share and link to report information with attribution to Ookla.
Kerry Baker leads Ookla's research and content efforts in North America. He has over 20 years experience in the telecom industry, primarily at T-Mobile studying network performance benchmarking and customer experience. Kerry also has founder’s experience with four technology-related startups. Kerry holds masters degrees from the University of Washington in Business and International Political Economics.
Across the Caribbean, internet connectivity is faster, more consistent, and there are more service providers options available for consumers than in the past. Although there are vast differences top-to-bottom across countries, fiber growth continues to drive leaps in performance and, where fiber has yet to reach, satellite service is a viable solution in countries where it is available.
Key Takeaways
More countries are posting download speeds over 100 Mbps. There is a healthy uplift year-on-year, going from just four countries with median download speeds in excess of 100 Mbps in Q2 2024, to 10 countries in Q2 2025. Median download speeds are up 25% from a year ago on average across all countries.
Consistency is improving where it needs it most. The 10 lowest-ranked countries improved by an average of 14.2% compared to a 2.5% improvement in the 10 highest ranked in terms of reliably delivering speeds of a minimum 25 Mbps download speed AND 3 Mbps upload speed.
Starlink speed and consistency rivals the fixed service providers. Starlink records as-good-as or better consistency in seven of its 11 markets where service is available.
(Please note, these charts are interactive. Hover the cursor over a line or bar to feature the subject. Deselect items from the legend to see the remaining subjects in detail.)
Top ISP Broadband Performance Across Caribbean Markets
Speedtest Intelligence® | Q1 2024 – Q2 2025
The trend among fixed Internet service provider (ISP) median download speeds across the Caribbean is one of strong and widespread performance improvement over the last year and a half, increasing from just four to ten countries exceeding 100 Megabits per second (Mbps).
Guadeloupe is the clear standout, starting as a leader (120.67 Mbps) and more than doubling its speed to 246.32 Mbps by Q2 2025. It shows both the highest overall speed and the largest absolute growth.
Martinique and PuertoRico also demonstrated very strong, consistent growth to round out the top tier.
While most countries improved, Sint Maarten is a notable example of rapid progress. It began with one of the lowest speeds (25.21 Mbps) and effectively doubled it to 51.22 Mbps.
Overall, median upload speeds also show a general trend of improvement, but progress is far more variable compared to download speeds, with a handful of leaders pulling away from the pack.
Martinique again stands out, as it more than tripled its upload speed from a modest 30.43 Mbps to an impressive 93.33 Mbps, the most significant growth in the region.
Two countries surpassed the 100 Mbps mark: Guadeloupe (114.38 Mbps) and the CaymanIslands (107.00 Mbps), establishing them as the clear leaders in upload performance thanks to strong fiber deployments.
A large group of countries experienced only slow, incremental growth, remaining below 40 Mbps. Locations like PuertoRico, the DominicanRepublic, and the Bahamas saw very little change in performance over the six-quarter period due to limited fiber expansion.
Unlike the speed metrics, there is no single regional trend for latency. Some countries have stable performance, some are improving dramatically, while a notable number are seeing latency get worse.
Trinidad and Tobago is the consistent and undisputed leader, maintaining an excellent latency of just 13-15 ms. Joining Trinidad and Tobago in a country club of best latency performers are Caribbean Netherlands, Puerto Rico, Bermuda (included in region for purposes of this article), Curaçao, Cayman Islands, The Bahamas and Jamaica have consistently low latencies.
Haiti improved most, cutting its latency from 95 ms to 71 ms, while the Cayman Islands also saw a solid drop from 49 ms to a very competitive 27 ms.
A handful of countries are stuck in the 80-100 ms doldrums range — Antigua and Barbuda, Aruba, Barbados, Dominica, Saint Martin, Saint Lucia, Sint Maarten.
Spotlight on Guadeloupe and Martinique Speeds
Guadeloupe and Martinique Speeds by Fixed Provider
Speedtest Intelligence® | Q2 2025, Mbps
Taking a closer look at the top median download countries of Guadeloupe and Martinique and their fixed service providers, we can see these are strongly competitive markets for fiber services.
In Guadeloupe, CANALBOX is the performance leader, delivering the fastest median download (354.37 Mbps) and upload (276.44 Mbps) speeds.
Interestingly,SFR performs differently in each market.
In Martinique, SFR leads with relatively balanced download (263.10 Mbps) and upload (180.40 Mbps) speeds.
In Guadeloupe, while its download speed is very competitive (295.26 Mbps), its upload speed is drastically lower (46.22 Mbps), making it a highly asymmetric service.
The top performer in one country isn’t the No. 1 provider in the other. CANALBOX wins in Guadeloupe but is the slowest of the three providers in Martinique, while SFR wins in Martinique but is not the top performer in Guadeloupe. There can be distinct network infrastructure and market strategies in each country.
Consistency – More Countries are Delivering Reliable Download and Upload Speeds
Ookla uses the network Consistency metric to gauge how prevalent acceptable broadband speeds are across a network, based on the percentage of Speedtest samples exceeding a threshold of 25 Mbps download and 3 Mbps upload performance.
The consistency of the region’s broadband networks saw widespread improvement from Q2 2024 to Q2 2025, meaning a higher percentage of users achieved a baseline speed of at least 25 Mbps download and 3 Mbps upload.
A top tier of locations deliver a highly consistent experience. Trinidad and Tobago (86.3%), Bermuda (86.1%), and PuertoRico (85.5%) lead the region, providing the benchmark-level service to over 85% of users.
Significant gains were seen in countries that started with lower scores. SintMaarten (+10.6 points) and the DominicanRepublic (+8.8 points) made the largest gains, but still with more upside remaining for improving the baseline user experience.
Virtually every country improved its consistency score year-over-year. Even those not improving, like Dominica and Grenada, only saw very minor declines of less than one percentage point.
Despite broad improvements, a significant country digital divide remains. While the leaders push past 85% consistency, several countries like Haiti (66.2%) and SintMaarten (65.0%) are still working to provide that baseline service to a majority of their users. Cuba, with a score below 10%, remains a severe outlier.
Starlink Brings More Competition
Starlink Performance, Median Download Speed and Consistency
Speedtest Intelligence® | Q2 2025
A little over a year ago, Ookla examined the Caribbean region and, at the time, Starlink was available in just five countries. Now it has more than doubled that number to 11 countries where it is available (including parts of some where it is sold out). Based on Q2 2025 data, Starlink’s performance compared to the overall fixed broadband market varied depending on the country, excelling in some, trailing in others, and competitive in all.
Starlink provides a substantial median download speed advantage in several markets. The most dramatic case is the U.S. Virgin Islands, where Starlink’s median speed of 151.61 Mbpsis over 50 Mbps faster than the country’s overall average. It also offers a significant performance boost in locations like Saint Martin and the Bahamas*.
In some of the region’s more developed high-speed markets, Puerto Rico and Trinidad and Tobago, Starlink’s speeds are nearly identical to those of the top fixed providers, offering a comparable experience.
In countries with exceptionally fast fiber providers, Starlink lags considerably. Guadeloupe’s overall median speed of 246.32 Mbps is nearly double Starlink’s speed in the country. Similarly, Martinique’s fixed broadband market is much faster than Starlink.
In terms of delivering a consistent, baseline-usable internet connection, Starlink shows a distinct advantage in many Caribbean nations, though it does not outperform the most reliable fixed networks in the region.
Starlink shows an advantage in the U.S. Virgin Islands and Saint Martin, offering a double-digit or near double-digit percentage point lead over the average for all providers.
Starlink’s consistency is identical to Jamaica as a whole, the scores are exactly the same (78.0%), while in Puerto Rico, they are also very close, making them comparable choices.
In Trinidad and Tobago, the market’s consistency score (86.3%) is substantially higher than Starlink’s (77.8%), and more consistent as well in the Dominican Republic and Haiti.
Starlink’s impact in the Caribbean varies. It presents a viable, high-speed option where fixed networks are less developed or slower, yet it generally doesn’t outperform the most advanced fiber networks in the area.
Starlink seems to offer a significant improvement in consistency for islands where the overall fixed market hasn’t achieved high reliability. Conversely, in countries with the strongest fixed networks, local providers offer a more consistent experience.
*The Bahamas and Nassau offer an example for looking more closely at the map and at the numbers
In the prior section we saw that Starlink performed well in the Bahamas for its download speed and its consistency, beating the country scores. However, Nassau, with about 70% of the country’s population, is relatively distinct from the rest of the country’s archipelago. This population density has encouraged fiber deployment, in particular from ALIVFibr.
Nassau (New Providence):
Q2 2025 Speedtest IntelligenceⓇ
Median Download Speed (Mbps)
Consistency (%)
ALIVFibr
243.33
95.1
Starlink
94.42
80.8
Space X is everywhere, as the country (and region) has many islands with nice views of the sky. Clearly fiber offers superior performance when it is available, as in Nassau, but Starlink can be the great option almost everywhere else. This can be true of much of the Caribbean.
The past year-and-a-half has witnessed maturation of these rival technologies across many countries in the region. While country comparisons are interesting, it is also important to dig deep for the full story, whether by technology or geography, or both. We’ll continue to monitor progress and provide updates on the state of broadband connectivity across the Caribbean. For more information about Ookla’s data and insights, please get in touch.
Ookla retains ownership of this article including all of the intellectual property rights, data, content graphs and analysis. This article may not be quoted, reproduced, distributed or published for any commercial purpose without prior consent. Members of the press and others using the findings in this article for non-commercial purposes are welcome to publicly share and link to report information with attribution to Ookla.
Kerry Baker leads Ookla's research and content efforts in North America. He has over 20 years experience in the telecom industry, primarily at T-Mobile studying network performance benchmarking and customer experience. Kerry also has founder’s experience with four technology-related startups. Kerry holds masters degrees from the University of Washington in Business and International Political Economics.
Fiber ISPs have the Upper Hand in Upload Speed and Latency
Wi-Fi 7 has been commercially available for over a year, but has only gained a small foothold in Canada. Each new technology generation increases the performance over previous generations. This slow adoption of Wi-Fi 7 raises the question of whether Canadians are missing out on a better connectivity experience. This article looks at the growth of Wi-Fi 7 in Canada and compares its performance against prior Wi-Fi generations across top fixed internet service providers (ISP).
Key Takeaways:
Wi-Fi 7 adoption is less than 1%, according to its share of fixed samples of Speedtest user data. As a primary means for households to acquire new hardware, it’s significant that only one major ISP (Rogers) has just started to include Wi-Fi 7 routers with its internet plans.
Fiber is much faster in the uplink and much quicker in latency than cable across all Wi-Fi generations.
Customer ratings of their ISP improves with each generation of Wi-Fi, from 2.7 stars for Wi-Fi 4 to 4.6 stars for Wi-Fi 7.
Wi-Fi by Technology Standard and the Growth of Wi-Fi 7
Wi-Fi 4 (802.11n), introduced in 2009, hangs onto 12.7% of Speedtest user samples
Wi-Fi 5 (802.11ac) arrived in 2013 and registers a 34.1% share
Wi-Fi 6 (802.11ax), which came to market in 2019, and its extension, Wi-Fi 6E, introduced in early 2021, together account for a majority 52.6% share
Wi-Fi 7 (802.11be) came along early in 2024 and has garnered just 0.6% through Q1 2025
[Note: 6 and 6E are the same IEEE standard. 6E in this article is 6 GHz only in order to allow for discrete analysis of this spectrum band. Wi-Fi 6E samples on 2.4 GHz or 5 GHz are included with Wi-Fi 6. PC Mag explains.]
Slow and steady, but mostly slow
Wi-Fi 7 as percentage of total Wi-Fi based on Speedtest users (share of samples)
Q1 2024
Q2 2024
Q3 2024
Q4 2024
Q1 2025
Canada
0.0%
0.1%
0.2%
0.3%
0.6%
United States
0.2%
0.3%
0.5%
0.8%
1.8%
Wi-Fi 7 adoption in Canada is roughly one-third of the rate in the U.S. This may be systemic. In the U.S., for example, cable provider Spectrum (Charter Communications) started offering its Wi-Fi 7 router in November last year. Rogers has only just started to promote a Wi-Fi 7 router bundled with one of its plans, claiming to be the first in Canada, albeit in just one city initially. This seven-month gap in these two announcements matches the two-quarter lag seen in Speedtest data.
The role of ISPs providing equipment is critical in the U.S. Seventy-one percent (71%) of internet households in the U.S. get their routers from their ISP, according to research published in April this year from Parks Associates. If Canada is similar, then this step by Rogers is critical to advancing the growth of this Wi-Fi generation.
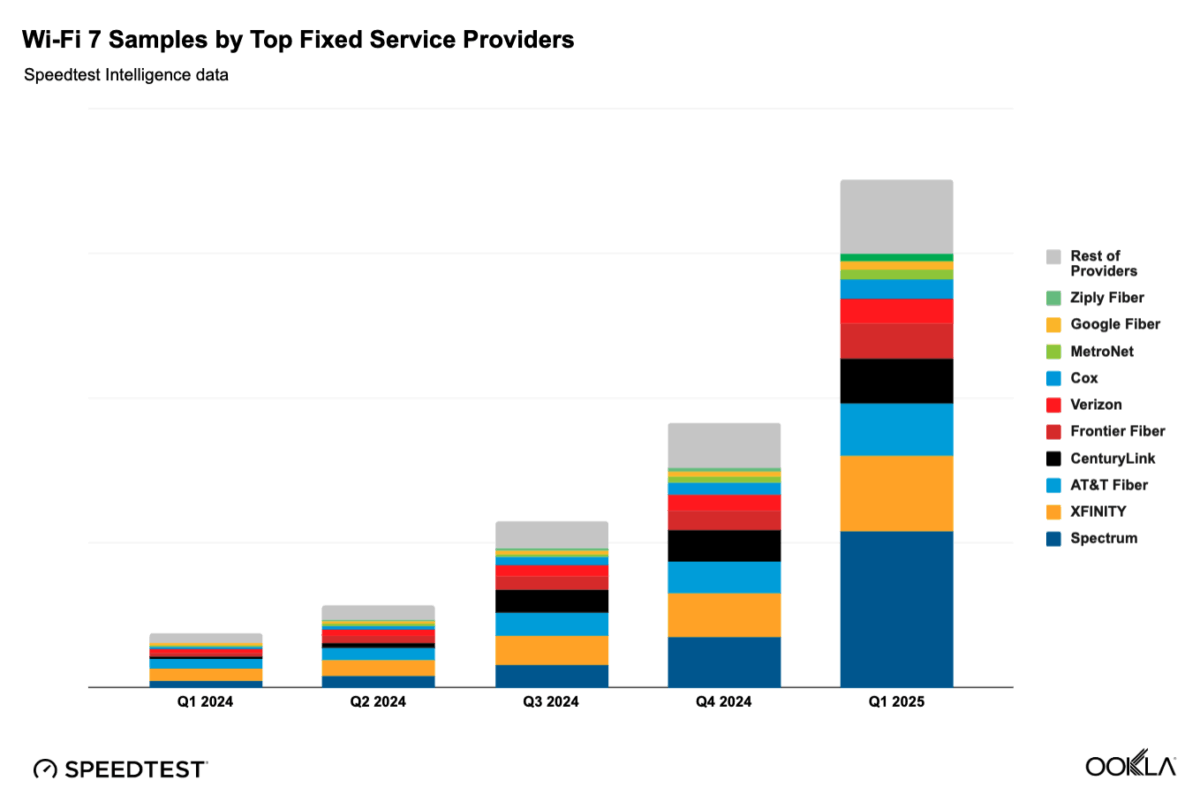
The ISPs listed are the five largest Wi-Fi 7 providers in Speedtest Intelligence data based on total Speedtest user samples on Wi-Fi 7.
Wi-Fi Download Speed, Upload Speed, Latency | All and Top 5 Fixed Providers
Speedtest Intelligence data, Canada, Q1 2025. Median values. Wi-Fi 7 sample size is small for Cogeco and Videotron
For all providers, the increase in median download speed for each Wi-Fi generation is expected. Wi-Fi 6E, not technically a generation, demonstrates that the 6 GHz spectrum performance in isolation can top Wi-Fi 7 – 885.01 Mbps vs. 762.68 Mbps for all providers, respectively. Wi-Fi 7 includes samples from slower bands of 2.4 GHz and 5 GHz. So, even with the newest capabilities of Wi-Fi 7, the physical characteristics of a house, for example, can mean that the better coverage propagation of 2.4 GHz gives a better connection than 6 GHz.
Wi-Fi 7 benefits from double the channel bandwidth and four-times the modulation, as well as a feature called Multi-Link Operation (MLO) which allows data to travel across all frequency bands rather than one. As this analysis is focused on results rather than technical specifications, for those interested in learning more about Wi-Fi 7 capabilities, see The Ultimate Wi-Fi 7 Upgrade Guide by Ekahau (a Ziff Davis company, as is Ookla).
The most significant opportunities for improving customer experience lie in addressing the performance of legacy Wi-Fi generations. E-cycling Wi-Fi 4 and 5 routers for newer technology could provide an immediate performance boost for customers of any ISP. This is particularly true for Rogers and Bell Pure Fibre, which stand tallest for their Wi-Fi 6E and 7 median download speeds.
This performance boost includes upload speeds and latency as well, especially for Bell Pure Fibre and TELUS PureFibre. Median upload speeds leap from a little over 38 Mbps on Wi-Fi 4 to 700.44 Mbps and 655.56 Mbps on Wi-Fi 7, respectively.
Cable ISPs – Cogeco, Rogers, Videotron – are technology limited in the uplink. Although for Rogers, it has and is deploying fiber-to-the-home (FTTH) in Ontario and Atlantic Canada. Roger’s FTTH contributes to the improving upload speed trends expected with the newer Wi-Fi generations. Cogeco and Videotron show little differentiation in median upload speeds by Wi-Fi generation, apart from a step-up from Wi-Fi 4 to anything newer.
This same performance difference in the uplink repeats in multi-server latency. Again, anything not Wi-Fi 4 is better; and fiber has an advantage over cable. This same fiber vs cable performance pattern – that is, (1) close on download speeds, but (2) cable slower on upload speeds and (3) cable lagging on latency – is observed in the U.S. as well.
Wi-Fi 7 – Star of the Show
Speed and lag are critical in determining the customer experience. Customer experience relative to one’s expectations determines customer perception. Customer perception is captured by “sentiment” metrics like ratings or stars, satisfaction percentages, or loyalty and recommendation metrics like Net Promoter Score (NPS).
Taking a look at Speedtest user ratings of their ISP on a five star rating scale, just as seen with download speed, upload speed and latency, each newer generation of Wi-Fi is attended by better consumer sentiment. To be clear, these are Speedtest users’ scores for their ISP by Wi-Fi generation, not a score for the routers themselves.
Mean Star Ratings (1 – 5) by Wi-Fi Generation, Speedtest Intelligence data, Q1 2025, Canada
Wi-FI 4
Wi-Fi 5
Wi-Fi 6
Wi-Fi 6E
Wi-Fi 7
2.7
3.6
3.8
4.1
4.6
A legacy of older Wi-Fi router generations in an ISP’s customer base limits the customer experience. So too with the transport technology (eg, DOCSIS 3.0). Furthermore, Wi-Fi 7 may need new consumer-premise cabling; some Wi-Fi 7 capable devices may not support the full channel width; and so on. This is to say that technology bottlenecks are possible at each node in the ecosystem. Getting this all lined up to match the service capabilities to the right-fit rate plan that meets the customer needs is Rubik’s Cube. More awareness, better education, and technology transparency will help realize the potential of Wi-Fi 7.
Ookla can assist ISPs, venue owners, and companies in designing Wi-Fi networks, monitoring their performance, and optimizing them. Please contact us to learn more about Speedtest Intelligence and our Wi-Fi expertise at Ekahau.
Les Fournisseurs de Service Internet par fibre optique ont l’avantage en matière de vitesse de téléversement et de latence
Le Wi-Fi 7 est disponible sur le marché depuis plus d’un an, mais il n’a réussi à prendre qu’une faible part du marché résidentiel au Canada. Chaque nouvelle génération améliore les performances par rapport à la précédente. Cette lente adoption soulève la question : les Canadiens passent-ils à côté d’une meilleure expérience de connectivité? Cet article examine la croissance du Wi-Fi 7 au Canada et compare ses performances à celles des générations Wi-Fi antérieures chez les principaux Fournisseurs de Services Internet (FSI) fixes.
Points Clés :
L’adoption du Wi-Fi 7 est inférieure à 1 %, selon sa part des utilisateurs de l’application Speedtest via des connexions fixes. Étant donné que les forfaits des FSI sont le principal moyen pour les foyers d’acquérir de nouveaux équipements (routeur), il est significatif qu’un seul FSI majeur ait tout juste commencé à inclure des routeurs Wi-Fi 7 dans ses offres.
La fibre optique est beaucoup plus rapide pour le téléversement (uplink) et offre une latence bien plus faible que le câble, et ce, pour toutes les générations de Wi-Fi.
Les évaluations des FSI par leurs clients s’améliorent à chaque nouvelle génération de Wi-Fi, passant de 2,7 étoiles pour le Wi-Fi 4 à 4,6 étoiles pour le Wi-Fi 7 en moyenne.
Le répartition du Wi-Fi par technologie et la croissance du Wi-Fi 7
Wi-Fi Génération Proportion
Données de Speedtest Intelligence, Canada, T1 2025
Le Wi-Fi 4 (802.11n), introduit en 2009, conserve 12,7 % des échantillons d’utilisateurs de Speedtest.
Le Wi-Fi 5 (802.11ac), arrivé en 2013, enregistre une part de 34,1 %.
Le Wi-Fi 6 (802.11ax), lancé en 2019, et son extension, le Wi-Fi 6E (introduit début 2021), représentent ensemble une part majoritaire de 52,6 %.
Le Wi-Fi 7 (802.11be), apparu début 2024, n’a recueilli que 0,6 %des échantillons à compter du premier trimestre de 2025.
[N.B. Le Wi-Fi 6 et le 6E partagent la même norme IEEE. Dans cet article, le 6E ne concerne que la bande de 6 GHz, afin de permettre une analyse distincte de cette bande de fréquence. Les échantillons Wi-Fi 6E sur 2,4 GHz ou 5 GHz sont inclus avec le Wi-Fi 6.]
Lentement mais sûrement, mais surtout lentement
Part des échantillons d’utilisateurs de l’application Speedtest sur Wi-Fi 7
T1 2024
T2 2024
T3 2024
T4 2024
T1 2025
Canada
0,0%
0,1%
0,2%
0,3%
0,6%
États-Unis
0,2%
0,3%
0,5%
0,8%
1,8%
L’adoption du Wi-Fi 7 au Canada correspond à environ un tiers du taux observé aux États-Unis, ce qui pourrait apparaître comme systémique. Aux États-Unis, le fournisseur internet par câble Spectrum (Charter Communications) a par exemple commencé à offrir son routeur Wi-Fi 7 en novembre de l’année dernière. Rogers vient tout juste de commencer à promouvoir un routeur Wi-Fi 7 inclus dans l’un de ses forfaits, se présentant ainsi comme le premier au Canada à offrir ce service , bien qu’initialement dans un nombre limité de villes. Cet écart de sept mois entre les deux annonces correspond au décalage de deux trimestres observé dans les données de Speedtest.
Les Fournisseurs de Service Internet ont un rôle crucial à jouer. Soixante et onze pour cent (71 %) des foyers américains reçoivent leur routeur de leur FSI, selon une étude publiée en avril de cette année par Parks Associates. Si la situation est similaire au Canada, cette initiative de Rogers est essentielle pour faire progresser cette génération de Wi-Fi.
Les FSI listés ci-dessous sont les cinq plus grands fournisseurs de Wi-Fi 7 selon les données de Speedtest Intelligence, basées sur le nombre total d’échantillons d’utilisateurs de l’application Speedtest sur Wi-Fi 7.
Vitesse de téléchargement, téléversement, latence multi-serveurs médiane par FSI et génération de Wi-Fi
Données de Speedtest Intelligence, Canada, T1 2025. La taille de l'échantillon pour le Wi-Fi 7 est faible pour Cogeco et Vidéotron.
Pour tous les fournisseurs, l’augmentation de la vitesse de téléchargement médiane à chaque génération de Wi-Fi est attendue. Le Wi-Fi 6E, qui n’est pas techniquement une génération, démontre que la performance de la bande de spectre de 6 GHz, prise séparément, peut dépasser celle du Wi-Fi 7 – 885,01 Mbit/s contre 762,68 Mbit/s pour l’ensemble des fournisseurs. Ceci peut s’expliquer par le fait que Wi-Fi 7 inclut des échantillons provenant des bandes 2,4 GHz et 5 GHz, dont la performance est généralement plus lente. D’un autre côté, les caractéristiques physiques d’un logement peuvent avoir un impact, par exemple dû à la meilleure propagation de la bande 2,4 GHz offrant ainsi une meilleure connexion que celle de 6 GHz.
Le Wi-Fi 7 bénéficie d’une bande passante de canal deux fois supérieure et d’une modulation quatre fois supérieure, ainsi que d’une fonction appelée Multi-Link Operation (MLO) ou Opération Multi-liens qui permet aux données de circuler sur toutes les bandes de fréquences simultanément plutôt qu’une seule. Comme cette analyse se concentre sur les résultats plutôt que sur les spécifications techniques, ceux qui souhaitent en savoir plus sur les capacités du Wi-Fi 7 peuvent consulter The Ultimate Wi-Fi 7 Upgrade Guide par Ekahau (une société de Ziff Davis, comme Ookla).
Les opportunités les plus significatives pour améliorer l’expérience client résident dans l’amélioration des performances des anciennes générations de Wi-Fi. Le recyclage des routeurs Wi-Fi 4 et 5 au profit de technologies plus récentes pourrait offrir une amélioration immédiate des performances pour les clients quel que soit leur FSI. C’est particulièrement vrai pour Rogers et Bell Pure Fibre, qui se distinguent par leurs vitesses de téléchargement médianes en Wi-Fi 6E et 7.
Cette amélioration des performances inclut également les vitesses de téléversement et la latence, en particulier pour Bell Pure Fibre et TELUS PureFibre. Les vitesses de téléversement médianes bondissent d’un peu plus de 38 Mbit/s en Wi-Fi 4 à 700,44 Mbit/s et 655,56 Mbit/s en Wi-Fi 7, respectivement.
Les FSI comme Cogeco, Rogers et Vidéotron sont technologiquement limités pour le téléversement. Rogers a déployé et continue de déployer la fibre jusqu’au domicile (FTTH) en Ontario et dans le Canada atlantique. La fibre FTTH de Rogers contribue aux tendances d’amélioration des vitesses de téléversement attendues avec les nouvelles générations de Wi-Fi. Cogeco et Vidéotron montrent peu de différenciation dans les vitesses de téléversement médianes par génération de Wi-Fi, mis à part un bond entre le Wi-Fi 4 et les technologies plus récentes.
Cette même différence de performance dans le téléversement se répète pour la latence multi-serveurs. Encore une fois, toute technologie plus récente que le Wi-Fi 4 offre de meilleures performances, et la fibre a un avantage certain sur le câble. Ce même schéma de performance fibre contre câble – c’est-à-dire (1) des vitesses de téléchargement similaires, mais (2) un téléversement plus lent pour le câble et (3) une latence plus élevée pour le câble – est également observé aux États-Unis.
Wi-Fi 7 – La vedette du spectacle
La vitesse et la latence sont essentielles pour déterminer l’expérience client par rapport à leurs attentes. La perception du client est capturée par des métriques de « sentiment » comme les évaluations sur une échelle allant de 1 à 5 étoiles, les pourcentages de satisfaction, ou des métriques de fidélité et de recommandation comme l’Indice de Recommandation Net (Net Promoter Score NPS).
En examinant les évaluations des FSI par les utilisateurs de Speedtest sur une échelle de une à cinq étoiles, on constate que, tout comme pour la vitesse de téléchargement, la vitesse de téléversement et la latence, chaque nouvelle génération de Wi-Fi s’accompagne d’un meilleurs sentiment de satisfaction des consommateurs. Pour être clair, il s’agit des notes attribuées par les utilisateurs de Speedtest à leur FSI par génération de Wi-Fi, et non d’une note pour les routeurs eux-mêmes.
Évaluations moyennes allant de 1 à 5 étoiles par génération de Wi-Fi, données de Speedtest Intelligence, T1 2025, Canada
Wi-FI 4
Wi-Fi 5
Wi-Fi 6
Wi-Fi 6E
Wi-Fi 7
2,7
3,6
3,8
4,1
4,6
La présence d’anciennes générations de routeurs Wi-Fi dans la base de clients d’un FSI a un impact certain sur l’expérience client. Il en va de même pour la technologie de transport (par ex., DOCSIS 3.0). De plus, le Wi-Fi 7 pourrait nécessiter un nouveau câblage chez le client; certains appareils compatibles Wi-Fi 7 pourraient ne pas supporter la pleine largeur de bande du canal, etc. Cela signifie que des goulots d’étranglement technologiques sont possibles à chaque nœud de l’écosystème. Aligner tout cela pour faire correspondre les capacités du service au bon forfait qui répond aux besoins du client est un véritable casse-tête. Une plus grande sensibilisation, une meilleure éducation et une transparence technologique aideront à réaliser le potentiel du Wi-Fi 7.
Ookla peut aider les FSI, les propriétaires de lieux publics et les entreprises à concevoir, surveiller et optimiser leurs réseaux Wi-Fi. Veuillez nous contacter pour en savoir plus sur Speedtest Intelligence et notre expertise Wi-Fi chez Ekahau.
Ookla retains ownership of this article including all of the intellectual property rights, data, content graphs and analysis. This article may not be quoted, reproduced, distributed or published for any commercial purpose without prior consent. Members of the press and others using the findings in this article for non-commercial purposes are welcome to publicly share and link to report information with attribution to Ookla.
Kerry Baker leads Ookla's research and content efforts in North America. He has over 20 years experience in the telecom industry, primarily at T-Mobile studying network performance benchmarking and customer experience. Kerry also has founder’s experience with four technology-related startups. Kerry holds masters degrees from the University of Washington in Business and International Political Economics.
Airlines are using in-flight connectivity to differentiate their service and create brand value
Just as hotels have progressively integrated Wi-Fi connectivity as a standard amenity for their guests, in-flight Wi-Fi is transitioning from a novelty to a convenience to an expected service.
Reflecting this increasing expectation, the American Customer Satisfaction Index (ACSI) this year incorporated “Quality of in-flight Wi-Fi” into its benchmarks for the airline industry. In-flight Wi-Fi placed 21st out of the 21 benchmarks, ranking lower than baggage handling, seat comfort, and even airline food.
To assess this performance, we analyzed our Speedtest data collected during Q1 2025. We examined performance for individual airlines and for in-flight connectivity service providers.
KEY TAKEAWAYS:
In-flight Wi-Fi for the majority of users compares very poorly with their experience on terrestrial networks
Hawaiian Airlines and Qatar Airways stand out as the best performing airlines based on our data
Starlink’s low-earth orbit (LEO) satellite constellation drives performance for leading airline Wi-Fi
Expect airlines to ramp up their efforts — in-flight connectivity can be a key point of differentiation for travelers, helps support the premium brand value that many international airlines aspire to create, and is an opportunity to monetize a literally captive audience
In-flight Wi-Fi Speed and Latency Performance by Airline
Speedtest data, Q1 2025, airlines sorted by median
Hawaiian Airlines and Qatar Airways use Starlink’s low-Earth orbit (LEO) satellite constellation to deliver their inflight Wi-Fi, resulting in download speeds and upload speeds and latency that are better than the other airlines.
Many other airlines are also providing very usable speeds. Spirit Airlines, Air Canada, Delta Airlines, Breeze Airlines, American Airlines and Aeromexico all provide 10th percentile (where 90% of the results are faster) download speeds above 10 megabits per second (Mbps) and very respectable median download speeds. Furthermore, upload speeds on most of these airlines tend to support basic uplink connectivity needs like emailing. However, when the upload speed is observed alongside the many high-latency results, real-time uses like gaming or video calling are likely not possible (to the relief of all other passengers).
Lufthansa, at the other end of the download speed ranking, is limited by the Deutsche Telekom LTE ground-to-air network. While Lufthansa may offer other connectivity options, our data shows a significant number of its passengers are still connecting via this poorer-performing service.
Likewise, given the premium brand reputation of carriers like Japan Airlines, Turkish Airlines, and Cathay Pacific, they likely offer better-performing connectivity services on other aircraft. However, as with Lufthansa, our data reveals that a notable portion of their passengers are still encountering a substandard Wi-Fi experience.
Qatar Airways presents additional insight as, along with Starlink as one of its connectivity service providers, it also operates planes with geo-stationary orbit GEO connectivity. This is most evident in the multiserver latency results. While Qatar’s median latency is similar to Hawaiian Airlines, its 10th percentile (the laggiest experience) is much higher, keeping it in the company of other GEO-supported airlines.
Connectivity Service Providers
In our Speedtest samples of in-flight connectivity service providers we collect a mix of GEO, LEO, medium earth orbit (MEO), multi-orbit / hybrid network providers, and even ground-based LTE. Furthermore, the category includes satellite service integrators. These integrators do not own or operate their own satellite constellations. Instead they partner with satellite operators for capacity while managing the business relationship with the airline, including installing and managing the in-flight connectivity system on the aircraft.
In-flight Connectivity Service Providers and Associated Airlines
Deutsche Telekom
Air France, Cathay Pacific, Condor, Lufthansa
Hughes (SES)
Spirit Airlines
Inmarsat (Viasat)
Air New Zealand, Qatar Airways
Intelsat
Air Canada, Alaska Airlines, American Airlines, United Airlines
MTN Satellite Communications
Southwest Airlines
Nelco (PAC/Intelsat)
Air India
Panasonic Avionics Corporation
Aer Lingus, Air France, American Airlines, ANA, Asiana Airlines, British Airways, Etihad Airways, EVA Air, Fiji Airways, Finnair, Iberia Airlines, ITA Airways, Japan Airlines, KLM, Korean Air, Malaysian Airlines, Scandinavian Airlines, Singapore Airlines, SWISS Airlines, TAP Air Portugal, Thai Airlines, United Airlines, Virgin Atlantic, VoeAzul, WestJet, Zipair Tokyo
SITA Switzerland
Qatar Airways
SpaceX Starlink
Hawaiian Airlines, Qatar Airways
Türk Telekom
Turkish Airlines
Viasat
Aeromexico, American Airlines, Breeze Airlines, Delta Airlines, EL AL Airlines, Icelandair, JetBlue, Southwest Airlines, United Airlines, Virgin Atlantic
* Based on Speedtest data samples, Q1 2025; not based on active or announced partnerships
Deutsche Telekom is in the European Aviation Network, a hybrid network that combines a GEO satellite from Viasat/Inmarsat with a ground-based LTE network across Europe.
Hughes, an EchoStar company, provides GEO satellite internet for consumers and enterprises. In late 2022 it began offering “Hughes Fusion,” a multi-orbit in-flight connectivity solution that can simultaneously communicate with both GEO and LEO satellites. Hughes frequently collaborates with European satellite operator SES, a GEO and MEO provider.
Intelsat provides in-flight connectivity through its fleet of GEO satellites and offers a multi-orbit solution that combines its GEO network with access to a LEO constellation. Intelsat is in the process of being acquired by SES.
MTN Satellite Communications, primarily known for its services in the maritime and remote land-based sectors, also provides in-flight connectivity. The company leverages capacity from various satellite operators across different orbits, both GEO and LEO.
Nelco, a Tata Group enterprise, has partnered with Intelsat to offer its GEO-based connectivity services to airlines operating in Indian airspace.
Panasonic Avionics Corporation (PAC) – a provider of in-flight entertainment and connectivity systems, does not operate its own satellite constellation. Instead, it partners with various satellite operators, including those with GEO and LEO networks (eg, EutelsatOneWeb), to offer multi-orbit connectivity service to airline customers.
SITA Switzerland, a multinational information technology company, partners with satellite network operators, to deliver passenger broadband.
SpaceX Starlink is rapidly expanding its LEO satellite network, offering high-speed, low-latency internet service to airlines, and is being adopted by several carriers.
Türk Telekom has been providing in-flight connectivity through partnerships including Panasonic Avionics.
Viasat operates a constellation of high-capacity GEO satellites. Its services are used by numerous airlines globally. Viasat acquired Inmarsat, another GEO satellite network, in May 2023.
In-flight Wi-Fi Speed and Latency Performance by Connectivity Service Provider
Speedtest data, Q1 2025, provider sorted by median
The advantages of its dense LEO constellation compared to the GEOs make SpaceX’s Starlink the clear standout in speeds and latency. Its medians are 152.37 Mbps download speed, 24.16 Mbps upload speed, and 44 milliseconds (ms) multi-server latency.
Hughes and Intelsat, with their multi-orbit offering, deliver solid median download speeds – 84.55 Mbps and 61.61 Mbps, respectively. Viasat performs well on download speed, too, at 50.38 Mbps, given it is a GEO provider.
On the other end of the scale, the LTE ground network of Deutsche Telekom delivers a minimally usable median download speed of 4.14 Mbps. Passengers on these flights may have access to GEO services (which, for example, we see in our data with Air France, though not in sufficient sample size to include in this article), but, as stated above, given we record Speedtest samples on Deutsche Telekom means that passengers are connecting with very slow internet speeds.
Looking more closely at slower download speeds, the 10th percentile reveals a similar pattern to the median, with Starlink still performing well at 65.31 Mbps, and Hughes and Viasat still managing usable download speeds of 28.29 Mbps and 12.78 Mbps, respectively. The rest of the provider speeds tail off and down into the single-digit Mbps, and raises a question: is it the satellite constellation capacity or the onboard Wi-Fi technology (or both) that is the limiting factor? The question of onboard Wi-Fi technology is taken up in the conclusion to this research article.
Examining the uplink, besides Starlink at 24.16 Mbps, only Intelsat provides adequate median upload speeds at 9.96 Mbps. Next, Panasonic Avionics, Turk Telekom (also PAC) and Nelco (also PAC) neatly cluster – 3.65, 3.40 and 2.60 Mbps, respectively – followed by Deutsche Telekom at 2.53 Mbps.
Latency is the starkest separation between LEO and GEO, which is obvious given the orbital altitude differences in distance between them is roughly 60 times or more. Bearing this in mind, Starlink’s median multiserver latency of 44 ms would otherwise seem an outlier compared with all other providers, ranging from 667 ms to 839 ms.
Nowhere to go but up
In-flight connectivity isn’t seamless. Depending on airline routes or models of airplanes, different connectivity service providers may be used (or occasionally restricted by governments when crossing over certain territories). Moreover, old equipment on and in the airplanes takes time and expense to upgrade.
However, the upgrades are happening as many airlines see value and opportunity to provide extended services, along with better Wi-FI. For example, United Airlines is not just moving its entire fleet to Starlink for better performance, but also to deepen its customer loyalty relationships. “Access will be free for all MileagePlus customers and includes game-changing inflight entertainment experiences like streaming services, shopping, gaming and more.” SAS is also working with Starlink to enhance its “gate-to-gate” connectivity and offer free high-speed Wi-Fi by the end of this year.
Not all airlines are selecting Starlink. Also announced this year, American Airlines has aligned itself with Viasat and Intelsat, while Delta has gotten on board with Viasat and Hughes, deplaning Intelsat.
Another example of improvement, this time inside the airplane, is Panasonic Avionics offering Wi-Fi 6E. Wi-Fi 6E adds the 6 GHz frequency band to prior Wi-Fi generations (that offered 2.4 GHz and 5 GHz), which has more channels and less interference than older Wi-Fi devices.
Finally, competition is heating up. The likes of Project Kuiper and, perhaps, AST SpaceMobile will add new LEO options, where we see the leading LEO Starlink performing very well in our Speedtest data. Intention to provide “direct-to-device” connectivity to wireless customers from the mobile network operators, helps support the scale of the capital-intensive business case for launching rockets and orbiting satellites.
Watch this space
We will be revisiting this topic soon with updated information and insights. If you are an airline or an in-flight connectivity service provider, we’d like to hear from you to ensure we’re capturing and reflecting your passengers’ Wi-Fi connection experience.
Ookla assists ISPs, venue owners, and companies in designing Wi-Fi networks, monitoring their performance, and optimizing them. Please contact us to learn more about Speedtest Intelligence and Ekahau.
Ookla retains ownership of this article including all of the intellectual property rights, data, content graphs and analysis. This article may not be quoted, reproduced, distributed or published for any commercial purpose without prior consent. Members of the press and others using the findings in this article for non-commercial purposes are welcome to publicly share and link to report information with attribution to Ookla.
Kerry Baker leads Ookla's research and content efforts in North America. He has over 20 years experience in the telecom industry, primarily at T-Mobile studying network performance benchmarking and customer experience. Kerry also has founder’s experience with four technology-related startups. Kerry holds masters degrees from the University of Washington in Business and International Political Economics.
Cable has the fastest-growing Wi-Fi 7, but Fiber has the fastest Wi-Fi 7 speeds
Editor’s note: This article was revised on June 12 to reflect that Verizon’s median download speeds are a result of its rate plans and for clarity about cable technology.
Wi-Fi 7 has been around for over a year. If you haven’t noticed this latest generation of Wi-Fi technology, it might be because it is still just gaining a foothold. But even for those who haven’t yet heard of Wi-Fi 7, one can surmise that a new technology generation will have better performance than what’s come before. This article looks at the growth of Wi-Fi 7 in the United States, then compares its performance against prior Wi-Fi generations across top fixed internet service providers (ISP).
Key Takeaways:
Wi-Fi 7 adoption is less than 2%, according to its share of fixed samples of Speedtest user data. ISPs are beginning to include Wi-Fi 7 routers in their service bundle, which is the primary means for households to acquire routers.
Wi-Fi 7 speed is faster, as expected, even delivering gig-speed for one fiber ISP. However, cable providers, which are competitive with fiber speeds on the downlink, have much slower uplink speeds and more lag on latency. Cable companies have 30% more of the older Wi-Fi 4 and 5 routers than fiber companies, constraining the potential customer experience.
Net Promoter Score (NPS) improves with each generation of Wi-Fi, with an immense gulf from -38 for Wi-Fi 4 to +45 for Wi-Fi 7.
Wi-Fi in the U.S. by Technology Standard and the Growth of Wi-Fi 7
Wi-Fi Generations Mix
Speedtest Intelligence data, United States, Q1 2025
Generation breakdown:
Wi-Fi 4 (802.11n), introduced in 2009, hangs onto 13.0% of Speedtest user samples
Wi-Fi 5 (802.11ac) arrived in 2013 and registers a 33.0% share
Wi-Fi 6 (802.11ax) came to market in 2019 and 6E (also 802.11ax) added in early 2021 together account for a majority 52.3% share
Wi-Fi 7 (802.11be) came along early in 2024 and has garnered just 1.8% through Q1 2025
[NB: 6 and 6E are the same IEEE standard. 6E in this article is 6 GHz only, to allow for discrete analysis of this spectrum band. Wi-Fi 6E router samples on 2.4 GHz or 5 GHz are included with Wi-Fi 6. PC Mag explains.]
Wi-Fi 7’s Early Shoots
Wi-Fi 7 Speedtest user samples as share of total Wi-Fi Speedtest samples, Speedtest Intelligence data:
Q1 2024
Q2 2024
Q3 2024
Q4 2024
Q1 2025
0.2%
0.3%
0.5%
0.8%
1.8%
Wi-Fi 7 adoption started slowly and was less than 1% share through all of 2024, but then it more than doubled in Q1 2025 vs. Q4 2024, as more providers began offering Wi-Fi 7 routers as part of the service bundle. The role of ISPs providing equipment is critical. Seventy-one percent (71%) of internet households in the U.S. get their routers from their ISP, according to recent research from Parks Associates. For example, Spectrum (Charter Communications) began offering its Wi-Fi 7 router late last year and tripled its adoption over these two quarters, allowing the company to claim that it is the fastest growing Wi-Fi 7 provider as of Q1 2025.
The ISPs listed in the chart are the ten largest Wi-Fi 7 providers in Speedtest Intelligence data based on total Speedtest user samples on Wi-Fi 7.
Wi-Fi Performance by Generation
Median Download Speeds (Mbps), All and Top 10 Fixed Providers
Speedtest Intelligence data, United States, Q1 2025
For all providers, the increase in median download speed for each Wi-Fi generation is expected. At the top end, Wi-Fi 7 at 764.15 Mbps, even with Wi-Fi 7 including samples from slower bands of 2.4 GHz and 5 GHz, is still faster by 51.64 Mbps than Wi-Fi 6E at 712.51 Mbps. However, among the individual ISPs, there are some ISPs where 6E is faster than Wi-Fi 7. Even with the newest capabilities of Wi-Fi 7, the physical characteristics of a house, for example, can mean that the better coverage propagation characteristics of 2.4 GHz gives a better connection than 6 GHz.
Wi-Fi 7 benefits from double the channel bandwidth and four-times the modulation, as well as a feature called Multi-Link Operation (MLO) which allows data to travel across all frequency bands rather than one. As this analysis is focused on results rather than technical specifications, for those interested in learning more about Wi-Fi 7 capabilities, see The Ultimate Wi-Fi 7 Upgrade Guide by Ekahau (a Ziff Davis company, as is Ookla).
Among the top 10 ISPs, older generation Wi-Fi 4 and Wi-Fi 5 median download speeds generally cluster in similar ranges, respectively, though CenturyLink (Lumen) is slower due to a large portion of its customer base being on slower, copper-based broadband service. In its Q1 2025 earnings report, Lumen reported 1.1 million subscribers on fiber and 1.4 million customers primarily on the slower service.
Verizon’s relatively slower median download speeds on the newer Wi-Fi generations (6, 6E, 7) are likely due to customer rate plan mix.
Frontier, Verizon’s acquisition target, is clearly the fastest on Wi-Fi 7 and records the only gigabit median download speed of 1.011 Gbps.
Median Upload Speeds (Mbps), All and Top 10 Fixed Providers
Speedtest Intelligence data, United States, Q1 2025
As with download speeds, the upload speeds for all providers follow the expected path of getting faster with each newer Wi-Fi generation. However, among the ISPs, there is greater variation in the upload than the download. In particular, the cable ISPs – Cox Communications, Spectrum (Charter Communications), Xfinity (Comcast Corporation) – lagging behind the symmetrical speed of fiber, are far below in the uplink speed. The Wi-Fi 7 average of the median upload speeds of the three cable companies is just 64.40 Mbps vs. 595.75 for the seven fiber companies.
On Wi-Fi 4 and 5, the three cable companies average 47.1% of samples (almost half) while the seven fiber companies average 36.3% of samples on these older generations. The Wi-Fi 5 average of the median upload speeds of the three cable companies is just 27.65 Mbps vs. 178.17 Mbps for the seven fiber companies.
If older cable technology tracks with the Wi-Fi router generations, then the cable companies have a slow-to-change portion of their customer base who will need targeted incentives to upgrade. The cellular industry markets its generations and consumers know, for example, that they need a 5G phone to be on a 5G network. But Wi-Fi, as a category, has not educated consumers to the same extent such that consumers could experience better connectivity with, for example, the latest router (assuming they even know the technology generation of their current router). And, given that the vast majority of a consumers’ mobile traffic is via Wi-Fi – and basically all of the home internet – this is an opportunity for the industry to align the network capability with the service plan with the router with the end device.
As with download speed, again Frontier clocks a blazing median upload speed of 0.9 Gbps (866.85 Mbps).
Median Multi-Server Latency (ms), All and Top 10 Fixed Providers
Speedtest Intelligence data, United States, Q1 2025
Just as with speeds, latency tracks its improvements by Wi-Fi generation for all providers. However, it is arguable from a consumer relevance perspective that Wi-Fi 5, 6, and 6E provide essentially the same latency experience across all providers.
Also as with speed, the fiber companies (apart from MetroNet) have better performance on latencies than the cable companies. On average for Wi-Fi 7, the cable companies latency is 25 milliseconds (ms) vs. 15 ms for the fiber companies (including MetroNet, and including copper customers mentioned above).
The best performer on latency is the aptly named Ziply Fiber, with as-low-as or lower Wi-Fi 4 latency than other ISPs have on Wi-Fi 7 (12 ms), and Ziply is the only provider in single-digit Wi-Fi 7 latency (8 ms).
Wi-Fi 4 Nostalgia? Sentimental is bad for Sentiment
Speed and lag are critical in determining the customer experience. Customer experience relative to one’s expectations determines customer perception. The customer perception is captured by “sentiment” metrics like ratings or stars, satisfaction percentages, or loyalty and recommendation metrics like Net Promoter Score (NPS).
Taking a look at NPS by Wi-Fi generation, just as seen with download speed, upload speed and latency, each newer generation of Wi-Fi is attended by better consumer sentiment. To be clear, these are Speedtest users’ scores for their ISP by Wi-Fi generation, not a score for the routers themselves.
NPS by Wi-Fi Generation, Speedtest Intelligence data, Q1 2025:
Wi-FI 4
Wi-Fi 5
Wi-Fi 6
Wi-Fi 6E
Wi-Fi 7
-38
3
11
30
45
As noted, a legacy of older Wi-Fi router generations in an ISP’s customer base, cable companies having more than fiber providers, limits the customer experience. So too with the transport technology (eg, DOCSIS 3.0). Furthermore, Wi-Fi 7 may need new consumer-premise cabling; some Wi-Fi 7 capable devices may not support the full channel width; and so on. This is to say that technology bottlenecks are possible at each node in the ecosystem. Getting this all lined up to match the service capabilities to the right-fit rate plan that meets the customer needs is Rubik’s Cube. More awareness, better education, and technology transparency will help realize the potential of Wi-Fi 7.
Ookla can assist ISPs, venue owners, and companies in designing Wi-Fi networks, monitoring their performance, and optimizing them. Please contact us to learn more about Speedtest Intelligence and Ekahau.
That leaves just Google Fiber and Xfinity on our top ten without recent, major M&A news. With so many providers (we count 59 ISPs in our data with Wi-Fi 7 samples, and there are more than a thousand fiber providers in the U.S.) in a capex-intensive industry, scale economics drives consolidation. Furthermore, there is a fiber-first imperative narrative that access technologies will converge over time, which also encourages industry consolidation.
Ookla retains ownership of this article including all of the intellectual property rights, data, content graphs and analysis. This article may not be quoted, reproduced, distributed or published for any commercial purpose without prior consent. Members of the press and others using the findings in this article for non-commercial purposes are welcome to publicly share and link to report information with attribution to Ookla.
Kerry Baker leads Ookla's research and content efforts in North America. He has over 20 years experience in the telecom industry, primarily at T-Mobile studying network performance benchmarking and customer experience. Kerry also has founder’s experience with four technology-related startups. Kerry holds masters degrees from the University of Washington in Business and International Political Economics.
Significant improvements in internet services are being seen by customers in Mexico, notably enhanced speeds due to the strategic deployment of fiber infrastructure, offering superior symmetrical upload and download capabilities. It is essential for Mexican consumers to understand the technological advancements that are leading to these speed improvements to ensure they are subscribing to the optimal service as ISPs continue to develop their offerings.
A recent development includes Totalplay’s introduction of new plans with symmetrical speeds, a shift from their previous offerings that featured only asymmetrical speeds. Consequently, Totalplay’s uplink speeds are now receiving a substantial increase.
Fixed ISP Median Speeds, Mexico
Speedtest Intelligence data, monthly January 2021 – May 2025
Median download and upload speeds for Mexican ISPs over time
Ookla Speedtest Intelligence® data reveals that median fixed download speeds in Mexico have more than tripled over the past five years across all fixed ISPs. Totalplay, known for its emphasis on speed leadership, has a median download speed more than two-thirds faster than all providers combined in 2025, consistently setting itself apart from competitors.
The true differentiator, however, is increasingly found in upload speeds, where fiber optic technology (FTTH) shines.
Totalplay’s new plans introduced in April 2025 marked its entry into offering symmetrical speeds. Concurrent with this change, Speedtest data shows a dramatic leap in Totalplay’s median upload speeds, more than doubling from the weeks prior. While the observed median speeds may not yet be perfectly symmetrical—potentially due to factors like user equipment capabilities—this represents a significant enhancement to their service and reinforces their competitive speed position. The introduction of these faster plans prompted elevated testing by the Speedtest community, with speeds now settling at a new, higher watermark.
Telmex: Leveraging its substantial fiber footprint (while also upgrading a legacy DSL network), Telmex was the first major ISP in México to offer symmetrical speeds, beginning in January 2024. Telmex leads the number of broadband and voice subscribers in México, although it cannot offer pay TV services.
Megacable is executing on a multi-year plan to transition its HFC network to become a fully-fiber provider, a move evident in its steady gains in median upload speed. At the end of Q1 2025, 77% of subscribers were on fiber vs 67% in 1Q 2024, per Mega earnings report.
izzi: Reliant primarily on cable (DOCSIS) technology, izzi faces inherent limitations in providing the same level of uplink speeds available with FTTH. Its network passes more than 19.9 million homes, but just 12.5 thousand of those are fiber, according to Grupo Televisa earnings report.
The strategic assets of each ISP clearly dictate their market positions and ability to compete on speed. Fiber providers like Totalplay and Telmex are less constrained by the asymmetrical nature of older technologies. Totalplay’s recent enhancement to its uplink capabilities is a clear strategic move, leveraging its FTTH infrastructure to further differentiate itself, particularly against the larger incumbent Telmex, and solidify its reputation as a speed leader in the dynamic Mexican broadband market.
La fibra impulsa la revolución de la velocidad de subida e intensifica la competencia entre los ISP
Los clientes en México están experimentando mejoras significativas en los servicios de Internet, velocidades notablemente mejoradas debido al despliegue estratégico de infraestructura de fibra, que ofrece capacidades simétricas superiores de carga y descarga. Es esencial que los consumidores mexicanos comprendan los avances tecnológicos que están llevando a estas mejoras de velocidad para asegurarse de que se suscriben al servicio óptimo a medida que los ISP continúan desarrollando sus ofertas.
Entre los recientes desarrollos se incluye la introducción por parte de Totalplay de nuevos planes con velocidades simétricas, un cambio con respecto a sus ofertas anteriores que presentaban solo velocidades asimétricas. En consecuencia, las velocidades de subida de Totalplay están ahora registrando un aumento sustancial.
Velocidades medias de proveedores de servicios de Internet fijos en México
Datos de Speedtest Intelligence, mensuales de enero de 2021 a mayo de 2025
Median download and upload speeds for Mexican ISPs over time
Los datos de Speedtest Intelligence® de Ookla revelan que las velocidades medianas de descarga fijas en México se han más que triplicado en los últimos cinco años en todos los ISP fijos. Totalplay, conocido por su apuesta en el liderazgo en velocidad, registra una velocidad mediana de descarga más de dos tercios más rápida que la de todos los proveedores combinados en 2025, lo que hace que se diferencie de sus competidores de manera constante.
El verdadero diferenciador, sin embargo, se encuentra cada vez más en las velocidades de subida, donde la tecnología de fibra óptica (FTTH) brilla.
Los nuevos planes introducidos en abril de 2025 por Totalplay marcaron su entrada en la oferta de velocidades simétricas. Paralelamente a este cambio, los datos de Speedtest muestran un salto dramático en las velocidades medianas de subida de Totalplay, más del doble que en las semanas anteriores. Si bien las velocidades medianas observadas pueden no ser perfectamente simétricas, potencialmente debido a factores como las capacidades del equipo del usuario, esto representa una mejora significativa para su servicio y refuerza su posición competitiva en velocidad. La introducción de estos planes más rápidos provocó pruebas elevadas por parte de la comunidad Speedtest, con velocidades que ahora se establecen en un nuevo punto de referencia más alto.
Telmex. Aprovechando su considerable huella de fibra (mientras también actualiza una red DSL heredada), Telmex fue el primer ISP en México en ofrecer velocidades simétricas, comenzando en enero de 2024. Telmex lidera el número de suscriptores de banda ancha y voz en México, aunque no puede ofrecer servicios de televisión de pago.
Megacable está ejecutando un plan de varios años para transformar su red HFC en un proveedor totalmente de fibra, un movimiento evidente en sus ganancias constantes en la velocidad de subida media. Al final del primer trimestre de 2025, el 77% de los suscriptores estaban en fibra frente al 67% en el primer trimestre de 2024, según el informe de ganancias de Mega.
izzi. Dependiendo principalmente de la tecnología de cable (DOCSIS), izzi enfrenta limitaciones inherentes para ofrecer el mismo nivel de velocidades de subida disponibles con FTTH. Su red pasa por más de 19.9 millones de hogares, pero sólo 12.5 mil de ellos son de fibra, según el informe de resultados de Grupo Televisa.
Los activos estratégicos de cada ISP claramente dictan sus posiciones en el mercado y su capacidad para competir en velocidad. Los proveedores de fibra como Totalplay y Telmex están menos limitados por la naturaleza asimétrica de las tecnologías más antiguas. La reciente mejora de Totalplay en sus capacidades de subida es un movimiento estratégico claro, al aprovechar su infraestructura FTTH para diferenciarse aún más, particularmente contra el incumbente más grande, Telmex, y solidificar su reputación como líder en velocidad en el dinámico mercado de banda ancha mexicano.
Ookla retains ownership of this article including all of the intellectual property rights, data, content graphs and analysis. This article may not be quoted, reproduced, distributed or published for any commercial purpose without prior consent. Members of the press and others using the findings in this article for non-commercial purposes are welcome to publicly share and link to report information with attribution to Ookla.
Kerry Baker leads Ookla's research and content efforts in North America. He has over 20 years experience in the telecom industry, primarily at T-Mobile studying network performance benchmarking and customer experience. Kerry also has founder’s experience with four technology-related startups. Kerry holds masters degrees from the University of Washington in Business and International Political Economics.
The Samsung Galaxy S25 family shows impressive performance for Speedtest users in the United States
U.S. consumers have been hanging onto their phones longer, lengthening the handset upgrade timeline for the mobile industry. Many device payment “installment” plans are 36-months long and Verizon stated in prior investor meetings that its average handset upgrade time is more than 40-months long.
Without any major change in technology (eg, from 4G to 5G) or innovation in device design (aka form factor), consumers haven’t been considering a phone upgrade. Improved device quality and already-high prices for smartphones further dampened consumers’ desire to purchase the latest-and-greatest devices.
But now, the tide may be turning thanks in part to the threat that looming import tariffs may cause a spike in handset prices. In addition, consumers may be tempted by switching offers and want to re-evaluate their mobile service provider which could also prompt a device upgrade. According to recent statements by executives from AT&T, Verizon, Comcast (Xfinity Mobile), and T-Mobile during Q1 earnings calls, there are indications that consumers are getting ahead of potential price increases and upgrading their phones now.
Enough about them – let’s talk about you.
If you upgraded your phone years ago to get onto 5G, now is the time to look at upgrading again. With Samsung’s annual update in February to its Galaxy family – the S25, S25+, and S25 Ultra – these devices take advantage of the latest network performance capabilities.
Key Takeaways:
If you need speed, consider upgrading your older 5G phone for a new S25 model. No matter which company is your mobile service provider, in our comparison of the S21 Ultra to the S25 Ultra, all providers are faster by at least 100 Megabits per second (Mbps) in median download speed on the new phone.
Bigger is better when it comes to device performance on wireless networks (as long as you are fine with the bigger size and bigger cost). The S25 Ultra outperforms the download and upload speeds of the S25 and S25+.
The price isn’t going down, probably, but it might go up. We’re not professing to have any insider information and the potential for import tariffs is uncertain, but some consumers have already decided to not wait around. (Check your eligibility for upgrade offers from your mobile service provider.)
To see how much your network speeds might improve, we compared Speedtest users’ experience across five generations of Galaxy Ultras – the S21 Ultra through the S25 Ultra. Each year with each new model, there is a new Snapdragon chipset and modem from Qualcomm underpinning its performance on the cellular networks. So, even being just somewhat faster each year can accumulate to a substantial speed increase over the years.
Galaxy S21 Ultra – S25 Ultra
While T-Mobile’s deeper spectrum advantage is evident across all of our Speedtest users performance results, each carrier categorically demonstrates better performance on the Galaxy S25 Ultra than any earlier models. So, even if you’re not interested in switching providers, there is still meaningful improvement in the network experience to be gained by staying on your current network.
Download Speeds
Samsung Galaxy Download Speeds (Mbps)
Speedtest Intelligence® | March 2025
DL speed 50/90/10 by AT&T/T-Mobile/Verizon for Ultras
Speedtest users on T-Mobile with the S21 Ultra experiencing speeds in the mid-200 Mbps would enjoy median download speeds over 400 Mbps by upgrading to the S25 Ultra. Not to be outdone, a Verizon S21 Ultra owner would approximately triple their speed with an S25 Ultra. A similar AT&T customer would about double their speed.
It’s worth noting that all of these median download speeds – T-Mobile, AT&T and Verizon alike – are far more than needed for just about any typical mobile application or use case. However, network speeds in the aggregate are indicative of the overall network capacity and its ability to serve all its customers, not just an individual.
Each successive generation of Galaxy Ultra generally shows improved performance. Chipsets and modems from Qualcomm lay at the heart of these gains. For example, from the S24 (Snapdragon 8 Gen 3 with Modem-RF system X75) to the S25 (Snapdragon Elite 8 with 5G Modem-RF system X80) increases the number of carriers that can be aggregated in the downlink. In other words, the S25 can use more spectrum than the S24, which is seen in the step-up in median download speeds for each provider.
In March, T-Mobile touted 4.3 Gbps on a Galaxy S25 with the Snapdragon X80 5G Modem-RF System running test software, leveraging many-carrier aggregation of its sub-6GHz spectrum trove. To see faster network speeds from Speedtest users, we look at their 90th percentile. Not quite 4.3 Gbps but still quite fast, T-Mobile’s S25 Ultra clocks 0.9 Gbps. Like T-Mobile’s, Verizon’s and AT&T’s 90th percentile on the S25 Ultra is their fastest, but across all the models, there is a surfeit of high-end speed for all these mobile service providers.
Fast is fast, but how slow is slow? Looking at the lower-end Speedtests, the 10th percentile download speeds aren’t actually too slow. Meaning, even the slowest at 11.23 Mbps for the S21 Ultra on AT&T is still ample to support browsing and streaming. (The fastest-slow at 69.10 Mbps for the S25 Ultra on T-Mobile would be a respectable medianspeed on 4G LTE.) As with median and 90th percentile, the S25 Ultra’s performance in the 10th percentile is a step up not only from the S21 Ultra, but even over last year’s S24 Ultra.
Upload Speeds
Samsung Galaxy Upload Speeds (Mbps)
Speedtest Intelligence® | March 2025
UL speed 50/90/10 by AT&T/T-Mobile/Verizon
Mobile video calls and live streaming have users paying more attention to the device-network uplink. The same goes for the technology side. On 5G standalone networks (ie, not connected to the 4G core network), the Galaxy S24 and S25 families can access two carrier aggregation (2CA) in the uplink. On the Galaxy S25 lineup, T-Mobile adds two more advanced features to aid the uplink called UL MIMO and PC 1.5 (uplink multiple-input multiple-output and power class). In our network testing conducted by our sister company RootMetricsⓇ, we see these 5G advanced features in action, and it shows in our Speedtest Intelligence data here as well.
Speedtest user median upload speeds, relatively similar by mobile service provider on the S21, S22 and S23 Ultras, are faster on the S24 and, more so on the S25 Ultras. The advanced 5G uplink features are having an impact.
At the top end, the 90th percentile indicates the fastest upload speeds are generally similar for AT&T no matter which generation of Ultra, while T-Mobile and Verizon see clear gains on the S24 and S25 Ultras. This is corroborated by our RootMetrics data, where we see the vast majority of our uplink tests on the T-Mobile network and over a quarter of Verizon’s (in first quarter 2025) on 5G standalone.
At the slower 10th percentile, unlike with download speeds where we still saw useful performance, the upload speeds are quite slow to the degree of being unusable for some applications. T-Mobile’s S25 Ultra performs better, potentially aided by PC 1.5 mentioned earlier. (To be clear about the 10th percentile, this means 90% of our Speedtest users experienced at least this speed on these devices.)
Latency
Latency gets just a brief mention because there isn’t much variability — not to the extent that the milliseconds difference is perceivable. On the same mobile service provider, the difference in median multi-server latency from the S21 Ultra (the most lag) to the S25 Ultra (the least lag) is only 8 milliseconds (ms), 4 ms, and 7 ms on AT&T, T-Mobile, and Verizon, respectively.
Comparing among the service providers on just the S25 Ultra, latency tracks to the maturity (or lack) of the 5G standalone networks. That is, AT&T’s is nascent; T-Mobile’s is mature; Verizon is rolling it out. Thus, the corresponding median multi-server latencies are 52 ms, 38 ms and 46 ms.
The Galaxy S25 Family
If the analysis of the Galaxy Ultra generations above has you thinking about upgrading to the 25, here’s a look at Samsung’s three Galaxy models’ – the S25, the S25+, and again the S25 Ultra – performance using Speedtest Intelligence data since the device launch in early February through March 2025.
Download Speeds
Samsung Galaxy Download Speeds (Mbps)
Speedtest Intelligence® | February – March 2025
DL speed 50/90/10 by AT&T/T-Mobile/Verizon
As we would expect from our examination of the Galaxy Ultras, differences in median download speeds among the mobile service providers for the S25 and S25+ is here as well.
Less expected, however, is an obvious difference among the device models for the same mobile service provider. In particular for AT&T and Verizon, deciding between the S25 and the S25 Ultra can mean a difference in median download speed of in the ballpark of 90 Mbps.
What might be happening here? Size matters, and it matters in a few ways. But it isn’t just the screen size to consider about the size, the volume of the device is also important:
One, performance can be affected by the internal temperature of the phone, so a larger phone is better at regulating this (with something called a “vapor chamber” is doing work here). In fact, the volume of the SG 25 Ultra is 50% greater than the SG 25 (granted, some of that space is for housing its pen), which allows for better heat dissipation.
Two, the size of the device allows architectural flexibility within the chassis for optimal antennae placements. This is assuming that the antennae are the same across all three models, from a supply chain and manufacturing perspective. But, one could imagine putting larger antennae in larger devices as well if the model’s volume supported incremental unit costs at scale.
Three, a larger device has more space to be held in one’s hand. When we hold a phone (and hold it up to our head), we are blocking wireless signals. This blocking – attenuation – affects performance, which is familiar to everyone in more obvious situations like when parking underground. Depending on where the S25 Ultra is held (remember antennagate?), the antenna is less likely to be covered than it would be on the smaller S25.
(The same size-performance pattern exists with the S24 family)
Representing the best network signal conditions, the 90th percentile speed rips across all mobile service providers, with the fastest again from Speedtest users on the Ultra.
While on the other end, the slower download speeds are still very serviceable at the 10th percentile on any of these devices and mobile providers.
Upload Speeds
Samsung Galaxy Upload Speeds (Mbps)
Speedtest Intelligence® | February – March 2025
UL speed 50/90/10 by AT&T/T-Mobile/Verizon
Median upload speeds exhibit the same pattern seen with download speeds, where the device performance is better with each step-up in model. The range of upload speeds is much tighter than download, and there is very little difference between the S25+ and S25 Ultra on its respective mobile service provider.
The faster upload speeds of the 90th percentile are in a generally similar range across all S25 models on its respective mobile service provider.
As we saw across the Galaxy S generations, the 10th percentile upload speeds are quite slow to the cusp of being unusable for some applications like video calls, perhaps save the S25 Ultra. Again, T-Mobile’s S25 Ultra has PC 1.5 enabled which appears to be contributing to better performance.
Conclusion
In wireless technology, the generations (the “G’s”) run a course lasting about ten-years long before the next new generation launches. 5G launched six years ago, so there are many people who still have their first 5G phone. If that describes you, then now is a good time to upgrade to experience the technology gains that have accumulated in the wireless networks and in the latest Galaxy S25 family.
The S25 and S25+ phones are fast, but if you don’t mind the larger size of the S25 Ultra and can afford its higher price (tariffs not withstanding), then it is the top performer in Speedtest data. It’s Ultra fast.
Ookla retains ownership of this article including all of the intellectual property rights, data, content graphs and analysis. This article may not be quoted, reproduced, distributed or published for any commercial purpose without prior consent. Members of the press and others using the findings in this article for non-commercial purposes are welcome to publicly share and link to report information with attribution to Ookla.
Kerry Baker leads Ookla's research and content efforts in North America. He has over 20 years experience in the telecom industry, primarily at T-Mobile studying network performance benchmarking and customer experience. Kerry also has founder’s experience with four technology-related startups. Kerry holds masters degrees from the University of Washington in Business and International Political Economics.