
Every telecommunications provider faces the challenge of customer churn — the rate at which subscribers cancel or switch providers over a given time period. While churn is inevitable, it isn’t cheap. Industry studies consistently show that acquiring a new customer costs 5 to 25 times more than keeping an existing one. Despite this economic reality, many internet providers struggle to identify the specific factors that drive customers to switch services.
As new technologies like 5G and Fiber to the Home (FTTH) transform the telecommunications landscape, providers need to look beyond traditional metrics like download speed to understand and improve customer satisfaction. Network responsiveness and the quality of everyday connected experiences – like video conferencing, streaming movies, and online gaming – play crucial roles in retaining customers. But without access to granular data and insights into these actual user experiences, providers risk misallocating resources and missing opportunities to address the true drivers of churn.

Ookla’s crowdsourced data provides these key insights by capturing both Quality of Experience (QoE) and Quality of Service (QoS) metrics, along with provider ratings and Net Promoter Scores (NPS), to reveal the reasons behind customer churn. In this article, we’ll explore how these comprehensive measurements help providers pinpoint churn factors, improve retention strategies, and optimize user experiences. For a deeper dive, check out our webinar “Why Customers Leave: Preventing Churn with Crowdsourced Data.”
The Connection Between Network Performance and Customer Retention
Customer decisions to stay or leave are heavily influenced by network performance. While promotional offers and pricing strategies play a role in these decisions, long-term retention also depends on delivering a fast, consistent, and responsive experience. Providers that fall short risk losing subscribers to competitors that consistently meet customer expectations.
A recent Ookla analysis revealed a striking pattern across the United States: providers with higher percentages of low-latency connections consistently achieve better customer satisfaction scores and higher retention rates than those with slower, less responsive networks. The impact of low latency on customer loyalty is particularly clear when looking at customer satisfaction for users on fiber compared to those on non-fiber networks:
- Fiber networks averaged a 3.84 customer rating (on a 5-point scale) versus 3.17 for non-fiber connections.
- Net Promoter Score (NPS) — a standard customer loyalty metric that measures willingness to recommend a company on a scale from 0-10 — showed an even more dramatic difference, with fiber networks achieving positive scores of around +20 while non-fiber networks averaged -16.5.
While providers have traditionally emphasized download speed in their marketing and performance assessments, our data shows that latency may play an even bigger role in keeping customers happy and reducing churn.
Beyond Speed: Understanding QoS and QoE Metrics
For decades, the telecommunications industry has typically focused on a single metric — download speed — as the primary measure of network quality. With download speed often viewed as a proxy for overall bandwidth, the assumption was that more bandwidth would generally lead to a better user experience.
However, speed alone doesn’t fully explain why customers with objectively fast connections can still experience issues like slow video buffering, delays in real-time applications, or inconsistent app performance. Other network factors — particularly latency — can significantly contribute to these problems, often leading to user frustration and, in some cases, prompting them to switch providers.
That’s why it’s crucial for providers to gain a more holistic view of performance that reflects how customers actually experience their network in daily life. Ookla collects this comprehensive data through two complementary approaches:
Quality of Service (QoS): Measuring What Networks Deliver
Quality of Service measures the technical aspects of network performance that affect user experience, including speed and latency, which influence how well a network can deliver a smooth, consistent connection.
QoS is measured when users actively run a Speedtest. These tests capture key network performance metrics, including:
- Download and upload speeds (measuring network capacity)
- Latency and jitter (measuring network responsiveness)
- Network provider identification and connection type (mobile, fixed, Wi-Fi)
Quality of Experience (QoE): Measuring Real-World User Experiences
Quality of Experience metrics examine how users actually experience the network during everyday digital activities. These metrics provide insights into how various network types perform across key performance indicators that directly impact user satisfaction. From streaming Netflix and video chatting with colleagues to competing in online games, network performance plays a significant role in shaping the user experience.
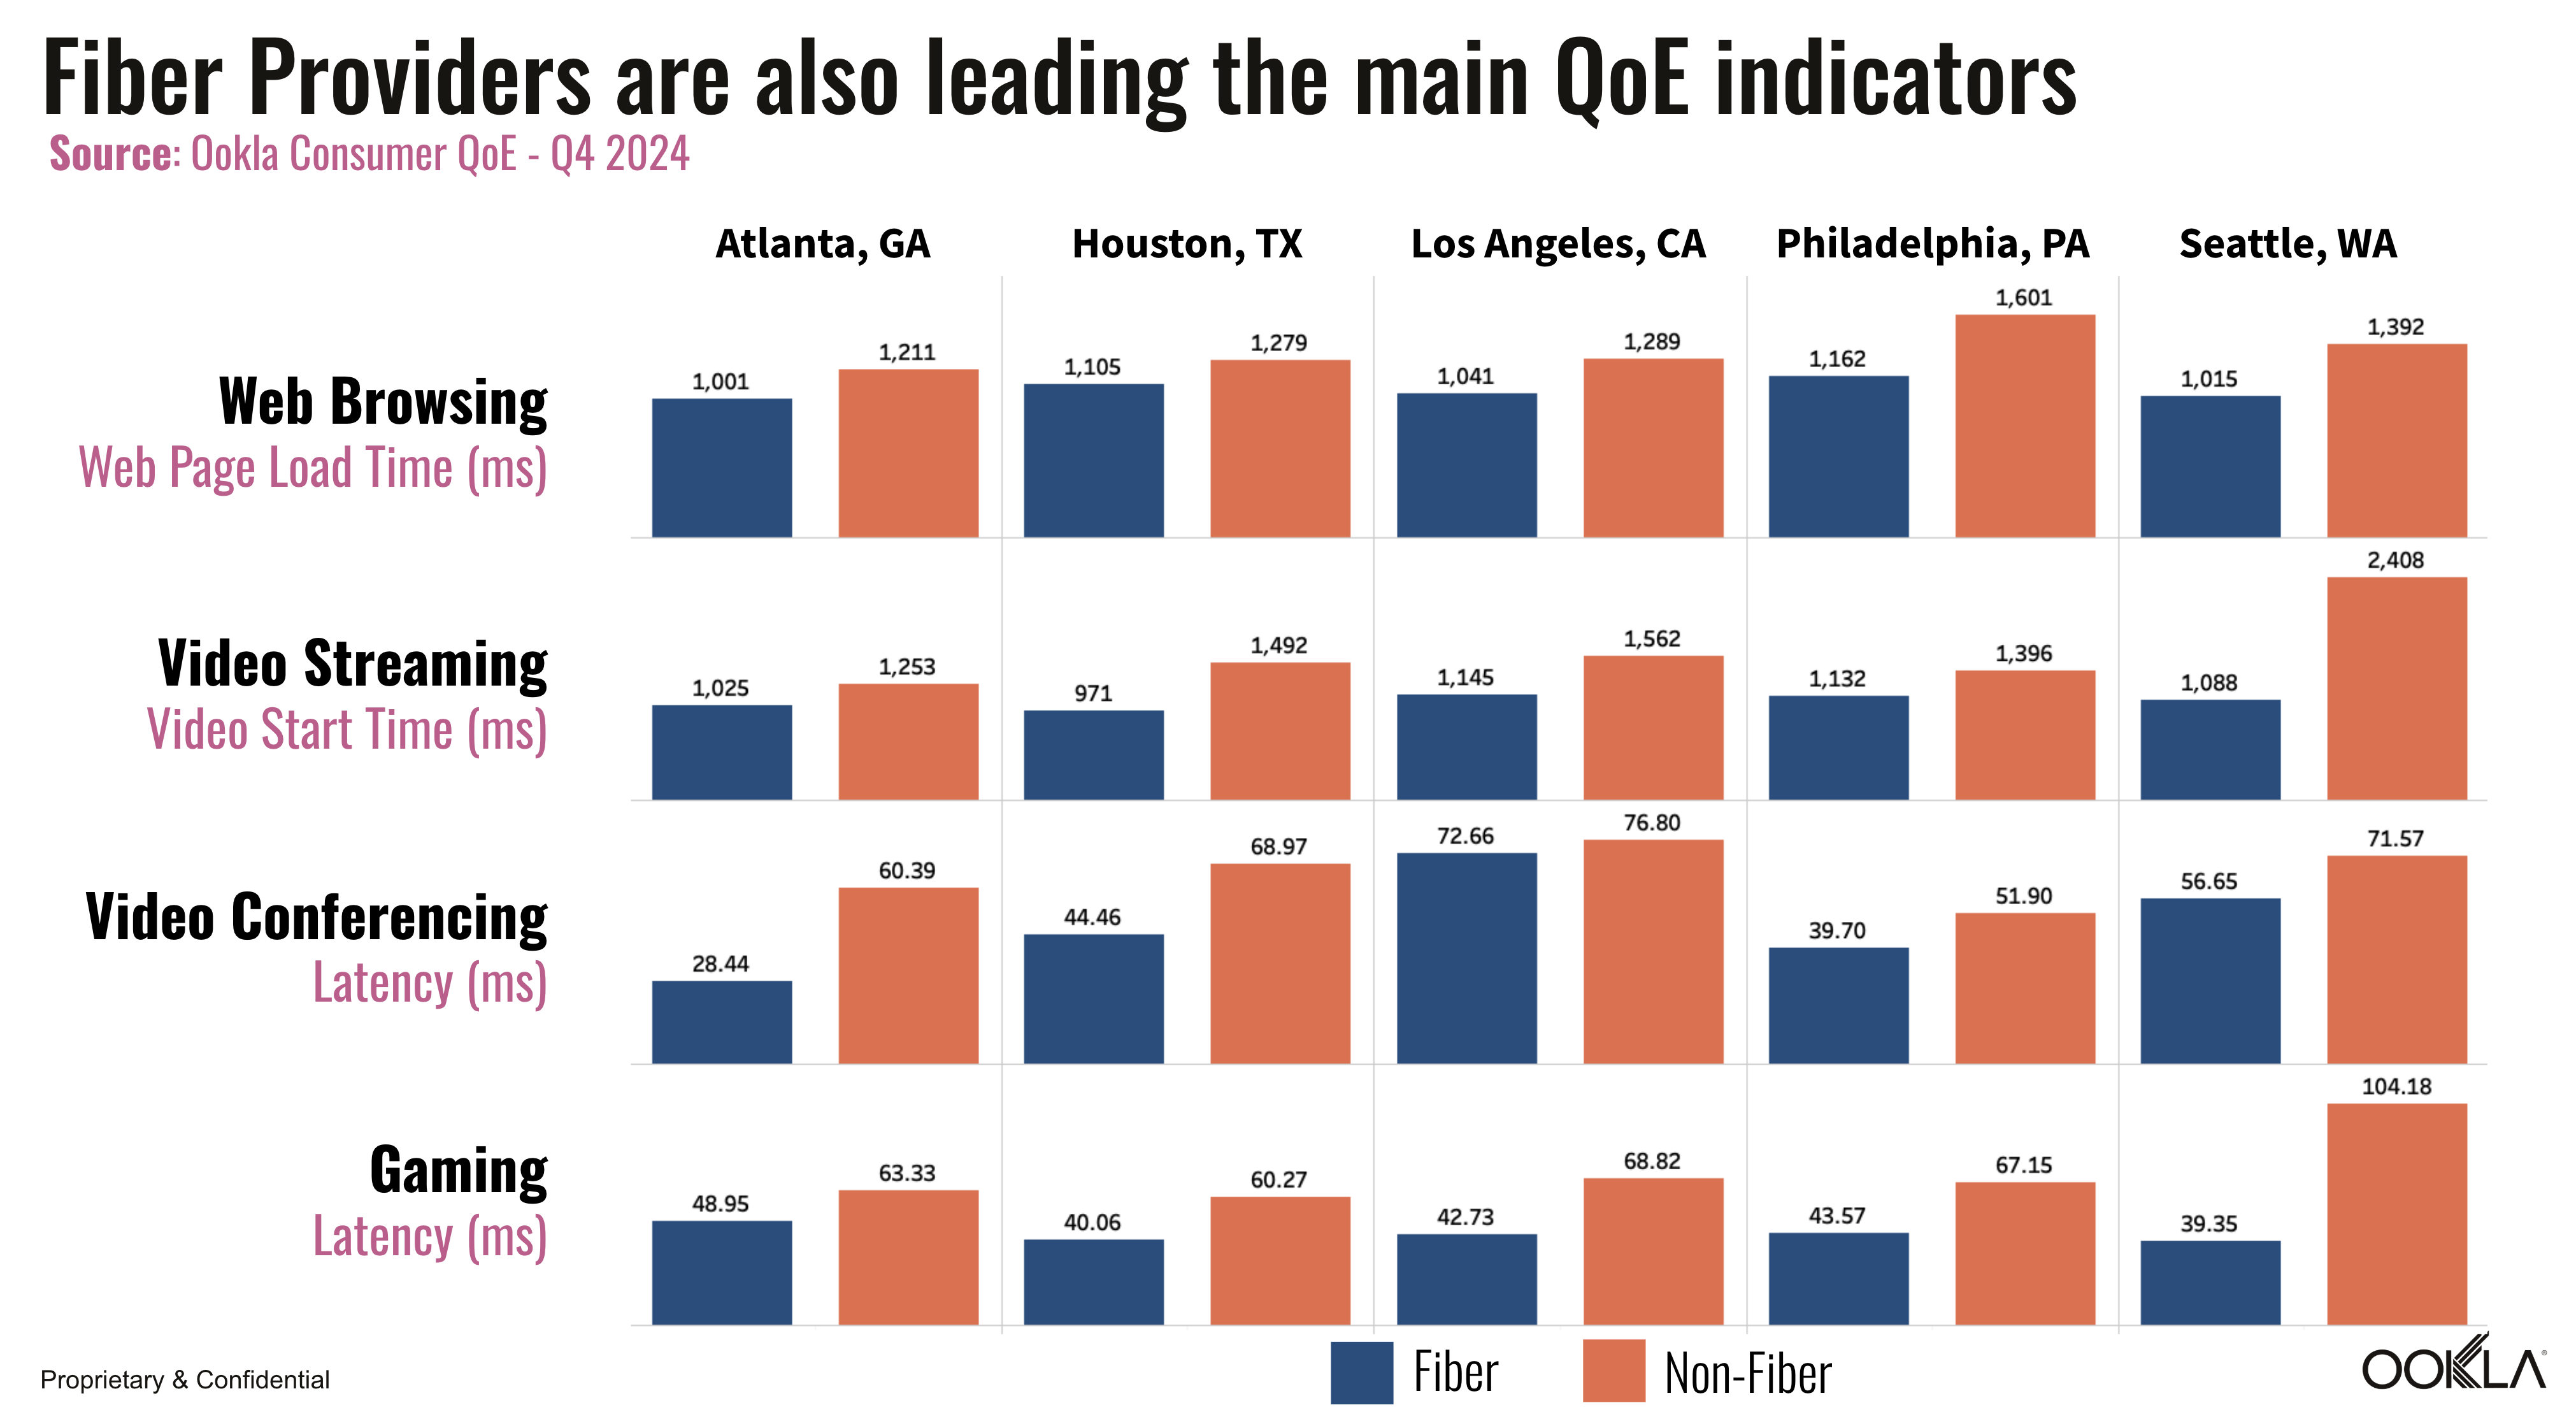
QoE metrics are primarily collected through Ookla’s embedded SDK across hundreds of applications in the digital ecosystem, measuring performance across various network types, including fiber and non-fiber connections. Here are some notable performance differences observed between fiber and non-fiber networks based on QoE metrics:
- Video streaming: Metrics like video start time show significant differences between network types, with fiber connections averaging 1.47 seconds versus 1.76 seconds for non-fiber, a 16% improvement that reduces buffering when starting videos or changing resolutions.
- Web browsing: Page load times on fiber networks averaged 1.12 seconds compared to 1.35 seconds for non-fiber, a 17% faster experience that adds up to significant time savings during extended browsing sessions.
- Video conferencing: Across Zoom, Google Meet, Microsoft Teams, and WhatsApp, fiber networks delivered conferencing latency of 51.56 ms versus 79.43 ms for non-fiber, a 35% improvement that, combined with other network factors, contributes to more consistent video and audio quality.
- Gaming: Lower latency in fiber networks can create substantial competitive advantages in gaming. Ookla data shows fiber networks deliver gaming latency improvements ranging from 22.8% in Atlanta (48.95 ms vs 63.33 ms) to 62.2% in Seattle (39.35 ms vs 104.18 ms). For gamers, milliseconds matter – faster network response means more immediate reactions to controls, giving players a smoother experience and potential edge.
No one likes a laggy game, a frozen video call, or a sluggish webpage — and when frustration piles up, customers often start looking for a better option. Ookla’s QoE and QoS insights can help providers stay ahead of customer experience issues and make the kinds of improvements that keep users happy.
Understanding Churn: Where Customers Go and Why They Leave
It’s not enough to know that customers are leaving — providers need to know where they’re going and why. Traditional churn metrics only tell you that subscribers are switching, but they typically don’t reveal which competitors are gaining them or which locations are most affected.
That’s where Ookla’s Net Flow Percentage analysis comes in. By tracking aggregated, anonymized user data, providers can pinpoint exactly where they’re losing customers, find patterns in subscriber movement, and see how network performance correlates with subscriber losses or gains. Net Flow Percentage analysis helps providers:
- Identify location patterns by analyzing service areas with changing usage trends
- Observe provider transitions to understand shifts in market share over time
- Calculate Net Flow percentage as the difference between users gained and users lost in a given area
When combined with performance metrics, Net Flow Percentage analysis offers key correlations that can guide targeted technical improvements where they’ll have the greatest impact on retention, while also revealing potential reasons behind churn.
How ISPs Can Prevent Churn
Providers can no longer afford to simply react to customer churn; they must be proactive in staying ahead of potential issues and actively fostering loyalty. Strategies that focus on continuously enhancing the customer experience are now essential. Ookla’s data provides valuable competitive benchmarking and insights to help identify and prioritize areas for optimization. Using this information, providers can deliver a high-quality user experience that minimizes churn and strengthens long-term customer relationships.
With data-driven insights, ISPs can focus on strategies to improve customer retention:
- Fiber Deployment (FTTH) Expansion: High-performing fiber networks consistently deliver faster speeds and more reliable performance compared to non-fiber alternatives, providing a superior experience that helps reduce churn.
- Low Latency: Providing users with consistently low latency is crucial for ensuring a smooth and responsive network experience, particularly for activities like video conferencing, gaming, and web browsing. Providers that deliver low latency tend to see higher customer satisfaction and reduced churn.
- Quality of Experience Optimization and Proactive Monitoring: QoE metrics track critical user experience factors like video start times and service stability, allowing providers to monitor and address issues proactively, preventing dissatisfaction and minimizing churn risks.
Implementing proactive strategies to reduce churn enables ISPs to enhance customer satisfaction and build lasting loyalty, providing a strong competitive edge in the fast-evolving telecom industry.
Turning Insights into Action: Real-World Examples of Churn Prevention
Understanding why and where customers leave is only valuable if it leads to proactive, targeted action. Ookla’s analysis has pinpointed several examples where granular insights into network performance, user behavior, and technology gaps directly guided providers to address the root causes of churn:
- Tackling Performance Issues: Small performance degradations can drive major customer losses. One provider observed that a 25% increase in YouTube and Google loading times coincided with significant customer departures. After network infrastructure upgrades at key connection points, web performance improved and customer retention stabilized.
- Addressing Network Technology Gaps: Disparities in technology can significantly impact customer decisions. Data from Houston showed fiber networks delivering 10x faster speeds than non-fiber alternatives (477 Mbps vs. 47 Mbps), while users in Seattle experienced dramatically higher latency on non-fiber networks.
- Leveraging Early Infrastructure Investments: Providers who deployed fiber early captured significant market share that continues to grow. This underscores the importance of timely network upgrades and the need for providers to accelerate fiber deployments, optimize latency, and consistently enhance the quality of experience to maintain competitive advantage.
While customer churn remains a major concern among telecom providers, those who leverage crowdsourced data to identify specific performance issues and technology gaps gain a decisive advantage. The key is targeting investments with precision, creating a virtuous cycle — better performance drives higher satisfaction, reduced churn, and ultimately stronger returns on infrastructure investments.
Conclusion: Using Data-Driven Insights Reduce Churn
The bottom line is that keeping customers is much cheaper than replacing them. That’s why understanding why they leave — and taking steps to prevent it — is so critical. By leveraging insights from Ookla’s QoS and QoE data, providers can gain a comprehensive understanding of both network performance and its impact on real-world user satisfaction.
With a clearer picture of the factors that drive churn, providers can address issues like slow speeds, high latency, and inconsistent experiences. Providers that invest in fiber, consistently deliver low latency, and proactively monitor QoE are better positioned to keep their customers happy — and prevent churn.

For more on how Ookla’s crowdsourced data can help your enterprise reduce churn, reach out to our team! And if you want a deeper dive into applying these insights to your strategy, check out our recent webinar “Why Customers Leave: Preventing Churn with Crowdsourced Data.”
Ookla retains ownership of this article including all of the intellectual property rights, data, content graphs and analysis. This article may not be quoted, reproduced, distributed or published for any commercial purpose without prior consent. Members of the press and others using the findings in this article for non-commercial purposes are welcome to publicly share and link to report information with attribution to Ookla.
