| April 11, 2025

Keeping Customers Loyal: Data-Driven Strategies to Prevent Churn

Every telecommunications provider faces the challenge of customer churn — the rate at which subscribers cancel or switch providers over a given time period. While churn is inevitable, it isn’t cheap. Industry studies consistently show that acquiring a new customer costs 5 to 25 times more than keeping an existing one. Despite this economic reality, many internet providers struggle to identify the specific factors that drive customers to switch services.

As new technologies like 5G and Fiber to the Home (FTTH) transform the telecommunications landscape, providers need to look beyond traditional metrics like download speed to understand and improve customer satisfaction. Network responsiveness and the quality of everyday connected experiences – like video conferencing, streaming movies, and online gaming – play crucial roles in retaining customers. But without access to granular data and insights into these actual user experiences, providers risk misallocating resources and missing opportunities to address the true drivers of churn.

Ookla’s crowdsourced data provides these key insights by capturing both Quality of Experience (QoE) and Quality of Service (QoS) metrics, along with provider ratings and Net Promoter Scores (NPS), to reveal the reasons behind customer churn. In this article, we’ll explore how these comprehensive measurements help providers pinpoint churn factors, improve retention strategies, and optimize user experiences. For a deeper dive, check out our webinar “Why Customers Leave: Preventing Churn with Crowdsourced Data.”

The Connection Between Network Performance and Customer Retention

Customer decisions to stay or leave are heavily influenced by network performance. While promotional offers and pricing strategies play a role in these decisions, long-term retention also depends on delivering a fast, consistent, and responsive experience. Providers that fall short risk losing subscribers to competitors that consistently meet customer expectations.

A recent Ookla analysis revealed a striking pattern across the United States: providers with higher percentages of low-latency connections consistently achieve better customer satisfaction scores and higher retention rates than those with slower, less responsive networks. The impact of low latency on customer loyalty is particularly clear when looking at customer satisfaction for users on fiber compared to those on non-fiber networks:

  • Fiber networks averaged a 3.84 customer rating (on a 5-point scale) versus 3.17 for non-fiber connections.
  • Net Promoter Score (NPS) — a standard customer loyalty metric that measures willingness to recommend a company on a scale from 0-10 — showed an even more dramatic difference, with fiber networks achieving positive scores of around +20 while non-fiber networks averaged -16.5.

While providers have traditionally emphasized download speed in their marketing and performance assessments, our data shows that latency may play an even bigger role in keeping customers happy and reducing churn.

Beyond Speed: Understanding QoS and QoE Metrics

For decades, the telecommunications industry has typically focused on a single metric — download speed — as the primary measure of network quality. With download speed often viewed as a proxy for overall bandwidth, the assumption was that more bandwidth would generally lead to a better user experience.

However, speed alone doesn’t fully explain why customers with objectively fast connections can still experience issues like slow video buffering, delays in real-time applications, or inconsistent app performance. Other network factors — particularly latency — can significantly contribute to these problems, often leading to user frustration and, in some cases, prompting them to switch providers. 

That’s why it’s crucial for providers to gain a more holistic view of performance that reflects how customers actually experience their network in daily life. Ookla collects this comprehensive data through two complementary approaches:

Quality of Service (QoS): Measuring What Networks Deliver

Quality of Service measures the technical aspects of network performance that affect user experience, including speed and latency, which influence how well a network can deliver a smooth, consistent connection.

QoS is measured when users actively run a Speedtest. These tests capture key network performance metrics, including:

  • Download and upload speeds (measuring network capacity)
  • Latency and jitter (measuring network responsiveness)
  • Network provider identification and connection type (mobile, fixed, Wi-Fi)

Quality of Experience (QoE): Measuring Real-World User Experiences

Quality of Experience metrics examine how users actually experience the network during everyday digital activities. These metrics provide insights into how various network types perform across key performance indicators that directly impact user satisfaction. From streaming Netflix and video chatting with colleagues to competing in online games, network performance plays a significant role in shaping the user experience.

QoE metrics are primarily collected through Ookla’s embedded SDK across hundreds of applications in the digital ecosystem, measuring performance across various network types, including fiber and non-fiber connections. Here are some notable performance differences observed between fiber and non-fiber networks based on QoE metrics:

  • Video streaming: Metrics like video start time show significant differences between network types, with fiber connections averaging 1.47 seconds versus 1.76 seconds for non-fiber, a 16% improvement that reduces buffering when starting videos or changing resolutions.
  • Web browsing: Page load times on fiber networks averaged 1.12 seconds compared to 1.35 seconds for non-fiber, a 17% faster experience that adds up to significant time savings during extended browsing sessions.
  • Video conferencing: Across Zoom, Google Meet, Microsoft Teams, and WhatsApp, fiber networks delivered conferencing latency of 51.56 ms versus 79.43 ms for non-fiber, a 35% improvement that, combined with other network factors, contributes to more consistent video and audio quality.
  • Gaming: Lower latency in fiber networks can create substantial competitive advantages in gaming. Ookla data shows fiber networks deliver gaming latency improvements ranging from 22.8% in Atlanta (48.95 ms vs 63.33 ms) to 62.2% in Seattle (39.35 ms vs 104.18 ms). For gamers, milliseconds matter – faster network response means more immediate reactions to controls, giving players a smoother experience and potential edge.

No one likes a laggy game, a frozen video call, or a sluggish webpage — and when frustration piles up, customers often start looking for a better option. Ookla’s QoE and QoS insights can help providers stay ahead of customer experience issues and make the kinds of improvements that keep users happy.

Understanding Churn: Where Customers Go and Why They Leave

It’s not enough to know that customers are leaving — providers need to know where they’re going and why. Traditional churn metrics only tell you that subscribers are switching, but they typically don’t reveal which competitors are gaining them or which locations are most affected.

That’s where Ookla’s Net Flow Percentage analysis comes in. By tracking aggregated, anonymized user data, providers can pinpoint exactly where they’re losing customers, find patterns in subscriber movement, and see how network performance correlates with subscriber losses or gains. Net Flow Percentage analysis helps providers:

  • Identify location patterns by analyzing service areas with changing usage trends
  • Observe provider transitions to understand shifts in market share over time
  • Calculate Net Flow percentage as the difference between users gained and users lost in a given area

When combined with performance metrics, Net Flow Percentage analysis offers key correlations that can guide targeted technical improvements where they’ll have the greatest impact on retention, while also revealing potential reasons behind churn. 

How ISPs Can Prevent Churn

Providers can no longer afford to simply react to customer churn; they must be proactive in staying ahead of potential issues and actively fostering loyalty. Strategies that focus on continuously enhancing the customer experience are now essential. Ookla’s data provides valuable competitive benchmarking and insights to help identify and prioritize areas for optimization. Using this information, providers can deliver a high-quality user experience that minimizes churn and strengthens long-term customer relationships.

With data-driven insights, ISPs can focus on strategies to improve customer retention:

  • Fiber Deployment (FTTH) Expansion: High-performing fiber networks consistently deliver faster speeds and more reliable performance compared to non-fiber alternatives, providing a superior experience that helps reduce churn.
  • Low Latency: Providing users with consistently low latency is crucial for ensuring a smooth and responsive network experience, particularly for activities like video conferencing, gaming, and web browsing. Providers that deliver low latency tend to see higher customer satisfaction and reduced churn.
  • Quality of Experience Optimization and Proactive Monitoring: QoE metrics track critical user experience factors like video start times and service stability, allowing providers to monitor and address issues proactively, preventing dissatisfaction and minimizing churn risks.

Implementing proactive strategies to reduce churn enables ISPs to enhance customer satisfaction and build lasting loyalty, providing a strong competitive edge in the fast-evolving telecom industry.

Turning Insights into Action: Real-World Examples of Churn Prevention

Understanding why and where customers leave is only valuable if it leads to proactive, targeted action. Ookla’s analysis has pinpointed several examples where granular insights into network performance, user behavior, and technology gaps directly guided providers to address the root causes of churn:

  • Tackling Performance Issues: Small performance degradations can drive major customer losses. One provider observed that a 25% increase in YouTube and Google loading times coincided with significant customer departures. After network infrastructure upgrades at key connection points, web performance improved and customer retention stabilized.
  • Addressing Network Technology Gaps: Disparities in technology can significantly impact customer decisions. Data from Houston showed fiber networks delivering 10x faster speeds than non-fiber alternatives (477 Mbps vs. 47 Mbps), while users in Seattle experienced dramatically higher latency on non-fiber networks.
  • Leveraging Early Infrastructure Investments: Providers who deployed fiber early captured significant market share that continues to grow. This underscores the importance of timely network upgrades and the need for providers to accelerate fiber deployments, optimize latency, and consistently enhance the quality of experience to maintain competitive advantage.

While customer churn remains a major concern among telecom providers, those who leverage crowdsourced data to identify specific performance issues and technology gaps gain a decisive advantage. The key is targeting investments with precision, creating a virtuous cycle — better performance drives higher satisfaction, reduced churn, and ultimately stronger returns on infrastructure investments.

Conclusion: Using Data-Driven Insights Reduce Churn

The bottom line is that keeping customers is much cheaper than replacing them. That’s why understanding why they leave — and taking steps to prevent it — is so critical. By leveraging insights from Ookla’s QoS and QoE data, providers can gain a comprehensive understanding of both network performance and its impact on real-world user satisfaction.

With a clearer picture of the factors that drive churn, providers can address issues like slow speeds, high latency, and inconsistent experiences. Providers that invest in fiber, consistently deliver low latency, and proactively monitor QoE are better positioned to keep their customers happy — and prevent churn.

Why customers leave: Preventing Churn

For more on how Ookla’s crowdsourced data can help your enterprise reduce churn, reach out to our team! And if you want a deeper dive into applying these insights to your strategy, check out our recent webinar “Why Customers Leave: Preventing Churn with Crowdsourced Data.”

Ookla retains ownership of this article including all of the intellectual property rights, data, content graphs and analysis. This article may not be quoted, reproduced, distributed or published for any commercial purpose without prior consent. Members of the press and others using the findings in this article for non-commercial purposes are welcome to publicly share and link to report information with attribution to Ookla.

| March 21, 2025

Bridging the Digital Divide: How Regulators Use Crowdsourced Data to Improve Rural Connectivity

Digital connectivity has become essential for modern life, with access to high-speed internet now allowing people to work remotely, access education, receive healthcare services, and participate in online commerce and banking. Yet a stark digital divide persists: while 40% of urban centers globally enjoy download speeds exceeding 100 Mbps (sufficient for most demanding online activities including HD video streaming and remote work), rural communities across the world — including in Africa, Central and Southern Asia often struggle with slow connectivity or none at all. These disparities can create profound differences in opportunity, limiting the potential for many communities worldwide.

To effectively address connectivity gaps, regulators and policymakers need granular, accurate data on real-world network performance, and that’s where data from Ookla® can help. Crowdsourced data from Ookla’s Speedtest® provides crucial insights into actual user experiences, helps identify underserved areas, tracks improvements, and holds service providers accountable for deployment promises.

In this article, we’ll examine the current state of global connectivity disparities, explore how the digital divide affects education, healthcare, and economic opportunities in underserved areas, and show how Egypt’s Decent Life Initiative is using data-driven approaches to transform rural connectivity. 

For a deeper look into these topics, including case studies and methodological insights from Ookla and the National Telecom Regulatory Authority (NTRA) of Egypt, watch our full webinar.

The State of Global Digital Connectivity

Effective solutions start with an accurate diagnosis. Before meaningful progress can be made in bridging the digital divide, stakeholders need precise data showing where connectivity gaps are widest and which communities are most affected. Without detailed mapping of these disparities, stakeholders risk directing investments to the wrong areas and missing chances to help those most in need. 

A study by the European Commission’s Joint Research Center, conducted in partnership with Ookla, revealed several key findings about global connectivity disparities:

  • Many countries in Africa lag significantly behind, with some regions experiencing median download speeds below 3 Mbps.
  • Broadband speeds vary dramatically between and within regions, with 40% of urban centers enjoying speeds over 100 Mbps while others struggle with basic connectivity.
  • A strong correlation exists between connectivity and economic development, with high-income countries enjoying significantly better broadband speeds.
  • In many countries in Africa and other developing regions, mobile networks are more widespread and better performing than fixed broadband networks.

These findings highlight the complex nature of the digital divide and the need for targeted approaches to address connectivity challenges in different regions. By mapping end-user speeds and coverage differences with precision, stakeholders can develop more effective interventions tailored to specific geographic and socioeconomic situations.

Map of Bridging the Digital Divide: Understanding the need

The Real Impact of the Digital Divide

Connectivity gaps aren’t just data points on a map – they represent real barriers that affect people’s everyday lives. When communities lack reliable internet access, they face serious disadvantages across multiple areas of life, as seen in Sub-Saharan Africa, where GSMA reports two-thirds of the population (710 million people) do not currently use mobile internet despite living within the footprint of a mobile broadband network. These impacts include:

  • Limited access to information directly affects civic participation, with disconnected communities unable to access government services, agricultural guidance, and essential public health information.
  • Educational inequality deepens when rural students cannot access digital learning resources and research materials or utilize remote learning options available to their urban counterparts.
  • Healthcare outcomes suffer as communities without reliable connectivity cannot benefit from telemedicine, remote diagnostics, or timely access to medical specialists.
  • Economic opportunities vanish when rural residents cannot participate in e-commerce, access online job markets, or utilize digital financial services

Addressing connectivity problems requires understanding not just where internet access is lacking, but how that absence affects real people in these communities. With this understanding, stakeholders can develop more effective strategies that prioritize the most impactful investments. 

Leveraging Crowdsourced Data for Better Connectivity

When making connectivity decisions, actual user experiences matter more than theoretical coverage maps. Regulators need to know where people are truly experiencing poor or great service, not just where internet providers claim to provide coverage. Ookla’s crowdsourced data reveals these real-world experiences, helping stakeholders make better decisions through several practical applications:

  • Creating precision maps of connectivity disparities by visualizing actual speeds geographically rather than relying on operator-reported coverage claims.
  • Identifying socioeconomic impacts through targeted research, such as the World Bank’s use of Ookla data to discover that 30% of areas near Brazilian educational facilities had inadequate speeds for effective e-learning.
  • Guiding evidence-based policy decisions, as demonstrated in the OECD’s analysis, revealed that rural fixed broadband speeds averaged 31% below national averages even in developed countries.
  • Establishing accountability frameworks, exemplified by South Carolina’s use of Ookla data to track rural-urban connectivity gaps and verify that providers delivered promised service improvements.

The examples from Brazil, OECD countries, and South Carolina demonstrate how empirical, user-generated data provides crucial insights that theoretical coverage models simply cannot offer. With such a granular understanding of actual network performance, regulators can target investments more precisely, measure progress accurately, and hold providers accountable for delivering on any promised improvements.

Graph of Crowdsourcing Helps with Strategic Planning

Case Study: Egypt’s Decent Life Initiative

Egypt’s ambitious Decent Life Project is a comprehensive national development program launched to improve the quality of life in rural areas, with telecommunications infrastructure as a key component. Launched in 2019, it demonstrates how data-driven planning, strategic investment, and public-private collaboration can transform rural connectivity at scale. This nationwide program tackles both coverage and quality issues in some of the country’s most underserved communities:

  • A comprehensive approach targeting 4,500 villages and directly impacting over 58 million Egyptians through improved infrastructure and services
  • Collaborative implementation involving more than 20 ministries, 23 civil society organizations, and numerous volunteers to address connectivity alongside other development needs
  • Strategic two-pillar telecommunications strategy focusing on mobile network expansion (establishing 1,096 new stations) and fiber optic deployment (targeting 2.8 million buildings)
  • Measurable improvements in download speeds across targeted governorates, documented via before-and-after performance testing using Ookla data
  • Innovative funding model combining government funding resources with private operator investments to share costs and accelerate deployment

With 80% of the first phase complete and plans to reach 99% mobile coverage by 2025, Egypt’s Decent Life Project demonstrates how targeted interventions can dramatically reduce rural-urban connectivity disparities. Egypt’s approach also underscores the power of coordinated action across government agencies, private sector partners, and civil society organizations. 

Best Practices for Addressing the Digital Divide

Successful digital divide initiatives like Egypt’s Decent Life Project and many others revealed a crucial insight: technical solutions alone cannot solve connectivity challenges when underlying economic, regulatory, and social barriers remain unaddressed.

Indeed, meaningful change occurs when comprehensive strategies align policy, funding, and technology toward clearly defined connectivity goals. Across initiatives aimed at narrowing the digital divide, several approaches consistently deliver positive results:

  • Data-centric planning that uses granular performance metrics to identify specific underserved areas rather than relying on broad regional generalizations
  • Technology diversity that combines mobile, fixed, and alternative technologies based on local geography, population density, and economic conditions
  • Collaborative funding frameworks that blend public resources with private investment to distribute costs and create appropriate incentives
  • Focus on outcomes rather than specific technologies, allowing solutions to adapt to local contexts and evolving capabilities
  • Parallel investment in digital literacy and relevant content to ensure infrastructure investments translate into actual adoption and usage
  • Continuous performance monitoring to maintain accountability, document improvements, and adjust strategies based on measured results

Practical experience from successful initiatives around the world shows that these elements form not just a theoretical framework but a proven roadmap for accelerating connectivity improvements. By combining data-driven planning, appropriate technology choices, innovative funding, and continuous performance monitoring, countries can make rapid progress even in challenging environments. 

Conclusion

Bridging the digital divide requires a comprehensive understanding of both coverage and usage gaps, strategic investment in infrastructure, and ongoing assessment of performance improvements. As demonstrated by Egypt’s Decent Life Project, crowdsourced data plays a critical role in guiding these efforts and measuring their impact.

When regulators leverage accurate, real-time performance data, they can more effectively address connectivity challenges and ensure digital resources are accessible to all communities. The result is not just improved network statistics but meaningful improvements in education, healthcare, economic opportunity, and quality of life.

For a more detailed examination of how regulators are using crowdsourced data to improve rural connectivity, including additional case studies and methodological insights, check out our recent webinar, “How Regulators Use Crowdsourced Data to Improve Connectivity in Underserved Rural Communities.”  


Ookla retains ownership of this article including all of the intellectual property rights, data, content graphs and analysis. This article may not be quoted, reproduced, distributed or published for any commercial purpose without prior consent. Members of the press and others using the findings in this article for non-commercial purposes are welcome to publicly share and link to report information with attribution to Ookla.

| January 14, 2025

The Hidden Power of Speedtest: Ookla Enterprise Solutions in Action

Every day, millions of people rely on Speedtest® to get the most accurate, trusted view of their real-world internet performance. Whether streaming 4K content out and about, looking for a reliable connection to work remotely, or managing a smart home hub of devices, people need to know if their connection can keep up with their needs. 

But end users aren’t the only ones that benefit from accurate, real-world connectivity testing information. Businesses, universities, healthcare facilities, and even the leading Internet service providers (ISPs) all use Speedtest to optimize their own networks.

At Ookla®, we sit at the intersection between the service providers tasked with designing and optimizing networks and the consumers that make use of those networks every day. Our insights not only help people choose a mobile or Wi-Fi service provider, we help organizations of every type optimize the networks and services they provide.

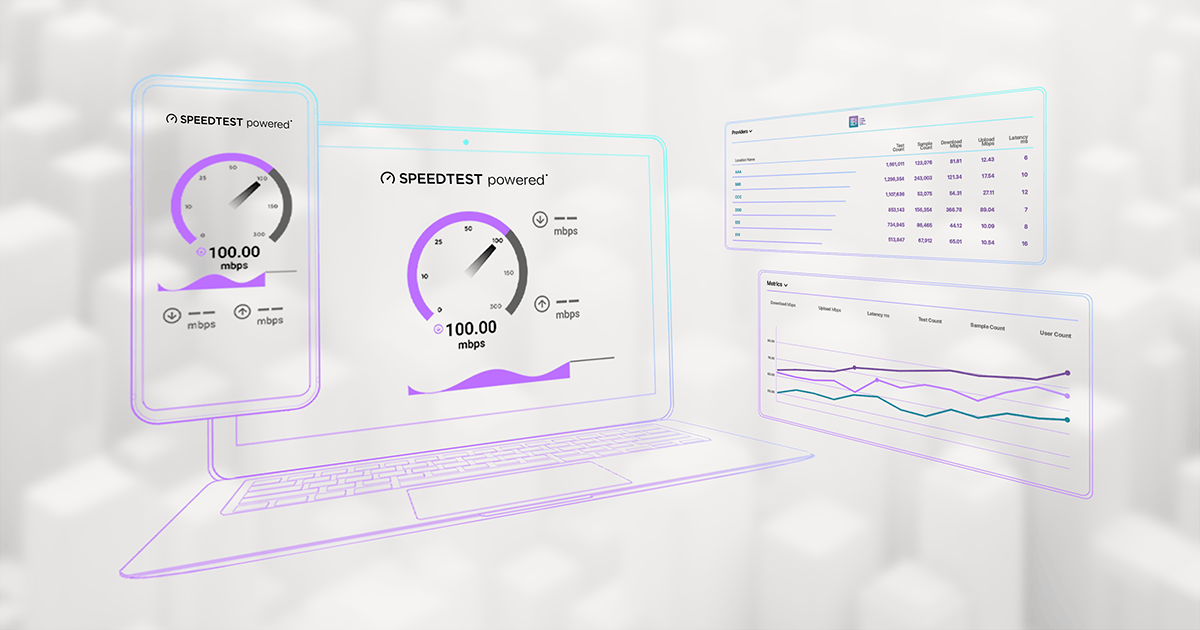
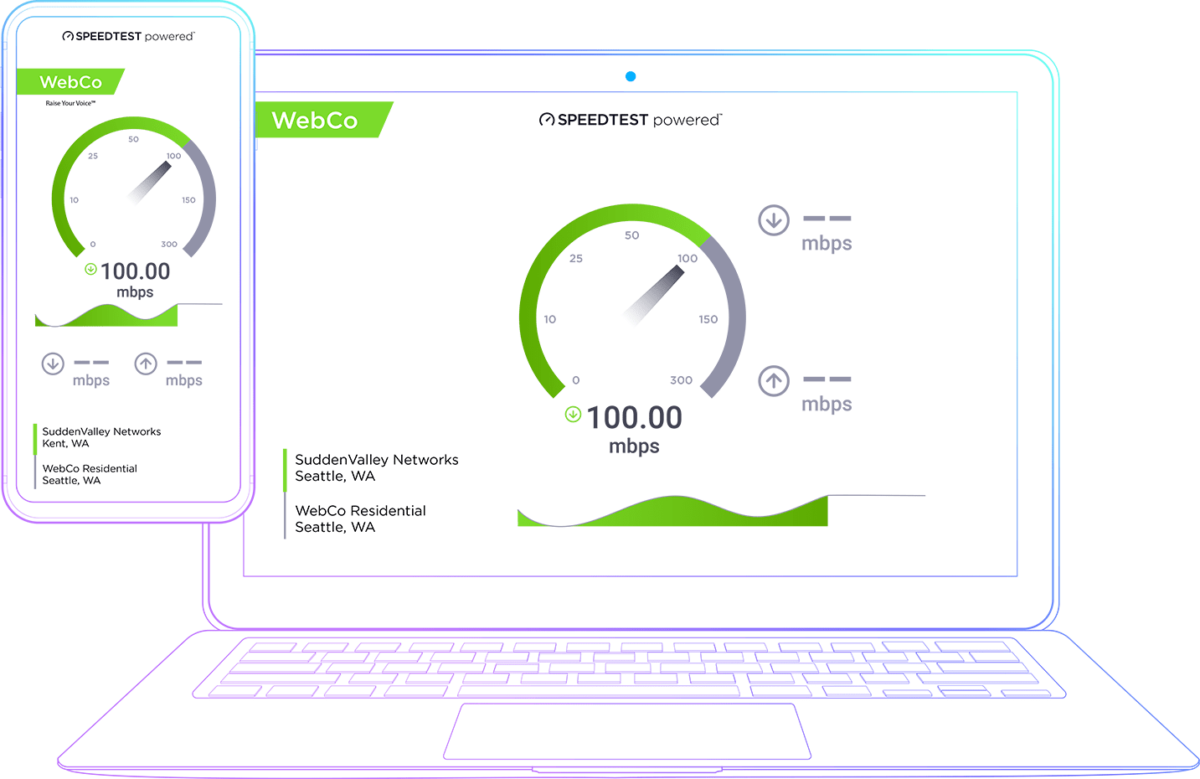
Speedtest Powered™ bridges the gap between these two worlds. As part of the enterprise side of Speedtest that most users never see, it encompasses three solutions — Speedtest Custom, Speedtest SDK, and Speedtest Embedded. These tools allow organizations to leverage the trusted testing capabilities that have made Speedtest the global standard for internet performance measurement while maintaining their unique brand identity. Enterprises rely on these solutions to solve connectivity challenges and deliver reliable service across every network touchpoint.

Let’s take a look at how different enterprises are putting these tools to work!

Real-World Data Making a Real-World Impact 

From education to aviation, organizations are integrating Speedtest capabilities directly into their systems to solve critical connectivity challenges. Here’s how they’re putting Speedtest Powered tools to work:

Enhanced Customer Experience for Airline In-Flight Connectivity

Many airlines offer in-flight Wi-Fi as a way for passengers to work or just consume some entertainment during their journey. Some even offer upgraded experiences with faster speeds or longer durations at an additional cost. To ensure the highest level of customer experience, airlines use Speedtest Embedded to consistently monitor Wi-Fi performance across their entire fleet. This solution enables real-time performance tracking and SLA verification, ensuring passengers receive the connectivity they expect (and at many times, pay for) at 35,000 feet. Airline IT teams can quickly identify and address connectivity issues, while flight crews have immediate visibility into network performance.

Remote Testing Solutions for Schools and Enhanced Work-from-Home Efficiency

A school district in a major city integrated Speedtest SDK into their student devices to support remote learning initiatives. With this capability, IT teams can monitor student connectivity without requiring manual testing, ensuring educational continuity and compliance with federal remote learning programs. The solution also helps the school district quickly identify and address connectivity challenges, enhancing both student success and operational efficiency. Similarly, enterprises use Speedtest Embedded to monitor connectivity performance across their remote workforce, enabling both automatic and on-demand testing to their private servers to ensure reliable work-from-home experiences.

Healthcare Innovation

A major healthcare system integrated Speedtest solutions across their operations to ensure reliable connectivity for critical medical services and remote staff. By implementing Speedtest Custom in their facilities, medical teams can verify network performance for bandwidth-intensive tasks like medical image transfers. Healthcare providers also use Speedtest Embedded to monitor connectivity for remote employees, ensuring their IT infrastructure supports seamless operations whether staff are on-site or working from home. This approach helps maintain operational efficiency while supporting the high-performance network demands of modern healthcare delivery.

5G Network Optimization 

A major 5G provider integrated Speedtest SDK into their customer-facing mobile app to gain comprehensive insights into network performance. The solution enables periodic measurements across consumer devices while allowing both customers and support teams to run on-demand tests. This allows the provider to collect over 200 data points — including device information, Wi-Fi details, connection metrics, and location data — helping optimize their 5G network deployment and identify areas needing coverage improvements.

Customer Care Evolution

Relaying experiential information to a customer care rep can be challenging for invisible mediums like cellular and Wi-Fi services. Terms like “slow,” “stuttery,” “sometimes not great,” are instantly cleared up with a simple Speedtest. A leading ISP integrated Speedtest Custom into their support workflow, empowering customers to verify their connection speeds while providing valuable data to internal support teams. This has reduced the need for on-site technician visits and enhanced customer satisfaction through more efficient problem diagnosis and troubleshooting.

Telecom Compliance and Optimization 

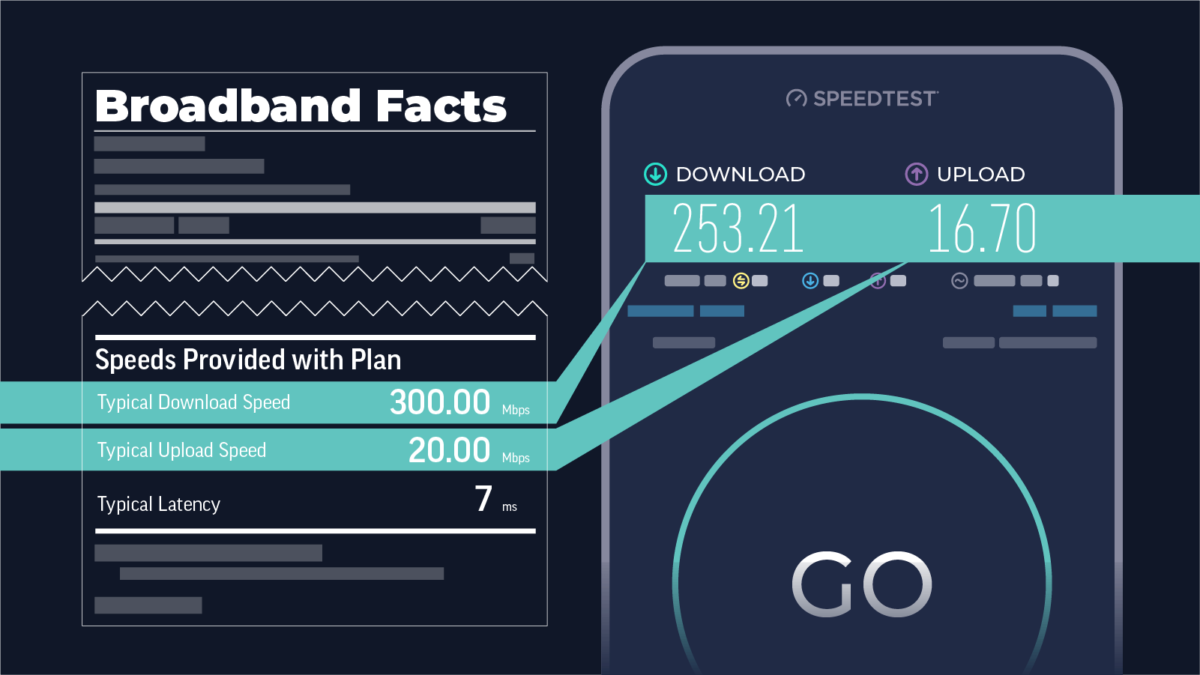
A mobile operator in Europe integrated Speedtest SDK into their mobile and web platforms to meet new regulatory requirements for subscriber speed reporting. The solution enabled users to test and report their speeds while providing the operator with comprehensive network performance insights. This breadth and depth of data — including device types, connection quality, and location information — helps the operator optimize their network, diagnose customer issues efficiently, and provide stakeholders with actionable information while meeting regulatory requirements.

Conclusion 

Speedtest isn’t just the tool millions use to check their home internet speeds — it’s also powering network measurement and optimization behind the scenes across multiple industries. 

Through Speedtest Powered solutions — Speedtest Custom, SDK, and Embedded — organizations can integrate trusted performance testing directly into their platforms while maintaining brand consistency. The result? Better data, better insights, and better customer experiences. 

Ready to bring the power of Speedtest to your organization? Visit our product page for a deeper look into our solutions, or reach out to learn more


Ookla retains ownership of this article including all of the intellectual property rights, data, content graphs and analysis. This article may not be quoted, reproduced, distributed or published for any commercial purpose without prior consent. Members of the press and others using the findings in this article for non-commercial purposes are welcome to publicly share and link to report information with attribution to Ookla.