| April 11, 2025

Keeping Customers Loyal: Data-Driven Strategies to Prevent Churn

Every telecommunications provider faces the challenge of customer churn — the rate at which subscribers cancel or switch providers over a given time period. While churn is inevitable, it isn’t cheap. Industry studies consistently show that acquiring a new customer costs 5 to 25 times more than keeping an existing one. Despite this economic reality, many internet providers struggle to identify the specific factors that drive customers to switch services.

As new technologies like 5G and Fiber to the Home (FTTH) transform the telecommunications landscape, providers need to look beyond traditional metrics like download speed to understand and improve customer satisfaction. Network responsiveness and the quality of everyday connected experiences – like video conferencing, streaming movies, and online gaming – play crucial roles in retaining customers. But without access to granular data and insights into these actual user experiences, providers risk misallocating resources and missing opportunities to address the true drivers of churn.

Ookla’s crowdsourced data provides these key insights by capturing both Quality of Experience (QoE) and Quality of Service (QoS) metrics, along with provider ratings and Net Promoter Scores (NPS), to reveal the reasons behind customer churn. In this article, we’ll explore how these comprehensive measurements help providers pinpoint churn factors, improve retention strategies, and optimize user experiences. For a deeper dive, check out our webinar “Why Customers Leave: Preventing Churn with Crowdsourced Data.”

The Connection Between Network Performance and Customer Retention

Customer decisions to stay or leave are heavily influenced by network performance. While promotional offers and pricing strategies play a role in these decisions, long-term retention also depends on delivering a fast, consistent, and responsive experience. Providers that fall short risk losing subscribers to competitors that consistently meet customer expectations.

A recent Ookla analysis revealed a striking pattern across the United States: providers with higher percentages of low-latency connections consistently achieve better customer satisfaction scores and higher retention rates than those with slower, less responsive networks. The impact of low latency on customer loyalty is particularly clear when looking at customer satisfaction for users on fiber compared to those on non-fiber networks:

  • Fiber networks averaged a 3.84 customer rating (on a 5-point scale) versus 3.17 for non-fiber connections.
  • Net Promoter Score (NPS) — a standard customer loyalty metric that measures willingness to recommend a company on a scale from 0-10 — showed an even more dramatic difference, with fiber networks achieving positive scores of around +20 while non-fiber networks averaged -16.5.

While providers have traditionally emphasized download speed in their marketing and performance assessments, our data shows that latency may play an even bigger role in keeping customers happy and reducing churn.

Beyond Speed: Understanding QoS and QoE Metrics

For decades, the telecommunications industry has typically focused on a single metric — download speed — as the primary measure of network quality. With download speed often viewed as a proxy for overall bandwidth, the assumption was that more bandwidth would generally lead to a better user experience.

However, speed alone doesn’t fully explain why customers with objectively fast connections can still experience issues like slow video buffering, delays in real-time applications, or inconsistent app performance. Other network factors — particularly latency — can significantly contribute to these problems, often leading to user frustration and, in some cases, prompting them to switch providers. 

That’s why it’s crucial for providers to gain a more holistic view of performance that reflects how customers actually experience their network in daily life. Ookla collects this comprehensive data through two complementary approaches:

Quality of Service (QoS): Measuring What Networks Deliver

Quality of Service measures the technical aspects of network performance that affect user experience, including speed and latency, which influence how well a network can deliver a smooth, consistent connection.

QoS is measured when users actively run a Speedtest. These tests capture key network performance metrics, including:

  • Download and upload speeds (measuring network capacity)
  • Latency and jitter (measuring network responsiveness)
  • Network provider identification and connection type (mobile, fixed, Wi-Fi)

Quality of Experience (QoE): Measuring Real-World User Experiences

Quality of Experience metrics examine how users actually experience the network during everyday digital activities. These metrics provide insights into how various network types perform across key performance indicators that directly impact user satisfaction. From streaming Netflix and video chatting with colleagues to competing in online games, network performance plays a significant role in shaping the user experience.

QoE metrics are primarily collected through Ookla’s embedded SDK across hundreds of applications in the digital ecosystem, measuring performance across various network types, including fiber and non-fiber connections. Here are some notable performance differences observed between fiber and non-fiber networks based on QoE metrics:

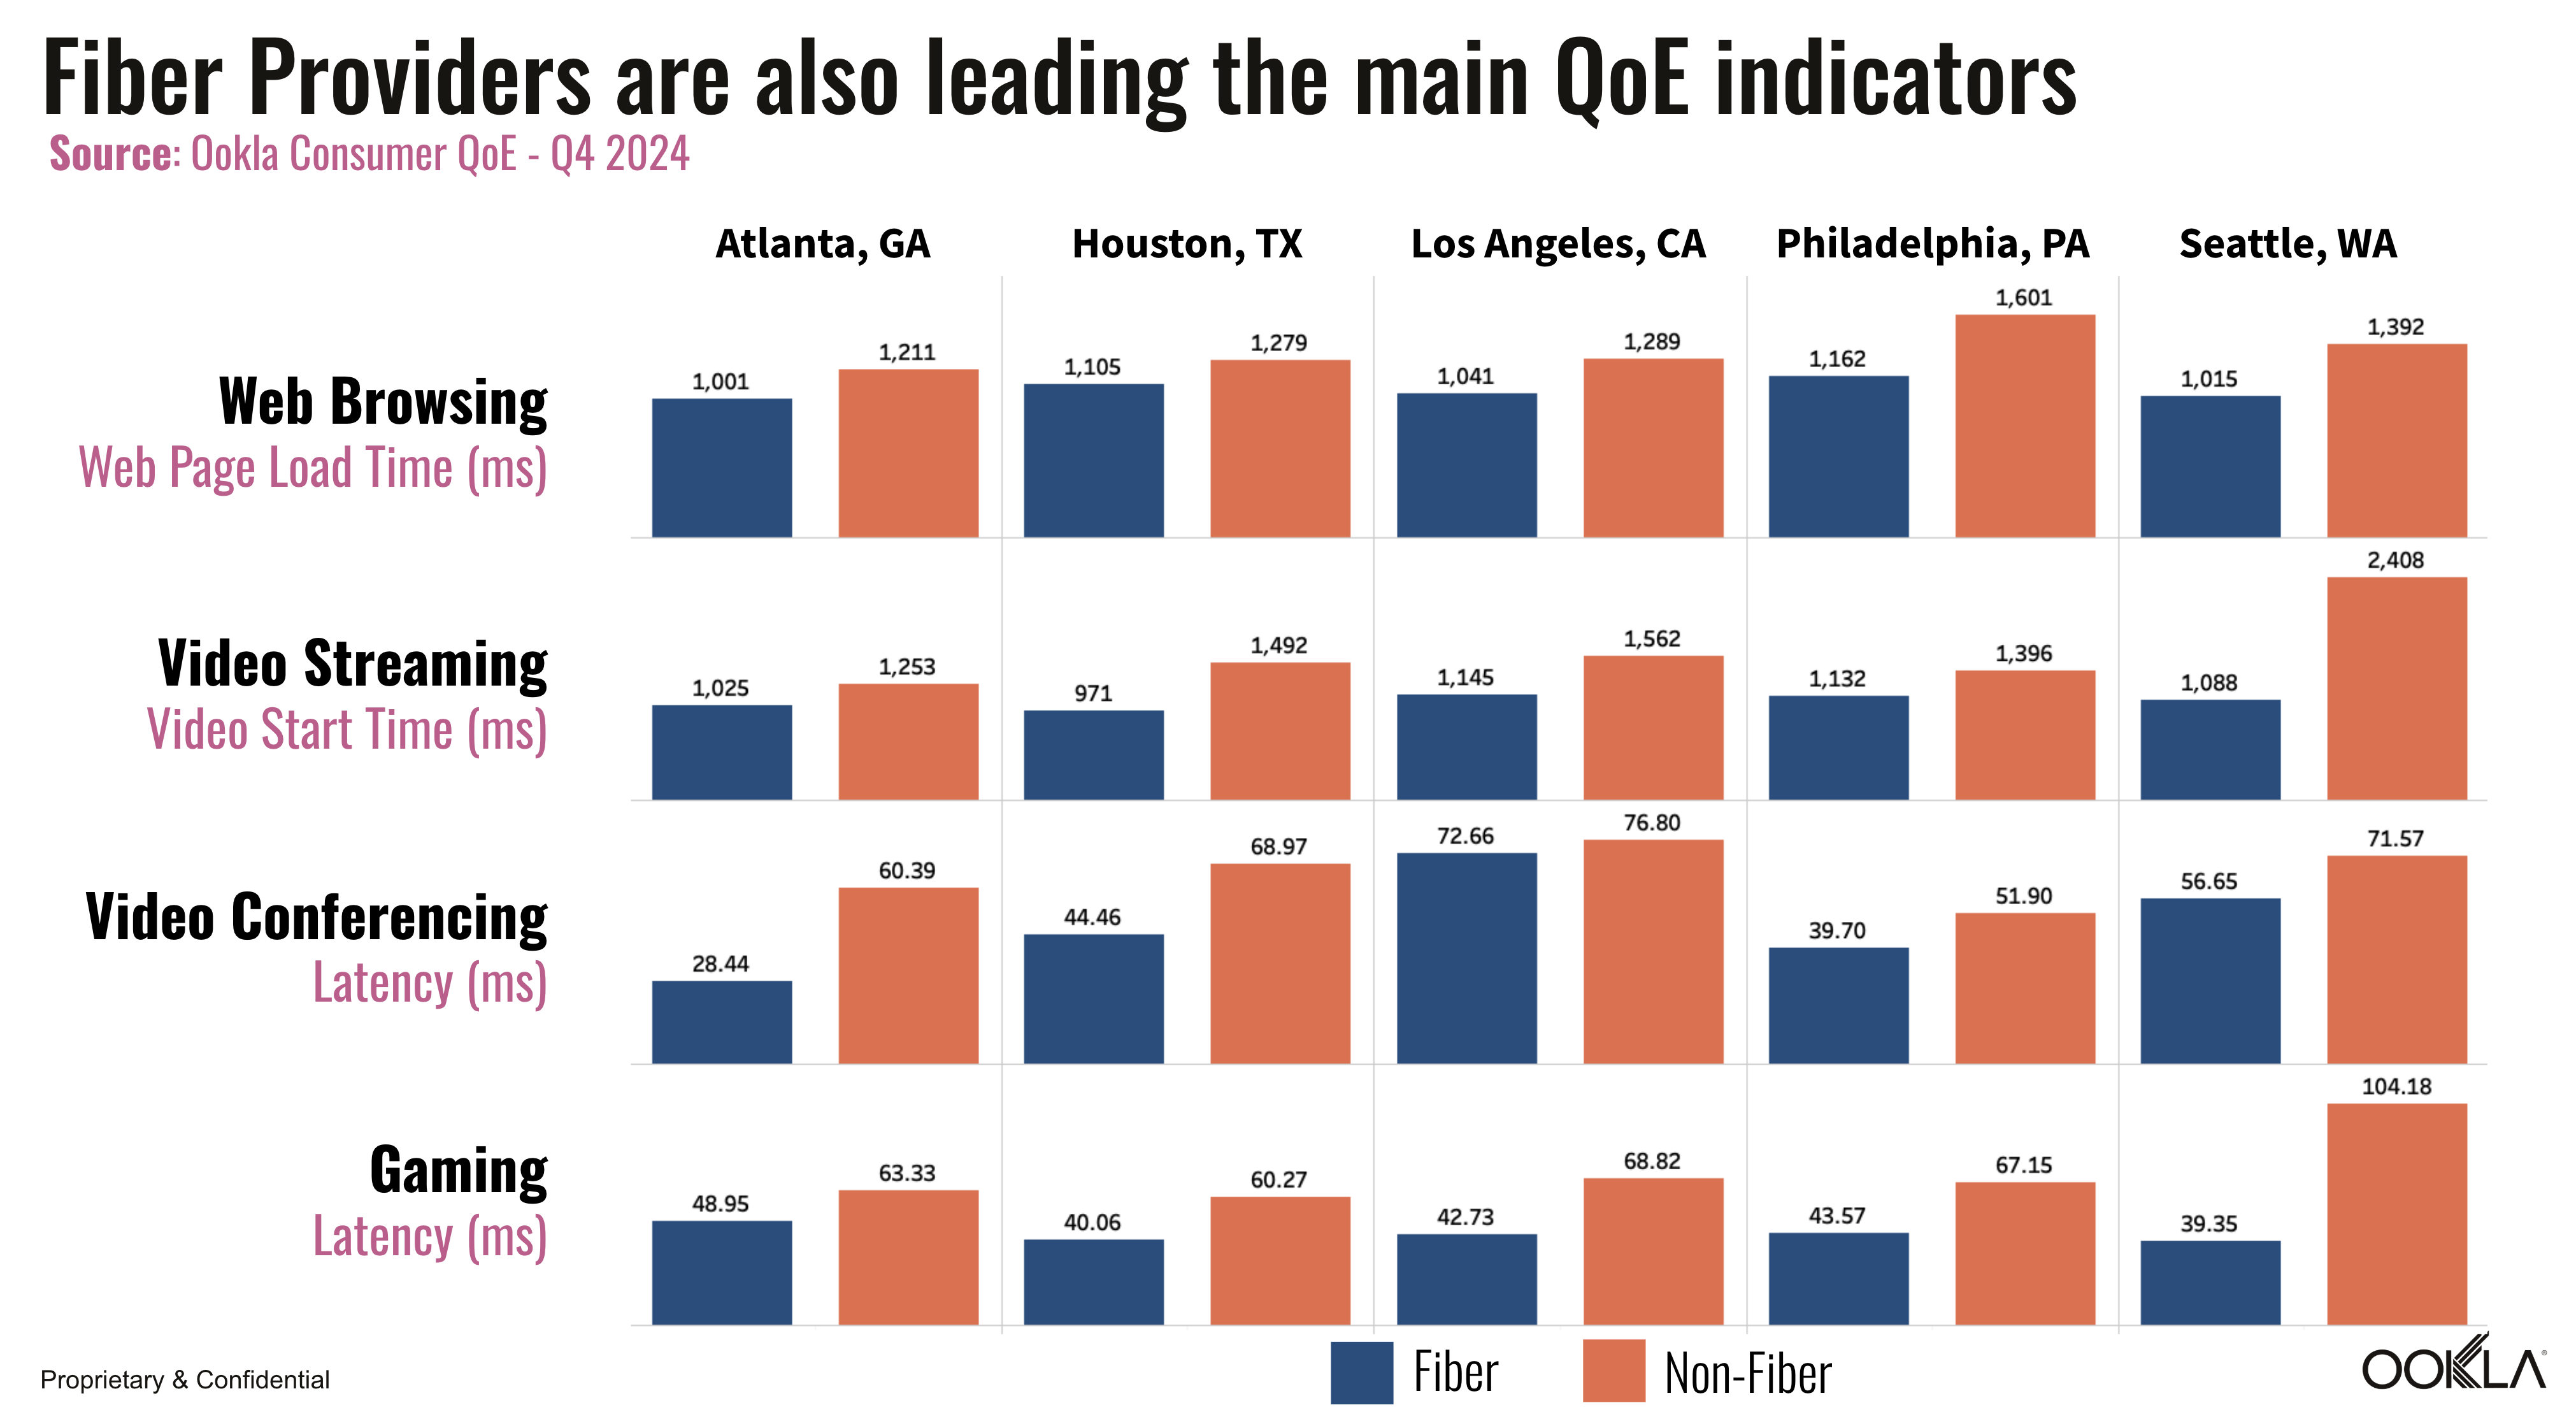
  • Video streaming: Metrics like video start time show significant differences between network types, with fiber connections averaging 1.47 seconds versus 1.76 seconds for non-fiber, a 16% improvement that reduces buffering when starting videos or changing resolutions.
  • Web browsing: Page load times on fiber networks averaged 1.12 seconds compared to 1.35 seconds for non-fiber, a 17% faster experience that adds up to significant time savings during extended browsing sessions.
  • Video conferencing: Across Zoom, Google Meet, Microsoft Teams, and WhatsApp, fiber networks delivered conferencing latency of 51.56 ms versus 79.43 ms for non-fiber, a 35% improvement that, combined with other network factors, contributes to more consistent video and audio quality.
  • Gaming: Lower latency in fiber networks can create substantial competitive advantages in gaming. Ookla data shows fiber networks deliver gaming latency improvements ranging from 22.8% in Atlanta (48.95 ms vs 63.33 ms) to 62.2% in Seattle (39.35 ms vs 104.18 ms). For gamers, milliseconds matter – faster network response means more immediate reactions to controls, giving players a smoother experience and potential edge.

No one likes a laggy game, a frozen video call, or a sluggish webpage — and when frustration piles up, customers often start looking for a better option. Ookla’s QoE and QoS insights can help providers stay ahead of customer experience issues and make the kinds of improvements that keep users happy.

Understanding Churn: Where Customers Go and Why They Leave

It’s not enough to know that customers are leaving — providers need to know where they’re going and why. Traditional churn metrics only tell you that subscribers are switching, but they typically don’t reveal which competitors are gaining them or which locations are most affected.

That’s where Ookla’s Net Flow Percentage analysis comes in. By tracking aggregated, anonymized user data, providers can pinpoint exactly where they’re losing customers, find patterns in subscriber movement, and see how network performance correlates with subscriber losses or gains. Net Flow Percentage analysis helps providers:

  • Identify location patterns by analyzing service areas with changing usage trends
  • Observe provider transitions to understand shifts in market share over time
  • Calculate Net Flow percentage as the difference between users gained and users lost in a given area

When combined with performance metrics, Net Flow Percentage analysis offers key correlations that can guide targeted technical improvements where they’ll have the greatest impact on retention, while also revealing potential reasons behind churn. 

How ISPs Can Prevent Churn

Providers can no longer afford to simply react to customer churn; they must be proactive in staying ahead of potential issues and actively fostering loyalty. Strategies that focus on continuously enhancing the customer experience are now essential. Ookla’s data provides valuable competitive benchmarking and insights to help identify and prioritize areas for optimization. Using this information, providers can deliver a high-quality user experience that minimizes churn and strengthens long-term customer relationships.

With data-driven insights, ISPs can focus on strategies to improve customer retention:

  • Fiber Deployment (FTTH) Expansion: High-performing fiber networks consistently deliver faster speeds and more reliable performance compared to non-fiber alternatives, providing a superior experience that helps reduce churn.
  • Low Latency: Providing users with consistently low latency is crucial for ensuring a smooth and responsive network experience, particularly for activities like video conferencing, gaming, and web browsing. Providers that deliver low latency tend to see higher customer satisfaction and reduced churn.
  • Quality of Experience Optimization and Proactive Monitoring: QoE metrics track critical user experience factors like video start times and service stability, allowing providers to monitor and address issues proactively, preventing dissatisfaction and minimizing churn risks.

Implementing proactive strategies to reduce churn enables ISPs to enhance customer satisfaction and build lasting loyalty, providing a strong competitive edge in the fast-evolving telecom industry.

Turning Insights into Action: Real-World Examples of Churn Prevention

Understanding why and where customers leave is only valuable if it leads to proactive, targeted action. Ookla’s analysis has pinpointed several examples where granular insights into network performance, user behavior, and technology gaps directly guided providers to address the root causes of churn:

  • Tackling Performance Issues: Small performance degradations can drive major customer losses. One provider observed that a 25% increase in YouTube and Google loading times coincided with significant customer departures. After network infrastructure upgrades at key connection points, web performance improved and customer retention stabilized.
  • Addressing Network Technology Gaps: Disparities in technology can significantly impact customer decisions. Data from Houston showed fiber networks delivering 10x faster speeds than non-fiber alternatives (477 Mbps vs. 47 Mbps), while users in Seattle experienced dramatically higher latency on non-fiber networks.
  • Leveraging Early Infrastructure Investments: Providers who deployed fiber early captured significant market share that continues to grow. This underscores the importance of timely network upgrades and the need for providers to accelerate fiber deployments, optimize latency, and consistently enhance the quality of experience to maintain competitive advantage.

While customer churn remains a major concern among telecom providers, those who leverage crowdsourced data to identify specific performance issues and technology gaps gain a decisive advantage. The key is targeting investments with precision, creating a virtuous cycle — better performance drives higher satisfaction, reduced churn, and ultimately stronger returns on infrastructure investments.

Conclusion: Using Data-Driven Insights Reduce Churn

The bottom line is that keeping customers is much cheaper than replacing them. That’s why understanding why they leave — and taking steps to prevent it — is so critical. By leveraging insights from Ookla’s QoS and QoE data, providers can gain a comprehensive understanding of both network performance and its impact on real-world user satisfaction.

With a clearer picture of the factors that drive churn, providers can address issues like slow speeds, high latency, and inconsistent experiences. Providers that invest in fiber, consistently deliver low latency, and proactively monitor QoE are better positioned to keep their customers happy — and prevent churn.

Why customers leave: Preventing Churn

For more on how Ookla’s crowdsourced data can help your enterprise reduce churn, reach out to our team! And if you want a deeper dive into applying these insights to your strategy, check out our recent webinar “Why Customers Leave: Preventing Churn with Crowdsourced Data.”

Ookla retains ownership of this article including all of the intellectual property rights, data, content graphs and analysis. This article may not be quoted, reproduced, distributed or published for any commercial purpose without prior consent. Members of the press and others using the findings in this article for non-commercial purposes are welcome to publicly share and link to report information with attribution to Ookla.

| May 7, 2024

Assessing and Addressing Indoor Coverage Issues

In an era where staying connected is not just a convenience but a necessity, fast and reliable indoor cellular and Wi-Fi connectivity play a pivotal role for enterprises and consumers alike. In fact, according to Ericsson, up to 80% of all data traffic is consumed at indoor locations and 90% of our time is spent indoors, making good indoor cell and Wi-Fi performance more important than ever. From enabling mission-critical business applications to allowing users to binge Fallout while stuck at the airport, users expect perfect connectivity 24/7, regardless of location. 

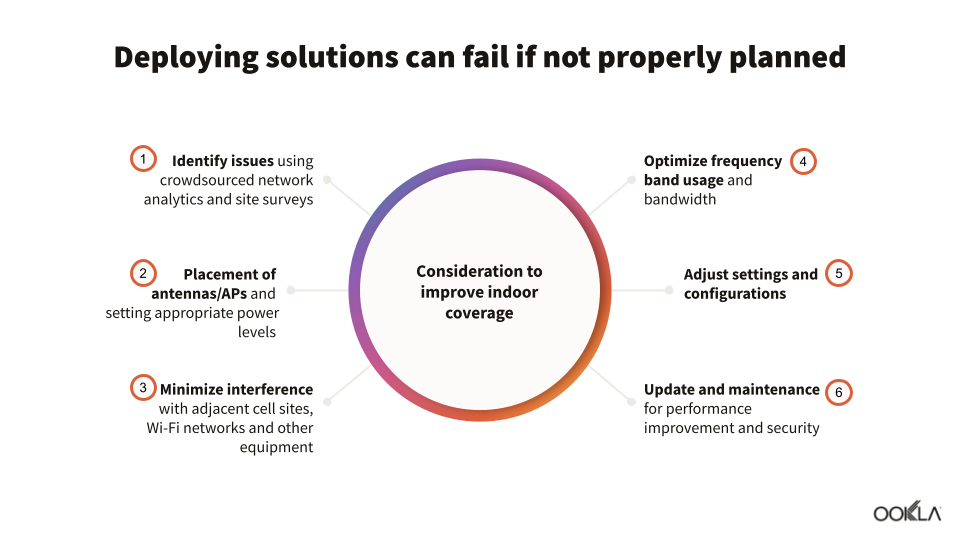
However, achieving consistently reliable and high-speed indoor coverage isn’t as straightforward as it might sound. Obstacles like walls, windows, and various building materials can attenuate radio signals and hamper propagation, while suboptimal access point (AP) placement, improper power level configurations, and interference from nearby networks or devices can further degrade indoor connectivity performance.

Chart titled "Deploying solutions can fail if not properly planned"

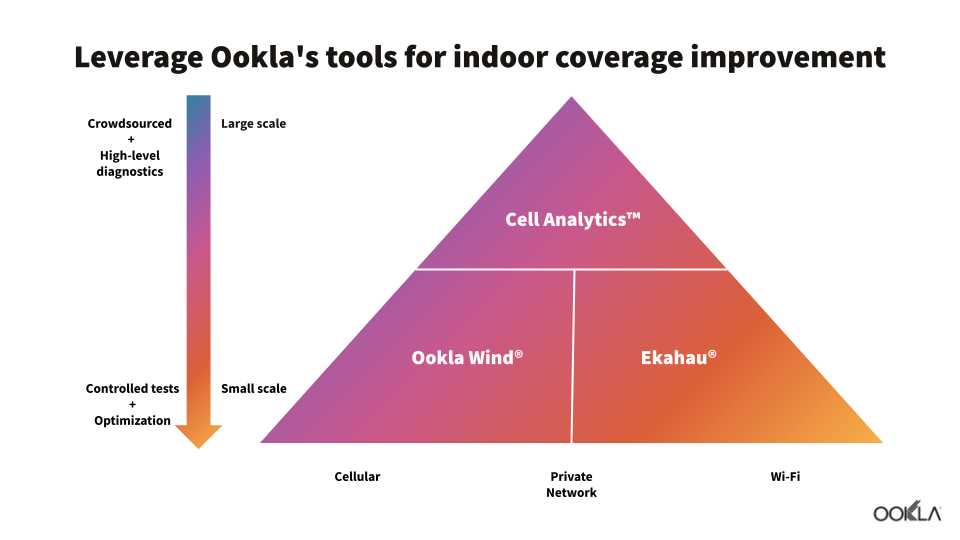
To overcome these challenges, proper network planning is critical, and that’s where Ookla can help. With complementary datasets like Ekahau’s Wi-Fi performance suite and Ookla’s solutions for mobile network intelligence including Cell Analytics™ and Ookla Wind™, operators can identify and address indoor coverage issues for both cellular and Wi-Fi networks. 

Detecting Indoor Coverage Issues

Internet users often switch between Wi-Fi and cellular networks, but these transitions aren’t always as seamless as one would expect. Some users might encounter poor service while moving between networks, while others may simply switch off one network type altogether, avoiding the need to report any problems to their ISP. This compounds challenges for ISPs in identifying and addressing coverage issues, making proactive network monitoring and testing critical. 

The first step in maximizing indoor connectivity and detecting coverage issues is understanding your network’s current gaps, weak signal areas, and sources of interference or poor performance.

Evaluating Cellular Coverage with Cell Analytics

Powered by the Ookla® Speedtest® network testing platform, Cell Analytics provides unparalleled intelligence into wireless service quality, RF measurements, data usage, user density – both indoors and outdoors – cell site locations, and much more. Cell Analytics leverages billions of samples from consumer devices to show you indoor coverage gaps, weak signal areas, and buildings with good coverage but poor quality. Some key capabilities of Cell Analytics include: 

  • Assessing the performance, quality, and availability of existing networks
  • Identifying and fixing network issues faster
  • Locating opportunities for capacity expansion
  • Prioritizing network optimization and marketing efforts
  • Focusing engineering efforts where they’re needed most

Evaluating Wi-Fi Coverage with Ekahau’s Sidekick 2

Ekahau’s Sidekick 2 Wi-Fi testing and measurement device assesses your network health and provides early detection for any changes in the environment that can negatively impact your Wi-Fi network. The Sidekick 2 enables comprehensive site surveys to rapidly detect issues like:

  • Poor primary or secondary coverage 
  • Interference sources 
  • Wall attenuation sources 
  • AP placement 
  • AP power levels
  • Security vulnerabilities 

With an easy-to-use mobile app interface, the Sidekick 2 empowers anyone to collect reliable Wi-Fi data simply by walking around a facility. If you can walk a dog, you can use the Sidekick 2!

Chart titled "Leverage Ookla's tools for indoor coverage improvement"

Improving Indoor Coverage with Ookla Wind & Ekahau

Ookla Wind offers another complementary solution for identifying and improving indoor coverage via a controlled walk/drive testing solution. Using our handset-based Android app, Ookla Wind provides controlled testing of 5G, 4G, Wi-Fi, and other network types, allowing ISPs to diagnose coverage problems and validate improvements at a granular level. Some key capabilities include:

  • Walk/drive test automation with scripting
  • Integrated Speedtest SDK for real-world throughput testing
  • Cloud-based reporting and visualization of test data
  • Real-time monitoring during live events at venues like stadiums

On the Wi-Fi side, Ekahau’s software solutions are designed to simplify Wi-Fi design and optimization for anyone, whether you’re a veteran IT pro or a recently hired IT intern. Using measured survey data collected by the Sidekick 2, Ekahau’s software can help you take the next steps toward improving your indoor coverage. Let’s take a look at how Ekahau’s Optimizer and Analyzer software solutions can help solve your network woes with ease. 

Ekahau Optimizer allows you to perform incredibly accurate health check and security surveys with the Sidekick 2 and the Android or iOS device of your choice. Ekahau Optimizer automatically analyzes data from the Sidekick 2, then it identifies and makes recommendations for fixing several key issues that IT admins have to contend with on a regular basis, such as primary and secondary coverage issues, SNR problems, minimum basic rates, SSID configuration, channel widths, and more. 

Ekahau Analyzer provides another convenient solution for troubleshooting the most common network issues, including coverage problems. Connected to the Sidekick, the app validates your network’s configuration and makes it easy to visualize actual spectrum utilization and access point reporting side-by-side, view associated stations, discover rogue devices, and identify the channels your APs are operating on to improve overall Wi-Fi performance. 

Conclusion

In today’s hyperconnected world, reliable indoor connectivity is a must for both businesses and consumers alike. By combining Ookla’s crowdsourced testing and analytics capabilities with Ekahau’s powerful Wi-Fi solutions, organizations get a 360-degree view of their indoor mobile and Wi-Fi coverage and can ensure their networks deliver the seamless indoor experiences users demand.

Image linked to access to On-Demand video of the "How to Optimize Indoor Cellular and Wi-Fi Coverage webinar

From pinpointing indoor coverage gaps and identifying other issues using Cell Analytics and Ekahau to conducting controlled testing with Wind, these complementary solutions provide end-to-end indoor connectivity optimization solutions for IT admins across a broad range of industry.

To learn more about how Ookla and Ekahau solutions can be used to solve coverage problems, check out our recent webinar on-demand, “How to Optimize Indoor Cellular and Wi-Fi Coverage.” 

Ookla retains ownership of this article including all of the intellectual property rights, data, content graphs and analysis. This article may not be quoted, reproduced, distributed or published for any commercial purpose without prior consent. Members of the press and others using the findings in this article for non-commercial purposes are welcome to publicly share and link to report information with attribution to Ookla.

| November 6, 2024

The Path to "Full" 5G: Challenges and Opportunities in Standalone 5G Deployment

5G technology has been making headlines for years, but the transition to standalone 5G (5G SA) has been slower than many expected. While non-standalone 5G (NSA) uses 5G radio technology alongside existing 4G core networks, 5G SA represents a complete transition to an independent 5G network with its own core. Think of SA 5G as “pure” or “real” 5G, with 4G LTE removed entirely from the equation. This evolution promises notable improvements in network performance and capabilities, yet its deployment has faced obstacles.

Our recent webinar, “The Slow Road to 5G Standalone: What’s Delaying Deployment?” explored the challenges and opportunities in 5G SA deployment and implementation. Featuring experts from Ookla and T-Mobile, the discussion provided comprehensive insights into the current state and future potential of this technology.

In this article, we’ll explore key takeaways from the webinar, including the benefits, challenges, emerging use cases of 5G SA, and we’ll also take a look at T-Mobile’s aggressive approach to 5G SA. For a deeper look at these topics, including expert analysis and detailed performance data, watch the full webinar

Key benefits and technical improvements of 5G SA

5G Standalone (SA) technology promises to deliver significant advantages over its predecessors, opening new possibilities for consumers and industries alike. But the transition to 5G SA involves more than just upgrading cell towers—it requires the implementation of an entirely new core network. This core acts as the “brain” of the system, managing data connections, handling security, and enabling advanced features.

To fully realize the potential of 5G SA, several technological innovations have been introduced to enhance network performance and user experiences. These include better management of network resources and more efficient data transmission. A standalone 5G core is essential to unleash these developments, setting 5G SA apart as “real” 5G and enabling capabilities that were impossible with 4G-dependent networks.

The result is better use of available spectrum, faster data speeds, and extended coverage in challenging environments like indoor spaces or rural regions. Key benefits for users include:

  • Improved upload speeds: Faster upload speeds for activities like social media sharing, file uploads, and cloud services.
  • Better coverage in more places: Improved connectivity in areas previously underserved by mobile networks, enhancing user experiences in more locations.
  • Lower latency: Near-real-time responsiveness for applications like gaming and augmented reality.
  • Increased network efficiency: Operators can serve more users with improved quality of service, leading to a smoother and more reliable mobile experience.

Beyond these immediate improvements, 5G SA also paves the way for transformative technologies like network slicing, which we’ll explore in later sections.

Challenges to 5G standalone deployment

While 5G SA promises significant advancements in mobile technology, our webinar discussed a perhaps surprising reality: the deployment of 5G SA has been slower than many industry experts anticipated, with only about 12% of 5G networks worldwide utilizing SA technology. This gap between the technology’s potential and its current adoption raises important questions about the obstacles facing network operators and the future trajectory of 5G technology. Several challenges have contributed to this slow adoption:

  • Technical complexity and core network upgrades: Transitioning to a fully independent 5G core network presents significant hurdles, requiring extensive and costly upgrades to the core infrastructure, which is both technically challenging and time-consuming.
  • Transition hurdles: Operators must carefully manage the transition from NSA to 5G SA to minimize disruptions to existing services while gradually introducing SA capabilities. This process requires coordinating changes across the network infrastructure, device ecosystem, and service offerings simultaneously.
  • Unclear ROI: Some operators are hesitant to invest heavily in 5G SA without a clear return on investment.
  • Lack of a widely recognized “killer use case”: While applications like network slicing and enhanced Fixed Wireless Access (FWA) show promise, some operators are still waiting for more compelling use cases that clearly demonstrate the need for SA capabilities before making the leap.
  • 5G SA ecosystem compatibility and availability: Ensuring all network components, devices, and applications are SA 5G-compatible presents a significant challenge, and the limited availability of SA-compatible devices in the market can slow down adoption.

Despite these industry-wide challenges, some carriers have chosen to forge ahead with 5G SA deployment, recognizing its long-term potential. T-Mobile, in particular, has taken a bold approach to 5G SA implementation.

T-Mobile’s aggressive approach to 5G SA

While many mobile carriers have been cautious in their approach to 5G SA, T-Mobile has taken a decidedly different path. The company recognized early on that to truly differentiate its 5G offerings and introduce new features, a full transition to 5G SA was necessary. T-Mobile has since positioned itself as a leader in 5G SA, providing valuable insights for the industry into both the challenges and benefits of this technology.

T-Mobile viewed 5G SA as a pathway to improved network performance, advanced features, and more efficient use of its spectrum assets. Central to this vision was T-Mobile’s recognition that a dedicated 5G core network was essential to achieve superior performance beyond what NSA 5G could offer. The carrier’s approach has thus far yielded promising results:

  • Enhanced coverage and capacity: Broader network reach and ability to serve more users, especially in densely populated urban areas
  • Advanced features: Early implementation of network slicing and Voice over New Radio (VoNR), enabling new service possibilities
  • Improved uplink performance: Faster upload speeds and better coverage, benefiting applications like live streaming and large file transfers

While T-Mobile and its users have clearly benefited from this technology, the carrier’s journey hasn’t been without challenges. T-Mobile had to navigate issues such as ensuring device compatibility across its customer base, optimizing network performance during the transition, and educating customers about the benefits of 5G SA.

Emerging use cases for 5G SA

The true measure of SA 5G’s value lies in the new applications and services it enables. While many mobile operators are still cautious about immediate 5G SA deployment, this technology represents the future of 5G. As carriers inevitably move in this direction, they’re looking to both enhance existing services and enable entirely new possibilities. 

Our webinar delved into three key areas where 5G SA is already making an impact and showing its transformative potential: Network Slicing, Fixed Wireless Access (FWA), and Voice over New Radio (VoNR). 

Network slicing is a capability unique to 5G SA that allows operators to create virtual network segments tailored to specific use cases or customers. This enables the allocation of dedicated network resources to ensure optimal performance for critical services. T-Mobile has leveraged this capability to launch T-Priority, the world’s first network slice for first responders. Key benefits of network slicing include:

  • Better prioritization: Up to 5x higher network resource prioritization for critical services
  • Customized performance: Ability to optimize network parameters for specific applications or user groups
  • Improved reliability: Dedicated resources to ensure consistent performance for essential services

Fixed Wireless Access (FWA) uses 5G technology to provide home internet services, competing directly with traditional broadband options. 5G SA’s expanded capacity and performance make it particularly well-suited for this application. T-Mobile has identified FWA as a major growth opportunity, setting an ambitious target of 12 million FWA customers by 2027-2028. Key advantages of 5G SA for FWA include:

  • Expanded wireless capacity: Ability to serve more home internet customers in a given area compared to previous wireless technologies
  • Competitive performance: Offers speeds and latency that can rival or exceed traditional home broadband options in many areas, providing consumers with more choices
  • Simplified and cost-effective deployment: Implementation is faster and more cost-effective than laying traditional broadband infrastructure

Voice over New Radio (VoNR) represents the next evolution in mobile voice technology. By enabling voice calls to be carried entirely over a 5G network, VoNR promises improved call quality and lower latency compared to existing voice services. (We’ll explore VoNR in more detail in the next section.)

With T-Mobile’s T-Priority in use, we’re already seeing the real-world impact of 5G SA. As other applications continue to develop and mature, we can expect 5G SA’s influence to expand across various industries and services.

Voice over New Radio (VoNR): the next evolution in mobile voice

As 5G SA networks mature, they’re not just improving data services—they’re also revolutionizing voice communications. Voice over New Radio (VoNR) represents a significant leap forward from its predecessor, Voice over LTE (VoLTE). This technology enables voice calls to be carried entirely over a 5G network, potentially offering superior call quality and reduced call setup times. 

T-Mobile has been at the forefront of VoNR deployment, providing valuable insights into its real-world performance and benefits. Key aspects of T-Mobile’s VoNR deployment and performance include

  • Nationwide reach: VoNR is now enabled for over 300 million people in the U.S.
  • Controlled rollout: T-Mobile implemented VoNR market-by-market, ensuring performance met specific metrics before enabling the service.
  • Device compatibility: A large portion of T-Mobile’s device base is either VoNR-capable or can be enabled for VoNR.
  • Promising performance: Call failure rates for VoNR are comparable to, and in some cases better than, VoLTE.
  • Rapid adoption: VoNR’s share of calls has increased threefold from the second half of 2023 to the first half of 2024.

As more devices become VoNR-capable and coverage expands, more and more users should enjoy a seamless voice experience that fully leverages the capabilities of 5G technology.

Measuring 5G SA performance: Complementary datasets from Speedtest and RootMetrics

As mobile operators deploy 5G SA, measuring its real-world impact is crucial for understanding the technology’s true benefits and challenges. Ookla’s complementary datasets—combining RootMetrics’ controlled testing methodology with Speedtest’s crowdsourced data—provide a comprehensive view of network performance from both controlled and real-world environments. 

Data from RootMetrics testing across 125 of the largest metropolitan markets in the U.S. revealed several notable findings about 5G SA performance:

  • Network usage patterns vary significantly between operators: While T-Mobile extensively uses 5G SA when available, other carriers often default to LTE for lighter data tasks such as loading apps or webpages.
  • Latency improvements are task-dependent: RootMetrics testing showed that latency benefits become more pronounced with complex tasks like video streaming, which requires multiple network interactions.
  • Urban deployment focus: 5G SA availability and usage is currently more prevalent in metropolitan areas than in more rural areas. 

RootMetrics’ real-world performance data provides quantitative evidence of 5G SA’s benefits across various network scenarios and use cases, offering valuable insights for mobile operators as they plan their 5G SA deployments.

 If you’d like to see Ookla’s tools in action yourself, reach out to our team

The Road Ahead: 5G Advanced and Beyond

As 5G SA networks continue to evolve, the industry is already looking toward the next phase of development. Our webinar provided insight into the future of 5G technology, including the upcoming 5G Advanced standard and early considerations for 6G. These developments promise to further optimize network capabilities and open up new possibilities for innovation. Some key points about the future of 5G include: 

  • 5G Advanced: The next evolution of 5G, focusing on improving network efficiency and user experiences. 
  • 6G planning: Initial discussions and research into 6G technology have begun, with a focus on creating new value and revenue streams beyond enhanced mobile broadband. 
  • Spectrum refarming: Carriers are actively shifting spectrum from LTE to 5G, aiming to improve network efficiency and overall 5G performance.
  • Industry applications: The industry is expanding Fixed Wireless Access (FWA) capabilities and exploring new use cases for network slicing across various sectors, aiming to harness the full potential of mature 5G networks.

The evolution from 5G SA to 5G Advanced and early 6G research signals the industry’s commitment to continuous innovation. These developments aim to refine existing capabilities and create entirely new value propositions, potentially reshaping various aspects of technology and society in the coming years.

Conclusion

The journey to widespread 5G SA adoption is complex, but the potential benefits are immense. As we’ve seen, early adopters like T-Mobile (and its users) are already reaping the rewards of their investment, from improved network performance to innovative services like network slicing and enhanced FWA offerings.

To dive deeper into the intricacies of 5G SA deployment, including expert insights and real-world examples, watch our full webinar on demand!

Ookla retains ownership of this article including all of the intellectual property rights, data, content graphs and analysis. This article may not be quoted, reproduced, distributed or published for any commercial purpose without prior consent. Members of the press and others using the findings in this article for non-commercial purposes are welcome to publicly share and link to report information with attribution to Ookla.

| March 19, 2024

Broadband Consumer Labels are Coming Soon, and Ookla’s Data Can Help ISPs Prepare

The internet has become a fundamental tool of daily life, serving as a key resource for consumers and businesses alike. As our reliance on connectivity continues to grow, it’s become critical for all internet users to have access to accurate and transparent information about their internet service providers (ISPs). This need for transparency has prompted the FCC to introduce its Broadband Consumer Label initiative, which will educate consumers with standardized, easy-to-understand information about the broadband services that ISPs across the United States are offering. 

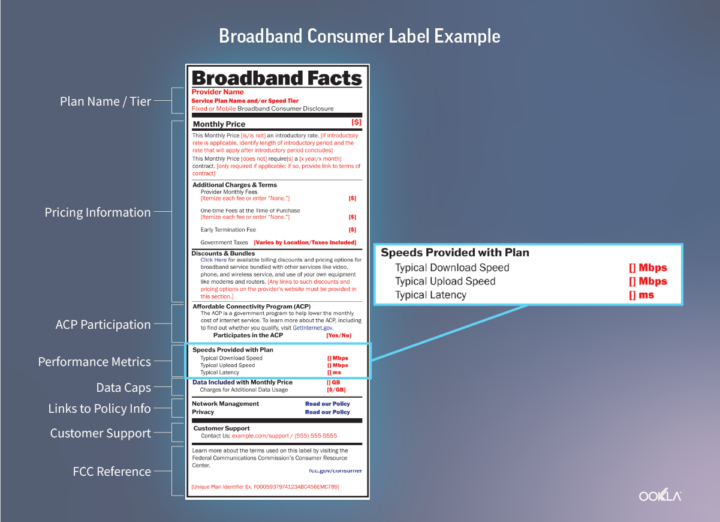
Broadband Consumer Labels are similar in appearance to the nutrition labels affixed to nearly every product at the grocery store, with both types of labels providing consumers with key information–and transparency–about the products they’re buying. ISPs will soon be required to display their own version of “nutrition labels” at the point of sale, including in marketing materials and on provider websites. Broadband Consumer Labels, which must be machine-readable, are required to disclose several key service attributes, such as the typical download and upload speeds associated with a plan, the typical latency users can expect, as well as pricing and other information. Specifically, ISPs are required to display the following information on Broadband Consumer Labels: 

  • Plan name/tier
  • Monthly pricing information, including one-time charges, early termination fees, introductory discounts, and bundled services
  • Whether or not an ISP participates in the Affordable Connectivity Program (ACP), though this could change if the ACP program isn’t extended 
  • Performance metrics, including typical download and upload speed, as well as typical latency
  • Data cap information
  • Links to ISP policy information 
  • Customer support contact information
  • FCC reference ID (a unique identifier supplied by the FCC), as well as a link to the FCC’s consumer page

Providers with more than 100,000 subscribers are required to display Broadband Consumer Labels by April 10, 2024, while all other providers have until October 10, 2024. 

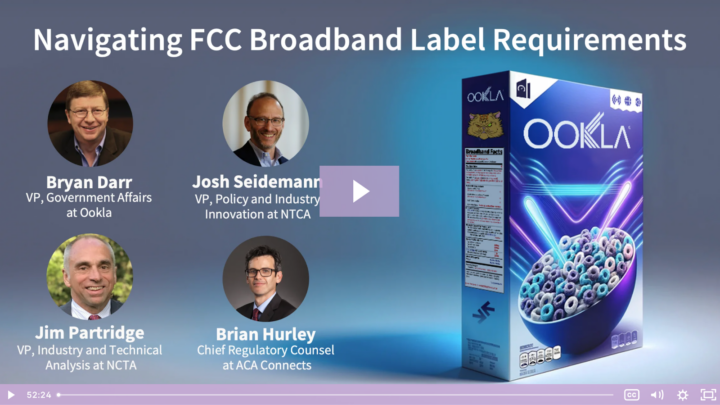
screenshot of navigating FCC broadband label requirements from webinar

For a more detailed breakdown of the risks, challenges, and importance of these labels, watch our webinar: Navigating FCC Broadband Label Requirements.

The benefit to consumers is clear: transparency

Broadband Consumer Labels will provide consumers with much-needed transparency into the level of service they can expect when choosing an ISP. By organizing performance and pricing details in a simple, repeatable format, users can be sure they’re getting what they pay for, and they can compare different providers and plans more easily. The benefits to providers, meanwhile, largely comes in the form of increased consumer trust, confidence, and ultimately, brand loyalty. The labels will also provide ISPs with a medium to promote their offerings to users across the country.

image of FCC broadband consumer label

Broadband Consumer Label risks & challenges

On the other hand, the introduction and continued maintenance of broadband labels marks a sea change for the telco industry at large. The more pricing tiers and technologies that exist across multiple markets, the more unique labels will need to be published. For example, one provider’s label in Seattle could be different from the same provider’s label in nearby Tacoma in terms of price, plan tiers, speeds, and more. It will be a behemoth effort for many ISPs to create and update labels, and internet providers will undoubtedly face challenges. Providers not only need to adhere to the FCC’s guidelines in relatively short order, but labels must also be updated every six months, as well any time an ISP modifies an existing plan or introduces a new one. 

Providers also face both regulatory and commercial risks with the new labels. Some of those risks and challenges include: 

Regulatory Risks:

  • Although the program begins in April, the rules are subject to change as the FCC is still requesting input from key stakeholders.
  • Latency is considered particularly important for people who use video conferencing, including those with disabilities.
  • The FCC has yet to define what “typical” means in the context of speeds and latency. 
  • Consumer advocacy groups believe many subscribers are not getting what they pay for.
  • Expect FCC enforcement mechanisms to be developed for situations in which the information displayed on labels doesn’t match with the real-world user experience. 

Commercial Risks

  • Competition will have broad visibility into performance claims for every plan a provider offers. 
  • Administrative overhead for ISPs driven by the number of price plans, markets, technologies, etc.
  • Existing subscriber misconceptions of service experienced compared to the actual service delivered.
  • Resellers must provide performance metrics even though they have limited control over quality of service (QoS) metrics.
  • Consumer advocacy groups and consumers pose a legal risk for providers if information on labels isn’t reflected in reality. 

How Ookla can help ISPs with the broadband label revolution 

With deadlines for providers right around the corner, it’s critical for ISPs to coordinate across IT, marketing, legal, and regulatory teams to determine the number of labels needed for various regions, price points, performance metrics, and more. Two label requirements that may prove particularly difficult for providers to manage are the typical speed and latency performance metrics in a given area. 

While the FCC hasn’t yet defined what “typical” means for performance metrics on broadband labels, providers could find it difficult to both determine and validate those metrics because the real-world speeds experienced by consumers often differ from a provider’s advertised speeds, and it can also be difficult to distinguish real-world performance between different technologies or tiers of service, such as fiber or cable. 

That’s where Ookla can help. Ookla receives over 11 million consumer-initiated Speedtests per day from all over the world, with over 50 billion total tests taken to date. Ookla’s detailed data and insights on speed, latency, and a host of other metrics can help Internet Service Providers substantiate typical speed or latency claims, ensuring their subscribers know what to expect and ultimately get what they pay for. 

Three Ookla solutions that should be particularly helpful in both the rollout and maintenance of broadband labels are Speedtest Embedded™, Speedtest Custom™, and the Ookla Enrichment API™. 

  • Speedtest Embedded allows Speedtest to be integrated as a testing solution on servers and desktops, as well as CPE devices. Ookla captures millions of these CPE tests every day on consumer gateways, Wi-Fi routers, and set-top boxes, providing ISPs with measurements directly from or very near to the service connection. 
  • Speedtest Custom provides users with accurate network performance testing backed by the same trusted testing engine as Speedtest, helping ISPs and their customers understand their connected experiences with performance metrics including download, upload, latency, and jitter.  
  • Ookla Enrichment API lets ISPs link a given test to a specific plan subscription, allowing providers to enrich test data with subscriber tiers/provisioned speeds, technology types, whether a test was conducted in a residential or commercial area, and more. Please reach out to learn more about the Ookla Enrichment API.

Conclusion 

As we navigate the quickly approaching deadlines of April and October 2024 for the implementation of Broadband Consumer Labels, the urgency for ISPs to adapt cannot be overstated. These labels should add a new level of transparency and trust within the telecommunications sector, offering consumers and businesses clear, standardized information about broadband services. 

However, the path to compliance won’t be easy. ISPs must navigate complex logistical and data management hurdles to produce and maintain these labels accurately. Each label must reflect specific service characteristics relevant to the geographic location it serves, which will require a granular level of detail and regular updates (every six months) to ensure accuracy. What’s more, regulatory uncertainties and the dynamic nature of broadband services can add layers of additional complexity to this endeavor. The FCC will likely offer some latitude on implementation during the first several months, but ISPs should prepare to contend with eventual enforcement of the rules. Perhaps more immediate is the potential for challenges from aggressive public interest groups and impassioned subscribers. 

Ookla is here to help! With an unmatched depth and breadth of connectivity data derived from millions of consumer-initiated Speedtests taken daily, Ookla’s solutions can help ISPs streamline the process of substantiating the claims made on these new broadband labels. With Speedtest Embedded, Speedtest Custom, and the Ookla Enrichment API, ISPs can access real-time insights into network performance, customer experience, and other critical metrics. 

These tools are instrumental in validating the typical speed and latency performance information required on broadband labels, ensuring that ISPs can meet FCC guidelines with confidence and precision. Contact us to learn more. 

Ookla retains ownership of this article including all of the intellectual property rights, data, content graphs and analysis. This article may not be quoted, reproduced, distributed or published for any commercial purpose without prior consent. Members of the press and others using the findings in this article for non-commercial purposes are welcome to publicly share and link to report information with attribution to Ookla.

| December 1, 2021

Four Video Experience Metrics ISPs and Mobile Operators Should Care About [Webinar]

Video content is now the dominant form of global network traffic, and consumers are spending more time than ever watching videos on streaming services and social media platforms. When a customer subscribes to your internet service or mobile network, they are ultimately paying for a service that allows them to consume content. They expect to be able to watch videos at a high quality without interruption, and if you can’t deliver a great video streaming experience, it’s likely that you’ll end up with a dissatisfied customer.

It’s important for ISPs and operators to understand their customers’ real-life connectivity and quality of experience when they are consuming video content. Understanding the streaming experience starts with analyzing the right video KPIs — metrics that will help you measure and improve video performance on your network, as well as prioritize marketing and engineering efforts where you have excellent or poor performance.

Register for our December 9 webinar to learn about the latest industry research and best practices for accurately measuring the end-user’s experience in real-world conditions — so you can deliver world-class video streaming quality.

Which metrics should you care about?

Major video content providers and platforms like Netflix, Hulu, Youtube, Instagram and Facebook all use industry-standard metrics to ensure that their users are having good experiences. If you’re looking to improve your customers’ video streaming experience on your network, these are the video metrics that you should pay attention to:

1. Start delays

A start delay is the time from when the user hits “play” to when the video starts playing. Hitting play and having to wait a long time for the video to begin is not a good streaming experience.

2. Start failures

A start failure is when the user attempted to play a video but it failed to start. Failed playback usually leads to customer dissatisfaction with the streaming service or network provider.

3. Rebuffering ratio

This is the time spent stalling divided by the time spent playing back video. You can also look at stall proportion to understand the frequency of rebuffering events.

4. Average bitrate

This is the average media bitrate of the video played. In adaptive bitrate streaming, lower bitrate means lower quality video and a higher bitrate means a higher quality video, so you should be aiming to provide a higher average bitrate than your competitors.

Video Analytics in Speedtest Intelligence® captures each of these metrics and surfaces data from millions of video tests initiated in Speedtest® by consumers all over the world. To learn more about what you can do with these metrics, such as finding areas of opportunity for expansion, competitive benchmarking and promoting a superior video experience, join the webinar on Thursday, December 9.

The webinar will take place for APAC time zones at 11 a.m. GMT +8 (8:30 a.m. Mumbai, 10 a.m. Bangkok/Jakarta, 11 a.m. Manila/Singapore/Beijing/Kuala Lumpur, 12 p.m. Tokyo/Seoul, 2 p.m. Sydney), and a recording will be provided for registrants who can’t join the live presentation. Register now.

Ookla retains ownership of this article including all of the intellectual property rights, data, content graphs and analysis. This article may not be quoted, reproduced, distributed or published for any commercial purpose without prior consent. Members of the press and others using the findings in this article for non-commercial purposes are welcome to publicly share and link to report information with attribution to Ookla.

| June 10, 2021

How to Make Data-Driven Broadband Funding Decisions [Webinar]

Billions of dollars in federal funding are being dispersed this summer as part of the United States government’s mission to expand broadband across America. State and local policymakers are currently tasked with ensuring that funding goes to broadband investments that will connect constituents to the speeds they need. This article highlights two instances where Ookla® data is uniquely positioned to help federal, state and local governments understand where constituents don’t have access to high-speed internet.

Register for our June 23 webinar to learn more about how accurate, up-to-date information about internet performance and accessibility can help you prioritize funding decisions and bridge the digital divide in your jurisdiction.


Addressing the digital divide in network access

This past year has made it increasingly clear that broadband is essential in our daily lives — students have needed high-speed internet to connect to the classroom, employees have needed to be able to connect to work remotely and sick people have needed access to broadband to use telehealth services. At the same time, broadband issues in both rural and urban communities have made the digital divide increasingly obvious. For those below or near the poverty line, a lack of equipment to get connected and a lack of financial resources acts as a barrier. In many areas there is a lack of adequate connectivity, impacting everyone, regardless of their economic circumstance.

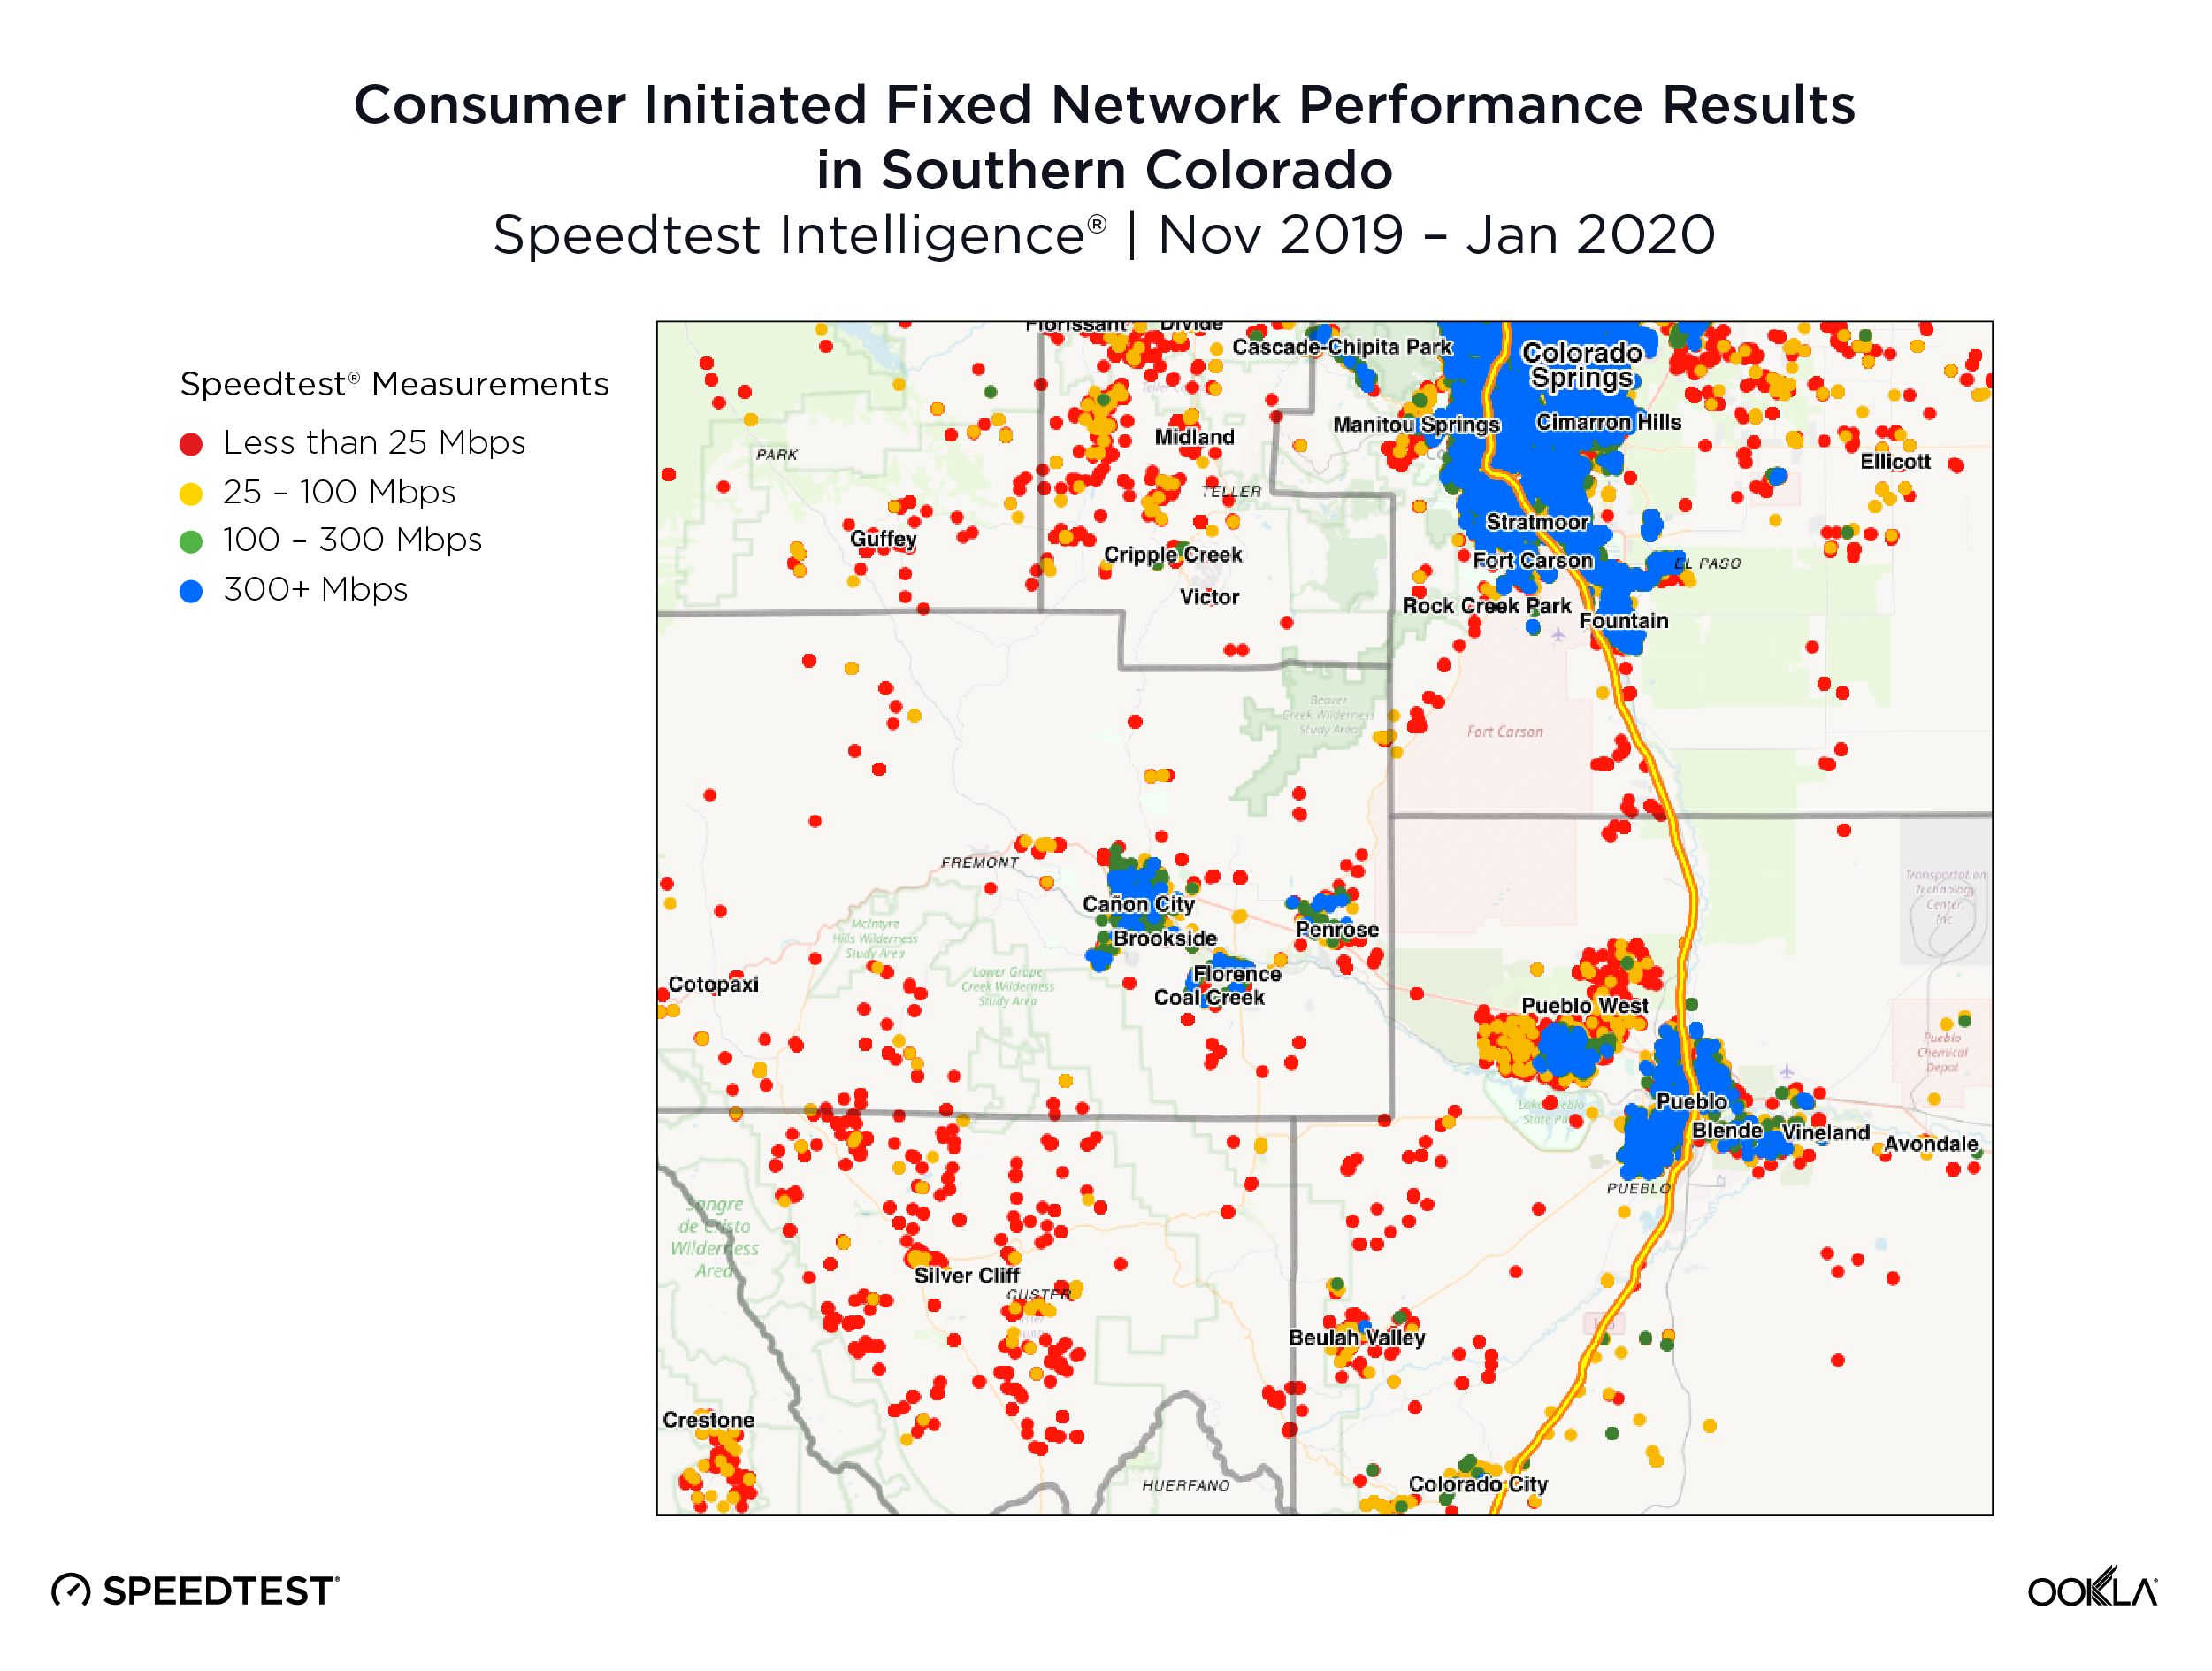
Less populated, more rural areas of the U.S. tend to have less access to high-speed internet. Take Colorado, for example, where much of the greater Colorado Springs area has broadband speeds of 300+ Mbps. Yet many underserved areas exist in the more rural areas of Colorado. These underserved areas are clearly demonstrated by the red dots on the below map of Speedtest® measurements for all fixed operators via Android and iOS devices. This data reveals that many of the rural communities in Colorado don’t have access to the FCC minimum download speeds of 25 Mbps. By looking only at tests taken on devices that provide GPS location information, we can see the precise geographic boundaries of the digital divide, illustrated with real-world network performance data.

speedtest_consumer_initiated_fixed_performance_so_colorado_0621

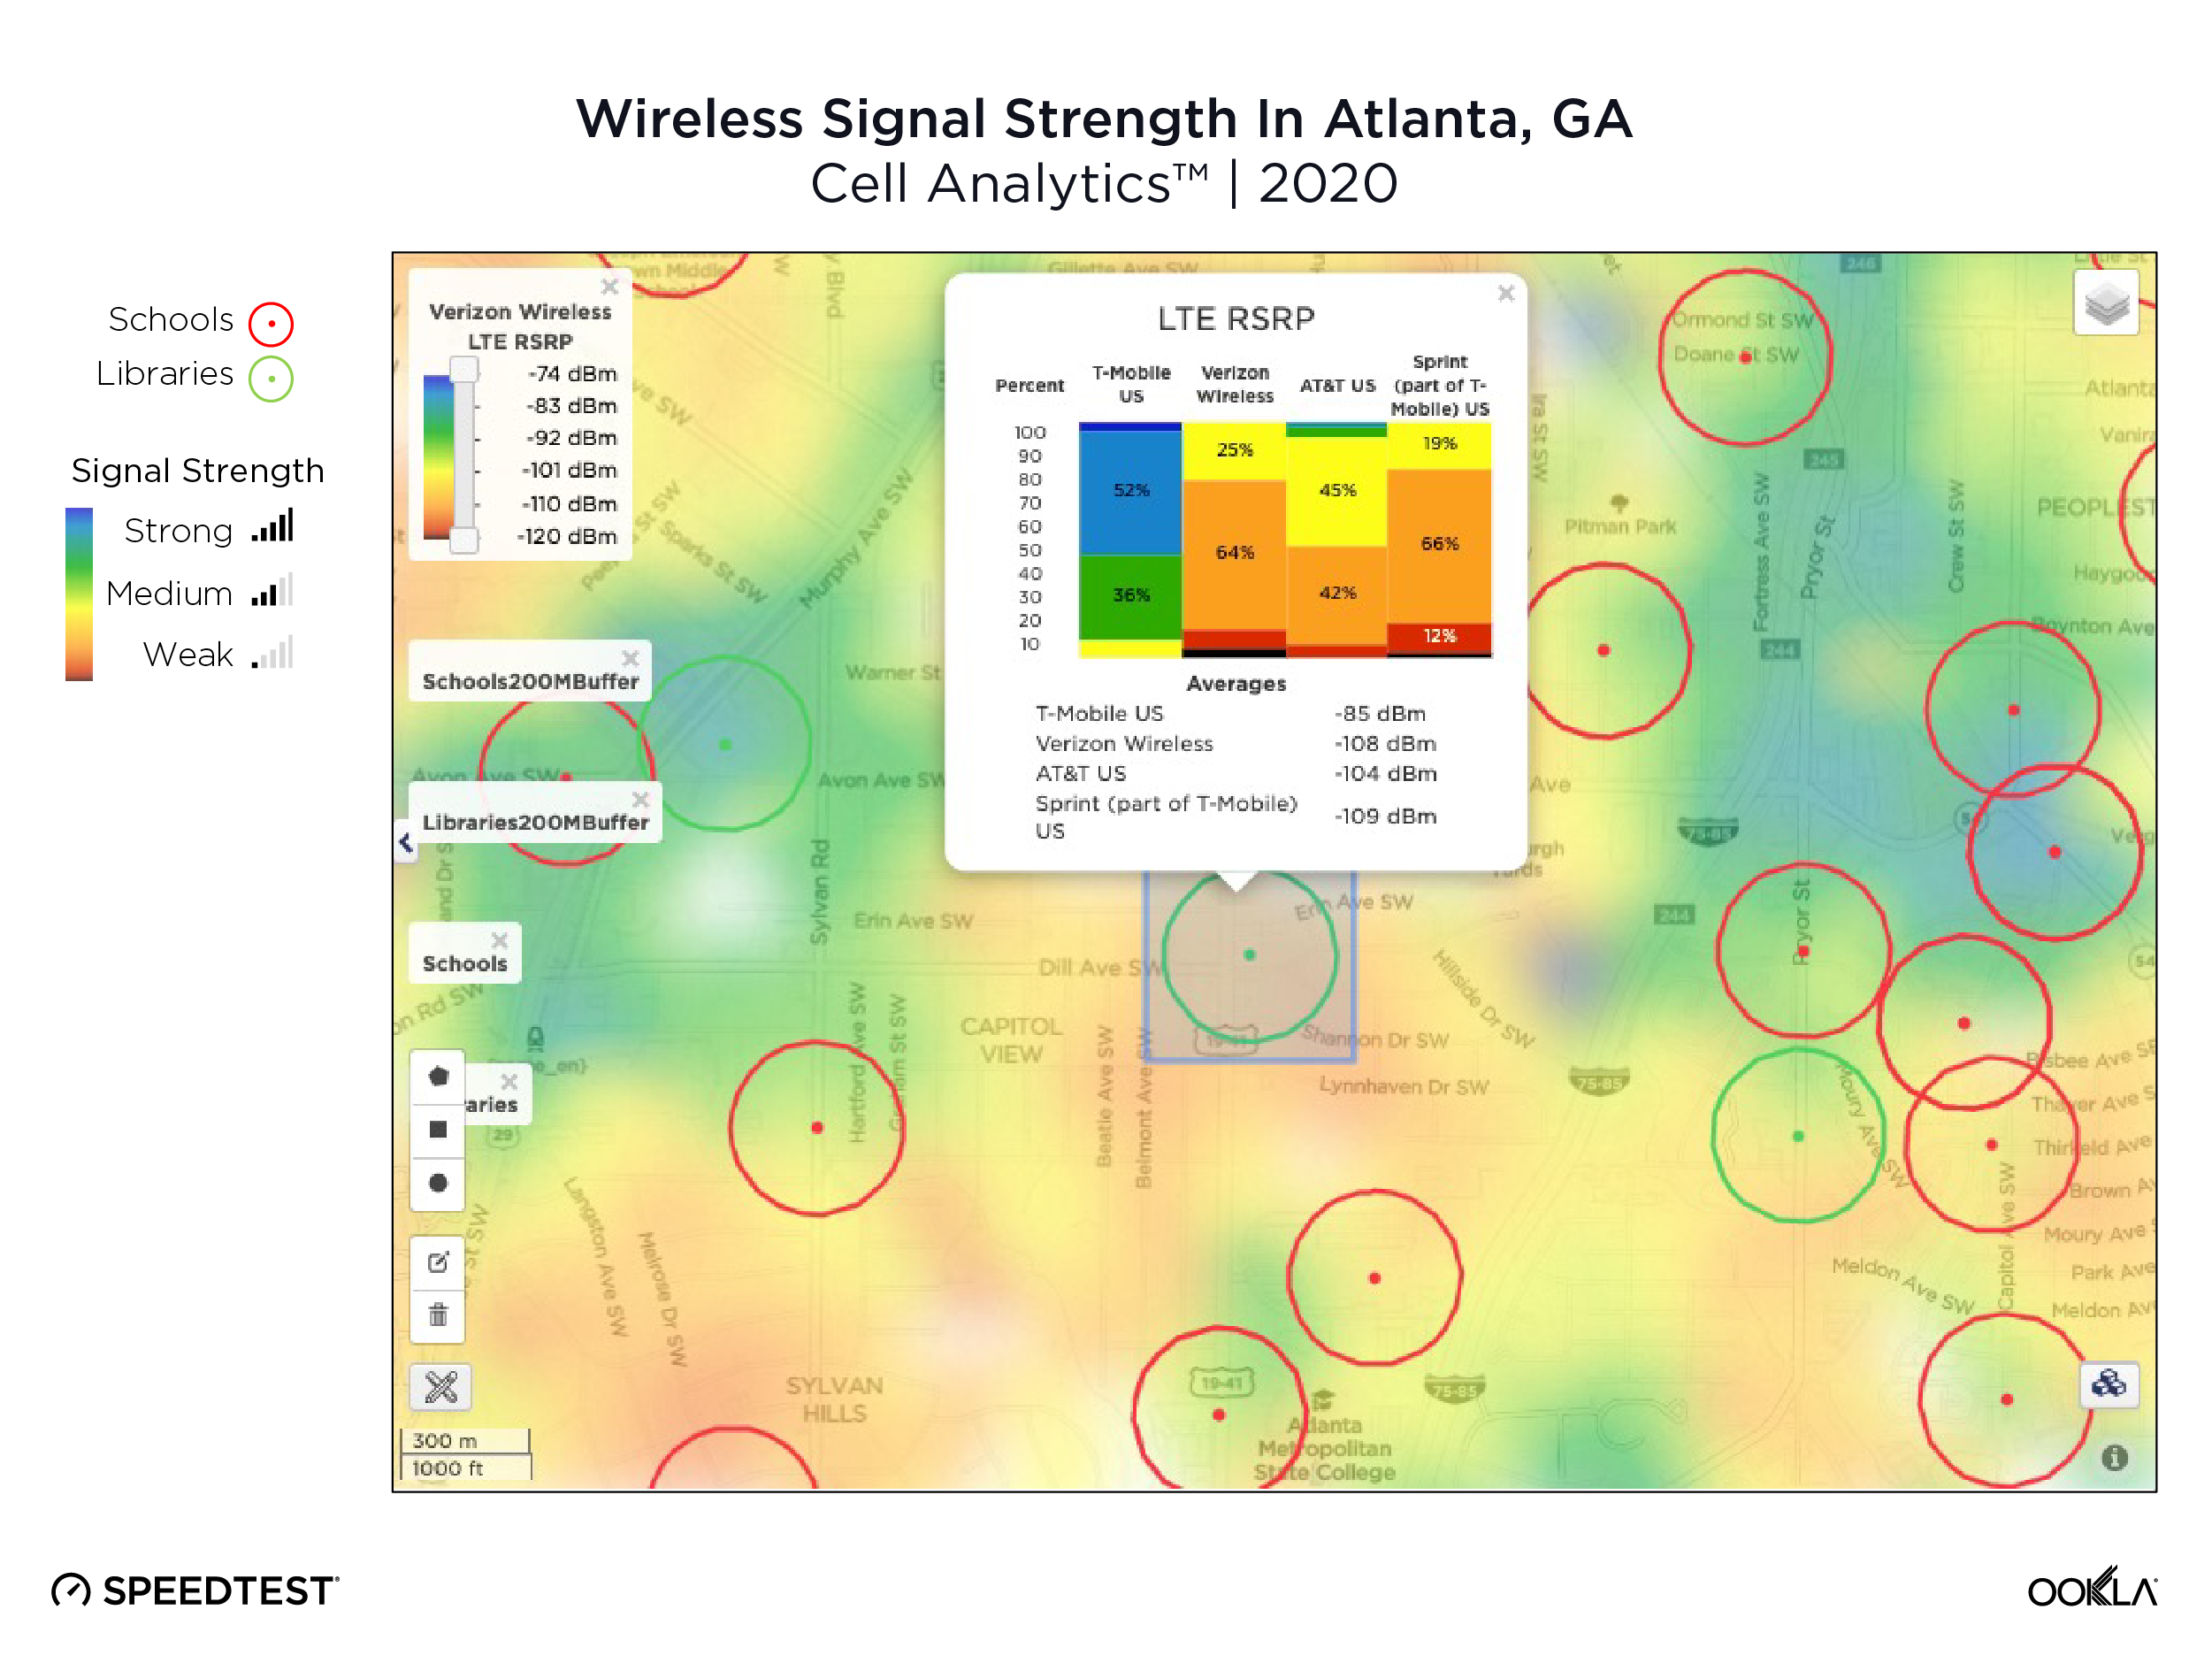
Connectivity problems exist in urban communities as well. The map below shows Cell Analytics™ data for Atlanta, Georgia. The red circles are locations of schools, the green circles are locations of libraries and the color gradient on the map indicates the signal strength in those locations. As you can see, many of the schools and libraries in Atlanta only have access to medium or weak signal strength, depending upon the carrier they have chosen. Within some neighborhoods, coverage quality is poor across all operators, leaving residents with no good option. Residents in urban communities under economic stress often depend on their phone to connect to the internet. This is especially true for students who rely on hotspots and tablets to connect to the classroom. Higher quality wireless service is critical when it comes to closing the homework gap in urban communities such as Atlanta.

cell_analytics_wirelss_signal_strength_atlanta_0621

The federal government aims to make big strides towards closing the gap in both rural and urban communities across the nation with the billions of dollars in broadband funding allocated in the American Rescue Plan (ARP) Act. While this new funding is welcome, it creates a question for policymakers around how to best use the budget to solve for digital equity. Decision makers often lack the data that they need to make smart infrastructure investments that will provide broadband access to the greatest number of people.

Using Ookla data for smarter spending

The webinar will show how policymakers can use Speedtest datasets to determine specific locations where constituents can’t access adequate broadband. Learn how we can help you allocate resources to areas that show a clear need for investment in broadband infrastructure.

Speedtest Intelligence® data can help answer questions like:

  • How is performance in a geographic area or for an internet service provider (ISP) trending over time?
  • How widespread are any changes (e.g., network improvements) impacting typical network performance in a given area?
  • Are minimum thresholds needed for remote work, education and telehealth being met in a given area?
  • How commonly does an ISP deliver a minimum level of service?
  • How does an ISP’s real-world network performance compare to their self-reported speeds and service levels?

To learn how to turn this data into actionable broadband policy, tune into the webinar on Wednesday, June 23 at 9 a.m. Pacific (12 p.m. Eastern). A recording will be provided for registrants who can’t make the live presentation.


Ookla retains ownership of this article including all of the intellectual property rights, data, content graphs and analysis. This article may not be quoted, reproduced, distributed or published for any commercial purpose without prior consent. Members of the press and others using the findings in this article for non-commercial purposes are welcome to publicly share and link to report information with attribution to Ookla.