A year on from our inaugural report, the global 5G SA narrative in 2026 has shifted from a coverage race to a capability contest. The GCC now delivers median download speeds five times those in Europe, while the U.S. has completed its Tier-1 SA launches. Europe is accelerating, but from a low base, and the gap with global leaders risks widening as 5G Advanced scales elsewhere.
The second edition of Ookla and Omdia’s flagship report on the global state of 5G Standalone confirms that the technology has moved beyond launch announcements into an execution-driven phase. By the close of 2025, the “coverage gap” between major economic blocs had narrowed, but a more consequential “capability gap” has emerged, reflecting divergent spectrum strategies, investment depth, and the extent to which operators have moved beyond baseline SA deployment toward end-to-end network optimization.
Globally, 5G SA availability based on Speedtest® sample share reached 17.6% in Q4 2025, up modestly from 16.2% a year earlier, indicating that roughly one in six 5G Speedtests worldwide now occurs on a standalone network. The headline global median SA download speed of 269.51 Mbps represents a 52% premium over non-standalone networks, though this figure masks significant regional variation driven by spectrum allocation depth, carrier aggregation maturity, and user-plane engineering.
For governments and regulators, the stakes of the SA transition have intensified. National competitiveness, digital sovereignty, and AI readiness have converged to reshape investment priorities across major markets. The European Commission’s Digital Networks Act, the U.S.’ supply chain diversification program, and China’s integration of 5G Advanced into its 15th Five-Year Plan all signal that 5G SA is now treated as foundational national infrastructure central to AI ambitions, and not merely a connectivity upgrade.
This year’s report significantly expands the scope of the analysis. For the first time, our research examines 5G SA’s impact on end-user battery life and voice performance (VoNR), quality of experience (QoE) metrics to cloud and gaming infrastructure, and the first wave of commercial monetization strategies spanning consumer network slicing, enterprise SLAs, and 5G Advanced segmentation. We also provide an assessment of the geopolitical context now shaping SA’s evolution, from Europe’s Digital Networks Act to the GCC’s sovereign AI infrastructure strategies.
Key Takeaways:
The GCC has established itself as the global 5G SA performance leader, with the UAE setting the speed benchmark
Led by e& and du’s aggressive 5G Advanced deployments, the Gulf Cooperation Council (GCC) delivered the world’s fastest 5G SA median download speeds in Q4 2025 at 1.13 Gbps, nearly five times that of Europe. The UAE alone reached a median of 1.24 Gbps on SA networks, a speed that would be considered exceptional even for full-fiber broadband in developed markets. The deployment of four-carrier aggregation and enhanced MIMO technology, coupled with the strategic allocation of premium mid-band spectrum to the SA network, demonstrates the performance ceiling that a fully realized 5G SA architecture can achieve.
South Korea followed at 767 Mbps, driven by wide 3.5 GHz channel bandwidth, with the U.S. at 404 Mbps following the completion of nationwide SA deployments by all three Tier-1 operators. Europe, at 205 Mbps, trails all developed regions, though the region’s SA networks still deliver a 45% download speed premium over NSA, confirming the performance value of the SA transition where material spectrum depth is allocated.
Europe’s 5G SA gap with global peers is narrowing, but the region still trails North America by 27 percentage points
Europe’s 5G SA sample share more than doubled from 1.1% to 2.8% between Q4 2024 and Q4 2025, driven by accelerated deployments in Austria (8.7%), Spain (8.3%), the United Kingdom (7.0%), and France (5.9%). These four markets now account for the vast majority of European SA connections. The United Kingdom and France registered the strongest year-on-year acceleration in Europe, each gaining 5.3 percentage points, reflecting the impact of investment-linked merger conditions and competition in the United Kingdom, as well as targeted R&D policy support in France.
U.S. Widens 5G SA Lead Over Europe & Gulf
Speedtest Intelligence® | Q1 2023 – Q4 2025
However, the region still trails North America by 27 percentage points and emerging Asia by 30. At the global level, the U.S. remains the largest accelerator in absolute terms over the last year, with SA sample share rising 8.2 percentage points to 31.6% year-on-year, driven by the sequential rollout of SA across all Tier-1 operators beyond T-Mobile. Firmware fragmentation, where handset OEMs gatekeep SA network access pending individual carrier certification, and tariff structures that fail to incentivize migration from NSA, remain the primary barriers to faster European adoption.
5G SA delivers measurable performance and quality of experience gains, but end-to-end optimization separates leaders from laggards
Globally, SA connections delivered a 52% download speed premium (mostly an artifact of rich spectrum allocation and lower network load) and improved median multi-server latency by over 6% compared to NSA. However, this year’s report finds that a standalone core migration alone does not guarantee a better end-user experience. Quality of experience analysis reveals a nuanced picture: SA improves video and cloud infrastructure latency in Europe versus NSA, but underperforms NSA for gaming latency within the same region. North America records the lowest absolute SA cloud and gaming latency, consistent with dense hyperscaler adjacency and mature interconnect ecosystems.
Among European markets, France (41 ms to cloud endpoints), Austria (48 ms), and Finland (50 ms) demonstrate what is achievable where backbone quality, peering density, and routing discipline are strong. These outcomes reflect an underappreciated end-to-end network stack optimization dividend, encompassing data-center proximity, fiber backhaul depth, and user-plane topology, rather than a pure “SA dividend” alone.
The report also presents early evidence of a tangible consumer benefit of SA: battery life. In the UK, devices on EE’s 5G SA network recorded median discharge times approximately 22% longer than those on NSA, with O2 showing an 11% advantage. These gains likely stem from features like SA’s unified control plane, which eliminates the dual-connectivity overhead of NSA configurations.
Core network investment is accelerating as monetization transitions from concept to selective execution
Omdia’s latest forecasts confirm the industry’s shift toward software-defined core capability as the primary driver of next-cycle investment. Global 5G core software spending is projected to grow at an 8.8% CAGR between 2025 and 2030, with EMEA leading at 16.7%, significantly outpacing North America (5.5%) and Asia & Oceania (4.2%). This reflects EMEA’s later position in the deployment cycle, as the region is entering its period of peak 5G core adoption, while North America’s core spending trajectory is expected to have peaked in 2025 following the commercial launches by AT&T and Verizon. By end of Q3 2025, 83 operators worldwide had deployed 5G core networks, with 5G core investment accounting for 63.6% of global core network function software spending.
5G Core Investment Accelerates Across Regions
Omdia | 2023-2030
On monetization, consumer strategies now span speed tiers (primarily Europe), network slicing (Singapore, France, and the U.S.), and 5G Advanced segmentation packages (China). Enterprise slicing presents the much larger long-term revenue opportunity, with T-Mobile’s SuperMobile representing the first nationwide commercial B2B slicing service in the U.S. Countries with coordinated regulatory frameworks, implementing clear coverage obligations, investment incentives, or infrastructure consolidation policies with deployment remedies, consistently outperform those with fragmented or reactive approaches, reinforcing the report’s finding that policy has emerged as a primary competitive differentiator in 5G SA outcomes globally.
Download the full report
For the comprehensive analysis of 5G SA and 5G Advanced deployment, performance, and monetization across global markets, including new research on battery life, voice performance, quality of experience, geopolitical context, and expanded policy case studies from the UK, France, Brazil, Japan, and the UAE, download the full report, 5G Standalone and 5G Advanced: A Global Reality Check on 5G SA and 5G Advanced in 2026.
Ookla retains ownership of this article including all of the intellectual property rights, data, content graphs and analysis. This article may not be quoted, reproduced, distributed or published for any commercial purpose without prior consent. Members of the press and others using the findings in this article for non-commercial purposes are welcome to publicly share and link to report information with attribution to Ookla.
Luke Kehoe leads Ookla’s research and thought leadership efforts in Europe.
An electronic engineering alumnus of University College Dublin, Luke has extensive experience collaborating with mobile operators, telecoms vendors, and government agencies in research and advisory roles across Europe. He has contributed to internationally recognised thought leadership publications in areas such as 5G, IoT, open RAN, and edge computing, working with prestigious organisations like the Telecom Infra Project and the World Economic Forum.
Mobile networks are entering a new phase in 2026. The focus has shifted from headline speed gains to how networks perform under pressure. Operators and regulators are asking a more practical question: can networks deliver reliable, low-latency, resilient connectivity under real-world stress?
The stakes of that question become clear in high-pressure moments. A packed stadium where thousands of users try to upload video at the same time. A busy city center during peak commuting hours. An industrial facility running latency-sensitive robotics. A regional power outage where mobile networks become the last remaining communications layer. In each case, peak throughput matters less than consistency, responsiveness, and continuity.
5G Standalone (5G SA) sits at the center of the shift toward latency, resilience, and real-world performance. The standalone 5G architecture promises lower latency, stronger quality-of-service controls, and a foundation for 5G Advanced. Yet global rollout remains uneven, monetization remains challenging, and policy debates around resilience and sovereignty are reshaping how telecom infrastructure is governed. The state of 5G SA in 2026 reflects all of those tensions at once.
5G Standalone removes the LTE anchor used in non-standalone (NSA) deployments and connects devices directly to a 5G core. That architectural shift reduces signaling overhead and gives operators greater control over latency, traffic management, and quality-of-service enforcement. In practical terms, it enables capabilities such as network slicing, uplink prioritization, and more predictable responsiveness.
Adoption levels, however, vary dramatically by region, and those differences have real performance and competitive consequences. According to Speedtest Intelligence data, China, for instance, has reached roughly 80% 5G SA sample share, reflecting nationwide commercial cores across major operators. India is approaching 50% penetration, though adoption is concentrated within one large operator.
Meanwhile, the United States is nearing one-third SA share as carriers expand commercialization, while much of Europe remains in the low single digits, as operators continue prioritizing returns on earlier NSA investments.
Several structural factors shape SA adoption:
Core deployment complexity: Moving to a standalone core involves integration across cloud infrastructure, vendors, and operations—it is not as simple as switching on new software.
Device configuration: Even when handsets are SA-capable, firmware activation and carrier provisioning can delay actual SA usage.
Plan migration: Commercial rollout depends on operators actively migrating subscribers onto SA-enabled plans, which does not happen automatically.
Spectrum mix and aggregation: The balance between low-band spectrum for coverage and mid-band spectrum for capacity—combined with effective carrier aggregation—determines whether SA delivers meaningful performance gains.
Real-world penetration ultimately depends on how much subscriber traffic actually migrates onto standalone networks. While standalone 5G is clearly expanding, the gap between leading and lagging markets is widening—and that fragmentation will shape competitive dynamics heading into 2026.
Latency Is Where 5G SA Makes Its Most Meaningful Difference
Latency is where the benefits of 5G SA become most visible. Fast download speeds remain critical for everyday experiences like streaming high-resolution video, downloading large files, or loading rich web content. But many emerging and mission-critical applications depend on responsiveness as well—often referred to in technical standards as Ultra-Reliable Low-Latency Communications (URLLC)— including real-time cloud collaboration, remote control of industrial equipment, interactive gaming, and AR-assisted workflows. In those environments, lower and more consistent latency can matter as much as, or more than, peak throughput.
Globally, 5G SA delivered roughly a 23% reduction in median latency compared with NSA deployments. In some markets, the improvement was even more pronounced:
Hong Kong (~43% improvement vs. NSA): The standalone architecture reduced signaling overhead and delivered materially faster multi-server responsiveness.
France (~31% improvement vs. NSA): Routing traffic fully through the 5G core improved latency levels and consistency compared with NSA.
Download performance also remained strong on 5G SA, although speed gains often reflect spectrum strategy (i.e., carrier aggregation and mid-band usage) as much as architecture. In Q3 2025, several markets stood out:
UAE (~1.2 Gbps median SA download): Aggressive mid-band deployment and strong carrier aggregation pushed median speeds above 1 Gbps.
South Korea (>700 Mbps median SA download): Mature 3.5 GHz mid-band deployment continued to deliver strong, sustained throughput.
United States (>300 Mbps median SA download): Expanded multi-band standalone rollout translated into steady, measurable download improvements year-over-year.
However, architecture alone does not guarantee superior user experience. Performance outcomes still depend heavily on deployment decisions and optimization. Several factors explain why results can vary across operators and markets:
Spectrum mix and coverage balance: Heavy mid-band deployments boost capacity but can struggle indoors without complementary low-band support. Low-band improves reach but limits peak speed.
Carrier aggregation strategy: Without effective aggregation and uplink tuning, standalone gains can level off under heavier traffic loads.
Core placement and routing efficiency: CDN proximity, User Plane Function placement, and peering strategy directly affect end-to-end latency—sometimes more than radio conditions do.
In some markets, latency to major cloud-hosted services improved significantly under SA, while gaming latency showed little change in Europe. That gap highlights an important reality: improvements in the radio network do not automatically translate into consistent gains across every application unless optimized.
5G SA delivers measurable performance improvements—particularly in latency. The strongest results appear when core architecture, spectrum strategy, and routing decisions are aligned with real-world usage patterns.
Monetization Remains the Central Question
5G SA’s technical case continues to grow stronger: latency improves, uplink performance becomes more predictable, and download speeds increase. Core-level control becomes more granular. But technical progress does not automatically translate into commercial returns. The monetization challenge heading into 2026 varies sharply between consumer and enterprise segments
Consumer Monetization
For most consumers, network architecture is invisible. They notice when streaming buffers, downloads drag, or apps feel sluggish, but they also notice whether their everyday connectivity feels stable or unreliable. Speed matters, but stability and predictability shape trust over time.
5G SA slices or 5QI configurations can support experiences that users already value:
Stable uplink performance: Creators uploading high-resolution video or backing up large files expect transfers to complete without mid-stream drops.
Reliable hotspot use in congested venues: Travelers tethering laptops in airports or conferences need connections that remain usable under load.
Automatic continuity during broadband outages: 5G backup for home Wi-Fi provides tangible value when fiber or cable service fails, and standalone architecture can help operators manage those connections more predictably.
Improved uplink scheduling, congestion management, and quality-of-service controls can enable these outcomes. However, consumers rarely pay a premium specifically for “standalone” architecture. Monetization is typically attached to reliability features, backup services, or tier differentiation rather than to core network branding.
Enterprise Monetization
Enterprise buyers evaluate networks differently. The question is less about peak speed and more about operational impact. When latency spikes disrupt automated workflows or when connectivity drops affect distributed operations, the cost is measurable.
5G SA aligns more directly with enterprise requirements for URLLC, where industrial automation and robotics depend on consistent, predictable responsiveness:
Predictable low latency: Industrial automation and robotics depend on consistent responsiveness.
Network slicing and traffic isolation: Critical applications require guaranteed resources and separation from general network congestion.
Integration with private and hybrid deployments: Enterprises need interoperability with on-prem systems and edge infrastructure.
Defined accountability: Service-level guarantees and monitoring matter more than only speed metrics.
Enterprise buyers focus on performance guarantees and operational continuity—not on the underlying network architecture. They pay for performance commitments that protect their operations from outages and instability. In several markets, enterprise deployments are contributing a larger share of 5G revenue growth than consumer plans, particularly in private and hybrid network use cases.
For operators, the question heading into 2026 is how to translate standalone’s technical gains into repeatable revenue streams.
Infrastructure Sovereignty Is Reshaping Telecom Strategy
In 2025, telecom infrastructure was increasingly treated as strategic national infrastructure, alongside energy, transport, and cloud computing. A series of resilience events reinforced that shift. Regional power outages showed how quickly cellular uptime can degrade when grid supply fails. Subsea cable disruptions exposed transport vulnerabilities. Cloud outages demonstrated that software-layer failures can affect network availability even when radio sites remain operational.
Resilience now spans multiple layers:
Site-level power autonomy: Backup batteries and generators determine how long networks operate during outages.
Transport redundancy: Multi-path routing reduces single points of failure.
Core and orchestration reliability: Software resilience affects service continuity.
Cloud infrastructure dependencies: Hyperscale outages can cascade into network degradation.
Policy frameworks are evolving accordingly. In Europe, proposals such as the Digital Networks Act emphasize coordination, resilience, and infrastructure security. Cybersecurity reforms are tightening vendor scrutiny, and broader industrial strategies increasingly link telecom policy to AI competitiveness and supply chain stability. Other major markets are pursuing parallel strategies, though with different emphases:
China continues integrating domestic AI development with telecom infrastructure, reinforcing alignment between network deployment and national technology priorities.
India is accelerating efforts to build local network stack capabilities, reducing reliance on foreign vendors while expanding 5G coverage.
The United States remains focused on reshoring initiatives and supply chain security, particularly in core infrastructure and semiconductor ecosystems.
Gulf markets are linking AI readiness and national digitization goals to rapid 5G Advanced deployment timelines.
Telecom strategy increasingly intersects with national resilience planning, industrial policy, and long-term economic competitiveness.
5G Advanced Builds on SA—6G Remains Under Scrutiny
5G SA provides the architectural foundation for 5G Advanced, which expands capabilities through software-driven enhancements. Early commercial deployments are emerging across China and parts of the Gulf, with additional announcements expected in 2026.
5G Advanced aims to extend:
Stronger uplink performance: As AI tools, cloud collaboration, and content creation generate more upstream traffic, networks need to handle sustained uploads, not just fast downloads, with enhanced carrier aggregation in the uplink
Better energy efficiency: Operators face mounting cost and sustainability pressure as traffic grows and networks densify.
Deeper automation and analytics: More advanced network intelligence supports faster optimization, fault detection, and capacity planning.
At the same time, 6G discussions are accelerating. Standards work continues, with commercial deployments projected closer to 2030.
However, many operators are still navigating SA migration and monetization challenges. For several regions, 6G may represent an efficiency-driven evolution rather than a headline speed revolution.
The central 6G question may not be peak performance. It may be whether future networks align effectively with a broader ecosystem that now includes hyperscale cloud providers, neutral host operators, private wireless deployments, and non-terrestrial networks.
Tying It All Together
The mobile market heading into 2026 is shaped less by headline speed claims and more by how networks perform in real-world conditions. 5G SA has delivered measurable technical gains, particularly in latency, but commercial and operational outcomes now depend on how effectively operators deploy, optimize, and position those capabilities.
Performance consistency, resilience under disruption, and alignment with enterprise and national infrastructure priorities are increasingly central to how networks are evaluated. The next phase of competition will be determined not just by faster radios, but by how well operators translate architectural progress into durable value.
For a deeper discussion of standalone performance trends, monetization tradeoffs, and the policy shifts shaping 2026, watch the full webinar on-demand.
Ookla retains ownership of this article including all of the intellectual property rights, data, content graphs and analysis. This article may not be quoted, reproduced, distributed or published for any commercial purpose without prior consent. Members of the press and others using the findings in this article for non-commercial purposes are welcome to publicly share and link to report information with attribution to Ookla.
Dave Andersen is a Marketing Program Manager at Ookla, where he creates enterprise and consumer content across Ookla’s brands. Dave got his start in the telco space in 2012, producing content for RootMetrics. Dave has a bachelors in marketing from Washington State University and studied creative writing in Oklahoma State’s MFA program.
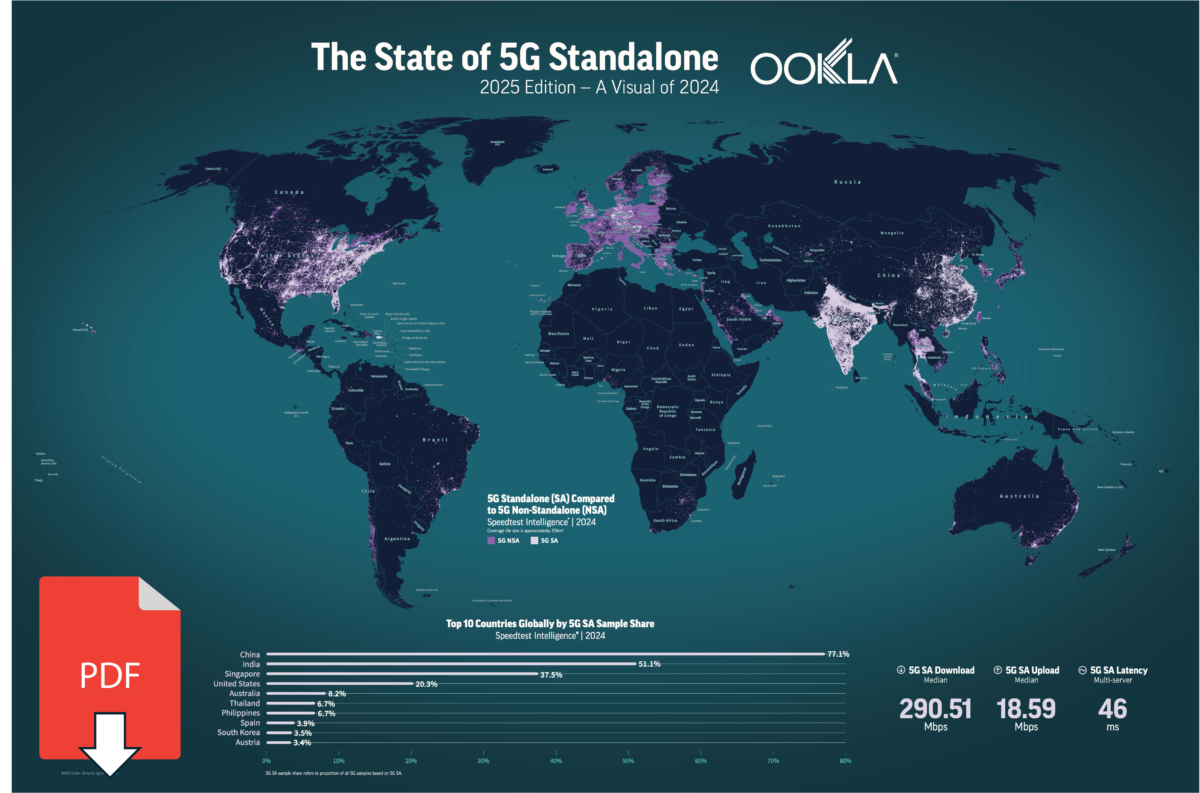
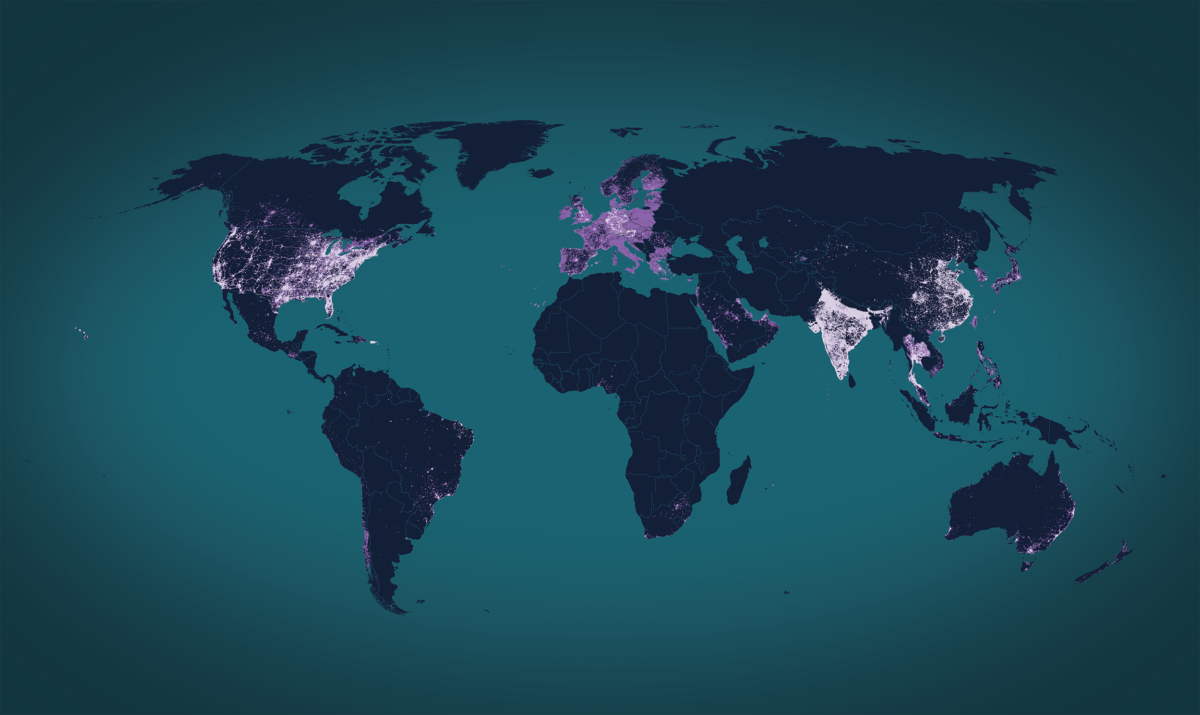
5G SA rollouts are accelerating globally, but device and tariff-side fragmentation continue to drag on real-world usage
Editor’s Note: The 5G SA map in this poster has been updated. The revised version uses Zoom Level 11 tile resolution, consistent with last year’s edition, to better capture full-year network patterns, particularly in highly urbanized markets like China.
The deployment of 5G Standalone networks is accelerating across a widening number of markets, driven by maturing device ecosystems, rising core network investment, and the growing commercial imperative to deliver the performance improvements that the SA architecture can enable. Despite this progress, the gap between operator-reported coverage of 5G SA networks and real-world usage of these networks continues to widen, held back by tariff inertia and device-side fragmentation in network access.
Regional disparities in commercialization progress persist, but the direction of travel is clear. Markets that were virtually absent from the 5G SA landscape a year ago are now registering meaningful deployment levels, and several advanced operators are pushing into the next evolutionary phase with early deployments of 5G Advanced capabilities built on the SA foundation, including new levels of spectrum depth through advanced carrier aggregation features.
Building on the success of last year’s inaugural edition, Ookla® has released an updated high-resolution downloadable poster based on Speedtest Intelligence® data, offering a unified view of the global reach of both 5G NSA and 5G SA networks through 2025. This visual accompanies a new flagship global study in collaboration with Omdia, comparing the competitiveness of leading regions and countries in 5G SA deployment, performance, and monetization.
Key Takeaways
Asia Pacific continues to lead in 5G SA reach, but new entrants are reshaping the global leaderboard
In 2025, six of the top ten countries by 5G SA reach were in Asia Pacific, with China (79.0% 5G SA sample share), India (49.2%), and Singapore (37.0%) maintaining dominant positions globally. China’s lead has been reinforced by multi-operator SA deployments across all major carriers, while India’s position reflects the deep nationwide low-band coverage strategy pushed by Reliance Jio on the 700 MHz band, supplemented by growing mid-band SA rollout. Singapore’s strong showing, meanwhile, reflects the favorable deployment conditions provided by a small landmass and very high urbanization.
The United States (27.6%) has continued its upward trajectory, propelled by T-Mobile’s maturing SA network and commercial launches by both AT&T and Verizon for the first time during the year, while Australia (15.4%) has similarly benefited from multi-operator SA deployments. Thailand (8.5%) and the Philippines (9.0%) round out the Asia Pacific contingent, reflecting growing SA ambitions in Southeast Asia. The UAE (8.0%) has entered the top ten for the first time, signaling a geographic diversification of SA adoption beyond advanced Asian markets. Austria (8.0%) and Spain (8.1%) remain the only European markets in the upper ranks, though the region’s broader trajectory has shifted meaningfully.
APAC Claims 6 of Top 10 Spots in Global 5G SA Reach
Speedtest Intelligence® | 2025
The U.S. sustains its 5G SA performance lead, while the UAE and South Korea demonstrate the ceiling for optimized networks
The United States now combines relatively high 5G SA reach with strong download speeds, a combination that is unusual globally. In Q4 2025, median download speeds on 5G SA in the U.S. reached 403.97 Mbps, building on the gains recorded in the prior year, and significantly ahead of large-scale Asian deployments such as China (212.40 Mbps) and India (222.11 Mbps).
T-Mobile’s “layer cake” spectrum strategy remains the foundation of U.S. 5G SA performance. By pairing broad 600 MHz coverage, initially launched as 5G NSA in 2019 before transitioning to SA in 2020, with dense mid-band deployment in the 2.5 GHz band, the operator has matured its SA network to the point where advanced features such as uplink carrier aggregation and Voice over NR (VoNR) are now widely deployed. Recent 5G SA launches by AT&T and Verizon have extended multi-operator coverage and added the U.S. to the small but burgeoning list of Western markets in which all operators now support nationwide 5G SA networks.
At the top of the global performance table, the UAE has emerged as the clear leader in absolute 5G SA download speeds, registering a median of 1.24 Gbps in Q4 2025. This result is driven by large, contiguous TDD mid-band deployments, intensive carrier aggregation, and site grid densification by Etisalat and du. South Korea sustains its position as a high-performance market at 766.92 Mbps, propelled by its exclusive use of the 3.5 GHz band for 5G, though it continues to trail regional peers in SA reach due to limited commercialization beyond KT. This marks a notable shift from the global leadership South Korea held at the start of the 5G cycle.
5G SA delivers performance uplift across key metrics, but real-world gains in QoE require more than just a core migration
Globally, 5G SA networks are delivering materially improved performance compared to the non-standalone architecture, and the performance gains have held even as SA deployments mature with higher traffic onboarding. In Q4 2025, median download speeds on 5G SA were more than 120% higher than on NSA networks in North America, 57% higher in advanced Asia and Oceania, and 45% higher in Europe. The regional variation reflects differences in spectrum depth, network maturity, and the degree to which operators have activated advanced SA features such as carrier aggregation, rather than any inherent advantage of SA in downlink performance.
Headline latency improvements, a touted beneficiary of the transition to the 5G core, continue to be significant. SA networks delivered median multi-server latency reductions of more than 27% in advanced Asia and Oceania, nearly 24% in North America, and 17% in Europe compared to NSA. However, it is important to note that a standalone core migration alone does not guarantee a better end-user experience in real-world applications. Our quality of experience (QoE) analysis reveals a nuanced picture. SA improves video and cloud infrastructure latency in Europe versus NSA, but underperforms NSA for gaming latency within the same region. North America records the lowest absolute SA cloud and gaming latency, consistent with dense hyperscaler adjacency and mature interconnect ecosystems.
Among European markets, France (41 ms to cloud endpoints), Austria (48 ms), and Finland (50 ms) demonstrate what is achievable where backbone quality, peering density, and routing discipline are strong. These outcomes reflect an underappreciated end-to-end network stack optimization dividend, encompassing data-center proximity, fiber backhaul depth, and user-plane topology, rather than a pure “SA dividend” alone.
The upload story has begun to diverge by region. North America’s SA networks deliver 54% higher upload speeds than NSA, reflecting the early implementation of advanced uplink capabilities. In Europe, however, the upload advantage is just 6%, highlighting the still nascent deployment of features such as higher-order MIMO and uplink carrier aggregation in the region beyond leading countries like the United Kingdom. Advanced Asia and Oceania sit in between at 21%, suggesting that the ecosystem for advanced SA uplink capabilities remains at an early stage in most global markets.
A detailed analysis of the state of 5G SA and 5G Advanced around the world is featured in Ookla’s flagship report, produced in collaboration with Omdia, on regional competitiveness in the technology.
Ookla will be at Mobile World Congress this year, located at Booth 2I28 in Hall 2. Please drop by to discuss the state of connectivity in your market, and how Ookla’s network insights can help deliver better connected experiences.
Ookla retains ownership of this article including all of the intellectual property rights, data, content graphs and analysis. This article may not be quoted, reproduced, distributed or published for any commercial purpose without prior consent. Members of the press and others using the findings in this article for non-commercial purposes are welcome to publicly share and link to report information with attribution to Ookla.
Luke Kehoe leads Ookla’s research and thought leadership efforts in Europe.
An electronic engineering alumnus of University College Dublin, Luke has extensive experience collaborating with mobile operators, telecoms vendors, and government agencies in research and advisory roles across Europe. He has contributed to internationally recognised thought leadership publications in areas such as 5G, IoT, open RAN, and edge computing, working with prestigious organisations like the Telecom Infra Project and the World Economic Forum.
Mobile networks are entering a new phase in 2026. The story is no longer limited to coverage expansion or ultra fast download speeds. Operators, regulators, and enterprise buyers are increasingly focused on whether networks can deliver the reliability, responsiveness, and the capacity needed to support new services under real-world conditions—measured not just by download speeds, but by how networks behave under load, during disruptions, and in latency-sensitive use cases.
That shift is happening alongside meaningful changes in network architecture. Standalone 5G (5G SA) is gaining ground in multiple markets, and early 5G Advanced launches are building on SA foundations. Network resilience also is receiving far more scrutiny after a year of high-profile disruption events. At the same time, satellites are taking on a bigger role, from redundancy to direct-to-device (D2D) connectivity.
This article examines what those changes mean for 2026, including where 5G SA is expanding, why resilience has become a priority, how D2D is reshaping coverage assumptions, along with why AI-driven traffic is forcing networks to rethink uplink speed and latency. For a deeper discussion of these trends by Ookla Research’s analyst team, watch our webinar, From 5G SA to D2D and AI: What Ookla’s Analysts Say About the Year Ahead in Mobile.
Standalone 5G Expands, but Progress Varies Sharply by Region
Standalone 5G continues to grow, but the transition from non-standalone (NSA) deployments looks very different depending on the region. Ookla Speedtest data shows that the APAC region still leads global 5G SA deployment and adoption, reaching roughly 33% penetration by Q3 2025. Growth has begun to plateau slightly year-over-year, which suggests slower rollout or slower migration from NSA among existing 5G users, rather than a lack of initial SA capability.
Within APAC, China stands out for the scale and consistency of SA availability. China reached roughly 80% 5G SA sample share in our results, reflecting nationwide commercial SA cores across all major operators rather than limited or city-level deployments. India has also become a meaningful SA market since launching in 2023, though India’s SA growth has been driven largely by a single operator, resulting in rapid uptake but less uniform national availability.
Other regions show progress, but the gap remains large:
North America: Incremental SA expansion. North America’s SA penetration climbed to 27% sample penetration in Q3 2025, up from 18% in the previous year, as operators expanded SA on top of existing 5G coverage rather than building new networks from scratch.
Japan and South Korea: Cautious migration. Japan and South Korea reached approximately 10% SA penetration at the end of 2025, reflecting cautious migration from mature NSA deployments.
Europe: Core transition lag. Europe remains at just over 2% SA penetration, as many operators continue to prioritize returns on earlier NSA investments and delay full core transitions.
Gulf region: Early launches, limited scale. The Gulf region is close behind Europe at roughly 1.7%, despite early commercial launches and aggressive public timelines.
Europe and the Middle East still trail in SA penetration, but both regions have accounted for a large share of newer commercial SA deployments in recent months. While adoption remains low today, recent launches indicate that SA is moving from trials to broader commercial rollout in these markets.
5G SA Performance Gains Are Clear—Latency Tells the Story
5G SA performance improvements are visible across multiple metrics, but latency stands out as the most meaningful indicator of what SA enables. Download speeds on SA have reached new highs in several markets. For example, in Q3 2025 the UAE led with a median SA download speed of roughly 1.2 Gbps, followed by South Korea (740 Mbps), and Greece (~500 Mbps). The U.S., which was a leading country on SA speeds in 2024, reached over 318 Mbps median SA download speeds in 2025.
Download speed remains a useful benchmark, but multi-server latency shows the deeper value of SA architecture. Standalone architecture removes reliance on an LTE anchor and reduces signaling overhead, which consistently delivers better latency than NSA. Globally, 5G SA delivered a 23% reduction in median latency compared with 5G NSA. Certain markets recorded even sharper improvements, including:
Hong Kong: latency improvement of ~43% vs NSA
France: latency improvement of ~31% vs NSA
Latency improved in several markets in 2025. Hong Kong recorded multi-server latency below 17 ms, followed by Macau (19 ms), Singapore (~21 ms), and Switzerland (~23 ms). This latency improvement likely reflects a shorter path between the device and the core network under SA5G.
Standalone 5G provides the architectural foundation for 5G Advanced—the next phase of 5G evolution. 5G Advanced is a software-driven upgrade that expands SA-based capabilities and performance. China has driven early adoption, with a reported 50 million 5G Advanced users in 2025. Operators in Bahrain, Kuwait, Saudi Arabia, and the UAE have launched commercial 5G Advanced services or announced availability plans. Trials have expanded across Europe, South America, and Asia, and additional commercial announcements are expected in 2026. In the United States, operators such as T-Mobile have begun positioning nationwide standalone networks as the foundation for future 5G Advanced capabilities, with broader feature enablement expected as standards and device ecosystems mature.
For operators, the central question remains monetization. Consumer monetization of 5G SA features like network slicing remains limited in many markets, while enterprise use cases map more directly to 5G SA and 5G Advanced capabilities. Lower latency, stronger quality-of-service controls, and more predictable performance align more naturally with enterprise and industrial requirements than with everyday consumer usage.
Network Resilience Becomes Both a Policy Priority and a Service Differentiator
Network resilience moved into sharper focus in 2025 after several high-profile disruption events demonstrated how quickly connectivity degrades when power, transport, or cloud dependencies fail. Power outages, subsea cable disruptions, and cloud service failures each exposed different failure modes, but the outcome was the same: mobile availability dropped when users needed it most.
At its core, resilience comes down to two factors: maintaining essential connectivity during unplanned shocks and restoring service quickly once disruption occurs. Analysis of the Iberian Peninsula blackout showed a direct relationship between grid failure and cellular uptime. When power failed, mobile service degraded rapidly, and recovery timelines varied significantly by operator, depending on backup power duration at sites, transport redundancy, and restoration processes.
Resilience challenges extend beyond physical infrastructure. Backup generators and battery autonomy remain critical, but recent cloud outages illustrate how service degradation can originate in software and cloud systems, not just the underlying network. Site-level hardening alone does not prevent outages when orchestration platforms or cloud services fail, turning software reliability into a network availability issue even when radio sites remain powered and functional.
Operators and regulators are responding:
Network design and redundancy: Operators are investing in circuit diversity, multi-path design, and improved site-level power autonomy to reduce single points of failure.
Resilience as a service feature: Some operators are beginning to treat resilience as a differentiator, bundling it into consumer offerings such as automatic cellular (4G/5G) backup for home Wi-Fi, helping households stay online when the primary broadband connection goes down.
Regulatory power requirements: Regulators in several markets are pushing harder on minimum hours of battery autonomy or generator requirements, in some cases scaling requirements by population density or site criticality.
Resilience is no longer a low-profile engineering topic. Indeed, resilience has become part of customer experience, national infrastructure planning, and regulatory oversight.
Direct-to-Device Connectivity Is Moving from Novelty to Commercial Reality
Direct-to-device (D2D) satellite connectivity is moving from early trials toward limited commercial availability. Standard smartphones can now connect directly to satellites without specialized hardware, extending basic connectivity beyond the reach of terrestrial networks.
Early deployments show growing usage. Operators in the United States, along with markets such as Canada and New Zealand, have moved past pilot phases, reporting sustained messaging activity rather than purely emergency use. Several technical and commercial models are developing at the same time, ranging from smartphone-native satellite messaging to operator-partnered satellite services that reuse existing cellular spectrum. Several technical and commercial models are developing at the same time, ranging from smartphone-native satellite messaging to operator-partnered satellite services that reuse existing cellular spectrum.
D2D is unlikely to replace terrestrial mobile networks, but it is reshaping expectations around coverage and resilience. Satellite connectivity increasingly serves as a fallback layer during outages and a coverage extender in hard-to-reach areas, reducing reliance on additional tower builds alone.
AI Is Forcing Networks to Rethink Upload and Latency Requirements
AI-driven applications are starting to change how networks are used. Unlike video streaming, which is overwhelmingly download-heavy, AI interactions generate sustained upstream data and place greater emphasis on responsiveness, shifting network planning priorities toward upload capacity and latency.
Forecast data suggests enterprise AI traffic will continue to grow. Ericsson reports AI-driven traffic trending toward a more symmetrical pattern—approximately 74% download and 26% upload—compared with the historical 90/10 ratio. Current 5G networks in many markets still deliver upload ratios between 6% and 15%, highlighting a growing mismatch between emerging AI demand and existing network configurations.
Latency requirements also become more complex under AI workloads. Basic LLM queries and voice assistants are less sensitive to latency fluctuations, but agentic AI (multi-step AI systems that take actions) and other time-sensitive systems are not.
Current cloud infrastructure latency often averages around 35 ms, which is generally sufficient for many consumer AI interactions. Industrial robotics, AR systems, and autonomous applications introduce tighter responsiveness expectations, where delays can compound across multi-step workflows. These lower-latency requirements are pushing networks toward architectural changes:
Standalone 5G adoption: Supporting more consistent, low-latency performance
Edge compute and hybrid inference: Reducing latency by moving processing closer to the user
AI changes both user behavior and network traffic patterns, increasing pressure on uplink capacity, latency targets, and overall capacity planning.
Looking Ahead to 6G
6G discussions are accelerating, but the industry remains cautious. Standards development is underway, with many expecting completion around 2028 and commercial deployments closer to 2030. Spectrum debates are intensifying, and policy moves are starting to shape the direction of future networks, including U.S. focus on the 7 GHz band.
Even with that momentum, the business case for 6G remains under scrutiny, largely because many operators are still working through standalone 5G migration, monetization, and return-on-investment challenges. Operators in several regions are likely to treat 6G less as a hardware refresh cycle and more as a software-driven evolution focused on efficiency, sustainability, and operational improvement.
In that context, the most important 6G question may not be peak performance. The bigger question is whether 6G can align with a broader connectivity ecosystem that increasingly includes:
Cloud providers such as AWS, Microsoft Azure, and Google Cloud
Shared in-building wireless operators (“neutral hosts”) that support multiple carriers in venues like airports and stadiums
Private wireless networks deployed and managed by enterprises
Non-terrestrial networks such as satellite connectivity
New competition for the customer relationship beyond traditional mobile operators
Tying it All Together
The 2026 mobile market is being shaped by real infrastructure shifts. Standalone 5G is expanding, latency performance is becoming a higher priority, and early 5G Advanced deployments are building on SA foundations. Network resilience has become a public priority, and satellite connectivity is taking on a larger role that includes direct-to-device services. AI is also changing the profile of demand, pushing networks to rethink uplink planning, latency targets, and edge architecture.
Operators, regulators, and enterprise buyers are no longer judging networks only on download speeds. The conversation has expanded to include uptime, responsiveness, redundancy, and the ability to support new workloads under real-world conditions.
Ookla retains ownership of this article including all of the intellectual property rights, data, content graphs and analysis. This article may not be quoted, reproduced, distributed or published for any commercial purpose without prior consent. Members of the press and others using the findings in this article for non-commercial purposes are welcome to publicly share and link to report information with attribution to Ookla.
Dave Andersen is a Marketing Program Manager at Ookla, where he creates enterprise and consumer content across Ookla’s brands. Dave got his start in the telco space in 2012, producing content for RootMetrics. Dave has a bachelors in marketing from Washington State University and studied creative writing in Oklahoma State’s MFA program.
More than five years after the technology first hit Latin America’s shores, 5G is now floating through many of the region’s countries. In some leading areas, 5G speeds are rising and 5G signals abound.
But Latin America’s steps into a 5G future have been uneven. In some countries – like Brazil – the technology has managed to spread far and wide, and download speeds have reached impressive milestones. Users’ satisfaction often tracks with these improvements. In other countries – like Mexico – the rollout of 5G has been a stutter-step affair, with some operators making progress while others fall behind. And in some countries, like Peru, 5G remains in its early days.
Still, there are some hints that advanced 5G services are now making their way into the Latin American region. 5G Standalone (SA) connections are beginning to pop up. 5G private wireless networks are multiplying. And 5G fixed wireless access (FWA) is paving a way for mobile network operators to move beyond the smartphone opportunity among consumers.
Key takeaways:
Brazil shows clear leadership in many 5G metrics. The country’s median 5G speeds reached 430.83 Mbps in the third quarter of 2025, according to Ookla Speedtest® data, the highest in the region. And 38.5% of the country’s 5G users spent a majority of their time connected to 5G networks, placing Brazil third in this metric, behind Uruguay and Puerto Rico (an unincorporated territory of the United States considered part of Latin America).
Not surprisingly, spectrum contributes directly to operators’ 5G performance. 5G providers with 100 MHz of spectrum in the 3.5 GHz band – such as Personal Argentina, Claro Brasil, and Vivo Brasil – generally offer 5G speeds above 300 Mbps.
There are some signals that more advanced technologies are on their way. In the third quarter of 2025, 5G SA connections showed up in Brazil (1.6% of all 5G connections) and Puerto Rico (41.1% of all 5G connections). Moreover, FWA is now available to a growing number of customers in countries like Brazil, Colombia, Mexico, and elsewhere. And 5G private wireless networks are beginning to pop up too.
The tangled history of 5G and Latin America
Uruguay’s state-owned operator Antel, along with vendor Nokia, claimed the first 5G network in Latin America in 2019, using short-range millimeter wave spectrum. The move reflected Uruguay’s ambition to be a technological leader in the region. At just 68,037 square miles, Uruguay is one of the smallest countries in Latin America, making extensive 5G networks there somewhat easier to deploy, at least from a geographic coverage perspective.
But Uruguay’s 5G efforts since then have been somewhat symbolic of the region’s wider struggles to deploy speedy 5G connections on a widespread basis. In 2025 – more than five years after its first foray into 5G – Antel deployed a total of 500 5G cell sites, each with 100 MHz worth of midband 3.5 GHz spectrum. This kind of spectrum supports the speedy, widespread connections often associated with 5G. It was released to Antel in 2023.
Perhaps Latin America’s biggest 5G launch came a year after Antel’s first 5G announcement, in 2020, when Brazil’s three big mobile network operators launched 5G with Dynamic Spectrum Sharing (DSS) technology. Like Antel in Uruguay, this launch too was mostly symbolic, considering DSS allows 5G signals to piggyback on existing 4G LTE spectrum. It generally doesn’t support the snappy speeds available through fat chunks of midband spectrum. Brazil’s real 5G inflection point occurred the following year, in 2021, when the country’s regulator released wide swathes of midband 3.5 GHz spectrum to operators.
Some of Mexico’s operators also stepped into 5G around this same time. For example, AT&T Mexico launched 5G services in the 2.5 GHz band in 2021. And América Móvil’s Telcel used its existing 3.5 GHz holdings for a 5G launch in 2022, eventually expanding the service to 125 cities and 10 million subscribers by 2025.
These launches helped unlock a wave of spectrum auction activity in other leading Latin American countries like Argentina and Colombia in 2023. Other markets continue to trail, however. For example, Costa Rica completed its own 3.5 GHz auction at the beginning of 2025, while Peru wrapped up its 3.5 GHz auction in September 2025.
Speedy connections, if you can get them
The results of all this 5G activity are now clear:
5G Speeds Across Latin America
Speedtest Intelligence | Q3 2025
Brazil’s performance was good enough to place it fourth globally in the latest issue of the Speedtest Global IndexTM for mobile performance, behind only the United Arab Emirates, Qatar, and Kuwait.
But commercial 5G launches don’t necessarily equate to widespread 5G connections. Ookla’s Speedtest Intelligence tracks 5G availability, which measures the percentage of 5G active users connected to 5G a majority of the time, based on when a 5G icon is displayed on their device.
Here’s how leading Latin American counties shake out in this ranking:
5G Availability Across Latin America
Speedtest Intelligence | Q3 2025
To put this into perspective, Canada’s overall 5G availability rating clocked in at 73.2% in the third quarter of 2025, while the U.S. sat at 75.2%.
These results are also noteworthy given the relative popularity of fiber networks in Latin American countries like Peru and Chile. Fiber typically supplies the internet piping that powers high-speed 5G cell sites.
To be clear, these broad 5G results in Latin America are due to a confluence of factors. First, operators must get access to suitable spectrum. For 5G, that typically involves large blocks of midband spectrum between 2.5 GHz and 4 GHz. Then, they must invest into the equipment and cell towers necessary to broadcast 5G signals across their spectrum license territories.
And then, of course, they must also sell enough 5G devices and service plans to make that investment worthwhile.
Measuring the importance of spectrum
Spectrum is often described as the “lifeblood” of the wireless industry, and certainly it’s a critical starting block to any successful 5G offering. In Latin America, it’s clear that some regulators not only share this view but have also put it into action.
For example, Brazil’s 2021 spectrum auction was notable in its scale. Major operators in the country – América Móvil’s Claro, TIM Brasil, and Telefônica Brasil’s Vivo – each acquired massive spectrum blocks (100 MHz per operator). Those fat chunks of spectrum – coupled with the speed that Brazil’s regulator, Anatel, free up the spectrum for commercial use – are main reasons why Brazil tops Speedtest charts for the Latin American region.
Other countries have made various efforts at matching Brazil’s lead. For example, Chile, Colombia, Argentina, and Peru have all aligned on the 3.5 GHz band for 5G. Specifically, Colombia’s 2023 auction released four blocks of spectrum in the 3.5 GHz band – each of them 80 MHz wide – to each of the country’s four operators. And Argentina’s 2023 auction released 100 MHz blocks to América Móvil’s Claro and Personal in the 3.3–3.6 GHz range.
This symmetry in spectrum and timing helps ensure economies of scale for 5G equipment across the region, particularly for operators with systems in multiple countries.
Broadly, these spectrum allocations – particularly the breadth of spectrum allocated to each operator – track directly to network performance:
Another important factor in this discussion of spectrum is the manner by which regulators free up spectrum for 5G operators. For example, Brazil’s 2021 auction wasn’t solely designed to funnel auction revenues into government coffers. Instead, Brazilian telecom regulator Anatel allowed auction winners to pay for a portion of their licenses through investment obligations. Meaning, operators can pay for their spectrum by deploying it. Regulators in other countries like Peru have employed a similar strategy, waiving a portion of operators’ annual spectrum fees for 5G deployments in rural or unserved areas.
Meanwhile, Mexico’s approach to spectrum allocation may stand as a cautionary tale. According to the GSMA, Mexico’s spectrum costs are established every year by the country’s Congress, and “this yearly approval process creates uncertainty, as it is impossible for mobile operators to anticipate how these fees will evolve,” the trade association wrote. Indeed, Telefónica’s Movistar in Mexico returned its spectrum holdings to regulators in 2022 in order to become an MVNO on AT&T Mexico’s network. More recently, Mexico’s telecom regulator cancelled a spectrum auction due to a lack of resources.
Broadly, the average amount of spectrum assigned to mobile network operators in Latin American countries increased by 51% between 2016 and 2024, from 267 MHz to 403 MHz, according to the GSMA. But that’s significantly less than the global average, which was 574 MHz in 2024.
Nonetheless, the situation is still developing. According to the GSMA, Paraguay and Peru were among the handful of countries that held spectrum auctions in the third quarter of 2025. And Bolivia, Ecuador, and Colombia are among the countries that have scheduled additional spectrum auctions in the future.
Of course, once regulators release spectrum, operators must then put it into action.
5G shows faster speeds, and faster speeds satisfy
América Móvil is Latin America’s regional 5G behemoth. But the company’s overall capital expenses (capex) have been slowing in recent years following significant spending on spectrum and network infrastructure. Specifically, América Móvil’s capex outlay reached $8.6 billion in 2023, but fell to $7 billion last year. For 2025, the company is on track to spend $6.7 billion.
That slowdown in spending coincides with Telefonica’s exit from many Latin American markets with 5G, due to its plans to focus on its “core” markets in Europe and Brazil.
Millicom, meanwhile, is the company positioned to replace Telefónica as the region’s second-largest telecom operator. Millicom invests over $1 billion annually in its fixed and mobile networks, according to one detailed report on the company’s operations. But that doesn’t necessarily mean Millicom plans to inject 5G into its growing Latin American mobile footprint. Millicom officials have suggested an emphasis on fiber and 4G, deploying 5G only at “the best time.”
There’s also the question of what 5G equipment operators ought to spend all their capex on. Here emerges the Huawei question: Should Latin American operators heed U.S. cybersecurity warnings about the use of gear from Chinese suppliers like Huawei? Many have not.
Despite intense political debate on the topic, Brazil did not ban Huawei as part of its early 5G auctions. Consequently, Huawei supplies significant portions of the 5G radio access network (RAN) for the country’s three big operators. Operators in Peru and Mexico also use equipment from Chinese vendors.
But Huawei doesn’t have a lock on the Latin American market. For example, Sweden’s Ericsson is the sole 5G supplier for Entel Chile. In Argentina, Telefónica’s Movistar selected Ericsson for its network modernization to 5G-ready standards. And América Móvil’s Claro in Colombia and Argentina, and TIM Brasil, selected Finland’s Nokia for broad 5G deployments.
Regardless, once operators pay for the equipment to put 5G to work, they often have some clear progress to show:
And faster speeds can also be traced to customers’ satisfaction. Speedtest Intelligence data in Mexico shows a correlation between swift connections and happy subscribers.
Still, offering faster speeds is just a first step. Operators must also package 5G connections in a way that’s attractive to potential customers. Here too there are signs of forward progress. For example, América Móvil’s Telcel in Mexico promotes 5G to its prepaid users – a nod to the fact that more than 80% of Mexican mobile users subscribe to prepaid plans. And América Móvil’s Claro in Brazil touts the speed of its 5G network in support of its deal with OpenAI to offer ChatGPT to its mobile customers.
As a result of such efforts, GSMA Intelligence predicts 5G will spread to 50% of all Latin American mobile connections by 2030, or 410 million people. That’s just below the 57% global average expected by the firm in that year.
SA, private wireless and FWA hint at the future
The “Non-Standalone” (NSA) version of 5G was released first, and it has been widely adopted on a global basis. However, the “Standalone,” or SA, iteration of 5G is sometimes referred to as the “true” version of 5G. That’s partly because 5G SA doesn’t rely on a 4G core network like the “Non-Standalone” (NSA) version of 5G does. SA also supports advanced services such as network slicing (a technology that can funnel select types of user traffic into speedier pipes).
In Latin America’s shift to SA, Brazil is a standout. According to Speedtest data, roughly 1.6% of all 5G samples in Brazil used 5G SA technology in the third quarter of 2025. Only Puerto Rico ranked higher, with 41.1% of 5G samples using 5G SA technology. That’s likely thanks to T-Mobile’s network in the country; T-Mobile made an early move to 5G SA technology throughout its U.S. operations.
According to GSMA Intelligence, Argentina, Colombia, and Costa Rica are the other Latin American countries with commercial SA networks. But those connections are not yet showing up in Speedtest sample sizes that are statistically relevant.
That said, FWA may be a more tangible service that hints at a future enabled by 5G technology. Fixed wireless allows 5G operators (those with suitable spectrum holdings and FWA-capable equipment) to provide broadband connections into users’ homes and offices. FWA can serve as an alternative to wired connections in remote or rural areas – or as a competitive response to other fixed internet providers.
GSMA Intelligence counts roughly a dozen Latin American countries with FWA services.
Again, Brazil looks the standout here. For example, Claro in Brazil launched its 5G+ FWA offering in 2023 with speeds up to 1 Gbps. The company’s plans cap customers’ monthly usage starting at 200 GB per month. Similarly, Telefônica Brasil’s Vivo launched its Box 5G in 2024 with a 150 GB per month cap.
And Brisanet, a regional challenger in Brazil, is aggressively pursuing 5G FWA with larger data caps. The company counted 37,000 FWA customers in its most recent quarter.
Other Latin American countries are seeing similar FWA outcroppings. América Móvil’s Claro in Colombia launched FWA in 2024 with a 160 GB monthly cap. In Mexico, AT&T’s Internet en Casa offers speeds of around 10 Mbps. And Personal in Argentina counts around 50,000 FWA users.
Yet another signal of the maturation of 5G in Latin America is the arrival of 5G private wireless networks, which can be used by enterprises for applications ranging from autonomous mining to oil refining to industrial manufacturing. These kinds of operations are increasingly popping up in countries including Brazil and Chile.
Regardless, the advancement of FWA, as well as 5G SA, private wireless networks, and other advanced technologies, show that some Latin American denizens are seeing the promise of 5G. This can be attributed to efficient and forward-looking regulators, significant financial commitments by some operators, and a desire among users for ever-faster connections.
But 5G is still in its early days across the full Latin American region, with many countries still lagging significantly in broad 5G rollouts. Spectrum costs – such as those in Mexico – contribute. So too do regulatory delays, such as those that have slowed spectrum auctions in places like Colombia. And that all can affect operator interest in 5G, as seen by Millicom’s intention to continue to leverage 4G until the time for 5G rolls around.
5G en América Latina: focos de evolución
Algunos países de la región muestran claros avances en 5G, mientras que otros aún no han logrado un gran progreso.
Más de cinco años después de que la tecnología llegara por primera vez a las costas de América Latina, el 5G está ahora presente en muchos países de la región. En algunas áreas líderes, las velocidades 5G están aumentando y las señales 5G abundan.
Pero los pasos de América Latina hacia un futuro 5G han sido desiguales. En algunos países, como Brasil, la tecnología ha logrado extenderse a lo largo y ancho de la geografía, y las velocidades de descarga han alcanzado hitos impresionantes. La satisfacción de los usuarios a menudo va a la par de estas mejoras. En otros países, como México, el despliegue del 5G ha sido un proceso a trompicones, con algunos operadores avanzando mientras que otros se quedan atrás. Y en países como Perú, el 5G sigue en sus primeras etapas.
Aun así, hay indicios de que los servicios avanzados de 5G están llegando a la región latinoamericana. Las conexiones 5G Standalone (SA) están comenzando a aparecer. Las redes privadas inalámbricas 5G se están multiplicando. Y el acceso inalámbrico fijo (FWA) 5G está abriendo un camino para que los operadores de redes móviles vayan más allá de la oportunidad del smartphone entre los consumidores.
Conclusiones clave:
Brasil muestra un claro liderazgo en muchas métricas de 5G. La velocidad mediana de 5G del país alcanzó los 430.83 Mbps en el tercer trimestre de 2025; según datos de Ookla Speedtest®, la más alta de la región. Y el 38.5% de los usuarios de 5G del país pasaron la mayor parte de su tiempo conectados a redes 5G, lo que sitúa a Brasil en tercer lugar en esta métrica, detrás de Uruguay y Puerto Rico.
Como era de esperar, el espectro contribuye directamente al rendimiento 5G de los operadores. Los proveedores de 5G con 100 MHz de espectro en la banda de 3.5 GHz, como Personal Argentina, Claro Brasil y Vivo Brasil, generalmente ofrecen velocidades 5G superiores a 300 Mbps.
Hay algunas señales de que tecnologías más avanzadas están en camino. En el tercer trimestre de 2025, las conexiones 5G SA aparecieron en Brasil (1.6% de todas las conexiones 5G) y Puerto Rico (41.1% de todas las conexiones 5G). Además, el FWA está ahora disponible para un número creciente de clientes en países como Brasil, Colombia, México y otros. Y las redes privadas inalámbricas 5G también están empezando a surgir.
La intrincada historia del 5G y América Latina
El operador estatal de Uruguay, Antel, junto con el proveedor Nokia, desplegó la primera red 5G en América Latina en 2019, utilizando espectro de onda milimétrica de corto alcance. La medida reflejó la ambición de Uruguay de ser un líder tecnológico en la región. Con solo 68,037 millas cuadradas, Uruguay es uno de los países más pequeños de América Latina, lo que hace que las redes 5G extensas sean algo más fáciles de implementar allí, al menos desde una perspectiva de cobertura geográfica.
Pero los esfuerzos de 5G de Uruguay desde entonces han sido algo simbólicos de las luchas más amplias de la región para desplegar conexiones 5G rápidas de forma generalizada. En 2025, más de cinco años después de su primera incursión en el 5G, Antel desplegó un total de 500 emplazamientos celulares 5G, cada uno con 100 MHz de espectro de banda media de 3.5 GHz. Este tipo de espectro es compatible con las conexiones rápidas y generalizadas a menudo asociadas con el 5G. Fue liberado a Antel en 2023.
Quizás el mayor lanzamiento de 5G en América Latina se produjo un año después del primer anuncio de 5G de Antel, en 2020, cuando los tres grandes operadores de redes móviles de Brasil lanzaron 5G con tecnología Dynamic Spectrum Sharing (DSS). Al igual que Antel en Uruguay, este lanzamiento también fue en su mayoría simbólico, considerando que el DSS permite que las señales 5G se monten en el espectro 4G LTE existente. Generalmente no es compatible con las velocidades rápidas disponibles a través de grandes porciones de espectro de banda media. El verdadero punto de inflexión del 5G en Brasil ocurrió al año siguiente, en 2021, cuando el regulador del país liberó amplias franjas de espectro de banda media de 3.5 GHz a los operadores.
Algunos de los operadores de México también se adentraron en el 5G en esta misma época. Por ejemplo, AT&T México lanzó servicios 5G en la banda de 2.5 GHz en 2021. Y Telcel de América Móvil utilizó sus tenencias existentes de 3.5 GHz para un lanzamiento de 5G en 2022, expandiendo finalmente el servicio a 125 ciudades y 10 millones de suscriptores para 2025.
Estos lanzamientos ayudaron a desbloquear una ola de actividad de subastas de espectro en otros países líderes de América Latina como Argentina y Colombia en 2023. Sin embargo, otros mercados continúan a la zaga. Por ejemplo, Costa Rica completó su propia subasta de 3.5 GHz a principios de 2025, mientras que Perú concluyó su subasta de 3.5 GHz en septiembre de 2025.
Conexiones rápidas, si las puedes conseguir
Los resultados de toda esta actividad 5G son ahora claros:
Velocidades 5G en toda Latinoamérica
Speedtest Intelligence | Q3 2025
El rendimiento de Brasil fue lo suficientemente bueno como para situar al país en cuarto lugar a nivel mundial en la última edición del Speedtest Global IndexTM en rendimiento móvil, solo por detrás de Emiratos Árabes Unidos, Catar y Kuwait.
Pero los lanzamientos comerciales de 5G no equivalen necesariamente a conexiones 5G generalizadas. Speedtest Intelligence de Ookla rastrea la disponibilidad de 5G, que mide el porcentaje de usuarios activos de 5G conectados a 5G la mayor parte del tiempo, basándose en el momento en que se muestra un icono de 5G en su dispositivo.
Así es como se clasifican los principales países de América Latina en este ranking:
Disponibilidad 5G en toda Latinoamérica
Speedtest Intelligence | Q3 2025
Para poner esto en perspectiva, la calificación general de disponibilidad de 5G de Canadá se situó en el 73.2% en el tercer trimestre de 2025, mientras que la de EE. UU. se situó en el 75.2%.
Estos resultados también son dignos de mención dada la popularidad relativa de las redes de fibra en países latinoamericanos como Perú y Chile. La fibra generalmente suministra la tubería de internet que alimenta los emplazamientos celulares 5G de alta velocidad.
Para ser claros, estos amplios resultados de 5G en América Latina se deben a una confluencia de factores. Primero, los operadores deben obtener acceso a un espectro adecuado. Para el 5G, generalmente implica grandes bloques de espectro de banda media entre 2.5 GHz y 4 GHz. Además, deben invertir en el equipo y las torres celulares necesarios para transmitir señales 5G a través de sus territorios de licencia de espectro.
Y luego, por supuesto, también deben vender suficientes dispositivos y planes de servicio 5G para que esa inversión valga la pena.
Midiendo la importancia del espectro
El espectro a menudo se describe como el “alma” de la industria inalámbrica y, ciertamente, es un bloque de partida crítico para cualquier oferta 5G exitosa. En América Latina, está claro que algunos reguladores no solo comparten esta opinión, sino que también la han puesto en acción.
Por ejemplo, la subasta de espectro de Brasil de 2021 fue notable en su escala. Los principales operadores del país —Claro de América Móvil, TIM Brasil y Vivo de Telefônica Brasil— adquirieron cada uno bloques masivos de espectro (100 MHz por operador). Esas grandes porciones de espectro, junto con la velocidad con la que el regulador de Brasil, Anatel, liberó el espectro para uso comercial, son las principales razones por las que Brasil encabeza las listas de Speedtest para la región latinoamericana.
Otros países han realizado diversos esfuerzos para igualar el liderazgo de Brasil. Por ejemplo, Chile, Colombia, Argentina y Perú se han alineado en la banda de 3.5 GHz para 5G. Específicamente, la subasta de Colombia de 2023 liberó cuatro bloques de espectro en la banda de 3.5 GHz —cada uno de 80 MHz de ancho— a cada uno de los cuatro operadores del país. Y la subasta de Argentina de 2023 liberó bloques de 100 MHz a Claro de América Móvil y Personal en el rango de 3.3 a 3.6 GHz.
Esta simetría en el espectro y el momento ayuda a garantizar economías de escala para los equipos 5G en toda la región, particularmente para los operadores con sistemas en múltiples países.
En términos generales, estas asignaciones de espectro, particularmente la amplitud del espectro asignado a cada operador, se correlacionan directamente con el rendimiento de la red:
Otro factor importante en esta discusión sobre el espectro es la forma en que los reguladores liberan el espectro para los operadores de 5G. Por ejemplo, la subasta de Brasil de 2021 no fue diseñada únicamente para canalizar los ingresos de la subasta a las arcas del gobierno. En cambio, el regulador de telecomunicaciones brasileño, Anatel, permitió a los ganadores de la subasta pagar una parte de sus licencias a través de obligaciones de inversión. Es decir, los operadores pueden pagar su espectro desplegándolo. Los reguladores de otros países como Perú han empleado una estrategia similar, eximiendo una parte de las tarifas anuales de espectro de los operadores para despliegues de 5G en zonas rurales o no atendidas.
Mientras tanto, el enfoque de México para la asignación de espectro puede ser una advertencia. Según la GSMA, los costos del espectro de México son establecidos cada año por el Congreso del país, y “este proceso de aprobación anual crea incertidumbre, ya que es imposible para los operadores móviles anticipar cómo evolucionarán estas tarifas”, escribió la asociación comercial. De hecho, Movistar de Telefónica en México devolvió sus tenencias de espectro a los reguladores en 2022 para convertirse en un MVNO en la red de AT&T México. Más recientemente, el regulador de telecomunicaciones de México canceló una subasta de espectro debido a la falta de recursos.
En términos generales, la cantidad promedio de espectro asignado a los operadores de redes móviles en los países latinoamericanos aumentó en un 51% entre 2016 y 2024, de 267 MHz a 403 MHz, según la GSMA. Pero eso es significativamente menor que el promedio mundial, que fue de 574 MHz en 2024.
No obstante, la situación sigue desarrollándose. Según la GSMA, Paraguay y Perú se encontraban entre el puñado de países que celebraron subastas de espectro en el tercer trimestre de 2025. Y Bolivia, Ecuador y Colombia se encuentran entre los países que han programado subastas de espectro adicionales en el futuro.
Por supuesto, una vez que los reguladores liberan el espectro, los operadores deben ponerlo en acción.
El 5G muestra velocidades más rápidas, y velocidades más rápidas son satisfactorias
América Móvil es el gigante regional de 5G de América Latina. Pero los gastos de capital (capex) generales de la compañía se han ralentizado en los últimos años después de un gasto significativo en espectro e infraestructura de red. Específicamente, el capex de América Móvil alcanzó los 8.6 mil millones de dólares en 2023, pero cayó a 7 mil millones el año pasado de dólares. Para 2025, la compañía va en camino de gastar 6.7 mil millones de dólares.
Esa desaceleración en el gasto coincide con la salida de Telefónica de muchos mercados latinoamericanos con 5G, debido a sus planes de centrarse en sus mercados “centrales” en Europa y Brasil.
Millicom, mientras tanto, es la empresa posicionada para reemplazar a Telefónica como el segundo operador de telecomunicaciones más grande de la región. Millicom invierte más de mil millones de dólares anualmente en sus redes fijas y móviles, según un informe detallado sobre las operaciones de la compañía. Pero eso no significa necesariamente que Millicom planee inyectar 5G en su creciente huella móvil latinoamericana. Los funcionarios de Millicom han sugerido un énfasis en la fibra y el 4G, desplegando 5G sólo en “el mejor momento”.
También existe la cuestión de en qué equipos 5G deberían gastar los operadores todo su capex. Aquí surge la pregunta de Huawei: ¿deberían los operadores latinoamericanos prestar atención a las advertencias de ciberseguridad de EE. UU. sobre el uso de equipos de proveedores chinos como Huawei? Muchos no lo han hecho.
A pesar del intenso debate político sobre el tema, Brasil no prohibió a Huawei como parte de sus primeras subastas de 5G. En consecuencia, Huawei suministra porciones significativas de la red de acceso de radio (RAN) 5G para los tres grandes operadores del país. Los operadores de Perú y México también utilizan equipos de proveedores chinos.
Pero Huawei no tiene el control total del mercado latinoamericano. Por ejemplo, la sueca Ericsson es el único proveedor de 5G para Entel Chile. En Argentina, Movistar de Telefónica seleccionó a Ericsson para su modernización de red a estándares listos para 5G. Y Claro de América Móvil en Colombia y Argentina, y TIM Brasil, seleccionaron a Nokia de Finlandia para amplios despliegues de 5G.
En cualquier caso, una vez que los operadores pagan por el equipo para poner el 5G a trabajar, a menudo tienen un progreso claro que mostrar:
Y las velocidades más rápidas también se pueden relacionar con la satisfacción de los clientes. Los datos de Speedtest Intelligence en México muestran una correlación entre las conexiones rápidas y los suscriptores contentos.
Aun así, ofrecer velocidades más rápidas es sólo un primer paso. Los operadores también deben empaquetar las conexiones 5G de una manera que sea atractiva para los clientes potenciales. Aquí también hay señales de progreso. Por ejemplo, Telcel de América Móvil en México promueve el 5G a sus usuarios de prepago, un guiño al hecho de que más del 80% de los usuarios móviles mexicanos se suscriben a planes de prepago. Y Claro de América Móvil en Brasil promociona la velocidad de su red 5G en apoyo de su acuerdo con OpenAI para ofrecer ChatGPT a sus clientes móviles.
Como resultado de tales esfuerzos, GSMA Intelligence predice que el 5G se extenderá al 50% de todas las conexiones móviles latinoamericanas para 2030, o 410 millones de personas. Eso está justo por debajo del promedio mundial del 57% esperado por la firma en ese año.
SA, redes privadas y FWA insinúan el futuro
La versión “No Autónoma” (Non-Standalone, NSA) de 5G se lanzó primero y ha sido ampliamente adoptada a nivel mundial. Sin embargo, la iteración “Autónoma”, o SA, de 5G a veces se denomina la versión “verdadera” de 5G. Eso se debe en parte a que 5G SA no se basa en una red central 4G como lo hace la versión “No Autónoma” (NSA) de 5G. SA también es compatible con servicios avanzados como el network slicing (una tecnología que puede canalizar tipos selectos de tráfico de usuarios a canales más rápidos).
En la transición de América Latina a SA, Brasil es un caso destacado. Según los datos de Speedtest, aproximadamente el 1.6% de todas las muestras de 5G en Brasil utilizaron tecnología 5G SA en el tercer trimestre de 2025. Solo Puerto Rico ocupó un lugar más alto, con un 41.1% de las muestras de 5G utilizando tecnología 5G SA. Es probable que esto se deba a la red de T-Mobile en el país; T-Mobile hizo un movimiento temprano hacia la tecnología 5G SA en todas sus operaciones en EE. UU.
Según GSMA Intelligence, Argentina, Colombia y Costa Rica son los otros países latinoamericanos con redes SA comerciales. Pero esas conexiones aún no aparecen en tamaños de muestra de Speedtest que sean estadísticamente relevantes.
Dicho esto, el FWA puede ser un servicio más tangible que insinúa un futuro habilitado por la tecnología 5G. El fixed wireless o acceso inalámbrico fijo permite a los operadores de 5G (aquellos con tenencias de espectro adecuadas y equipos compatibles con FWA) proporcionar conexiones de banda ancha a los hogares y oficinas de los usuarios. El FWA puede servir como una alternativa a las conexiones por cable en áreas remotas o rurales, o como una respuesta competitiva a otros proveedores de internet fijo.
GSMA Intelligence cuenta aproximadamente una docena de países latinoamericanos con servicios FWA.
Una vez más, Brasil parece ser el destacado aquí. Por ejemplo, Claro en Brasil lanzó su oferta 5G+ FWA en 2023 con velocidades de hasta 1 Gbps. Los planes de la compañía limitan el uso mensual de los clientes a partir de 200 GB por mes. De manera similar, Vivo de Telefônica Brasil lanzó su Box 5G en 2024 con un límite de 150 GB por mes.
Y Brisanet, un retador regional en Brasil, está buscando agresivamente 5G FWA con límites de datos más grandes. La compañía contó con 37.000 clientes FWA en su trimestre más reciente.
Otros países latinoamericanos están experimentando afloramientos de FWA similares. Claro de América Móvil en Colombia lanzó FWA en 2024 con un límite mensual de 160 GB. En México, Internet en Casa de AT&T ofrece velocidades de alrededor de 10 Mbps. Y Personal en Argentina cuenta con alrededor de 50.000 usuarios de FWA.
Otra señal de la maduración del 5G en América Latina es la llegada de las redes inalámbricas privadas 5G, que pueden ser utilizadas por empresas para aplicaciones que van desde la minería autónoma hasta el refinado de petróleo y la fabricación industrial. Este tipo de operaciones están apareciendo cada vez más en países como Brasil y Chile.
En cualquier caso, el avance del FWA, así como el del 5G SA, las redes inalámbricas privadas y otras tecnologías avanzadas, muestran que algunos habitantes de América Latina están viendo la promesa del 5G. Esto se puede atribuir a reguladores eficientes y con visión de futuro, compromisos financieros significativos por parte de algunos operadores y un deseo entre los usuarios de conexiones cada vez más rápidas.
Pero el 5G todavía está en sus primeras etapas en toda la región, con muchos países aún rezagados significativamente en los amplios despliegues de 5G. Los costos del espectro, como los de México, contribuyen. También lo hacen los retrasos regulatorios, como los que han ralentizado las subastas de espectro en lugares como Colombia. Y todo eso puede afectar al interés de los operadores en el 5G, como se ve en la intención de Millicom de seguir aprovechando el 4G hasta que llegue el momento del 5G.
Ookla retains ownership of this article including all of the intellectual property rights, data, content graphs and analysis. This article may not be quoted, reproduced, distributed or published for any commercial purpose without prior consent. Members of the press and others using the findings in this article for non-commercial purposes are welcome to publicly share and link to report information with attribution to Ookla.
Mike Dano is a Lead Industry Analyst in Ookla’s research and content team. He covers the North and South American markets, and global technology trends. Previously, Mike was a journalist covering the global telecom industry for 25 years at publications including RCR Wireless News, Fierce Network and Light Reading.
As 5G networks continue to mature globally, the industry is witnessing a pivotal shift toward 5G Standalone (5G SA) architecture, which offers significant performance improvements compared to the initial Non-Standalone (NSA) 5G deployments that began in 2019. This evolution to 5G SA represents not just a technical upgrade but a fundamental reimagining of what mobile networks can deliver to both consumers and enterprises.
The global 5G SA landscape shows significant regional variations in deployment strategies, performance metrics, and monetization approaches. Using network data from Speedtest Intelligence® and market analysis from Omdia, this article looks at the current state of 5G SA development across different regions and the innovative ways operators are working to monetize these investments.
For a deeper dive into these topics, including expert analysis and interactive data visualizations, watch our recent webinar featuring Ookla and Omdia analysts. Additionally, our collaborative study with Omdia – “Global Evaluation of Europe’s Digital Competitors in 5G Standalone” – provides comprehensive analysis of 5G SA networks, their performance benchmarks, and the business considerations telecom operators face.
Global 5G SA Deployment Status
Understanding where different regions stand in their 5G journey is crucial for operators planning their network evolution and investment strategies with 5G SA. The global landscape of 5G SA deployment shows striking variations that reflect different market priorities, regulatory environments, and competitive dynamics.
Our analysis shows that China, India, and the U.S. have established clear leadership in 5G SA deployment, with China showing over 80% 5G SA sample share in Ookla’s network measurement data. Meanwhile, Europe lags significantly behind, despite the European Commission setting some of the most ambitious 5G infrastructure targets of any advanced liberal economy.
These regional disparities highlight the different approaches operators are taking, with some focusing on early competitive launches (to maintain network leadership and cater to the premium market segment), while others are being more cautious and balancing deployment against investment constraints. Several key trends are shaping the global 5G SA landscape:
Regional momentum: Despite a slow start, the EMEA region has accelerated its deployment pace, accounting for 70-75% of commercial SA launches in the last two years, with Spain and Austria emerging as regional leaders.
Performance gains: 5G SA is delivering consistent improvements across markets, particularly in reducing latency and providing faster median download speeds, with the U.S. emerging as a global performance leader through T-Mobile’s multi-band spectrum strategy.
Regulatory impact: Government funding programs and regulatory requirements have proven effective in driving deployment, with countries like Spain (Unico funding program), the U.K. (merger-related coverage obligations), and Germany (spectrum auction conditions) showing stronger progress.
The data clearly shows that no one-size-fits-all approach works for 5G SA deployment, with operators in each market pursuing strategies that reflect their specific circumstances. Countries implementing targeted regulatory measures and spectrum strategies are showing stronger progress, suggesting that supportive policy frameworks play a significant role in accelerating deployment.
Consumer 5G Monetization Strategies
Many operators have struggled to increase average revenue per user (ARPU) despite significant 5G investments over the last several years. With 5G Standalone technology, operators now have new opportunities to create premium offerings that customers truly value, moving beyond simply selling larger data packages.
The most successful operators are finding ways to turn technical capabilities like faster speeds, lower latency, and guaranteed service levels into premium services that target specific customer groups. A recent Omdia survey of 19,000 consumers showed people are willing to pay more for specific benefits like faster speeds, priority video streaming, location-based speed boosts, reduced gaming lag, and better performance for work applications. These consumer preferences are already translating into real-world offerings, with several innovative approaches emerging across markets:
Speed tiers: Elisa in Finland offers SA-enabled “5G Plus Premium” with an 18% price premium over standard 5G service
Performance guarantees: Three Austria provides bandwidth guarantees for 5G home internet, with premium tiers commanding a 23% price premium
Event-based services: Singtel offers special “Event Pass” options for sporting events and concerts, giving customers priority connections when networks are congested
Gaming packages: Deutsche Telekom’s 5G Plus Gaming service combines reduced lag times with a bundle of over 100 games for €10
Priority connections: U.K. operators target premium subscribers with “Network Boost” and “5G Ultra” services that provide prioritized connections in crowded areas
These early examples demonstrate a clear shift toward more targeted service offerings. Operators are finding that different customer segments have different priorities and different willingness to pay for enhanced services, and the most successful approaches recognize these differences rather than treating all customers the same. While premium operators pursue advanced technical capabilities and guarantees, value-focused providers can still compete effectively with simpler offerings at competitive price points.
Fixed Wireless Access (FWA) Opportunities
5G Standalone technology is helping operators deliver competitive home internet service through Fixed Wireless Access (FWA), creating new revenue streams beyond mobile subscriptions. The approach varies by market, but the enhanced capabilities of SA networks — particularly through network slicing (creating dedicated virtual sections of the network for different services) — allow operators to deliver reliable home broadband while ensuring mobile customers maintain a good experience.
Effective FWA strategies depend heavily on local market conditions. Some operators use FWA to compete with traditional broadband providers, while others focus on underserved areas where fiber deployment is impractical. Key FWA deployment patterns include:
Dedicated capacity management: Operators like Elisa use network slicing to separate FWA traffic from mobile traffic, protecting their valuable smartphone customers while delivering better home internet performance
Market-specific strategies: U.S. operators have enough spectrum to deploy FWA widely without needing to separate traffic, while European operators in markets with extensive fiber networks must be more selective about where they offer FWA service
Targeted customer segments: FWA appeals to specific customer groups like students and temporary residents who value flexibility, while also serving as an alternative in areas underserved by traditional broadband
Competitive positioning: Mobile-only operators use FWA as an entry point into the home to compete with traditional broadband providers
FWA represents a significant opportunity for operators leveraging 5G SA capabilities. Our webinar highlighted how FWA approaches vary significantly by market, with operators adapting their strategies based on spectrum resources, existing broadband infrastructure, and competitive dynamics. These tailored approaches allow operators to target specific customer segments and market gaps where FWA offers the most compelling advantages.
Conclusion
The transition to 5G SA represents both a technical evolution and a business opportunity, but success requires understanding what consumers actually value. Beyond raw speed, consumers care about a consistent quality of experience, and the good news is that 5G SA is already delivering tangible improvements in network performance and the user experience.
Operators deploying 5G SA are recognizing that different customer segments have distinct priorities. By creating tailored offerings that address these needs — whether for entertainment, productivity, or other use cases — they are turning 5G SA’s technical advantages into services consumers are willing to pay more for.
Ookla retains ownership of this article including all of the intellectual property rights, data, content graphs and analysis. This article may not be quoted, reproduced, distributed or published for any commercial purpose without prior consent. Members of the press and others using the findings in this article for non-commercial purposes are welcome to publicly share and link to report information with attribution to Ookla.
Dave Andersen is a Marketing Program Manager at Ookla, where he creates enterprise and consumer content across Ookla’s brands. Dave got his start in the telco space in 2012, producing content for RootMetrics. Dave has a bachelors in marketing from Washington State University and studied creative writing in Oklahoma State’s MFA program.
Reliability-led differentiation hinges on low-band reach, mid-band density, and diversified core interconnects
Portugal’s mobile operators are on the defensive as DIGI scales its low-cost, flexible offers. With aggressive pricing across converged bundles that undercut the market by a wide margin, the Romanian disruptor is compressing margins at the value end, driving elevated churn and forcing operators to raise retention opex through cheaper flanker brands and shorter contract terms.
By choosing a rapid greenfield own-build rather than a national roaming agreement, DIGI has kept competition price-led rather than coverage-led. This has elevated network reliability as the established operators’ principal strategic moat and encouraged them to leverage their more mature infrastructure across Portugal as a core differentiator. The Iberian grid blackout earlier this year underscored the point: limited power autonomy and weak geo-redundancy in a greenfield network stack contributed to markedly poorer resilience outcomes, as revealed by first-of-its-kind analysis of background signal scans using Ookla® data.
The established operators’ are now seeking to copper-fasten their resilience and reliability credentials through heavy capital spending on network modernization, focused on diversifying spectrum use for more capable carrier aggregation, commercializing 5G Standalone (SA), and densifying the grid footprint.
To quantify how the network reliability race is unfolding in Portugal’s mobile market, we independently measured performance using RootMetrics’ controlled methodology on the latest Samsung flagship handsets. Testing in 1H 2025 covered indoor and outdoor locations across Lisbon, Porto, Madeira, the Azores, and an extensive national route. Combining walk and drive testing in high-usage areas, we covered more than 9,500 km and collected nearly 110,000 samples, including 146 indoor sites. The methodology is designed to mirror real-world network performance.
Key Takeaways:
MEO and Vodafone lead Portugal in network reliability. MEO prioritizes a wide, contiguous mid-band layer almost everywhere, underpinned by extensive low-band coverage. This yields the highest access and task success on the national route and the fastest call setup times in Portugal, as well as driving its Best 5G award based on Speedtest® data in 1H 2025. Vodafone, for its part, tops access latency and video task reliability in Lisbon and Porto, helped by advanced use of carrier aggregation, a deep low-band layer, and well-peered core paths.
NOS reaps a first-mover advantage from its expanding 5G SA footprint. The operator’s 5G SA deployments remain heavily urban-weighted, with 56% of Lisbon samples on the new core architecture versus 9% on the national route. Its strategy is to deploy 5G SA where there is dense mid-band (3.5 GHz) and carrier aggregation, and to fall back to NSA and low-band spectrum (700 MHz) elsewhere. The latency benefits of moving to the 5G core are validated by NOS’s leading video start times and access latency nationally.
DIGI’s network is mid-band-centric on narrow spectrum with limited carrier aggregation. The early-stage profile of the rollout is evident in its disproportionate reliance on the 2.6 GHz band and the absence of a low-band layer, which constrains coverage reach and increases handover exposure, weighing on network reliability. It does, however, deliver strong 5th percentile performance and national call setup times that are competitive with leader MEO, yet its time on 5G remains materially below the incumbents in every geography tested.
Regional network performance disparities persist in Portugal. Performance is poorer on Madeira and in the Azores because radio grids are sparser and rely more on low-band spectrum to span difficult terrain, so devices see fewer mid-band carriers and less carrier aggregation. Lower time on 5G leads to more frequent moves between network generations, increasing the risk of late handovers and task failures. Core breakout and peering are also less distributed, so traffic often routes via longer paths to mainland gateways, adding delay at busy times.
Network reliability challenges operators to optimize networks across RAN and core layers
MEO and Vodafone Lead in Network Reliability across Portugal
RootMetrics® | 1H 2025
To compare, in a scientifically robust way, how operators’ network investments translate into reliability in Portugal, RootMetrics’ controlled testing asks a simple question: when a user starts a task, does it complete without failing? Tens of thousands of “connect and complete” tests spanning calls, data uploads and downloads, and texts are conducted across varied routes and locations, then aggregated into a single Reliability score. The score is weighted toward data (75%), including calls (20%) and texts (5%) to reflect today’s real-world usage patterns.
The methodology rewards successful starts and uninterrupted completion and penalizes blocks, drops, and timeouts. Since each test follows the full path from device to radio to core to service edge, the results reflect end-to-end robustness rather than any single parameter:
Call Reliability (20% overall weight): This measures voice connection stability. It assigns more weighting to blocking (user presses call and the network refuses or never sets it up) over dropping (the call starts but ends unexpectedly), because initial failures tend to disrupt user intent more profoundly.
Blocking often rises during load spikes when signalling or media resources are exhausted at busy venues or during emergencies. Dropping usually increases with poor radio conditions and handover problems, for example low SINR and coverage gaps in rural areas.
Data Reliability (75% overall weight): This measures whether devices can establish a secure, usable data path (access success) and complete common transfers (task success) without stalls or timeouts. It covers both download and upload under light tasks such as webpage loads and heavier tasks such as file transfers, rewarding successful setup and uninterrupted completion and penalizing setup failures, timeouts, and mid-flow resets.
Even in cases where users see full signal bars on their device, data reliability components like task success can decline due to factors like packet loss and TCP resets (e.g., at a busy stadium) or poor mid-transfer handover (e.g., while on a high-speed train).
Text Reliability: (5% overall weight): This measures the ability to send and receive texts consistently, both within the same operator and across operators.
While text performance is usually robust, it can fail during incidents that span interconnect outages, misrouted numbering, spurious anti-spam filtering or queue backlogs.
Analysis of the controlled testing data in Portugal reveals the most reliable networks consistently combine adequate mid-band capacity to keep the median user out of congestion, meaningful use of low-band spectrum to lift access and task success at the cell edge and indoors, and tight integration between core and radio layers that keeps call setup fast and access latency low.
DIGI’s greenfield buildout gathers pace as established operators focus on RAN modernization and grid densification
DIGI’s commercial launch in Portugal in November 2024 has triggered a flurry of defensive moves by the country’s established operators. Confronted with a sharp rise in churn and renewed ARPU pressure, they have pushed more aggressive retention offers and leaned on low-cost flanker brands. DIGI’s disruptive model has reset reference pricing for entry-level mobile and convergent bundles. Even where rivals have not matched the headline tariffs, their flanker brands now cluster around €8 to €15 for 100 GB tiers to compete with DIGI’s eye-catching plans from as little as €4 for 50 GB, as well as seeking to limit cannibalization of their core brands.
Analysis of ANACOM data on subscriptions and site counts show DIGI’s rise has been exceptional. By Q1 2025 it already held over 3% of mobile internet subscriptions and rolled out 2,385 5G sites. With no national roaming and no low-band spectrum, it has concentrated capex on rapid coverage, densifying urban and suburban grids to compete on performance and offset the less favourable propagation of its mid-band holdings.
Vodafone and NOS Feature Largest 5G Site Footprint in Portugal
ANACOM | Q1 2025
The maturity of the established operators’ infrastructure, and the imperative to defend their network performance moat, puts them at a very different point in the 5G investment cycle to DIGI. MEO, for example, is partway through a multi-year RAN modernization and swap to Nokia, diverting capex into replacing legacy equipment and lifting performance and energy efficiency across its footprint.
NOS and Vodafone, which share mobile infrastructure under a MORAN arrangement (no spectrum sharing) in rural and interior areas to lower site costs and deepen rural coverage, have built leading 5G footprints after earlier, front-loaded expansion capex. NOS in particular has sought to differentiate through early 5G SA commercialization, marketing its Nokia-supplied 5G core as “5G+” and touting higher uplink speeds, lower latency, and better device battery life. MEO has since followed suit and deployed 5G SA atop its 3.5 GHz sites.
Mid-band depth and a 700 MHz underlay puts MEO at the frontier of network access and task success nationally
MEO’s relatively smaller 5G site footprint has driven a focus on efficient spectrum use over sheer volume as it ramps up site expansion (30% increase in 5G site count over the last year, the fastest rate of any operator in the period). Its balanced strategy leans on mid-band capacity with low-band for coverage extension. MEO recorded the highest share of 3.5 GHz (n78) usage in every geography in testing, operating a wide 90 MHz channel nationally. The contiguous mid-band block is the most extensively deployed in Portugal, with more than two-thirds of national route samples using it, 76-80% the islands, and 88% in Lisbon.
Outside dense urban areas like Lisbon and Porto, the operator makes extensive use of the 700 MHz (n28) band as a coverage layer. Nationally, roughly one-third of 5G samples were on 5 MHz of 700 MHz, while Lisbon’s 700 MHz share fell below 10% and the islands sat between 20 and 22%. This strategy maximizes mid-band time-on-air and keeps modulation high for the median user while preserving coverage probability at the edge, which reduces access failures and video stalls.
Because its low-band channel is narrower than rivals (Vodafone and NOS use 10 MHz), its overall 5G site footprint is smaller, and its spectrum mix beyond 700 MHz and 3.5 GHz is limited, with little carrier aggregation and sparse use of 2.1 GHz, devices on MEO’s network spend less time on 5G than those on Vodafone and NOS.
MEO Leads on Call Setup Times, while Vodafone Features Lowest Call Drop Rate
RootMetrics® | 1H 2025 – National Route
Despite this, MEO co-led reliability on the national route, delivering the highest access and task success and the fastest call setup at about 1.8 seconds. Madeira showed the same pattern, with MEO leading on access and task success, best call setup, and top overall reliability. In Lisbon and Porto, MEO was neck and neck with Vodafone on access and task success, and slightly ahead on call drop rate in the capital. The takeaway is that a higher share of time on 5G (enjoyed by Vodafone and NOS thanks to a larger 5G site footprint) and greater use of carrier aggregation does not automatically translate into a more consistent network experience.
Intensive use of carrier aggregation drives spectrum diversity across Vodafone’s site footprint
By Q4 2024, Vodafone’s extensive 5G site footprint placed it alongside NOS for time spent on 5G. In the testing, 84% of Vodafone samples were based on 5G nationally, compared with 66% for MEO and 27% for DIGI. Vodafone’s network profile closely mirrors NOS’s even in passively shared urban areas outside the regions where the pair engage in active sharing, with both showing intensive use of carrier aggregation. Vodafone, unlike NOS, still lacks a 5G SA footprint.
The operator combines its contiguous 700 MHz (10 MHz) and 3.5 GHz (90 MHz) holdings through dual-carrier aggregation (2CC), creating a potent 100 MHz aggregated capacity layer. The 3.5 GHz width matches MEO’s but is 10 MHz narrower than NOS’s. Across the national route, 2CC featured in just over one fifth of 5G samples, rising to a remarkable two-thirds of all samples in Lisbon and Porto. On the islands, where the grid is sparser, testing shows that Vodafone favours a balanced split between 700 MHz and 3.5 GHz for 5G with limited use of carrier aggregation.
Different 5G Spectrum Playbooks: Meo Prioritizes 3.5 GHz, NOS and Vodafone Leverage Carrier Aggregation
RootMetrics® | 1H 2025 (Observed Spectrum Use and Bandwidth, National Route)
Vodafone’s advanced use of 2CC lifts both peak and median performance, and it performs the strongest of all operators at the tail (5th percentile) nationally. This points to fair airtime sharing through effective resource scheduling and strong link adaptation that consistently selects the best modulation and coding, so performance at the cell edge or in busy cells holds up even when carrier aggregation is limited.
These outcomes translate into strong reliability. Vodafone jointly led overall network reliability with MEO in testing and led outright in the Azores, recording the lowest dropped call rate on the national route. In Lisbon and Porto, Vodafone delivered the best access latency and ranked first or joint first for video reliability, demonstrating that optimizations beyond deploying an SA core, such as short core paths and close CDN proximity, can drive strong results.
Early 5G SA underpins NOS’s lead in network responsiveness
Thetesting revealed that NOS features the most advanced network configuration in Portugal, combining a large and growing 5G SA footprint with the broadest range of carrier aggregation combinations. It also operates the largest 5G site grid, nearing 4,800 sites by Q4 2024, which put it neck and neck with Vodafone for time spent on 5G nationally at 84%.
Like Vodafone, NOS pairs a wide mid-band allocation (100 MHz at 3.5 GHz) with low-band spectrum (10 MHz at 700 MHz) and applies aggressive carrier aggregation across both NSA and SA. In Lisbon, 2CC was observed on 59% of samples, delivering the highest capacity configuration of any operator in Portugal at 110 MHz of aggregated spectrum, thanks to the wider mid-band block. On the national route, 2CC appeared in 20% of samples. Notwithstanding this, NOS showed a notably lower use of the 3.5 GHz band on the national route, at 32% of samples, compared with Vodafone at 37% and MEO at 67.6%.
NOS’s first mover advantage in 5G SA is translating into superior access responsiveness and faster video starts in cities. In Lisbon, 94% of samples were on 5G and 56% on SA, delivering the quickest video start at about 530 ms; in Porto it again posted the quickest start at about 540 ms. Outside dense areas, where SA represents only 9% of 5G usage on the national route, NOS still led these metrics, indicating disciplined core routing with clean CDN peering (traffic exiting core close to the user) and a fast, low-latency scheduler that delivers a quick first byte regardless of SA.
Low-band absence drives DIGI to maximize mid-band buildout
DIGI’s greenfield buildout has had to do more with less. Lacking 700 MHz spectrum to anchor a wide-area 5G layer, it has leaned heavily on mid-band assets, which drives more frequent 4G fallback and patchier 5G access indoors and in rural areas. In testing, only 27% of samples on the national route were on DIGI’s 5G network (and only 16% in the Azores and 21% on Madeira), rising to 48% in Lisbon, highlighting the urban skew of its initial rollout.
The operator’s mid-band 5G deployments are concentrated on relatively narrow TDD carriers rather than a single wide 3.5 GHz channel, reflecting the limits of a non-contiguous assignment. DIGI’s two 3.5 GHz carriers are separated by 40 MHz: it initially held one 40 MHz block from the 2021 award and received another from NOWO earlier this year, while Dense Air retains spectrum between them. Carrier aggregation can soften some drawbacks of a split 3.5 GHz allocation, but there remains an inherent efficiency and device support gap for NR intra-band CA versus a single wide carrier, which is less favourable from an RF engineering perspective.
NOS and Vodafone Boast Advanced Carrier Aggregation Depth in Lisbon
RootMetrics® | 1H 2025 (Observed Network Architecture Share, Lisbon)
In Lisbon, about 98% of DIGI’s 5G samples were based on a 20 MHz block of 2.6 GHz (n41) spectrum. On the national route, its mix split more evenly across 3.5 GHz (mostly a 40 MHz n78 configuration, less than half the width of other operators’ n78 assignments) and 2.6 GHz (20 MHz in each of the n38 and n41 bands). It has deployed the 3.5 GHz band more extensively in Porto than in Lisbon, with 37% of time spent on that spectrum in the former.
The nascent nature of DIGI’s greenfield buildout is reflected in its trailing peers on overall network reliability in testing, with lower network access and task success rates across all regions. While it already shows strong performance in call setup time (joint-best with MEO), poor outcomes in call drop rate (behind peers) indicate that factors such as a sparse 5G anchor and handover instability continue to pull down performance.
Conclusion: No one-size-fits-all in the race for network reliability in Portugal
The diversity in spectrum assignments (frequencies, bandwidths, and contiguity), subscriber base profiles (size, location, and traffic demand), and network investment cycles (greenfield buildout, vendor swap, or simple RAN refresh) means Portugal’s operators must pull different levers in their pursuit of competitive differentiation through network reliability. Despite these differences, all operators share an emphasis on low-band coverage for reach, mid-band capacity for depth, diverse and robust core interconnections, and strategic CDN placement
MEO and Vodafone’s lead in overall network reliability stems from distinctly different approaches, with MEO leveraging aggressive deployment of a wide 3.5 GHz block nearly everywhere, while Vodafone applies advanced carrier aggregation selectively, highlighting that no single strategy fits all in the quest for superior reliability. Likewise, NOS’s early rollout of 5G SA is enhancing latency-sensitive performance, and DIGI is delivering strong initial results in metrics like call setup time.
Novo concorrente impulsiona uma corrida à fiabilidade de rede no mercado móvel português
A diferenciação baseada na fiabilidade assenta no alcance em faixa baixa, na densidade em faixa média e em interligações diversificadas no core
Os operadores móveis em Portugal encontram-se na defensiva à medida que a DIGI expande as suas ofertas de baixo custo e elevada flexibilidade. Com uma política de preços agressiva em pacotes convergentes que reduzem significativamente o valor médio de mercado, o operador romeno está a comprimir as margens no segmento de valor, a aumentar a rotatividade de clientes e a obrigar os operadores a reforçar os gastos operacionais de retenção através de marcas secundárias mais baratas e contratos de menor duração.
Ao optar por uma rápida construção de rede própria em vez de um acordo de roaming nacional, a DIGI manteve a concorrência centrada no preço e não na cobertura. Isso elevou a fiabilidade da rede ao estatuto de principal trunfo estratégico dos operadores estabelecidos, incentivando-os a tirar partido das suas infraestruturas mais maduras em todo o país como elemento diferenciador central. O apagão da rede ibérica ocorrido no início deste ano veio sublinhar esta realidade: a autonomia energética limitada e a fraca redundância geográfica de uma rede recém-construída contribuíram para resultados de resiliência significativamente inferiores, conforme demonstrado por uma análise inédita de varrimentos de sinal de fundo com base em dados da Ookla®.
Os operadores estabelecidos procuram agora cimentar as suas credenciais de resiliência e fiabilidade através de forte investimento de capital na modernização da rede, com foco na diversificação do uso de espectro para uma agregação de portadoras mais capaz, na comercialização do 5G Standalone (SA) e na densificação da malha de cobertura..Para quantificar como está a evoluir a corrida à fiabilidade de rede no mercado móvel português, medimos de forma independente o desempenho das redes utilizando a metodologia controlada da RootMetrics, com os mais recentes modelos topo de gama da Samsung.. Os testes realizados no primeiro semestre de 2025 abrangeram locais interiores e exteriores em Lisboa, Porto, Madeira, Açores e uma extensa rota nacional. Combinando testes em caminhada e condução em zonas de elevada utilização, cobrimos mais de 9.500 km e recolhemos cerca de 110.000 amostras, incluindo 146 locais interiores. A metodologia foi concebida para reproduzir o desempenho real das redes.
Principais conclusões:
A MEO e a Vodafone lideram em fiabilidade de rede em Portugal. A MEO privilegia uma camada de banda média ampla e contínua quase em todo o território, sustentada por uma cobertura extensiva em banda baixa. Este equilíbrio proporciona as melhores taxas de acesso e de sucesso de tarefas na rota nacional, os tempos de estabelecimento de chamadas mais rápidos do país e fundamenta o seu prémio de “Melhor 5G” com base em dados Speedtest no primeiro semestre de 2025.
A Vodafone, por sua vez, lidera em latência de acesso e fiabilidade em tarefas de vídeo em Lisboa e no Porto, beneficiando de um uso avançado de agregação de portadoras, de uma camada profunda de banda baixa e de percursos de núcleo bem interligados.
A NOS colhe uma vantagem de pioneiro com a expansão da sua rede 5G SA. As implementações de 5G SA do operador permanecem fortemente concentradas em meio urbano, com 56% das amostras em Lisboa já sobre a nova arquitetura de núcleo, contra 9% na rota nacional. A estratégia passa por ativar o 5G SA onde existe densidade de banda média (3,5 GHz) e agregação de portadoras, recorrendo ao 5G NSA e à banda baixa (700 MHz) nas restantes zonas. Os ganhos de latência decorrentes da migração para o novo núcleo são comprovados pelos melhores tempos de início de vídeo e menor latência de acesso registados pela NOS a nível nacional.
A rede da DIGI é centrada na banda média, com espectro limitado e agregação reduzida. O caráter inicial do seu desenvolvimento é evidente na dependência desproporcionada da faixa dos 2,6 GHz e na ausência de uma camada de banda baixa, o que restringe o alcance de cobertura e aumenta a exposição a transições entre células, penalizando a fiabilidade da rede. Ainda assim, apresenta um desempenho sólido no quinto percentil e tempos de estabelecimento de chamadas a nível nacional competitivos face à líder MEO, embora o tempo em 5G permaneça significativamente inferior ao dos operadores incumbentes em todas as geografias testadas.
Persistem disparidades regionais de desempenho de rede em Portugal. O desempenho é inferior na Madeira e nos Açores devido a redes rádio mais dispersas e maior dependência de espectro de banda baixa para cobrir terrenos difíceis, o que resulta em menor presença de portadoras de banda média e menos agregação. O menor tempo em 5G conduz a transições mais frequentes entre gerações de rede, aumentando o risco de falhas de transição e de tarefas. A distribuição limitada dos pontos de interligação do núcleo também implica que o tráfego seja frequentemente encaminhado por percursos mais longos até gateways no continente, o que acarreta atrasos em períodos de maior utilização.
A fiabilidade de rede obriga os operadores a otimizar as redes nas camadas RAN e Núcle
MEO and Vodafone Lead in Network Reliability across Portugal
RootMetrics® | 1H 2025
Para comparar, de forma cientificamente rigorosa, de que modo os investimentos dos operadores se traduzem em fiabilidade em Portugal, a metodologia controlada da RootMetrics coloca uma questão simples: quando o utilizador inicia uma tarefa, esta conclui-se sem falhar?
São realizados dezenas de milhares de testes “conectar e concluir”, abrangendo chamadas, transferências de dados e mensagens de texto em diferentes percursos e locais, agregados depois num único índice de Fiabilidade. Este índice atribui maior peso aos dados (75%), incluindo chamadas (20%) e mensagens (5%), refletindo os padrões de utilização atuais.
A metodologia recompensa inícios bem-sucedidos e conclusões sem interrupções, penalizando bloqueios, quedas e falhas de tempo limite. Como cada teste cobre o percurso completo — do dispositivo à rádio, ao núcleo e até à extremidade do serviço —, os resultados refletem a robustez de ponta a ponta e não apenas um parâmetro isolado.
Fiabilidade de Chamadas (peso de 20% no total): Mede a estabilidade das ligações de voz, atribuindo maior peso aos bloqueios (quando o utilizador tenta ligar e a rede não responde ou não estabelece a chamada) do que às quedas (quando a chamada inicia, mas termina inesperadamente), dado que as falhas iniciais têm um impacto mais disruptivo na experiência do utilizador.
Os bloqueios tendem a aumentar durante picos de carga, quando os recursos de sinalização ou de media se esgotam em locais muito movimentados ou durante emergências. As quedas, por sua vez, são mais frequentes em zonas com más condições rádio ou falhas de transição entre células, como em áreas rurais.
Fiabilidade de Dados (peso de 75% no total): Avalia se os dispositivos conseguem estabelecer uma ligação de dados segura e utilizável (sucesso de acesso) e concluir transferências comuns (sucesso de tarefa) sem interrupções ou falhas. Inclui tanto downloads como uploads, desde tarefas leves (carregamento de páginas) até transferências mais exigentes, recompensando a conclusão sem falhas e penalizando falhas de configuração, interrupções ou reinícios.
Mesmo quando os utilizadores veem barras de sinal completas, a fiabilidade pode degradar-se devido a perda de pacotes ou reinícios de TCP (por exemplo, num estádio cheio) ou a falhas de transição durante transferências em movimento (como em comboios de alta velocidade).
Fiabilidade de SMS (peso de 5% no total): Mede a capacidade de enviar e receber mensagens de texto de forma consistente, tanto dentro da mesma rede como entre operadores diferentes.
Embora o desempenho neste indicador seja geralmente robusto, podem ocorrer falhas em casos de interrupções de interligação, erros de encaminhamento numérico, filtros anti-spam indevidos ou congestionamento de filas.
A análise dos dados de testes controlados em Portugal revela que as redes mais fiáveis combinam, de forma consistente, capacidade adequada em banda média para evitar congestionamentos, utilização significativa de espectro de banda baixa para melhorar o acesso e o sucesso de tarefas nas extremidades de célula e em interiores, e integração apertada entre as camadas núcleo e rádio, garantindo tempos rápidos de estabelecimento de chamadas e latência reduzida no acesso.
A expansão da rede própria da DIGI ganha ritmo enquanto os operadores estabelecidos apostam na modernização da RAN e na densificação da rede
O lançamento comercial da DIGI em Portugal, em novembro de 2024, desencadeou uma série de movimentos defensivos por parte dos operadores móveis estabelecidos. Perante um aumento acentuado da rotatividade de clientes e uma renovada pressão sobre o ARPU, estes responderam com ofertas de retenção mais agressivas e maior dependência de marcas secundárias de baixo custo. O modelo disruptivo da DIGI redefiniu a referência de preços para os pacotes móveis e convergentes de entrada. Mesmo onde os concorrentes não igualaram as tarifas de destaque, as suas marcas flanqueadoras posicionam-se agora entre os 8 e 15 euros para planos de 100 GB, de modo a competir com as propostas atrativas da DIGI — que começam nos 4 euros por 50 GB —, procurando simultaneamente limitar a canibalização das suas marcas principais.
A análise dos dados da ANACOM sobre assinaturas e número de sites mostra que a ascensão da DIGI tem sido excecional. No primeiro trimestre de 2025, já detinha mais de 3% das subscrições de internet móvel e havia implantado 2.385 sites 5G. Sem roaming nacional e sem espectro em banda baixa, concentrou o investimento de capital em cobertura rápida, densificando as redes urbanas e suburbanas para competir em desempenho e compensar a menor propagação das suas frequências em banda média.
Vodafone and NOS Feature Largest 5G Site Footprint in Portugal
ANACOM | Q1 2025
A maturidade das infraestruturas dos operadores estabelecidos e a necessidade de defenderem a sua vantagem em desempenho de rede colocam-nos numa fase muito distinta do ciclo de investimento em 5G face à DIGI. A MEO, por exemplo, encontra-se a meio de um processo plurianual de modernização da RAN e de substituição de equipamentos pela Nokia, canalizando investimentos para a atualização tecnológica e a melhoria da eficiência energética em toda a sua rede.
A NOS e a Vodafone, que partilham infraestrutura móvel sob um acordo MORAN (sem partilha de espectro) em áreas rurais e do interior para reduzir custos e reforçar a cobertura, consolidaram as maiores redes 5G após um investimento inicial intensivo. A NOS, em particular, procurou diferenciar-se através da comercialização antecipada do 5G Standalone (SA), promovendo o seu núcleo 5G fornecido pela Nokia sob a designação “5G+”, destacando velocidades de upload mais elevadas, menor latência e maior autonomia de bateria nos dispositivos. A MEO seguiu o mesmo caminho e implementou igualmente o 5G SA nas suas antenas de 3,5 GHz.
Densidade de cobertura de banda média e utilização da banda dos 700 MHz colocam a MEO na linha da frente do acesso e sucesso de operações
A NOS e a Vodafone, que partilham infraestrutura móvel sob um acordo MORAN (sem partilha de espectro) em áreas rurais e do interior para reduzir custos e reforçar a cobertura, consolidaram as maiores redes 5G após um investimento inicial intensivo. A NOS, em particular, procurou diferenciar-se através da comercialização antecipada do 5G Standalone (SA), promovendo o seu núcleo 5G fornecido pela Nokia sob a designação “5G+”, destacando velocidades de upload mais elevadas, menor latência e maior autonomia de bateria nos dispositivos. A MEO seguiu o mesmo caminho e implementou igualmente o 5G SA nas suas antenas de 3,5 GHz.
A menor dimensão da rede 5G da MEO tem levado a uma aposta na eficiência no uso do espectro, em vez do número de sites, ao mesmo tempo em que acelera a expansão (aumento de 30% no número de sites 5G no último ano, o crescimento mais rápido entre os operadores). A estratégia equilibrada assenta em capacidade em banda média e cobertura em banda baixa.
A MEO registou a maior utilização da faixa dos 3,5 GHz (n78) em todas as geografias testadas, operando um canal contínuo de 90 MHz a nível nacional. Este bloco de banda média é o mais amplamente implementado em Portugal: mais de dois terços das amostras da rota nacional recorreram a ele, 76–80% nas ilhas e 88% em Lisboa.
Fora dos grandes centros urbanos como Lisboa e Porto, a MEO faz uso extensivo da banda 700 MHz (n28) como camada de cobertura. A nível nacional, cerca de um terço das amostras 5G foram captadas em 5 MHz dos 700 MHz, enquanto em Lisboa a percentagem caiu para menos de 10% e nas ilhas situou-se entre 20% e 22%. Esta estratégia maximiza o tempo de utilização da banda média e mantém alta a modulação para o utilizador médio, preservando simultaneamente a probabilidade de cobertura nas extremidades das células, o que reduz falhas de acesso e interrupções em vídeo.
Por dispor de um canal de banda baixa mais estreito que o dos rivais (a Vodafone e a NOS utilizam 10 MHz), e de uma pegada 5G mais pequena e menos diversidade espectral além dos 700 MHz e 3,5 GHz, com pouca agregação de portadoras e uso limitado dos 2,1 GHz, os dispositivos na rede da MEO passam menos tempo em 5G do que nas redes da Vodafone e da NOS.
MEO Leads on Call Setup Times, while Vodafone Features Lowest Call Drop Rate
RootMetrics® | 1H 2025 – National Route
Apesar disso, a MEO partilhou a liderança de fiabilidade na rota nacional, apresentando os melhores resultados de acesso e sucesso de tarefas e o tempo de estabelecimento de chamadas mais rápido, cerca de 1,8 segundos. Na Madeira, verificou-se o mesmo padrão: liderança em acesso e sucesso de tarefas, melhor tempo de chamada e fiabilidade global superior. Em Lisboa e no Porto, a MEO esteve lado a lado com a Vodafone em acesso e sucesso de serviços ficou ligeiramente à frente na taxa de quedas de chamadas na capital. A conclusão: uma maior percentagem de tempo em 5G — como acontece com a Vodafone e a NOS — e maior uso de agregação de portadoras não se traduzem automaticamente numa experiência de rede mais consistente.
Uso intensivo de agregação de portadoras amplia a diversidade espectral na rede da Vodafone
No quarto trimestre de 2024, a ampla rede 5G da Vodafone colocou-a ao nível da NOS em termos de tempo em 5G. Nos testes, 84% das amostras da Vodafone basearam-se em 5G a nível nacional, face a 66% da MEO e 27% da DIGI. O perfil da rede da Vodafone espelha o da NOS, mesmo em áreas urbanas partilhadas passivamente, com ambas a demonstrarem um uso intensivo de agregação de portadoras (CA). A Vodafone, ao contrário da NOS, ainda não possui rede 5G SA.
A operadora combina as suas faixas contíguas de 700 MHz (10 MHz) e 3,5 GHz (90 MHz) através de agregação dupla (2CC), criando uma camada agregada de 100 MHz de capacidade. A largura dos 3,5 GHz é idêntica à da MEO e 10 MHz inferior à da NOS. Na rota nacional, a agregação 2CC foi observada em pouco mais de 20% das amostras 5G, subindo para dois terços das amostras em Lisboa e Porto. Nas ilhas, onde a rede é mais dispersa, os testes mostram uma divisão equilibrada entre 700 MHz e 3,5 GHz, com uso limitado de CA.
Different 5G Spectrum Playbooks: Meo Prioritizes 3.5 GHz, NOS and Vodafone Leverage Carrier Aggregation
RootMetrics® | 1H 2025 (Observed Spectrum Use and Bandwidth, National Route)
O uso avançado de agregação pela Vodafone eleva o desempenho tanto de pico como mediano, revelando o melhor desempenho no percentil 5 nacional. Isto reflete partilha eficiente de recursos e forte adaptação de ligação, com seleção otimizada de modulação e codificação, permitindo manter o desempenho nas extremidades das células e em áreas de maior tráfego, mesmo com agregação limitada.
Estes resultados traduzem-se em elevada fiabilidade. A Vodafone co-liderou a fiabilidade global da rede com a MEO e liderou isoladamente nos Açores, registando a menor taxa de chamadas caídas na rota nacional. Em Lisboa e Porto, apresentou a melhor latência de acesso e liderou ou partilhou a liderança em fiabilidade de vídeo, demonstrando que otimizações além da adoção do núcleo SA, como rotas curtas no core e proximidade de CDNs, podem gerar excelentes resultados.
A vantagem de pioneirismo da NOS no 5G SA reforça a capacidade de resposta da rede
Os testes revelaram que a NOS dispõe da configuração de rede mais avançada em Portugal, combinando uma extensa rede 5G SA com a maior variedade de combinações de agregação de portadoras. Opera igualmente a maior rede de sites 5G, com cerca de 4.800 locais no final de 2024, o que a colocou ao nível da Vodafone em tempo passado em 5G (84% a nível nacional).
Tal como a Vodafone, a NOS combina uma largura de banda média de 100 MHz (3,5 GHz) com 10 MHz em 700 MHz, aplicando agregação agressiva tanto em NSA como em SA. Em Lisboa, a agregação 2CC foi observada em 59% das amostras, oferecendo a maior capacidade agregada do país (110 MHz), graças ao bloco de banda média mais amplo. Na rota nacional, 2CC surgiu em 20% das amostras. Ainda assim, a NOS registou uma utilização mais baixa da banda de 3,5 GHz na rota nacional (32% das amostras) face à Vodafone (37%) e à MEO (67,6%).
A vantagem de pioneirismo da NOS no 5G SA está a traduzir-se em maior capacidade de resposta e em início de vídeo mais rápido nas cidades. Em Lisboa, 94% das amostras estavam em 5G e 56% em SA, com início de vídeo em cerca de 530 ms; no Porto, voltou a liderar, com 540 ms. Fora das zonas densas, onde o SA representa apenas 9% do uso de 5G na rota nacional, a NOS manteve a liderança nestas métricas, demonstrando roteamento eficiente no núcleo, interligação otimizada com CDNs (tráfego sai do core próximo do utilizador) e agendamento rápido e de baixa latência, garantindo resposta imediata independentemente do tipo de core.
A ausência de banda baixa leva a DIGI a maximizar a construção em banda média
A expansão da rede própria da DIGI tem sido feita com menos recursos. Sem espectro de 700 MHz para suportar uma camada 5G de grande alcance, a operadora apostou fortemente nas bandas médias, o que resulta em recuos mais frequentes para 4G e acesso 5G irregular em interiores e zonas rurais. Nos testes, apenas 27% das amostras na rota nacional estavam em 5G da DIGI (e apenas 16% nos Açores e 21% na Madeira), subindo para 48% em Lisboa, o que evidencia o carácter urbano da sua implementação inicial.
As implementações 5G da DIGI concentram-se em portadoras TDD relativamente estreitas, e não num canal único e largo em 3,5 GHz, refletindo as limitações de um licenciamento descontínuo. As duas portadoras de 3,5 GHz da DIGI estão separadas por 40 MHz: uma atribuída no leilão de 2021 e outra obtida à NOWO no início deste ano, enquanto a Dense Air mantém o espectro intermédio. A agregação de portadoras pode atenuar algumas desvantagens desta configuração dividida, mas subsiste uma lacuna de eficiência e de suporte de dispositivos face a uma portadora única mais larga, menos favorável do ponto de vista de engenharia de rádio.
NOS and Vodafone Boast Advanced Carrier Aggregation Depth in Lisbon
RootMetrics® | 1H 2025 (Observed Network Architecture Share, Lisbon)
Em Lisboa, 98% das amostras 5G da DIGI basearam-se num bloco de 20 MHz em 2,6 GHz (n41). Na rota nacional, a utilização dividiu-se de forma mais equilibrada entre 3,5 GHz (n78) — maioritariamente blocos de 40 MHz, menos de metade da largura dos concorrentes — e 2,6 GHz (n38/n41), com 20 MHz cada. A DIGI utilizou a faixa de 3,5 GHz mais extensivamente no Porto (37%) do que em Lisboa.
A natureza incipiente da rede própria da DIGI se reflete no desempenho inferior em termos de fiabilidade global, com menores taxas de acesso e de sucesso de tarefas em todas as regiões. Embora já demonstre bons resultados em tempos de estabelecimento de chamada (empatando com a MEO), as piores taxas de queda de chamadas indicam que fatores como rede 5G pouco densa e instabilidade nas transições continuam a afetar o desempenho.
Conclusão: Não existe uma solução única na corrida pela fiabilidade de rede em Portugal
A diversidade nas atribuições de espectro (frequências, larguras e contiguidade), nos perfis de clientes (dimensão, localização e procura de tráfego) e nos ciclos de investimento de rede (expansão inicial, substituição de fornecedor ou simples atualização da RAN) implica que os operadores portugueses precisam de estratégias diferenciadas para competir por meio da fiabilidade.
Apesar destas diferenças, todos partilham ênfase na cobertura em banda baixa para alcance, na capacidade em banda média para profundidade, nas interligações robustas no núcleo da rede e no posicionamento estratégico de CDNs.
A liderança da MEO e da Vodafone em fiabilidade global assenta em abordagens distintas: a MEO aposta na implantação agressiva de um bloco largo de 3,5 GHz, enquanto a Vodafone aplica agregação avançada de forma seletiva, o que prova que não existe uma estratégia única para alcançar fiabilidade superior. Da mesma forma, a NOS, com o seu desdobramentoprecoce do 5G SA, está a melhorar o desempenho em métricas sensíveis à latência, e a DIGI já alcança resultados promissores no tempo de estabelecimentode chamada.
Ookla retains ownership of this article including all of the intellectual property rights, data, content graphs and analysis. This article may not be quoted, reproduced, distributed or published for any commercial purpose without prior consent. Members of the press and others using the findings in this article for non-commercial purposes are welcome to publicly share and link to report information with attribution to Ookla.
Luke Kehoe leads Ookla’s research and thought leadership efforts in Europe.
An electronic engineering alumnus of University College Dublin, Luke has extensive experience collaborating with mobile operators, telecoms vendors, and government agencies in research and advisory roles across Europe. He has contributed to internationally recognised thought leadership publications in areas such as 5G, IoT, open RAN, and edge computing, working with prestigious organisations like the Telecom Infra Project and the World Economic Forum.
Global 5G SA rollouts are gaining momentum after a sluggish start, with China, India, Singapore, and the U.S. maintaining a substantial lead
The telecoms industry is approaching the midpoint of the 5G technology cycle, with capital investment in radio access network (RAN) expansion slowing significantly in developed markets over the last two years as the initial 5G coverage layer nears maturity. Many advanced operators are now prioritizing network densification while cautiously transitioning to a new 5G core architecture with standalone (SA), seeking to unlock new monetization opportunities through the enhanced flexibility, agility, and performance that 5G SA enables.
The interplay of high interest rates driving up the cost of capital, challenges in monetizing the initial non-standalone (NSA) architecture, and the technical complexity of the new 5G core—demanding an entirely new skill set to support implementation—has weighed on the global rollout of 5G SA, with significant regional disparities persisting in commercialization progress.
For the first time, and with the goal of offering deeper insight into the state of 5G SA worldwide, Ookla® has created a high-resolution downloadable poster based on Speedtest Intelligence® data, providing a unified view of the global reach of both 5G NSA and 5G SA networks in 2024. This visual is part of a flagship global study in collaboration with Omdia, comparing the competitiveness of leading regions and countries in 5G SA deployment, performance, and monetization.
Key Takeaways:
Asia Pacific remains at the forefront of global 5G SA deployment
In 2024, seven of the top ten countries by 5G SA reach were in Asia Pacific, with China (77.1% 5G SA sample share), India (51.1%), and Singapore (37.5%) leading globally. The region’s strong position has been driven by a higher number of multi-operator 5G SA deployments (as seen in China and Australia), extensive low-band rollout (such as Reliance Jio’s use of the 700MHz band for deep nationwide coverage in India), and favorable demographics, including very high urbanization in countries like Singapore.
Asia Pacific leads the world in 5G SA reach
Speedtest Intelligence® | 2024
Outside of Asia Pacific, the United States also ranks highly in 5G SA reach, despite only one of its three largest operators engaging in a commercial launch to date. In contrast, just two European countries—Spain and Austria—make the top ten, highlighting the region’s slow pace of 5G SA deployment and the broader decline in its global competitiveness in mobile network infrastructure during the 5G cycle.
Spectrum diversity propels the U.S. to a leading position in 5G SA performance
The U.S. has distinguished itself with significantly higher 5G SA reach than competing regions like Europe while also delivering superior median download speeds. In Q4 2024, median download speeds on 5G SA in the U.S. reached 388.44 Mbps, a substantial increase from 305.36 Mbps in the same period the previous year, and well ahead of Asian competitors such as Japan (254.18 Mbps) and China (224.82 Mbps).
The U.S.’s strong performance has been driven by T-Mobile’s post-merger 5G SA buildout—the first globally—which balanced nationwide reach with network depth. Its “layer cake” strategy combined a broad 600 MHz rollout, initially launched as 5G NSA in 2019 before transitioning to 5G SA in 2020, with mid-band deployments in the 2.5 GHz band. This approach has allowed T-Mobile to more extensively implement features like carrier aggregation and Voice over NR (VoNR) on its maturing 5G SA network, lending it a competitive edge in both availability and key performance metrics such as download speed and latency.
South Korea led the world in Q4 2024 with the highest median 5G SA download speeds at 746.25 Mbps, driven by its exclusive use of the 3.5 GHz band. However, it continues to trail its regional peers in 5G SA reach due to the challenging propagation characteristics exhibited by this spectrum and the limited commercialization beyond a single operator, KT.
5G SA enhances download speeds and latency globally, yet uplink advancements remain underutilized
Globally, 5G SA networks are delivering significantly improved performance across key metrics compared to the non-standalone architecture. In Q4 2024, median latency—a key beneficiary of transitioning to the 5G core—was nearly 20% lower on 5G SA networks compared to 5G NSA networks in Europe and China, and more than 25% lower in the United States and Japan. Similarly, median download speeds on 5G SA were more than 57% higher in Europe and 84% higher in China than those on non-standalone networks.
European 5G SA Users Benefit from Markedly Lower Latency and Higher Download Speed
Speedtest Intelligence® | Q4 2024
Notwithstanding these improvements, 5G SA’s full potential remains largely untapped in Europe. Advanced uplink capabilities unlocked by the technology—such as higher-order MIMO and carrier aggregation—remain limited to a few operators in leading markets like the United States, highlighting the still nascent profile of the device and equipment ecosystems for 5G SA.
A detailed analysis of the state of 5G SA around the world is featured in Ookla’s flagship report, produced in collaboration with Omdia, on regional competitiveness in the technology.
Ookla will be at Mobile World Congress this year, located at Booth 2I28 in Hall 2. Please drop by to discuss the state of connectivity in your market, and how Ookla’s network insights can help deliver better connected experiences.
Ookla retains ownership of this article including all of the intellectual property rights, data, content graphs and analysis. This article may not be quoted, reproduced, distributed or published for any commercial purpose without prior consent. Members of the press and others using the findings in this article for non-commercial purposes are welcome to publicly share and link to report information with attribution to Ookla.
Luke Kehoe leads Ookla’s research and thought leadership efforts in Europe.
An electronic engineering alumnus of University College Dublin, Luke has extensive experience collaborating with mobile operators, telecoms vendors, and government agencies in research and advisory roles across Europe. He has contributed to internationally recognised thought leadership publications in areas such as 5G, IoT, open RAN, and edge computing, working with prestigious organisations like the Telecom Infra Project and the World Economic Forum.
The operator’s download and upload speeds increased in the latter part of 2024, which coincides with Boost Mobile’s efforts to migrate customers onto its 5G network and off its roaming partners’ networks.
Key Takeaways
According to Speedtest data, Boost Mobile users nationwide saw their 5G median download speeds increased from 146.53 Mbps in September 2024 to 167.39 Mbps in April 2025.
Boost Speedtest users also experienced a similar phenomenon in their median upload speeds. Those speeds increased from 9.87 Mbps in September 2024 to 11.47 Mbps in April 2025.
Despite its improvements in median download and upload speeds in the latter part of 2024, Boost’s overall 5G upload and download speeds still lag in performance compared to all other US 5G providers combined.
Boost Mobile, the scrappy fourth 5G nationwide U.S. wireless network provider, has come a long way from its origin as a prepaid mobile brand launched by Sprint back in 2001. The wireless operator, which today is owned by Dish Network (and Dish’s parent company EchoStar), started building a nationwide greenfield 5G standalone (SA) network in 2022 using open radio access network (O-RAN) technology.
By mid-2023 Boost Mobile had covered more than 70% of the US population with its network. Today it claims to cover 80% of the U.S. population with its 5G SA network. It also has roaming deals with T-Mobile and AT&T, which extends its footprint beyond its existing coverage area.
Dish claims that its greenfield 5G SA network is more efficient than its competitors, however, Speedtest data indicates that while its network performance improved in the latter part of 2024, it still falls below the combined network upload and download speeds of the other 5G providers in the U.S.
Boost Mobile ended 2024 with 6.995 million wireless customers, which is down from the 9 million customers Boost had in 2020 when it was sold to Dish Network for $1.4 billion as a condition of T-Mobile’s acquisition of Sprint.
After several quarters of losing customers, the company experienced a bit of a turnaround in Q4 2024 when it added 90,000 net subscribers. This is an improvement over Q4 2023 when it lost 123,000 customers and over Q3 2024 when it lost 297,000 customers. The company will be reporting its Q1 2025 earnings May 9, 2025.
Median Download and Upload Speeds Are on the Rise
Analysis of Ookla Speedtest data from September 2024 to April 2025 demonstrates that Boost Mobile Speedtest 5G users clocked a median download speed of 146.53 Mbps in September 2024 before ticking up to 167.39 Mbps in April 2025. However, Boost’s median download speeds still falls significantly short when compared to all other 5G providers in the market which have a combined median 5G download speed of 237.61 Mbps in April 2025.
At the same time, Boost Mobile’s median upload speeds showed a similar pattern. Boost Speedtest users saw their median upload speeds of 9.87 Mbps in September 2024 increase to 11.47 Mbps in April 2025, which is still lower than the median upload speeds of all other 5G providers combined at 12.50 Mbps as of April 2025.
These increases and decreases in median upload and download speeds coincide with the Boost’s migration of its customers onto its 5G network and off its partners’ roaming networks (more on this below).
A Comparison of Boost Mobile's 5G Median Upload, Download and Latency Speeds
September 2024 through April 2025
A comparison of Boost Mobile's 5G Median Upload, Download and Latency Speeds from September 2024 until April 2025
Boost Lags in Latency
Latency is a key metric for wireless operators because it measures the responsiveness or reaction time of a connection – in other words, how quickly your device responds to a request. In this metric, Speedtest data measures multi-server latency, which calculates latency to multiple connections and then takes an average.
Boost logged a latency rate of 56 ms in September 2024, which declined slightly to 54 ms in December 2024 and January 2025 but rose again to 56 ms in April 2024. However, this latency rate is quite a bit higher than 48 ms in latency measured by the other wireless providers combined in April 2025.
Web Page Load Times Improve
Web page load times are an important network performance measurement because they indicate how quickly popular web pages load for consumers. Ookla Speedtest data from April 2025 shows Boost with a web page load time of 1.80 seconds.This is a slight decrease from September 2024 when Boost users logged web page load times of 1.90 seconds. All other 5G providers combined had a median web page load time of 1.40 seconds in April 2025.
A Comparison of 5G Web Load Times
September 2024 through April 2025
A comparison of Boost Mobile's 5G Web Load Times from September 2024 until April 2025
Boost’s Origin Story Likely Impacting Network Performance
Boost’s network performance is most likely influenced by the company’s origin as a prepaid brand on Sprint’s network.
Although Dish initially referred to its wireless brand as Dish Wireless, the company rebooted its branding in July 2024 and now uses the Boost Mobile brand exclusively.
Those original Boost Mobile prepaid customers remained on T-Mobile’s network while Dish built its greenfield cloud-native 5G SA network. In July 2021 Dish signed a roaming deal with AT&T to give it access to AT&T’s network and provide coverage for Boost Mobile customers (and also its other MVNO customers that it acquired when it purchased Ting Mobile and Republic Wireless).
At the time, Boost said that its roaming deal with AT&T would be particularly advantageous in rural areas and would allow it to provide wireless services to customers while it continued with its network build.
Because Boost started as a prepaid brand and then acquired more prepaid MVNO brands it’s likely that much of its installed prepaid subscriber base uses mid-tier or low-tier devices that may not be taking full advantage of Boost’s 5G network.
By June 2023 Boost had met its first coverage requirement (as determined by the FCC) by covering 70% of the U.S. population with its 5G network. At the end of 2024 Boost said that its network now reaches 80% of the U.S. population with 5G. The FCC last September granted Dish an extension to meet its final buildout requirement by December 14, 2026.
Boost today claims to cover 80% of the population of the U.S. with its 5G SA network. However, many of Boost’s customers are still roaming on AT&T and T-Mobile’s networks due to those prior roaming relationships. During Echostar’s Q4 2024 earnings call with investors, executives from Boost Mobile said that only one million of its nearly 7 million wireless customers are actually using Boost’s 5G network.
Boost also said that it is loading more than 75% of compatible devices on its SA network in accelerated markets.
Spectrum and Handsets Are Key Factors in Boost’s Performance
Boost Mobile’s network performance is also impacted by the mix of spectrum for its 5G SA network. The company deployed its 5G network using a mix of mid-band and low-band spectrum.
Boost claims that it is the first operator of a 5G network to use simultaneous four-carrier downlink and two-carrier uplink aggregation to allow for speedier connections. In October 2023 Boost said that by working with Samsung and Qualcomm it had achieved simultaneous 2x uplink and 4x downlink carrier aggregation and attained peak uplink speeds of 200 Mbps with just 35 MHz of 5G spectrum. It also said it achieved peak downlink speeds of 1.3 Gbps using just 75 MHz of 5G spectrum across FDD bands n71, n70 and n66.
While that four-carrier downlink and two-carrier uplink aggregation may be helping Boost improve its download and upload speeds it hasn’t been enough to make it speedier than the other nationwide providers.
As Boost Mobile migrates customers onto its 5G network and off its roaming partners, it also will be moving those customers onto new handsets that are compatible with the new network and will likely improve the customer experience.
Boost Mobile has been aggressive with its iPhone and Samsung Galaxy device promotions. In February it offered new customers an iPhone 16e for $199.99. In addition, it also offers significant discounts to existing customers on the latest iPhone and Samsung Galaxy devices when they upgrade to the company’s Infinite Access plan.
This plan, which costs $65/month, includes 30GB of premium data and comes with a new iPhone. The plan also allows customers to upgrade to a new device every year, without having to trade in their old phone.
Boost Needs Customers and Customer Experience
Boost has made great strides in building a greenfield 5G SA network in the U.S. from scratch but now the operator needs to deliver on its promise of building a state-of-the-art network by showing the type of stellar performance that one might expect.
We’ll continue to monitor Boost’s network performance, particularly as it continues to grow its customer base and become less reliant upon its roaming partners.
To find out more about Speedtest Intelligence® data and insights, please contact us here.
Ookla retains ownership of this article including all of the intellectual property rights, data, content graphs and analysis. This article may not be quoted, reproduced, distributed or published for any commercial purpose without prior consent. Members of the press and others using the findings in this article for non-commercial purposes are welcome to publicly share and link to report information with attribution to Ookla.
Sue Marek is Ookla’s editorial director and part of the company’s analyst team. She oversees the company’s thought leadership and editorial content. Sue is a journalist with more than 30 years of experience covering the telecom industry and her work has appeared in Fierce Network, Light Reading, and SDxCentral. She is a frequent speaker at industry events and has moderated panels at Mobile World Las Vegas, Connect(x), the Consumer Electronics Show, the Competitive Carriers’ Show and 5G North America. Sue has a B.S. in journalism from the University of Colorado.