| February 2, 2021

Using Crowdsourced Data for Competitive Network Intelligence in Latin America [Webinar]

Leer en español / Ler em Português

Mobile network operators in most markets worldwide are competing for the loyalty of a finite number of customers — and the winner is usually the network with the best coverage and performance. Competitive network intelligence drawn from hundreds of millions of real-world network measurements can show operators where competitors’ networks are outpacing their own.

In the upcoming Ookla® webinar, offered in both Portuguese and Spanish, we share how mobile operators in Latin America can monitor and benchmark their competitors’ performance and also prioritize network optimization in the areas most important to their customers. Read on to learn how crowdsourced data from Cell AnalyticsTM can give you an unprecedented view into competitor networks — and don’t miss the webinar.

pr-cta1
Wednesday, February 24 at 11 a.m. BRT

es-cta1
Thursday, February 25 at 9 a.m. CST (10 a.m. EST/PET/COT)

Track competitor launches, including new cell site deployments, frequencies and technologies

Cell Analytics gives operators an unprecedented view into competitor networks, including their cell site locations, most used frequencies and in-depth metrics about network performance, quality and coverage (including 5G). Using this information, you can prioritize your own new deployments and network improvements in areas where competitors have invested, as well as areas with a high density of users on all networks.

Assess network quality after reconfiguring a site or changing RAN vendors

When you reconfigure a cell site, change RAN providers, refarm old spectrum for new network technologies or make any other updates to your network, it’s important to measure the outcomes of these changes. Cell Analytics data can help you assess and compare the quality of your network (or competitors’ networks) before and after any changes are made.

Prioritize network optimizations based on user density and network congestion

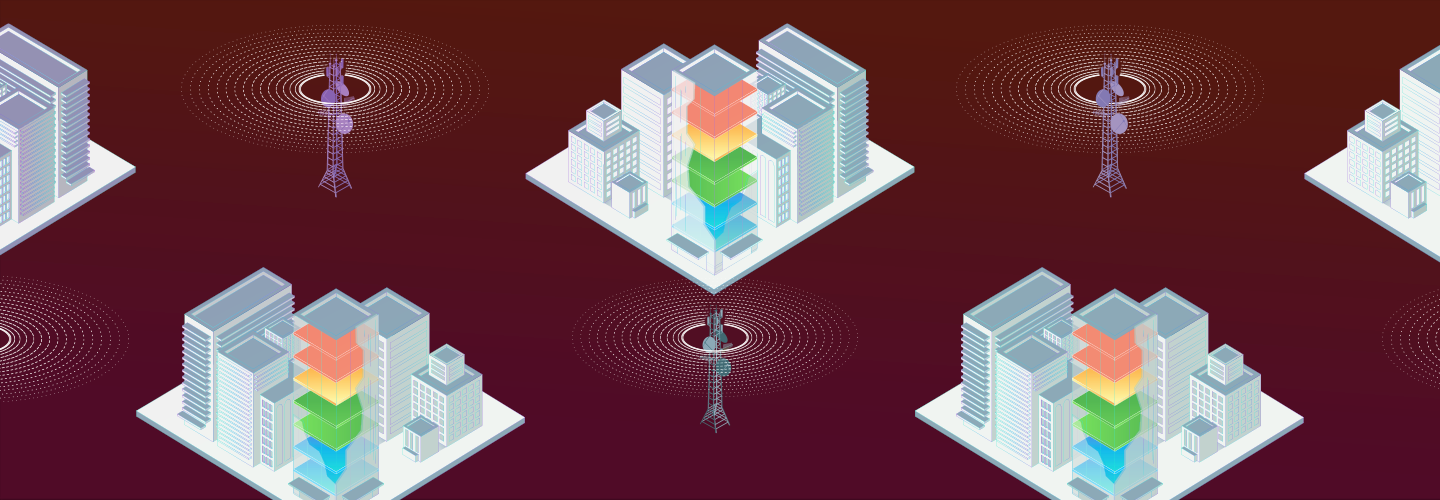
In areas with high user density, not all operators are equipped to handle the demand of heavily traveled locations such as airports, large sporting venues, popular office parks and transit centers. Cell Analytics can help you identify locations — including tall buildings — where your competitors have better coverage and prioritize improvements based on network congestion and user density.

The webinar will show real-life use cases where operators in Latin America can use crowdsourced data can help prioritize network improvements. Don’t miss it. A recording will be provided for registrants who can’t tune in to the live presentation.

Cadastre-se para o webinar em Português
Regístrese para ver el seminario web en español


Cómo usar datos de colaboración abierta para la inteligencia de redes competitivas en Latinoamérica [Seminario web]

Los operadores de redes móviles en la mayor parte de los mercados del mundo compiten por la lealtad de un número finito de clientes —y el ganador suele ser la red con la mejor cobertura y el mejor rendimiento—. La inteligencia de redes competitivas obtenida de cientos de millones de mediciones de redes reales puede demostrar a los operadores en qué zonas las redes de la competencia superan a las suyas.

En el próximo seminario web de Ookla, disponible tanto en español como en portugués, le contamos cómo los operadores móviles en Latinoamérica pueden monitorear y comparar el rendimiento de sus competidores mientras priorizan la optimización de las redes que se encuentran en las zonas más importantes para sus clientes. Siga leyendo para saber cómo los datos de colaboración abierta obtenidos a través de Cell Analytics pueden brindarle una visualización sin precedentes de las redes de la competencia. Además, no se pierda nuestro seminario web.

es-cta1
Jueves 25 de febrero a las 9 a. m. CST (10 a. m. EST/PET/COT)

Rastree los lanzamientos de la competencia, incluidas las nuevas implementaciones de instalaciones celulares, frecuencias y tecnologías

Cell Analytics ofrece a los operadores una visualización sin precedentes de las redes de la competencia, incluidas las ubicaciones de sus instalaciones celulares y las frecuencias más usadas, así como métricas detalladas sobre el rendimiento, la calidad y la cobertura de la red (incluyendo las redes 5G). Con esta información, puede priorizar sus propias implementaciones nuevas y mejoras de red en zonas en las que ha invertido la competencia, así como en zonas con una alta densidad de usuarios en todas las redes.

Evalúe la calidad de la red luego de reconfigurar una instalación o cambiar de proveedor de RAN

Al reconfigurar una instalación celular, cambiar de proveedor de RAN, volver a agrupar el espectro antiguo para nuevas tecnologías de red o realizar cualquier otra actualización en su red, es importante que mida los resultados de estos cambios. Los datos de Cell Analytics pueden ayudarlo a evaluar y comparar la calidad de su red (o las redes de la competencia) antes y después de realizar cualquier cambio.

Priorice las optimizaciones de red en función de la densidad de usuarios y la congestión de las redes

En zonas con alta densidad de usuarios, no todos los operadores están equipados para manejar la demanda de ubicaciones muy transitadas, como aeropuertos, grandes centros deportivos, edificios de oficinas y centros de tránsito. Cell Analytics puede ayudarlo a identificar ubicaciones, incluyendo edificios altos, en las que sus competidores tienen una mejor cobertura y a priorizar las mejoras en función de la congestión de las redes y la densidad de usuarios.

En el seminario web le mostraremos casos de uso reales en los que operadores de Latinoamérica puede usar datos de colaboración abierta para priorizar mejoras en la red. No se lo pierda. Se proporcionará una grabación para aquellos inscritos que no puedan asistir a la presentación en vivo.

Regístrese para ver el seminario web en español


Uso de dados de crowdsourcing para inteligência competitiva de redes na América Latina [Webinar]

As operadoras de redes móveis na maioria dos mercados em todo o mundo estão competindo pela lealdade de um número finito de clientes — e, geralmente, o vencedor é aquele que oferece a melhor cobertura e o melhor desempenho. A inteligência competitiva de redes obtida a partir de centenas de milhões de medições de redes reais pode mostrar aos operadores os pontos em que as redes de concorrentes apresentam um desempenho melhor que as suas.

No webinar da Ookla que será realizado em breve e disponibilizado em Português e Espanhol, nós explicaremos como as operadoras móveis na América Latina podem monitorar e se destacar em relação ao desempenho da concorrência, além de como priorizar a otimização de redes nas áreas mais importantes para seus clientes. Continue lendo para saber como os dados obtidos a partir de crowdsourcing do Cell Analytics podem oferecer a você uma visão sem precedentes sobre as redes de concorrentes — e não perca o webinar.

pr-cta1
Quarta-feira, 24 de fevereiro às 11:00 BRT

Identifique as expansões da concorrência, incluindo 5G, novas implementações de estações rádio base, novas frequências e tecnologias

O Cell Analytics oferece às operadoras uma visão sem precedentes em relação às redes dos concorrentes, incluindo a localização de suas estações rádio base, frequências mais utilizadas e métricas aprofundadas referentes ao desempenho, à qualidade e à cobertura de suas redes (incluindo 5G). Utilizando essas informações, você poderá priorizar suas expansôes e melhorias de rede em áreas onde os concorrentes tenham investido, bem como em áreas com uma alta densidade de usuários de todas as redes.

Analise a qualidade da rede após a reconfiguração de estações ou da troca de fornecedores de RAN

Ao reconfigurar uma estação rádio base, trocar de fornecedores RAN, substituir tecnologias de rede antigas por mais atuais ou realizar qualquer atualização em sua rede, é importante medir os resultados de tais mudanças. Os dados do Cell Analytics podem ajudar a analisar e comparar a qualidade de sua rede (ou da rede dos concorrentes) antes e depois da realização de quaisquer alterações.

Priorize otimizações de rede com base na densidade de usuários e congestionamentos de rede

Em áreas com alta densidade de usuários, nem todas as operadoras possuem as ferramentas necessárias para atender à demanda de locais com alto fluxo de pessoas, como aeroportos, instalações esportivas de grande porte, grandes parques comerciais e centros de trânsito. O Cell Analytics pode ajudar a identificar os locais — incluindo edifícios — em que seus concorrentes oferecem melhor cobertura, e priorizar as melhorias com base no congestionamento da rede e na densidade de usuários.

Este webinar apresentará casos reais em que as operadoras da América Latina podem utilizar dados obtidos através de crowdsourcing para ajudar a priorizar as melhorias na rede. Não perca! Uma gravação será fornecida aos cadastrados que não puderem assistir a apresentação ao vivo.

Cadastre-se para o webinar em Português

Ookla retains ownership of this article including all of the intellectual property rights, data, content graphs and analysis. This article may not be quoted, reproduced, distributed or published for any commercial purpose without prior consent. Members of the press and others using the findings in this article for non-commercial purposes are welcome to publicly share and link to report information with attribution to Ookla.

| December 3, 2020

Prioritizing Broadband Funding to Close the Digital Divide [Webinar]

Improving broadband access is a priority for legislators and policy makers, and the shift to working and learning from home has highlighted the deep digital divide across the United States — particularly in rural areas. Congress will likely allocate more dollars to ensure that every citizen has high-speed internet access in the coming year. Federal, state and local governments need accurate data on broadband availability and network performance in order to prioritize broadband development in underserved areas. With this information, government officials can ensure that they are maximizing their dollars and serving their constituents appropriately.

The upcoming Ookla® webinar on December 16 will share how network data from Ookla Speedtest® can give you deep insights into broadband availability and performance within your jurisdiction — and help you fund development efforts in the communities that need it most. Read on to learn more about prioritizing broadband funding.


Accurately determine where constituents can (or cannot) access adequate broadband

Policymakers have historically had to rely on fixed broadband deployment data from the FCC’s Form 477 to try to understand broadband access within their jurisdictions. This data is generally at least a year old by the time it reaches the hands of a policymaker — and in 2020, the government has delayed the latest update. It is crucial to look at the most robust, comprehensive and up-to-date data available on the networks to get a clear picture of broadband speeds and understand which communities aren’t being adequately served. Millions of users in the U.S. rely on Speedtest to test the performance of their networks — and the resulting data paints an accurate picture of where users can and cannot connect with internet that meets the FCC minimum thresholds of 25 Mbps download speed and 3 Mbps upload speed.

Use crowdsourced data on network speeds and availability to prioritize broadband funding

The webinar will show how Speedtest datasets can be filtered and analyzed to determine specific locations where constituents can’t access the speeds they need for remote learning and working from home. We will discuss why precise geolocation of network speed results is critical to understanding which communities need better broadband access — and how looking at ZIP codes alone may lead to underserved communities within those very ZIP codes.

Speedtest data can help policymakers eliminate costly data collection and analysis for areas that already have adequate service by pinpointing where internet service providers (ISPs) are actually delivering services that meet or exceed the current definition of broadband. Resources can instead be allocated to areas that show a clear need for broadband infrastructure investment.

The webinar on Wednesday, December 16 at 9 a.m. Pacific (12 p.m. Eastern) will show you how to analyze, filter and understand data from Speedtest to make informed spending decisions. Don’t miss it. A recording will be provided for registrants who can’t tune in to the live presentation. Register now.

Ookla retains ownership of this article including all of the intellectual property rights, data, content graphs and analysis. This article may not be quoted, reproduced, distributed or published for any commercial purpose without prior consent. Members of the press and others using the findings in this article for non-commercial purposes are welcome to publicly share and link to report information with attribution to Ookla.

| November 24, 2019

Exploring Fixed Broadband and Mobile Network Performance in Ukraine

Читати звіт українською мовою | Читать отчет на русском

As Ukraine emerged from the recession of 2016, both regulators and service providers committed to bringing high-speed internet services to more of the population and positioning the country as a seat for innovation. With recent LTE deployments from the mobile operators and fixed broadband providers building out fiber offerings, consumers in Ukraine are experiencing unprecedented access to faster internet — and the market is more competitive than ever. The mobile broadband market is currently dominated by three main competitors — Kyivstar, Vodafone Ukraine (owned by MTS) and lifecell (owned by Turkcell) — and the fixed broadband market is highly saturated, with hundreds of ISPs operating at the national, regional and local level. In this report, Ookla checked in to see how fixed broadband speed, mobile speed and 4G Availability have looked over the last two quarters in Ukraine.

Our analysis includes performance data from 1,805,450 consumer-initiated tests taken with Speedtest® and coverage data from over 623 million coverage scans on 372,690 devices during Q2-Q3 2019. The data in this analysis does not represent Crimea.

To see Ukraine’s fastest fixed broadband providers, fastest mobile providers and which providers offer the best speeds and 4G Availability in some of Ukraine’s largest cities, download the full report.

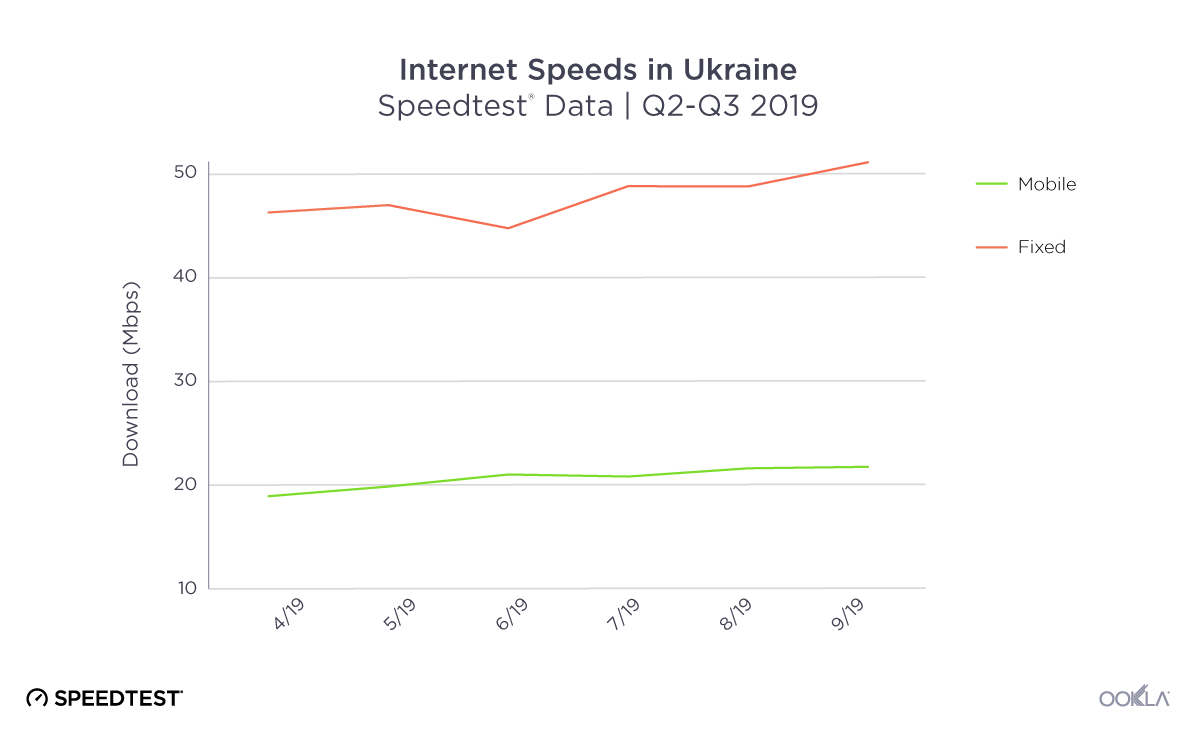
Mobile and fixed broadband speeds are increasing at the country level

Comparing-DL-Speeds-for-Ukraine-Fixed-Mobile

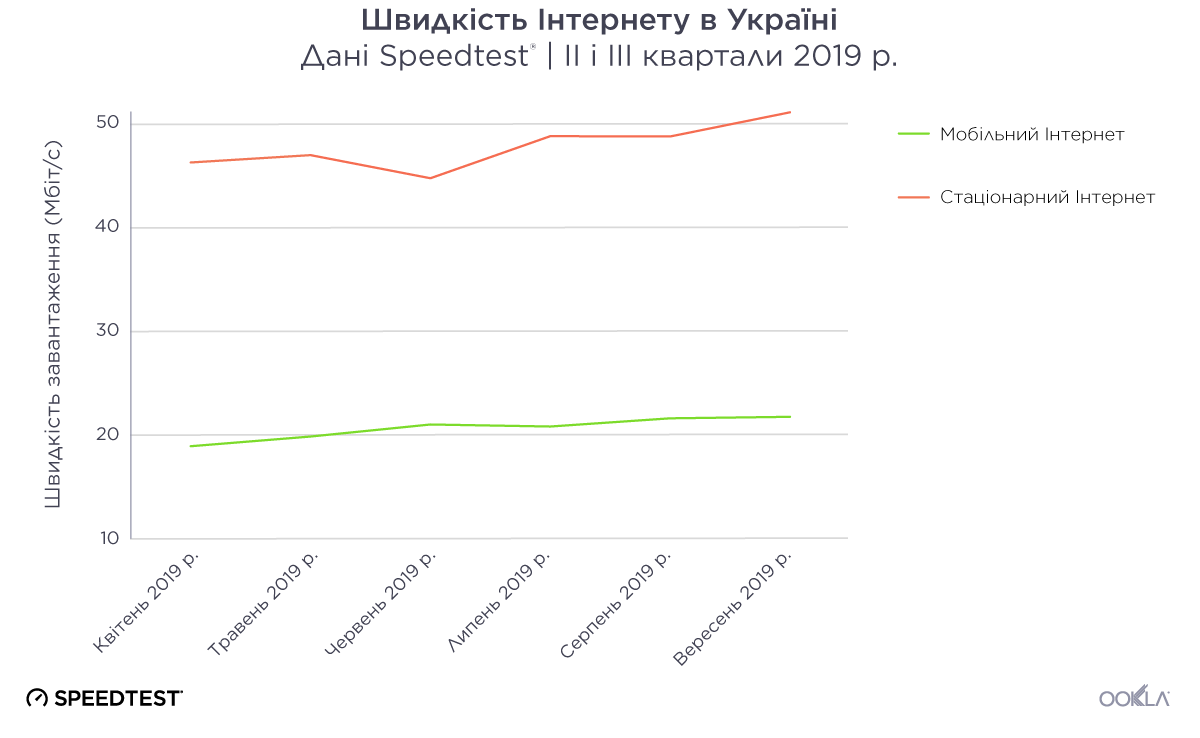
Both mobile and fixed broadband speeds saw incremental improvement at the country level during Q2-Q3 2019 in Ukraine. Average download speeds on fixed broadband increased by 10.4% during that time period to a peak of 49.99 Mbps in September. Mobile speeds were also on the rise, increasing 14.8% to 21.40 Mbps in September. As more of the country gains access to LTE service, we expect to see a continued trend of improvement in average mobile speeds.

New LTE deployments are bringing faster speeds to more of the country

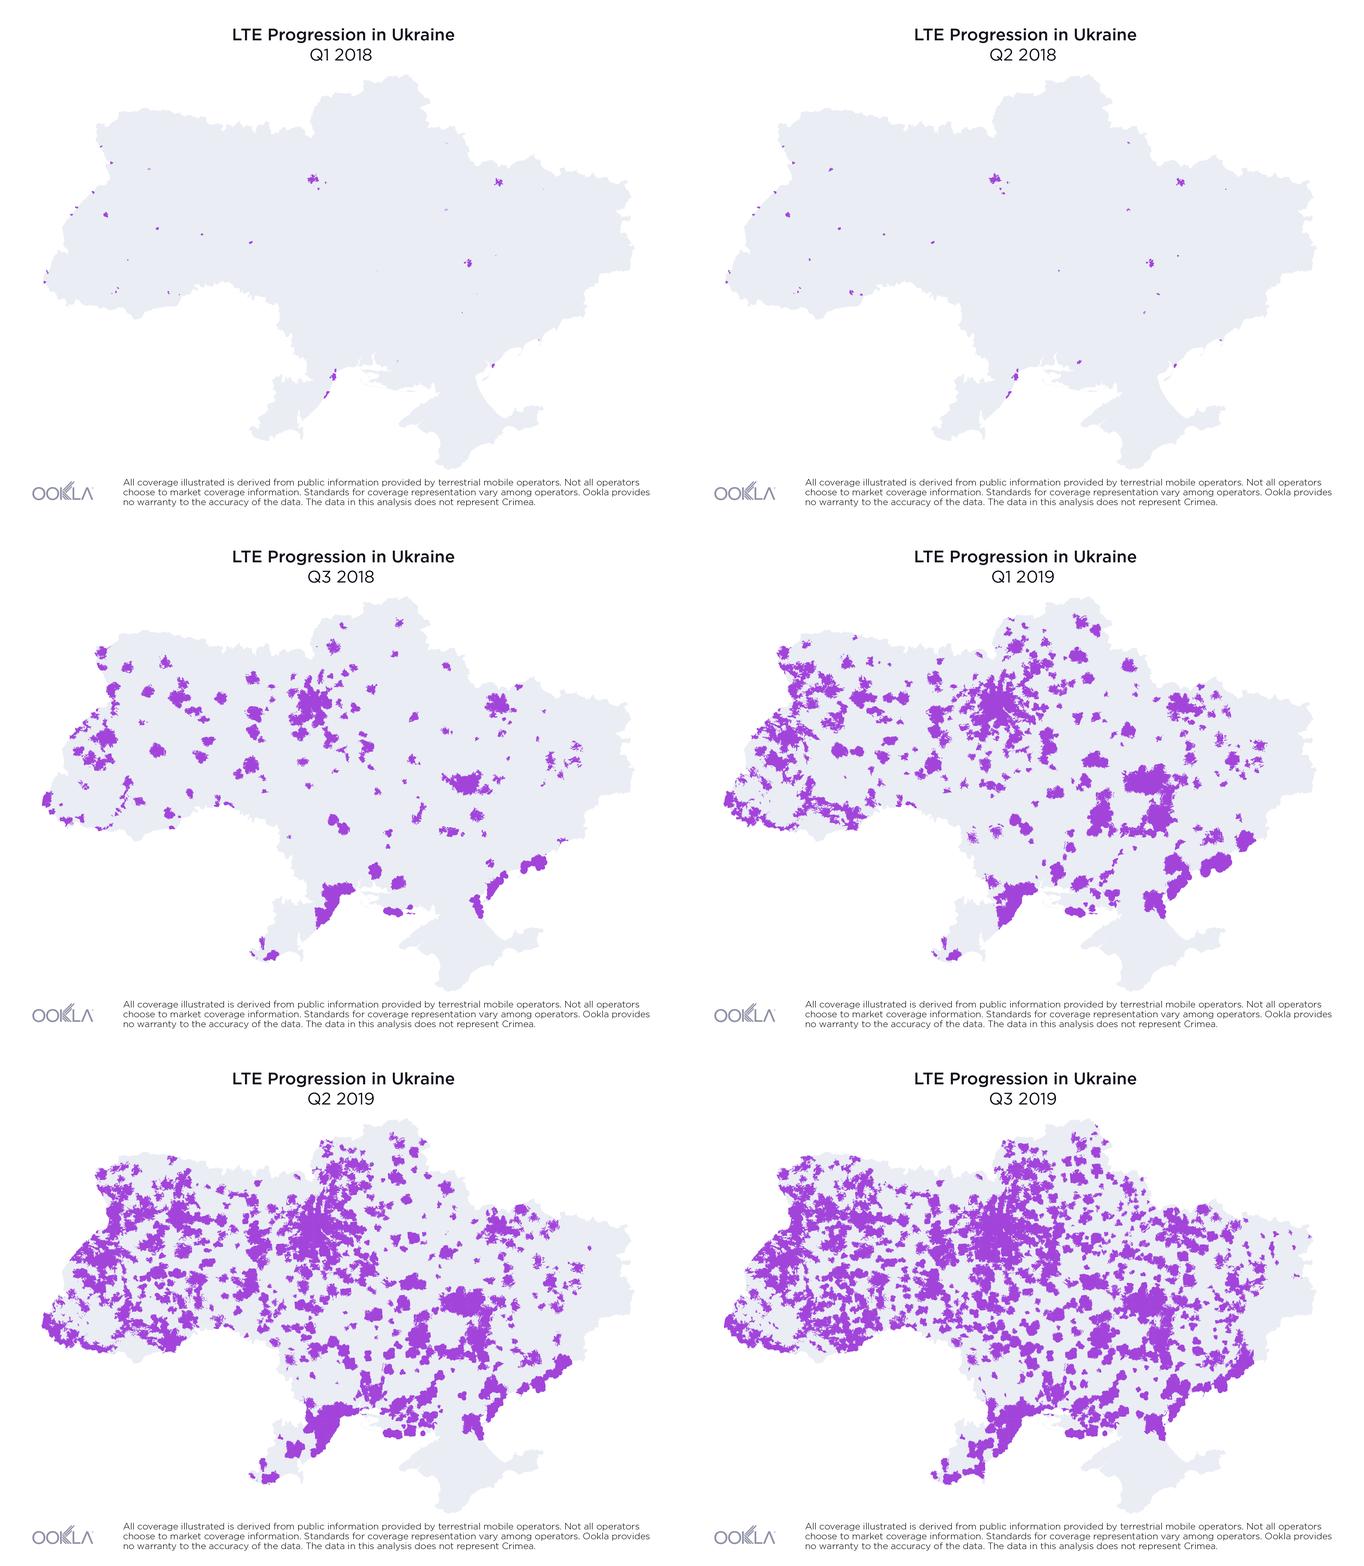
The development of LTE networks has been a key priority for operators in Ukraine over the last year. NCCIR allocated new spectrum and 4G licenses to Kyivstar, lifecell and Vodafone Ukraine at the beginning of 2018 with an agreement that they would provide LTE coverage to at least 90% of the population of each regional center within 12 months, and to 90% of the population of each town with more than 10,000 residents within 42 months.

As a result of new 4G deployments, we’ve seen rapid growth in LTE coverage over the last year in Ukraine and Speedtest data reveals the country’s 4G Availability was 34.8% during Q2-Q3 2019.

Ookla_Ukraine_progression_Map_2018q1-2019q3_en

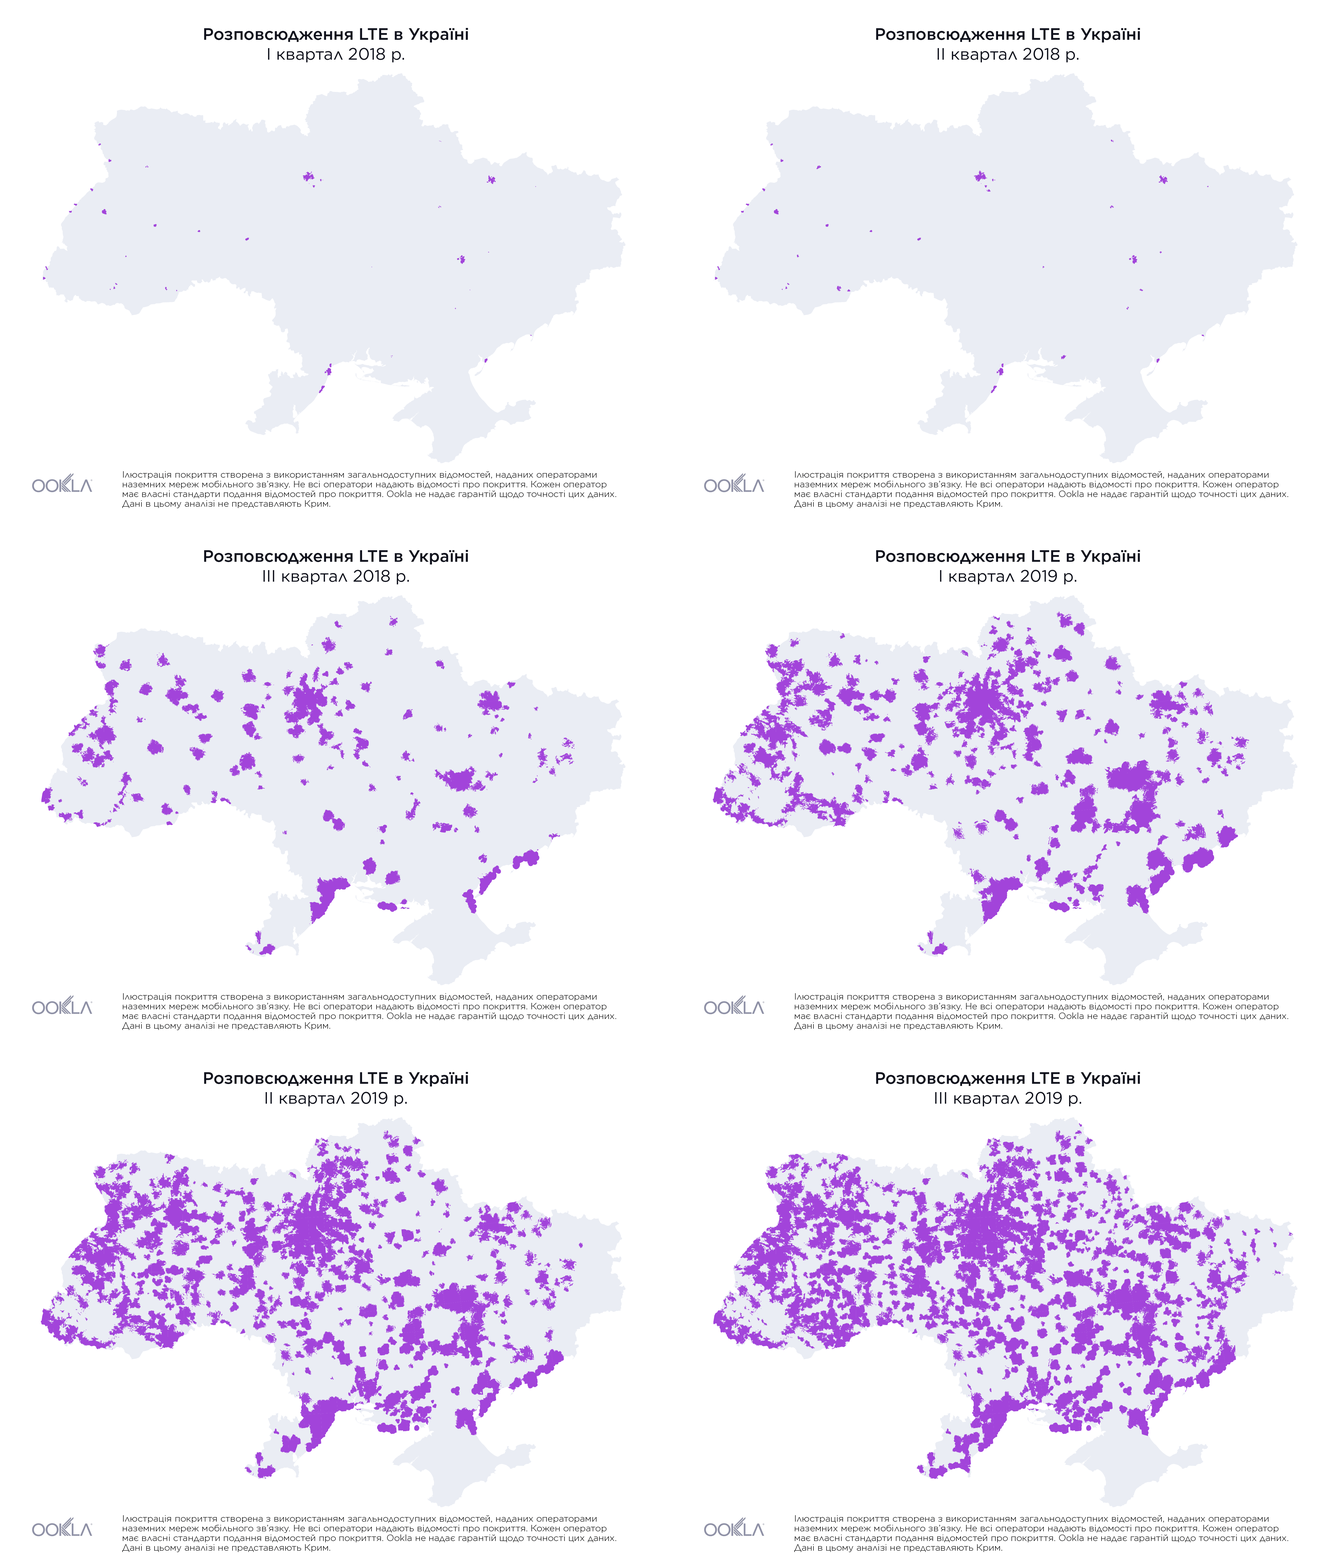
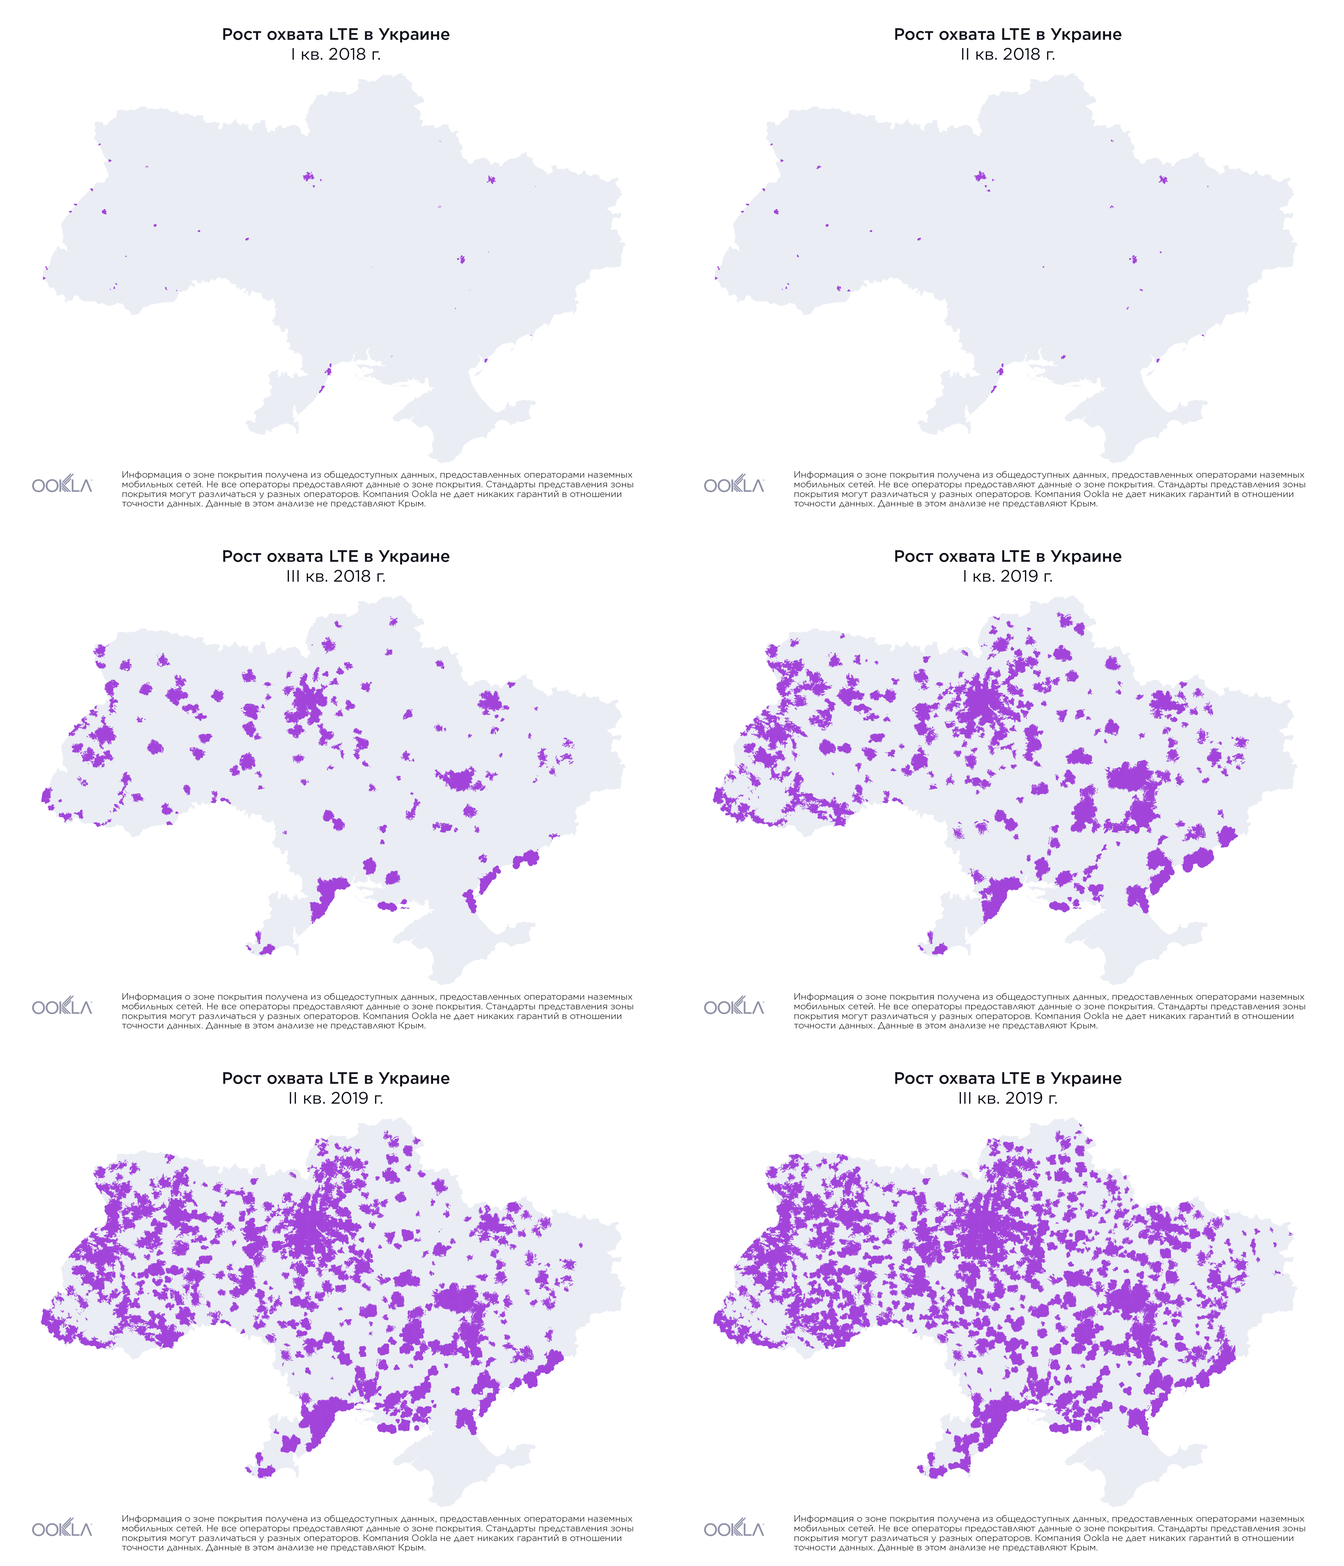
While less than 1% of the country had access to LTE service at the beginning of 2018, by the end of Q3 2019, the three largest mobile operators reported nearly 36.2% of land area in Ukraine was covered, as illustrated above.

To see Speedtest measurements of 4G Availability and speed by operator, download the full report.

Mobile speeds and 4G Availability are higher in urban areas than the country average, but fixed broadband speeds varied

-EN--4G-Avail-ukraine

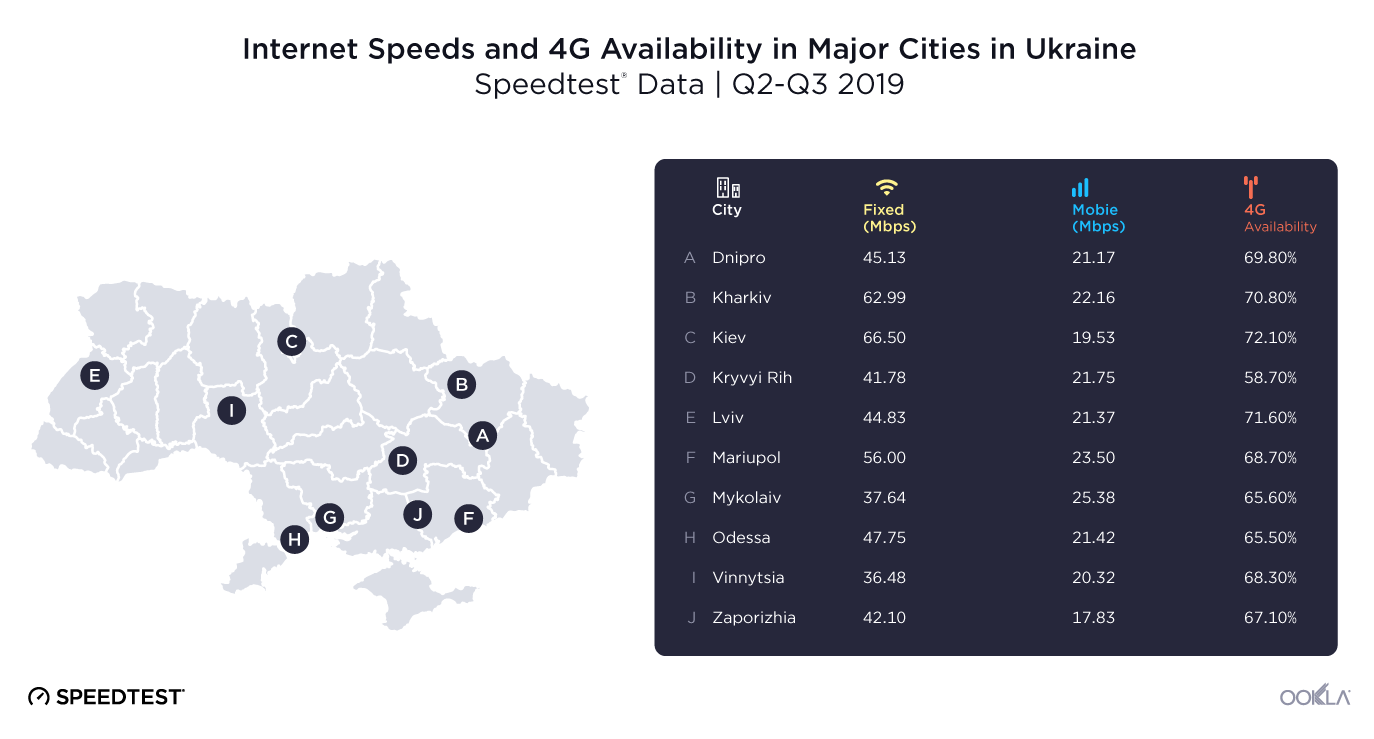
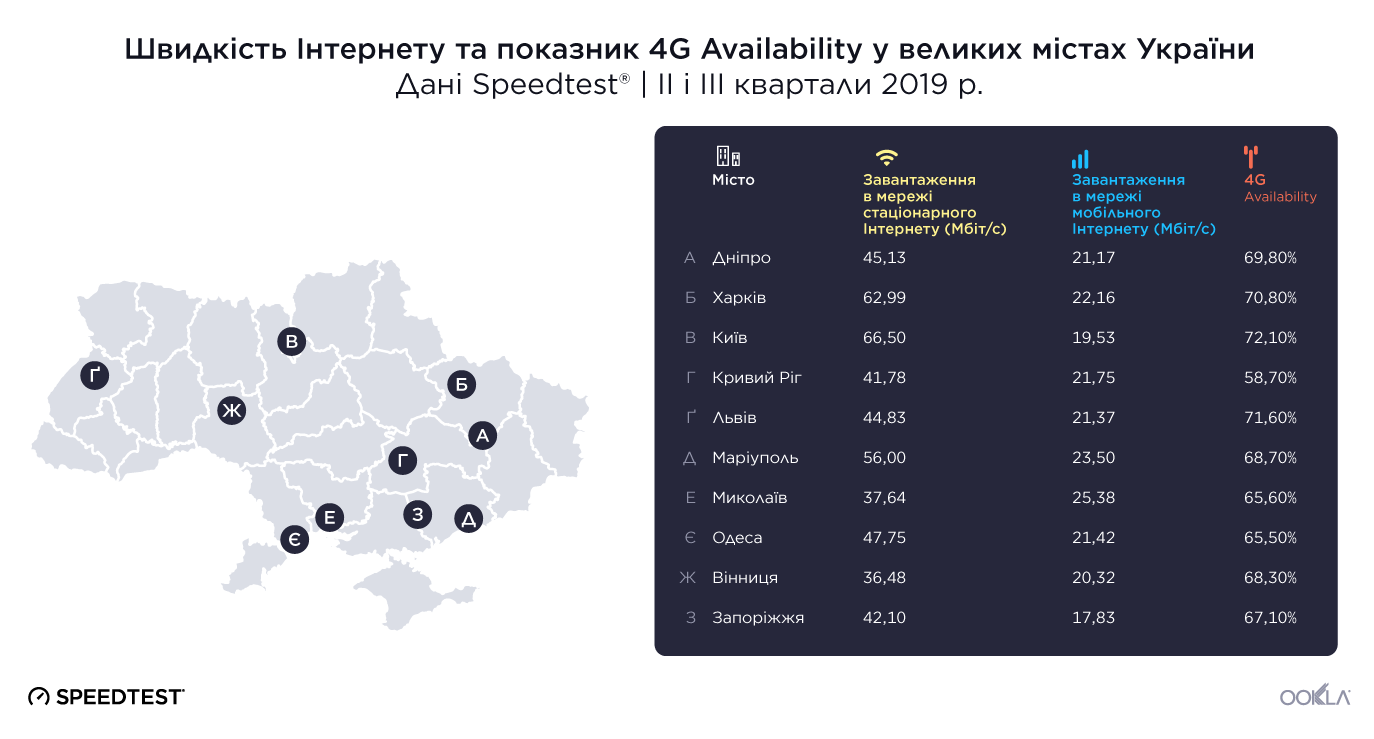
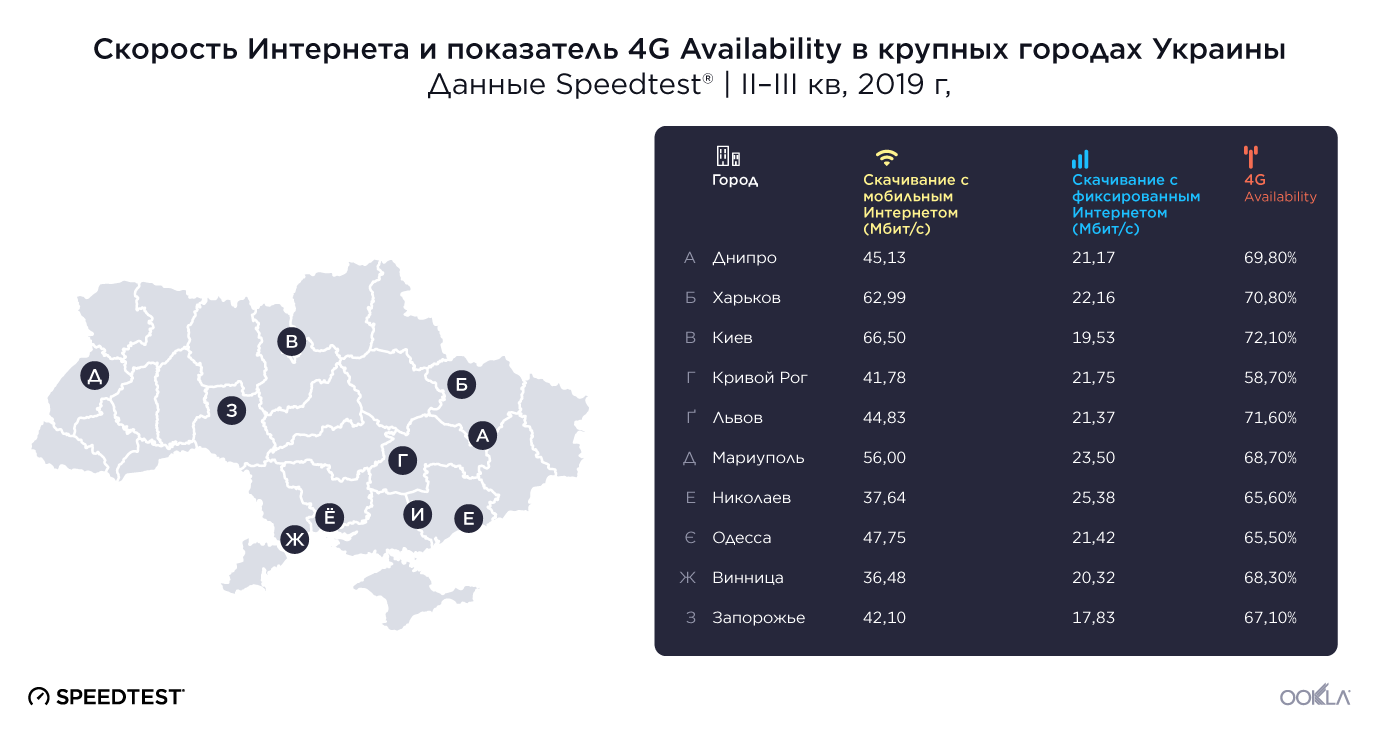
While some cities experienced fixed broadband speeds that were lower than the national average of 49.99 Mbps, Kiev (66.50 Mbps), Kharkiv (62.99 Mbps) and Mariupol (56.00 Mbps) all saw speeds that were significantly higher. The slowest speeds on our list were measured in Kryvyi Rih (41.78 Mbps), Mykolaiv (37.64 Mbps) and Vinnytsia (36.48 Mbps).

Mobile download speeds — which include all cellular technologies, not just 4G — were generally equal to or greater than the national average in the cities we looked at. Mykolaiv saw the fastest mobile download speeds, with an average of 25.38 Mbps, followed by Mariupol (23.50 Mbps) and Kharkiv (22.16 Mbps). The lowest speeds on this list were measured in Kiev (19.53 Mbps) and Zaporizhia (17.83 Mbps).

4G Availability is significantly higher in many of Ukraine’s cities than the overall country average of 34.8%, perhaps because of the operators’ commitment to bring LTE service to major population centers first. The capital, Kiev, had the best 4G Availability (72.1%) during Q2-Q3 2019, followed by Lviv (71.6%) and Kharkiv (70.8%). The other cities we measured showed a range between 65.5% and 69.8%, with the exception of Kryvyi Rih (58.7%), where there was somewhat less 4G Availability.

To see the fastest mobile and fixed broadband providers in each city, download the full report.

Editor’s note: The maps in this article were updated on November 25 to include Crimea.


Дослідження продуктивності мереж стаціонарного широкосмугового та мобільного Інтернету в Україні

Після того як Україна вийшла з економічної кризи 2016 року, регулятивні органи та постачальники послуг поставили собі за мету забезпечити надання послуг швидкісного Інтернету більшій кількості населення та позиціонувати Україну як країну, сприятливу для інновацій. Завдяки нещодавнім розгортанням LTE мобільними операторами та створенню оптоволоконних мереж постачальниками стаціонарного широкосмугового Інтернету споживачі в Україні мають безпрецедентний доступ до швидкого Інтернету, а конкуренція на ринку стала як ніколи високою. Зараз на ринку домінують три основні конкуренти: Київстар, Vodafone Україна (власником є компанія МТС) і lifecell (власником є компанія Turkcell). Ринок стаціонарного широкосмугового Інтернету дуже насичений: тут є сотні постачальників інтернет-послуг, які працюють на національному, регіональному та місцевому рівнях. У цьому звіті Ookla наведено результати перевірки швидкості стаціонарного широкосмугового та мобільного Інтернету, а також показника 4G Availability (доступність 4G) протягом останніх двох кварталів в Україні.

Ми проаналізували дані щодо продуктивності, отримані за результатами 1 805 450 тестів, проведених споживачами з використанням технологій Speedtest®, а також дані про покриття за результатами 623 мільйонів відповідних перевірок на 372 690 пристроях протягом II та III кварталів 2019 р. Дані в цьому аналізі не представляють Крим.

Щоб дізнатися, які постачальники послуг стаціонарного широкосмугового та мобільного Інтернету в Україні пропонують найшвидший доступ до Інтернету, а також про постачальників, які пропонують найшвидший доступ до мережі Інтернет і мають найкращий показник 4G Availability у великих містах України, завантажте повну версію звіту.

Швидкість мобільного та стаціонарного широкосмугового Інтернету збільшується по всій країні

-UA--Comparing-DL-Speeds-for-Ukraine-Fixed-Mobile

Швидкість мобільного та стаціонарного Інтернету в Україні поступово зростала протягом II і III кварталів 2019 р. Упродовж цього періоду середня швидкість завантаження стаціонарного широкосмугового Інтернету збільшилася на 10,4% до максимального значення 49,99 Мбіт/с у вересні. Швидкість мобільного Інтернету також збільшувалася: вона зросла на 14,8% й у вересні склала 21,4 Мбіт/с. Оскільки в Україні розповсюджується послуга LTE, ми очікуємо, що середня швидкість мобільного Інтернету буде безперервно зростати.

Нові розгортання LTE роблять швидший Інтернет доступнішим для більшої кількості людей

За останній рік розгортання мереж LTE було ключовим пріоритетом для операторів України. Національна комісія, що здійснює державне регулювання у сфері зв’язку та інформатизації, надала новий діапазон і ліцензії на 4G компаніям Київстар, lifecell і Vodafone Україна на початку 2018 року з домовленістю, що вони забезпечать покриття LTE принаймні для 90% населення кожного регіонального центру протягом 12 місяців і для 90% населення кожного міста, кількість жителів якого перевищує 10 000, протягом 42 місяців.

У результаті нових розгортань 4G за останній рік покриття LTE в Україні швидко зростало, а дані Speedtest свідчать про те, що показник 4G Availability протягом II та III кварталів 2019 року складав 34,8%.

Ookla_Ukraine_progression_Map_2018q1-2019q3_ua

На початку 2018 року територія, на якій були доступні послуги LTE, не перевищувала 1% площі країни. Однак наприкінці III кварталу 2019 року три найбільших оператори мобільного зв’язку повідомили, що покриття вже охопило майже 36,2% материкової території України, як показано вище.

Щоб дізнатися про виконані за допомогою Speedtest вимірювання показника 4G Availability та швидкості Інтернету, який надають оператори, завантажте повну версію звіту.

У середньому швидкість мобільного Інтернету та показник 4G Availability в міських регіонах вище, ніж у середньому по країні, однак показники швидкості стаціонарного Інтернету різняться

-UA--4G-Avail-Ukraine

Хоча в деяких містах швидкість стаціонарного Інтернету нижче середнього показника по країні, який дорівнює 49,99 Мбіт/с, у Києві (66,50 Мбіт/с), Харкові (62,99 Мбіт/с) і Маріуполі (56,00 Мбіт/с) швидкість Інтернету була набагато вищою. Найнижчі швидкості в містах із нашого списку були зафіксовані в Кривому Розі (41,78 Мбіт/с), Миколаєві (37,64 Мбіт/с) і Вінниці (36,48 Мбіт/с).

Швидкість завантаження в мобільних мережах (включно з усіма стільниковими мережами, а не лише 4G) зазвичай дорівнювала середньому національному показнику або перевищувала його в містах, у яких виконувалося вимірювання. У Миколаєві було зафіксовано найвищу швидкість завантаження: середній показник склав 25,38 Мбіт/с. На другому місці був Маріуполь із показником 23,50 Мбіт/с, а на третьому — Харків (22,16 Мбіт/с). Найнижчі швидкості серед міст із цього списку було зафіксовано в Києві (19,53 Мбіт/с) і Запоріжжі (17,83 Мбіт/с).

У багатьох містах України показник 4G Availability значно вищий, ніж середній показник по країні (34,8%). Імовірно, причина полягає в тому, що оператори намагаються вводити послугу LTE спочатку у великих містах. У столиці України, Києві, зафіксовано найвищий показник 4G Availability (72,1%) протягом II та III кварталів 2019 року. Друге місце за цим показником посідає Львів (71,6%), а третє — Харків (70,8%). В інших містах, у яких виконувалися вимірювання, діапазон показників склав від 65,5% до 69,8%, за винятком Кривого Рогу (58,7%), де показник 4G Availability був трохи нижчим.

Щоб дізнатися про постачальників найшвидшого мобільного та стаціонарного Інтернету в кожному місті, завантажте повну версію звіту.

Примітка редактора: Карти в цій статті були оновлені 25 листопада, щоб включити Крим.


Анализ скорости сетей мобильного и фиксированного широкополосного доступа в Интернет в Украине

После экономического спада 2016 года регулирующие органы и поставщики услуг в Украине поставили перед собой цель сделать высокоскоростной Интернет более доступным для населения и улучшить условия для внедрения инноваций в стране. Благодаря развертыванию сетей LTE операторами мобильной связи и созданию оптоволоконных сетей поставщиками фиксированного широкополосного доступа (ШПД) быстрый Интернет стал доступен для беспрецедентного количества украинских потребителей. При этом конкуренция на рынке интернет-услуг стала как никогда высокой. Ведущее положение на рынке мобильного широкополосного Интернета в настоящее время занимают три оператора: Киевстар, Vodafone Украина (принадлежит МТС) и lifecell (принадлежит Turkcell). А на рынке услуг фиксированного ШПД действуют сотни национальных, региональных и местных поставщиков. В рамках данного отчета компания Ookla рассматривает показатели скорости фиксированного ШПД и мобильного Интернета, а также 4G Availability (доступность 4G) в Украине за последние два квартала.

Наш анализ включает в себя данные о скорости за второй и третий кварталы 2019 г., полученные в результате проведения 1 805 450 потребительских тестов (с помощью Speedtest®), и данные охвата, полученные в ходе выполнения 623 млн проверок на 372 690 устройствах. Данные в этом анализе не представляют Крым.

Чтобы узнать больше о работающих в Украине поставщиках с самой высокой скоростью фиксированного ШПД и мобильного Интернета, а также ознакомиться с данными о скорости и показателями 4G Availability в некоторых из крупнейших городов Украины, скачайте полный отчет.

Скорость фиксированного ШПД и мобильного Интернета увеличивается по всей стране

-RU--Comparing-DL-Speeds-for-Ukraine-Fixed-Mobile

В течение второго и третьего кварталов 2019 г. скорость мобильного Интернета и фиксированного ШПД немного увеличилась по всей Украине. За этот период средняя скорость скачивания с фиксированным ШПД увеличилась на 10,4% и в сентябре достигла самого высокого значения — 49,99 Мбит/с. Скорость мобильного Интернета также возросла на 14,8% — до 21,40 Мбит/с в сентябре. Так как доступ к услугам LTE получает все больше украинцев, мы ожидаем, что средняя скорость мобильного Интернета продолжит увеличиваться.

Развертывание новых сетей LTE помогает увеличить скорость Интернета по стране

За последний год развертывание сетей LTE стало одним из главных приоритетов для операторов в Украине. В начале 2018 г. НКРСИ предоставила лицензии на новые частоты и 4G операторам Киевстар, lifecell и Vodafone Украина с обязательством, что они обеспечат охват сетями LTE по меньшей мере 90% населения в каждом региональном центре в течение 12 месяцев и до 90% населения в каждом городе с населением более 10 000 жителей в течение 42 месяцев.

Новые развертывания 4G значительно расширили охват LTE в Украине за последний год, и данные Speedtest показывают, что показатель 4G Availability в стране в течение второго и третьего кварталов 2019 г. составил 34,8%.

Ookla_Ukraine_progression_Map_2018q1-2019q3_ru

Хотя в начале 2018 года территория, на которой были доступны услуги LTE, составляла менее 1% площади страны, к концу третьего квартала 2019 г. три крупнейших мобильных оператора сообщили, что наземное покрытие обеспечено для 36,2% территории Украины, как показано выше.

Чтобы ознакомиться с данными Speedtest о показателе 4G Availability и скоростях по каждому оператору, скачайте полный отчет.

Скорость мобильного Интернета и показатель 4G Availability в городских районах выше, чем в среднем по стране, но скорость фиксированного ШПД варьировалась.

-RU--4G-Avail-ukraine

Хотя в некоторых городах скорость фиксированного ШПД была ниже, чем в среднем по стране (49,99 Мбит/с), она была значительно выше в Киеве (66,50 Мбит/с), Харькове (62,99 Мбит/с) и Мариуполе (56,00 Мбит/с). Самая низкая скорость была зарегистрирована нами в Кривом Роге (41,78 Мбит/с), Николаеве (37,64 Мбит/с) и Виннице (36,48 Мбит/с).

Скорость скачивания с мобильным Интернетом (учитывались все сотовые технологии, а не только 4G) в оцененных нами городах в целом находилась на уровне среднего значения по стране или превышала его. В Николаеве скорость скачивания с мобильным Интернетом была самой высокой — в среднем 25,38 Мбит/с. Второе место по этому показателю занял Мариуполь (23,50 Мбит/с), а третье — Харьков (22,16 Мбит/с). Самая низкая скорость зарегистрирована в Киеве (19,53 Мбит/с) и Запорожье (17,83 Мбит/с).

Показатель 4G Availability во многих городах Украины значительно выше, чем в среднем по стране (34,8%). Возможно, это связано с тем, что операторы стремятся обеспечить доступность услуг LTE в первую очередь в крупных населенных пунктах. Во втором и третьем кварталах 2019 г. столица Украины, город Киев, имела высокий показатель 4G Availability (72,1%). Второе место по этому показателю занял Львов (71,6%), а третье — Харьков (70,8%). В других городах, по которым были получены данные, этот показатель составил от 65,5% до 69,8%, за исключением Кривого Рога (58,7%), в котором показатель 4G Availability был ниже.

Чтобы ознакомиться с данными о поставщиках самого быстрого мобильного Интернета и фиксированного ШПД в каждом городе, скачайте полный отчет.

Примечание редактора: карты в этой статье были обновлены 25 ноября и теперь включают Крым.

Ookla retains ownership of this article including all of the intellectual property rights, data, content graphs and analysis. This article may not be quoted, reproduced, distributed or published for any commercial purpose without prior consent. Members of the press and others using the findings in this article for non-commercial purposes are welcome to publicly share and link to report information with attribution to Ookla.

| October 21, 2019

Exploring Recent Trends in the India Telecom Market

With the release of new fiber-to-the-home services and a strong push by providers to bring 4G to more parts of the country, we decided to check in and see how fixed broadband speed, mobile speed and 4G Availability have looked over the last two quarters in India.

Our analysis includes performance data from 21,096,823 consumer-initiated tests taken with Speedtest® and coverage data from over 2.5 billion coverage scans on 2,436,758 devices during Q2-Q3 2019.

For the first time ever we are also making available for download a detailed report on performance by operator including an in-depth look at peak time performance. Download the full report.

Mobile and fixed speeds are increasing at the country level

India-Mobile-Fixed-Speeds-in-Largest-Markets--1-
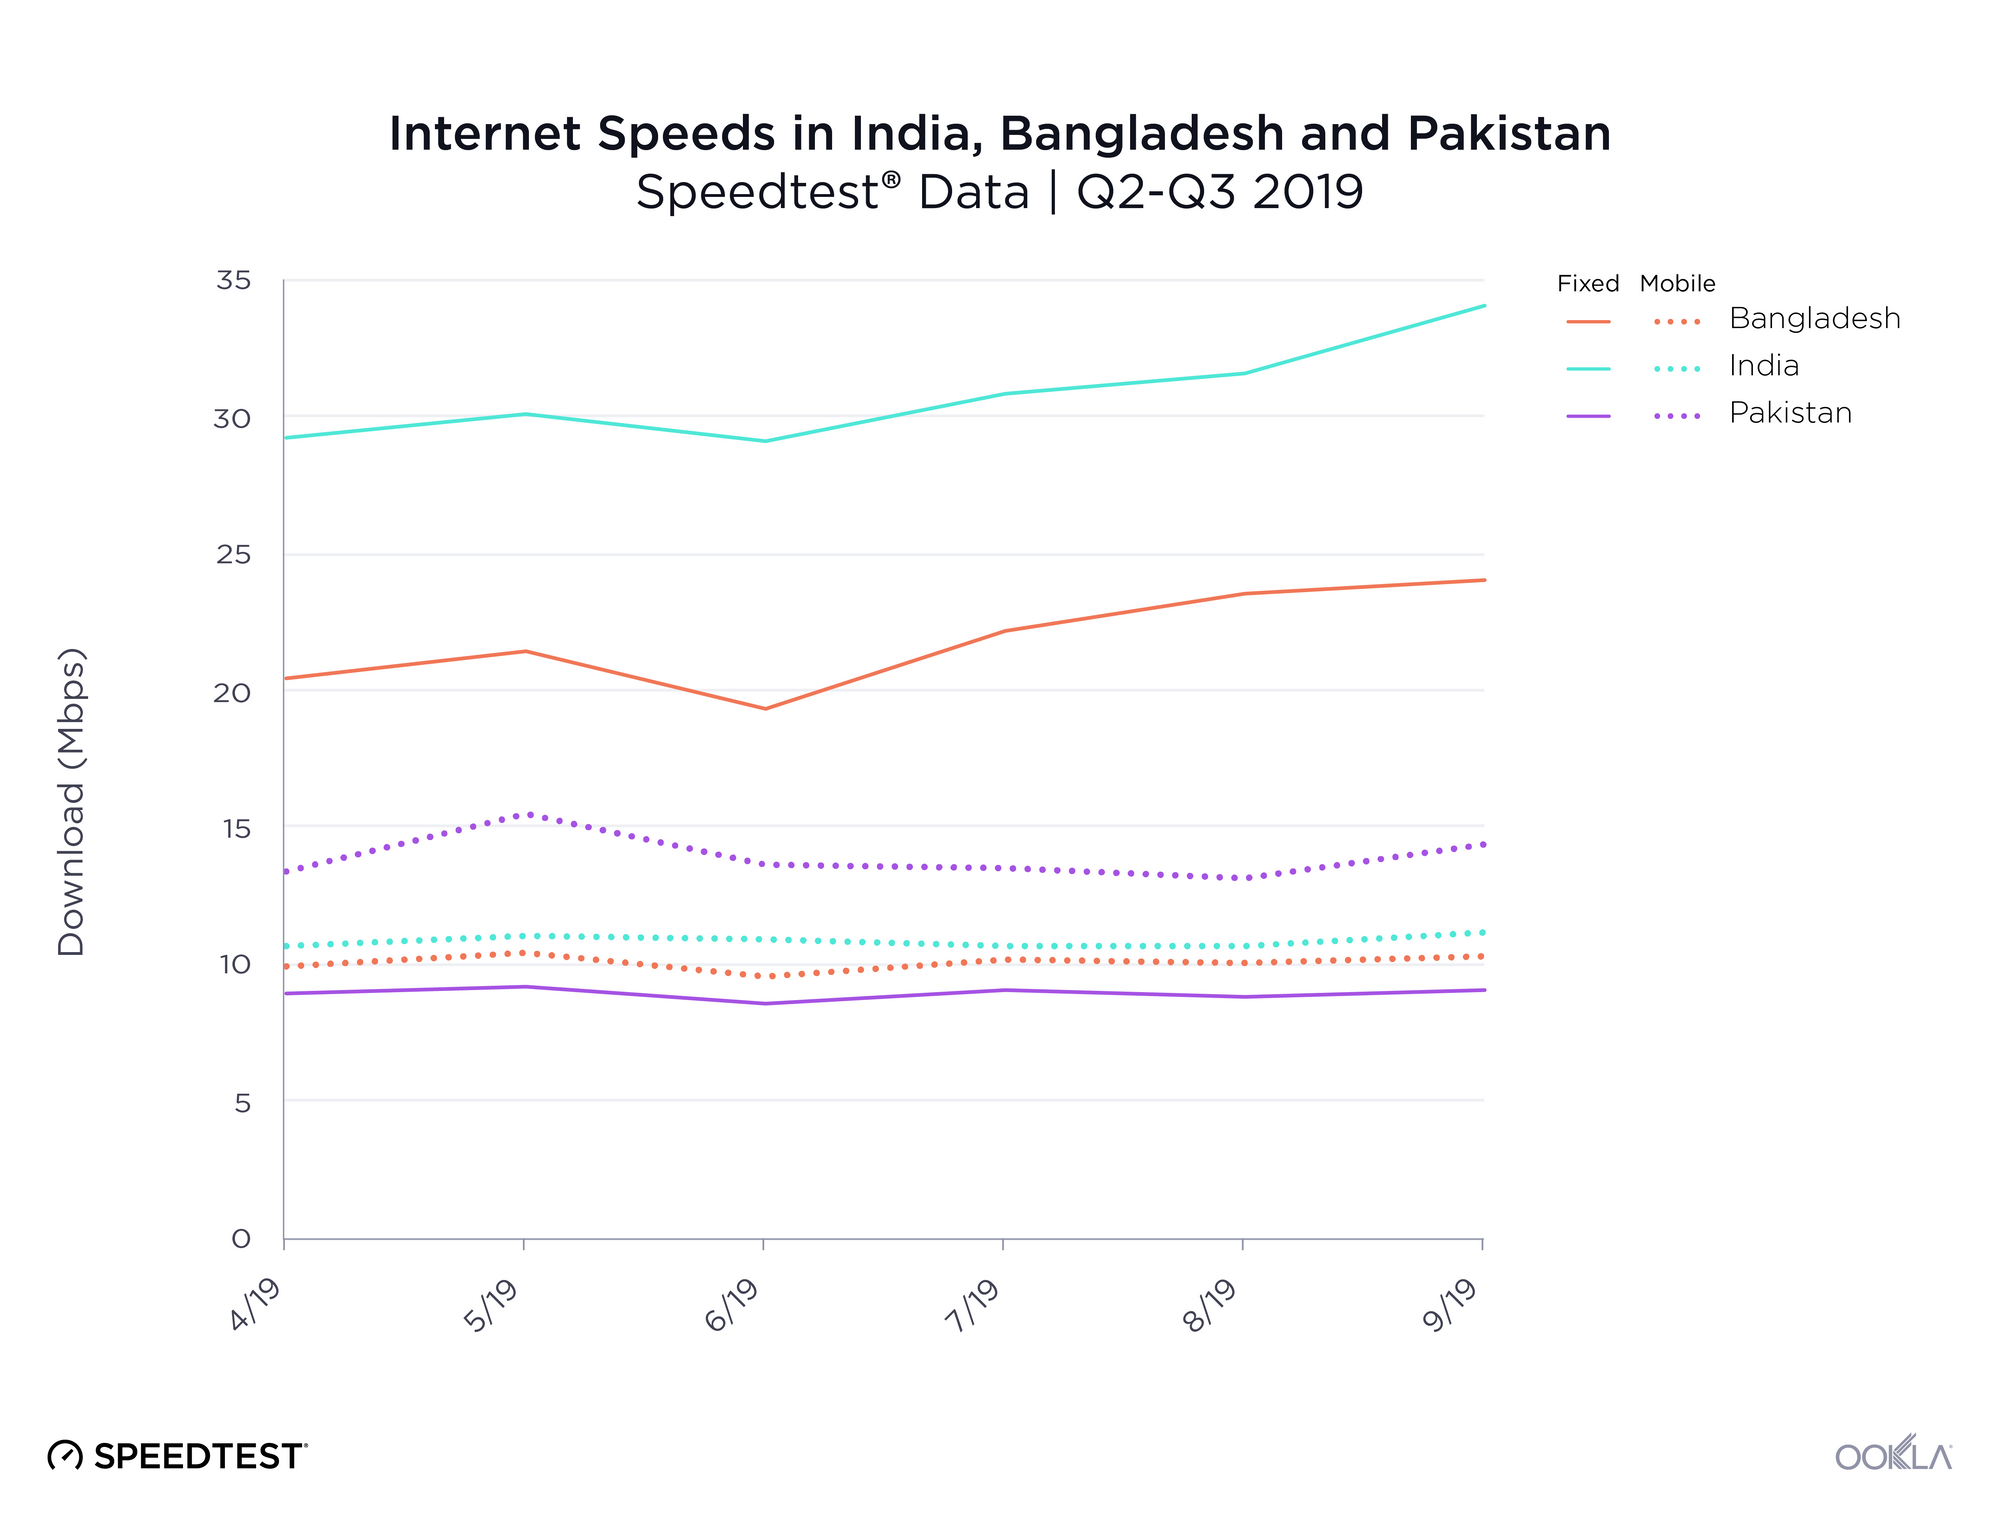
Mean fixed broadband download speeds in India rose 16.5% during Q2-Q3 2019 and topped 34.07 Mbps in September. Compared to Bangladesh, which saw a similar rate of improvement but lower speeds at 24.02 Mbps, and Pakistan, where speeds stayed relatively flat between 8.54 and 9.14 Mbps, India is the regional leader in mean download speed.

With Reliance Jio’s rollout of its new GigaFiber service in India in early September, we will likely continue to see country-wide speeds increase. (Download the full report to compare Jio’s monthly fixed download speeds before and after the launch of GigaFiber.)

However, mobile download speeds were relatively flat in India, fluctuating between 10.63 Mbps and 11.18 Mbps during Q2-Q3 2019. Regionally, India’s mobile performance is marginally faster than Bangladesh’s, which saw average speeds max out at 10.43 Mbps, and somewhat slower than Pakistan’s top speeds of 15.55 Mbps.

4G Availability continues to improve in India

India’s mobile providers are still trying to provide consistent 4G coverage across the country. We compared coverage data for over 231,274,713 samples from Speedtest Android users across Indian mobile operators in Q2-Q3 2019 to benchmark India’s 4G Availability against other markets in the region.

India-4G-Availability-by-Country

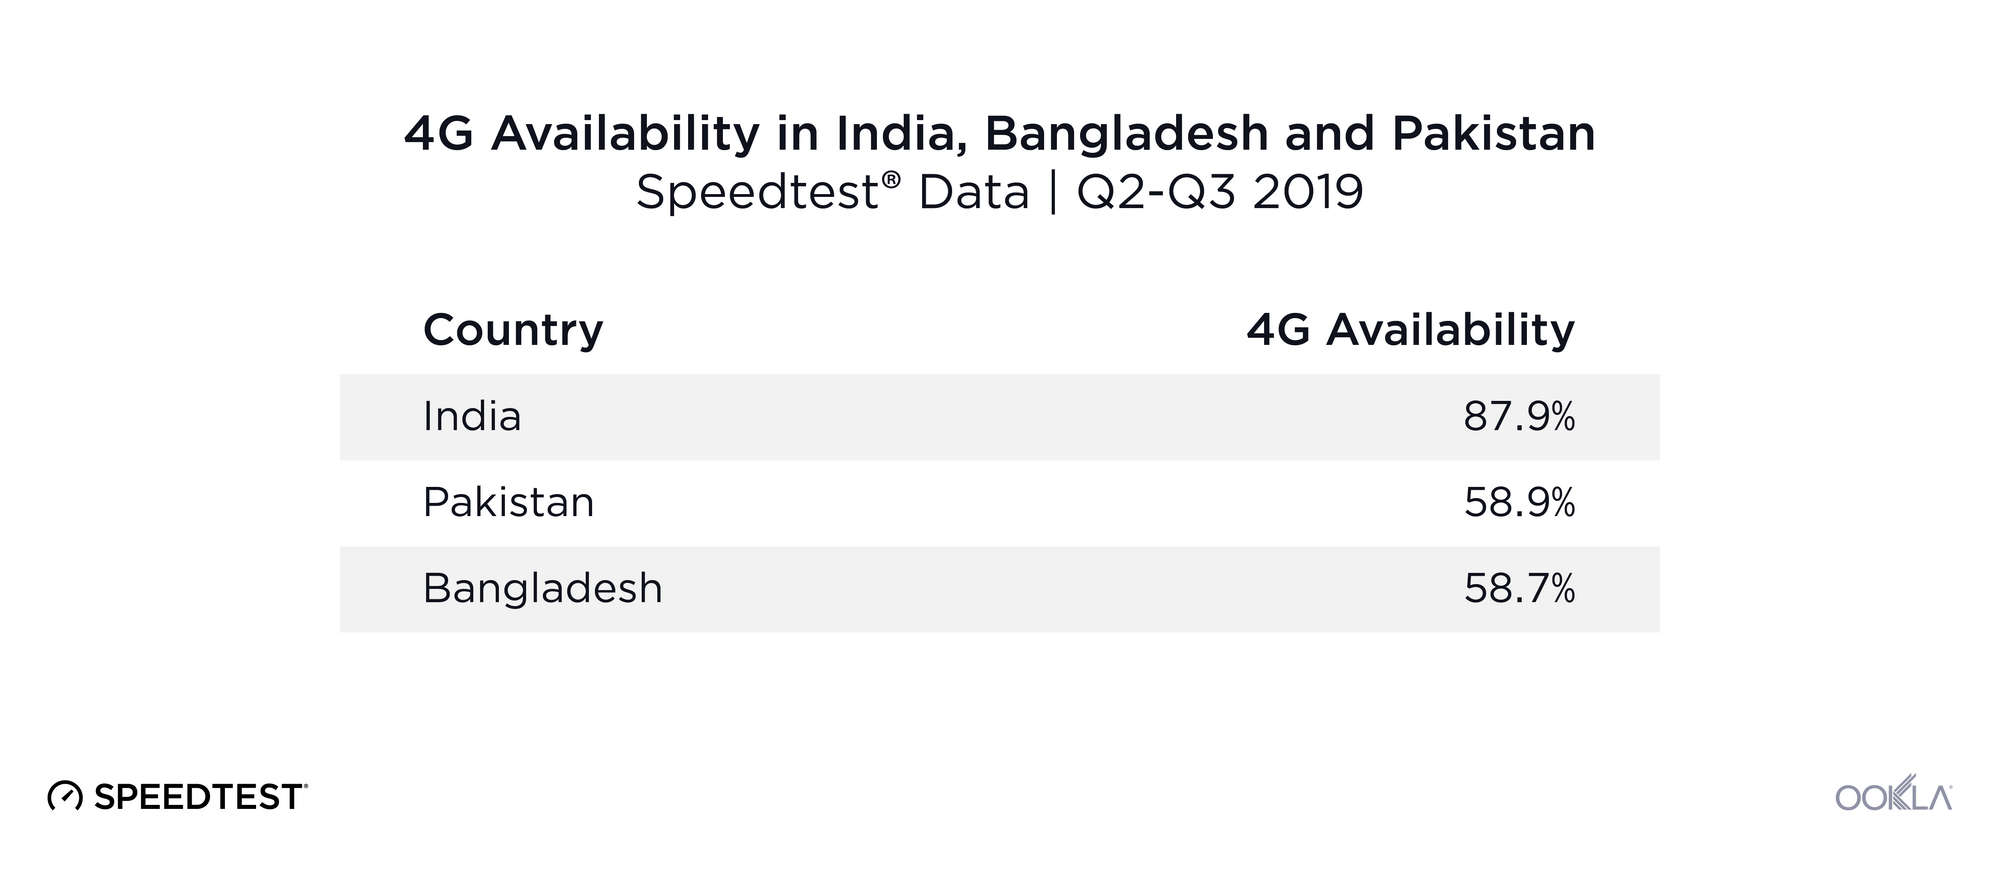
4G Availability is the percentage of an operator’s known locations where a device has access to LTE service (including roaming). India’s 4G Availability was relatively high at 87.9% across providers during Q2-Q3 2019. That means that Speedtest users had access to LTE service at 87.9% of surveyed locations. For comparison, 4G Availability was 58.9% in Pakistan and 58.7% in Bangladesh during the same period.

Fixed broadband speeds show wide disparities between India’s largest cities

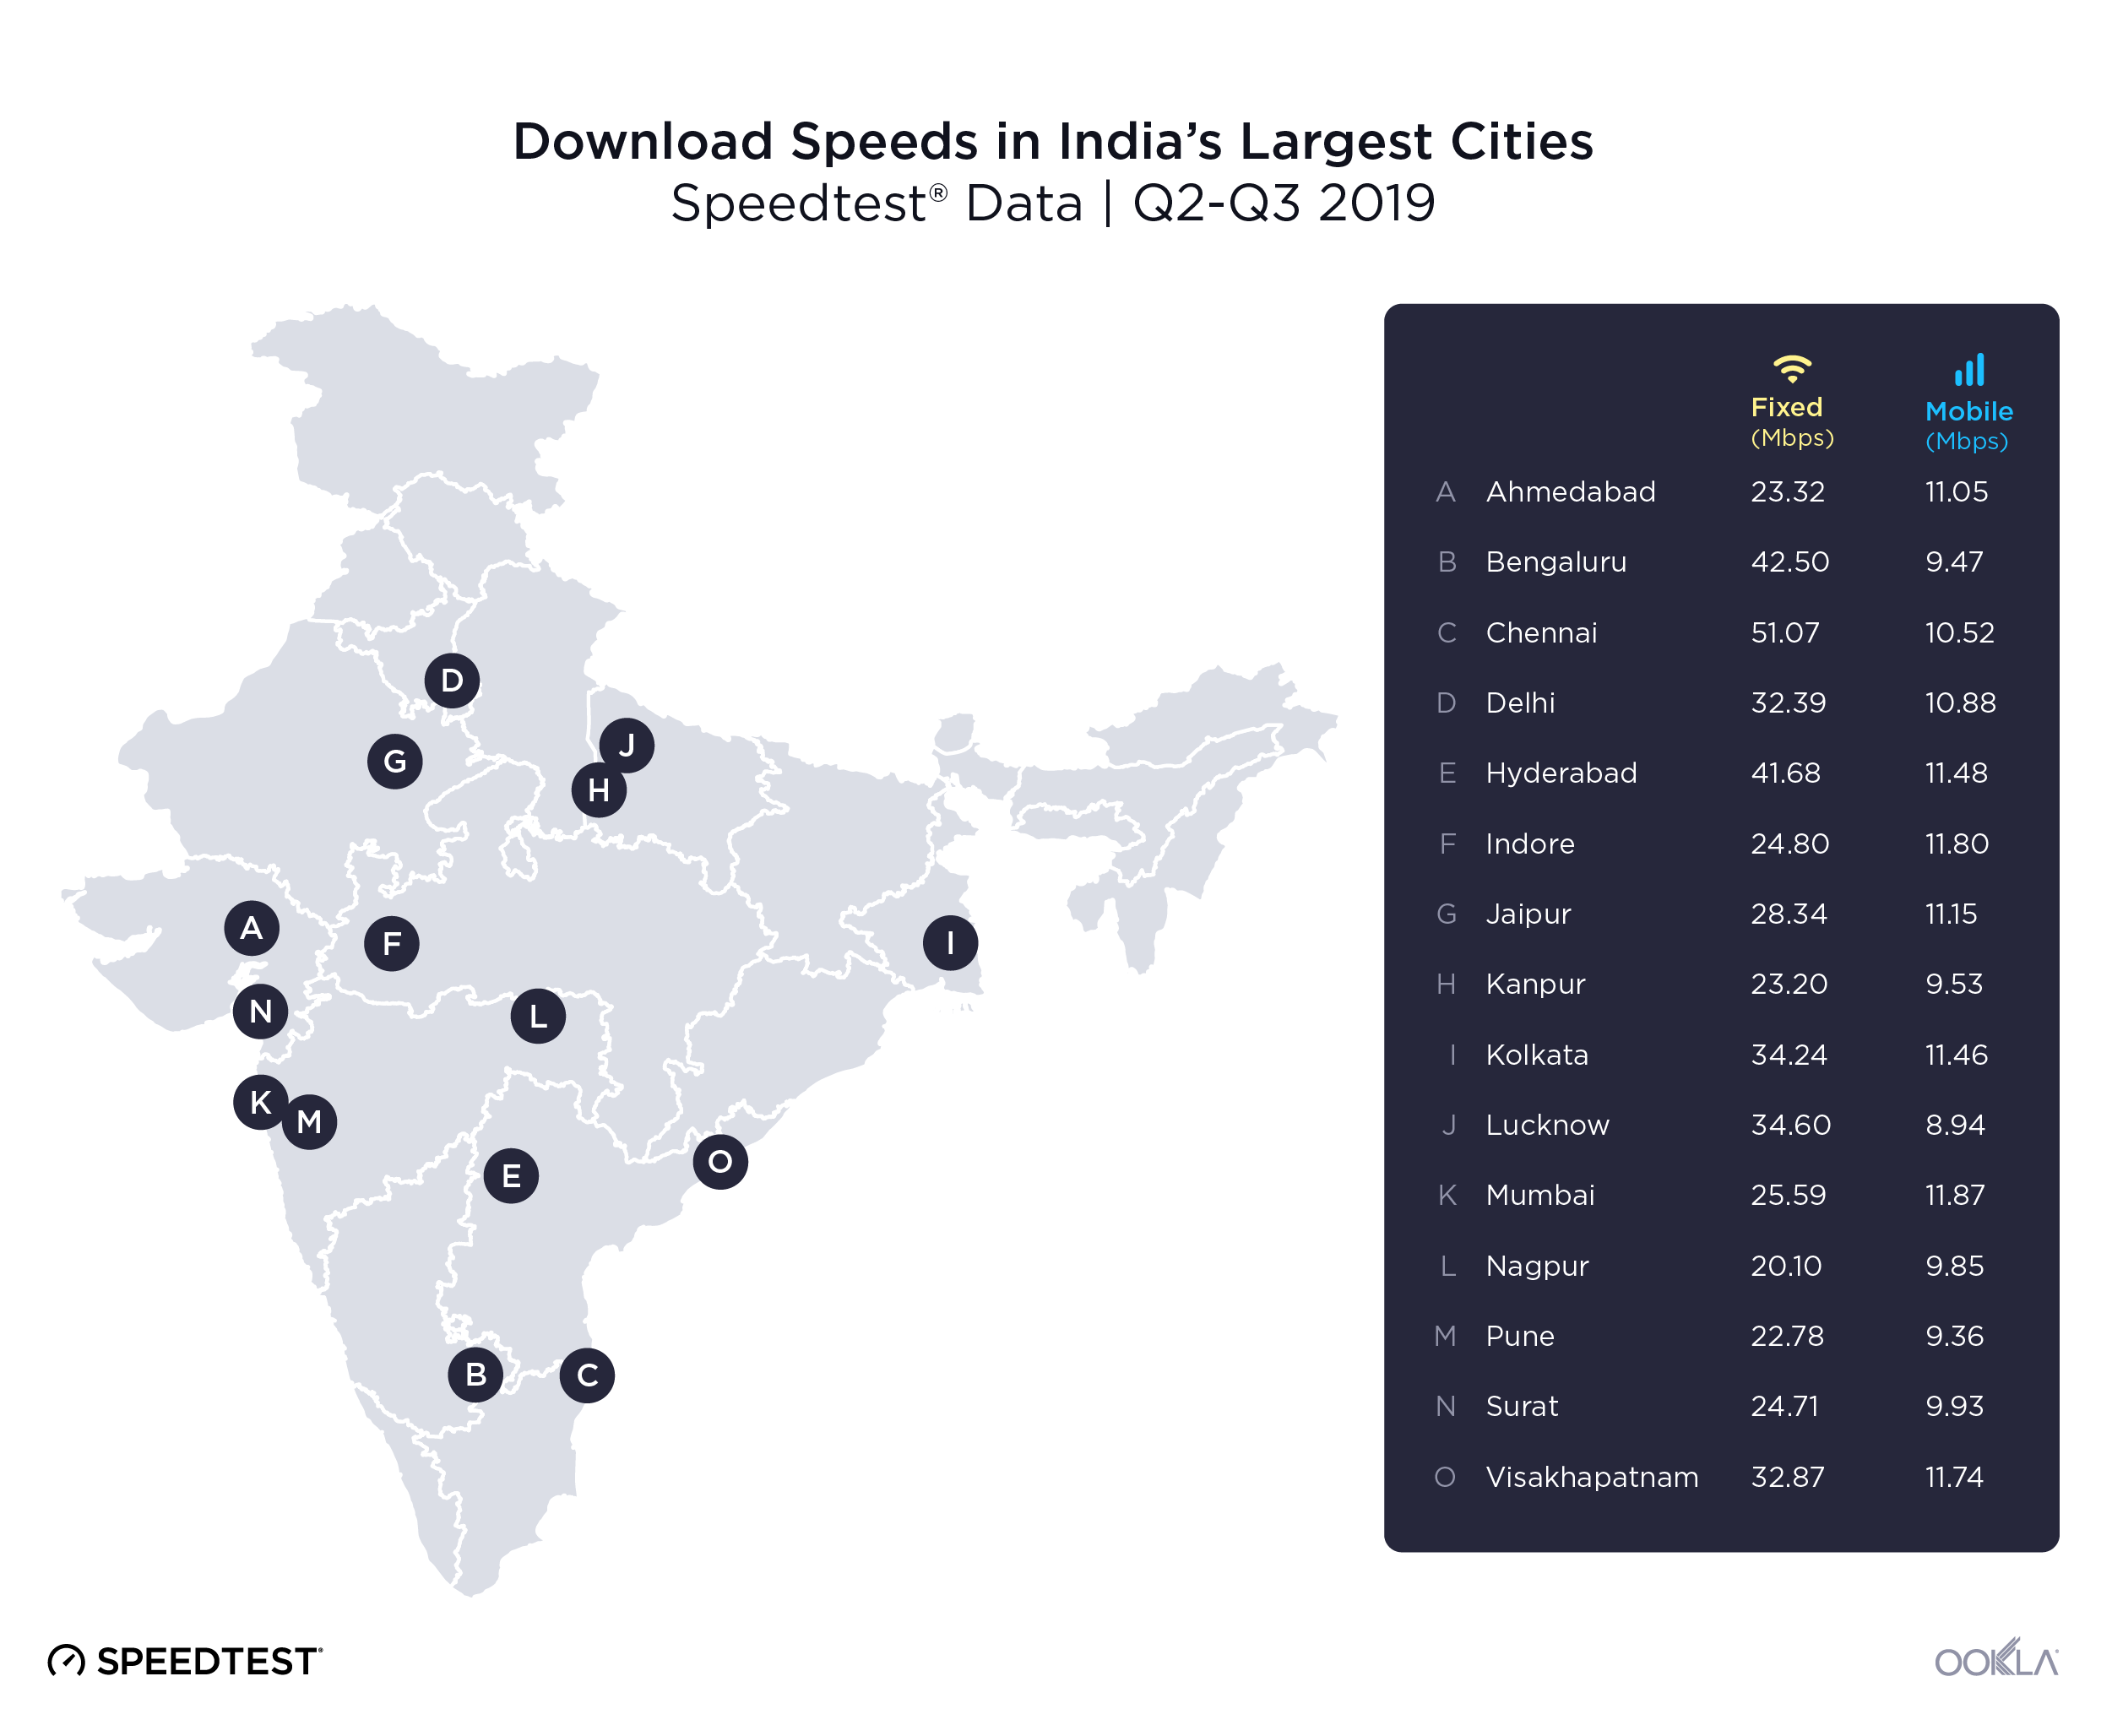
In a country as large as India, country-wide averages factor in many regional differences. To get a clearer picture of how consumers experience the internet across the country, we looked at fixed and mobile download speeds in the 15 largest cities in India during Q2-Q3 2019.

Ookla_Internet-Speeds-in-India---Largest-Cities-2

Chennai had by far the fastest mean download speed over fixed broadband (51.07 Mbps), followed by Bengaluru (42.50 Mbps) and Hyderabad (41.68 Mbps). The slowest download speeds on our list were measured in Nagpur (20.10 Mbps), followed by Pune (22.78 Mbps) and Kanpur (23.20 Mbps).

Mobile download speeds — which include all cellular technologies — showed somewhat less variation from city to city. Mumbai (11.87 Mbps), Indore (11.80 Mbps), Visakhapatnam (11.74 Mbps), Hyderabad (11.48) and Kolkata (11.46 Mbps) had the fastest mobile download speeds. The slowest mean download speed on our list was measured in Lucknow (8.94 Mbps).

Want to see which ISPs and mobile operators were fastest in each city, plus a breakdown of how operators perform at peak times of network congestion, based on signal metrics? Download the full report.

Ookla retains ownership of this article including all of the intellectual property rights, data, content graphs and analysis. This article may not be quoted, reproduced, distributed or published for any commercial purpose without prior consent. Members of the press and others using the findings in this article for non-commercial purposes are welcome to publicly share and link to report information with attribution to Ookla.