| February 17, 2021

ICYMI: Ookla Data and Research from January 2021


Highlights from the Speedtest Global IndexTM

Global-Index-Tweet-Image-January-2021-2
These are the top stories from January 2021:

  • Spain climbed five ranks and reached ninth place on fixed broadband. This is the first time the country has reached the top ten.
  • On mobile, the United Arab Emirates is in first place for the fifth time in 13 months.
  • Greece climbed to 29th place, most likely due to an expanding 5G market.
  • Denmark reached fifth place for fixed broadband for the first time in the last year.

Articles worth a second look

Introducing Video Testing from Speedtest

Video streaming is a crucial part of the internet experience. Now you can directly measure your video’s quality using Speedtest for iOS.

Emerging 5G Market Keeps Canada in the Global Top 10 for Mobile Speeds

Canada’s 5G market may be less than a year old, but its expansion has provided provinces and cities across the country with speeds that far exceed those over 4G.

Advances in 5G Boosts Mobile Speeds in Taiwan

This comprehensive report on Taiwan’s mobile speeds shows the impact 5G has had on the market — and how speeds vary by operator and across the country.

Illustrating the Worldwide Growth of 5G (Poster Download)

This poster illustrates the impact of 5G on network performance worldwide using data from Speedtest Intelligence®. Download the free poster to see the full picture of the industry’s achievements.

New Year, Great Data: The Best Ookla Open Data Projects We’ve Seen So Far

Read more about the most exciting open data projects from Ookla For GoodTM that really show what this data can do.

“There’s a Problem With Your Connection” — The Most Significant Outages of Q4 2020

Did you experience an online service outage during Q4 2020? Find out what online service outages made headlines during the last three months of 2020.
Upcoming webinars

Upcoming webinars

Using Crowdsourced Data for Competitive Network Intelligence in Latin America

In the upcoming Ookla® webinar, offered in both Portuguese and Spanish, we share how mobile operators in Latin America can monitor and benchmark their competitors’ performance and also prioritize network optimization in the areas most important to their customers.

pr-cta1
Wednesday, February 24 at 11 a.m. BRT

es-cta1
Thursday, February 25 at 9 a.m. CST (10 a.m. EST/PET/COT)

Ookla retains ownership of this article including all of the intellectual property rights, data, content graphs and analysis. This article may not be quoted, reproduced, distributed or published for any commercial purpose without prior consent. Members of the press and others using the findings in this article for non-commercial purposes are welcome to publicly share and link to report information with attribution to Ookla.

| December 10, 2018

The World’s Internet in 2018: Faster, Modernizing and Always On

When it comes to the internet, the news is mostly good for 2018. Download and upload speeds are increasing across the globe on both mobile and fixed broadband. 5G is on the horizon and gigabit service is expanding.

We looked at data from Speedtest IntelligenceTM, Ookla’s flagship data platform, from December 2017 through November 2018, to analyze everything from global internet speeds to the world’s fastest countries to when people are online. We also investigated which parts of the world are seeing the most benefit from high speed LTE on mobile and gigabit speeds on fixed broadband.

Mobile speeds increased more than 15% in 2018

Graphic-Tables-Final-v2_mobile-average-speed-3

The world’s average mobile download speed of 22.82 Mbps increased 15.2% over the past year, while mobile upload speed increased 11.6% to reach 9.19 Mbps.

Graphic-Tables-Final-v2_android-vs-ios-1

With a mean download speed of 27.84 Mbps and a mean upload of 10.61 Mbps, worldwide speeds on iOS devices were faster than those on Android (21.35 Mbps download, 8.73 Mbps upload) in 2018. This is likely due to market factors as Android devices are more popular in emerging markets where internet speeds tend to be slower.

However, download speed on Android devices increased 19.0% and upload speed increased 15.1%, more than those on iOS (18.0% increase for download and 11.1% increase for upload), which is good news for those emerging markets.

Fixed broadband speeds increased more than 26% in 2018

Graphic-Tables-Final-v2_fixed-average

On a global level, fixed broadband speeds were nearly twice as fast as those on mobile in 2018. The world’s average download speed on fixed broadband was 46.12 Mbps, 26.4% faster than last year. Upload speed increased 26.5% to 22.44 Mbps.

All said, though, both mobile and fixed broadband speeds increased at a slower rate in 2018 than they did in 2017.

Countries with the fastest internet in 2018

Graphic-Tables-Final-v2_top-5-mobile

The countries with the fastest mean download speeds over mobile in the past 12 months were: Norway (63.19 Mbps), Iceland (58.68 Mbps), Qatar (55.17 Mbps), Singapore (54.71 Mbps) and the Netherlands (53.42 Mbps).

Graphic-Tables-Final-v2_top-5-fixed

Singapore showed the world’s fastest mean download speeds over fixed broadband during the past twelve months at 175.13 Mbps. Next fastest were Iceland (153.03 Mbps), Hong Kong (138.31 Mbps), South Korea (114.67 Mbps) and Romania (109.90 Mbps).

To keep up with month-to-month internet speeds at a global level, visit the Speedtest Global Index.

Most improved countries for 2018 internet speeds

Graphic-Tables-Final-v2_most-improved-mobile

Costa Rica saw the largest increase in mobile download speed over the past year at 194.6%. Myanmar was second with 121.8%, Saudi Arabia third (113.2%), Iraq fourth (92.3%) and the Ukraine fifth (82.1%).

The countries with the largest improvements in upload speeds were Bangladesh (179.2%), the Ukraine (172.5%), Costa Rica (163.4%), Myanmar (146.9%) and Iraq (126.7%).

Graphic-Tables-Final-v2_most-improved-fixed

Paraguay saw the biggest increase in mean download speed over fixed broadband in the world over the past year at 268.6%. Guyana was second with 113.5%, Libya third (108.0%), Malaysia fourth (89.5%) and Laos fifth (76.2%).

Libya showed the most improvement in mean upload speed over fixed broadband during the past twelve months at 176.4%. Guyana was second with 116.1%, Malaysia third (95.2%), Belize fourth (88.9%) and Iraq fifth (76.8%).

4G is increasing mobile speeds

2017-2018-LTE-growth

When we looked specifically at Speedtest results on 4G, we saw that mean download speeds increased in most countries. Costa Rica was most improved for 4G download speed as was the case with overall download speed on mobile increasing 184.3% year over year. Saudi Arabia was second at 110.2% and Myanmar third at 78.0%.

Most encouragingly, we saw the number of Speedtest results over 4G increase in all but 15 countries. This could indicate that 4G availability is expanding. Tanzania saw the greatest increase with 355.0% more tests over 4G in 2018 than in 2017. Malta was second at 267.2% and Algeria third at 143.7%. We can see this expansion on the map above as 4G results fill in areas of the globe that were previously blank.

Gigabit coverage is expanding globally

gigabit-fade-1

Gigabit is in the news as ISPs across the globe expand their high-speed networks. We looked at Speedtest results on fixed broadband in excess of 750 Mbps to see which cities are benefitting most. Comparing locations with 100 or more gigabit-speed results in 2017 with those in 2018, that expansion becomes obvious. In 2017, 60 countries met our gigabit test threshold. In 2018, 16 additional countries joined our gigabit list. We’re also seeing that more cities around the world now have access to gigabit speeds.

Also exciting is that cities which already had gigabit in 2017 saw increases in the number of gigabit-speed results in 2018 as ISPs continue to build out infrastructure across cities. Many cities saw their first real gigabit expansion in 2018. For example, we saw the number of gigabit tests in New Delhi increase from 119 gigabit speed results in 2017 to 20,239 in 2018, that’s a mind-boggling 16,908% increase. Chennai, India saw a 7,481% increase (from 763 to 57,840) and Cormeilles-en-Parisis, France jumped 6,480%. Huge leaps in the number of gigabit-speed results were also seen in Gdańsk, Poland (6,338%); Rome, Italy (4,909%); Lancashire, United Kingdom (3,962%); Ota, Japan (3,240%); São Paulo, Brazil (2,947%); Hangzhou, China (2,669%) and Turda, Romania (2,636%).

When people are online

point-3-sec-final-1

The internet is always on, but we were surprised to see how consistently and steeply usage fell off on both mobile and fixed broadband after 9 pm local time. Normalizing the time of day for Speedtest results from around the globe, we found that usage bottoms out at 4 am and then climbs steeply again until 10 am. From there, the internet gets gradually busier until that night time drop off.

Internet in the world’s largest countries

The world’s five most populous countries are notably absent from the lists of fastest and most improved countries on mobile and fixed broadband. China, India, the U.S., Indonesia and Brazil represent about 46% of the world’s population, which makes their internet speeds worth noting nonetheless.

Internet Speeds in the World’s Largest Countries
Speedtest Data | December 2017-November 2018
Country Mean Mobile Download Speed (Mbps) % Improvement in Mobile Speed Mean Fixed Download Speed (Mbps) % Improvement in Fixed Speed
China 30.96 -5.8% 76.03 42.5%
India 9.11 15.2% 23.00 50.4%
United States 28.50 22.3% 92.77 37.3%
Indonesia 10.39 5.3% 14.89 18.3%
Brazil 18.65 29.3% 22.95 39.4%

Mobile internet speeds in the world’s largest countries

China had the fastest average mobile download speed among the world’s most populous countries in the past twelve months. However, China’s mobile download speed decreased during that time. The United States is fast catching up with China on mobile download speed.

Brazil occupied a middle ground for mobile download speed among the world’s most populous countries and showed the fastest rate of increase. India and Indonesia were at the bottom of this list. While the two nations show similar mobile download speeds to each other, India’s mobile download speed is improving much more quickly than Indonesia’s.

Fixed broadband speeds in the largest countries in the world

The United States showed the fastest fixed broadband download speed among the world’s most populous countries over the past year. China was second, India and Brazil nearly tie for third and Indonesia follows.

India showed the largest improvement in mean download speed over fixed broadband of the world’s five largest countries. China was second, Brazil third, the U.S. fourth and Indonesia fifth.

We’ll be back throughout 2019 to report on the state of the world’s internet as it evolves. Until then, take a Speedtest to find out how your network compares.

Ookla retains ownership of this article including all of the intellectual property rights, data, content graphs and analysis. This article may not be quoted, reproduced, distributed or published for any commercial purpose without prior consent. Members of the press and others using the findings in this article for non-commercial purposes are welcome to publicly share and link to report information with attribution to Ookla.

| September 4, 2019

In-Depth Analysis of Changes in World Internet Performance Using the Speedtest Global Index

A lot has changed in the two years since 2017 when we first began ranking mobile and fixed broadband speeds of countries around the world with the Speedtest Global IndexTM. 5G is being deployed around the world and fiber continues to make gigabit speeds a reality in more and more countries. We’ve been tracking it all and are here to report on how much speeds have increased, which countries are leading internet performance and which are falling behind, and what trends we see across continents.

World mobile speed increased 21.4% with fixed broadband up 37.4%

World-Download-Speeds-2019-OG2

Looking just at the last year, the world’s mean download speed over mobile increased 21.4% from 22.81 Mbps in July 2018 to 27.69 Mbps in July 2019. Mean upload speed over mobile increased 18.1% from 9.13 Mbps to 10.78 Mbps. The world average for download speed over fixed broadband increased 37.4% from 46.48 Mbps in July 2018 to 63.85 Mbps in July 2019. Mean upload speed over fixed broadband increased 48.9% from 22.52 Mbps to 33.53 Mbps.

Shake-ups in the country rankings for internet performance

Fastest-Countries-Mobile-2018-2019

Mobile speeds in the fastest countries have skyrocketed in the past year which has dramatically shifted the rankings. South Korea, which was not even in the top ten a year ago, saw a 165.9% increase in mean download speed over mobile during the past 12 months, in large part due to 5G. Switzerland’s mean download speed increased 23.5%. Canada’s was up 22.2%, Australia 21.2%, the Netherlands 17.3%, UAE 11.1%, Malta 10.3% and Norway 5.8%. Qatar remained in the top ten, although the country’s mean download speed over mobile actually dropped 1.4% from July 2018 to July 2019.

Individual mobile operators can make a huge difference in a country’s speeds. In 2017 we were excited to see Telenor uncap their mobile speeds, which drove Norway to the top of the Speedtest Global Index. A big part of South Korea’s mobile success in the past year is the way KT, LG U+ and SK Telecom banded together to release 5G at the same time. Switzerland has also benefited from 5G and Sunrise leads the country with 262 5G deployments across the country while Swisscomm has 52.

Fastest-Countries-Fixed-2018-2019

Fixed broadband rankings on the Speedtest Global Index have not changed as dramatically during the past 12 months as those on mobile. Singapore remains the fastest country with an increase in mean download speed over fixed broadband of 5.6%. Taiwan had the largest jump in speeds among the top 10 with a 166.5% improvement in fixed download speed between July 2018 and July 2019. Mean download speed over fixed broadband increased 52.4% in South Korea, 26.4% in Macau, 21.7% in Romania, 21.0% in Switzerland, 19.3% in the United States and 3.5% in Hong Kong.

Monaco and Andorra did not have enough tests to qualify for the Speedtest Global Index one year ago, but massive fixed broadband improvements in both countries inspired us to lower our test count threshold for inclusion and also share these smaller countries’ success stories.

Technologies paving the way: 5G and gigabit

The presence of 5G is not enough to change a market

As discussed above, 5G has the potential to rocket a country to the top of the mobile rankings on the Speedtest Global Index. In practice, we’ve seen 5G speeds that were over 1000% faster than those on LTE.

Mobile-Download-Speeds-by-Country

In reality, though, unless 5G is commercially available widely across a country and from all mobile operators (as was the case in South Korea), the change in speeds at the country level is not that significant. Though commercial 5G was launched widely across Switzerland by Sunrise and Swisscom in April 2019, the country’s mean download speed only increased 2.8% in the three months since. The average mobile download speed in the U.S. has actually declined slightly since 5G was initially deployed. This is because 5G is still only available in a very limited number of markets to consumers with 5G-capable devices.

Visit the Ookla 5G Map for the latest on 5G deployments across the globe.

Gigabit is a game-changer, if you can get it

Unlike 5G, fiber connections have been rolling out since 2007, opening up the possibility of gigabit-speed fixed broadband. That said, it’s costly and time-intensive to lay miles and miles of fiber so progress has varied widely across the globe.

Gigabit-Test---Performance_Singapore-1

Geographically small countries like Singapore have the advantage when it comes to fiber, because It’s easier and cheaper to lay fiber optic cable across the country’s small footprint. Singaporean internet service providers (ISPs) have used this advantage to go beyond mere gigabit and offer connections as fast as 10 Gbps. This is reflected both in Singapore’s dominance of the fixed rankings on the Speedtest Global Index and in the fact that 2.87% of their total Speedtest results over fixed broadband are gigabit-speed (800 Mbps or higher).

Gigabit-Test---Performance_Brazil-1

Brazil offers a good contrast for how difficult it can be for gigabit to reach the masses. While the first Brazilian ISP to offer fiber-to-the-premises (FTTP) initially did so in 2007, easy access to gigabit speeds was slow to follow. However, that may be starting to change. Between June and July 2019 we saw a large uptick in gigabit-speed results in Brazil, where the proportion of gigabit speed tests increased from 0.02% of total fixed broadband tests to 0.17%. This corresponded with a large increase in mean download speed at the country level.

Comparing world mobile and fixed broadband at a glance

We were curious to see just how different internet performance experiences were around the world, so we plotted average mobile download speed against average download speed on fixed broadband. All of the graphs below use a percentage difference from the global average, a number that changed between 2018 and 2019.

fade-Performance-vs-Global---Quadrant-All

Speed Leaders

There was not much change in the list of countries that showed above-average download speeds on both mobile and fixed broadband between July 2018 and July 2019, the “Speed Leaders.” What did change was that fixed broadband speeds increased significantly enough among the group to bring the whole pack closer to Singapore and Hong Kong. On the mobile axis, South Korea’s major increase in download speed made that country more of an outlier, pushing the boundaries of what great performance can look like.

Fixed-Focused countries

Between July 2018 and July 2019 we saw the number of countries considered to be “Fixed-Focused” (having faster download speeds over fixed broadband than the world average while their average mobile download speeds were slower than average) increase. Ireland was the only country that solidly fit this category in 2018. Thailand and Chile started near the midline for fixed speeds and below-average for mobile speeds in 2018. 2019 found both countries squarely in the Fixed-Focused category. Israel also edged into this category as their mobile download speed fell between July 2018 and 2019.

Mobile-Focused countries

The “Mobile-Focused” category saw the most movement between July 2018 and July 2019 as some countries (the UAE and Qatar) increased their fixed speeds sufficiently to join the Speed Leaders. Meanwhile, Bosnia and Herzegovina’s mobile download speed increased year-over-year to move them into the Mobile-Focused quadrant. Georgia’s mobile download speed decreased enough to move them from Mobile-Focused to Speed Laggers.

It will be interesting to see how many of these Mobile-Focused countries double down on their mobile investments and explore 5G alternatives to fixed broadband.

Speed Laggers

No country wants to be in the position of having slower than average mobile and fixed broadband speeds. We saw 57 countries in this “Speed Laggers” quadrant in July 2018 and 78 in July 2019. This increase is mostly due to our expansion of the number of countries we consider for the Speedtest Global Index based on test count. There were enough countries in this category that we’ve considered them separately by continent below.

Regional views of mobile and fixed broadband performance

Mobile-and-Fixed-Broadband-Improvement-by-Continent-02

We aggregated Speedtest results by continent to analyze mobile and fixed broadband performance by continent.

Mobile-and-Fixed-Performance-by-Continent-01

Asia had the highest percentage increase in mobile download speed followed by North America, Oceania, South America, Africa and Europe. Oceania had the fastest mean download speed in July 2019. North America placed second, Europe third, Asia fourth, South America fifth and Africa sixth.

On the fixed broadband side, South America saw the highest percentage increase in download speed. Asia came in second, Europe third, Africa fourth, North America fifth and Oceania sixth. North America had the fastest mean download speed in July 2019. Europe was second, Asia third, and Oceania fourth. As we saw with mobile, South America and Africa again ranked fifth and sixth, respectively.

A zoomed-in view of the speed quadrants separated by continent offers a more detailed view of each country’s role in these rankings.

Africa mostly lags in internet speeds

2019-Performance-vs-Global---Africa

In July 2019, all but two African countries in the Speedtest Global Index fell into the Speed Laggers category, having mobile and fixed broadband speeds that were below global averages. The exceptions were South Africa and Guinea, which both had fast enough mobile speeds to place them in the mobile-focused quadrant.

Asian markets show a wide breadth of internet performance

2019-Performance-vs-Global---Asia

Asia was the most diverse continent we examined in terms of internet performance. We saw a plurality of countries in each of the four quadrants in July 2019. Most of the Speed Leaders were in East Asia: China, Hong Kong (SAR), Japan, Macau (SAR), South Korea, and Taiwan. If we include Singapore, another Speed Leader, these are among the wealthiest nations in Asia (using GDP per capita). Two of Asia’s Fixed-Focused countries are in Southeast Asia (Malaysia and Thailand) and one is in the Middle East (Israel).

The Speed Laggers category contained countries from South Asia (including Afghanistan, India and Pakistan), Southeast Asia (Brunei, Cambodia, the Philippines and Vietnam) and the Middle East (Jordan). Mobile-Focused countries in Asia were mostly Middle Eastern, including Kuwait, Lebanon, Oman, Saudi Arabia and Turkey.

European mobile performance is mostly strong, fixed varies

2019-Performance-vs-Global---Europe

With the exception of Ireland, the European countries on the Speedtest Global Index fell into the Speed Leaders, Mobile-Focused, and Speed Laggers categories. All of the Speed Laggers (Belarus, Kazakhstan, Russia and the Ukraine) were from Eastern Europe. Countries from Southeast Europe (including Albania, Bosnia and Herzegovina, Croatia, Greece, Montenegro, Moldova, Serbia and Slovenia) and Central Europe (Austria and the Czech Republic) made up the bulk of the Mobile-Focused category.

Speed Leaders included countries from the Baltics (Estonia, Latvia and Lithuania), the Nordics (Denmark, Norway and Sweden), Central Europe (Poland and Romania), and Western Europe (including Belgium, France, Germany, the Netherlands, and Spain).

North American internet performance is sharply divided

2019-Performance-vs-Global---North-America

Canada and the U.S. are the only two North American countries in the Speed Leaders category. Panama is the only North American country under Fixed-Focused. Mexico and all of the Central American countries fall into the Speed Laggers category. There are no North American countries that are Mobile-Focused.

Each country in Oceania has a very different internet story

2019-Performance-vs-Global---Ocean

Oceania is represented in three of the four quadrants: Speed Leaders (New Zealand), Mobile-Focused (Australia) and Speed Laggers (Papua New Guinea) with Fiji straddling the divide between Speed Laggers and Mobile-Focused.

South America mostly lags in mobile and fixed internet speeds

2019-Performance-vs-Global---South-America

Most of the South American countries represented on the Speedtest Global Index are in the Speed Laggers quadrant (Argentina, Bolivia, Brazil, Colombia, Ecuador, Paraguay, Peru, Suriname and Venezuela). Chile is an exception, being part of the Fixed-Focused group, as is Uruguay which sits in Mobile-Focused.

Global internet speeds are improving on average and 5G and gigabit are compounding those advances where available. However, not all countries are benefitting equally. We’ll be interested to see how 5G continues to push mobile speeds in the next year and also whether 5G Wi-Fi becomes a game changer for fixed broadband. Remember to check the Speedtest Global Index on a monthly basis for updated country rankings. And take a Speedtest to make sure your experience is represented in your country’s averages.

Editor’s Note: This article was edited on September 10, 2019 to correct an error in the labeling on the first image. The colors in a later image were updated for consistency.

Ookla retains ownership of this article including all of the intellectual property rights, data, content graphs and analysis. This article may not be quoted, reproduced, distributed or published for any commercial purpose without prior consent. Members of the press and others using the findings in this article for non-commercial purposes are welcome to publicly share and link to report information with attribution to Ookla.

| March 13, 2020

Tracking COVID-19’s Impact on Global Internet Performance (Updated July 20)

We are no longer updating this article as internet speeds in most countries have stabilized to pre-pandemic levels. For ongoing information about internet speeds in specific countries, visit the Speedtest Global IndexTM or contact our press team.

Ookla® closely monitored the impact of COVID-19 on the performance and quality of global mobile and broadband internet networks in the early days of the pandemic. We shared regular information based on Ookla data to assist in the understanding of this unprecedented situation. You can still download the July 20, 2020 CSV here which contains all the public data we tracked in this article. If you are looking for information on internet or online service outages, please check Downdetector®.

Ookla retains ownership of this article including all of the intellectual property rights, data, content graphs and analysis. This article may not be quoted, reproduced, distributed or published for any commercial purpose without prior consent. Members of the press and others using the findings in this article for non-commercial purposes are welcome to publicly share and link to report information with attribution to Ookla.

| February 22, 2021

Revisiting iPhone 12 5G Performance Across the Globe


As we previously covered, the iPhone 12 is finally allowing Apple enthusiasts to connect to 5G. We’re back with fresh data to see how user adoption and new 5G rollouts have affected performance worldwide.

Unique 5G-capable device counts have leveled off

After the launch of various iPhone 12 models, the daily count of unique devices worldwide that are capable of connecting to 5G spiked significantly compared to the year as a whole. The daily trend of unique 5G-capable devices as a percentage of the whole year is dramatically higher than before the iPhone 12 models launched, but has remained relatively steady since December.
Daily-Trend_5G-Capable-Devices_Year_0221

Pro 5G and Pro Max 5G are the most popular iPhone 12 models

We looked again at Speedtest® results from the launch date of each model, this time including data through the end of January, to see which iPhone 12 models are the most popular. This time we added five additional cities for a total of 20 major cities across the globe. We still found that most Speedtest users have opted for the “Pro” models.

The iPhone 12 Pro Max 5G showed the highest number of samples among iPhone models in Bangkok, Kuwait City, Singapore, Abu Dhabi, Dubai, Riyadh, Hong Kong, New York, London, Madrid and Sydney. This was a change for both London and Madrid, which had previously had more samples from the iPhone 12 Pro 5G.

The iPhone 12 Pro 5G showed the most samples in Seoul, Zürich, Berlin, Amsterdam, Warsaw, Helsinki, Rome, Barcelona and Tokyo. While the more affordable models were less popular than the Pro models across all the cities on our list, the iPhone 12 Mini saw the most adoption in Tokyo and the iPhone 12 5G saw the most adoption in Rome and Madrid.
iPhone-12-Model-Popularity_0221

Seoul tops list of iPhone 12 5G speeds

As before, we analyzed Speedtest Intelligence® data for iPhone 12 devices in these 20 cities and found that Seoul had the fastest median speed over 5G, followed by several of the major cities of the Gulf Cooperation Council (GCC), namely Kuwait City, Abu Dhabi, Dubai and Riyadh.

It is also interesting to observe that, in the highly dynamic European market where many different network rollout approaches are possible, 5G download speeds in seven of nine European cities fell between 135-160 Mbps range on the iPhone 12. Helsinki and Warsaw were the exceptions in Europe, with 241.98 and 61.14 Mbps median download speeds, respectively.
iPhone-12-5G-Median-Speeds_0221

Operator breakdown: iPhone 12 performance in select cities

We also expanded our operator analysis to 10 cities. The following charts include median 5G speeds over iPhone 12 models of top operators with sufficient samples.

Operator rankings did not change in the four cities we previously analyzed. LG U+ in Seoul, China Mobile Hong Kong in Hong Kong and KPN Mobile in Amsterdam still had the fastest median 5G download speeds over the iPhone 12 in their local markets.
iPhone-12-5G-Median-Speeds_Seoul_0221-1

iPhone-12-5G-Median-Speeds_Hong-Kong_0221

iPhone-12-5G-Median-Speeds_Amsterdam_0221

iPhone-12-5G-Median-Speeds_Madrid_0221

Barcelona showed similar speeds by operator to those in Madrid. We could not yet determine whether Vodafone or Orange’s 5G networks were fastest for iPhone 12, but both providers had a solid lead over Movistar in both Madrid and Barcelona.
iPhone-12-5G-Median-Speeds_Barcelona_0221

United Arab Emirates was the fastest country for mobile according to the January 2021 Speedtest Global Index. As the capital and the second most populous city in the country, Abu Dhabi contributed to this average with median 5G download speeds of 396.06 Mbps on the iPhone 12 for Etisalat and 211.83 Mbps for du.
iPhone-12-5G-Median-Speeds_Abu-Dhabi_0221

In Bangkok, AIS showed the highest median 5G download speed over the iPhone 12 at 362.68 Mbps. TrueMove H followed at 242.22 Mbps. These two operators also had the highest number of Speedtest results over iPhone 12 among all operators analyzed for this article. Another popular operator in the region, DTAC, is not included in the chart due to limited iPhone 12 5G samples.
iPhone-12-5G-Median-Speeds_Bangkok_0221

Data from Speedtest Intelligence reveals that Sunrise had the fastest median 5G download speed over iPhone 12 by a considerable margin at 328.32 Mbps.
iPhone-12-5G-Median-Speeds_Zurich_0221

Telekom in Berlin comfortably had the fastest median 5G download speed over iPhone 12 at 249.16 Mbps.
iPhone-12-5G-Median-Speeds_Berlin_0221

As mentioned above, median 5G speeds over iPhone 12 lagged in Warsaw when compared with other European cities analyzed. This is likely due to the fact that the auction of 3.4-3.8 GHz bands did not take place as planned in Poland because of the pandemic. As of this analysis, Orange and T-Mobile’s 5G speeds for iPhone 12 devices were faster than Play, which trailed with 42.53 Mbps. We also saw 5G tests from Plus in Speedtest Intelligence, but the operator is not included in the above chart due to lack of iPhone 12 samples compared to other operators.
iPhone-12-5G-Median-Speeds_Warsaw_0221

We will continue to monitor how Apple’s 5G-capable devices impact the global market. Contact us to learn more about how Speedtest Intelligence can help you understand the latest developments in your market.

Ookla retains ownership of this article including all of the intellectual property rights, data, content graphs and analysis. This article may not be quoted, reproduced, distributed or published for any commercial purpose without prior consent. Members of the press and others using the findings in this article for non-commercial purposes are welcome to publicly share and link to report information with attribution to Ookla.

| November 24, 2019

Exploring Fixed Broadband and Mobile Network Performance in Ukraine

Читати звіт українською мовою | Читать отчет на русском

As Ukraine emerged from the recession of 2016, both regulators and service providers committed to bringing high-speed internet services to more of the population and positioning the country as a seat for innovation. With recent LTE deployments from the mobile operators and fixed broadband providers building out fiber offerings, consumers in Ukraine are experiencing unprecedented access to faster internet — and the market is more competitive than ever. The mobile broadband market is currently dominated by three main competitors — Kyivstar, Vodafone Ukraine (owned by MTS) and lifecell (owned by Turkcell) — and the fixed broadband market is highly saturated, with hundreds of ISPs operating at the national, regional and local level. In this report, Ookla checked in to see how fixed broadband speed, mobile speed and 4G Availability have looked over the last two quarters in Ukraine.

Our analysis includes performance data from 1,805,450 consumer-initiated tests taken with Speedtest® and coverage data from over 623 million coverage scans on 372,690 devices during Q2-Q3 2019. The data in this analysis does not represent Crimea.

To see Ukraine’s fastest fixed broadband providers, fastest mobile providers and which providers offer the best speeds and 4G Availability in some of Ukraine’s largest cities, download the full report.

Mobile and fixed broadband speeds are increasing at the country level

Comparing-DL-Speeds-for-Ukraine-Fixed-Mobile

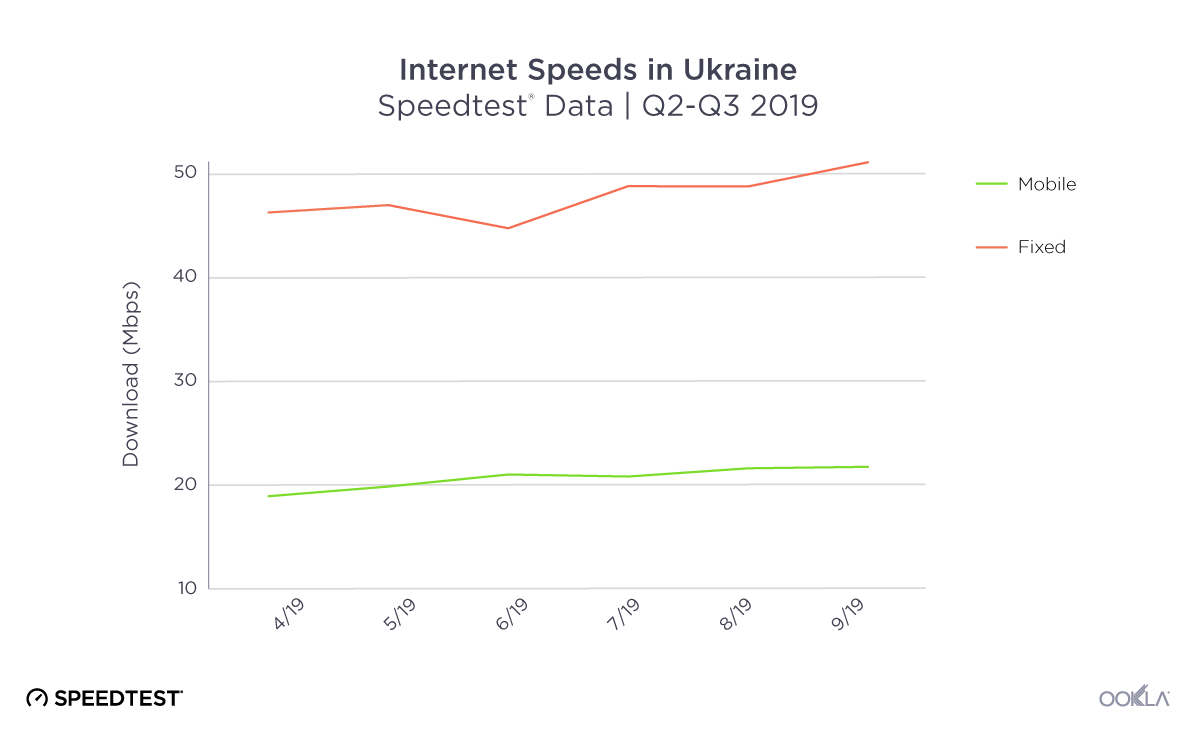
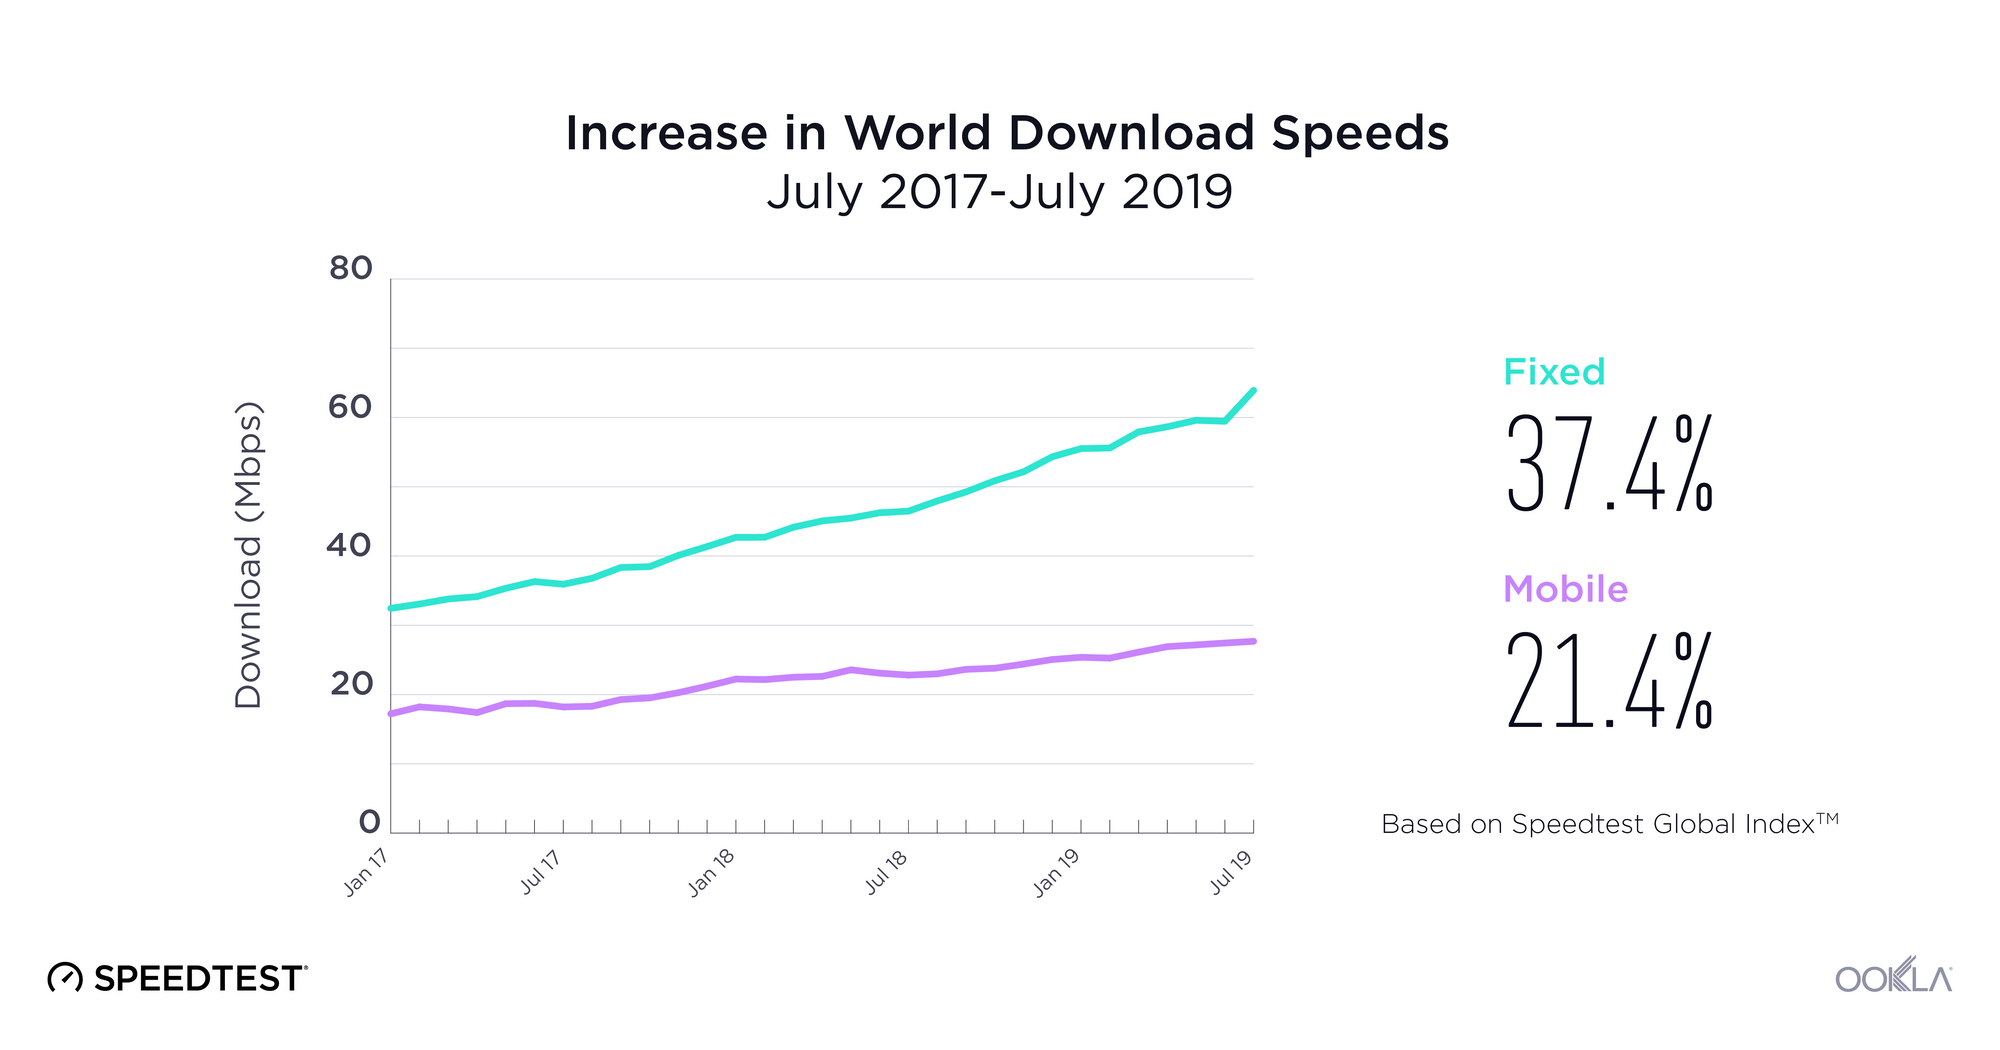
Both mobile and fixed broadband speeds saw incremental improvement at the country level during Q2-Q3 2019 in Ukraine. Average download speeds on fixed broadband increased by 10.4% during that time period to a peak of 49.99 Mbps in September. Mobile speeds were also on the rise, increasing 14.8% to 21.40 Mbps in September. As more of the country gains access to LTE service, we expect to see a continued trend of improvement in average mobile speeds.

New LTE deployments are bringing faster speeds to more of the country

The development of LTE networks has been a key priority for operators in Ukraine over the last year. NCCIR allocated new spectrum and 4G licenses to Kyivstar, lifecell and Vodafone Ukraine at the beginning of 2018 with an agreement that they would provide LTE coverage to at least 90% of the population of each regional center within 12 months, and to 90% of the population of each town with more than 10,000 residents within 42 months.

As a result of new 4G deployments, we’ve seen rapid growth in LTE coverage over the last year in Ukraine and Speedtest data reveals the country’s 4G Availability was 34.8% during Q2-Q3 2019.

Ookla_Ukraine_progression_Map_2018q1-2019q3_en

While less than 1% of the country had access to LTE service at the beginning of 2018, by the end of Q3 2019, the three largest mobile operators reported nearly 36.2% of land area in Ukraine was covered, as illustrated above.

To see Speedtest measurements of 4G Availability and speed by operator, download the full report.

Mobile speeds and 4G Availability are higher in urban areas than the country average, but fixed broadband speeds varied

-EN--4G-Avail-ukraine

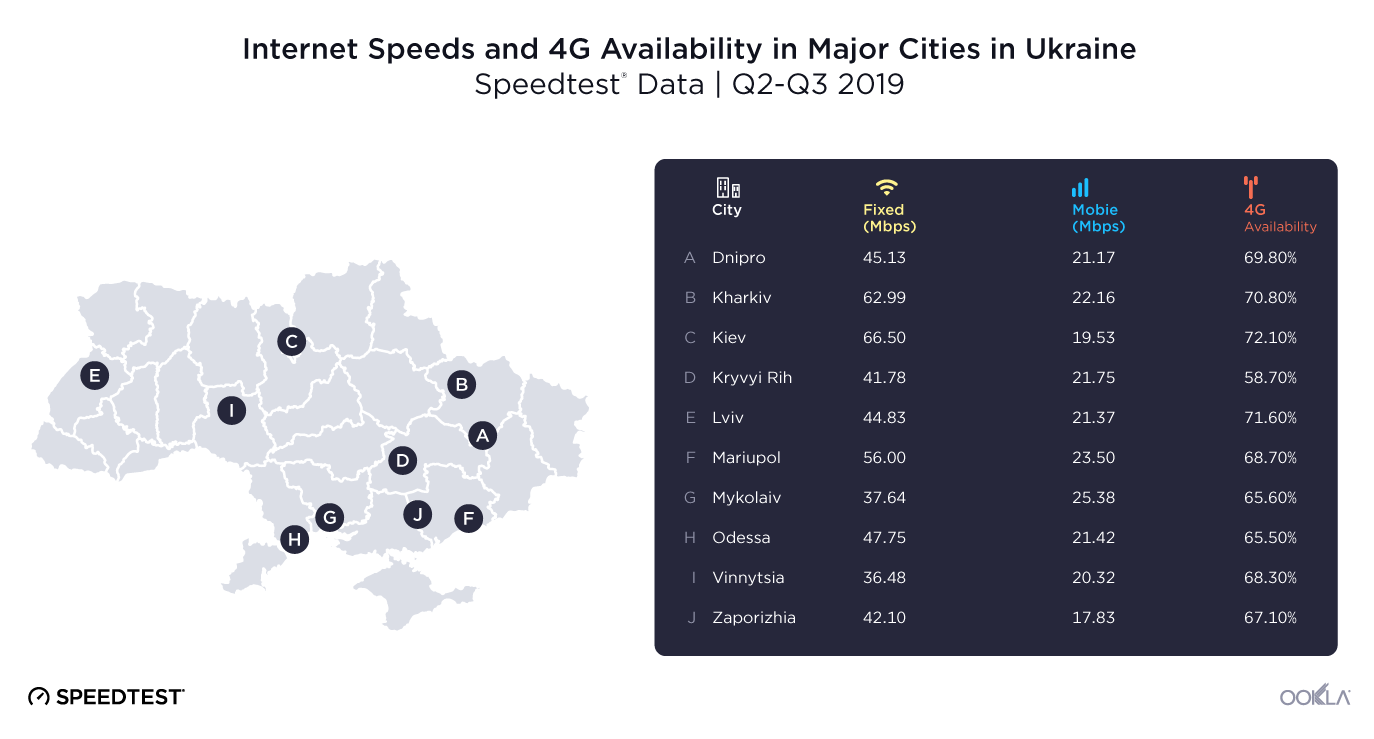
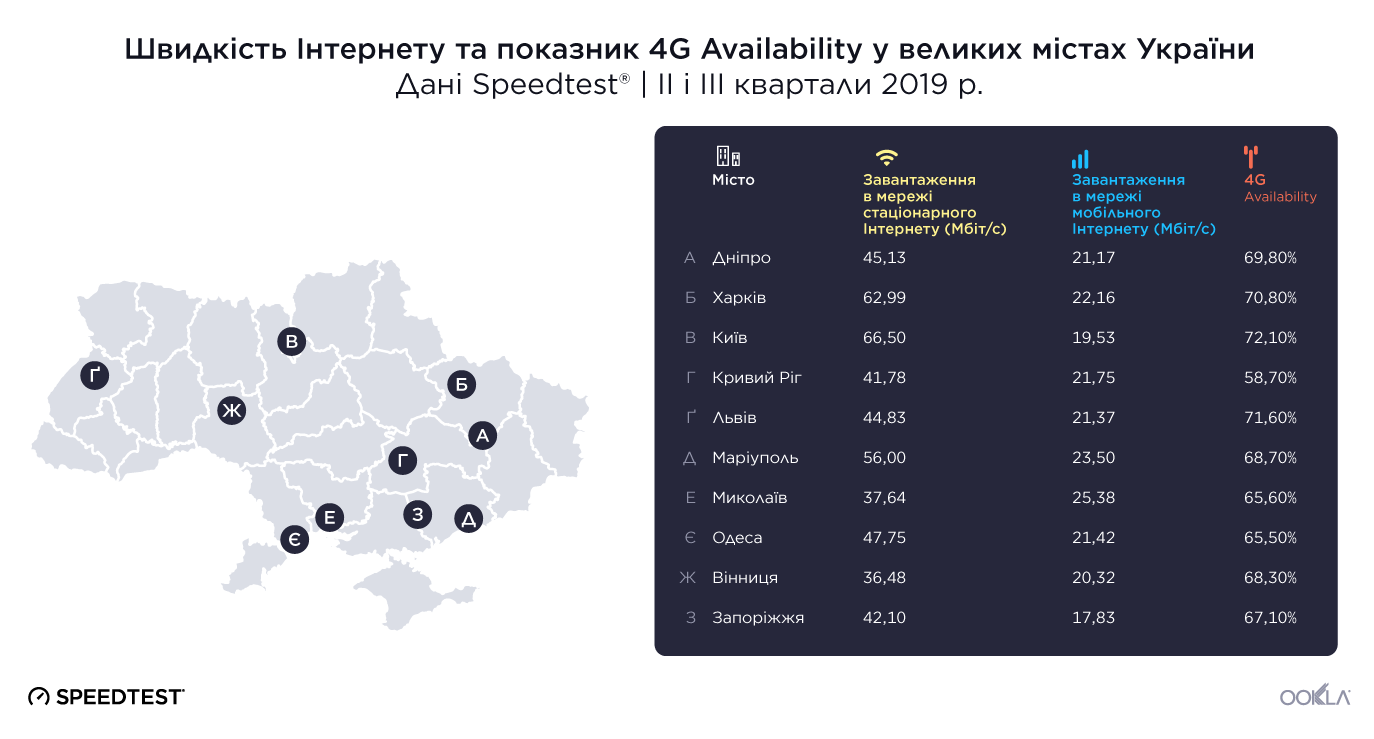
While some cities experienced fixed broadband speeds that were lower than the national average of 49.99 Mbps, Kiev (66.50 Mbps), Kharkiv (62.99 Mbps) and Mariupol (56.00 Mbps) all saw speeds that were significantly higher. The slowest speeds on our list were measured in Kryvyi Rih (41.78 Mbps), Mykolaiv (37.64 Mbps) and Vinnytsia (36.48 Mbps).

Mobile download speeds — which include all cellular technologies, not just 4G — were generally equal to or greater than the national average in the cities we looked at. Mykolaiv saw the fastest mobile download speeds, with an average of 25.38 Mbps, followed by Mariupol (23.50 Mbps) and Kharkiv (22.16 Mbps). The lowest speeds on this list were measured in Kiev (19.53 Mbps) and Zaporizhia (17.83 Mbps).

4G Availability is significantly higher in many of Ukraine’s cities than the overall country average of 34.8%, perhaps because of the operators’ commitment to bring LTE service to major population centers first. The capital, Kiev, had the best 4G Availability (72.1%) during Q2-Q3 2019, followed by Lviv (71.6%) and Kharkiv (70.8%). The other cities we measured showed a range between 65.5% and 69.8%, with the exception of Kryvyi Rih (58.7%), where there was somewhat less 4G Availability.

To see the fastest mobile and fixed broadband providers in each city, download the full report.

Editor’s note: The maps in this article were updated on November 25 to include Crimea.


Дослідження продуктивності мереж стаціонарного широкосмугового та мобільного Інтернету в Україні

Після того як Україна вийшла з економічної кризи 2016 року, регулятивні органи та постачальники послуг поставили собі за мету забезпечити надання послуг швидкісного Інтернету більшій кількості населення та позиціонувати Україну як країну, сприятливу для інновацій. Завдяки нещодавнім розгортанням LTE мобільними операторами та створенню оптоволоконних мереж постачальниками стаціонарного широкосмугового Інтернету споживачі в Україні мають безпрецедентний доступ до швидкого Інтернету, а конкуренція на ринку стала як ніколи високою. Зараз на ринку домінують три основні конкуренти: Київстар, Vodafone Україна (власником є компанія МТС) і lifecell (власником є компанія Turkcell). Ринок стаціонарного широкосмугового Інтернету дуже насичений: тут є сотні постачальників інтернет-послуг, які працюють на національному, регіональному та місцевому рівнях. У цьому звіті Ookla наведено результати перевірки швидкості стаціонарного широкосмугового та мобільного Інтернету, а також показника 4G Availability (доступність 4G) протягом останніх двох кварталів в Україні.

Ми проаналізували дані щодо продуктивності, отримані за результатами 1 805 450 тестів, проведених споживачами з використанням технологій Speedtest®, а також дані про покриття за результатами 623 мільйонів відповідних перевірок на 372 690 пристроях протягом II та III кварталів 2019 р. Дані в цьому аналізі не представляють Крим.

Щоб дізнатися, які постачальники послуг стаціонарного широкосмугового та мобільного Інтернету в Україні пропонують найшвидший доступ до Інтернету, а також про постачальників, які пропонують найшвидший доступ до мережі Інтернет і мають найкращий показник 4G Availability у великих містах України, завантажте повну версію звіту.

Швидкість мобільного та стаціонарного широкосмугового Інтернету збільшується по всій країні

-UA--Comparing-DL-Speeds-for-Ukraine-Fixed-Mobile

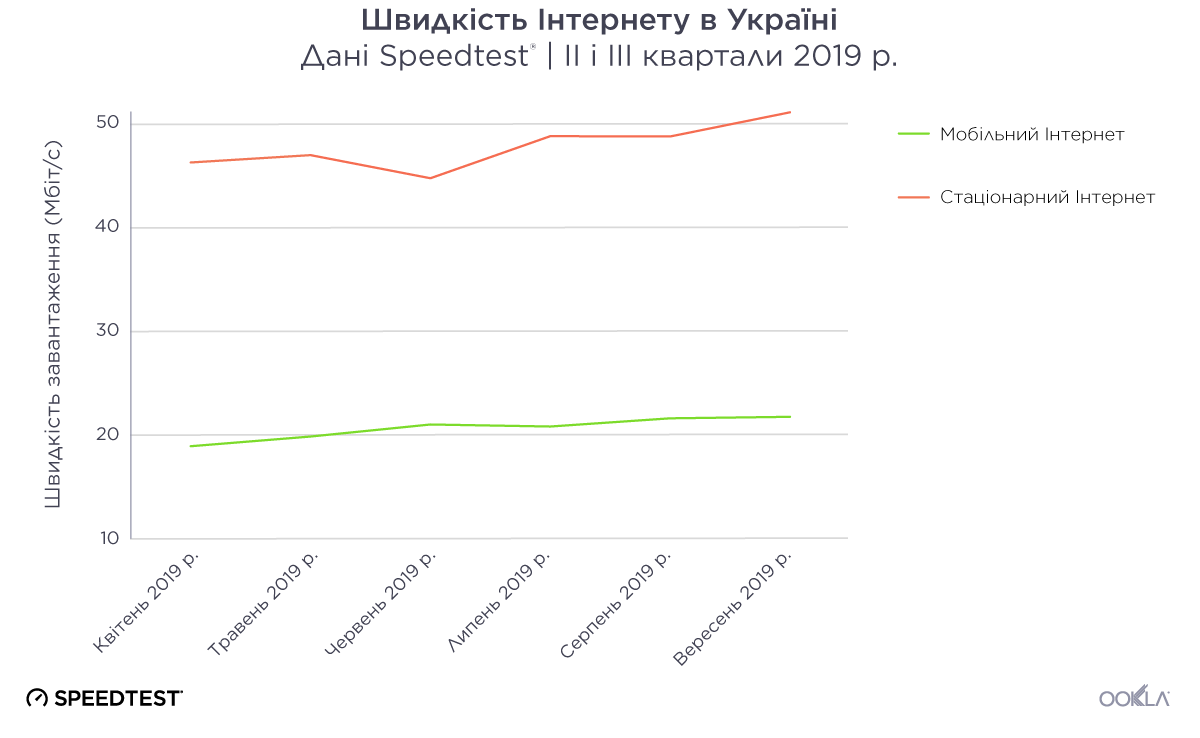
Швидкість мобільного та стаціонарного Інтернету в Україні поступово зростала протягом II і III кварталів 2019 р. Упродовж цього періоду середня швидкість завантаження стаціонарного широкосмугового Інтернету збільшилася на 10,4% до максимального значення 49,99 Мбіт/с у вересні. Швидкість мобільного Інтернету також збільшувалася: вона зросла на 14,8% й у вересні склала 21,4 Мбіт/с. Оскільки в Україні розповсюджується послуга LTE, ми очікуємо, що середня швидкість мобільного Інтернету буде безперервно зростати.

Нові розгортання LTE роблять швидший Інтернет доступнішим для більшої кількості людей

За останній рік розгортання мереж LTE було ключовим пріоритетом для операторів України. Національна комісія, що здійснює державне регулювання у сфері зв’язку та інформатизації, надала новий діапазон і ліцензії на 4G компаніям Київстар, lifecell і Vodafone Україна на початку 2018 року з домовленістю, що вони забезпечать покриття LTE принаймні для 90% населення кожного регіонального центру протягом 12 місяців і для 90% населення кожного міста, кількість жителів якого перевищує 10 000, протягом 42 місяців.

У результаті нових розгортань 4G за останній рік покриття LTE в Україні швидко зростало, а дані Speedtest свідчать про те, що показник 4G Availability протягом II та III кварталів 2019 року складав 34,8%.

Ookla_Ukraine_progression_Map_2018q1-2019q3_ua

На початку 2018 року територія, на якій були доступні послуги LTE, не перевищувала 1% площі країни. Однак наприкінці III кварталу 2019 року три найбільших оператори мобільного зв’язку повідомили, що покриття вже охопило майже 36,2% материкової території України, як показано вище.

Щоб дізнатися про виконані за допомогою Speedtest вимірювання показника 4G Availability та швидкості Інтернету, який надають оператори, завантажте повну версію звіту.

У середньому швидкість мобільного Інтернету та показник 4G Availability в міських регіонах вище, ніж у середньому по країні, однак показники швидкості стаціонарного Інтернету різняться

-UA--4G-Avail-Ukraine

Хоча в деяких містах швидкість стаціонарного Інтернету нижче середнього показника по країні, який дорівнює 49,99 Мбіт/с, у Києві (66,50 Мбіт/с), Харкові (62,99 Мбіт/с) і Маріуполі (56,00 Мбіт/с) швидкість Інтернету була набагато вищою. Найнижчі швидкості в містах із нашого списку були зафіксовані в Кривому Розі (41,78 Мбіт/с), Миколаєві (37,64 Мбіт/с) і Вінниці (36,48 Мбіт/с).

Швидкість завантаження в мобільних мережах (включно з усіма стільниковими мережами, а не лише 4G) зазвичай дорівнювала середньому національному показнику або перевищувала його в містах, у яких виконувалося вимірювання. У Миколаєві було зафіксовано найвищу швидкість завантаження: середній показник склав 25,38 Мбіт/с. На другому місці був Маріуполь із показником 23,50 Мбіт/с, а на третьому — Харків (22,16 Мбіт/с). Найнижчі швидкості серед міст із цього списку було зафіксовано в Києві (19,53 Мбіт/с) і Запоріжжі (17,83 Мбіт/с).

У багатьох містах України показник 4G Availability значно вищий, ніж середній показник по країні (34,8%). Імовірно, причина полягає в тому, що оператори намагаються вводити послугу LTE спочатку у великих містах. У столиці України, Києві, зафіксовано найвищий показник 4G Availability (72,1%) протягом II та III кварталів 2019 року. Друге місце за цим показником посідає Львів (71,6%), а третє — Харків (70,8%). В інших містах, у яких виконувалися вимірювання, діапазон показників склав від 65,5% до 69,8%, за винятком Кривого Рогу (58,7%), де показник 4G Availability був трохи нижчим.

Щоб дізнатися про постачальників найшвидшого мобільного та стаціонарного Інтернету в кожному місті, завантажте повну версію звіту.

Примітка редактора: Карти в цій статті були оновлені 25 листопада, щоб включити Крим.


Анализ скорости сетей мобильного и фиксированного широкополосного доступа в Интернет в Украине

После экономического спада 2016 года регулирующие органы и поставщики услуг в Украине поставили перед собой цель сделать высокоскоростной Интернет более доступным для населения и улучшить условия для внедрения инноваций в стране. Благодаря развертыванию сетей LTE операторами мобильной связи и созданию оптоволоконных сетей поставщиками фиксированного широкополосного доступа (ШПД) быстрый Интернет стал доступен для беспрецедентного количества украинских потребителей. При этом конкуренция на рынке интернет-услуг стала как никогда высокой. Ведущее положение на рынке мобильного широкополосного Интернета в настоящее время занимают три оператора: Киевстар, Vodafone Украина (принадлежит МТС) и lifecell (принадлежит Turkcell). А на рынке услуг фиксированного ШПД действуют сотни национальных, региональных и местных поставщиков. В рамках данного отчета компания Ookla рассматривает показатели скорости фиксированного ШПД и мобильного Интернета, а также 4G Availability (доступность 4G) в Украине за последние два квартала.

Наш анализ включает в себя данные о скорости за второй и третий кварталы 2019 г., полученные в результате проведения 1 805 450 потребительских тестов (с помощью Speedtest®), и данные охвата, полученные в ходе выполнения 623 млн проверок на 372 690 устройствах. Данные в этом анализе не представляют Крым.

Чтобы узнать больше о работающих в Украине поставщиках с самой высокой скоростью фиксированного ШПД и мобильного Интернета, а также ознакомиться с данными о скорости и показателями 4G Availability в некоторых из крупнейших городов Украины, скачайте полный отчет.

Скорость фиксированного ШПД и мобильного Интернета увеличивается по всей стране

-RU--Comparing-DL-Speeds-for-Ukraine-Fixed-Mobile

В течение второго и третьего кварталов 2019 г. скорость мобильного Интернета и фиксированного ШПД немного увеличилась по всей Украине. За этот период средняя скорость скачивания с фиксированным ШПД увеличилась на 10,4% и в сентябре достигла самого высокого значения — 49,99 Мбит/с. Скорость мобильного Интернета также возросла на 14,8% — до 21,40 Мбит/с в сентябре. Так как доступ к услугам LTE получает все больше украинцев, мы ожидаем, что средняя скорость мобильного Интернета продолжит увеличиваться.

Развертывание новых сетей LTE помогает увеличить скорость Интернета по стране

За последний год развертывание сетей LTE стало одним из главных приоритетов для операторов в Украине. В начале 2018 г. НКРСИ предоставила лицензии на новые частоты и 4G операторам Киевстар, lifecell и Vodafone Украина с обязательством, что они обеспечат охват сетями LTE по меньшей мере 90% населения в каждом региональном центре в течение 12 месяцев и до 90% населения в каждом городе с населением более 10 000 жителей в течение 42 месяцев.

Новые развертывания 4G значительно расширили охват LTE в Украине за последний год, и данные Speedtest показывают, что показатель 4G Availability в стране в течение второго и третьего кварталов 2019 г. составил 34,8%.

Ookla_Ukraine_progression_Map_2018q1-2019q3_ru

Хотя в начале 2018 года территория, на которой были доступны услуги LTE, составляла менее 1% площади страны, к концу третьего квартала 2019 г. три крупнейших мобильных оператора сообщили, что наземное покрытие обеспечено для 36,2% территории Украины, как показано выше.

Чтобы ознакомиться с данными Speedtest о показателе 4G Availability и скоростях по каждому оператору, скачайте полный отчет.

Скорость мобильного Интернета и показатель 4G Availability в городских районах выше, чем в среднем по стране, но скорость фиксированного ШПД варьировалась.

-RU--4G-Avail-ukraine

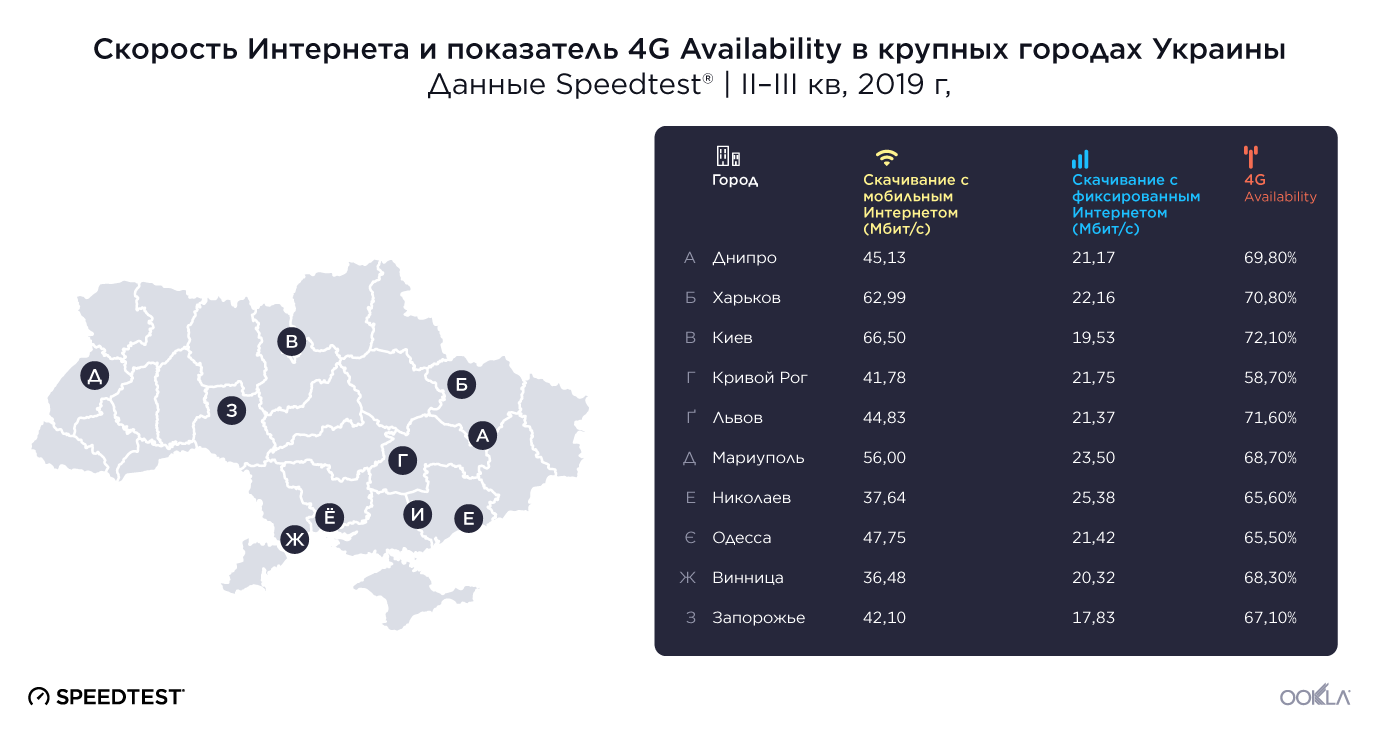
Хотя в некоторых городах скорость фиксированного ШПД была ниже, чем в среднем по стране (49,99 Мбит/с), она была значительно выше в Киеве (66,50 Мбит/с), Харькове (62,99 Мбит/с) и Мариуполе (56,00 Мбит/с). Самая низкая скорость была зарегистрирована нами в Кривом Роге (41,78 Мбит/с), Николаеве (37,64 Мбит/с) и Виннице (36,48 Мбит/с).

Скорость скачивания с мобильным Интернетом (учитывались все сотовые технологии, а не только 4G) в оцененных нами городах в целом находилась на уровне среднего значения по стране или превышала его. В Николаеве скорость скачивания с мобильным Интернетом была самой высокой — в среднем 25,38 Мбит/с. Второе место по этому показателю занял Мариуполь (23,50 Мбит/с), а третье — Харьков (22,16 Мбит/с). Самая низкая скорость зарегистрирована в Киеве (19,53 Мбит/с) и Запорожье (17,83 Мбит/с).

Показатель 4G Availability во многих городах Украины значительно выше, чем в среднем по стране (34,8%). Возможно, это связано с тем, что операторы стремятся обеспечить доступность услуг LTE в первую очередь в крупных населенных пунктах. Во втором и третьем кварталах 2019 г. столица Украины, город Киев, имела высокий показатель 4G Availability (72,1%). Второе место по этому показателю занял Львов (71,6%), а третье — Харьков (70,8%). В других городах, по которым были получены данные, этот показатель составил от 65,5% до 69,8%, за исключением Кривого Рога (58,7%), в котором показатель 4G Availability был ниже.

Чтобы ознакомиться с данными о поставщиках самого быстрого мобильного Интернета и фиксированного ШПД в каждом городе, скачайте полный отчет.

Примечание редактора: карты в этой статье были обновлены 25 ноября и теперь включают Крым.
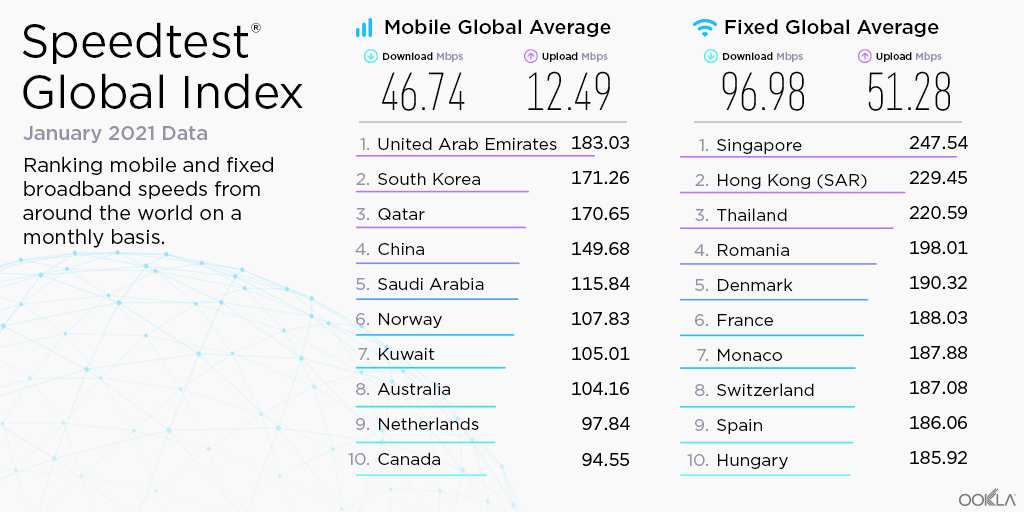
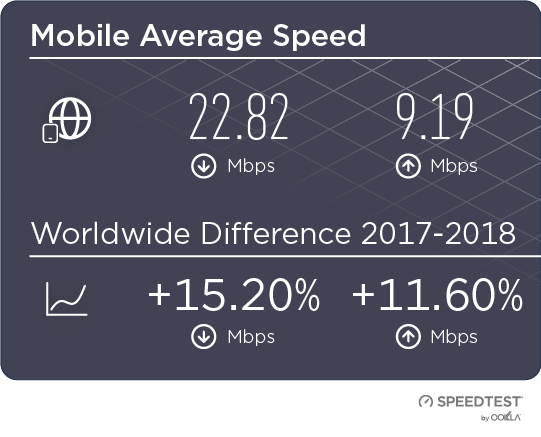
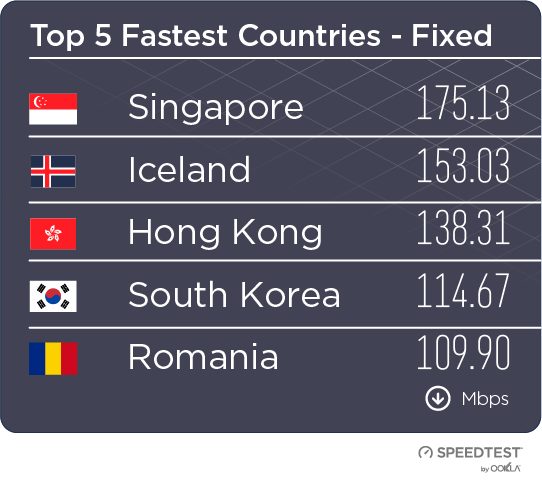
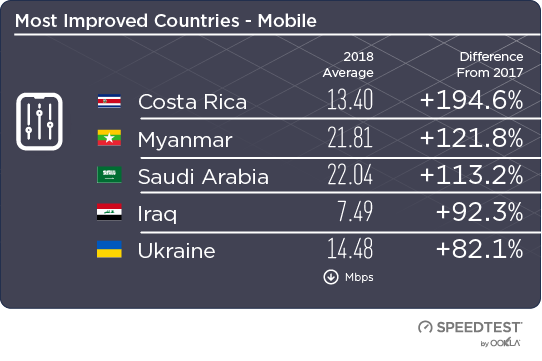
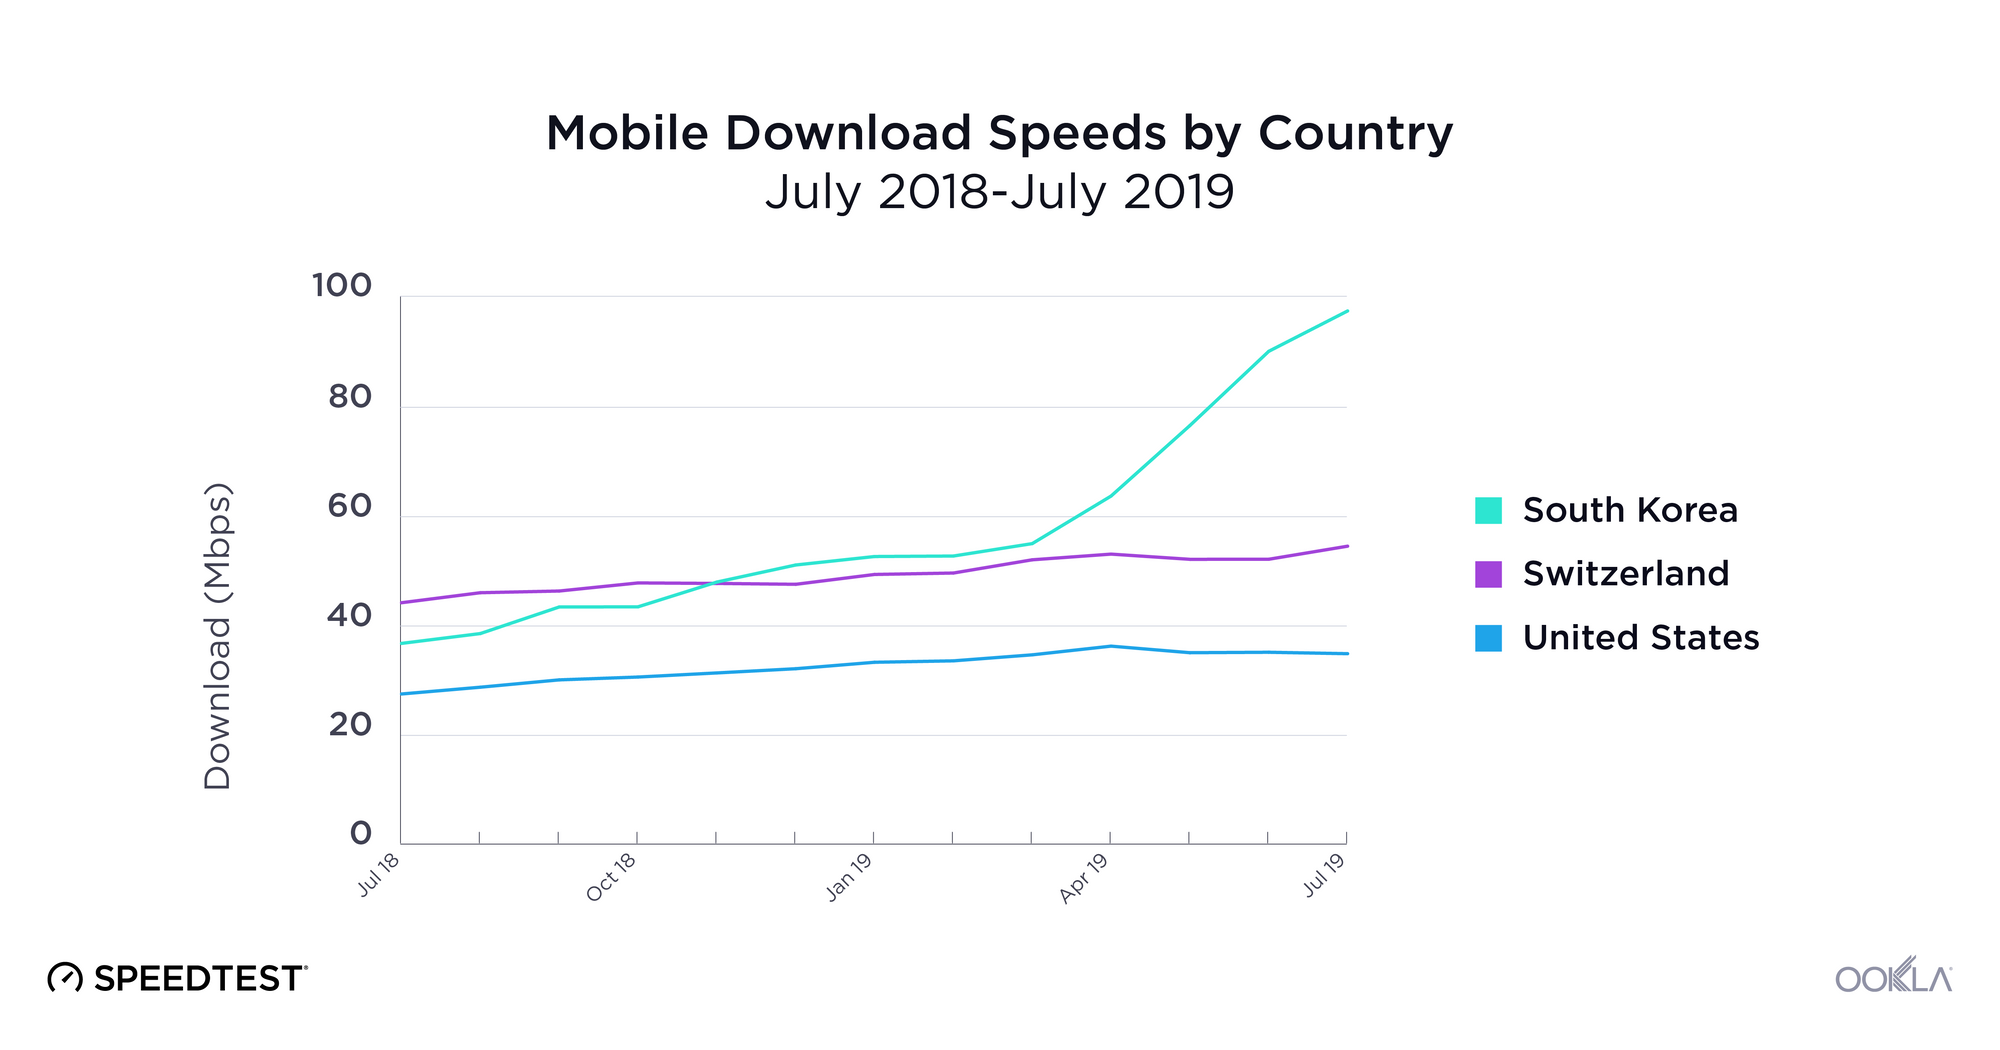
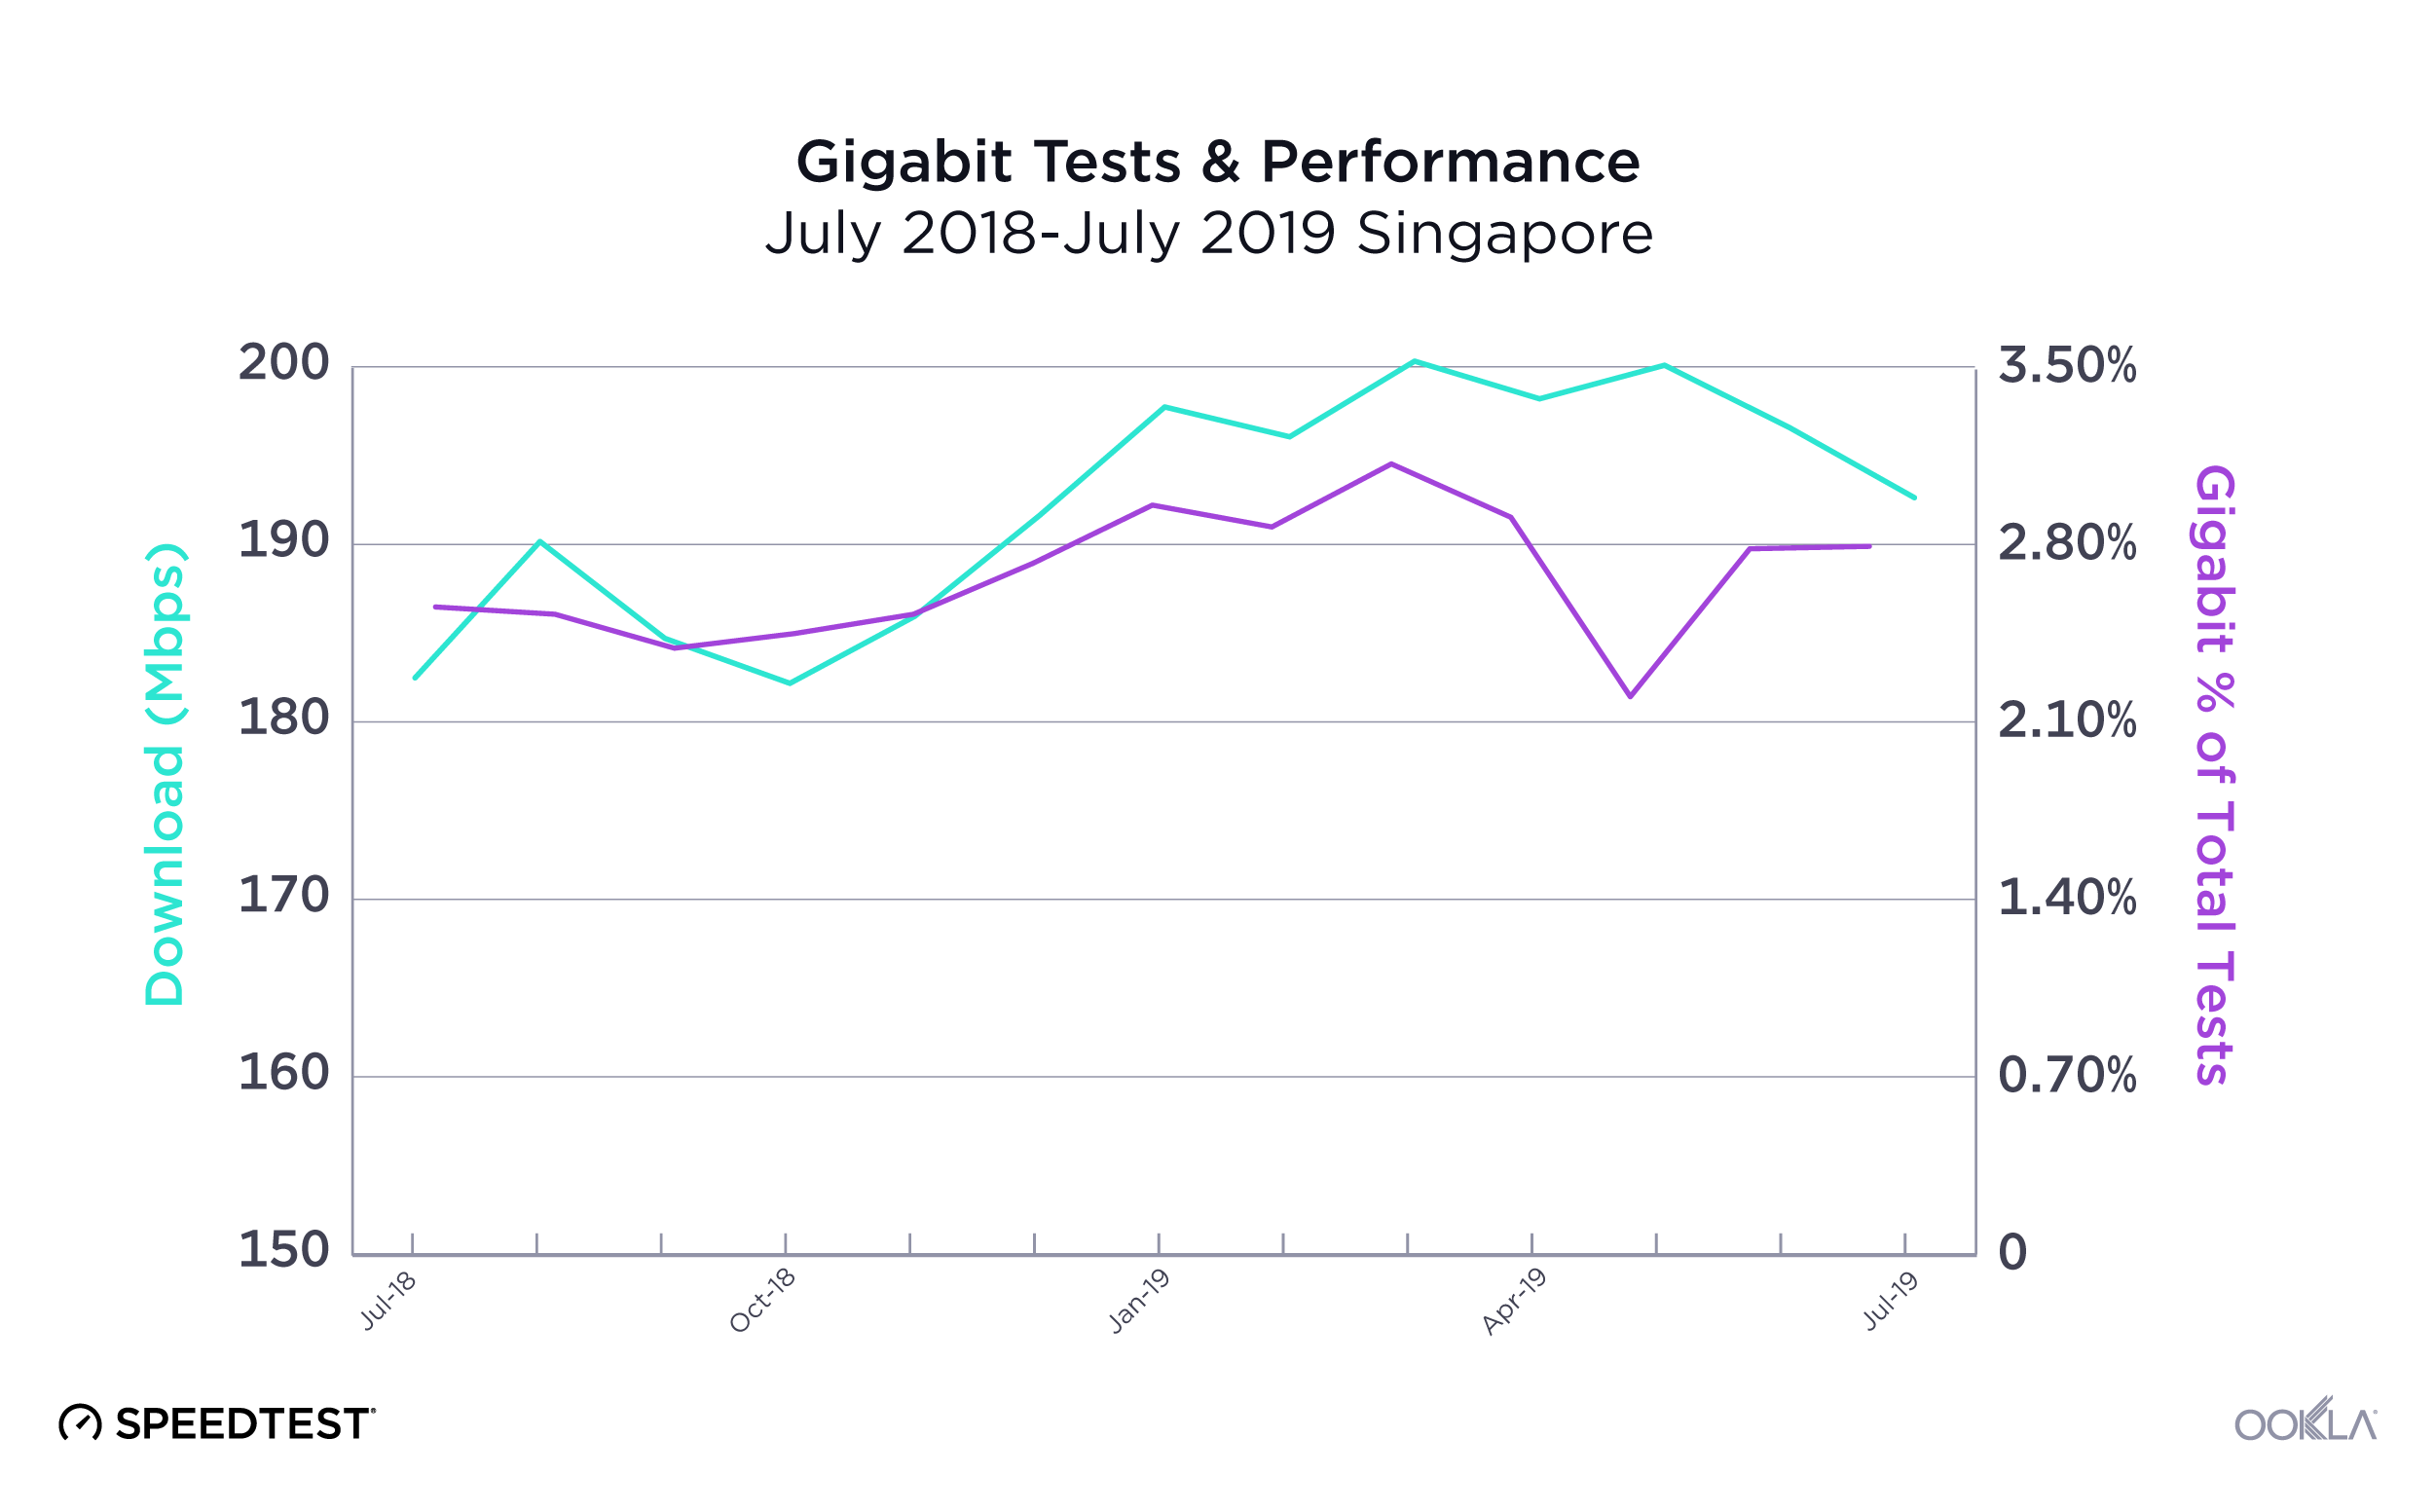
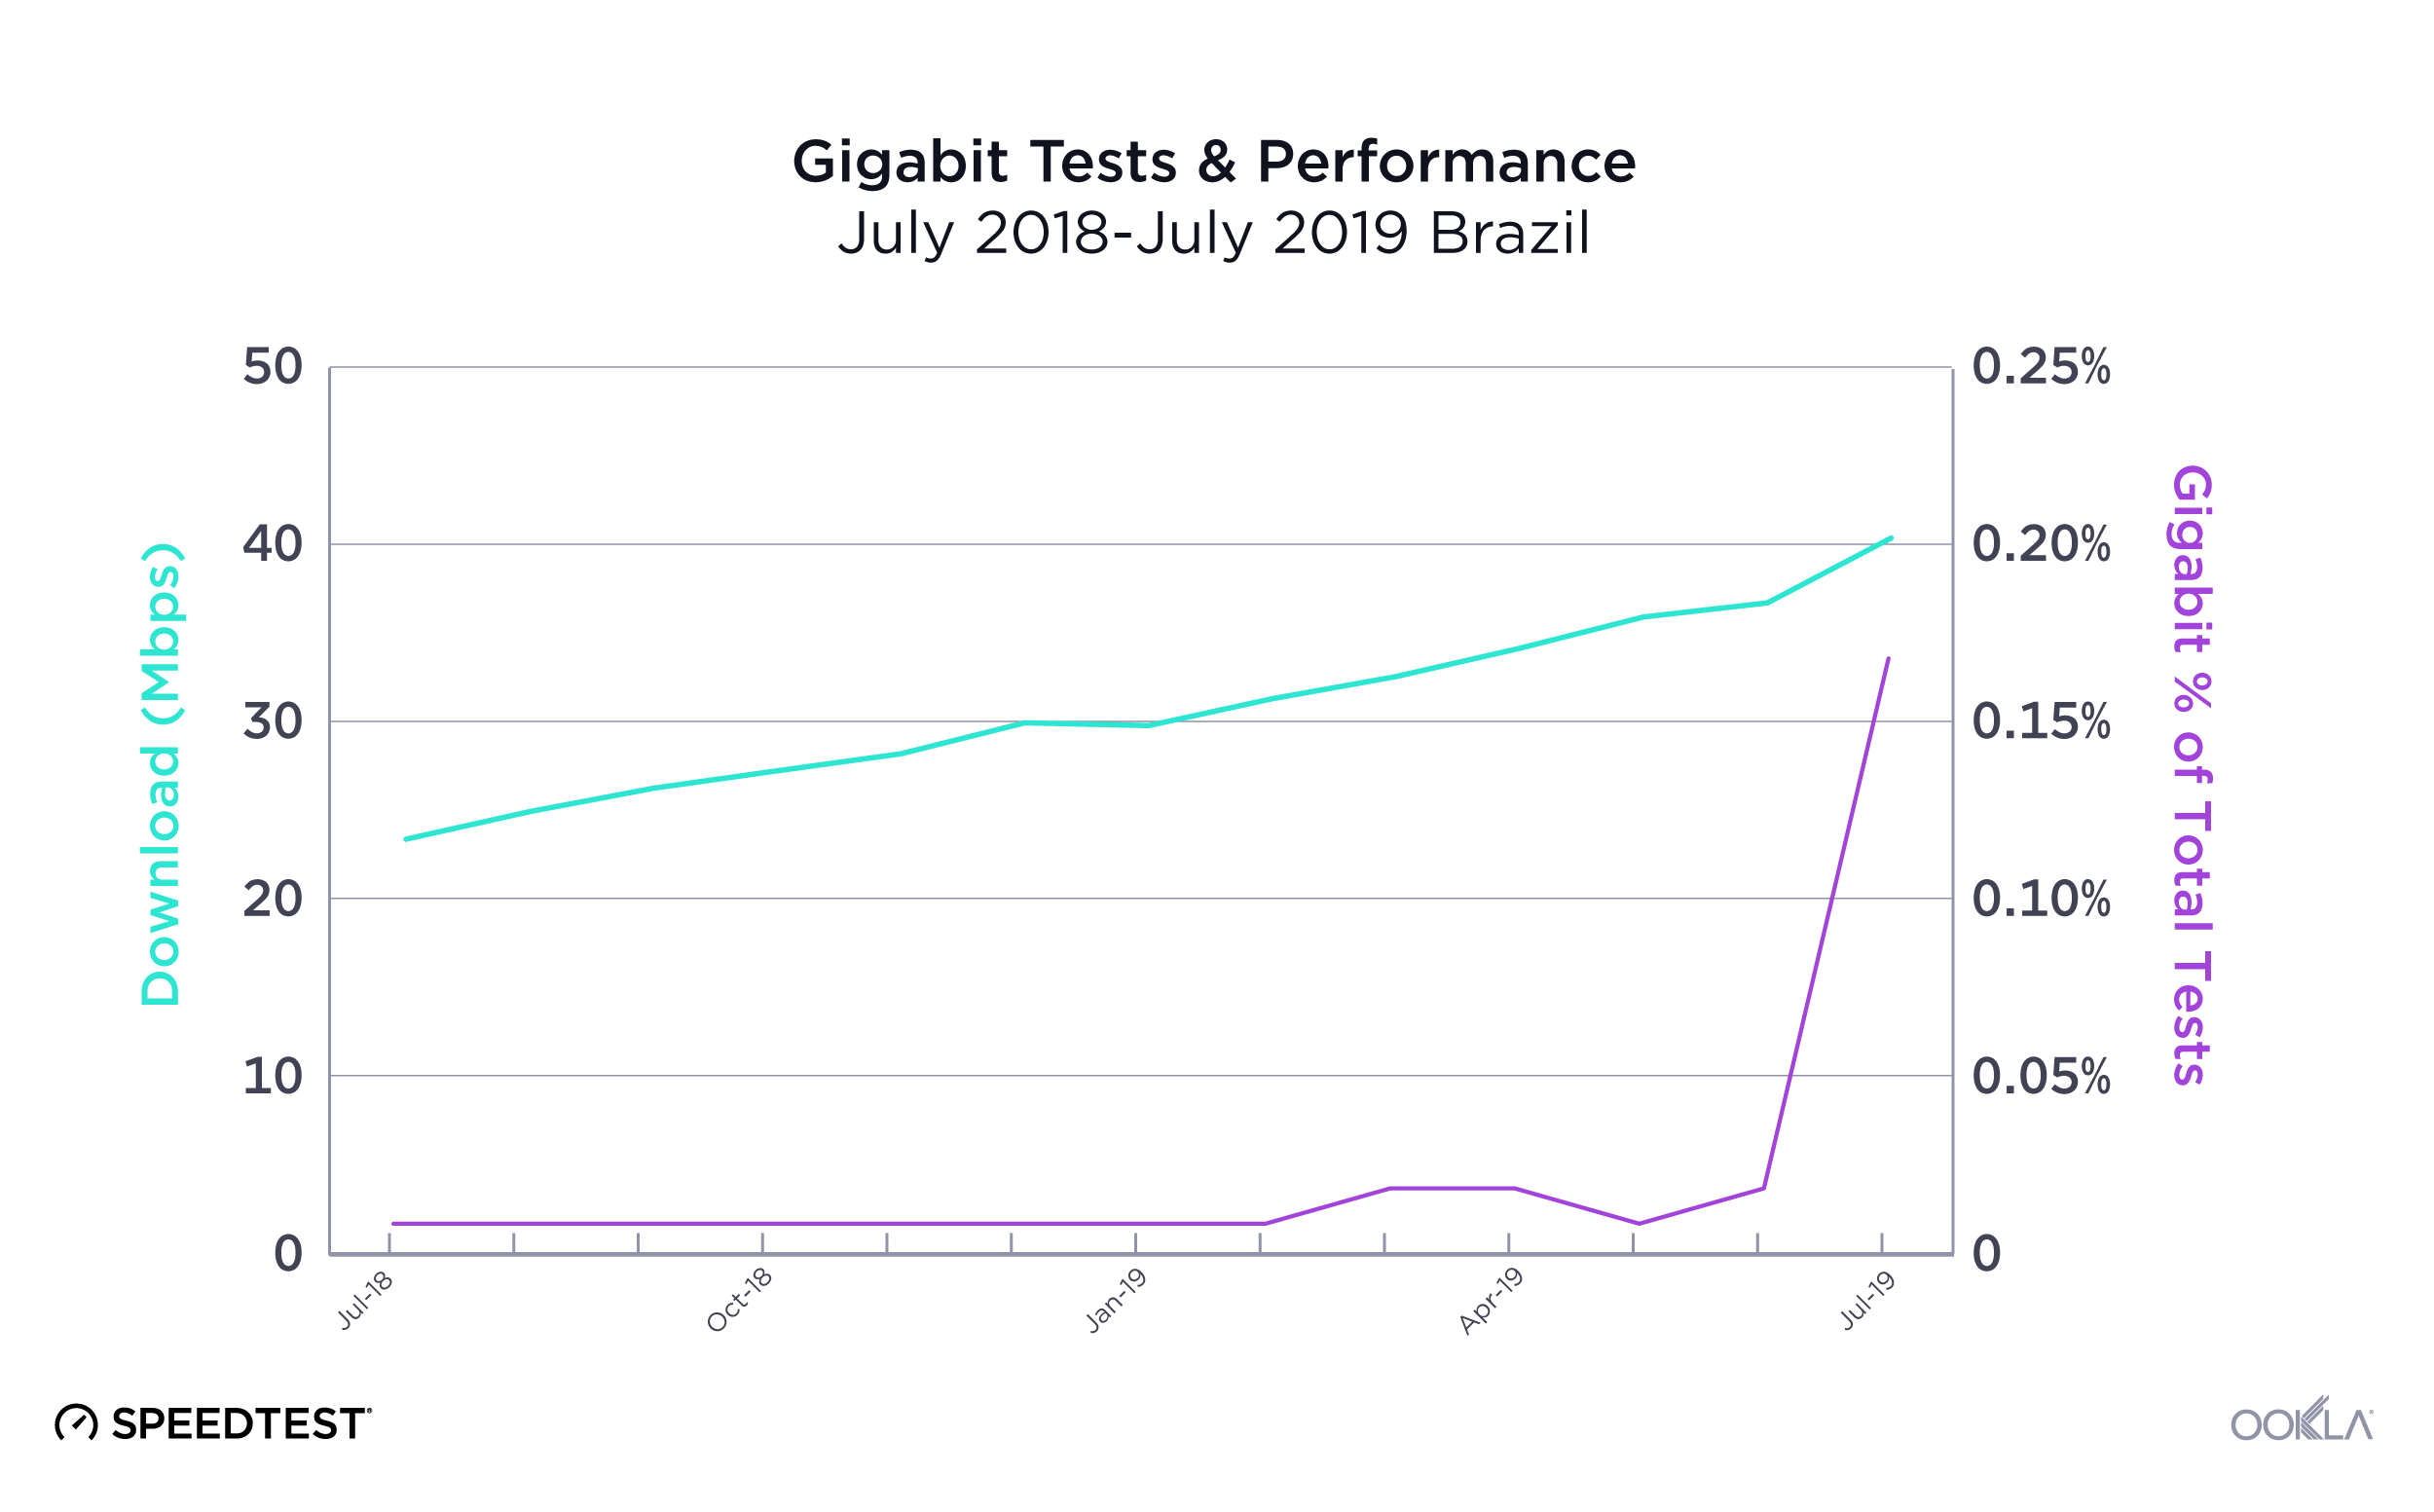
Ookla retains ownership of this article including all of the intellectual property rights, data, content graphs and analysis. This article may not be quoted, reproduced, distributed or published for any commercial purpose without prior consent. Members of the press and others using the findings in this article for non-commercial purposes are welcome to publicly share and link to report information with attribution to Ookla.

| February 20, 2019

An Expansive Analysis of European Mobile Roaming Speeds and Behaviors

Last year we took a look at how free roaming was working out for EU citizens in terms of speeds and latency. This year we’ve expanded our analysis to all European countries and included data on Wi-Fi roaming behavior. We’ve also added a little insight into how roaming might affect download speeds for visitors to Mobile World Congress (MWC) in Barcelona from February 25- 28, 2019.

Except where noted, this analysis is based on Speedtest data from Android devices on 4G LTE cellular connections during Q3-Q4 2018. We included data on any country with greater than 30 samples in all categories.

Most Europeans experience slower downloads while roaming

Roaming traffic is subject to deals struck between individual mobile operators on how that traffic will be prioritized, so roaming speeds can depend not only on the country of origin but also the country of destination and the plan a subscriber has selected.

Consider the following table where an Albanian experiences a mean download speed of 54.56 Mbps at home and then 38.47 Mbps while roaming elsewhere in Europe. This is expected as a roamer does not usually have a direct relationship with the mobile operator handling their data and calls abroad.

Mean Mobile Download Speeds in Europe
Speedtest Data | Q3-Q4 2018
Country Local Speed (Mbps) Roaming Speed (Mbps) % Difference
Austria 38.23 35.78 -6.4%
Belarus 16.15 19.49 20.7%
Belgium 52.58 35.42 -32.6%
Bulgaria 47.28 32.35 -31.6%
Croatia 43.83 43.60 -0.5%
Cyprus 37.13 20.58 -44.6%
Czech Republic 44.91 13.43 -70.1%
Denmark 48.83 34.89 -28.6%
Estonia 36.43 38.98 7.0%
Finland 39.33 38.20 -2.9%
France 39.94 34.97 -12.5%
Germany 33.77 28.57 -15.4%
Greece 41.35 38.08 -7.9%
Hungary 49.57 28.19 -43.1%
Iceland 69.27 35.58 -48.6%
Ireland 28.23 31.49 11.6%
Italy 32.18 43.12 34.0%
Kazakhstan 22.93 13.80 -39.8%
Latvia 30.88 33.79 9.4%
Liechtenstein 56.48 36.66 -35.1%
Lithuania 41.49 33.43 -19.4%
Luxembourg 50.91 25.08 -50.7%
Malta 56.34 34.27 -39.2%
Montenegro 45.45 49.97 10.0%
Netherlands 56.06 33.86 -39.6%
Norway 68.49 38.69 -43.5%
Poland 28.74 29.71 3.4%
Portugal 32.06 36.95 15.3%
Romania 36.64 30.74 -16.1%
Russia 20.91 20.47 -2.1%
Serbia 43.41 21.64 -50.1%
Slovakia 33.47 31.80 -5.0%
Slovenia 35.51 36.41 2.5%
Spain 36.07 22.37 -38.0%
Sweden 44.87 34.59 -22.9%
Switzerland 47.59 30.36 -36.2%
Turkey 38.19 28.77 -24.7%
Ukraine 26.07 25.48 -2.3%
United Kingdom 30.84 38.76 25.7%

Residents of the Czech Republic will face massive speed disappointment when roaming through the rest of Europe. Other countries with much better speeds at home than abroad include Luxembourg, Serbia, Iceland and Cyprus.

In ten European countries, citizens experience faster mobile downloads while roaming than they do at home. These include: Italy, the United Kingdom, Belarus, Portugal, Ireland, Montenegro, Latvia, Estonia, Poland and Slovenia. Most of these are among the slowest countries on this list, so it would make sense that their citizens would experience better speeds elsewhere in Europe than they do at home.

Europeans are connected to Wi-Fi most of the time

Customers sometimes try to get better speeds and avoid roaming fees (for those outside the E.U.) and data overages by connecting to Wi-Fi. The following table compares the percentage of time spent on Wi-Fi by a resident of a country with that of a visitor to the country.

Percentage of Time Spent on Wi-Fi in Europe
Speedtest Data | Q3-Q4 2018
Country Local Customers Visitors % Difference
Albania 61.9% 59.8% -3.4%
Andorra 73.6% 69.0% -6.2%
Armenia 61.5% 68.1% 10.7%
Austria 65.6% 36.7% -44.1%
Azerbaijan 67.0% 70.7% 5.5%
Belarus 63.9% 58.3% -8.9%
Belgium 71.1% 32.9% -53.7%
Bosnia and Herzegovina 71.9% 66.0% -8.2%
Bulgaria 65.2% 46.8% -28.2%
Croatia 66.1% 41.0% -38.0%
Cyprus 70.9% 58.4% -17.7%
Czech Republic 75.1% 38.9% -48.1%
Denmark 70.4% 52.9% -24.9%
Estonia 61.2% 45.6% -25.4%
Finland 56.6% 47.1% -16.7%
France 60.2% 43.1% -28.5%
Georgia 61.4% 62.2% 1.3%
Germany 72.2% 42.4% -41.3%
Greece 73.5% 52.2% -28.9%
Hungary 71.9% 35.0% -51.3%
Iceland 65.7% 58.2% -11.4%
Ireland 67.2% 52.4% -22.0%
Italy 64.1% 48.9% -23.7%
Kazakhstan 57.7% 64.7% 12.3%
Latvia 60.9% 43.8% -28.1%
Liechtenstein 71.7% 58.2% -18.9%
Lithuania 66.8% 43.3% -35.1%
Luxembourg 63.6% 26.0% -59.1%
Macedonia 65.3% 52.9% -18.9%
Malta 74.3% 58.0% -22.0%
Moldova 67.2% 67.3% 0.2%
Montenegro 63.6% 65.2% 2.5%
Netherlands 73.0% 42.5% -41.7%
Norway 74.7% 59.7% -20.1%
Poland 62.5% 48.1% -23.1%
Portugal 69.1% 54.7% -20.9%
Romania 62.4% 48.7% -21.9%
Russia 58.8% 65.9% 12.2%
San Marino 66.8% 39.7% -40.6%
Serbia 68.6% 61.2% -10.7%
Slovakia 69.6% 35.1% -49.6%
Slovenia 63.3% 26.4% -58.3%
Spain 70.8% 53.0% -25.2%
Sweden 71.8% 44.9% -37.4%
Switzerland 62.4% 47.2% -24.4%
Turkey 61.7% 73.0% 18.4%
Ukraine 61.5% 62.4% 1.5%
United Kingdom 71.3% 54.0% -24.3%

Finland showed the lowest time spent on Wi-Fi by residents at 56.6%. Kazakhstan was second at 57.7% followed by Russia (58.8%), France (60.2%) and Latvia (60.9%). The Czech Republic showed the highest time spent on Wi-Fi by residents at 75.1%. Norway was second at 74.7% followed by Malta (74.3%), Andorra (73.6%) and Greece (73.5%).

When it comes to time spent on Wi-Fi by visitors, Luxembourg had the lowest percentage at 26.0%. Slovenia was second at 26.4% followed by Belgium (32.9%), Hungary (35.0%) and Slovakia (35.1%). Turkey showed the highest time spent on Wi-Fi by visitors at 73.0%. Azerbaijan was second at 70.7% followed by Andorra (69.0%), Armenia (68.1%) and Moldova (67.3%).

Luxembourg saw the largest difference in time spent on Wi-Fi between residents and visitors with visitors using Wi-Fi 59.1% less than residents. Slovenia was close behind at 58.3%, followed by Belgium (53.7%) and Hungary (51.3%). On the other end of the spectrum, visitors to Turkey were on Wi-Fi 18.4% longer than residents followed by Kazakhstan (12.3%) and Russia (12.2%).

Roaming dramatically increases latency in Europe

Because roaming signals are routed through a user’s home network, latency is always an issue in roaming. Speedtest data shows that latency while roaming is a much larger issue for residents of some countries than it is for others.

Comparing European Latency In-Country and Abroad
Speedtest Data | Q3-Q4 2018
Country Local Latency (ms) Roaming Latency (ms) % Difference
Austria 24 83 245.8%
Belarus 32 75 134.4%
Belgium 24 81 237.5%
Bulgaria 24 126 425.0%
Croatia 32 86 168.8%
Cyprus 20 194 870.0%
Czech Republic 24 86 258.3%
Denmark 24 98 308.3%
Estonia 23 78 239.1%
Finland 26 104 300.0%
France 42 87 107.1%
Germany 33 87 163.6%
Greece 27 137 407.4%
Hungary 22 94 327.3%
Iceland 18 163 805.6%
Ireland 34 114 235.3%
Italy 52 116 123.1%
Kazakhstan 35 164 368.6%
Latvia 24 94 291.7%
Liechtenstein 40 90 125.0%
Lithuania 26 108 315.4%
Luxembourg 23 73 217.4%
Malta 18 141 683.3%
Montenegro 18 42 133.3%
Netherlands 26 81 211.5%
Norway 36 109 202.8%
Poland 33 104 215.2%
Portugal 27 102 277.8%
Romania 26 131 403.8%
Russia 42 161 283.3%
Serbia 22 76 245.5%
Slovakia 30 69 130.0%
Slovenia 21 69 228.6%
Spain 45 118 162.2%
Sweden 30 118 293.3%
Switzerland 26 75 188.5%
Turkey 26 115 342.3%
Ukraine 35 116 231.4%
United Kingdom 37 107 189.2%

Residents of Cyprus saw an average latency of 194 ms while roaming in Europe. The country with the second highest latency for residents roaming abroad was Kazakhstan at 164 ms, followed by Iceland (163 ms). Russia (161 ms) and Malta (141 ms). In contrast, Montenegro had a lower latency for residents roaming abroad than Italy did for residents using their mobile phones locally.

Roaming performance at MWC

MWC, the largest mobile conference in the world, has Barcelona teeming with visitors from across the globe all trying to connect to their home networks. During February 2018 we saw an average download speed of 34.31 Mbps while roaming in Barcelona and a mean latency of 201 ms. Visitors from the U.K. saw an average download speed of 49.00 Mbps and a mean latency of 111 ms, while those from Italy averaged a download of 32.88 Mbps and a latency of 128 ms.

What will the performance look like at this year’s conference? Schedule a meeting or come see us in Hall 2 at Booth 2i25 to learn more about our roaming data.

Ookla retains ownership of this article including all of the intellectual property rights, data, content graphs and analysis. This article may not be quoted, reproduced, distributed or published for any commercial purpose without prior consent. Members of the press and others using the findings in this article for non-commercial purposes are welcome to publicly share and link to report information with attribution to Ookla.

| December 10, 2020

Massive Expansions and Huge Improvements in Speed: The Worldwide Growth of 5G in 2020

The rapid expansion of 5G in countries across the globe was a bright spot in a year that needed one. But just how great is the news? We examined Speedtest Intelligence® data from over 60.5 million Speedtest® results during Q3 2020 to see how much speeds have improved, where download speeds are the fastest at the country and capital level, where 5G deployments have increased and what worldwide 5G coverage looks like now. We also looked at countries where 5G doesn’t yet reach to understand where good news might be on the horizon.

We have only included countries with commercially available 5G on these lists in order to provide a more accurate view of the performance consumers can reasonably expect. While our data shows results for many countries where 5G is not yet commercially available, these tests are likely results from engineers testing their own networks. In addition, we’re only providing analysis for countries with more than 200 samples during Q3 2020. The bars shown in our charts are 95% confidence intervals, which represent the range of values in which the true value is likely to be. Countries marked in tables with an asterisk first launched 5G commercially in 2020.

5G downloads were 954% faster than 4G at the global level

The worldwide median download speed over 5G was 954% faster than that over 4G during Q3 2020. Median upload speed over 5G was 311% faster than that over 4G. Consumers are eagerly adopting the new technology and many have wanted to measure the full throughput capacity of their network connection. In Q3 2020 alone, there were 4,324,788 Speedtest results over 5G.
Median-Speeds-Worldwide_1220-1

United Arab Emirates had the fastest 5G

United Arab Emirates topped the list of countries with the fastest top 10% 5G download speed in Q3 2020. Top 10% (or 90th percentile) measures the speeds seen by the fastest 10% of users and is a way to gauge what each country’s networks are capable of. Saudi Arabia was second for top 10% 5G download speed, Norway third, Spain fourth and Japan fifth.
Fastest-Countries-Top-5G-Download-Speed_1220-2

Another way to measure 5G performance is to look at median 5G download speed, which is a better predictor of the kind of performance most 5G customers can expect. Norway was the country with the fastest median download speed over 5G during Q3 2020. U.A.E. was second in this category, South Africa third, Saudi Arabia fourth and Spain fifth.
Fastest-Countries-Median-5G-Download-Speed_1220-2

It’s notable that Japan was on the list of 10 countries with the fastest top 10% 5G download speed but not on the list of 10 countries with the fastest median download speed over 5G. No matter how fast a country’s mobile infrastructure is, many other factors go into median 5G speeds, including device adoption and spectrum allocation.

Abu Dhabi tops list of 5G speeds in world capitals

Our examination of 5G performance for 18 world capital cities with 5G during Q3 2020 found that Abu Dhabi had the fastest median download speed over 5G at 546.81 Mbps. Riyadh was second, Madrid third, Seoul fourth and Kuwait City fifth. As we saw at the country level, median upload speed was much lower than download speed.
Median-5G-Performance-Capitals_1220-2

How 5G performance and time spent compare within regions

We looked more closely at 5G performance across several intergovernmental organizations and trade blocs to get a better sense of how countries are performing in comparison to their neighbors and trade partners. We also calculated Time Spent on 5G, the proportion of time that users with 5G-capable devices spent on 5G, for each country.

Italy had the fastest 5G among G7 countries, U.S. the slowest

Italy had the fastest median download speed over 5G of all the G7 countries. Japan was second, Canada third, the U.K. fourth and Germany fifth. The U.S. had the highest Time Spent on 5G, followed by Canada. For a deeper analysis of 5G in the U.K., read our previous coverage. Because France launched commercially available 5G only within the last couple of weeks, we have not included it on this table.
5G-Performance-G7-Countries_1220

South Africa was the only country in the African Union with sufficient 5G to rate

As we saw above, South Africa’s impressive median download speed over 5G ranked the country third in the world during Q3 2020. South Africa was only one of two countries in the African Union to have commercially available 5G during Q3 2020. The other, Madagascar, did not have sufficient samples to properly analyze. Time Spent on 5G in South Africa was very low, an indication that 5G is not yet widely available there.
5G-Performance-Africa_1220

South Korea had the fastest 5G in APEC countries, U.S. the slowest

A median download speed over 5G of 411.11 Mbps put South Korea comfortably at the top of Asia-Pacific Economic Cooperation (APEC) countries with the fastest 5G during Q3 2020. Thailand was second, Australia third, China fourth and Taiwan fifth. 5G speeds represented the largest improvement over 4G in the Philippines where the median download speed over 4G during Q3 2020 (9.36 Mbps) was substantially lower than that of other countries on this list.

South Korea and the U.S. tied for highest Time Spent on 5G among APEC countries during Q3 2020, followed by Hong Kong and Taiwan.
5G-Performance-APEC_1220

Spain had the fastest 5G in the E.U., Poland the slowest

Spain showed the fastest median download speed over 5G among the 11 European Union (E.U.) countries with sufficient 5G samples to rank during Q3 2020. Hungary was second, Finland third, Romania fourth and Ireland fifth. Spain’s median download speed over 5G also represented the largest gain over 4G among all of these countries, partially because Spain had the second slowest median download speed over 4G. France is not included on this list because 5G did not become commercially available in the country until after Q3 2020.

The Netherlands had the highest Time Spent on 5G among E.U. countries during Q3 2020, indicating that customers with 5G phones are able to spend far more time on 5G there than in other E.U. countries. Denmark was second for Time Spent on 5G among EU countries in Q3 2020 and Finland third.
5G-Performance-EU_1220

U.A.E had the fastest 5G in Gulf Cooperation Council Countries

With the second fastest median download speed over 5G in the world, U.A.E. was also the Gulf Cooperation Council (GCC) country with the fastest 5G during Q3 2020. Saudi Arabia was second and Qatar third. While Oman does have commercially available 5G, there were insufficient samples in the country during Q3 2020 to properly analyze performance.

5G represented the largest improvement over 4G in Kuwait and Bahrain, countries that had slower median download speeds over 4G than their neighbors.

Time Spent on 5G was relatively high in all the GCC countries on this list, except Bahrain, when compared to other countries in the world during Q3 2020. Qatar showed the highest Time Spent on 5G among GCC countries in Q3 2020 at 16.0%. U.A.E. was second and Saudi Arabia third.
5G-Performance-GCC_1220

Brazil was the only MERCOSUR country with sufficient 5G to rate

Brazil’s median download speed over 5G of 84.60 Mbps during Q3 2020 may not seem fast for 5G, but it still puts Brazil well ahead of other countries in the Southern Common Market (MERCOSUR), most of which do not yet have 5G at all. We did see 5G results in Colombia, but there were insufficient samples to properly compare.

Time Spent on 5G in Brazil during Q3 2020 was not quite one percent, indicating that customers do not have much access to 5G yet.
5G-Performance-MERCOSUR_1220

The U.S., Europe and Asia see widespread 5G coverage

Data from Cell Analytics™ shows a global view of 5G coverage in Q3 2020. This map, based on 5G connectivity data for opted-in Speedtest users, shows that 5G is spreading rapidly across the U.S., Europe, the Arabian Peninsula and Asia. In other regions, 5G is primarily available in larger cities, if at all.
Global-5G-Coverage_1220

99 countries worldwide had 5G, in 14,643 total cities

The number of countries with 5G deployments increased 62.3% between Q3 2019 and Q3 2020, with 99 countries having 5G deployments at the end of Q3 2020, according to the Ookla 5G Map™. There were 14,643 cities worldwide with 5G deployments at the end of Q3 2020, a 1,671% increase over Q3 2019. The total number of deployments worldwide was 17,046. The counts here and throughout this section include commercially available 5G as well as 5G networks with limited availability and those in pre-release.

Countries with the Most 5G Cities
Ookla 5G Map™ | Q3 2020
Country Numbers of Cities with 5G
United States 7,583
Germany 2,312
Austria 1,104
Netherlands* 1,009
Switzerland 554
Thailand* 325
Ireland 214
Puerto Rico 187
United Kingdom 169
Kuwait 97

The U.S. had the most cities with 5G deployments at the end of Q3 2020 with 7,583. Germany was second, Austria third, the Netherlands fourth and Switzerland fifth. A deployment is when a provider has some level of 5G presence in a city. A city can have multiple deployments when more than one provider is present.

Countries with the Largest Growth in Number of Deployments
Ookla 5G Map™ | Q3 2020
Country 5G Deployments as of Q3 2020 % Change Q3 2020 vs Q3 2019
Netherlands* 1,071 50,350%
Thailand* 451 32,401%
United States 7,808 21,566%
Germany 2,417 11,460%
Canada* 93 7,600%
Austria 1,173 4,918%
Ireland 236 4,180%
Poland 81 3,150%
Japan* 75 2,050%
Oman 50 2,000%

The Netherlands showed the largest percentage change in the number of 5G deployments between Q3 2019 and Q3 2020 with a 50,350% jump from two deployments in Q3 2019 to 1,071 in Q3 2020. Thailand saw the second largest percentage increase, the U.S. third, Germany fourth and Canada fifth.

Most early trials and commercial deployments of 5G spectrum allocations around the world have been centered around fallow swaths of the mid-band (3.3 GHz – 4.2 GHz) spectrum. With the recent commercialization of Dynamic Spectrum Sharing (DSS) across all major 5G infrastructure vendors, there is now increasing demand for 5G support on many existing 4G frequencies, ranging from 600 MHz to 2.5 GHz. In unique 5G markets like Japan, there is an additional need for the 4.5 GHz band as well as the millimeter wave (FR2).

In the United States, early deployments leveraged millimeter wave frequency bands in the 28 GHz and the 39 GHz, which delivered impressive speeds in a very constrained footprint. The rapid 5G deployment in the 600 MHz band has added a substantial nationwide 5G footprint — and with that, much wider 5G availability for many more Americans. With the recent merger between T-Mobile and Sprint, the deployment of 2.5 GHz spectrum has been significantly accelerated, which should improve both network efficiency and user experience on T-Mobile’s network. Additionally, next year’s availability of 5G Carrier Aggregation will allow T-Mobile to combine 600 MHz with 2.5 GHz to deliver improved 5G speeds on top of the existing nationwide footprint. In addition, DSS has recently been deployed by AT&T and Verizon, which allows operators to choose from existing low-band spectrum assets (850 MHz) and deliver both LTE and 5G at the same time. This feature alone doesn’t add a significant boost in perceived user experience, but will certainly improve the 5G footprint.

China showed the highest percentage of 5G test samples

Another way to measure 5G adoption is to look at the proportion of samples taken over 5G relative to the total number of samples on all technologies. Speedtest Intelligence is uniquely positioned to measure global growth in 5G because of the worldwide adoption of Speedtest apps. China had the highest percentage of 5G Speedtest results compared to other mobile technology types in Q3 2020 at 18.9%. South Korea was second, Hong Kong third, Puerto Rico fourth and Qatar fifth.

Countries with the Most 5G
Speedtest Intelligence® | Q3 2020
Country 5G Samples as a % of Total
China 18.9%
South Korea 15.8%
Hong Kong (S.A.R.)* 7.9%
Puerto Rico 6.7%
Qatar 5.7%
United States 5.5%
Netherlands* 4.9%
United Arab Emirates 4.6%
Kuwait 4.6%
Australia 4.2%

What 5G will look like in 2021

With recently announced device chipset advancements expected in 2021, including 5G Carrier Aggregation, operators will be able to combine two 5G frequency bands in the sub-6GHz (FR1) range, allowing not only faster speeds, but also greater coverage. More importantly, the ability to combine Frequency Division Duplexing (FDD) and Time Division Duplexing (TDD) FR1 channels will enable operators to leverage low-band frequencies (sub-1GHz) for uplink transmissions (user device to cell site), while combining the low-band with the mid-band (2.5 GHz, 3.5 GHz) on the downlink. This should significantly expand the availability of fast 5G download speeds across larger geographies.

Similarly, DSS — which is a stepping stone to standalone 5G and allows for the simultaneous delivery of 4G and 5G technology on the same spectrum slice — will enable operators to combine already-deployed FDD spectrum with dedicated mid-band spectrum for an enhanced standalone 5G experience. This will unlock the full potential of 5G networks, such as ultra low latency and network slicing, while delivering an improved mobile experience to users.

Where 5G fails to reach

During Q3 2020 Speedtest Intelligence showed 55 countries in the world (with more than 200 samples) where more than 20% of samples were from 2G and 3G connections (combined). These are countries where, in many cases, 5G is still aspirational. As excited as we are about the expansion of 5G, we do not want to see these countries left behind.

Countries That Still Rely Heavily on 2G and 3G Connections
Speedtest Intelligence® | Q3 2020
Country 2G & 3G Samples 4G Samples
Turkmenistan 74.9% 25.1%
Rwanda 52.3% 47.7%
Iraq 49.4% 50.6%
Belarus 46.5% 53.5%
Afghanistan 46.0% 54.0%
Antigua and Barbuda 40.2% 59.8%
Tajikistan 40.2% 59.8%
Suriname 39.7% 60.3%
Haiti 37.7% 62.3%
Syria 37.5% 62.5%
Ghana 36.0% 64.0%
Ethiopia 35.0% 65.0%
Mozambique 34.7% 65.3%
Benin 34.3% 65.7%
Angola 34.1% 65.9%
El Salvador 32.5% 67.5%
Moldova 31.8% 68.2%
Venezuela 30.3% 69.7%
Tanzania 30.0% 70.0%
Papua New Guinea 29.5% 70.5%
Jamaica 29.4% 70.6%
Sudan 29.2% 70.8%
Algeria 29.0% 71.0%
Namibia 28.5% 71.5%
Zimbabwe 28.5% 71.5%
Somalia 28.4% 71.6%
Nicaragua 28.1% 71.9%
Armenia 28.1% 71.9%
Bosnia and Herzegovina 28.1% 71.9%
Uzbekistan 27.8% 72.2%
Cameroon 27.5% 72.5%
Zambia 27.4% 72.6%
Uganda 26.6% 73.4%
Trinidad and Tobago 26.6% 73.4%
Honduras 26.5% 73.5%
Bangladesh 26.3% 73.7%
Burkina Faso 26.0% 74.0%
Ukraine 25.8% 74.2%
Nigeria 25.7% 74.3%
DR Congo 24.6% 75.4%
Costa Rica 24.3% 75.7%
Botswana 24.1% 75.9%
Libya 22.9% 77.1%
Azerbaijan 22.9% 77.1%
Ecuador 22.8% 77.2%
Mali 22.4% 77.6%
Mongolia 21.8% 78.2%
Maldives 21.6% 78.4%
Mauritius 21.3% 78.7%
Tunisia 21.0% 79.0%
Belize 20.7% 79.3%
Laos 20.5% 79.5%
Kenya 20.3% 79.7%
Paraguay 20.1% 79.9%
Côte d’Ivoire 20.0% 80.0%

In markets where 4G layers haven’t been deployed or substantially covered, end users fall back to the circuit-switched network (2G, 3G). These decades-old network technologies should be sufficient for basic voice and texting, social media, and navigation apps, but cannot deliver rich media experiences or video calling. Unfortunately, many countries on this list are places where consumers rely primarily on mobile phones for their internet connectivity.

5G is radically changing the speeds and capabilities of mobile networks around the world. If the current growth rate continues, it won’t be long before most nations have access to 5G. But there are nations and subsets of subscribers who may not see the benefits of 5G for years to come. We will continue reporting on 5G achievements across the globe and watching speeds in general on the Speedtest Global Index™.

Ookla retains ownership of this article including all of the intellectual property rights, data, content graphs and analysis. This article may not be quoted, reproduced, distributed or published for any commercial purpose without prior consent. Members of the press and others using the findings in this article for non-commercial purposes are welcome to publicly share and link to report information with attribution to Ookla.