A major outage, with over 1.4 million Downdetector user reports globally, across more than 50 online services, reinforces the need for more robust infrastructure given multiple dependent online services.
Downdetector outage reports highlights issues with Google Cloud
At approximately 17:56 UTC on June 12, 2025, Google Cloud entered an “Outage” state on Downdetector, as indicated by a sharp increase in user reports. Downdetector user reported data shows a rapid uptick in outage reports for Google Cloud, peaking at 6.30pm UTC, followed by a long tail of reports as users continued to experience problems with the service. This immediately affected several critical Google services, including Google Drive, Maps, Meet, Nest, Gemini, and YouTube itself.
Google Cloud Outage Summary
Downdetector® | June 12, 2025 | Global Reports
Over 1.4 million user outage reports globally
Concurrently, numerous external platforms that publicly acknowledge their reliance on Google Cloud infrastructure—notably Spotify, Snapchat, Rocket League, and OpenAI—also reported significant disruptions. The widespread nature of cloud infrastructure dependencies meant that a multitude of other online services, even those without a public direct link to Google Cloud, experienced indirect operational impacts.
Minutes later, at 18:00 UTC, Cloudflare also experienced a related outage. Cloudflare subsequently confirmed this disruption was a direct result of an issue with a “third-party cloud provider.” This directly affected major platforms such as Discord and Twitch, both of which publicly utilize Cloudflare’s infrastructure. A broad array of additional services dependent on Cloudflare were similarly impacted across their respective operations.
Over the course of the outage, Downdetector amassed over 1.4 million user reports globally, across more than 50 online services that the platform tracks. Of these 1.4 million, in excess of 800,000 were reported in the U.S. alone.
Downstream Impact – Services Impacted by Google Cloud Outage
Downdetector® | June 12, 2025 | Global Reports
The cascading effect of these outages unfortunately led to considerable confusion among users of communication service providers globally. Many users mistakenly attributed the service interruptions to their mobile or broadband providers, given that access to the affected online services was routed through their respective networks. All three national carriers in the U.S. for example, saw a substantial increase in user reports.
Both Google Cloud and Cloudflare services were largely restored to normal operational status by approximately 20:30 UTC. However, consistent with patterns observed during major service disruptions, user reports on Downdetector continued for a period thereafter.
For businesses, Downdetector provides access to dashboards that deliver early alerts, enable outage correlation, and allow for direct communication with users, ensuring a proactive approach to incident management. Learn how you can leverage Downdetector to be better prepared for outages, or reach out to schedule a demo.
Ookla retains ownership of this article including all of the intellectual property rights, data, content graphs and analysis. This article may not be quoted, reproduced, distributed or published for any commercial purpose without prior consent. Members of the press and others using the findings in this article for non-commercial purposes are welcome to publicly share and link to report information with attribution to Ookla.
Cable has the fastest-growing Wi-Fi 7, but Fiber has the fastest Wi-Fi 7 speeds
Editor’s note: This article was revised on June 12 to reflect that Verizon’s median download speeds are a result of its rate plans and for clarity about cable technology.
Wi-Fi 7 has been around for over a year. If you haven’t noticed this latest generation of Wi-Fi technology, it might be because it is still just gaining a foothold. But even for those who haven’t yet heard of Wi-Fi 7, one can surmise that a new technology generation will have better performance than what’s come before. This article looks at the growth of Wi-Fi 7 in the United States, then compares its performance against prior Wi-Fi generations across top fixed internet service providers (ISP).
Key Takeaways:
Wi-Fi 7 adoption is less than 2%, according to its share of fixed samples of Speedtest user data. ISPs are beginning to include Wi-Fi 7 routers in their service bundle, which is the primary means for households to acquire routers.
Wi-Fi 7 speed is faster, as expected, even delivering gig-speed for one fiber ISP. However, cable providers, which are competitive with fiber speeds on the downlink, have much slower uplink speeds and more lag on latency. Cable companies have 30% more of the older Wi-Fi 4 and 5 routers than fiber companies, constraining the potential customer experience.
Net Promoter Score (NPS) improves with each generation of Wi-Fi, with an immense gulf from -38 for Wi-Fi 4 to +45 for Wi-Fi 7.
Wi-Fi in the U.S. by Technology Standard and the Growth of Wi-Fi 7
Wi-Fi Generations Mix
Speedtest Intelligence data, United States, Q1 2025
Generation breakdown:
Wi-Fi 4 (802.11n), introduced in 2009, hangs onto 13.0% of Speedtest user samples
Wi-Fi 5 (802.11ac) arrived in 2013 and registers a 33.0% share
Wi-Fi 6 (802.11ax) came to market in 2019 and 6E (also 802.11ax) added in early 2021 together account for a majority 52.3% share
Wi-Fi 7 (802.11be) came along early in 2024 and has garnered just 1.8% through Q1 2025
[NB: 6 and 6E are the same IEEE standard. 6E in this article is 6 GHz only, to allow for discrete analysis of this spectrum band. Wi-Fi 6E router samples on 2.4 GHz or 5 GHz are included with Wi-Fi 6. PC Mag explains.]
Wi-Fi 7’s Early Shoots
Wi-Fi 7 Speedtest user samples as share of total Wi-Fi Speedtest samples, Speedtest Intelligence data:
Q1 2024
Q2 2024
Q3 2024
Q4 2024
Q1 2025
0.2%
0.3%
0.5%
0.8%
1.8%
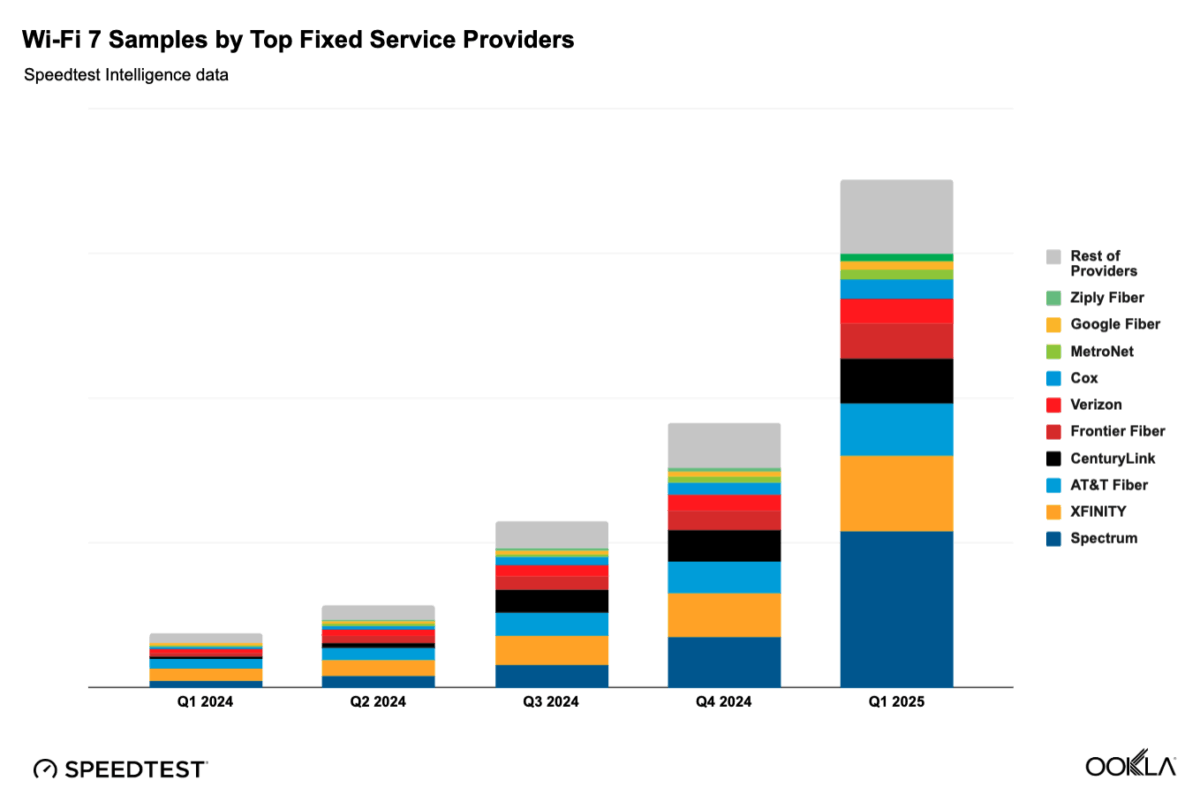
Wi-Fi 7 adoption started slowly and was less than 1% share through all of 2024, but then it more than doubled in Q1 2025 vs. Q4 2024, as more providers began offering Wi-Fi 7 routers as part of the service bundle. The role of ISPs providing equipment is critical. Seventy-one percent (71%) of internet households in the U.S. get their routers from their ISP, according to recent research from Parks Associates. For example, Spectrum (Charter Communications) began offering its Wi-Fi 7 router late last year and tripled its adoption over these two quarters, allowing the company to claim that it is the fastest growing Wi-Fi 7 provider as of Q1 2025.
The ISPs listed in the chart are the ten largest Wi-Fi 7 providers in Speedtest Intelligence data based on total Speedtest user samples on Wi-Fi 7.
Wi-Fi Performance by Generation
Median Download Speeds (Mbps), All and Top 10 Fixed Providers
Speedtest Intelligence data, United States, Q1 2025
For all providers, the increase in median download speed for each Wi-Fi generation is expected. At the top end, Wi-Fi 7 at 764.15 Mbps, even with Wi-Fi 7 including samples from slower bands of 2.4 GHz and 5 GHz, is still faster by 51.64 Mbps than Wi-Fi 6E at 712.51 Mbps. However, among the individual ISPs, there are some ISPs where 6E is faster than Wi-Fi 7. Even with the newest capabilities of Wi-Fi 7, the physical characteristics of a house, for example, can mean that the better coverage propagation characteristics of 2.4 GHz gives a better connection than 6 GHz.
Wi-Fi 7 benefits from double the channel bandwidth and four-times the modulation, as well as a feature called Multi-Link Operation (MLO) which allows data to travel across all frequency bands rather than one. As this analysis is focused on results rather than technical specifications, for those interested in learning more about Wi-Fi 7 capabilities, see The Ultimate Wi-Fi 7 Upgrade Guide by Ekahau (a Ziff Davis company, as is Ookla).
Among the top 10 ISPs, older generation Wi-Fi 4 and Wi-Fi 5 median download speeds generally cluster in similar ranges, respectively, though CenturyLink (Lumen) is slower due to a large portion of its customer base being on slower, copper-based broadband service. In its Q1 2025 earnings report, Lumen reported 1.1 million subscribers on fiber and 1.4 million customers primarily on the slower service.
Verizon’s relatively slower median download speeds on the newer Wi-Fi generations (6, 6E, 7) are likely due to customer rate plan mix.
Frontier, Verizon’s acquisition target, is clearly the fastest on Wi-Fi 7 and records the only gigabit median download speed of 1.011 Gbps.
Median Upload Speeds (Mbps), All and Top 10 Fixed Providers
Speedtest Intelligence data, United States, Q1 2025
As with download speeds, the upload speeds for all providers follow the expected path of getting faster with each newer Wi-Fi generation. However, among the ISPs, there is greater variation in the upload than the download. In particular, the cable ISPs – Cox Communications, Spectrum (Charter Communications), Xfinity (Comcast Corporation) – lagging behind the symmetrical speed of fiber, are far below in the uplink speed. The Wi-Fi 7 average of the median upload speeds of the three cable companies is just 64.40 Mbps vs. 595.75 for the seven fiber companies.
On Wi-Fi 4 and 5, the three cable companies average 47.1% of samples (almost half) while the seven fiber companies average 36.3% of samples on these older generations. The Wi-Fi 5 average of the median upload speeds of the three cable companies is just 27.65 Mbps vs. 178.17 Mbps for the seven fiber companies.
If older cable technology tracks with the Wi-Fi router generations, then the cable companies have a slow-to-change portion of their customer base who will need targeted incentives to upgrade. The cellular industry markets its generations and consumers know, for example, that they need a 5G phone to be on a 5G network. But Wi-Fi, as a category, has not educated consumers to the same extent such that consumers could experience better connectivity with, for example, the latest router (assuming they even know the technology generation of their current router). And, given that the vast majority of a consumers’ mobile traffic is via Wi-Fi – and basically all of the home internet – this is an opportunity for the industry to align the network capability with the service plan with the router with the end device.
As with download speed, again Frontier clocks a blazing median upload speed of 0.9 Gbps (866.85 Mbps).
Median Multi-Server Latency (ms), All and Top 10 Fixed Providers
Speedtest Intelligence data, United States, Q1 2025
Just as with speeds, latency tracks its improvements by Wi-Fi generation for all providers. However, it is arguable from a consumer relevance perspective that Wi-Fi 5, 6, and 6E provide essentially the same latency experience across all providers.
Also as with speed, the fiber companies (apart from MetroNet) have better performance on latencies than the cable companies. On average for Wi-Fi 7, the cable companies latency is 25 milliseconds (ms) vs. 15 ms for the fiber companies (including MetroNet, and including copper customers mentioned above).
The best performer on latency is the aptly named Ziply Fiber, with as-low-as or lower Wi-Fi 4 latency than other ISPs have on Wi-Fi 7 (12 ms), and Ziply is the only provider in single-digit Wi-Fi 7 latency (8 ms).
Wi-Fi 4 Nostalgia? Sentimental is bad for Sentiment
Speed and lag are critical in determining the customer experience. Customer experience relative to one’s expectations determines customer perception. The customer perception is captured by “sentiment” metrics like ratings or stars, satisfaction percentages, or loyalty and recommendation metrics like Net Promoter Score (NPS).
Taking a look at NPS by Wi-Fi generation, just as seen with download speed, upload speed and latency, each newer generation of Wi-Fi is attended by better consumer sentiment. To be clear, these are Speedtest users’ scores for their ISP by Wi-Fi generation, not a score for the routers themselves.
NPS by Wi-Fi Generation, Speedtest Intelligence data, Q1 2025:
Wi-FI 4
Wi-Fi 5
Wi-Fi 6
Wi-Fi 6E
Wi-Fi 7
-38
3
11
30
45
As noted, a legacy of older Wi-Fi router generations in an ISP’s customer base, cable companies having more than fiber providers, limits the customer experience. So too with the transport technology (eg, DOCSIS 3.0). Furthermore, Wi-Fi 7 may need new consumer-premise cabling; some Wi-Fi 7 capable devices may not support the full channel width; and so on. This is to say that technology bottlenecks are possible at each node in the ecosystem. Getting this all lined up to match the service capabilities to the right-fit rate plan that meets the customer needs is Rubik’s Cube. More awareness, better education, and technology transparency will help realize the potential of Wi-Fi 7.
Ookla can assist ISPs, venue owners, and companies in designing Wi-Fi networks, monitoring their performance, and optimizing them. Please contact us to learn more about Speedtest Intelligence and Ekahau.
That leaves just Google Fiber and Xfinity on our top ten without recent, major M&A news. With so many providers (we count 59 ISPs in our data with Wi-Fi 7 samples, and there are more than a thousand fiber providers in the U.S.) in a capex-intensive industry, scale economics drives consolidation. Furthermore, there is a fiber-first imperative narrative that access technologies will converge over time, which also encourages industry consolidation.
Ookla retains ownership of this article including all of the intellectual property rights, data, content graphs and analysis. This article may not be quoted, reproduced, distributed or published for any commercial purpose without prior consent. Members of the press and others using the findings in this article for non-commercial purposes are welcome to publicly share and link to report information with attribution to Ookla.
The LEO satellite provider is giving free gear to new customers in areas where it has excess capacity. Will it be able to handle an influx of new customers and still maintain its broadband speeds?
Key Takeaways
Users on Starlink’s network experienced median download speeds nearly double from 53.95 Mbps in Q3 2022 to 104.71 Mbps in Q1 2025. Median upload speeds also increased dramatically during the same period from 7.50 Mbps in Q3 2022 and to 14.84 Mbps in Q1 2025.
Only 17.4% of U.S. Starlink Speedtest users nationwide were able to get broadband speeds consistent with the FCC’s minimum requirement for broadband of 100 Mbps download speeds and 20 Mbps upload speeds. However, this small percentage of Starlink users is primarily due to its low upload speeds.
Speedtest® data for the states where Starlink is offering its free equipment to new users indicates that existing Starlink users are experiencing a range of median download speeds — from as high as 136.93 Mbps in Maine to as low as 72.65 Mbps in Alaska.
With Starlink’s substantial increase to its median upload and download speeds and ability to deliver broadband speeds of 100/20 Mbps to nearly 20% of Speedtest users across the country, the satellite provider is becoming an increasingly attractive broadband option for many.
SpaceX’s low-Earth orbit (LEO) satellite provider Starlink is making inroads in the U.S. broadband market and trying to attract more subscribers by offering free equipment to new customers in states where it says it has excess capacity (more on this below).
Ookla® Speedtest data on Starlink indicates that the satellite company’s network performance has been on the uptick over the past couple of years and as of Q1 2025 17.42% of U.S. Starlink Speedtest users were able to get speeds consistent with the FCC’s minimum requirement for fixed broadband of 100 Mbps download speeds and 20 Mbps upload speeds.
Starlink is positioned to benefit from recent changes to the Broadband Equity, Access and Deployment (BEAD) program. The National Telecommunications and Information Administration (NTIA) announced June 6 that it had reviewed the BEAD program and, as expected, it adopted a technology-neutral stance instead of prioritizing fiber deployments, making way for LEO satellite systems like Starlink to get BEAD funding.
In addition, some states such as Maine have launched state-funded programs that subsidize Starlink for some rural addresses and more are likely to follow. The Texas Broadband Development Office, for example, announced in January 2025 that it is developing a grant program to support LEO satellite broadband service in rural areas.
Starlink Upload, Download Speeds Are On the Rise
Starlink’s network performance over the past three years shows a dramatic increase in median download and upload speeds as well as a decline in latency.
Starlink’s performance across the U.S. from Q1 2022 until Q1 2025 indicates that after experiencing a decline in download speeds between Q1 2022 and Q3 2022, U.S. Speedtest users on Starlink’s network saw a median download speeds nearly double from 53.95 Mbps in Q3 2022 to 104.71 Mbps in Q1 2025.
The decline in median download speeds between Q1 2022 and Q3 2022 was likely due to growing pains as the satellite service added more subscribers and network usage increased.
A similar trend was observed in median upload speeds as Speedtest users saw their median upload speeds decline between Q1 2022 from 9.81 Mbps to 7.50 Mbps in Q3 2022 and then tick upward to Q1 2025 when median upload speeds reached 14.84 Mbps.
Starlink's Median Upload, Download and Latency Speeds
Q1 2022 through Q1 2025
Starlink's Median Upload, Download and Latency Speeds Over Time
Starlink’s Latency Ticks Downward
Perhaps more importantly than download and upload speeds is latency, which is the time it takes to transmit data from one point in the network to another. Transmitting data between earth and space is particularly challenging because of the distance involved. However, because Starlink’s satellites orbit the planet in low-orbit (about 340 miles above the earth) its latency is much lower than geostationary satellite systems that orbit about 22,000 miles above the earth. For example, signals from satellite system such as HughesNet have a much greater distance to travel, which is why Speedtest users on HughesNet experience a much higher median latency than Starlink Speedtest users.
A comparison of Starlink's Median Latency with HughesNet's Median Latency
Q1 2022 through Q1 2025
Starlink's low-Earth orbit median latency compared with geostationary satellite system's median latency
Starlink users in the U.S. experienced a median multi-server latency of 76 milliseconds (ms) in Q2 2022, but latency measurements ticked downward over time and in Q1 2025 Speedtest users clocked an average median latency of 45 ms.
Starlink said in March 2024 that it was improving its latency in the U.S. by adding six additional internet connection locations (also referred to as PoPs) and optimizing its gateway locations and its planning algorithms to ensure that traffic lands as close to its destination point as possible.
In addition, the satellite company has also steadily added more satellites to its constellation. In February 2022 Starlink had 1,560 satellites in orbit and as of February 2025 it had 6,751 satellites in orbit. At publication of this report, Starlink had launched an additional 24 satellites into low Earth orbit.
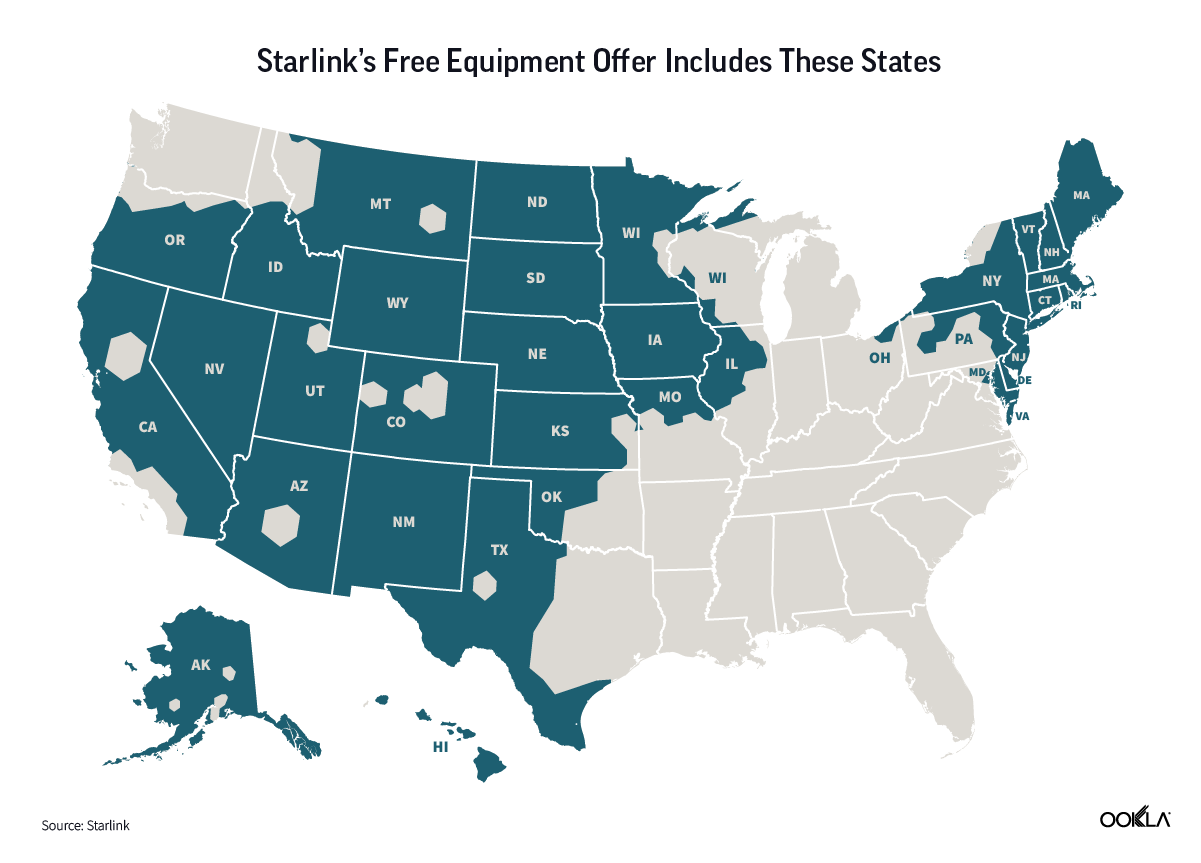
Starlink’s New Free Equipment Offer Targets Several States
Starlink recently announced plans to offer free equipment (valued at around $350) to new customers in areas where it has excess capacity. In the U.S., those areas are depicted on the map below and include all or portions of about 33 states.
Customers who receive the free gear must commit to a one-year plan, and they have a choice of one of two residential plans: An $80/mo plan that will give them speeds between 50-100 Mbps and a $120/mo plan that provides speeds of 250 Mbps.
Ookla Speedtest data for the states where Starlink is offering the free equipment indicates that existing Starlink users are experiencing a range of median download speeds — from as high as 136.93 Mbps in Maine to as low as 72.65 Mbps in Alaska. Perhaps more telling is the download speeds for Speedtest users in the 25th percentile, which provides the download speed performance for the bottom quarter of Speedtest users in these states.
With the exception of Alaska, the overall performance of the rest of the states, particularly the 25th percentile users in Nebraska, Colorado, Maine, Massachusetts, Nevada and Wyoming is probably a better indication of why Starlink is offering free gear to these states. With the 25th percentile of Starlink users in these states experiencing download speeds of more than 80 Mbps there is likely plenty of excess capacity.
Although Starlink said its goal is to deliver service with just 20 milliseconds (ms) median latency, the lowest median latency rates recorded by Speedtest users in all or portions of the selected states was 38 ms in the District of Columbia and 39 ms in Arizona, Colorado and New Jersey. Alaska and Hawaii have the highest latency rates of 105 ms and 115 ms respectively. The higher latency rates in these two states is likely due to these two states being more geographically distant from Starlink’s constellation of satellites and not having the same density of satellites as the continental U.S.
Speedtest Performance for Starlink Users in States that Get Free Gear
The portions or entirety of 33 states or territories where Starlink has decided to offer free gear to potential customers include both high density areas such as Washington D.C. and New Jersey as well as low density states like Alaska and Wyoming. With the exception of Alaska and West Texas, all of the states have a median download speed of more than 100 Mbps.
When looking at the 25th percentile of users (which are the bottom quarter of Starlink users in download speed performance) only one state – Alaska– has a download speed in the 30 Mbps range and three states have 25th percentile users getting in the 50 Mbps range for download speeds.
In addition, when it comes to latency, 20 states have a median latency between 40-49 ms and two states on this list—Arizona and New Jersey— and Washington, D.C. —have median latency under 40 ms.
Starlink Speedtest Performance In the 50 U.S. States
How each state performs in latency, median download, and 25th percentile download
Starlink's performance in latency, median download, and 25th percentile download in all 50 states in the U.S.
Speedtest Performance in States Not Included in Starlink’s Free Equipment Offer
Many of the states where residents are not eligible to get Starlink’s free equipment offer are in the middle and southeastern areas of the U.S. and only eleven of those states have median download speeds over 100 Mbps compared to 28 states and Washington, D.C. that are in the eligible equipment list.
Median latency rates in these ineligible states are very similar to the eligible states with 14 states having a median latency rate between 40- 49 ms. However, when examining the 25th percentile of users (which are the bottom quarter of Starlink users in download speed performance) one state — Florida — has 25th percentile download speeds of just 27.12 Mbps, Washington has 25th percentile download speeds of 46.92 Mbps and Louisiana has 25th percentile download speeds of just 48.25 Mbps.
Northeast and Rural Mid-West States Win in Minimum Broadband Speeds
Only 17.4% of Starlink Speedtest users are able to get broadband speeds consistent with the FCC’s minimum requirement for broadband of 100 Mbps download speeds and 20 Mbps upload speeds. Much of this is due to Starlink’s low upload speeds, which are on the uptick but with a combined overall median upload speed of 14.84 Mbps in Q1 2025 there is still room for improvement.
However, when we look at all satellite providers that deliver service in the U.S., these providers combined are only able to provide 15.75% of Speedtest users with speeds that meet the FCC’s minimum requirement of 100/20 Mbps, which means Starlink outperforms the other providers in this category.
On a state level analysis, when comparing the median download and upload speeds collected in Q1 2025 across all 50 states and Washington, D.C., South Dakota is the No. 1 state with 42.3% of Starlink users getting the FCC’s minimum standard for fixed broadband speeds (100 Mbps downstream/20 Mbps upstream). All of the top-performing Starlink states are in the Northeastern and Midwestern U.S.
On the opposite end of the spectrum, the states with the lowest percentage of users receiving 100/20 Mbps broadband speeds are primarily in the Southeastern U.S. The only state outside of that area is Alaska with the smallest number of Speedtest users —just 5.3%—receiving 100/20 Mbps.
States With the Highest % of Starlink Users that Receive 100/20 Mbps Broadband Speeds
State
% of Starlink users that receive 100/20 Mbps
South Dakota
42.3
Rhode Island
39.0
Wyoming
38.5
Maine
36.5
Massachusetts
35.1
Data as of Q1 2025
States with the Lowest % of Starlink Users that Receive 100/20 Mbps Broadband Speeds
State
% of Starlink users that receive 100/20 Mbps
Alaska
5.3
Mississippi
8.4
Louisiana
9.0
Arkansas
9.6
Florida
9.8
Data as of Q1 2025
Starlink Delivers a Viable Broadband Option for Many
In our recent U.S. state broadband report which focused on Speedtest data from the 2H of 2024, we found that the number of states with 60% or more of Speedtest users getting speeds of 100/20 Mbps had increased substantially from the 1H of 2024.
However, it was disheartening to discover that during that same time period the digital divide within many states had actually increased (some of this is attributed to the demise of the Affordable Connectivity Program) rather than decreased leading us to conclude that many of the recent broadband investments were resulting in better urban coverage rather than closing the gap in rural areas.
With Starlink’s substantial increase to its median upload and download speeds and ability to deliver broadband speeds of 100/20 Mbps to nearly 20% of Speedtest users across the country, the satellite provider is becoming an increasingly attractive broadband option for many.
With Starlink’s latest promotional offer of free equipment to consumers in areas where it has excess capacity, we expect to see the company’s subscriber count grow throughout 2025. It will be interesting to see how the LEO provider balances subscriber growth with capacity.
We will continue to monitor Starlink’s speed performance in the U.S. throughout the year. For more information about Speedtest Intelligence® data and insights, please get in touch.
Ookla retains ownership of this article including all of the intellectual property rights, data, content graphs and analysis. This article may not be quoted, reproduced, distributed or published for any commercial purpose without prior consent. Members of the press and others using the findings in this article for non-commercial purposes are welcome to publicly share and link to report information with attribution to Ookla.
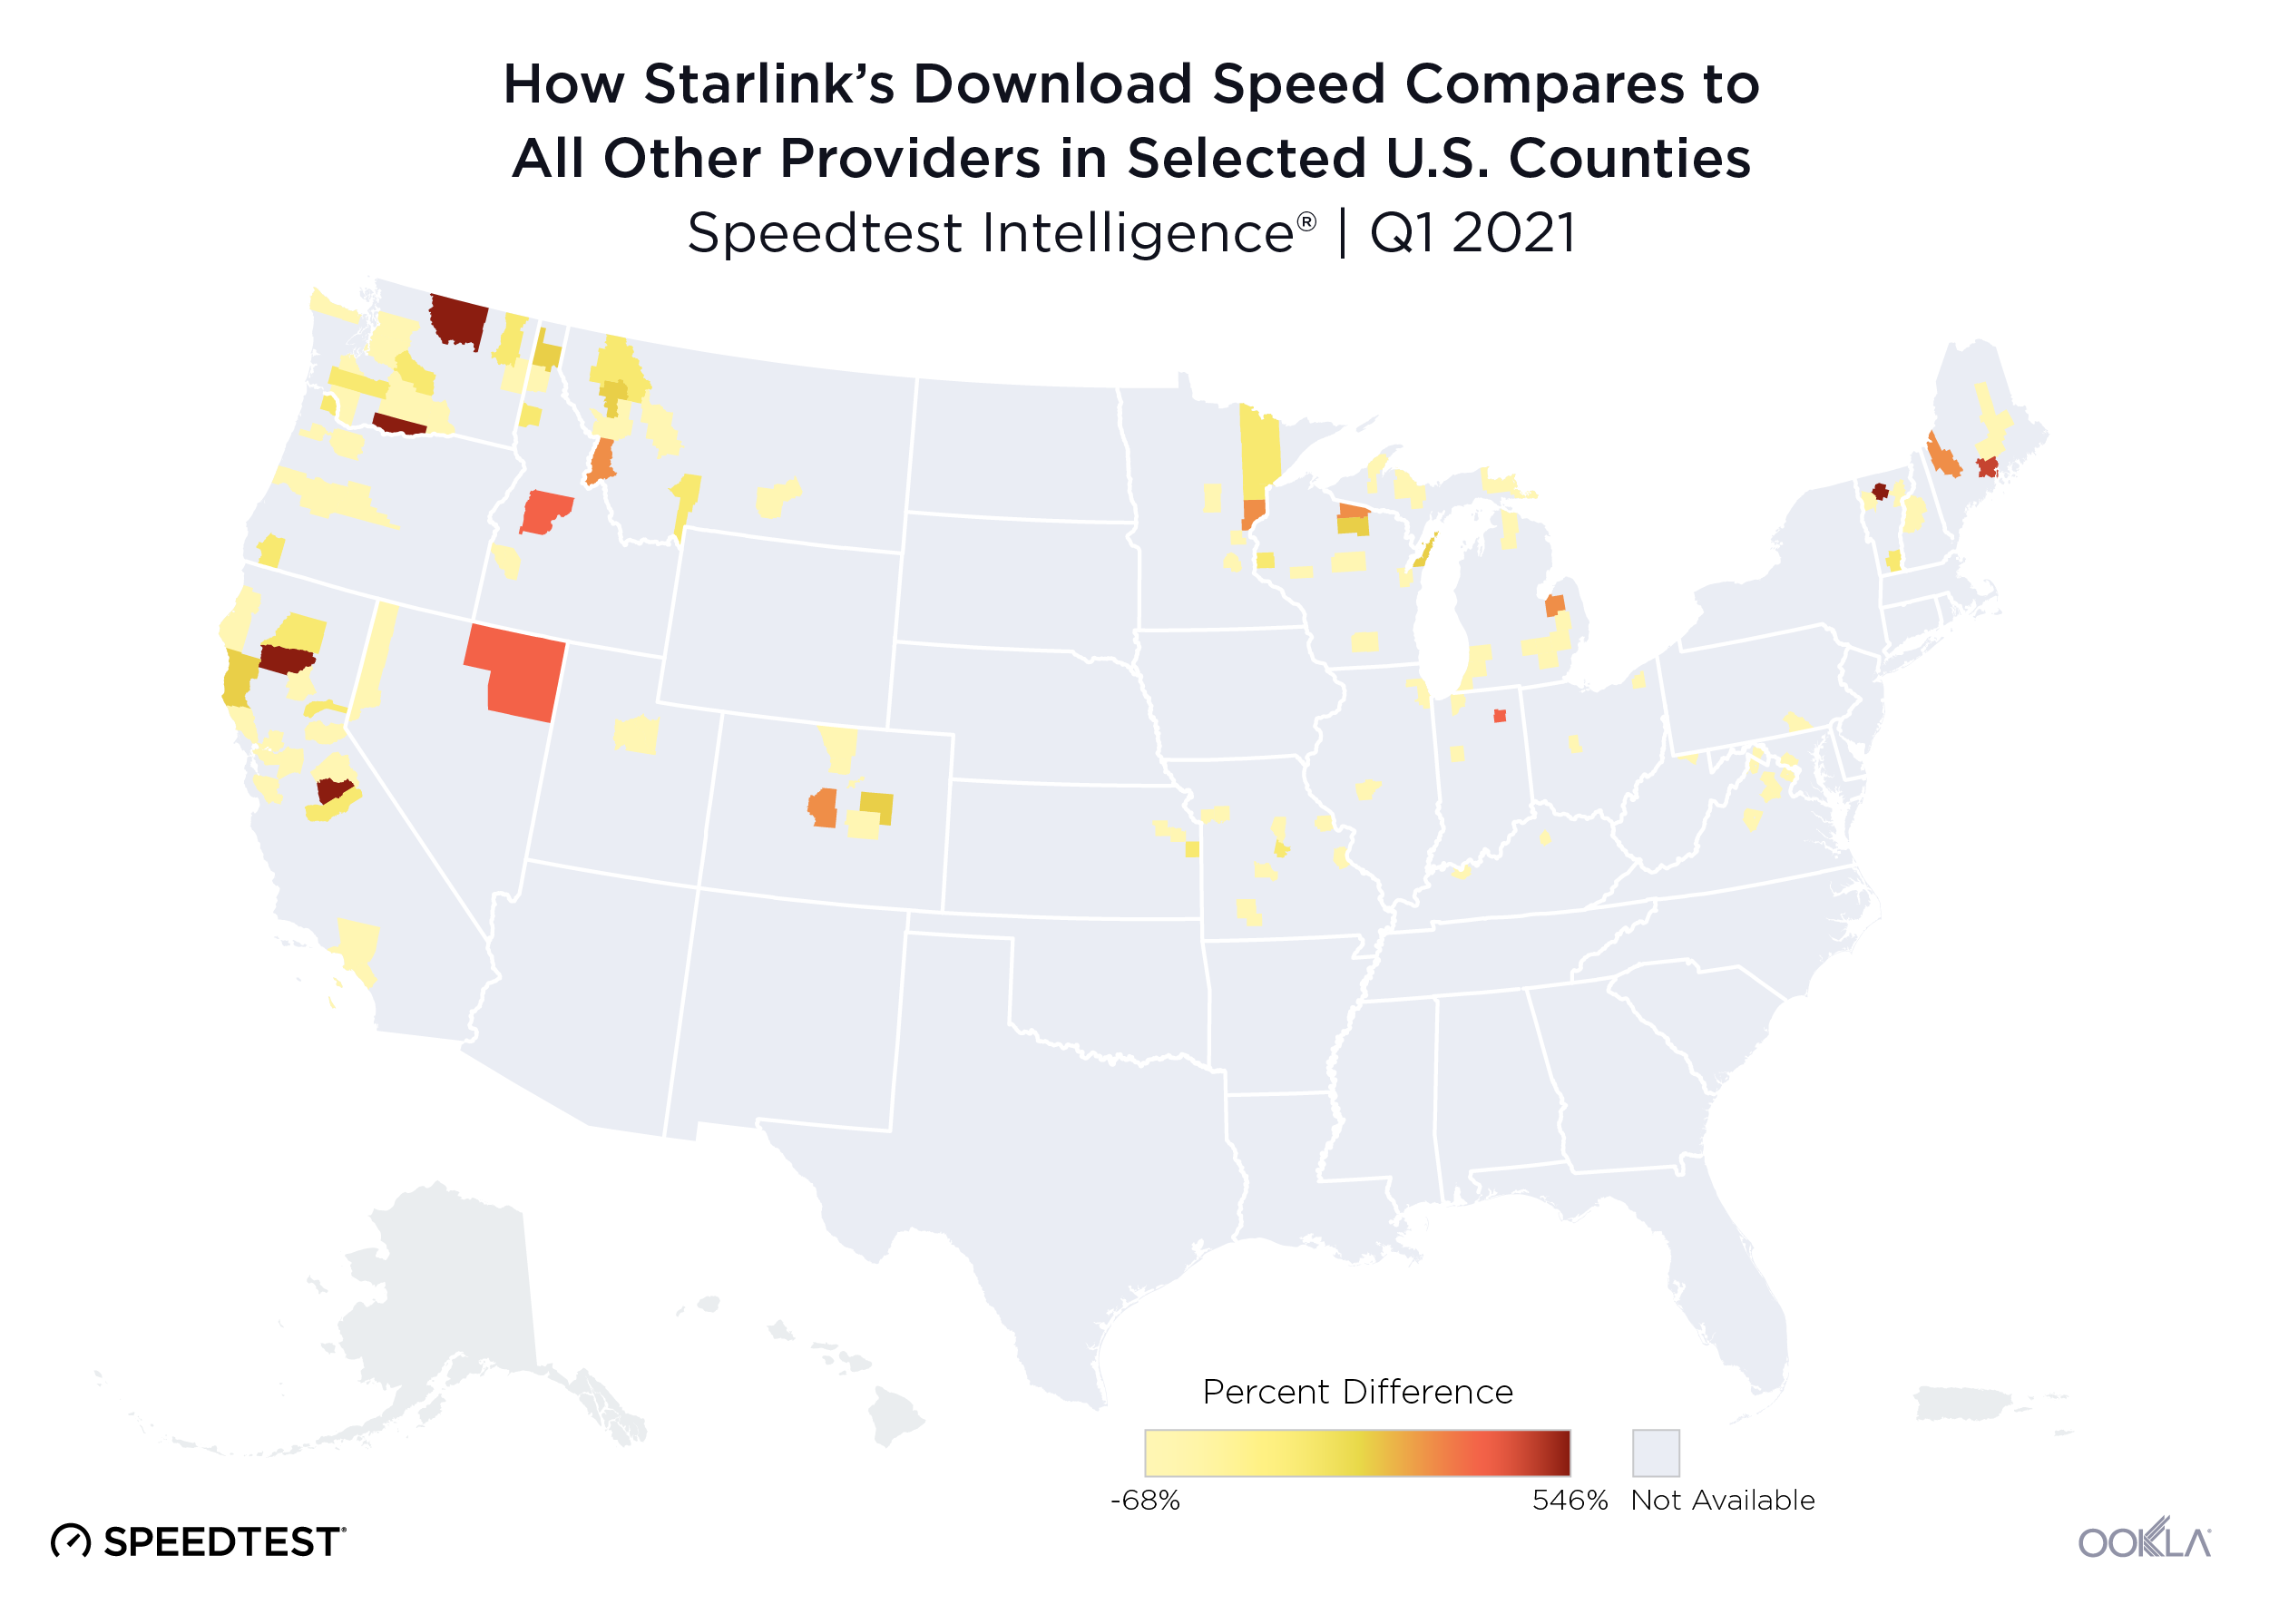
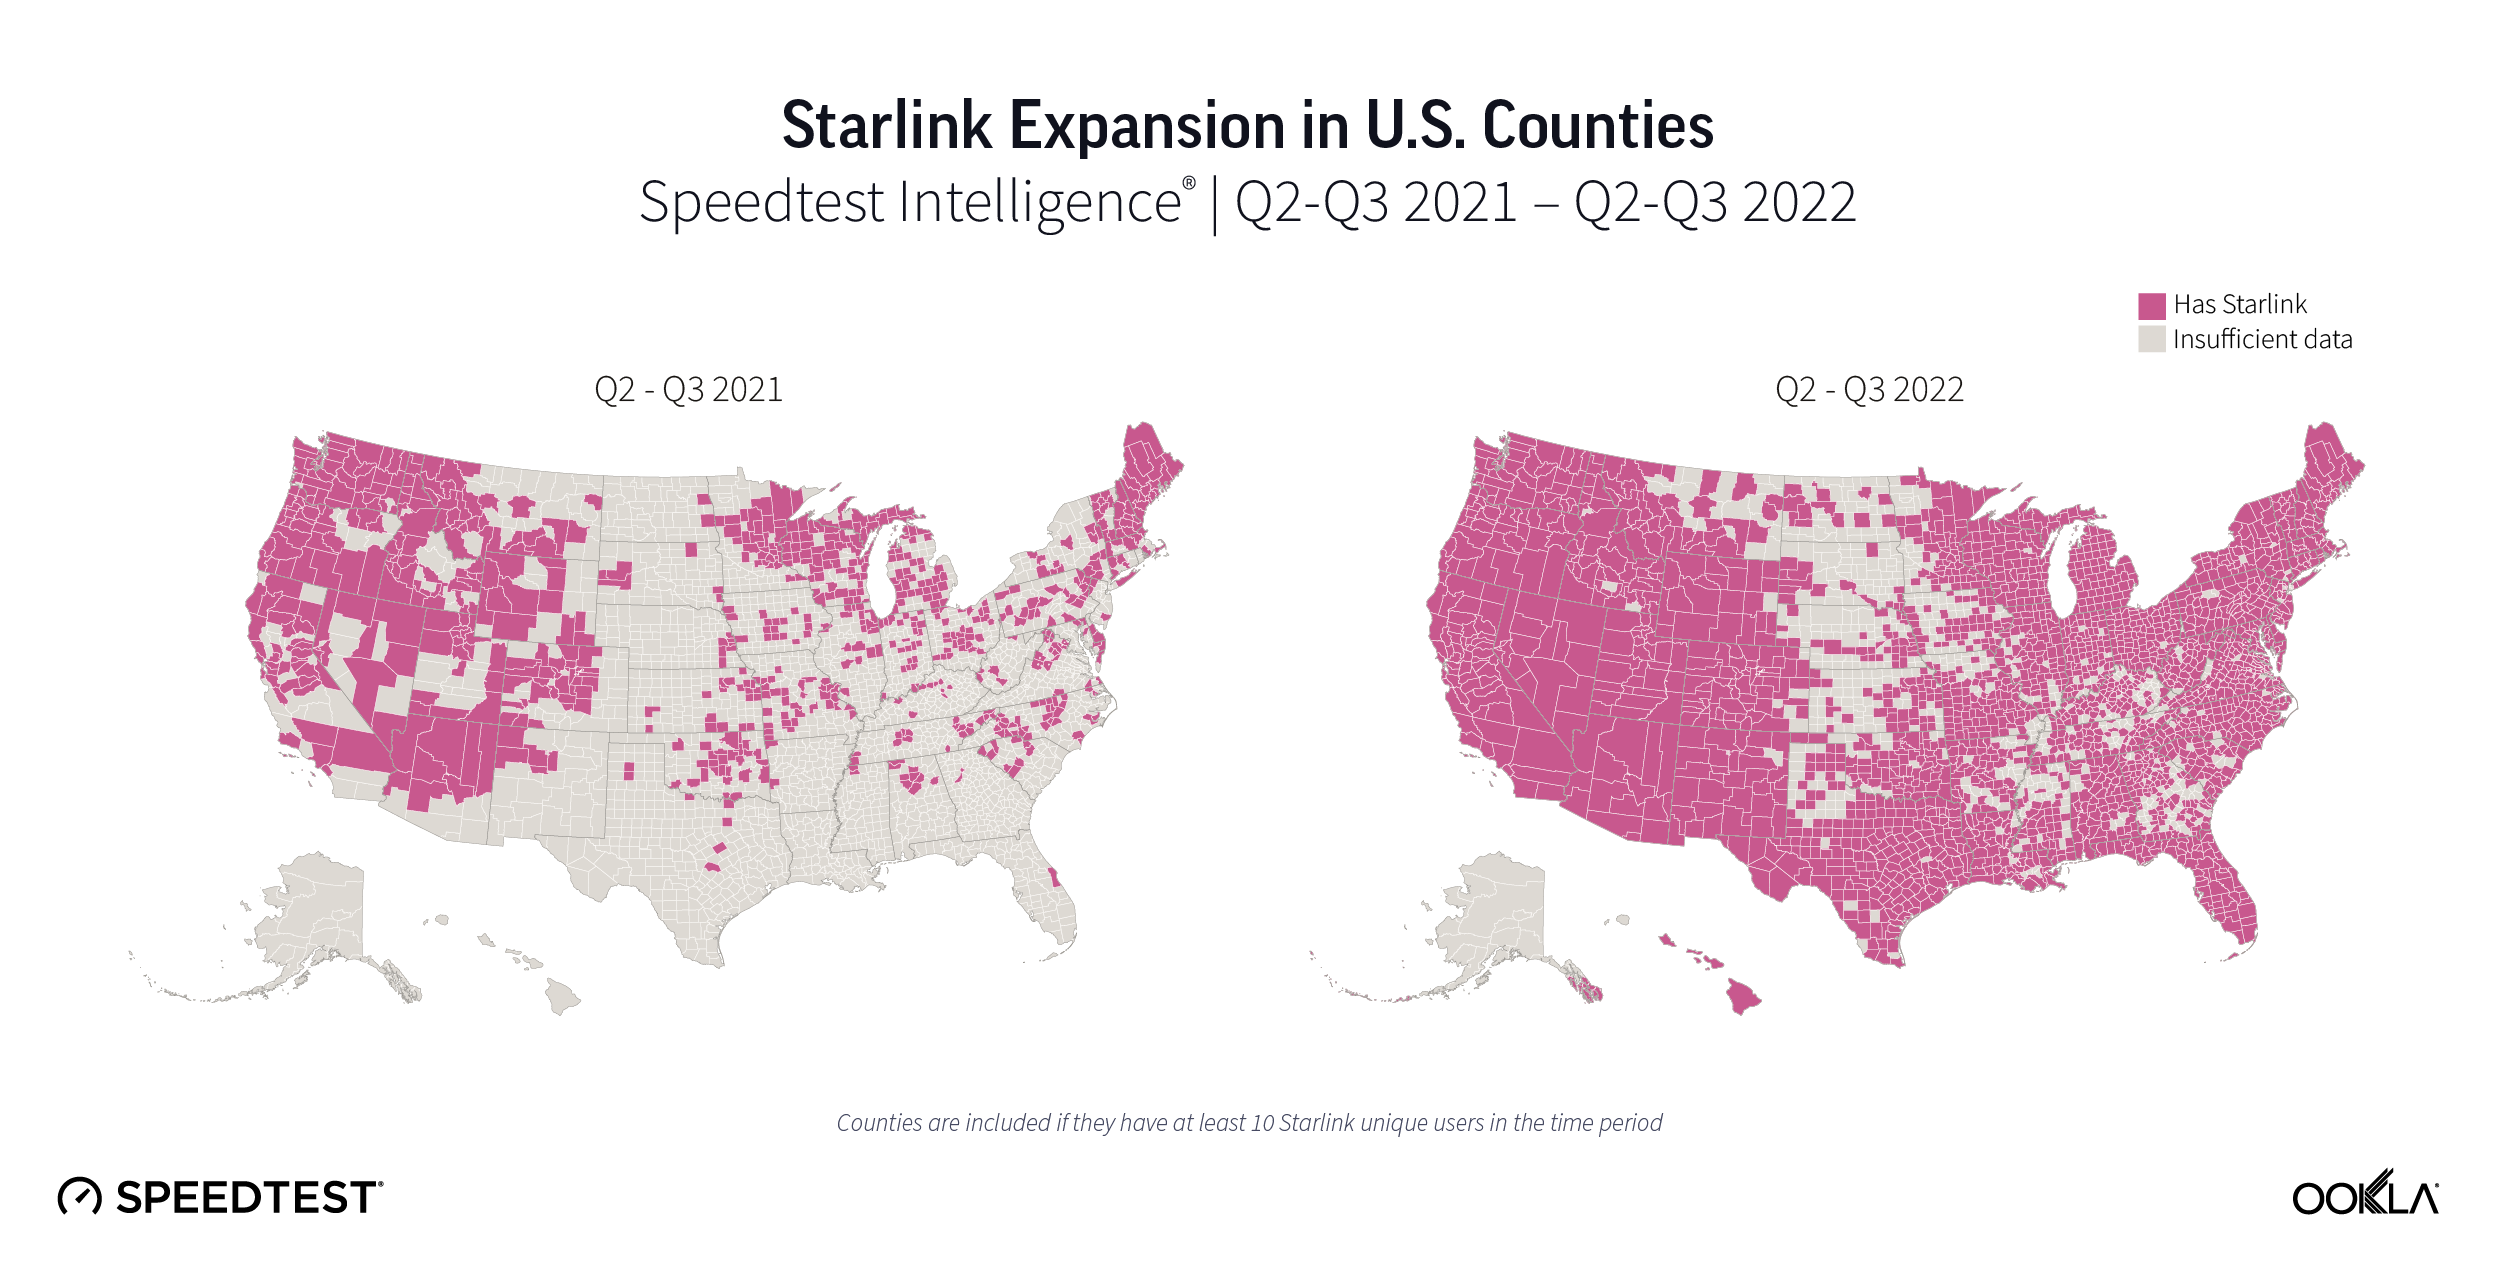
Starlink speeds are sometimes a vast improvement, sometimes not
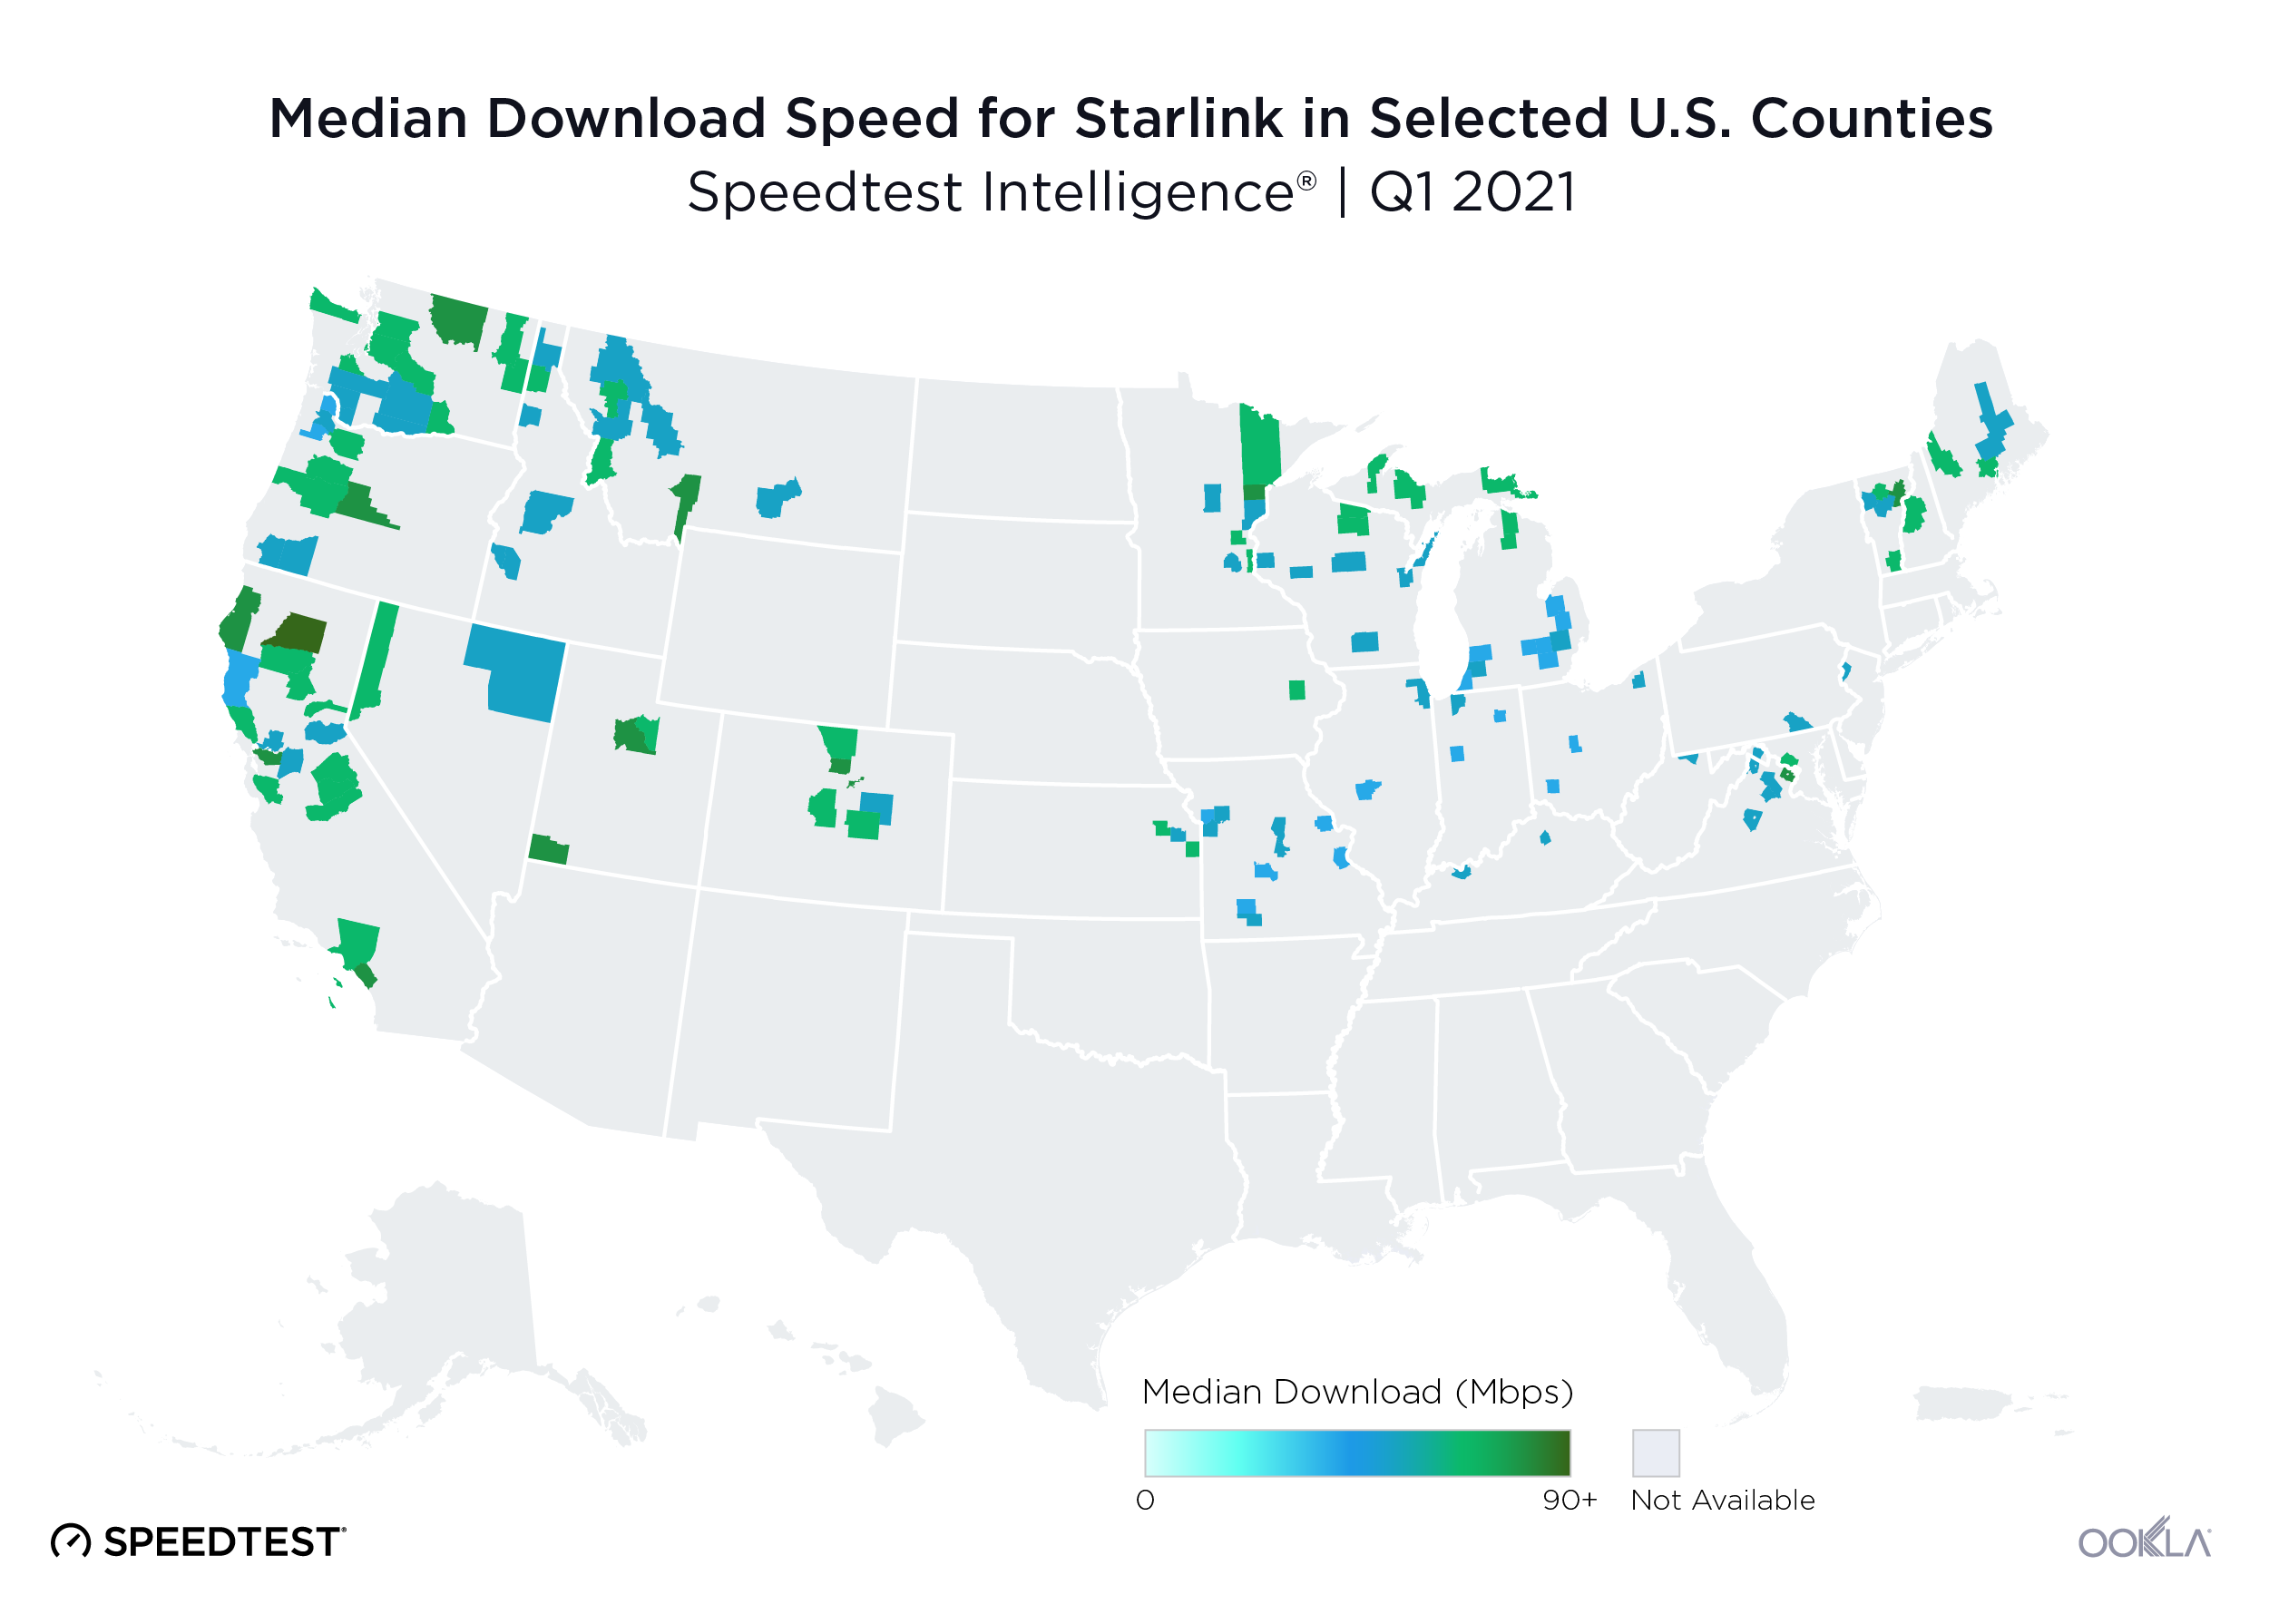
In the U.S. during Q1 2021, median download speeds from Starlink ranged from 40.36 Mbps in Columbia County, Oregon to 93.09 Mbps in Shasta County, California. These represented everything from a dramatic improvement over other fixed broadband providers (545.6% faster in Tehama County, California) to a disappointment (67.9% slower in Clay County, Missouri).
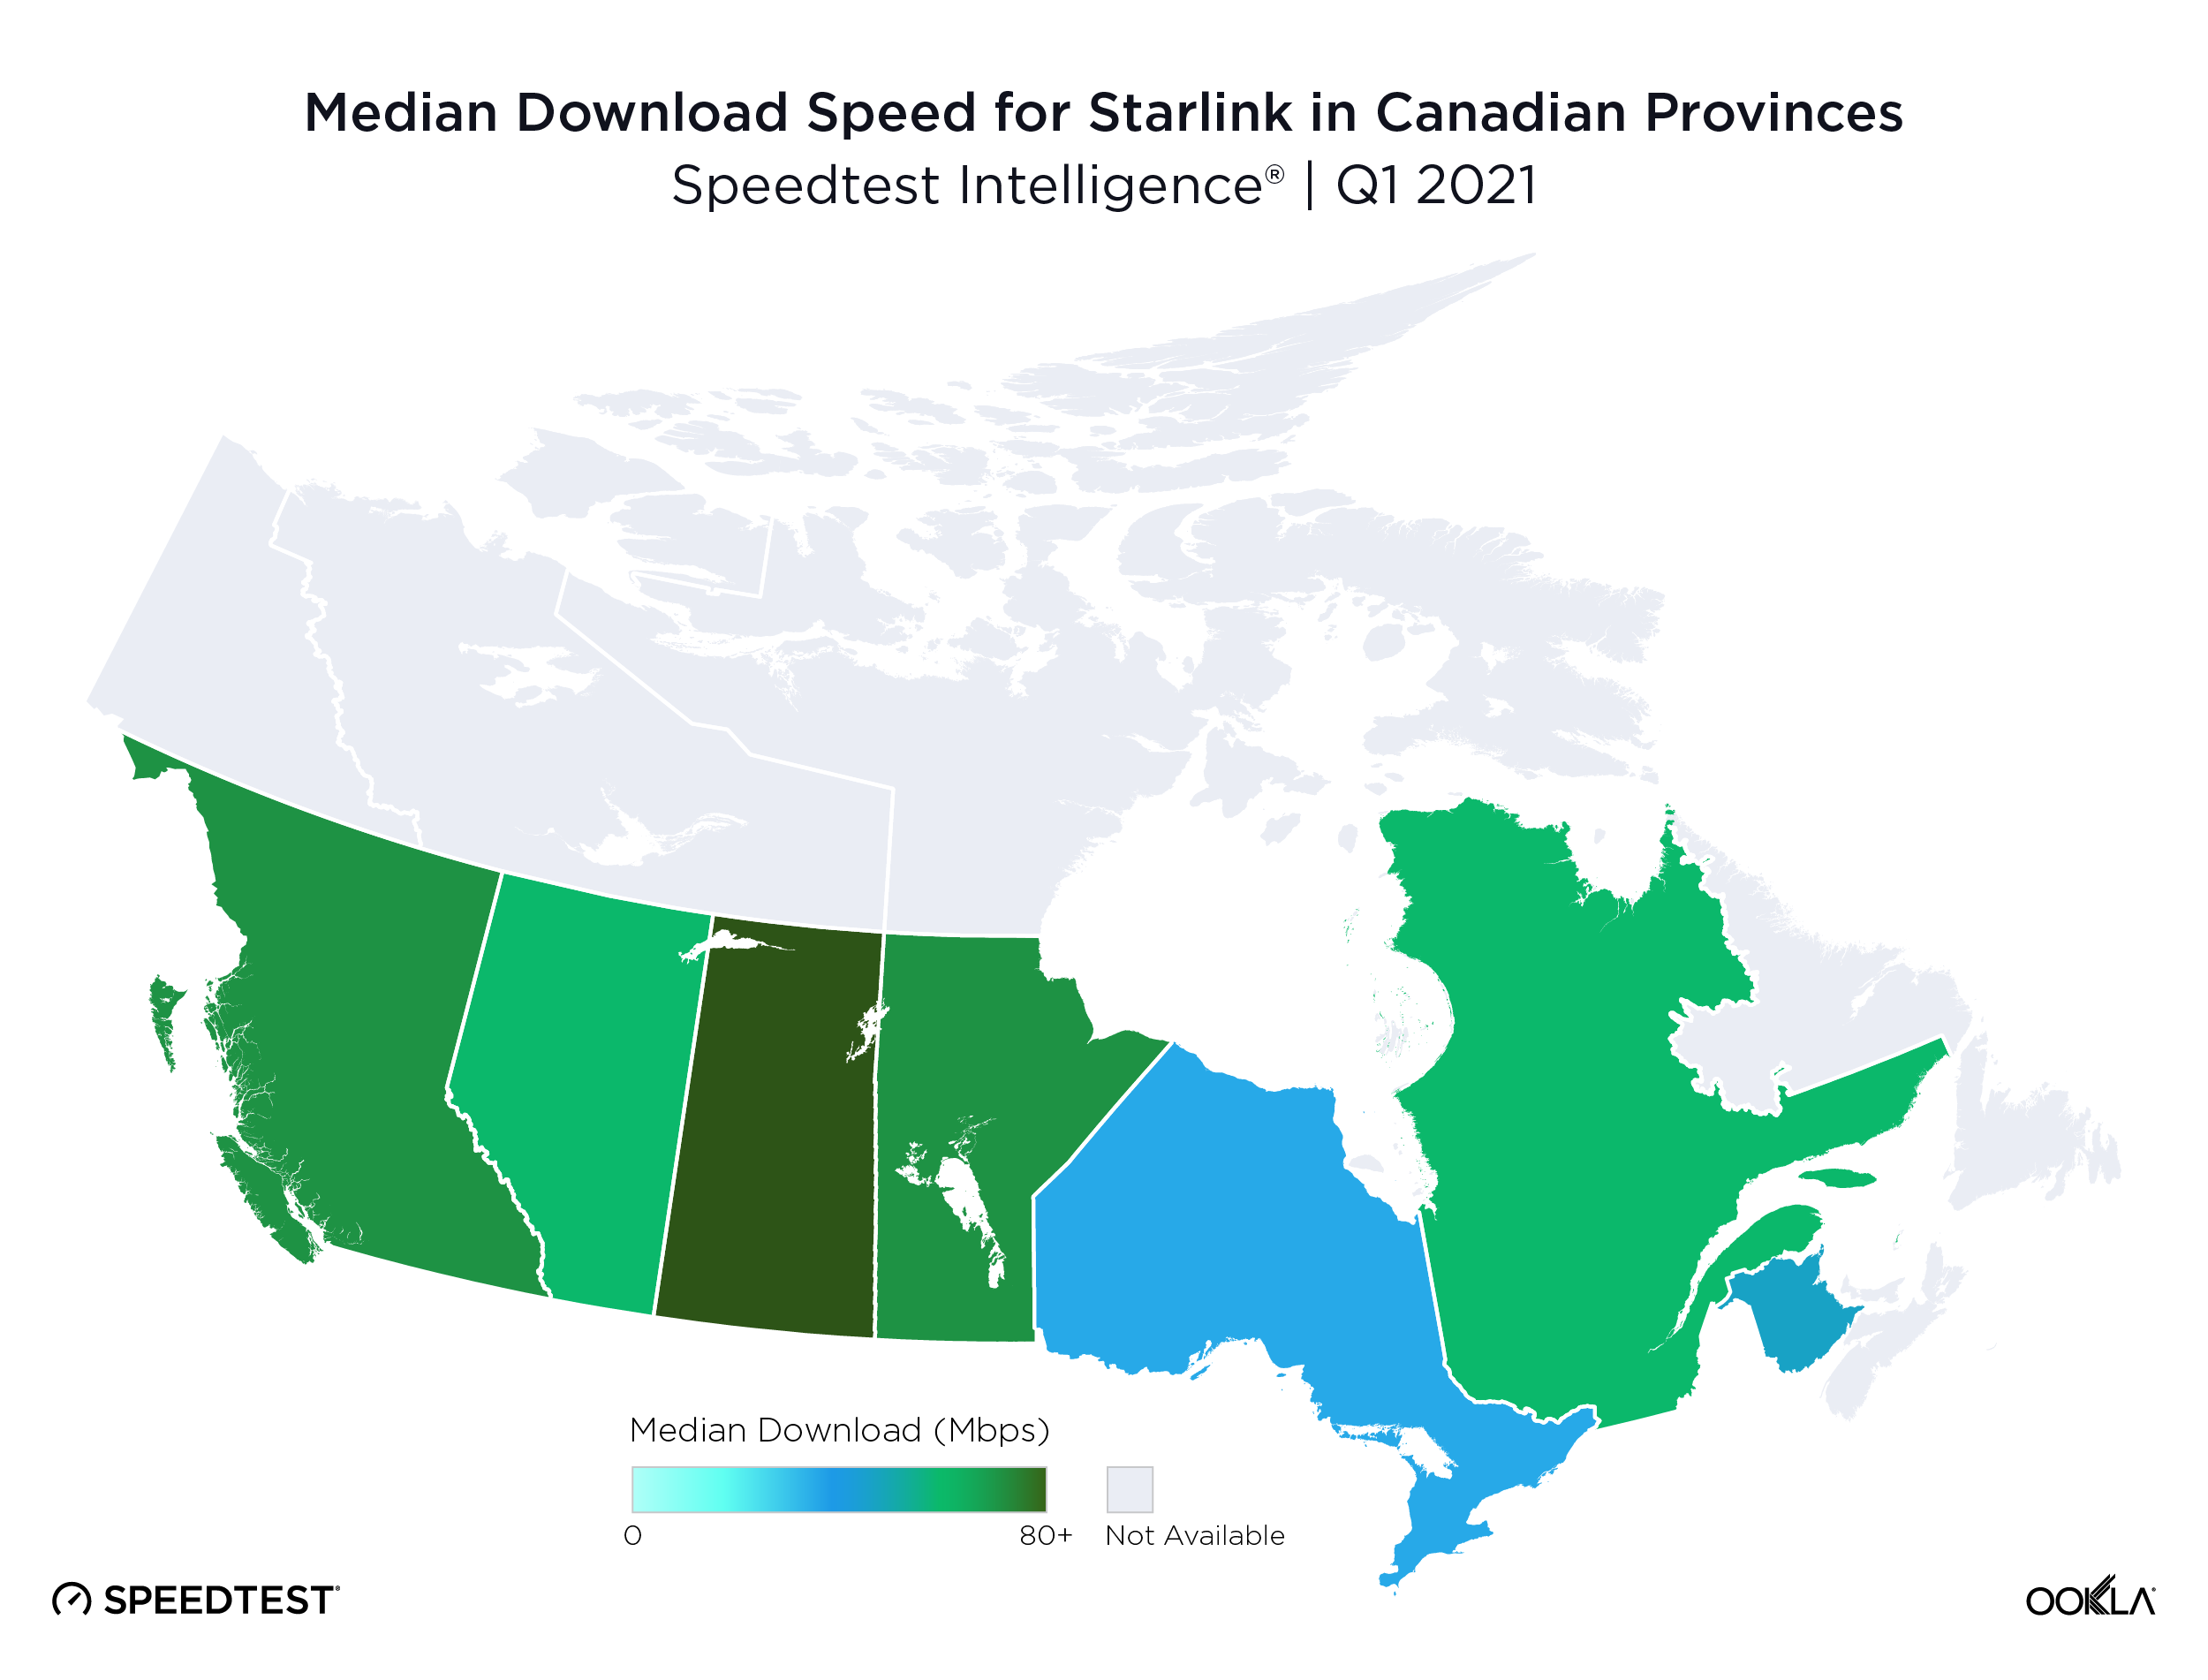
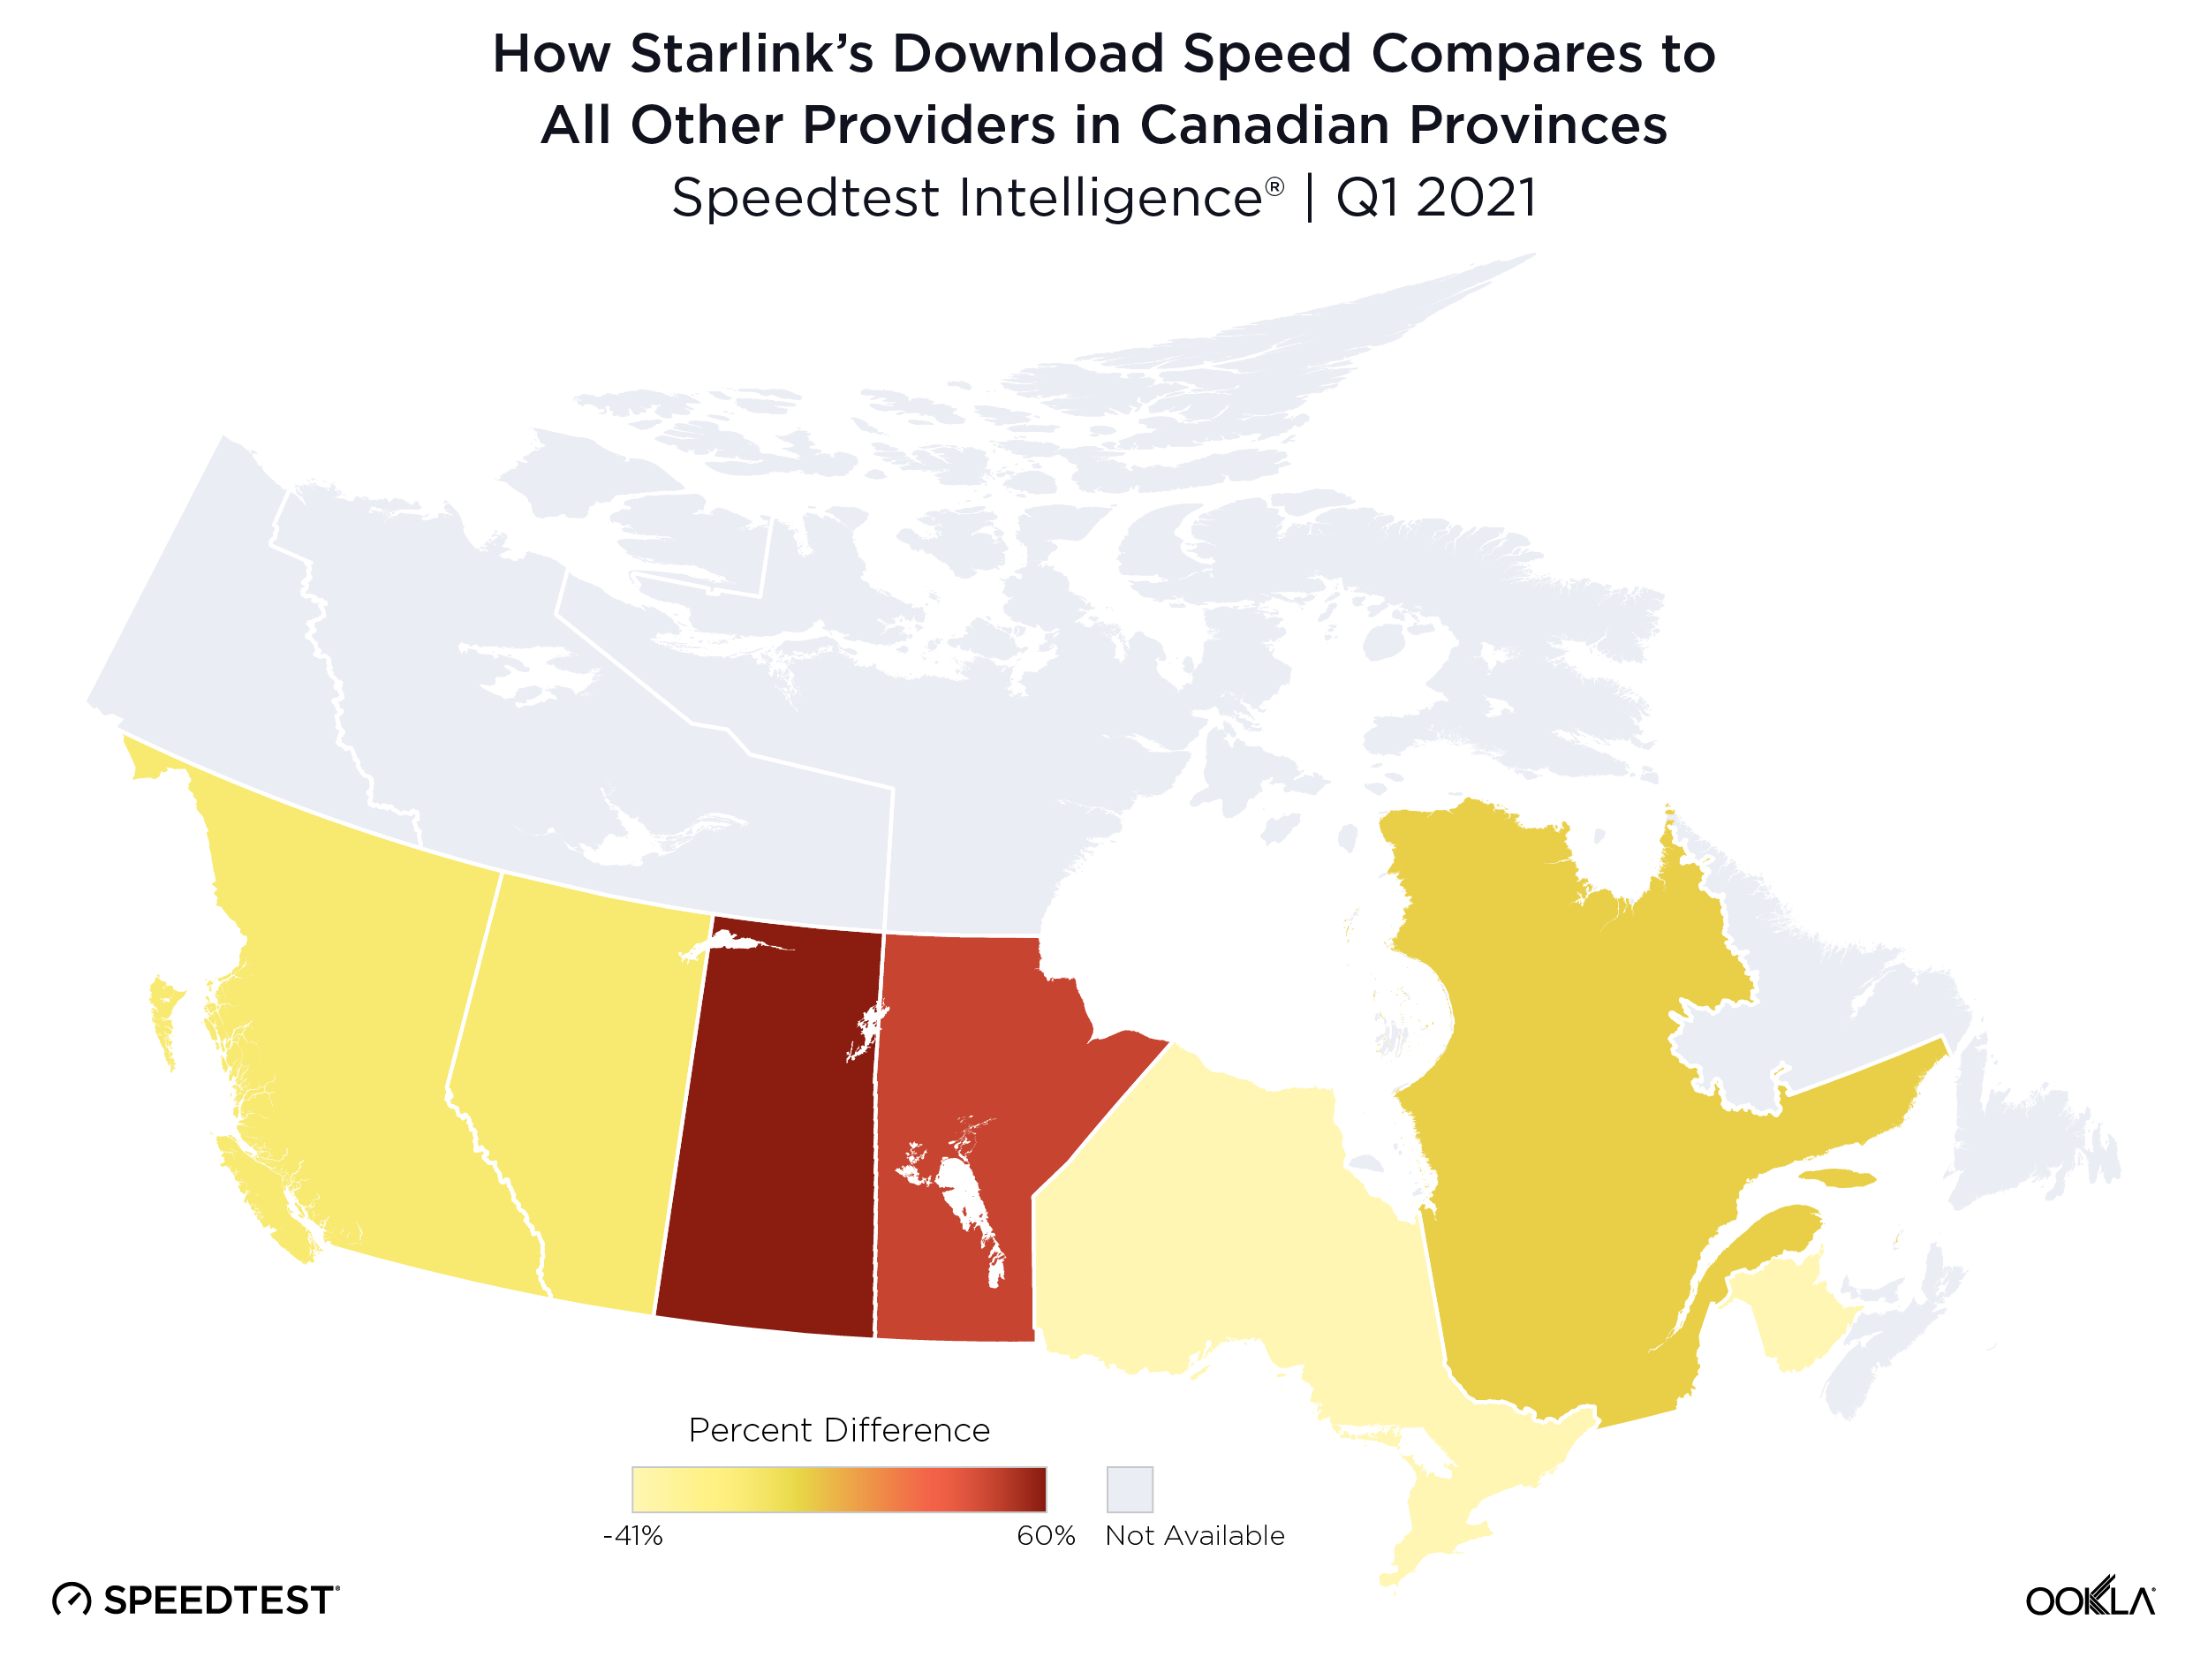
Starlink shows a narrower range of performance in Canada
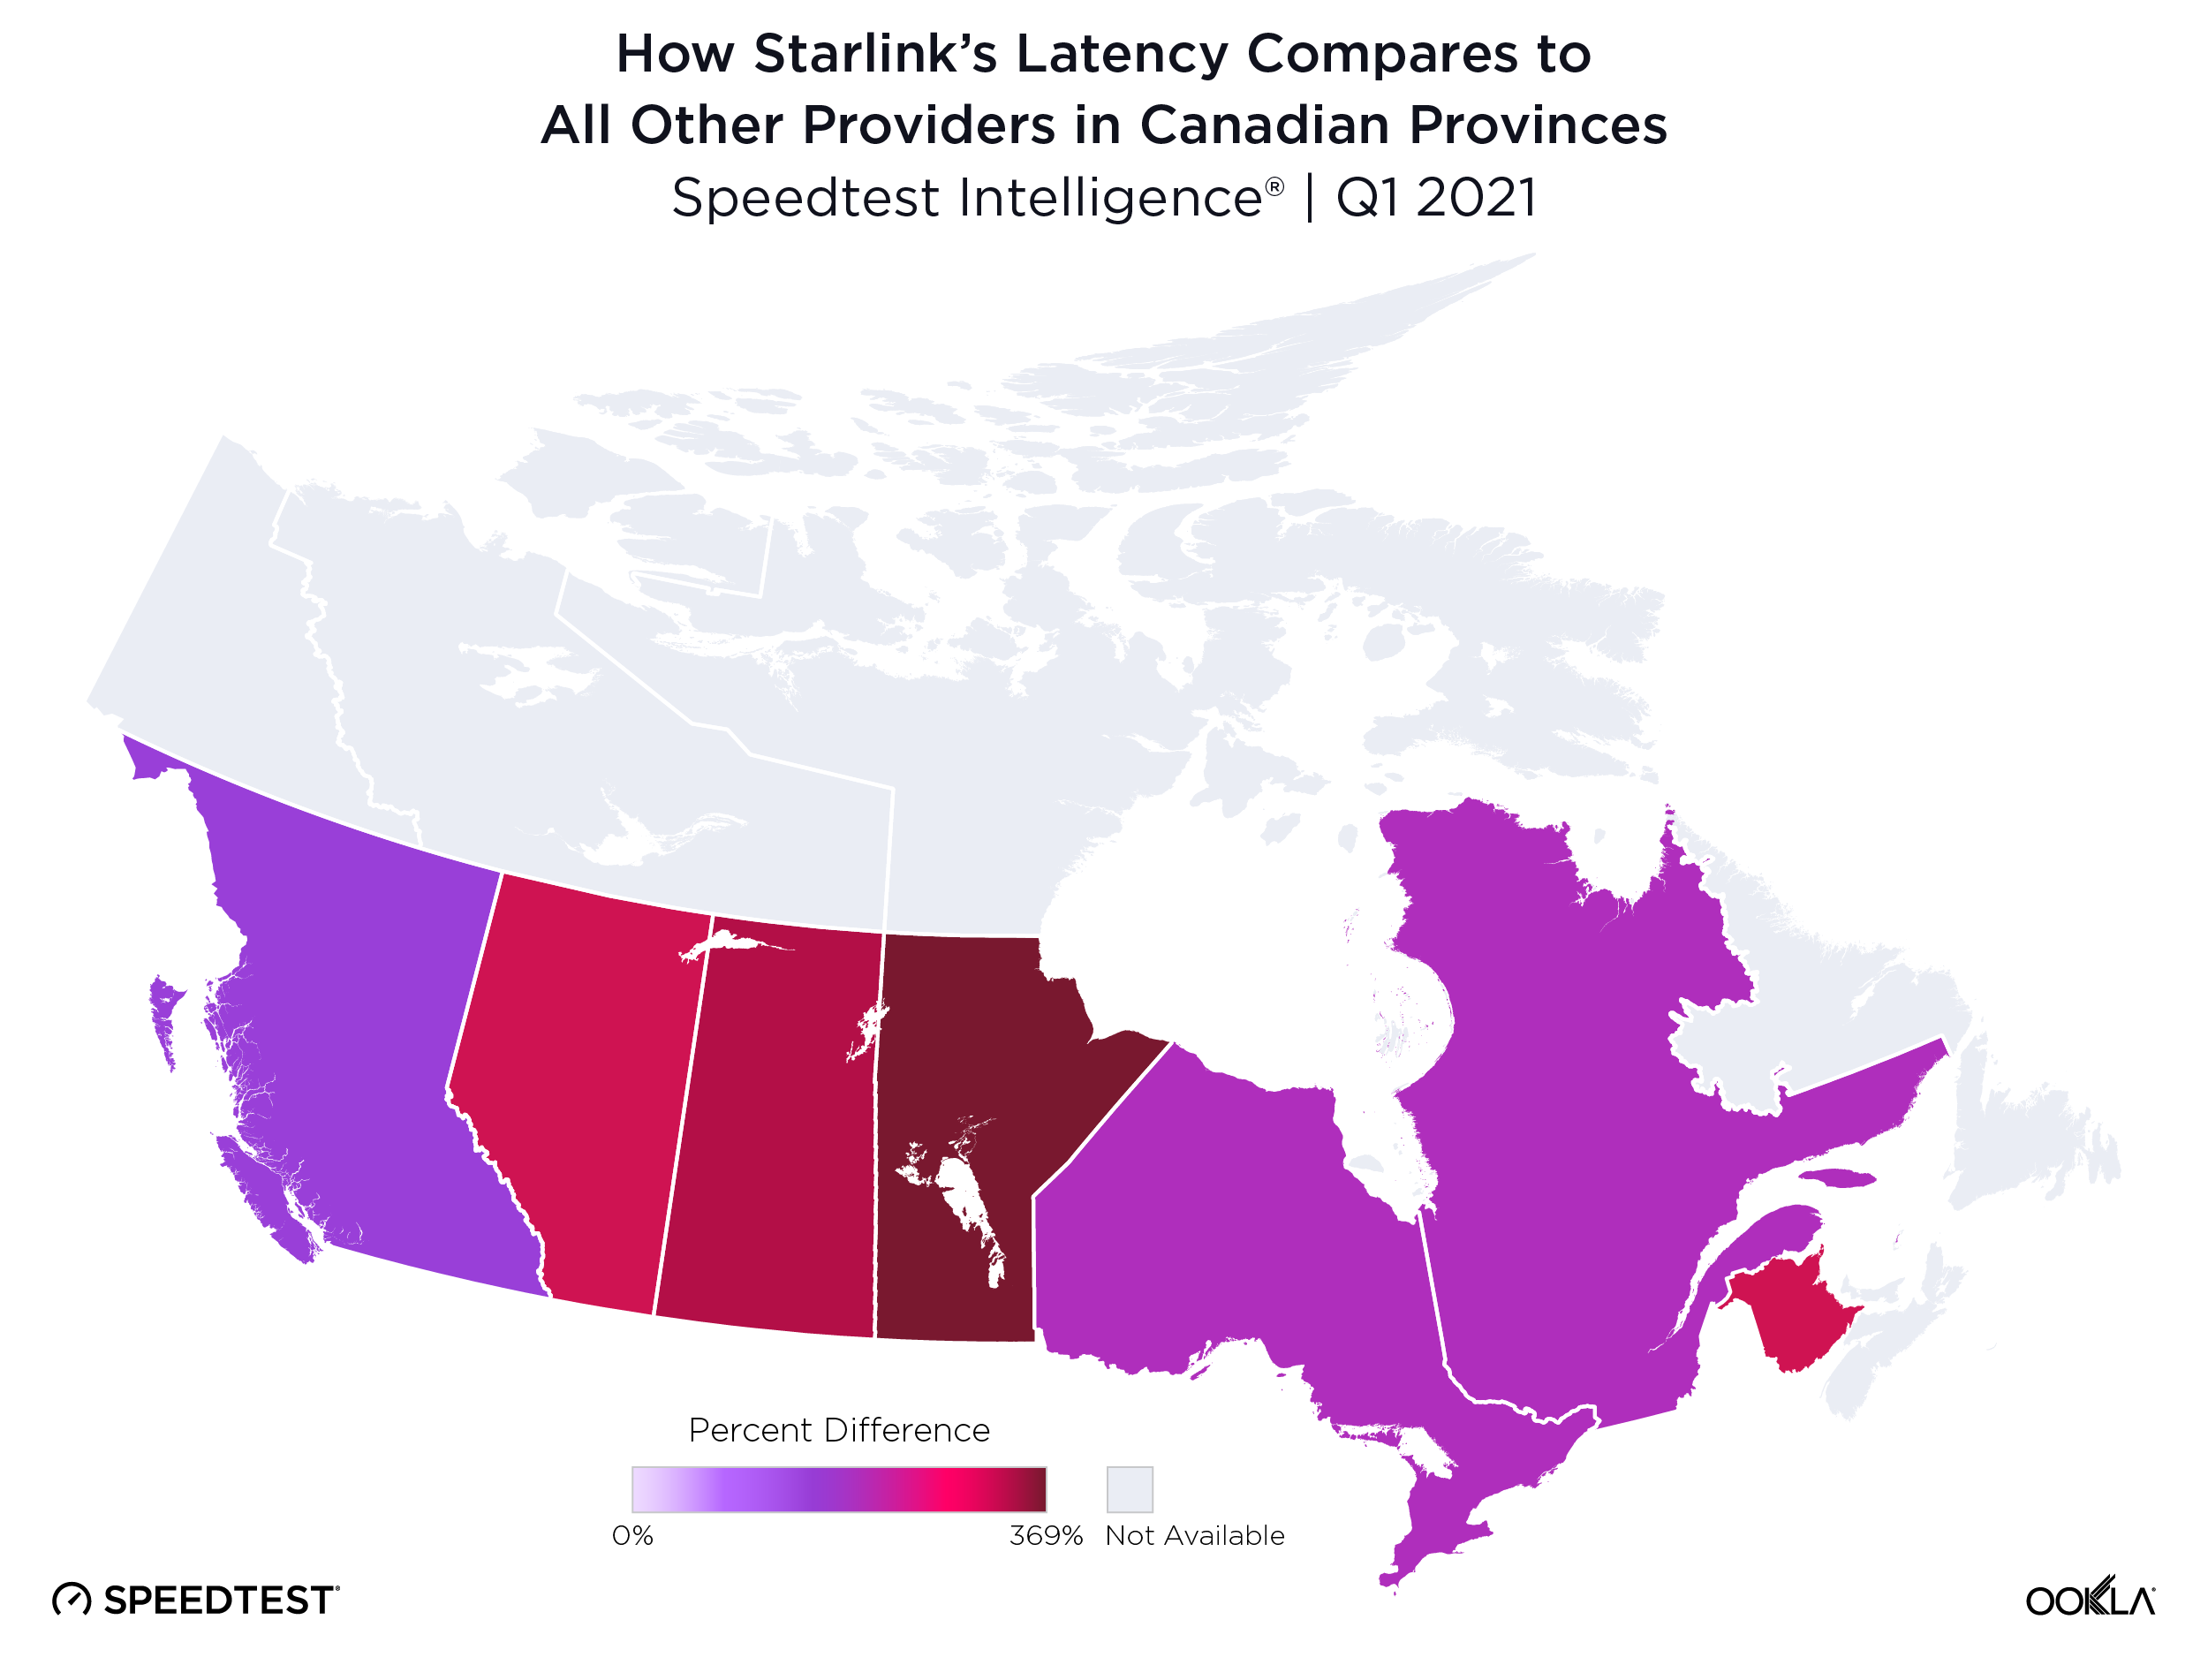
Starlink’s Q1 2021 median download speeds in Canadian provinces showed a smaller range than in the U.S. with a low of 53.61 Mbps in Ontario and a high of 80.57 Mbps in Saskatchewan. Percentage difference when compared to all other fixed broadband providers also showed a narrower range. In Saskatchewan and Manitoba, Starlink customers reported median download speeds 59.6% and 38.5% faster than those for all other fixed broadband providers combined. In Québec, median download speeds were nearly equal, with Starlink performing only 3.4% slower. In B.C., Alberta, Ontario and New Brunswick, on the other hand, Starlink’s median download speeds were 20.9%, 24.2%, 29.5% and 40.7% slower than other fixed broadband providers, respectively.
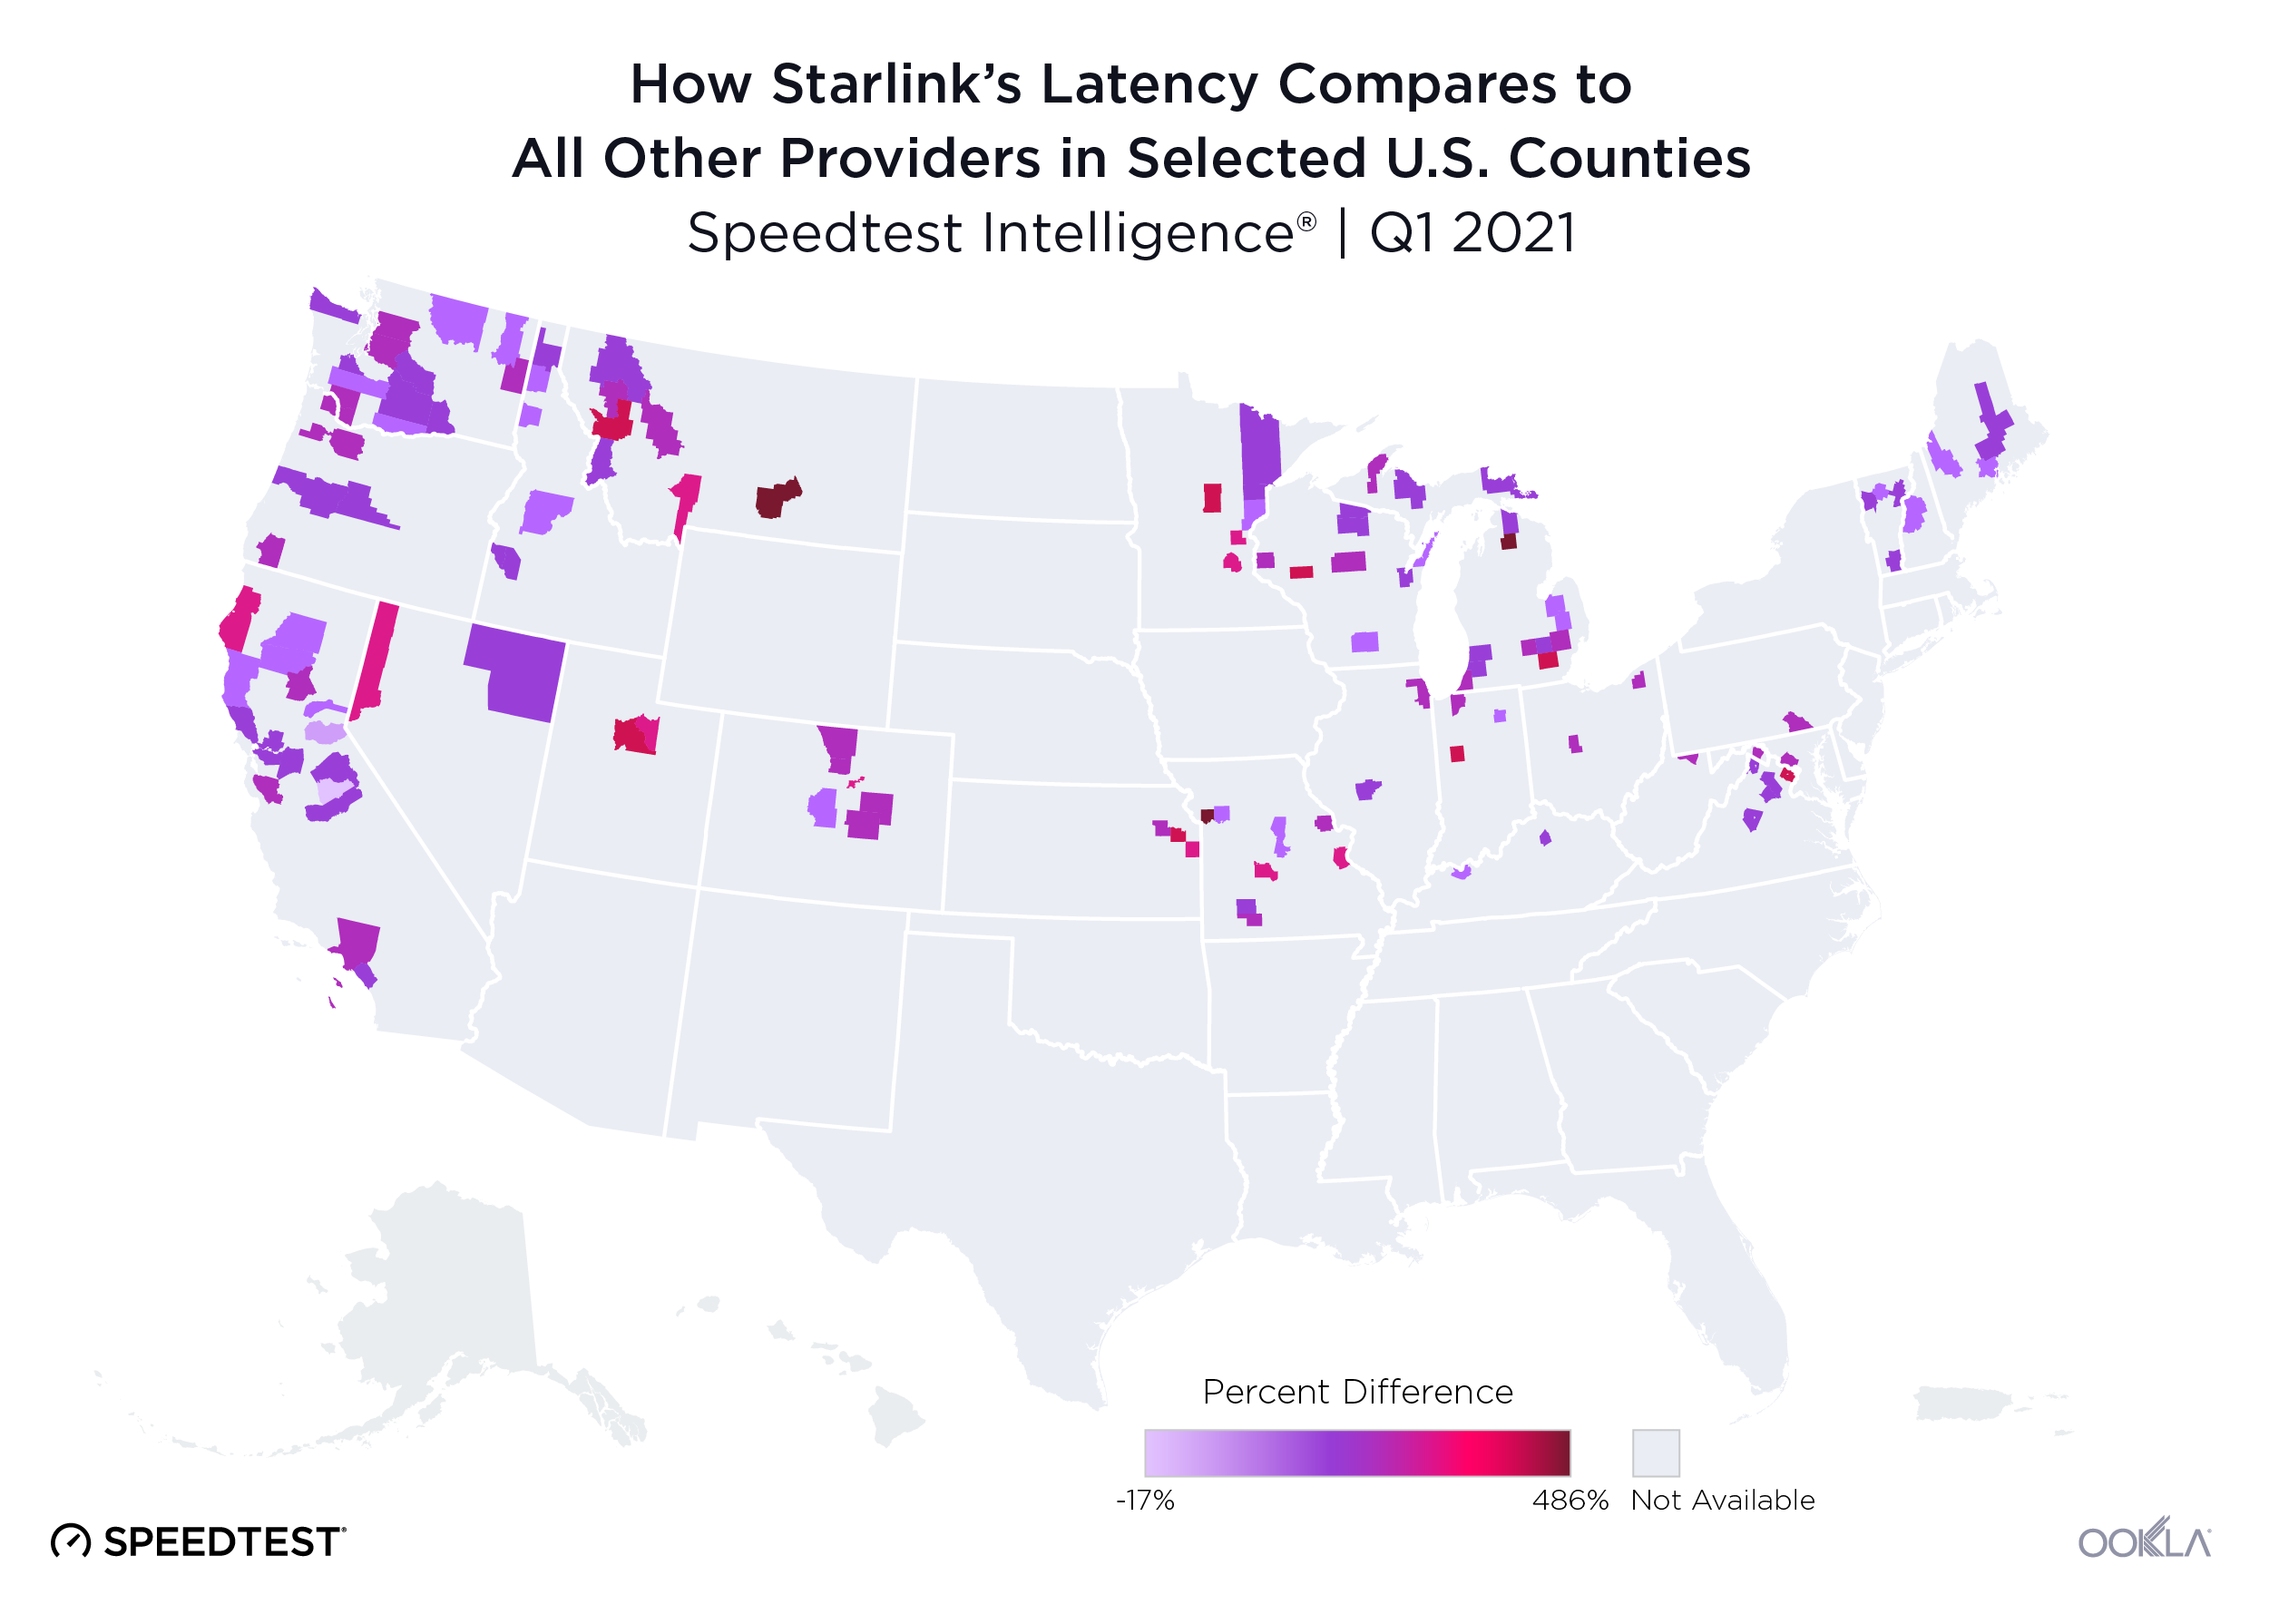
Starlink latency is up to 486% higher in U.S., 369% in Canada
A reasonable latency is critical to effective internet use. If your latency is too high, you might be the one on the video call with the tinny voice who’s answering questions when the conversation’s already moved on. If you’re a gamer, you already know that latency can cause your characters to stutter-step around at critical moments. Starlink plans to use low-Earth orbit satellites with laser links to radically decrease latency in rural areas. What we’re seeing so far, though, is that Starlink’s latency is higher than the alternatives, often much higher.
Starlink’s latency was higher in all but one of the U.S. counties surveyed during Q1 2021. The exception was Mariposa County, California where Starlink’s latency was 17.4% lower than that of all other providers combined. Median latency values on Starlink were observed from 31 ms (Kittitas County, Washington) all the way up to 88 ms (Otsego County, Michigan). For comparison, median latency values for all other providers combined ranged from 8 ms (Fairfax County, Virginia) to 47 ms (Daviess County, Kentucky).
In Canada, Starlink’s latency was higher in all provinces surveyed during Q1 2021. With median latency values from 34 ms (B.C.) to 61 ms (Saskatchewan), Starlink’s latency was 209.1% to 369.2% higher than that of all other providers combined.
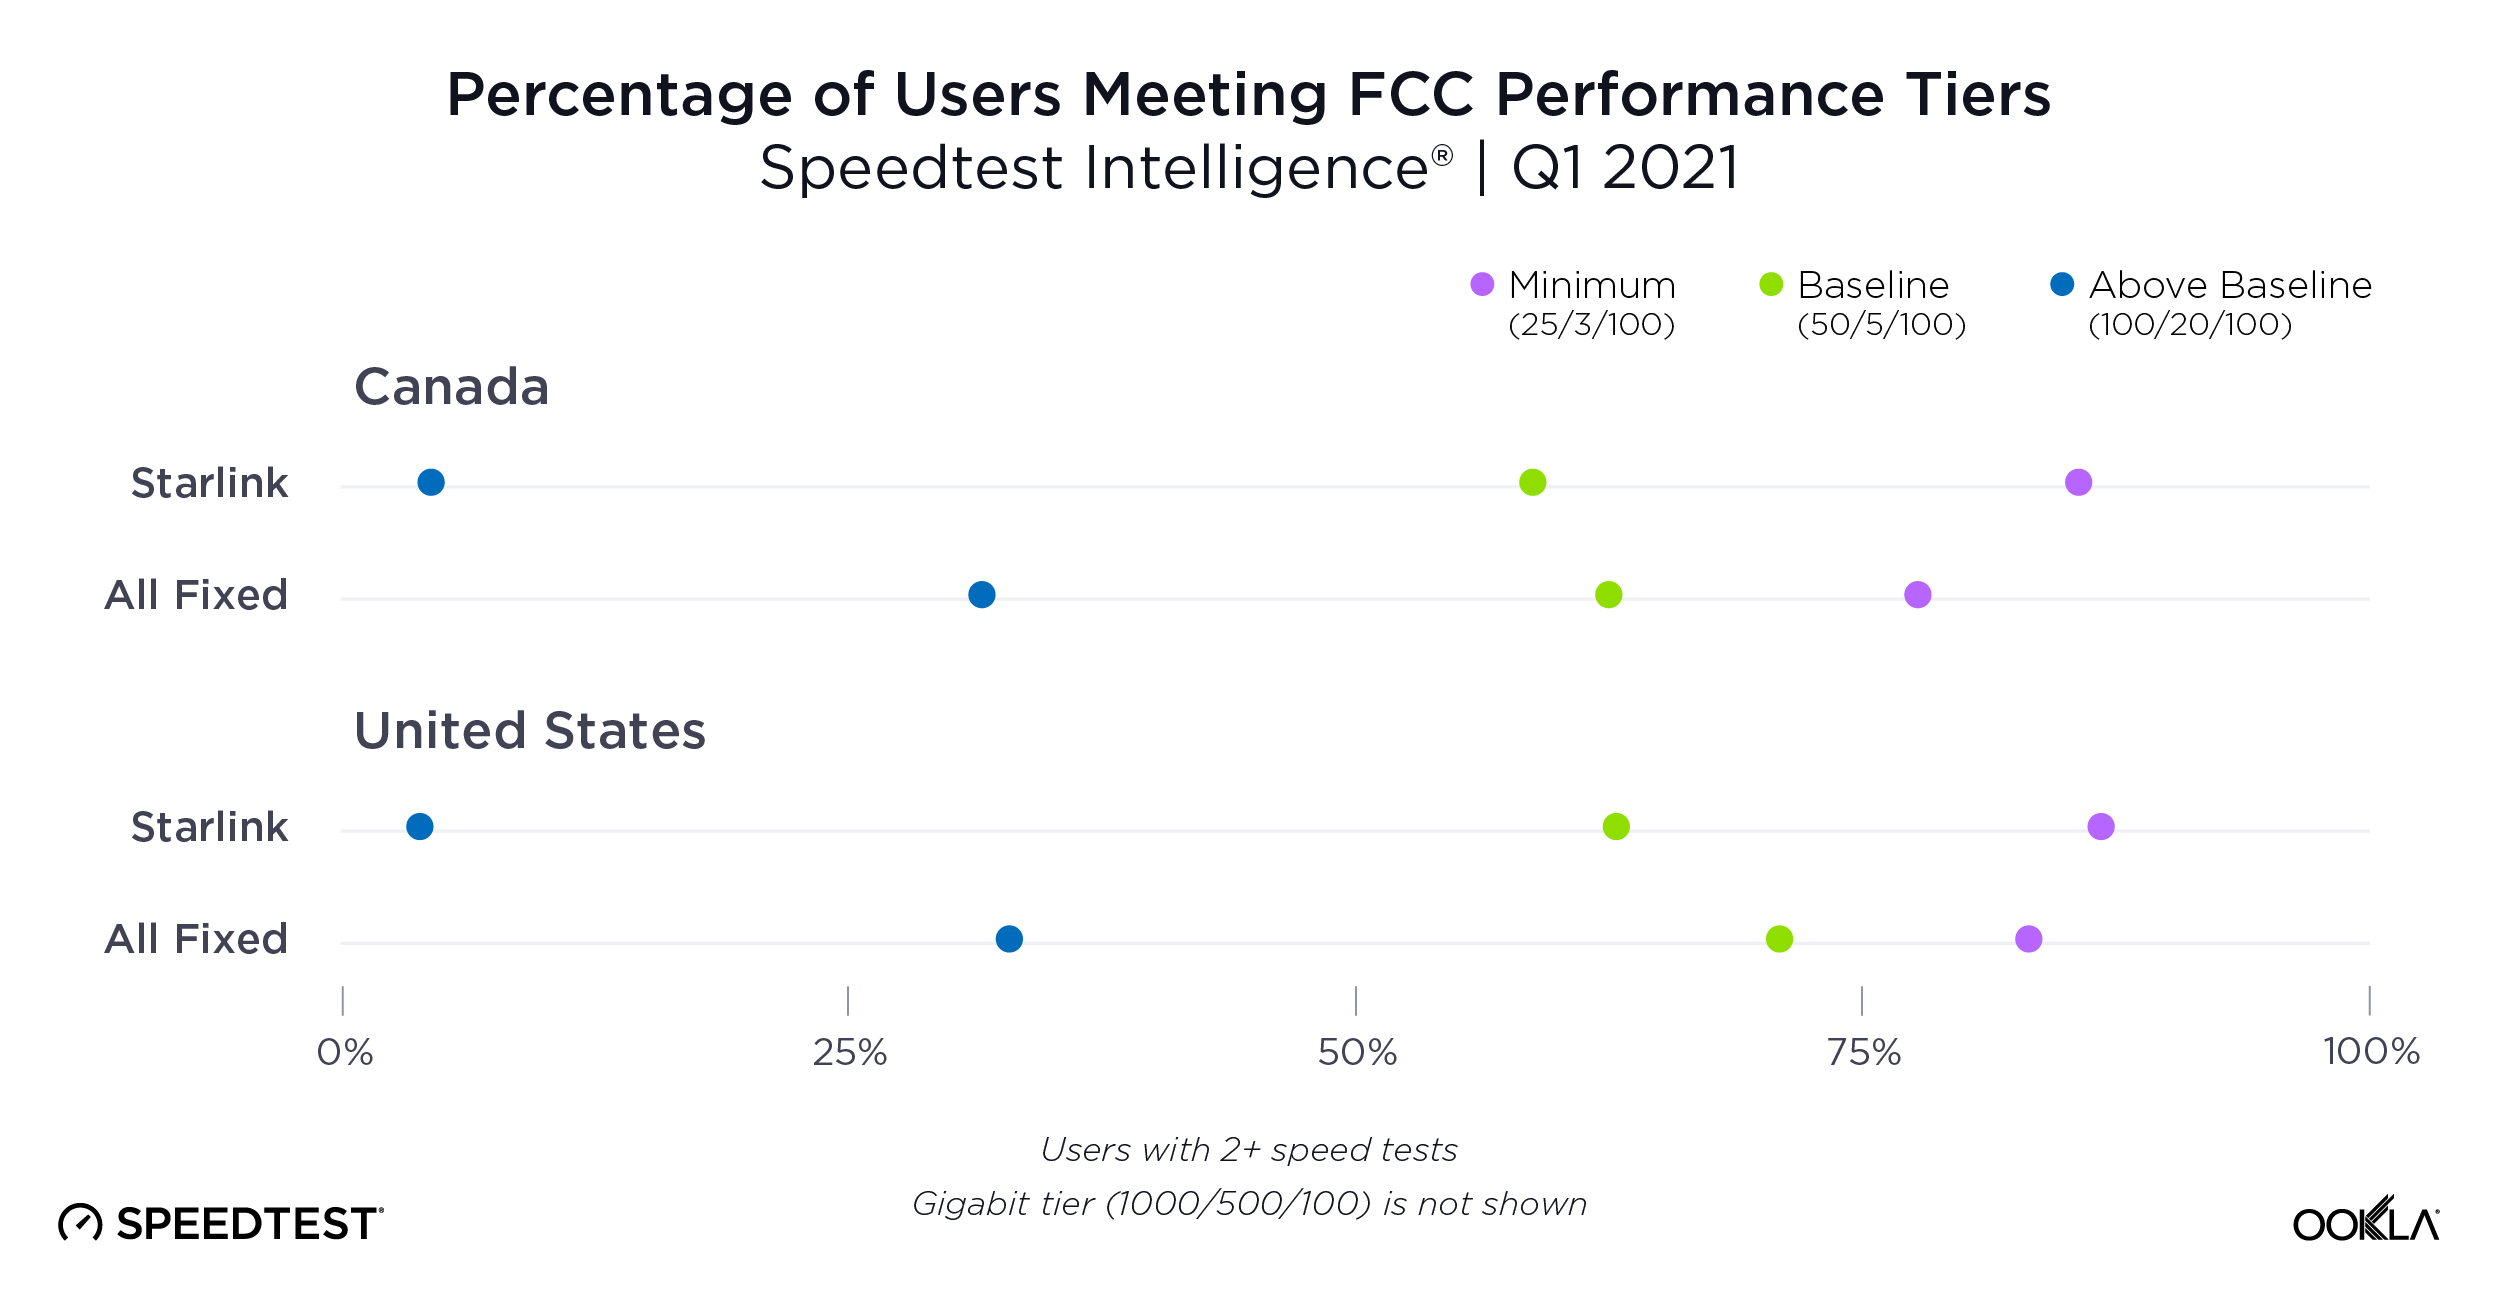
Starlink meets minimum tier for FCC’s Rural Development Opportunity Fund
In order to compete for the FCC’s Rural Digital Opportunity Fund (RDOF), providers must meet the minimum performance tier (25 Mbps download / 3 Mbps upload / 100 ms latency). We analyzed Speedtest® results for users with more than two tests during Q1 2021 to see whether Starlink could potentially qualify for this funding.
In both the U.S. and Canada, Starlink provided competitive or better service at the minimum (25/3/100) tier. In the U.S., 86.7% of Starlink users met this threshold, compared with 83.2% of those on all other fixed broadband providers. Although the FCC’s criteria don’t apply north of the border, 85.6% of Canadian Starlink users met the Minimum threshold, compared with 77.8% for all other providers. Starlink showed a smaller proportion of users meeting the baseline and above baseline tiers than all other providers combined.
Given this data, it’s safe to say Starlink could be a cost-effective solution that dramatically improves rural broadband access without having to lay thousands of miles of fiber.
Musk’s Starlink experiment is certainly fascinating and we applaud any effort to get better service for rural residents. That said, it’s clearly early days for the rapidly growing Starlink, and results from Q1 may not be indicative of future performance. We’ll be watching to see how performance improves as more satellites are launched and as more users join the service. If you’re on Starlink, take a Speedtest to share how your connection is performing.
Editor’s note: this article was updated on May 17 with a sentence clarifying how this data should be interpreted.
Ookla retains ownership of this article including all of the intellectual property rights, data, content graphs and analysis. This article may not be quoted, reproduced, distributed or published for any commercial purpose without prior consent. Members of the press and others using the findings in this article for non-commercial purposes are welcome to publicly share and link to report information with attribution to Ookla.
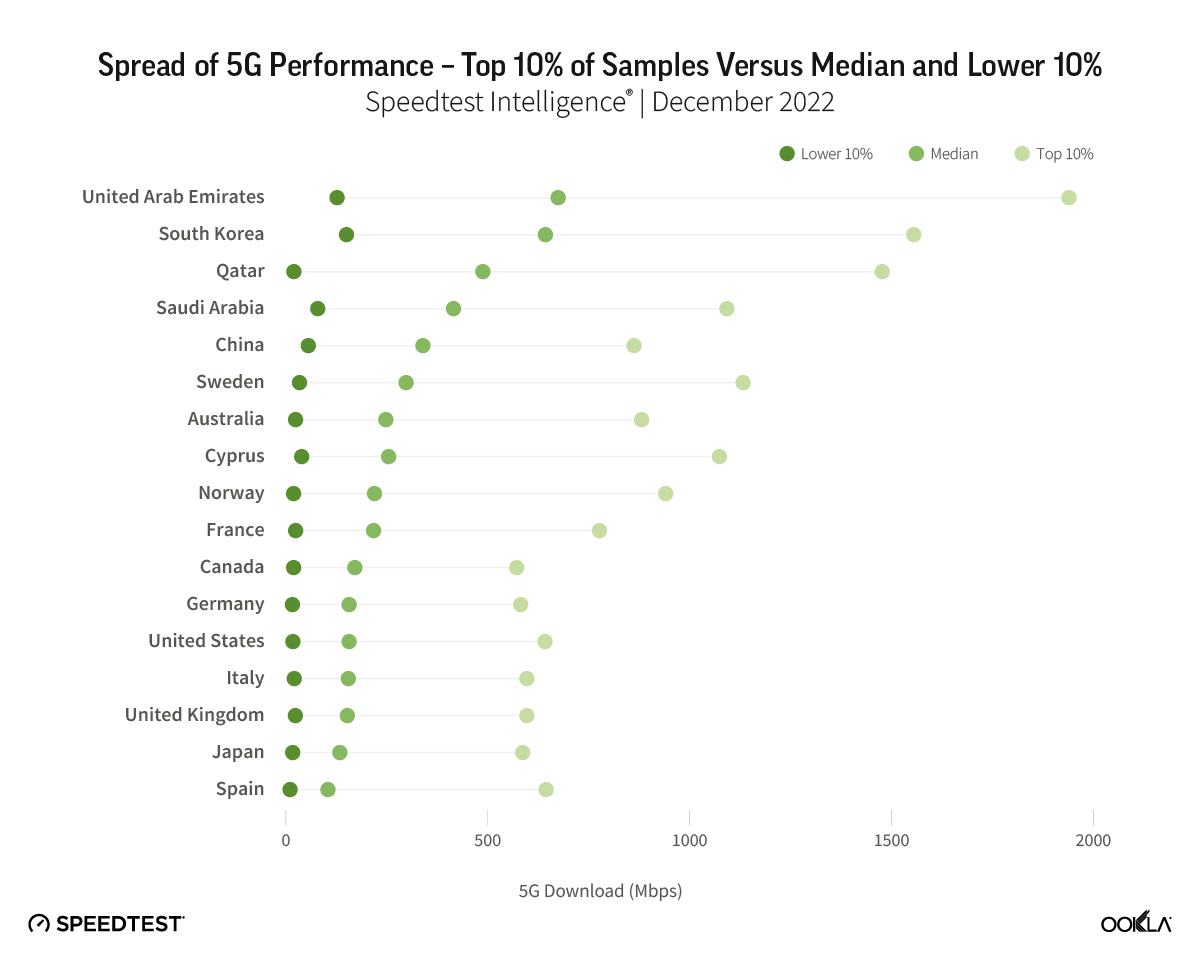
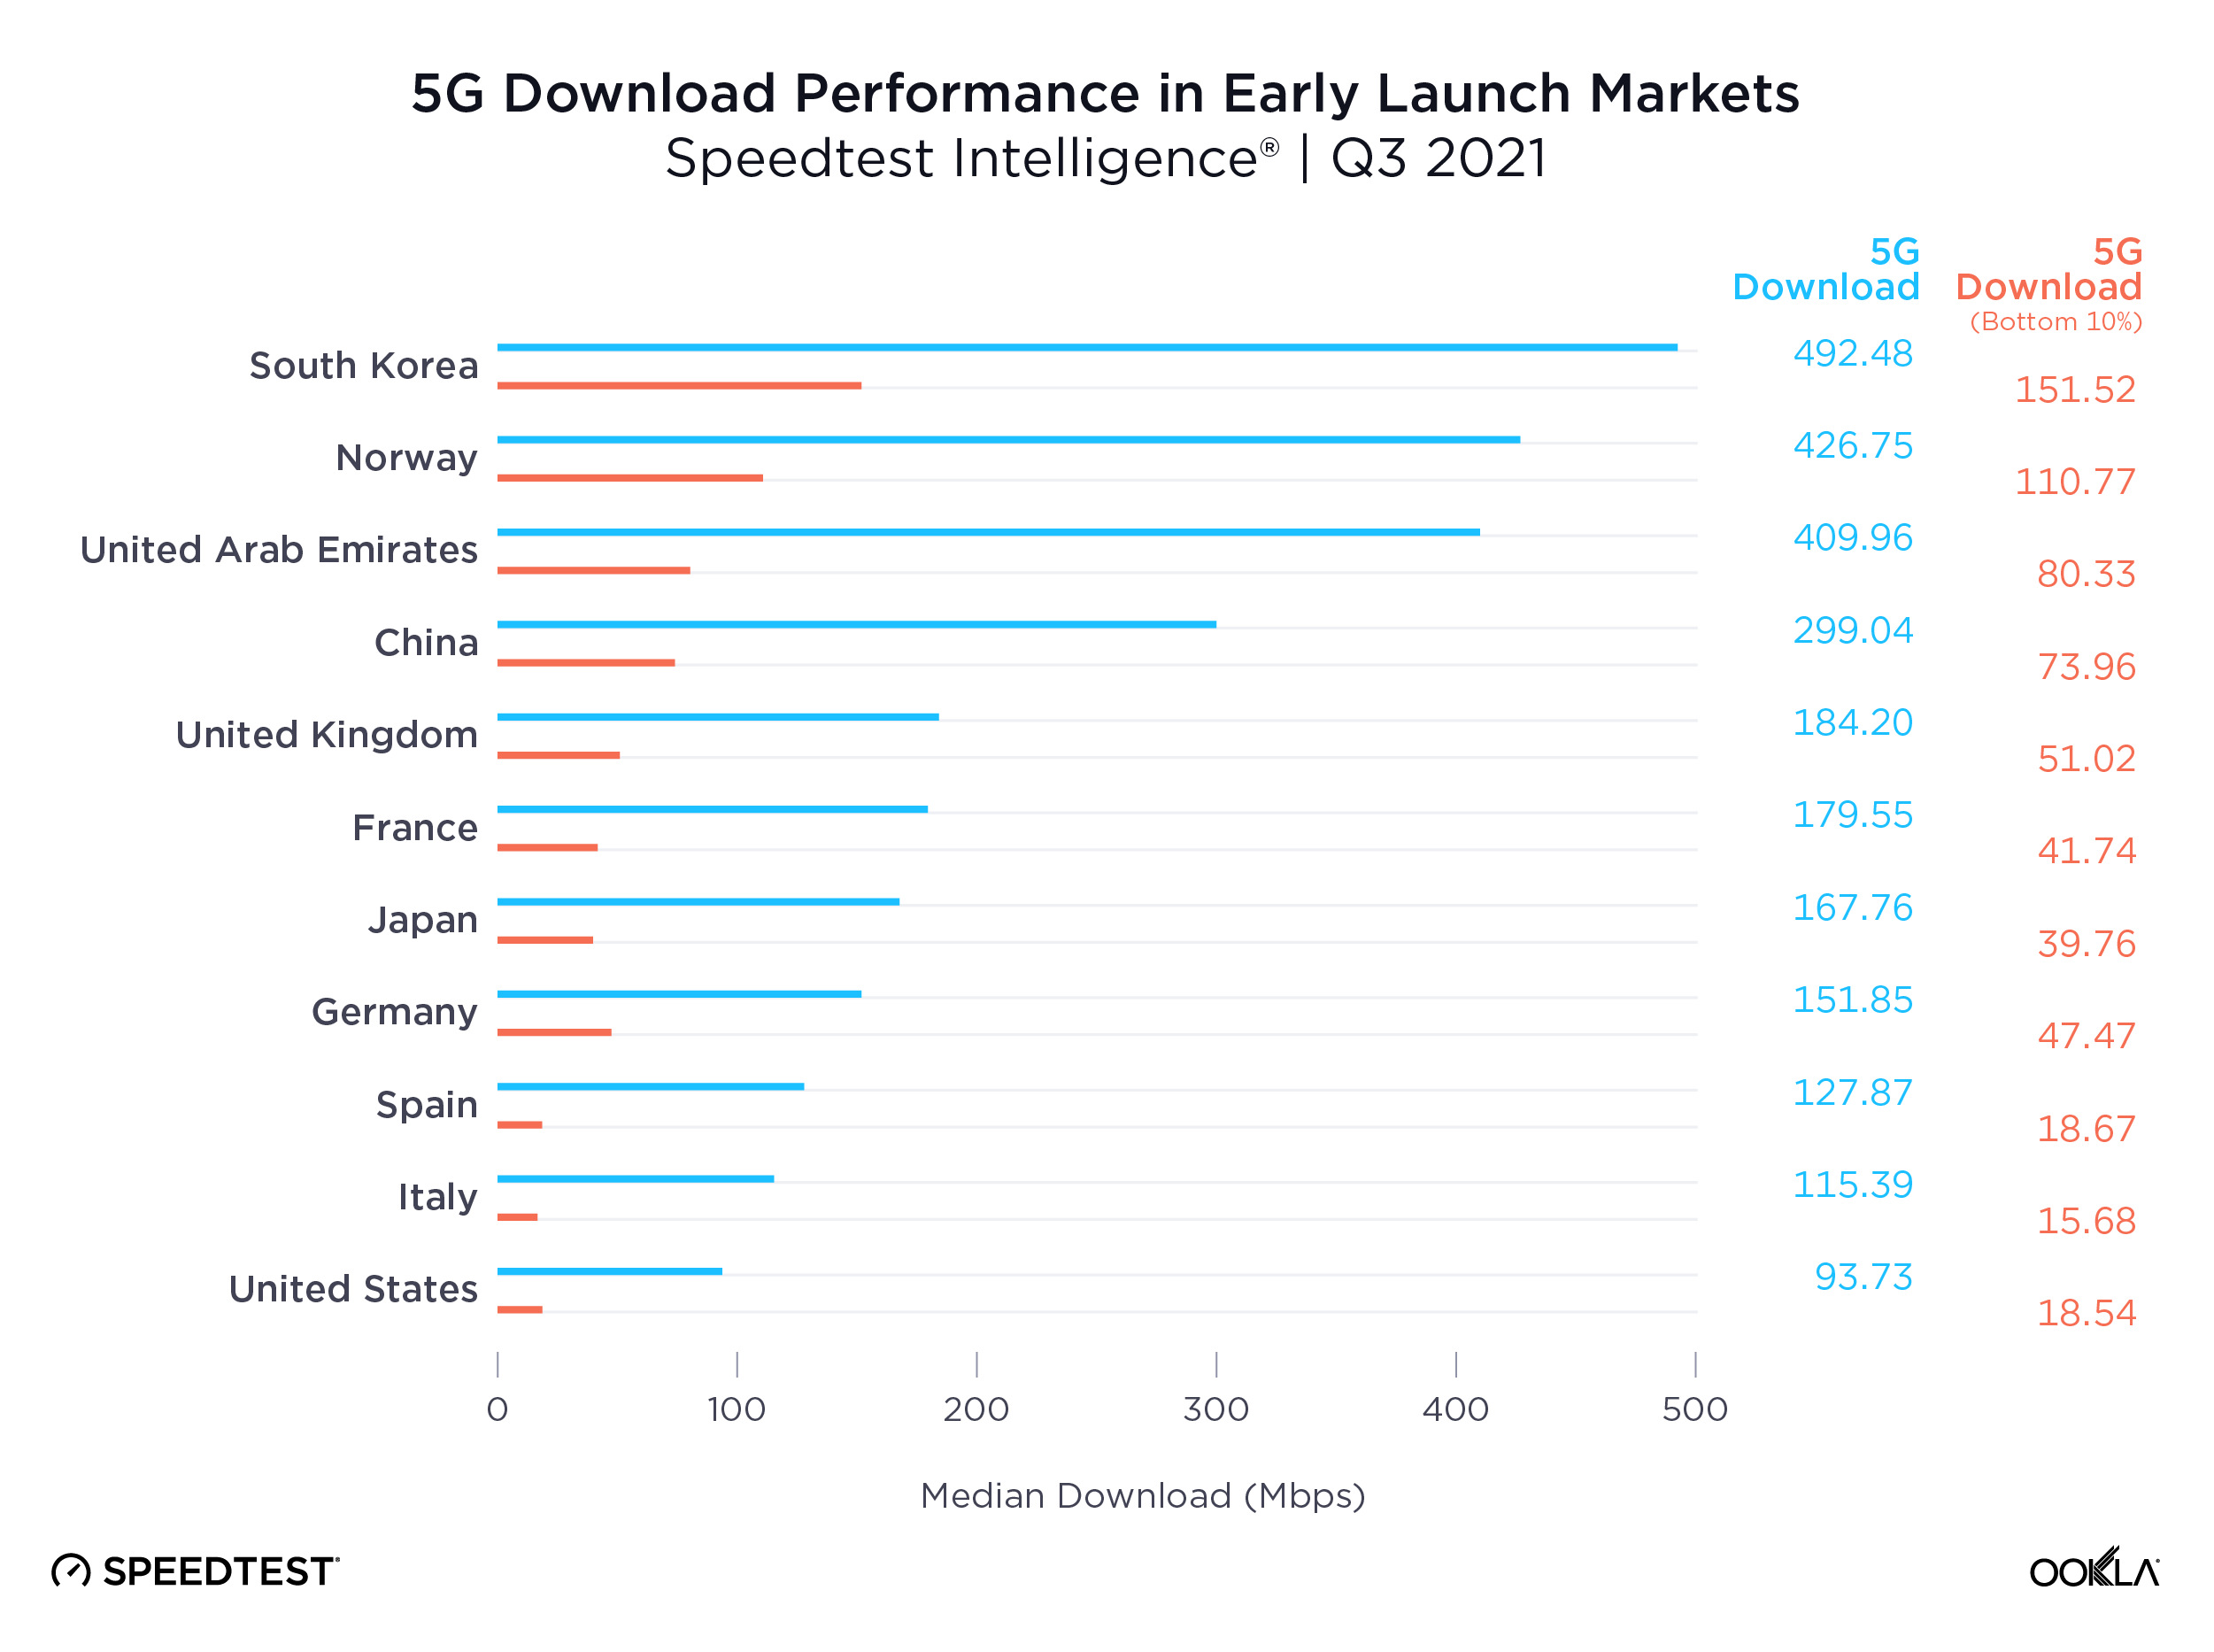
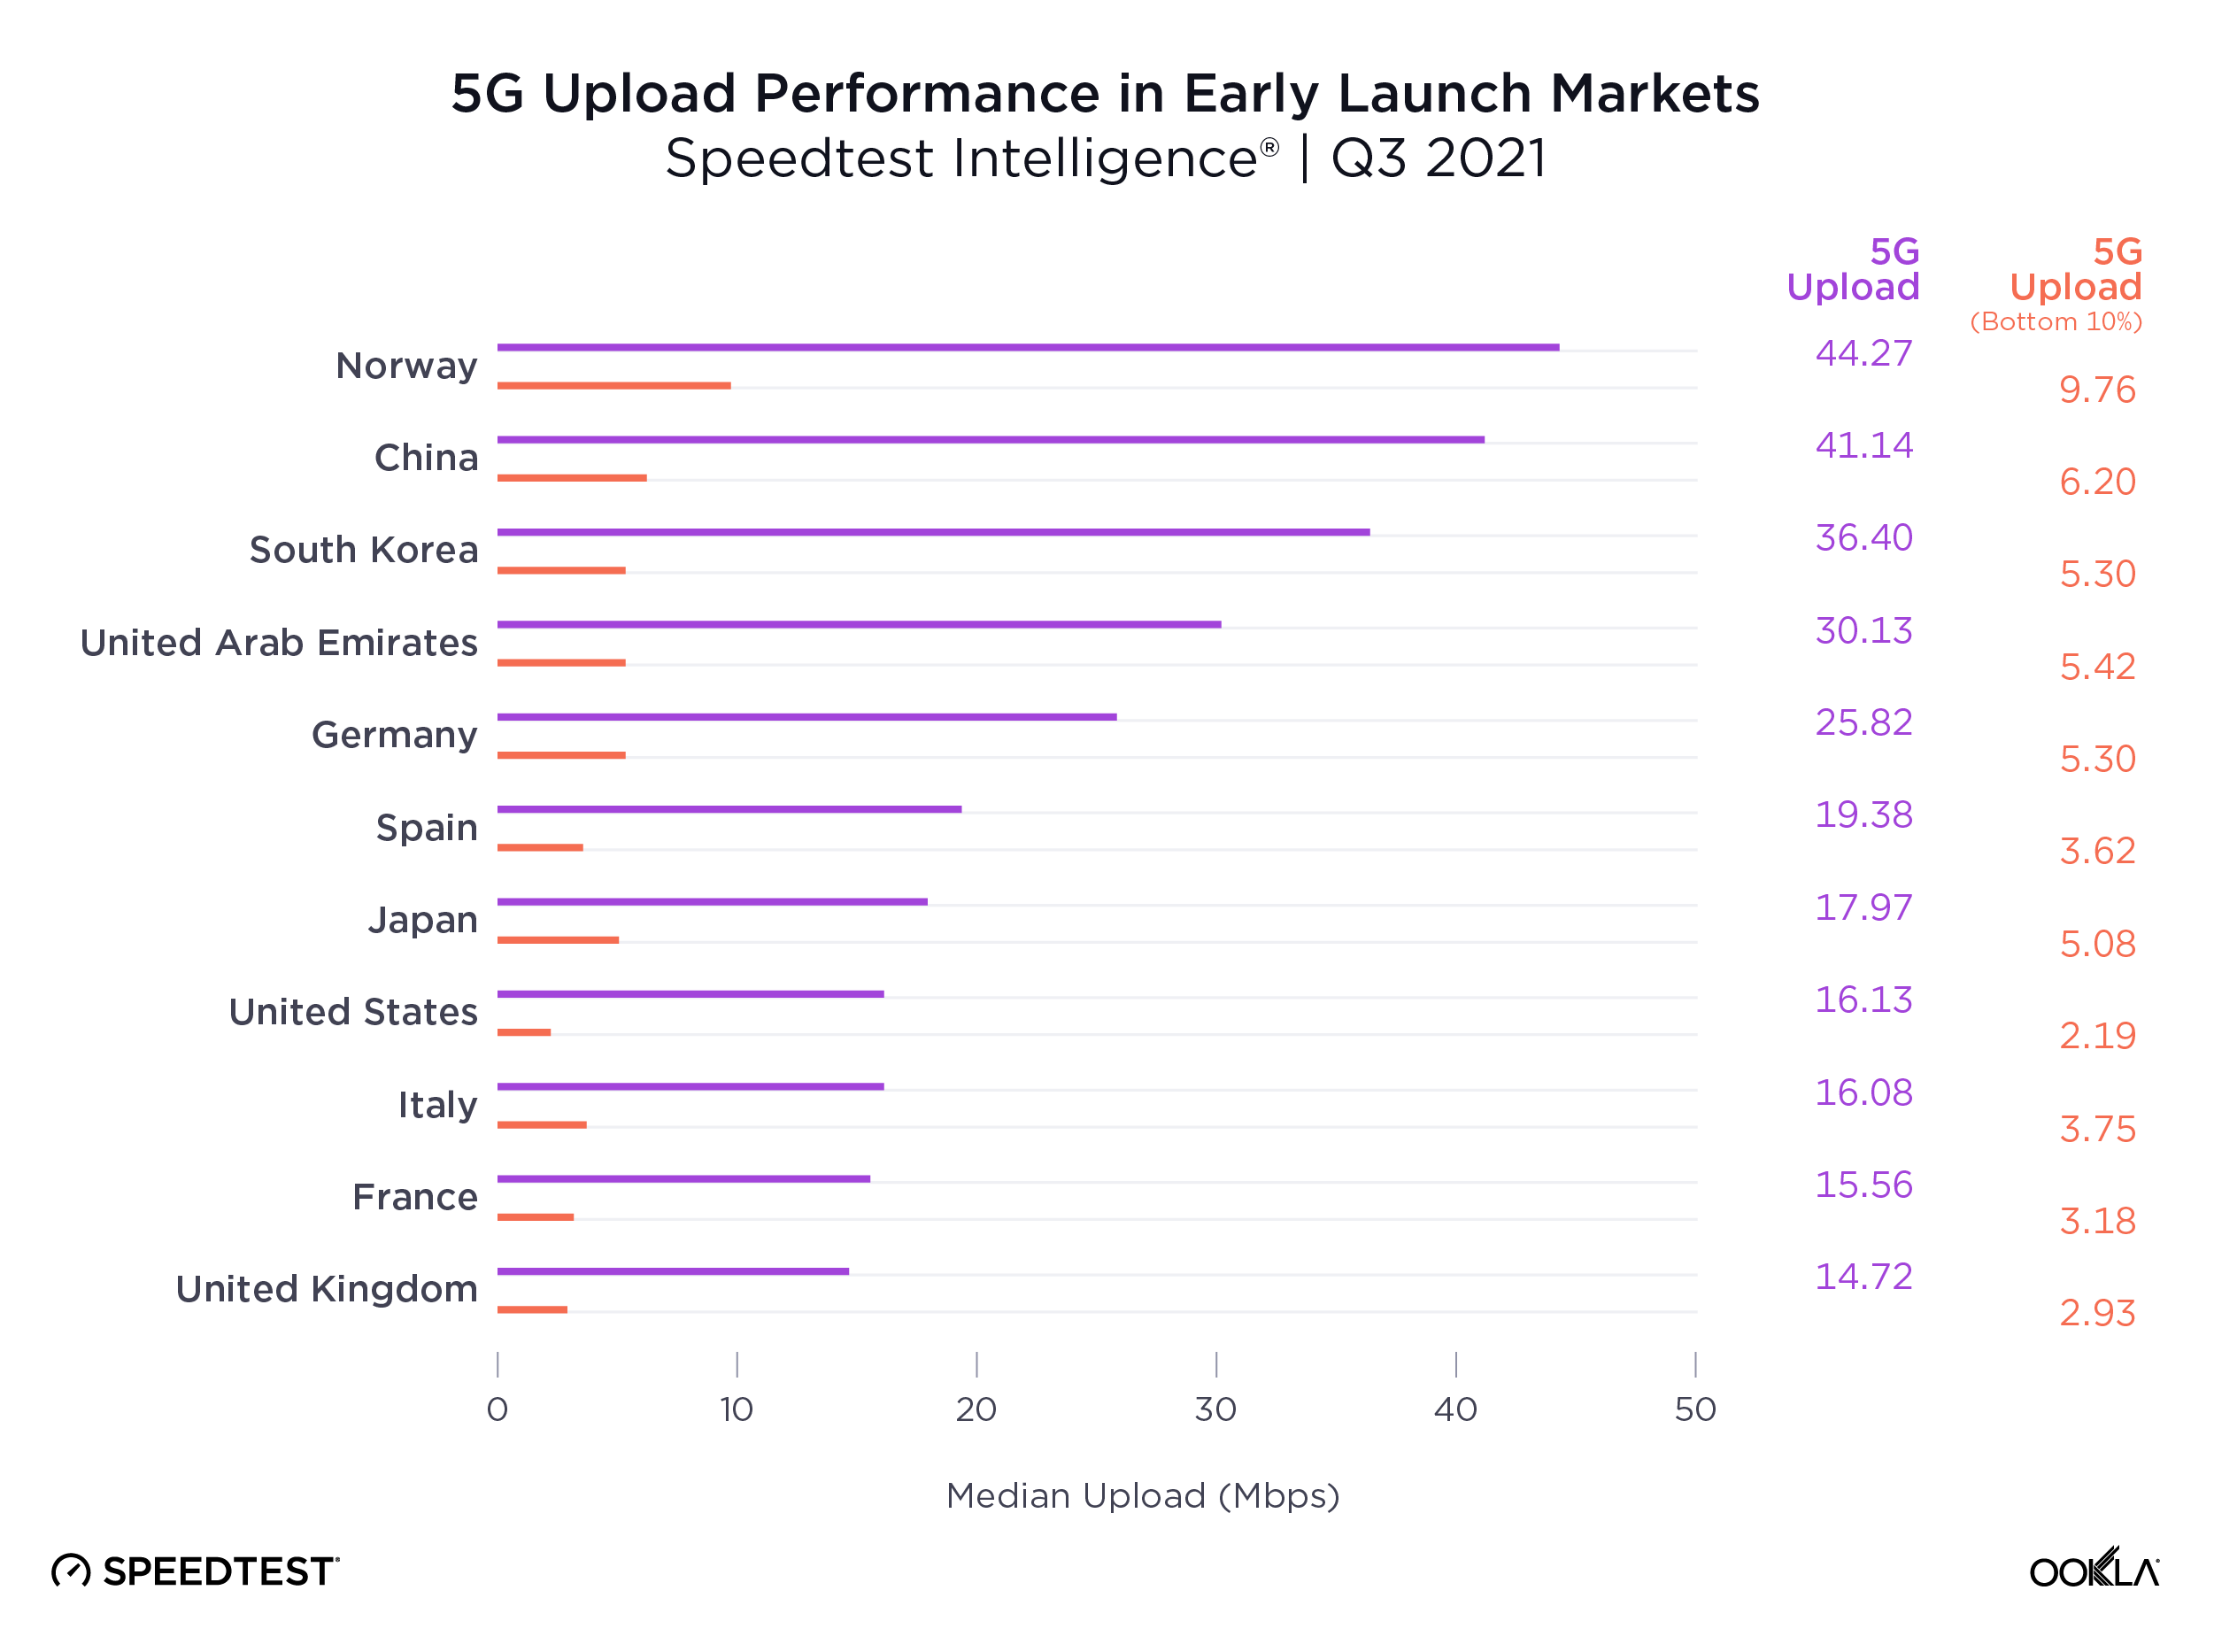
In-market 5G performance varies widely. Reviewing the top 10% and worst 10% of Ookla® Speedtest Intelligence® samples reveals significant variance in the consumer experience on today’s 5G networks, with 5G speeds peaking at over 1 Gbps for the top 10% of users in the U.A.E on average, but falling to below 20 Mbps for the lower 10% in Norway, the U.S., Japan, Germany, and Spain.
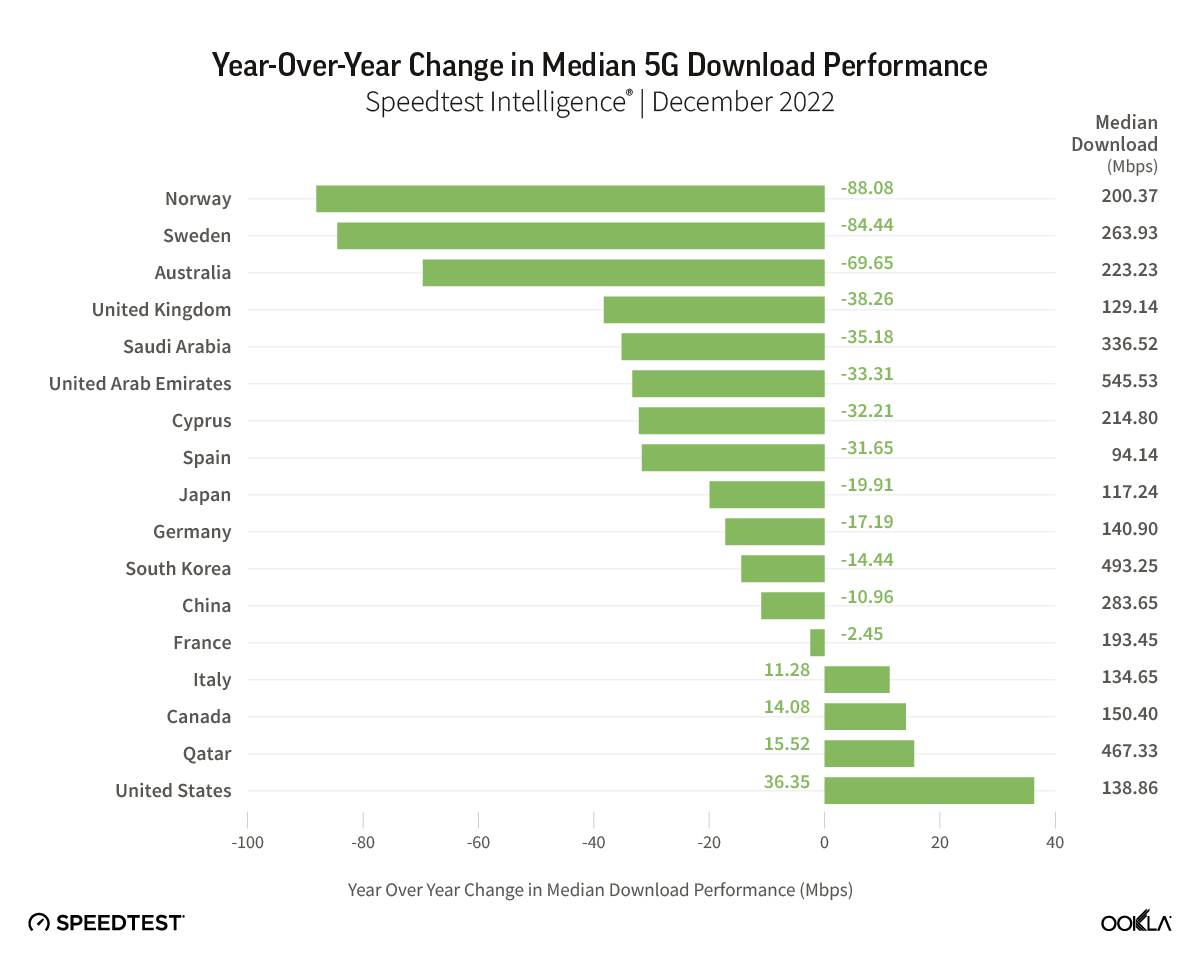
Median 5G performance is declining in many early launch 5G markets. While understandable as 5G adoption grows and users in more remote locations access 5G, declining median download speeds also point to investment and deployment challenges in some markets. At the same time, many of these markets are facing economic headwinds, placing more emphasis than ever on cost control. As a result, operators must carefully balance network investment priorities.
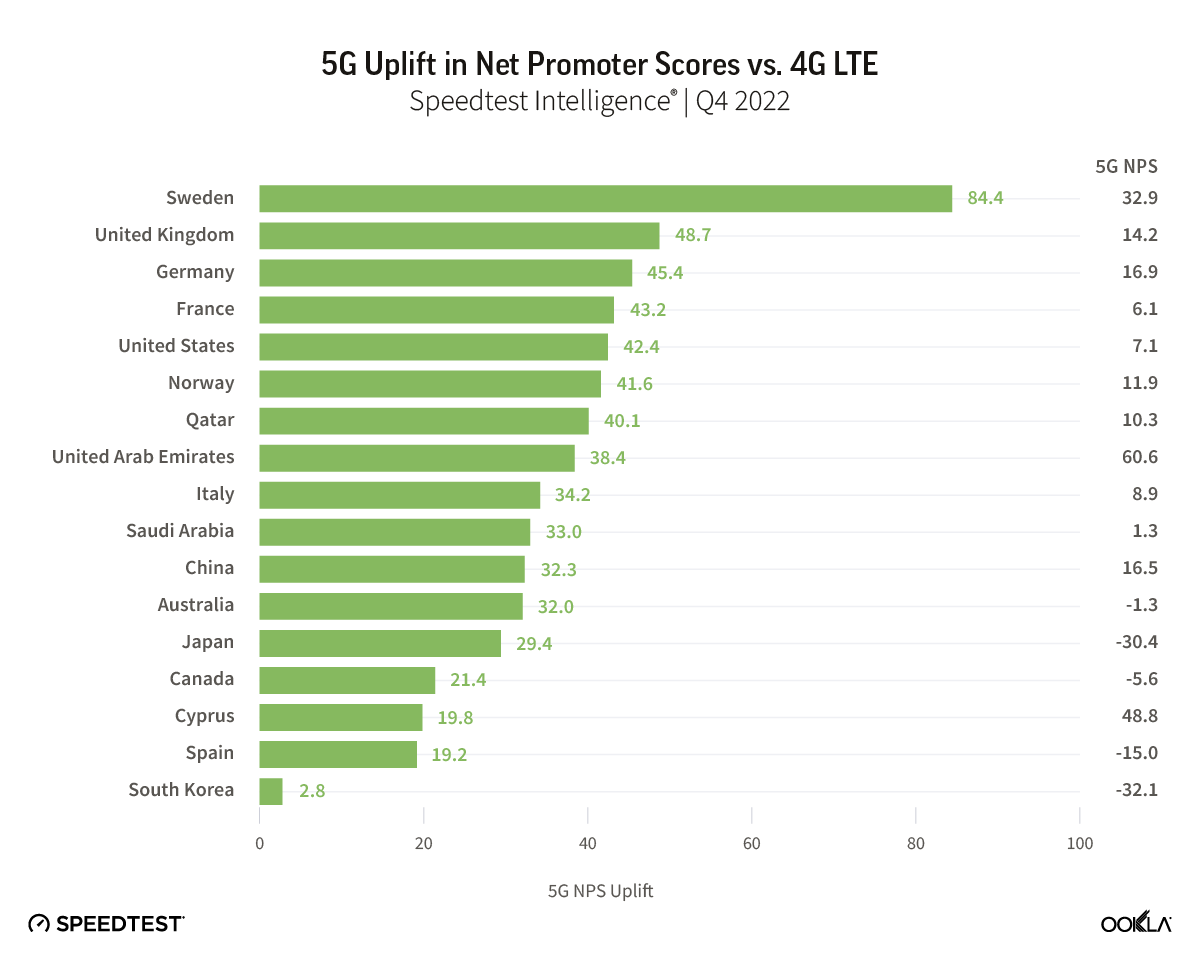
5G Net Promoter Scores (NPS) significantly higher than 4G LTE in most markets, but waning. With the exception of Sweden and Qatar, all the early launch 5G markets in our analysis saw 5G NPS fall year-over-year. Operators’ 5G NPS still trade at a premium compared to 4G, and while performance is just one part of the equation, operators should take care to build on the positive sentiment that 5G has brought to date.
Despite impressive headline speeds, 5G performance varies a lot
Median 5G performance allows us to gauge the midpoint of user experience on 5G networks, however it doesn’t paint the full picture. While headline 5G speeds impress, Speedtest Intelligence data lays bare the ups and downs of 5G performance for consumers, even in early launch, advanced 5G markets. We recently looked at 5G network performance over high frequency (mmW) bands, painting a view of the true potential of 5G networks. However, if we look at performance on today’s 5G networks, looking beyond the median at the range of performance between users in the top 10% and those in the lower 10%, Speedtest Intelligence data reveals huge variance in the performance users experience.
The U.A.E. was the fastest 5G market in our analysis, based on median download performance of 545.53 Mbps in December 2022, followed by South Korea and Qatar. However, the top 10% of users in the U.A.E. recorded speeds of at least 1,266.49 Mbps on average, while the lowest 10% of users experienced speeds of 127.52 Mbps or slower on average. At the other end of the scale, Spain recorded a median 5G speed of 94.14 Mbps, but also demonstrated wide variance between the top 10% of samples at 537.95 Mbps or faster and the lowest 10% with 10.67 Mbps or less.
Based on many of the marketing messages around 5G, consumers are led to expect a big bang change in performance. However, with 5G operating over a greater range of spectrum bands than previous generations, including high frequency spectrum which has relatively poorer propagation, it’s understandable that 5G performance will vary more than previous generations of mobile network technology.
5G markets set to face performance challenges during 2023
While globally 5G speeds have remained stable, for many of the markets in our analysis, median 5G download speeds have fallen over the past year. The U.S. was the main outlier, recording the strongest uplift in 5G performance as T-Mobile continued to drive home its performance advantage in the market, while Verizon’s performance improved early in 2022 through its deployment of 5G in C-band spectrum. This trend is likely to continue in 2023 in the U.S., as more C-band spectrum is made available. However, the picture remains concerning for a number of other 5G markets, particularly those where median 5G speeds are at the lower end of the spectrum.
In some markets, 5G was initially priced at a premium to 4G, with operators focused on driving incremental returns on the new network technology. However, operators have been increasingly opening up 5G access by removing incremental costs for consumers and adding prepaid plans too. As 5G adoption scales, it places more strain on the new networks. The challenge for many of these markets is that network performance is likely to degrade further unless network densification picks up.
For network operators, this investment imperative is occuring amidst macroeconomic headwinds, which are driving up operating costs and putting pressure on consumer and enterprise spend. In addition, there remain challenges in deploying additional 5G cell sites in dense urban areas where demand is strongest, while in some markets EMF limits and other regulations can limit the deployment of high-capacity 5G sites.
Net Promoter Score (NPS) from Speedtest Intelligence paints a largely positive picture of current 5G networks. NPS is a key performance indicator of customer experience, categorizing users into Detractors (score 0-6), Passives (score 7-8), and Promoters (score 9-10), with the NPS representing the percentage of Promoters minus the percent of Detractors, displayed in the range from -100 to 100. Across the markets we analyzed, 5G users on average rated their network operator with NPS scores that were universally higher than those for 4G LTE users. However, consumer sentiment for users on 5G networks is beginning to shift, with NPS scores falling, coinciding with lower median 5G performance in many of the markets we analyzed.
Declining performance levels will be a factor driving NPS down for some 5G users. It’s also important to remember that as 5G scales in many of these early launch markets, the profile of 5G users is also changing from predominantly urban-based users, to more of a mix of urban, suburban, and rural users, which brings additional coverage and performance challenges for network operators. We plan to examine the relationship between 5G performance and spectrum in an up-coming content piece. Please get in touch if you’d like to learn more about Speedtest Intelligence data.
Ookla retains ownership of this article including all of the intellectual property rights, data, content graphs and analysis. This article may not be quoted, reproduced, distributed or published for any commercial purpose without prior consent. Members of the press and others using the findings in this article for non-commercial purposes are welcome to publicly share and link to report information with attribution to Ookla.
“Smart cities” are communities that use technology to improve the efficiency of their operations, such as using internet of things (IoT) devices to collect data on traffic patterns or smart meters to track energy consumption. Ahead of the Smart Cities Connect conference in Denver on May 16–18, we wanted to explore the role that connectivity plays for some of the smartest cities in the U.S.
To enable city-wide technology initiatives, a stable connection to the internet is essential. Connectivity can lead to innovation, economic growth, and a better quality of life for residents through reduced traffic congestion and improved public safety.
In this article, we take a look at network performance metrics based on the most recent quarter of Speedtest Intelligence® data for the 100 largest cities across the U.S (by population counts, according to Census Bureau data).
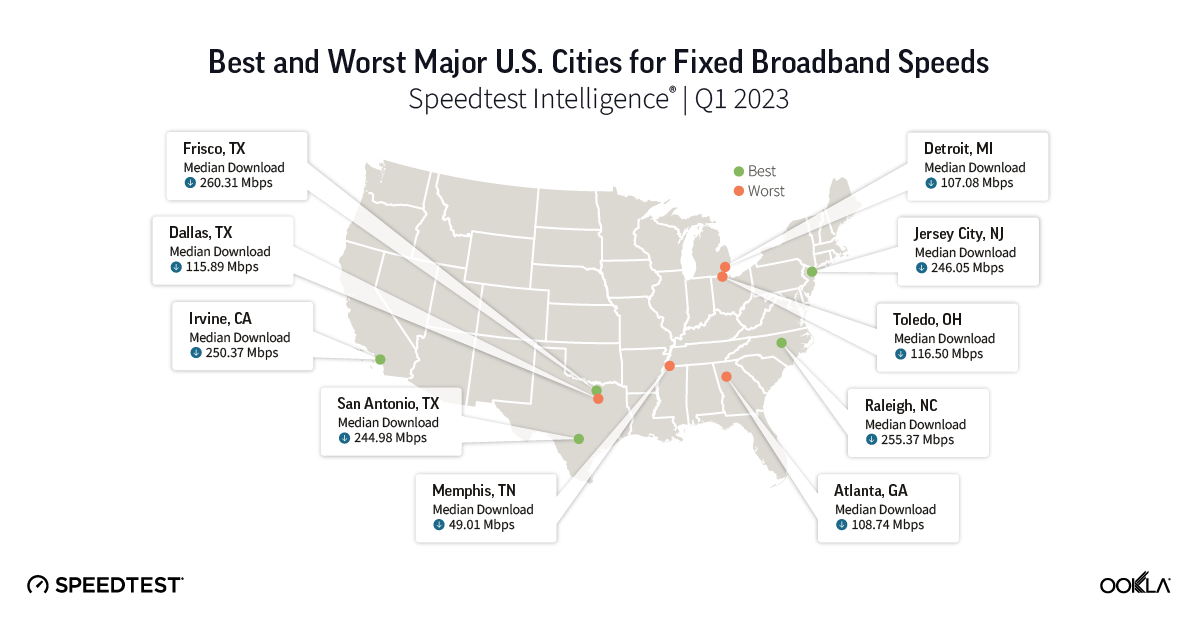
Major U.S. cities with the best and worst fixed broadband speeds
While the FCC’s minimum fixed broadband speed benchmark is currently 25 Mbps for downloading and 3 Mbps for uploading, legislators have proposed increasing the minimum speeds to 100 Mbps down and 20 Mbps up. Looking at fixed broadband speeds, we found that the median download speed for the five lowest ranking cities hovers around the 100 Mbps mark, aside from Memphis, which came in at 49.01 Mbps. There’s a large disparity between the slowest cities and the fastest cities, with Frisco, Texas clocking in the fastest median download speed of 260.31 Mbps. Overall, cities are better connected than rural areas, but pockets of poor fixed connectivity can still exist and capacity issues can plague systems at peak usage times.
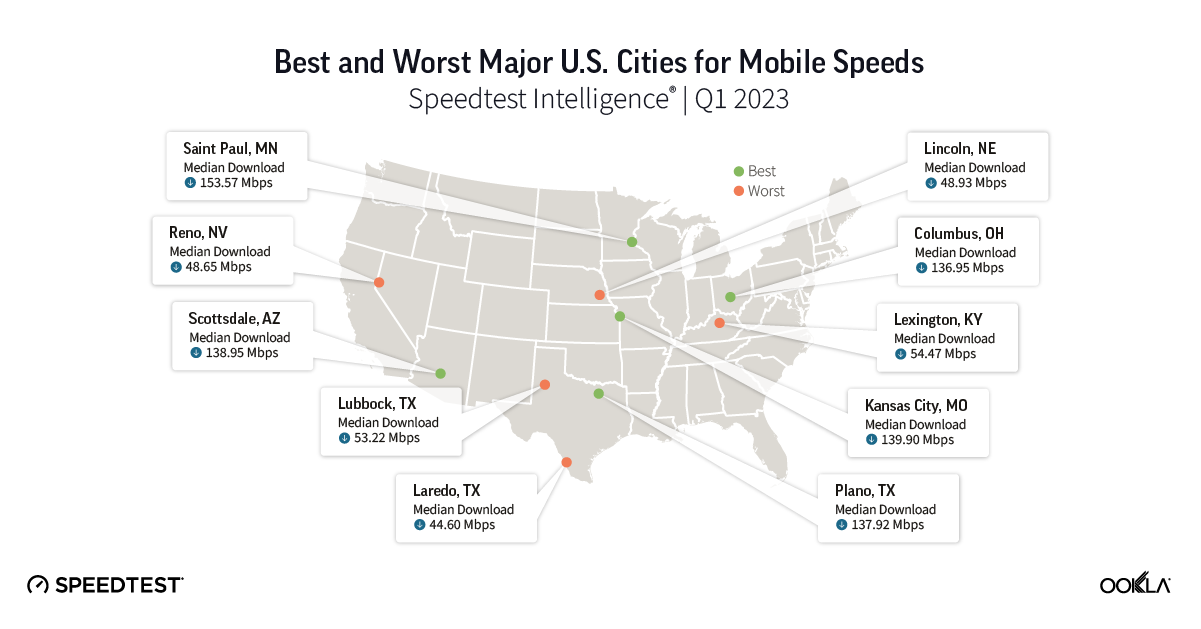
Major U.S. cities with the best and worst mobile speeds
Local governments aiming to bring high-speed connectivity to underserved communities will need to look to mobile connectivity. For truly remote areas, building a direct terrestrial connection will never be practical. In denser urban environments, low income households often rely completely on wireless for broadband as they cannot afford multiple services.
Looking at mobile performance in U.S. cities, Saint Paul; Kansas City, Missouri; Scottsdale; Plano; and Columbus are leading the way in mobile connectivity with median download speeds across all mobile technologies ranging from 136.95 Mbps to 153.57 Mbps. On the other end of the spectrum, the bottom five cities (Lexington, Lubbock, Lincoln, Reno, and Laredo) have much lower speeds, coming in around the 50 Mbps mark.
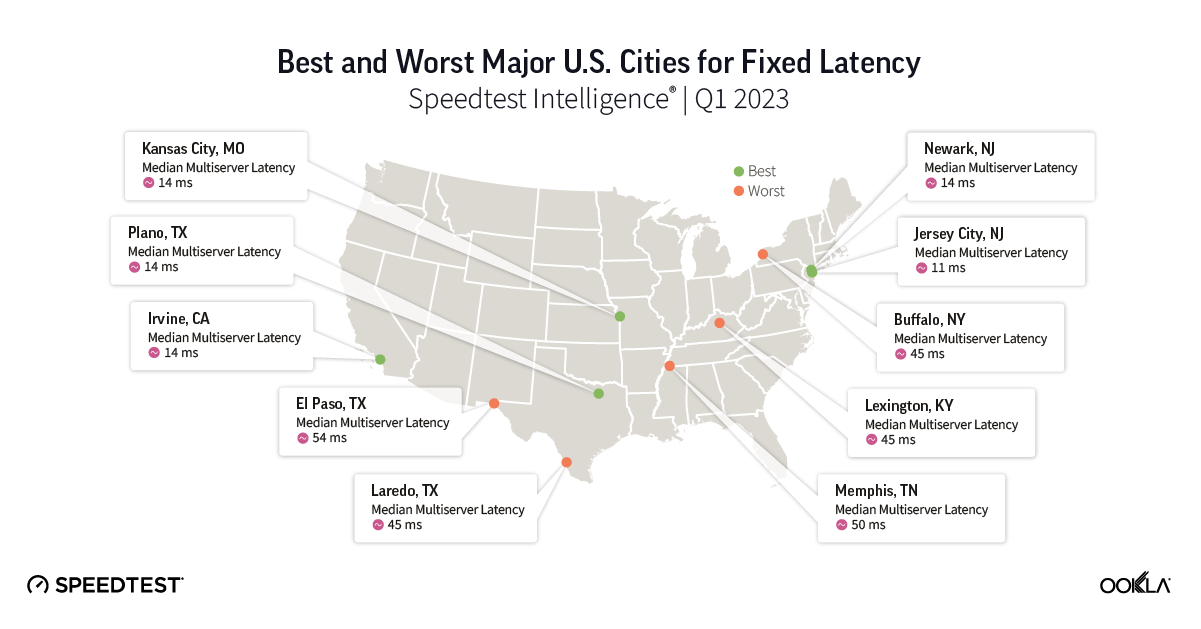
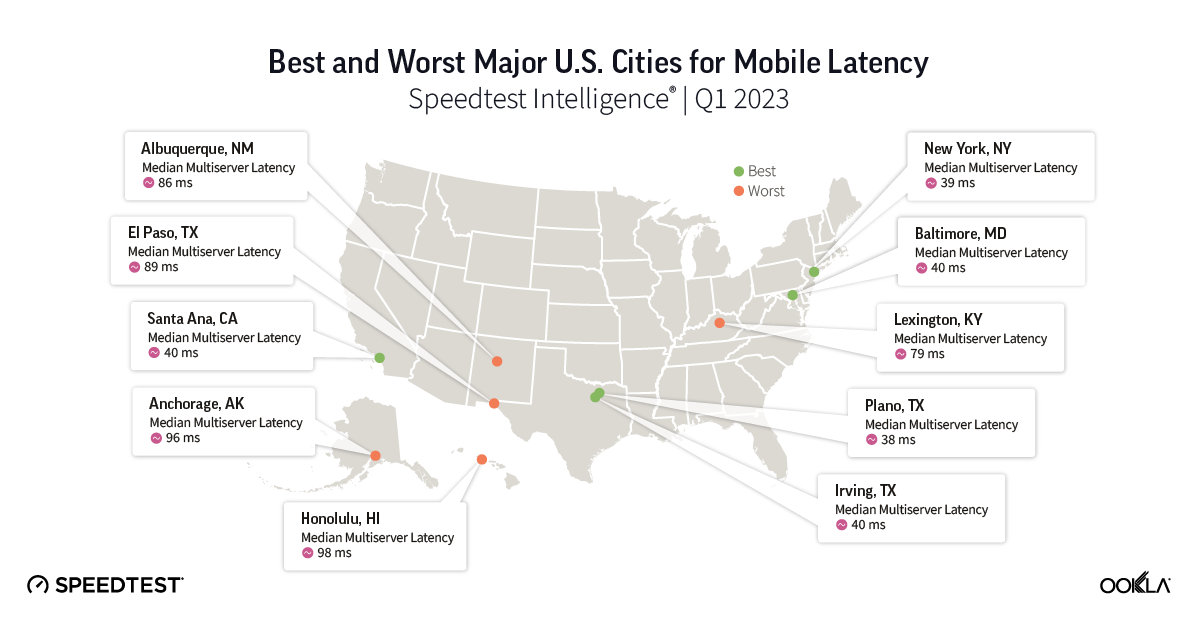
Major U.S. cities with the best and worst latency
Latency (measured in milliseconds) is a measure of how quickly a device gets a response after a request has been sent. Low latency means the server is responding quickly, whereas high latency means the server is responding slowly. When measuring latency, the lower the number, the better. Since smart cities collect and use data to streamline operations, a low latency is crucial for many scenarios, such as edge computing use cases for real-time traffic monitoring.
Among our list of U.S. cities, Jersey City, Newark, Kansas City (MO), Irvine, and Plano had the lowest latency for fixed network technologies with a median multi-server latency under 15ms. Buffalo, Lexington, Laredo, Memphis, and El Paso had higher latency, closer to the 50ms mark.
We saw that latency was higher across the board on mobile networks than it was on fixed broadband networks. Plano, New York, Baltimore, and Irving showed the lowest latency for mobile connections. Lexington, Albuquerque, El Paso, Anchorage, and Honolulu had the highest mobile latency, with median multi-server latency around the 100ms mark.
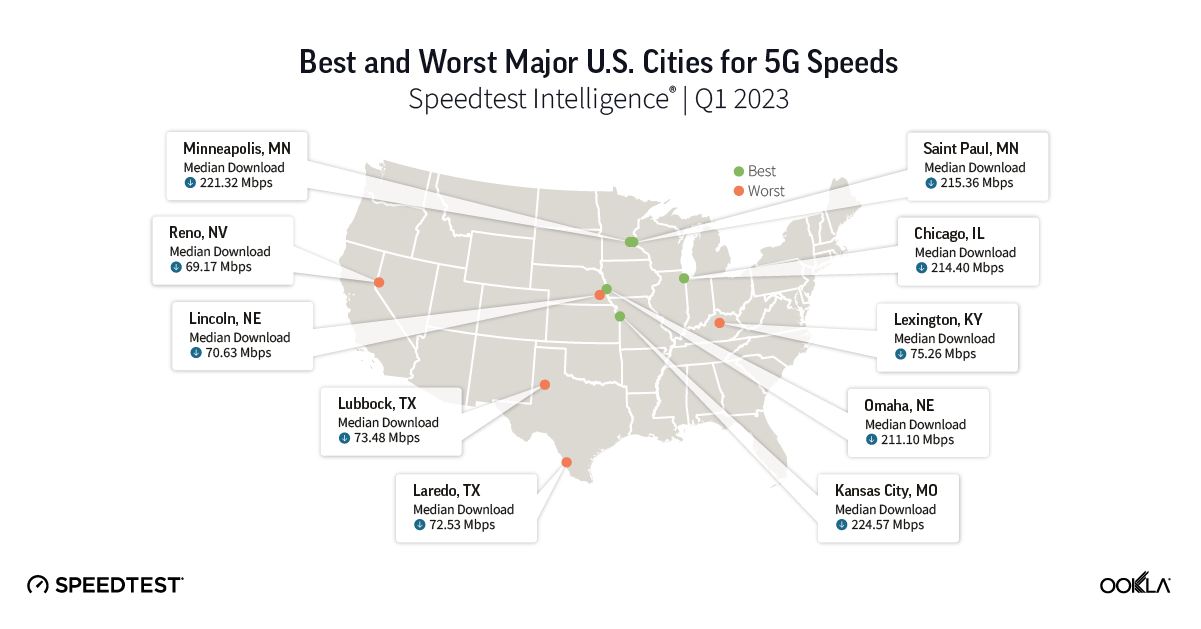
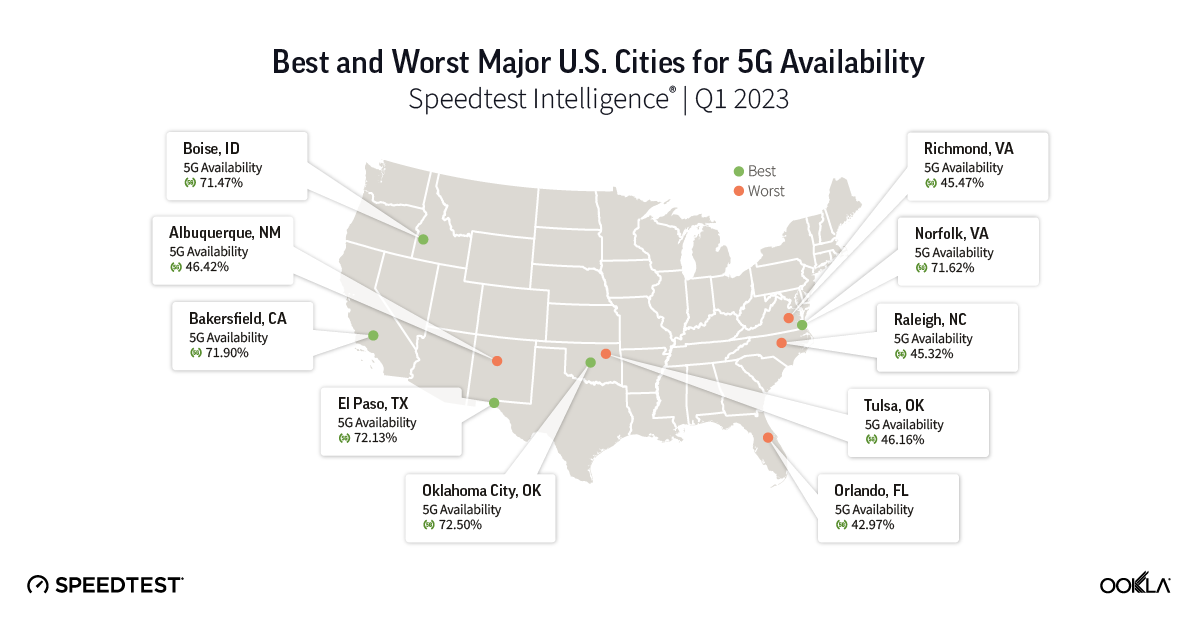
Major U.S. cities with the best and worst 5G speeds and 5G Availability
Smart cities will be significantly impacted by 5G, which delivers faster speeds, reduced latency, and more dependable connections. 5G networks are quickly overlaying the 4G footprint across the United States, and more federal funding is becoming available to improve 5G coverage. This will be an opportunity for lower-ranking cities like Lexington, Lubbock, Laredo, Lincoln, and Reno to improve the mobile network speeds in their cities.
Top ranking cities Kansas City (MO), Minneapolis, Saint Paul, Chicago, and Omaha are already providing great 5G speeds, with median download speeds as fast as 224.57 Mbps in Kansas City.
5G Availability shows what percent of users on 5G-capable devices spent the majority of their time on a 5G network connection. In some U.S. cities, (such as Oklahoma City, El Paso, Bakersfield, Norfolk, and Boise) users with 5G devices are connected to 5G most of the time. Most notably, Oklahoma City users were connected to 5G 72.50% of the time. On the low end, users in Albuquerque, Tulsa, Richmond, Raleigh, and Orlando were connected to 5G less than 50% of the time.
Network intelligence for smarter, more connected communities
Ookla’s enterprise solutions empower cities with comprehensive data on network performance, coverage, and availability. With Ookla data and insights, leaders can make informed policy decisions to close the digital divide. Federal, state, and local governments rely on Ookla for accurate network intelligence to enable modern connectivity in their smart communities.
Stop by the Ookla booth #208 at Smart Cities Connect in Denver on May 16–18 to find out where your city lands on these lists and how Ookla network insights can help you improve connectivity in your city.
Ookla retains ownership of this article including all of the intellectual property rights, data, content graphs and analysis. This article may not be quoted, reproduced, distributed or published for any commercial purpose without prior consent. Members of the press and others using the findings in this article for non-commercial purposes are welcome to publicly share and link to report information with attribution to Ookla.
5G continues to offer new and exciting ways of rethinking everything from streaming video to performing remote surgery. However, not everyone shares equally in these possibilities as many countries do not have access to 5G and even those that do, do not experience the same level of performance from their 5G connections. We examined Speedtest Intelligence® data from Q3 2021 Speedtest® results to see how 5G speeds have changed, where download speeds are the fastest at the country and capital level, where 5G deployments have increased and what worldwide 5G Availability looked like in Q3 2021. We also looked at countries that don’t yet have 5G to understand where consumers are seeing improvements in 4G access.
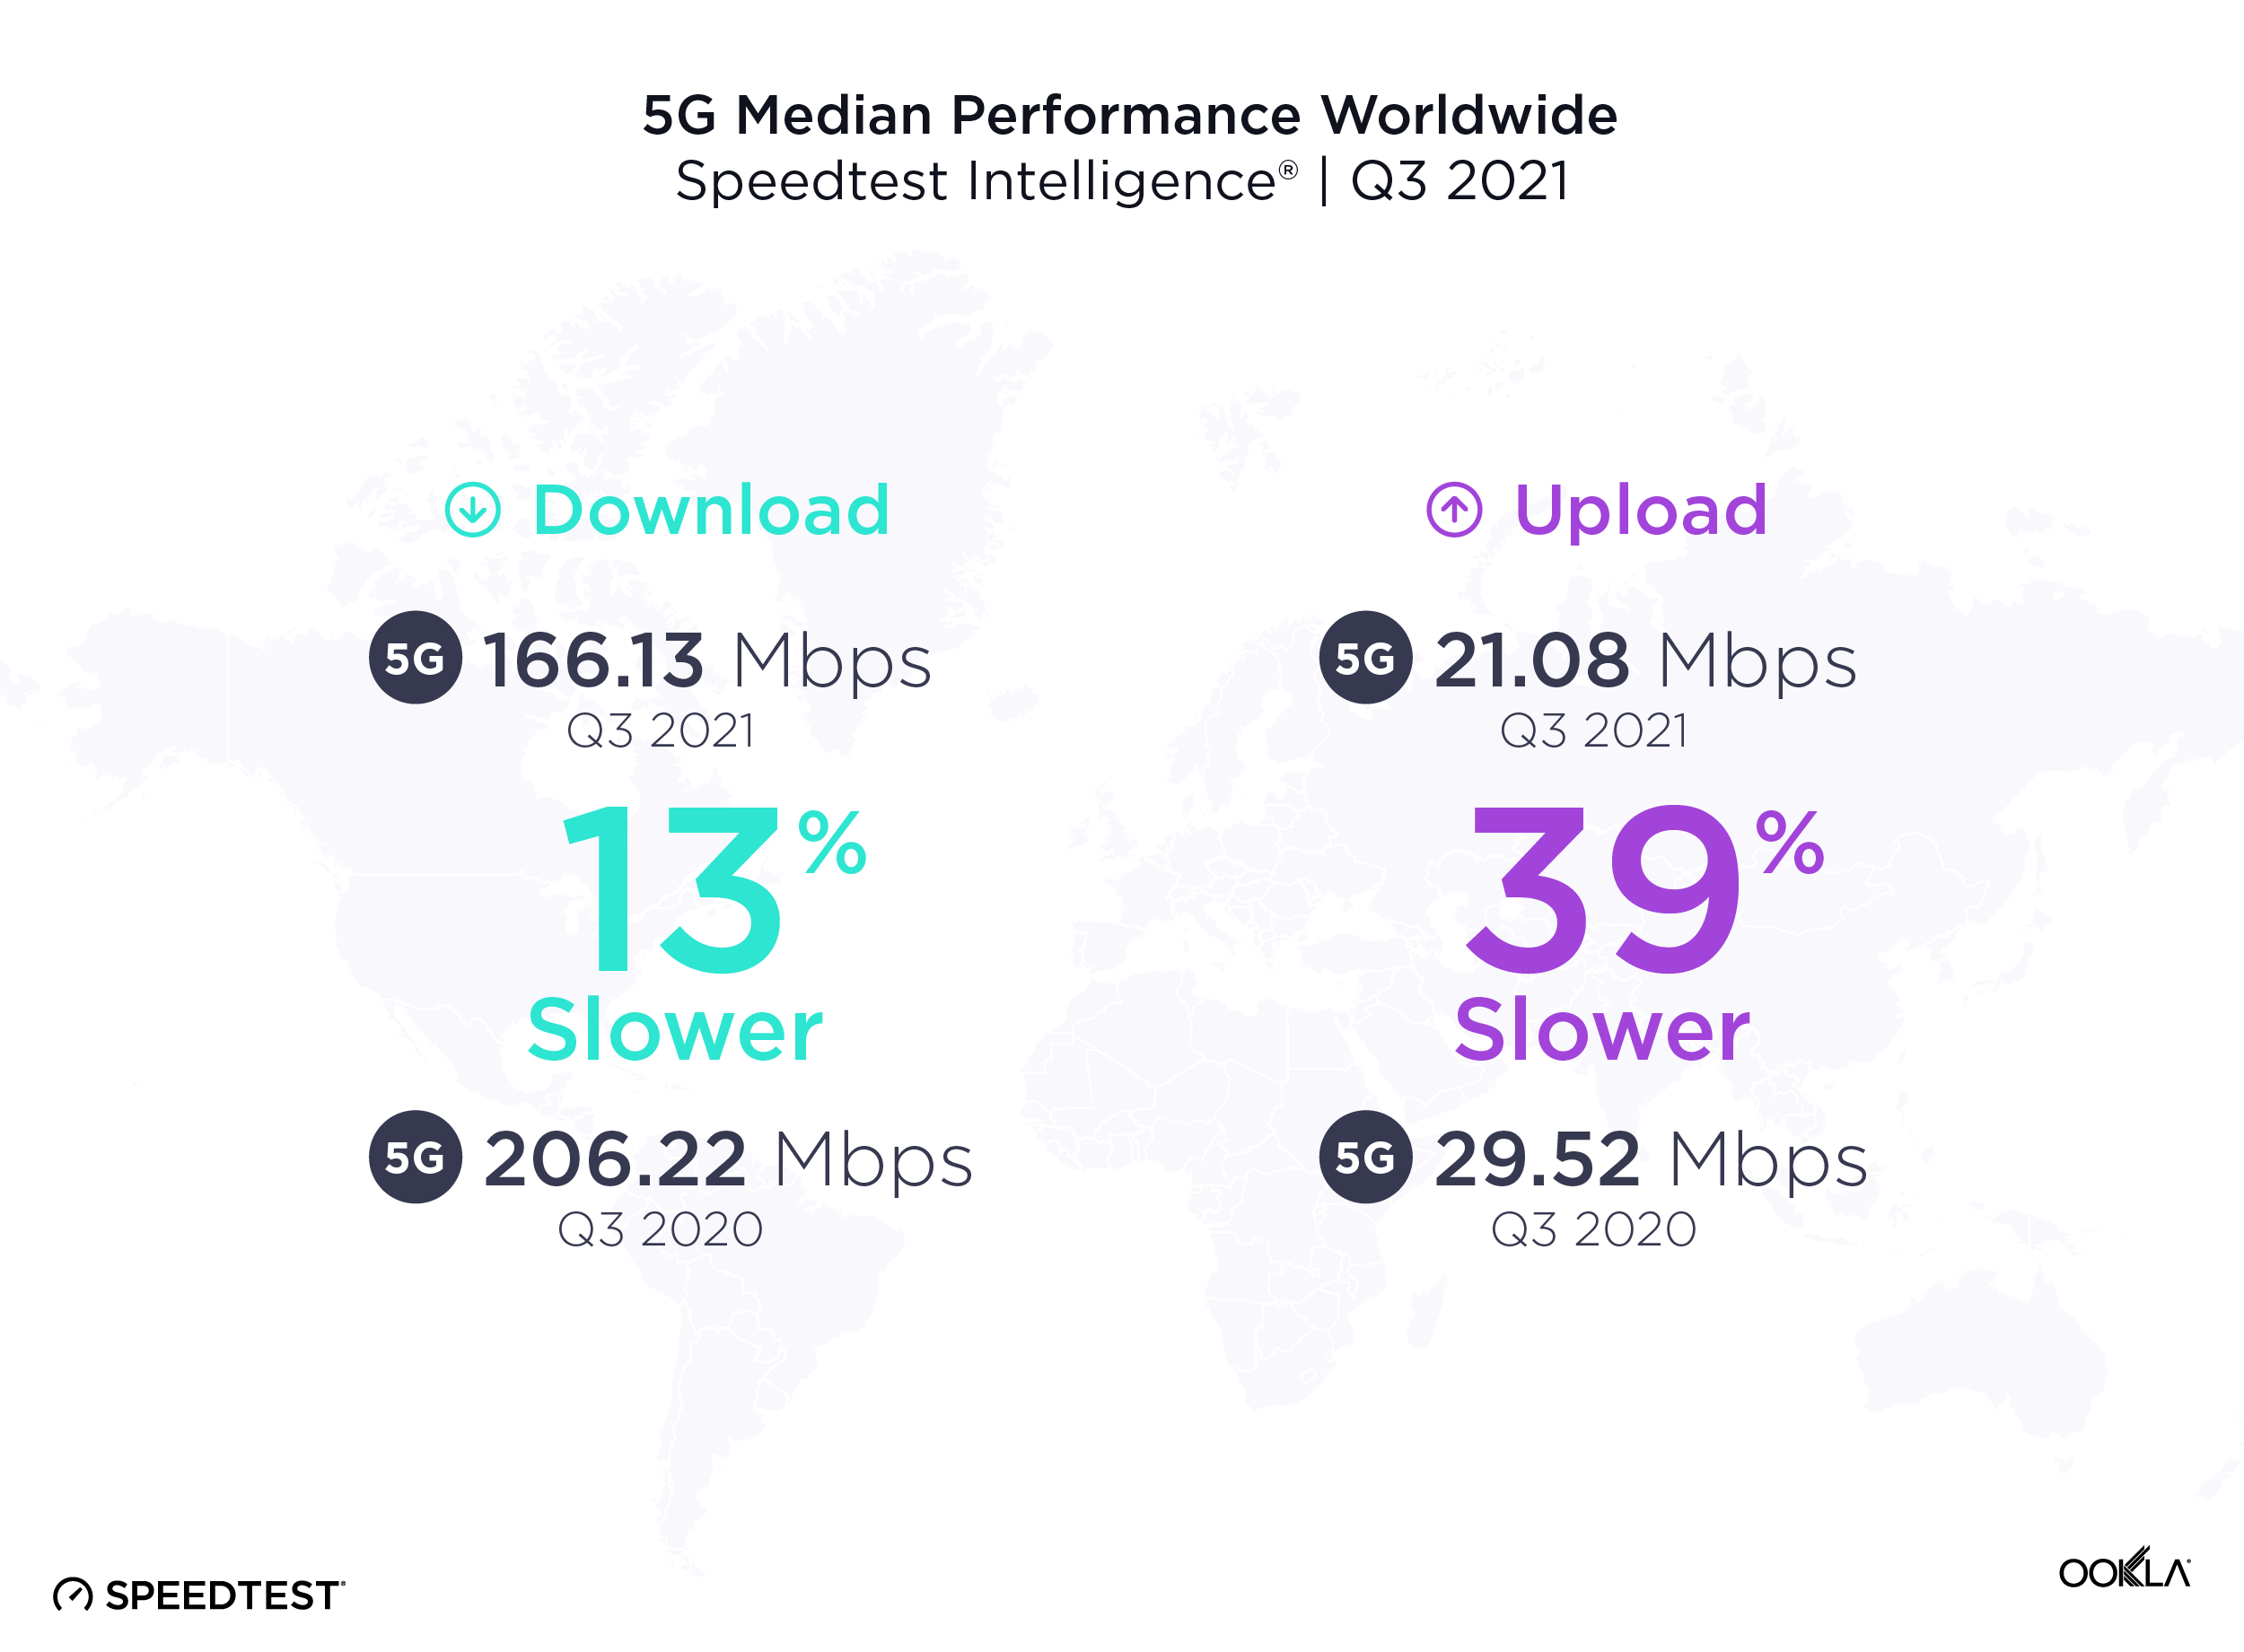
5G slowed down at the global level
It’s common to see new mobile access technologies slow down as adoption scales, particularly early on in the tech cycle. Over the past year from Q3 2020 to Q3 2021, the median global 5G download speed fell to 166.13 Mbps, down from 206.22 Mbps in Q3 2020. Median upload speed over 5G also slowed to 21.08 Mbps (from 29.52 Mbps) during the same period.
More users are logging on to existing 5G networks, and we’re also at the stage in the evolution of 5G where countries that have historically had slower speeds are starting to offer 5G. In addition, the widespread use of dynamic spectrum sharing that has been used to boost early 5G coverage weighs on 5G download speeds. While the dip in speeds looks like a letdown, it’s more of a compromise to enable broader access. With additional spectrum and further deployments slated for 2022, we anticipate speeds will begin to pick up again.
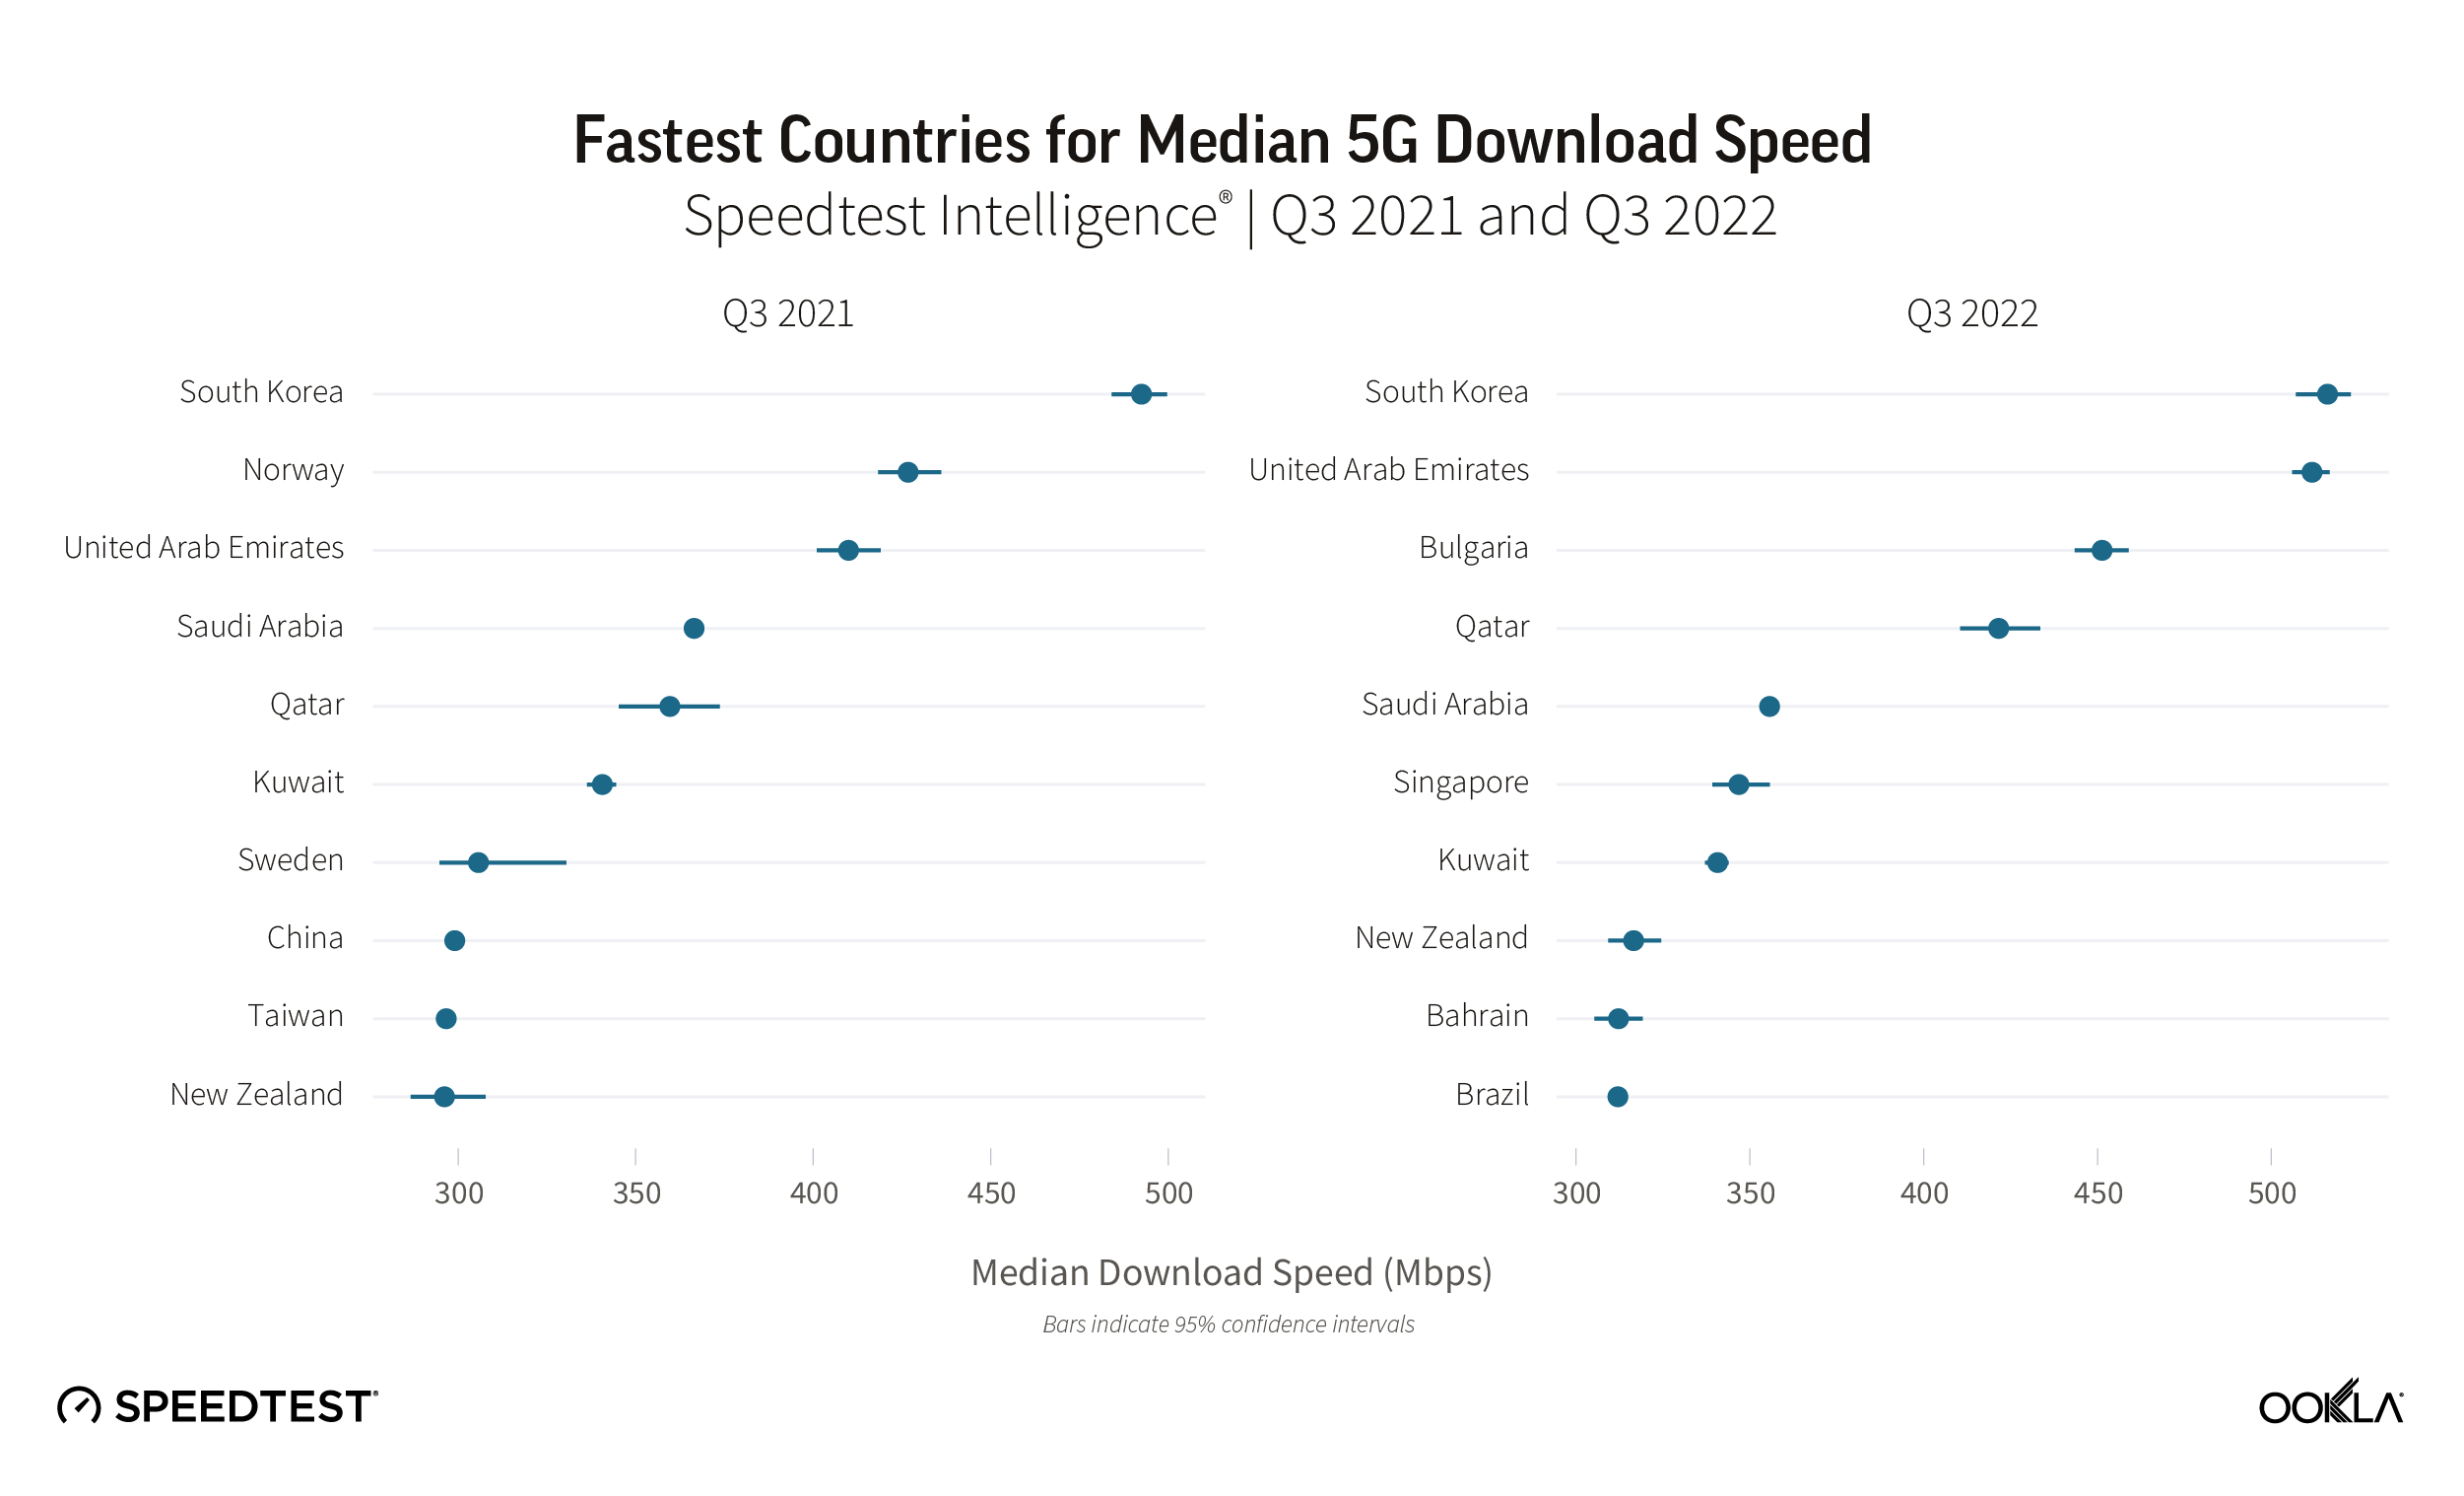
South Korea had the fastest 5G in the world
South Korea had the fastest median download speed over 5G during Q3 2021, leading a top 10 list that included Norway, United Arab Emirates, Saudi Arabia, Qatar, Kuwait, Sweden, China, Taiwan and New Zealand. Sweden, China, Taiwan and New Zealand were new to the top 10 in 2021 while South Africa (whose 5G was brand new last year), Spain and Hungary fell out of the top 10.
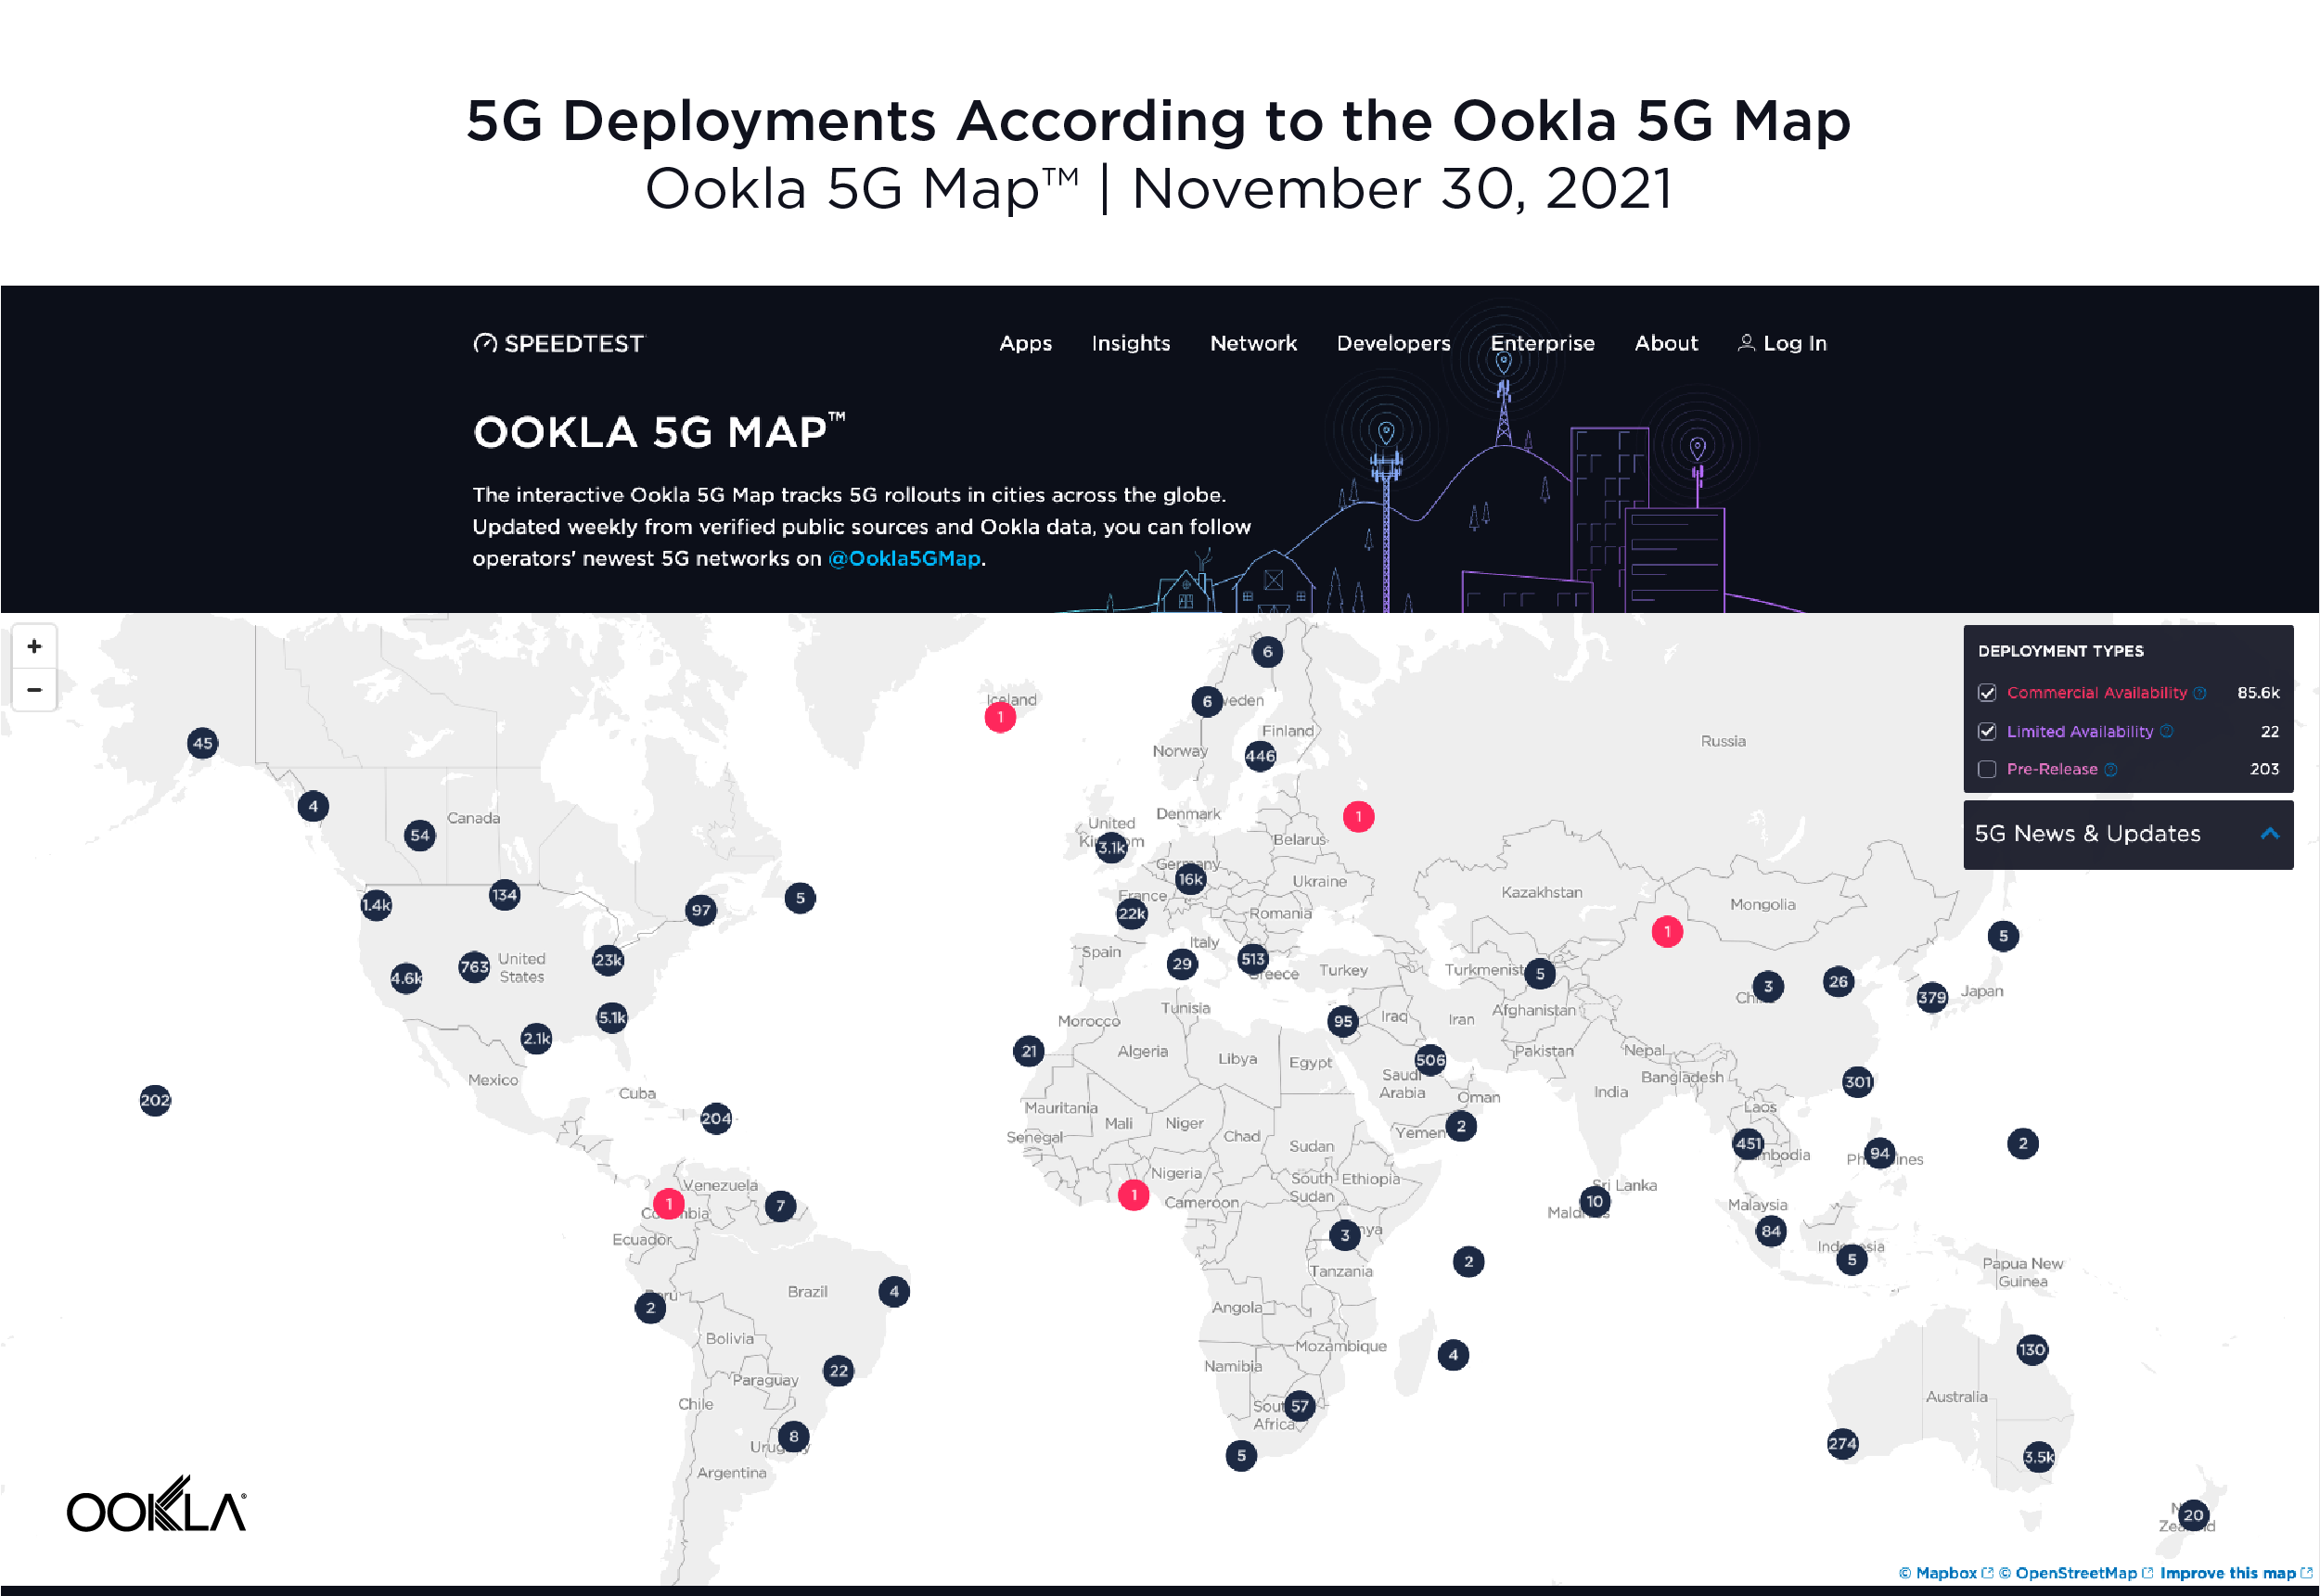
5G expanded to 13 additional countries
According to the Ookla® 5G Map™, there were 5G deployments in 112 countries as of November 30, 2021. That’s up from 99 countries on the same date a year ago. The total number of deployments increased dramatically during the same time period with 85,602 deployments on November 30, 2021 compared to 17,428 on November 30, 2020, highlighting the degree to which 5G networks scaled during the year. Note that there are often multiple deployments in a given city.
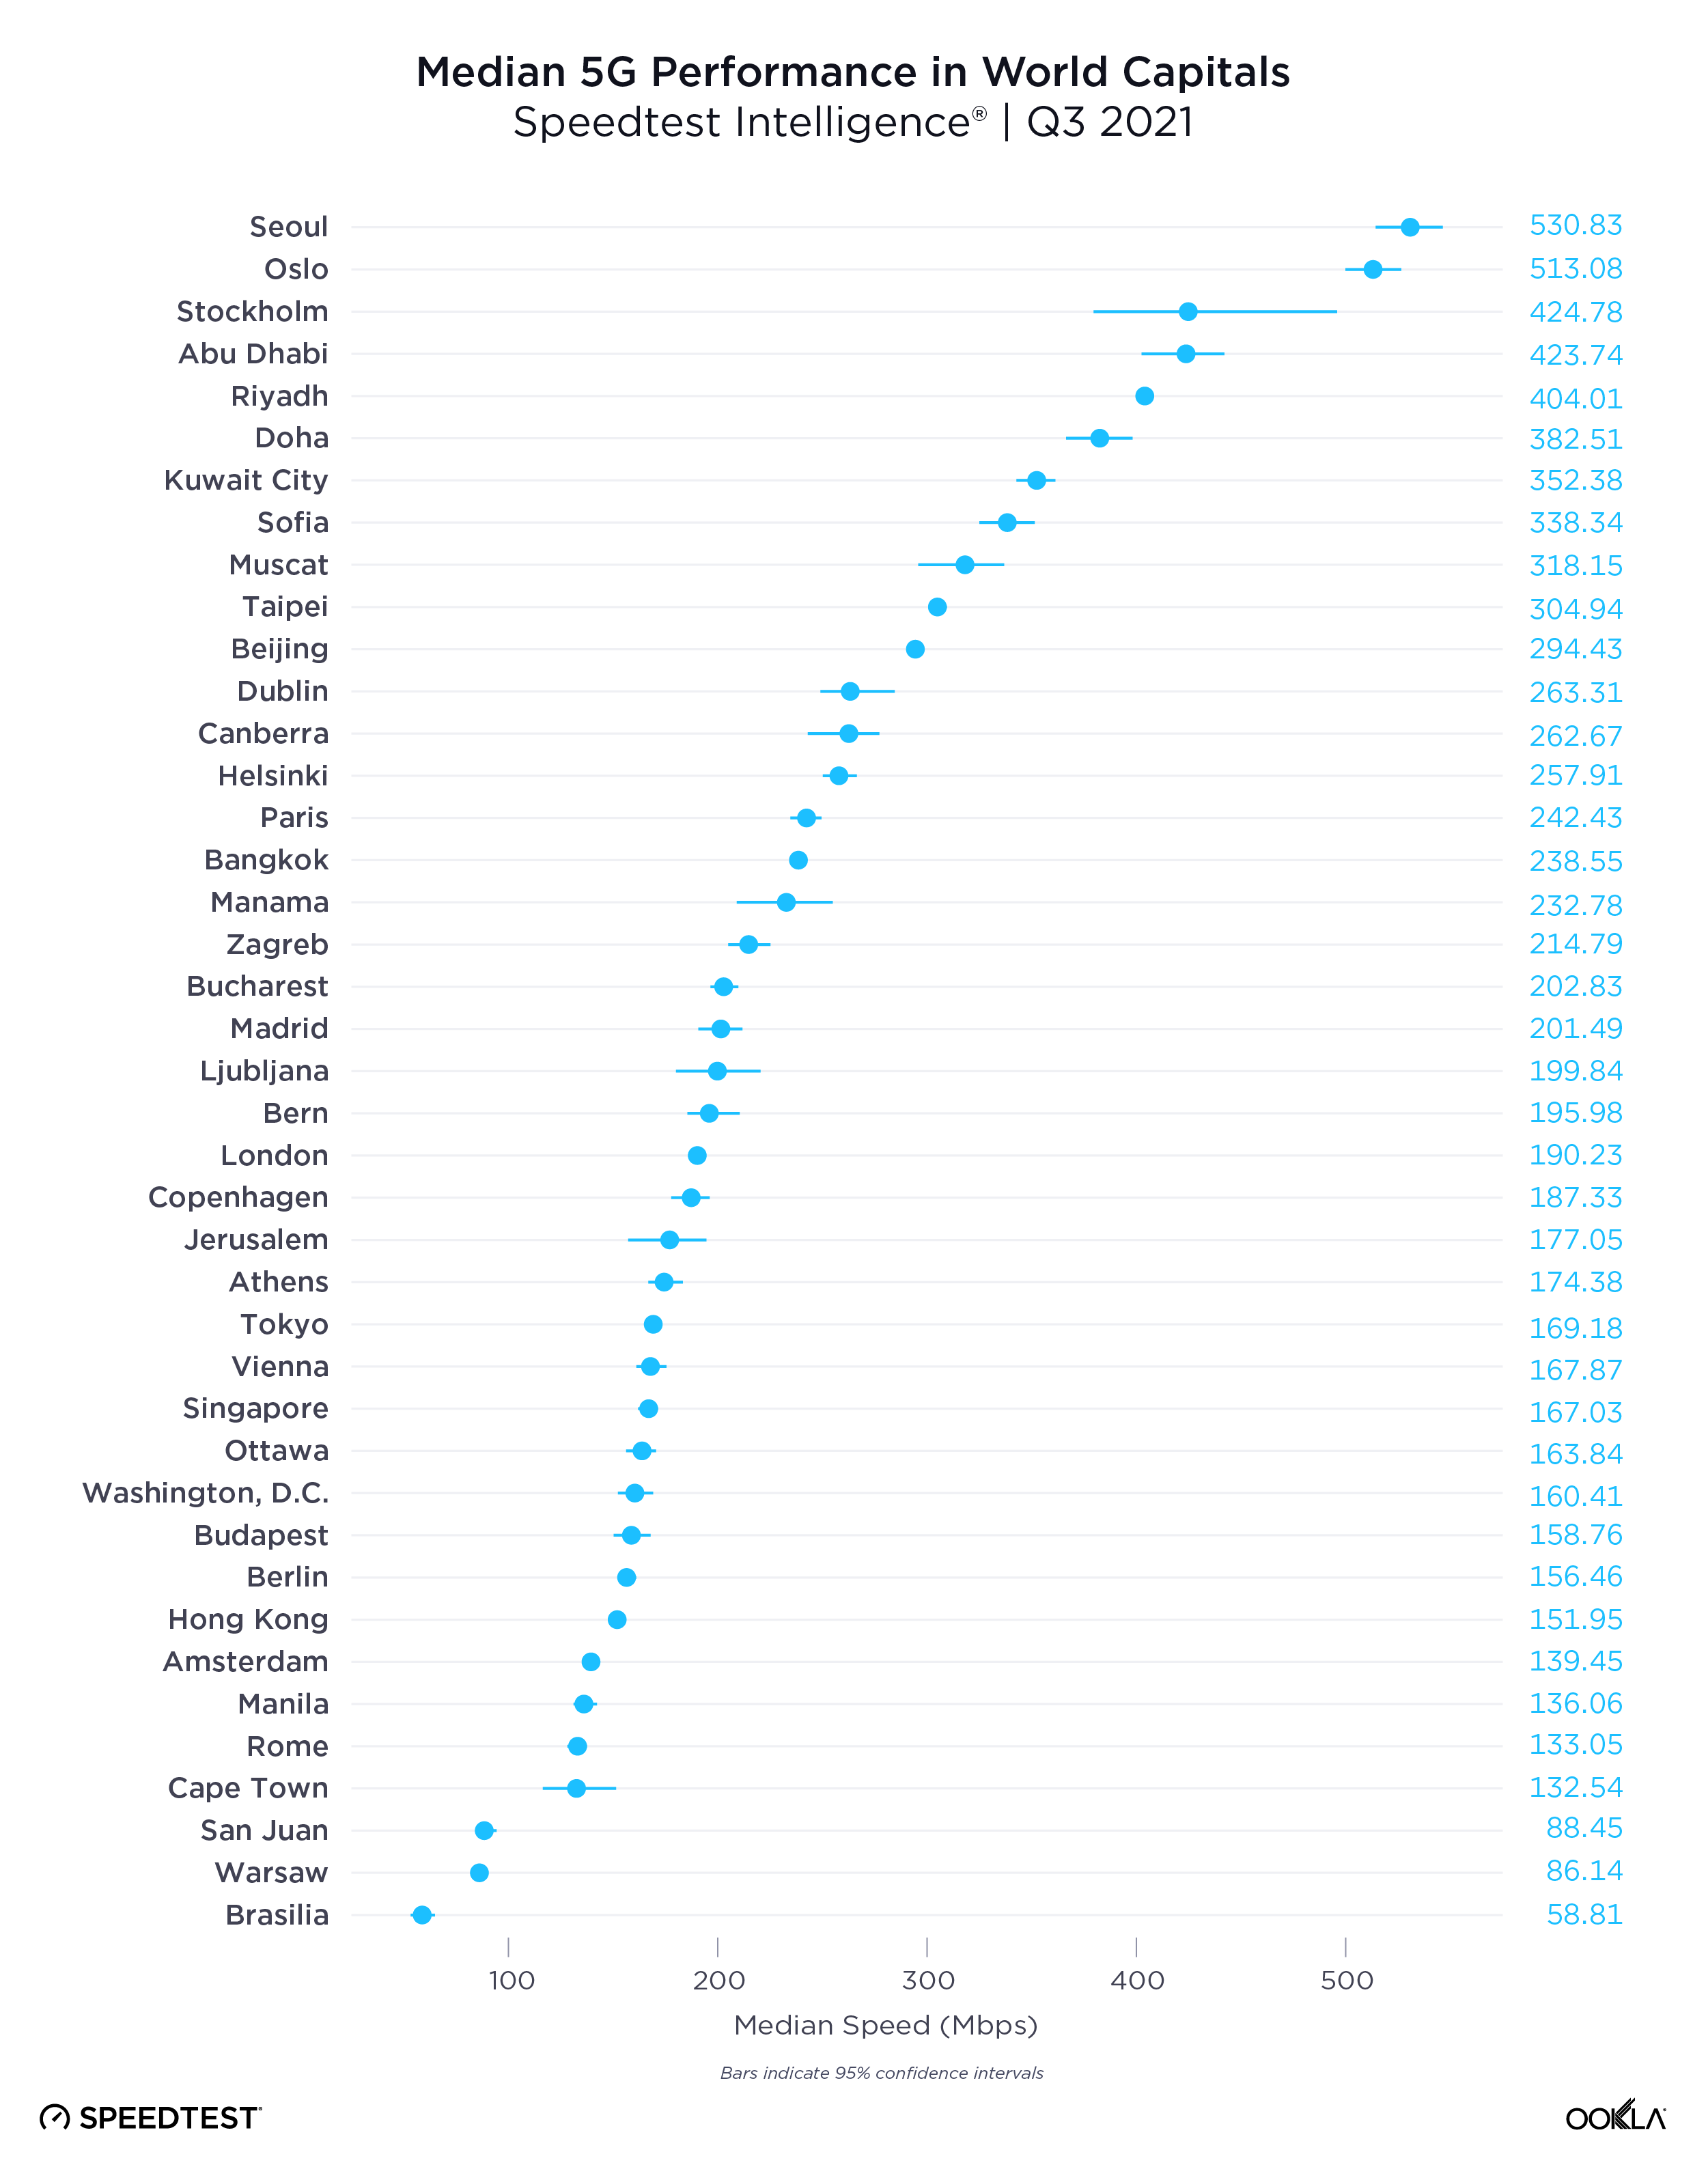
Seoul and Oslo lead world capitals for 5G
Speedtest Intelligence data from Q3 2021 shows a wide range of median 5G speeds among global capitals. Seoul, South Korea and Oslo, Norway were in the lead with 530.83 Mbps and 513.08 Mbps, respectively; Abu Dhabi, United Arab Emirates; Riyadh, Saudi Arabia and Doha Qatar followed. Brasilia, Brazil had the slowest median download speed over 5G on our list, followed by Warsaw, Poland; Cape Town, South Africa and Rome, Italy. Stockholm, Sweden and Oslo, Norway had some of the the fastest median upload speeds over 5G at 56.26 Mbps and 49.95 Mbps, respectively, while Cape Town had the slowest at 14.53 Mbps.
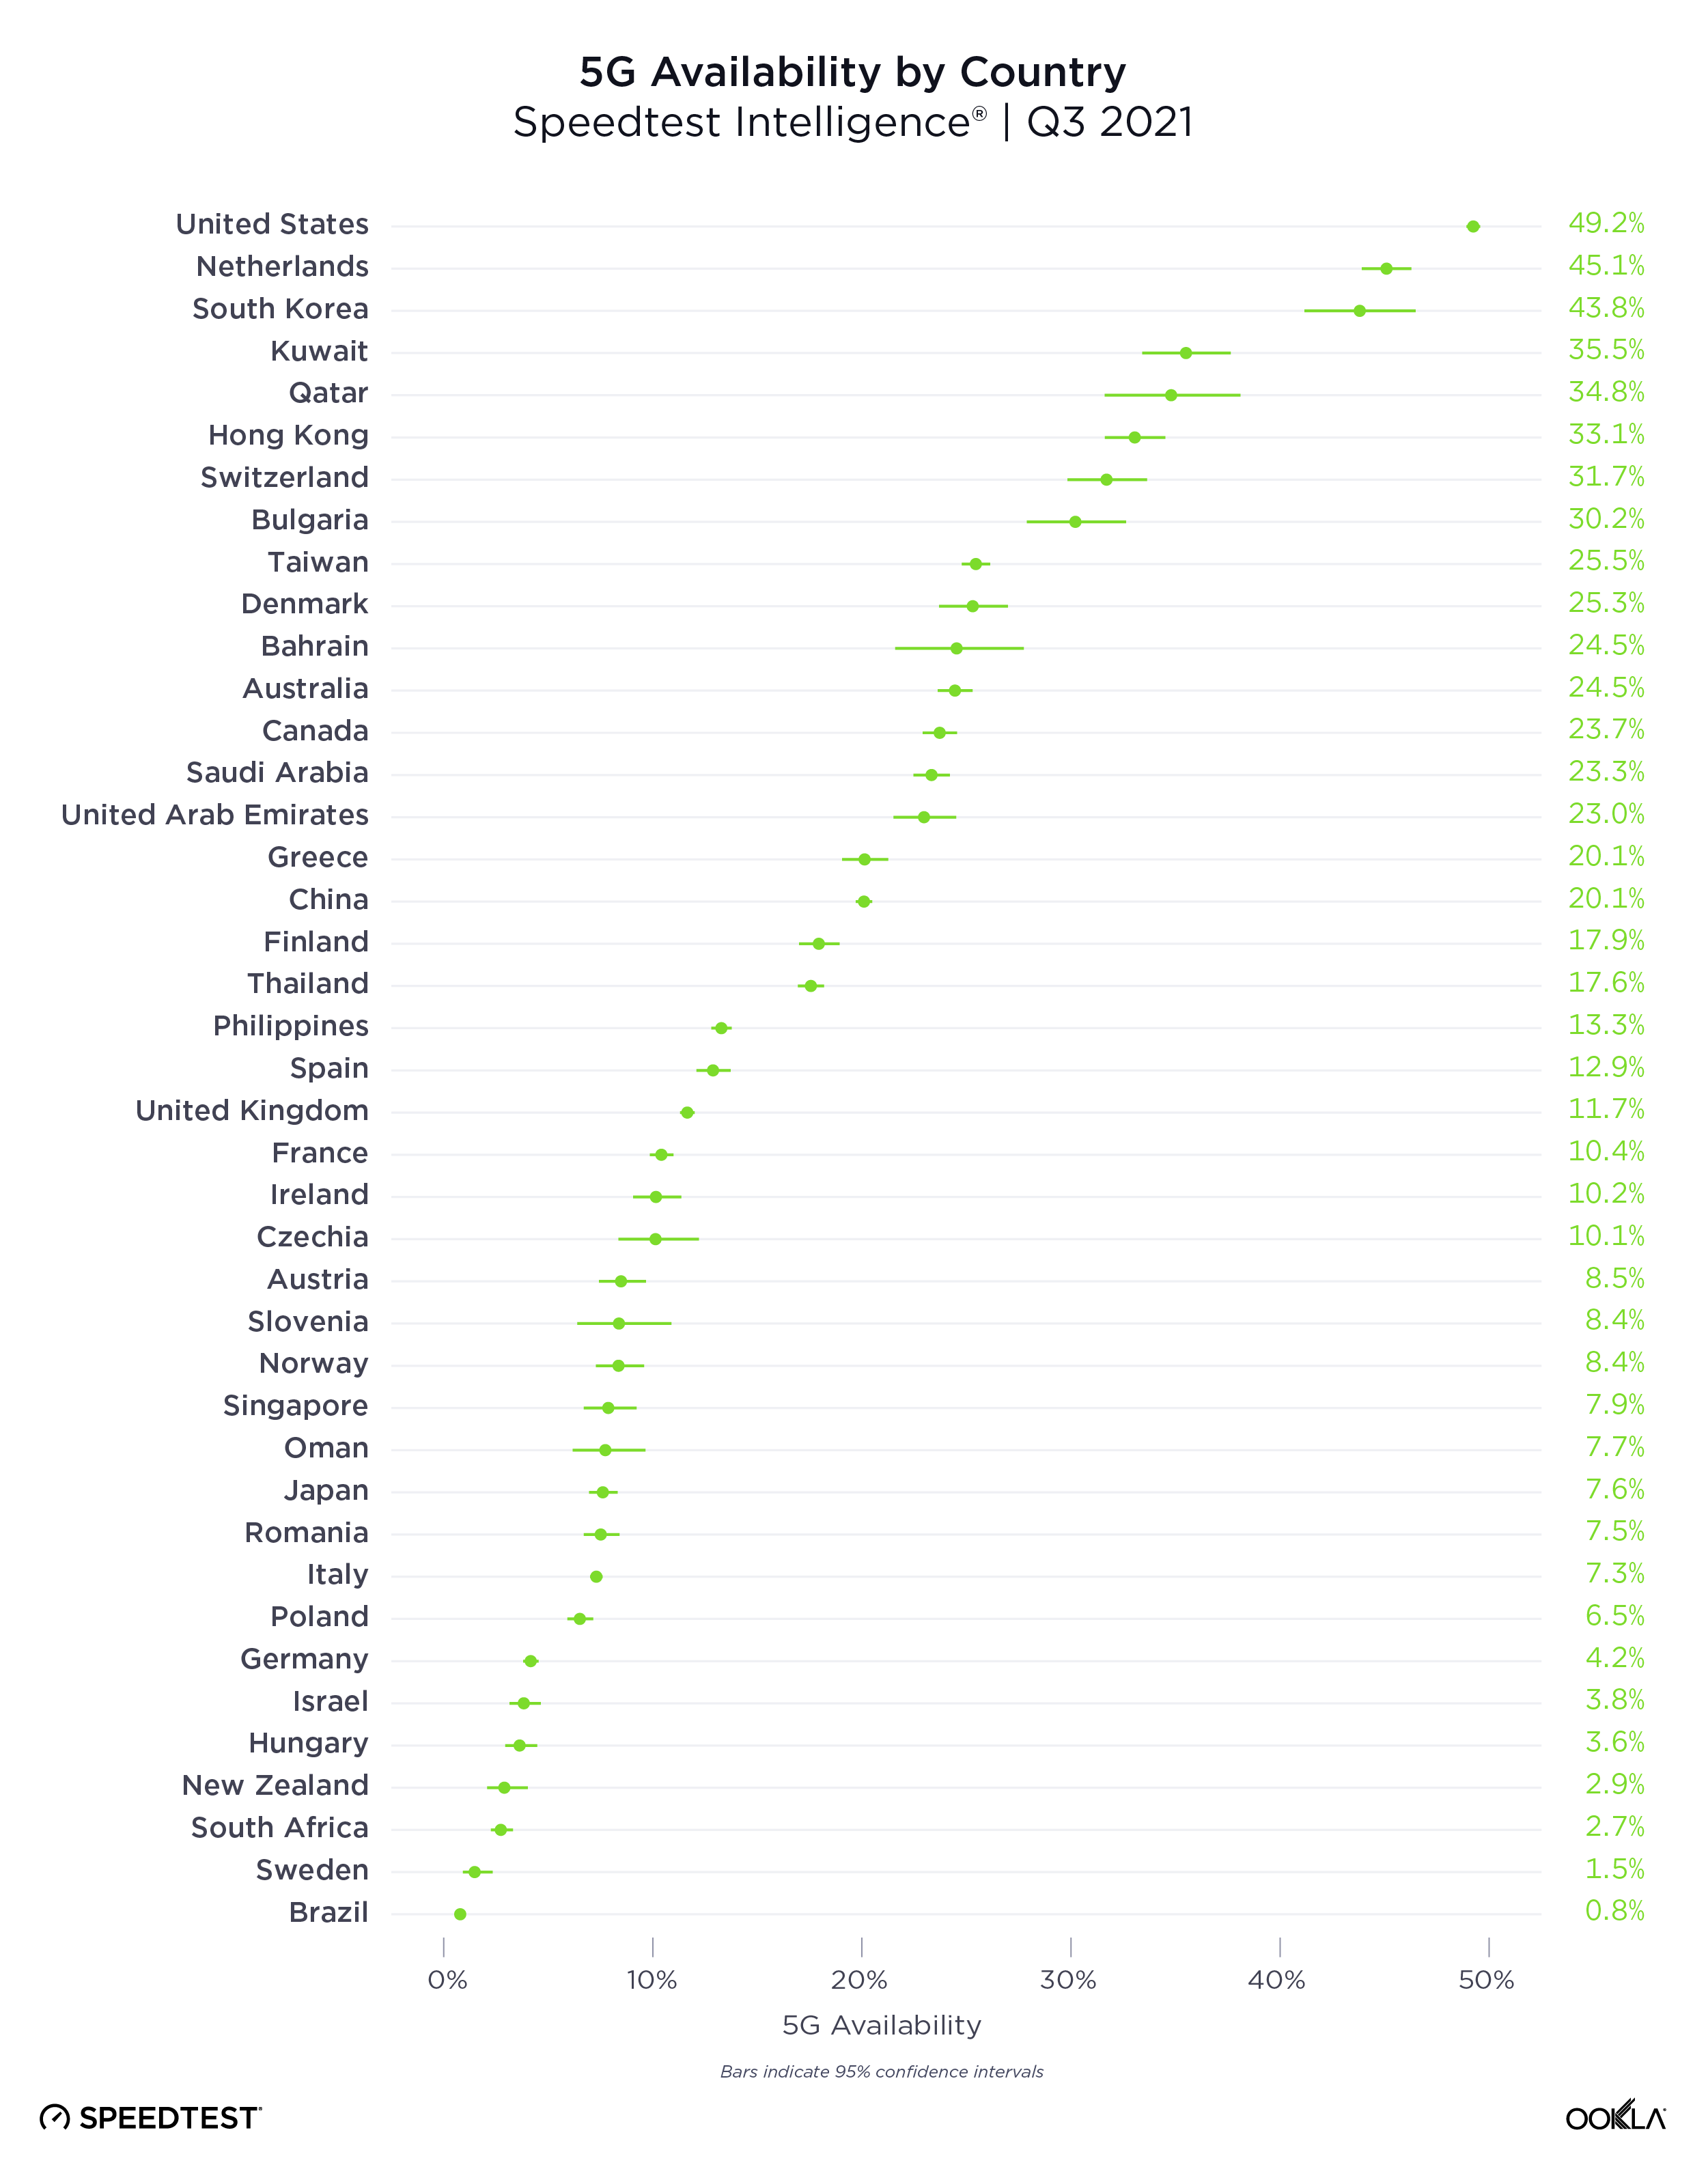
The U.S. had the highest 5G Availability
The presence of 5G is only one indicator in a market, because even in markets where 5G has launched, coverage and adoption can be pretty low. We analyzed 5G Availability to see what percent of users on 5G-capable devices spent the majority of their time on 5G, both roaming and on-network during Q3 2021.
The United States had the highest 5G Availability at 49.2%, followed by the Netherlands (45.1%), South Korea (43.8%), Kuwait (35.5%) and Qatar (34.8%). Brazil had the lowest 5G Availability on our list at 0.8%, followed by Sweden (1.5%), South Africa (2.7%), New Zealand (2.9%) and Hungary (3.6%).
Not all 5G networks are created equal
Ookla Speedtest Intelligence data shows a growing disparity in the performance of 5G networks worldwide, even among the pioneer markets who were among the first to launch the new technology. We see leading markets such as South Korea, Norway, the UAE and China pulling well ahead of key European markets, the U.S. and Japan on 5G download speeds, creating what increasingly looks like two tiers of 5G markets.
Part of the reason for this divergence is access to key 5G spectrum bands, with Verizon and AT&T in the U.S. for example, soon to deploy their C-band spectrum holdings for 5G use. However, what really seems to separate these markets is the level of 5G network densification. The number of people per 5G base station ranges from 319 in South Korea and 1,531 in China, to 4,224 in the EU and 6,590 in the US, according to the European 5G Observatory’s International Scoreboard during October 2021.
Despite the noise around 6G, 5G still has a long way to run
Median 5G mobile download speeds across these markets are respectable relative to the International Telecommunication Union’s (ITU) IMT-2020 target of 100 Mbps for user experienced download data rates. However, 5G Speedtest® results in each market demonstrate significant variability, with the bottom 10th percentile only recording speeds in excess of the IMT-2020 target in South Korea and Norway, and falling significantly short in many other markets, with Spain, Italy and the U.S. below 20 Mbps.
The story gets worse for upload speeds, where no market’s median speed broke the IMT-2020 recommended 50 Mbps, and where the bottom 10th percentile lay in single digits across the board. Operators are clearly prioritizing download speeds over upload, which makes sense given the asymmetric nature of demand, with most consumer applications requiring higher download speeds. However, as operators increasingly look to target the enterprise market with 5G connectivity and consumer demand for services such as video calling and mobile gaming continues to rise, operators will need to boost upload speeds.
Demand for mobile internet bandwidth continues to grow, up 43% year-on-year in Q3 2021 according to Ericsson’s latest mobility report. Looking ahead to 2022, operators will need to increase the capacity of their 5G networks to tackle this growing demand while driving network speeds to new heights. We’ve seen the impact the deployment of new spectrum can have on congested networks during 2021, with Reliance Jio witnessing a bump in 4G LTE performance and consumer sentiment following its acquisition of additional spectrum in India.
Where 5G still fails to reach
Speedtest Intelligence showed 70 countries in the world where more than 20% of samples were from 2G and 3G connections (combined) during Q3 2021 and met our statistical threshold to be included. These are mostly countries where 5G is still aspirational for a majority of the population. As excited as we are about the expansion of 5G, we do not want to see these countries left behind. Not only are 2G and 3G decades old, they are only sufficient for basic voice and texting, social media and navigation apps. To deliver rich media experiences or video calling, users need access to 4G or higher. Having so many consumers on 2G and 3G also prevents mobile operators from refarming that spectrum to make 4G and 5G networks more efficient.
Countries That Still Rely Heavily on 2G and 3G Connections
Speedtest IntelligenceⓇ | Q3 2021
Country
2G & 3G Samples
Central African Republic
89.9%
Palestine
84.7%
Yemen
72.4%
Turkmenistan
71.8%
Micronesia
56.3%
Madagascar
55.0%
Belarus
53.2%
Rwanda
51.7%
Kiribati
48.4%
Equatorial Guinea
47.6%
Afghanistan
44.4%
South Sudan
43.4%
Guyana
42.3%
Guinea
37.0%
Angola
36.8%
Cape Verde
35.9%
Tajikistan
35.6%
Zimbabwe
34.7%
Benin
34.4%
Togo
33.8%
Ghana
33.0%
Sierra Leone
31.7%
Antigua and Barbuda
30.2%
Vanuatu
30.1%
Lesotho
30.0%
Syria
29.6%
Moldova
29.4%
Saint Kitts and Nevis
28.9%
Mozambique
28.8%
Sudan
28.4%
Palau
28.3%
Grenada
28.1%
Tanzania
27.6%
Uganda
27.5%
Niger
27.5%
Gabon
27.5%
Haiti
27.4%
Suriname
27.4%
Tonga
27.3%
Liberia
27.0%
Namibia
26.7%
Swaziland
26.5%
The Gambia
26.3%
Saint Vincent and the Grenadines
26.3%
Dominica
26.3%
Somalia
26.1%
Cook Islands
26.0%
Zambia
25.9%
Barbados
25.7%
Armenia
25.5%
Algeria
25.4%
Papua New Guinea
25.2%
Jamaica
24.5%
Venezuela
24.2%
Ethiopia
24.1%
Uzbekistan
24.0%
El Salvador
23.5%
Honduras
23.1%
Nigeria
23.0%
Solomon Islands
22.8%
Caribbean Netherlands
22.7%
Botswana
22.3%
Anguilla
21.7%
Mauritania
20.6%
Saint Lucia
20.5%
Bosnia and Herzegovina
20.3%
Burundi
20.3%
Ecuador
20.2%
Ukraine
20.1%
Trinidad and Tobago
20.0%
We were pleased to see the following countries come off the list from last year, having dropped below the 20% threshold: Azerbaijan, Bangladesh, Belize, Burkina Faso, Cameroon, Costa Rica, Côte d’Ivoire, DR Congo, Iraq, Kenya, Laos, Libya, Maldives, Mali, Mauritius, Mongolia, Nicaragua, Paraguay and Tunisia. While countries like Palestine, Suriname, Ethiopia, Haiti and Antigua and Barbuda are still on this list, they have improved the percentage of their samples on these outmoded technologies when compared to last year (dropping 10-15 points, respectively), 2G and 3G samples in Belarus increased 6.7 points when comparing Q3 2021 to Q3 2020.
We’re excited to see how performance levels will normalize as 5G expands to more and more countries and access improves. Keep track of how well your country is performing on Ookla’s Speedtest Global Index™.
Ookla retains ownership of this article including all of the intellectual property rights, data, content graphs and analysis. This article may not be quoted, reproduced, distributed or published for any commercial purpose without prior consent. Members of the press and others using the findings in this article for non-commercial purposes are welcome to publicly share and link to report information with attribution to Ookla.
5G is no longer a new technology, however, consumers in many countries are still waiting to see the full benefits of 5G (or even to connect to 5G at all). We examined Speedtest Intelligence® data from Q3 2022 Speedtest® results to see how 5G performance has changed since last year, where download speeds are the fastest at the country level, and how satellite technologies are offering additional options to connect. We also looked at countries that don’t yet have 5G to understand where consumers are seeing improvements in 4G LTE access.
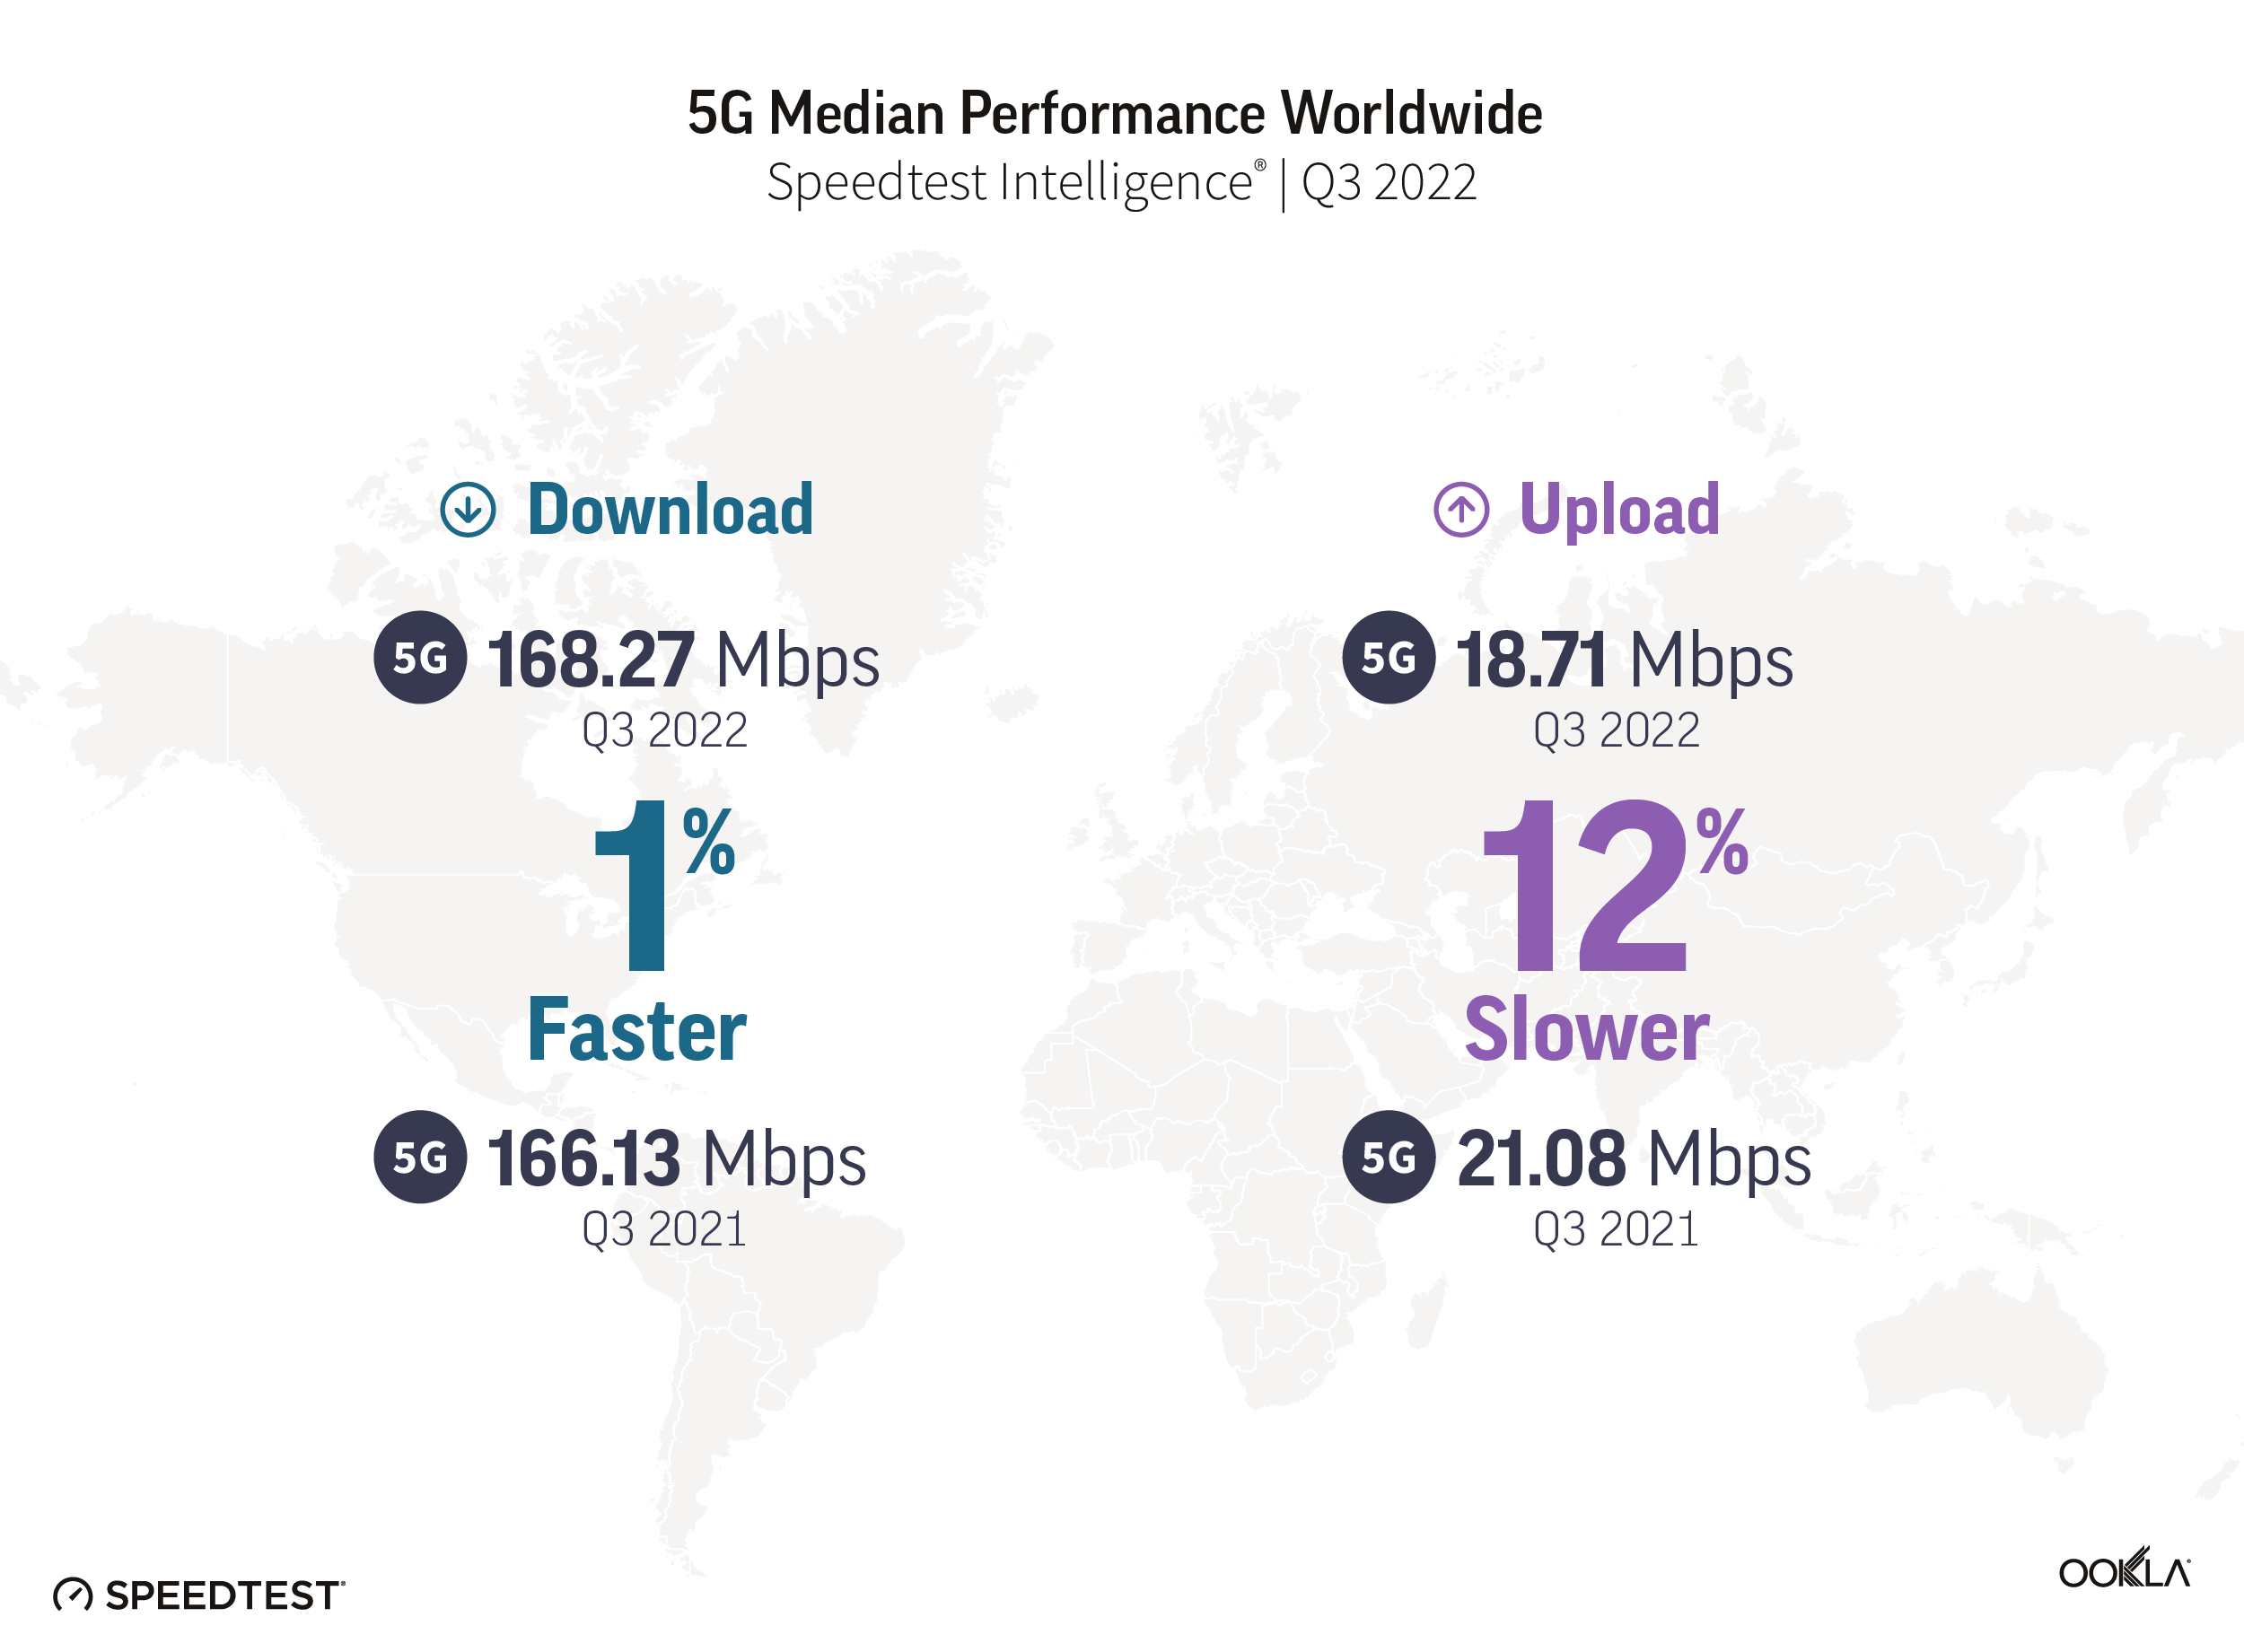
5G speeds were stable at the global level
In 2021, we discussed how an expansion of 5G access led to a decline in overall speed at the global level. This year showed a stabilization in overall speed, even as 5G access broadened, with a median global 5G download speed of 168.27 Mbps in Q3 2022 as compared to 166.13 Mbps in Q3 2021. Median upload speed over 5G slowed slightly to 18.71 Mbps (from 21.08 Mbps) during the same period. According to the Ookla® 5G Map™, there were 127,509 5G deployments in 128 countries as of November 30, 2022, compared to 85,602 in 112 countries the year prior.
South Korea and the United Arab Emirates led countries for 5G speeds
South Korea and the U.A.E. had the fastest median download speed over 5G at 516.15 Mbps and 511.70 Mbps, respectively, during Q3 2022, leading a top 10 list that included Bulgaria, Qatar, Saudi Arabia, Singapore, Kuwait, New Zealand, Bahrain, and Brazil. Bulgaria, Singapore, Bahrain, and Brazil were new to the top 10 in 2022, while Norway, Sweden, China, and Taiwan fell out of the top 10.
Satellite became more accessible but performance slowed
2022 saw a proliferation of fast, low-earth orbit (LEO) satellite internet from Starlink across the world. Q1 2022 saw Starlink speeds increase year over year in Canada and the U.S., with Starlink in Mexico having the fastest satellite internet in North America, Starlink in Lithuania the fastest in Europe, Starlink in Chile the fastest in South America, and Starlink in Australia the fastest in Oceania.
Q2 2022 saw Starlink speeds decrease in Canada, France, Germany, New Zealand, the U.K., and the U.S. from Q1 2022 as Starlink crossed the 400,000 user threshold across the world. Starlink in Puerto Rico debuted as the fastest satellite provider in North America. Starlink outperformed fixed broadband averages in 16 European countries. Starlink in Brazil had the fastest satellite speeds in South America. And Starlink in New Zealand was the fastest satellite provider in Oceania.
During Q3 2022, Starlink performance dipped once again from Q2 2022 in Canada and the U.S., while remaining about the same in Chile. Starlink in Puerto Rico and the U.S. Virgin Islands had the fastest satellite speeds in North America, while Starlink in Brazil again was the fastest satellite provider in South America.
With Viasat, HughesNet, and Project Kuiper set to launch huge LEO constellations in 2023, consumers around the world are poised to have more fast satellite internet options, particularly as the European Commission makes its own play for a constellation and Eutelsat and OneWeb potentially merging.
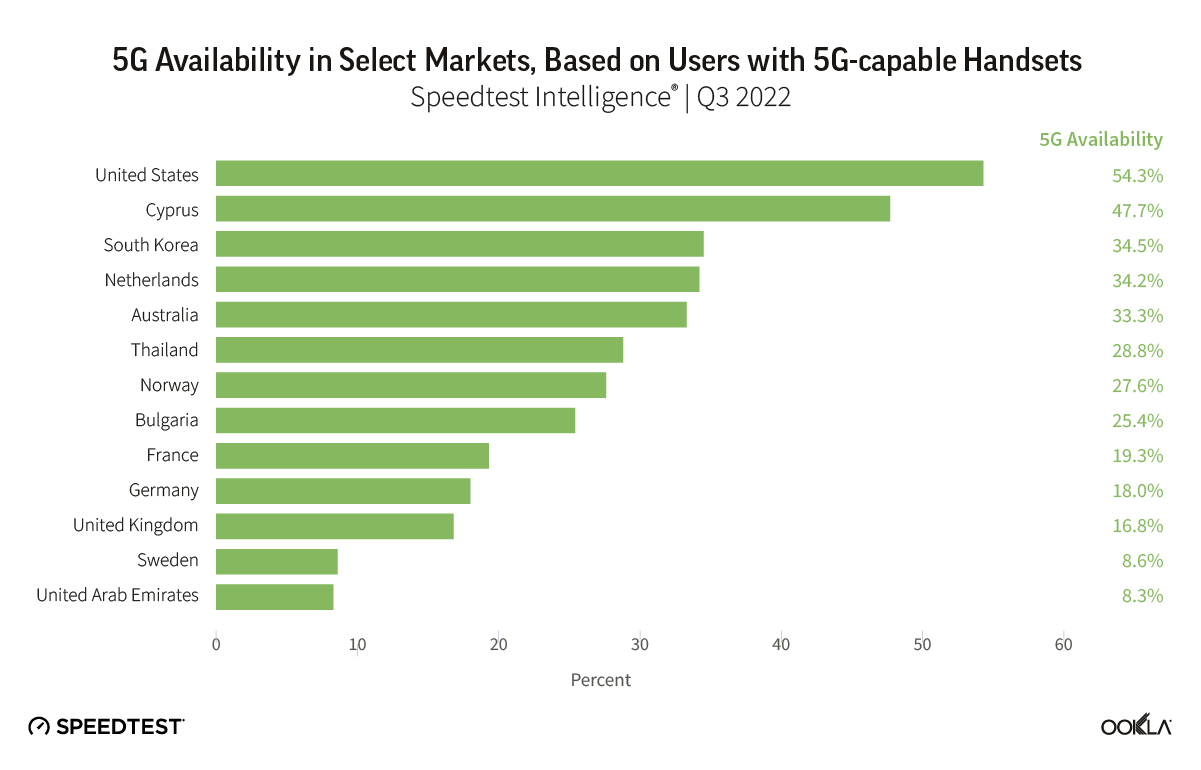
5G Availability points to on-going challenges
5G Availability measures the proportion of Speedtest users with 5G-capable handsets, who spend a majority of time connected to 5G networks. It’s therefore a function of 5G coverage and adoption. We see wide disparity in 5G Availability among markets worldwide, with for example the U.S. recording 54.3% in Q3 2022, well ahead of markets such as Sweden and the U.A.E., with 8.6% and 8.3% respectively.
Critical levers for mobile operators to increase 5G Availability include:
Increasing 5G coverage by deploying additional base stations
Obtaining access to, or refarming, sub-GHz spectrum, to help broaden 5G coverage, as sub-GHz spectrum has superior propagation properties than that of higher frequency spectrum bands.
Encouraging 5G adoption among users with 5G-capable handsets.
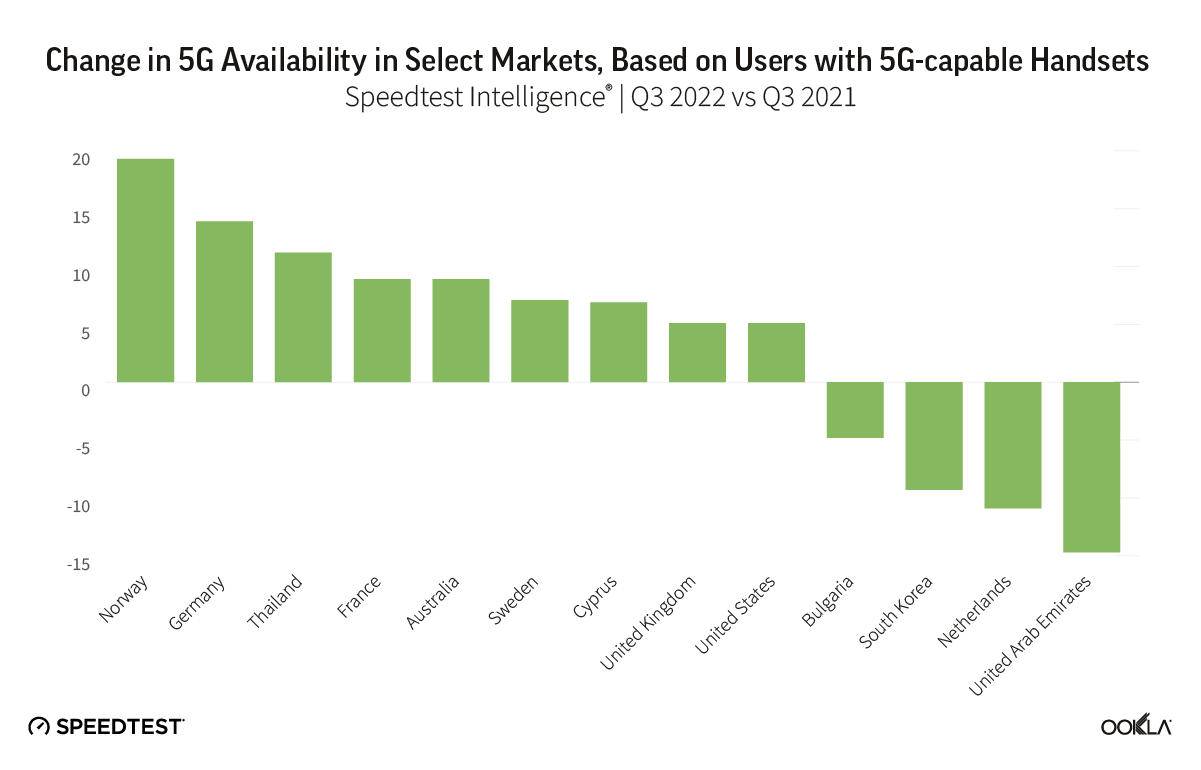
Speedtest Intelligence points to 5G adoption challenges in some markets, with 5G Availability dropping in Bulgaria, South Korea, the Netherlands, and the U.A.E. As more users acquire 5G-capable devices, operators need to balance their pricing models to ensure users have sufficient incentives to purchase a 5G tariff.
Where 5G continues to fail to reach
Speedtest Intelligence showed 29 countries in the world where more than 20% of samples were from 2G and 3G connections (combined) during Q3 2022 and met our statistical threshold to be included (down from 70 in Q3 2021). These are mostly countries where 5G is still aspirational for a majority of the population, which is being left behind technologically, having to rely on decades-old technologies that are only sufficient for basic voice and texting, social media, and navigation apps. We’re glad to see so many countries fall off this list, but having so many consumers on 2G and 3G also prevents mobile operators from making 4G and 5G networks more efficient. If operators and regulators are able to work to upgrade their users to 4G and higher, everyone will benefit.
Countries That Still Rely Heavily on 2G and 3G Connections
Speedtest IntelligenceⓇ | Q3 2021
Country
2G & 3G Samples
Central African Republic
76.2%
Turkmenistan
58.5%
Kiribati
51.6%
Micronesia
47.4%
Rwanda
41.1%
Belarus
39.7%
Equatorial Guinea
37.7%
Afghanistan
36.7%
Palestine
33.5%
Madagascar
27.5%
Sudan
27.4%
Lesotho
26.5%
South Sudan
26.3%
Benin
26.0%
Guinea
25.5%
Cape Verde
24.3%
Tonga
24.3%
Syria
23.4%
The Gambia
23.4%
Ghana
23.3%
Palau
22.9%
Niger
22.8%
Tajikistan
22.7%
Mozambique
22.4%
Guyana
21.8%
Togo
21.8%
Congo
21.1%
Moldova
20.8%
Saint Kitts and Nevis
20.0%
We were pleased to see the following countries come off the list from last year, having dropped below the 20% threshold: Algeria, Angola, Anguilla, Antigua and Barbuda, Armenia, Barbados, Bosnia and Herzegovina, Botswana, Burundi, Caribbean Netherlands, Cook Islands, Dominica, Ecuador, El Salvador, Ethiopia, Gabon, Grenada, Haiti, Honduras, Jamaica, Liberia, Mauritania, Namibia, Nigeria, Papua New Guinea, Saint Lucia, Saint Vincent and the Grenadines, Sierra Leone, Solomon Islands, Somalia, Suriname, Swaziland, Tanzania, Trinidad and Tobago, Uganda, Ukraine, Uzbekistan, Vanuatu, Venezuela, Yemen, Zambia, and Zimbabwe. While countries like Belarus, Cape Verde, Central African Republic, Guinea, Guyana, Madagascar, Palestine, Rwanda, South Sudan, Tajikistan, Togo, and Turkmenistan are still on this list, they have improved the percentage of their samples on these outmoded technologies when compared to last year by at least 10 points. Palestine improved by more than 50 points. 2G and 3G samples in Kiribati increased 3.2 points when comparing Q3 2022 to Q3 2021.
We’re glad to see performance levels normalize as 5G expands to more and more countries and access improves and we are optimistic that 2023 will bring further improvements. Keep track of how well your country is performing on Ookla’s Speedtest Global Index™ or track performance in thousands of cities worldwide with the Speedtest Performance Directory™.
Ookla retains ownership of this article including all of the intellectual property rights, data, content graphs and analysis. This article may not be quoted, reproduced, distributed or published for any commercial purpose without prior consent. Members of the press and others using the findings in this article for non-commercial purposes are welcome to publicly share and link to report information with attribution to Ookla.
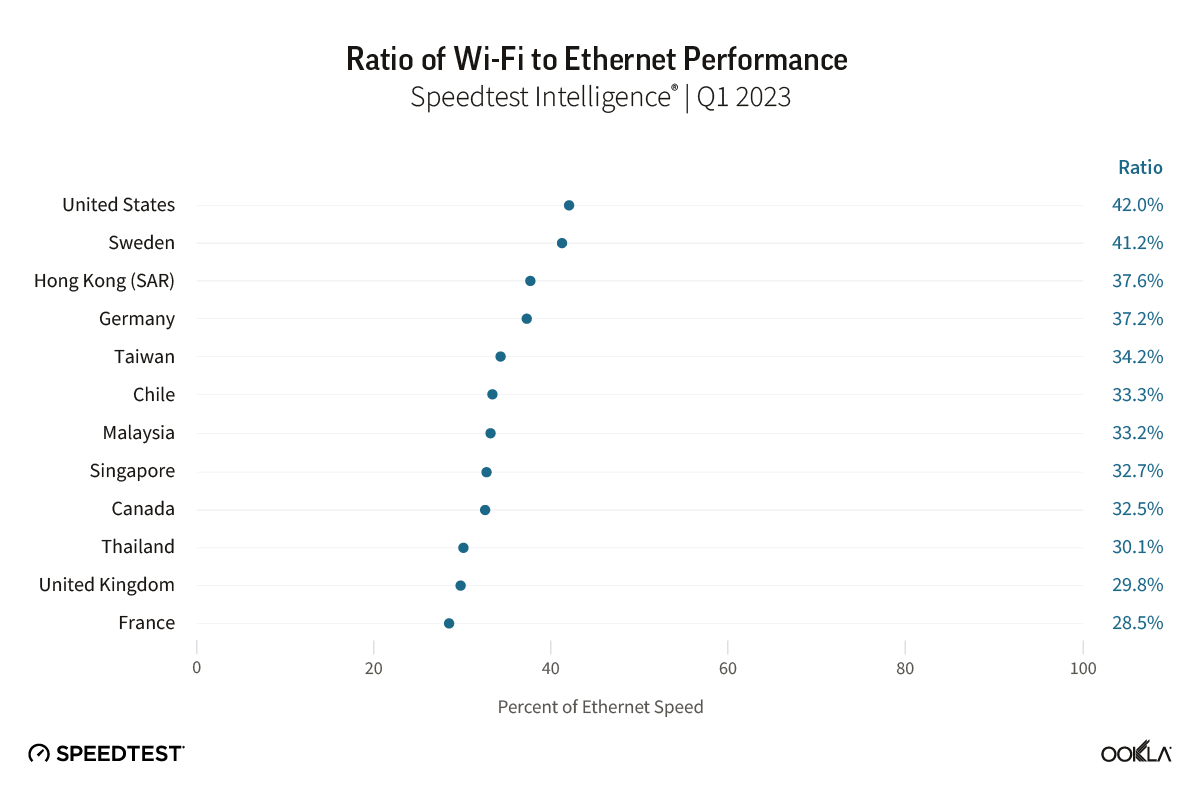
Wi-Fi woes continue. Ookla® Speedtest Intelligence® data shows Wi-Fi performance continues to lag behind ethernet performance within home networks in many advanced fixed broadband markets, with Wi-Fi speeds typically ranging from between 30-40% of ethernet speeds during Q1 2023.
Developed Asian and North American markets lead the charge to Wi-Fi 6/6E. Wi-Fi 4 and 5 remain the dominant Wi-Fi access technologies globally, accounting for a combined 89% of Speedtest® samples during Q1 2023. However, a number of advanced fixed broadband markets are rapidly migrating to Wi-Fi 6 and 6E, with China, Hong Kong (SAR), Singapore, Canada, and the U.S. leading the charge.
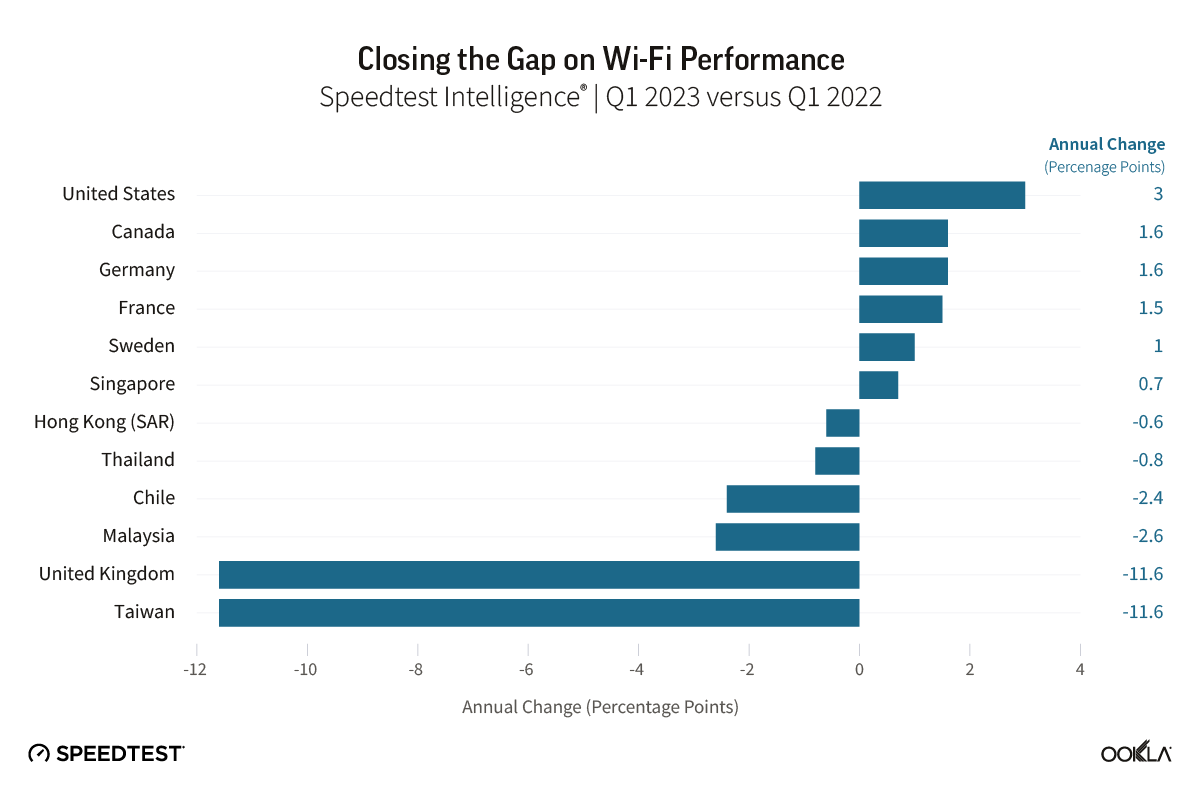
Growing Wi-Fi 6/6E adoption helps narrow the gap in Wi-Fi performance. In markets such as Canada, France, Germany, Singapore, Sweden, and the U.S., where the transition to fiber is more advanced, and where ISPs are actively driving adoption of Wi-Fi 6/6E routers, we see Wi-Fi performance closing the gap to ethernet. However, more needs to be done in other markets, where migration to more advanced fixed access networks is exposing the limitations of the installed base of Wi-Fi routers.
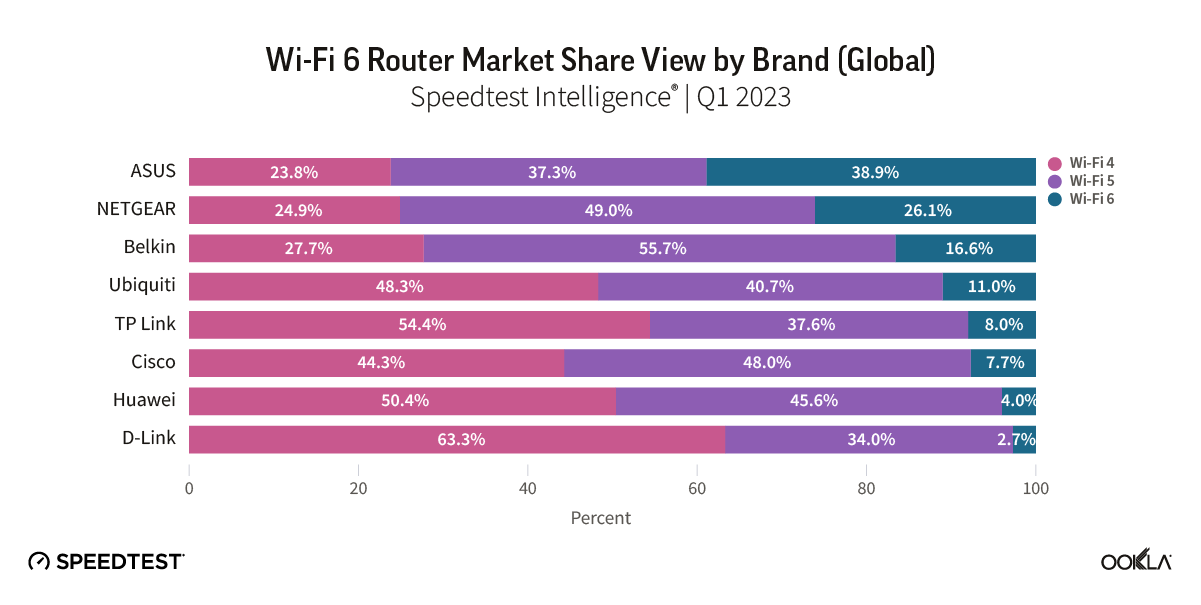
Router vendors pushing the envelope with Wi-Fi 7 capable launches. ASUS leads the market for Wi-Fi 6/6E routers among Speedtest samples, and both ASUS and other leading router vendors have been quick to launch Wi-Fi 7 capable routers. Despite this, Wi-Fi 6 and 6E remain the growing component of their installed bases. ASUS leads the market according to Speedtest Intelligence with 39% of its routers we sampled supporting Wi-Fi 6/6E during Q1 2023, well ahead of second placed NETGEAR with 26%.
Smartphone device support indicates Wi-Fi 6/6E should remain the immediate focus for ISPs. With the two largest smartphone vendors globally, Samsung and Apple, currently shunning Wi-Fi 7, ISPs waiting to see if they can leapfrog Wi-Fi 6E to Wi-Fi 7 should stay their hands. The fact that China still needs to allocate the 6 GHz spectrum band — key for Wi-Fi 6E and 7 — for unlicensed use is also significant, and appears to have weighed on the Wi-Fi 6E adoption among China’s leading Android smartphone manufacturers.
Wi-Fi performance continues to lag ethernet within the home
ISPs in advanced fixed broadband markets are increasingly looking to offer more advanced Wi-Fi routers and solutions such as mesh networks, which are designed to improve Wi-Fi coverage and performance. However, Speedtest Intelligence data shows that more needs to be done to improve Wi-Fi performance, which typically ranged from between 30-40% of ethernet speeds. Median Wi-Fi performance as measured by Speedtest will tend to lag behind median ethernet performance, depending on distance of the end-user device from the router, including any obstacles and signal interference the Wi-Fi signal needs to traverse to reach the device.
Our analysis of Speedtest Intelligence data reveals that driving greater adoption of more advanced Wi-Fi routers can help ISPs narrow the gap between Wi-Fi and ethernet performance, with ISPs in Canada, France, Germany, Singapore, Sweden, and the U.S. already successfully doing so over the past year.
Despite this, the results are not always positive, with the gap between Wi-Fi and ethernet performance widening, in particular in the U.K. and Taiwan. Where markets are rapidly migrating from more legacy fixed broadband technology to advanced cable and fiber connections, Wi-Fi performance can lag relative to ethernet, indicating a need to accelerate the adoption of more advanced Wi-Fi technologies.
Older generations of Wi-Fi 4 and Wi-Fi 5 remain dominant globally
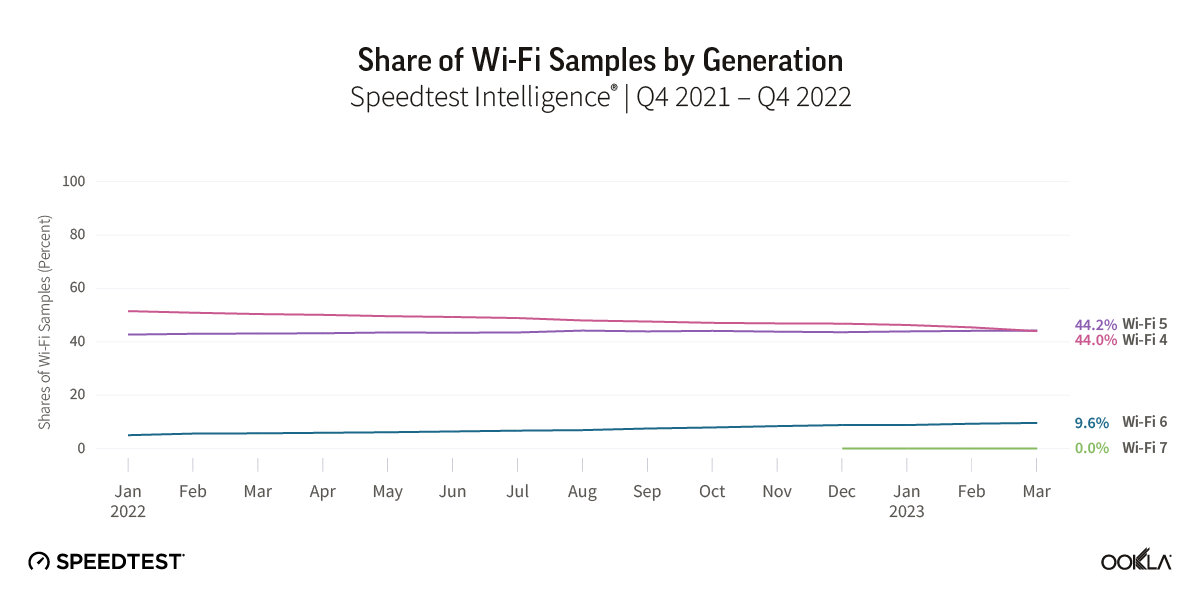
While much of the focus of the device ecosystem is on spurring adoption of the latest Wi-Fi standards, there is a long way to go before even Wi-Fi 6 becomes a dominant standard globally. Based on Speedtest Intelligence data, the proportion of Wi-Fi tests by generation (a good proxy for adoption) shows that Wi-Fi 4 and Wi-Fi 5 remain the dominant router technology, with Wi-Fi 6 representing just under 10% as of February 2023, and Wi-Fi 7 showing very few samples. The share of samples from Wi-Fi 4 routers has fallen by 6 ppts year-over-year, while Wi-Fi 5’s share of samples has marginally increased.
Asian and North American ISPs lead the charge to Wi-Fi 6 and beyond
ISPs are the main driver behind the adoption of new Wi-Fi standards, as highlighted by a 2022 study by Parks Associates, which found that 52% of U.S. consumers acquired their router from their ISP. Rolling out more advanced routers to their customer bases enables them to take advantage of the increased performance of newer generations of Wi-Fi technology, and helps to ensure ISPs deliver faster speeds, particularly over fiber access networks.
Adoption of Wi-Fi 6 varies by market, even among the most developed fixed broadband markets globally. ISPs in a number of advanced fixed markets have already begun offering Wi-Fi 6E routers to their customer bases, with ISPs in North America in particular moving in this direction, including Bell Canada, Rogers, Telus, Verizon, XFINITY, Charter, and Frontier, as well as leading ISPs in advanced Asian and European markets.
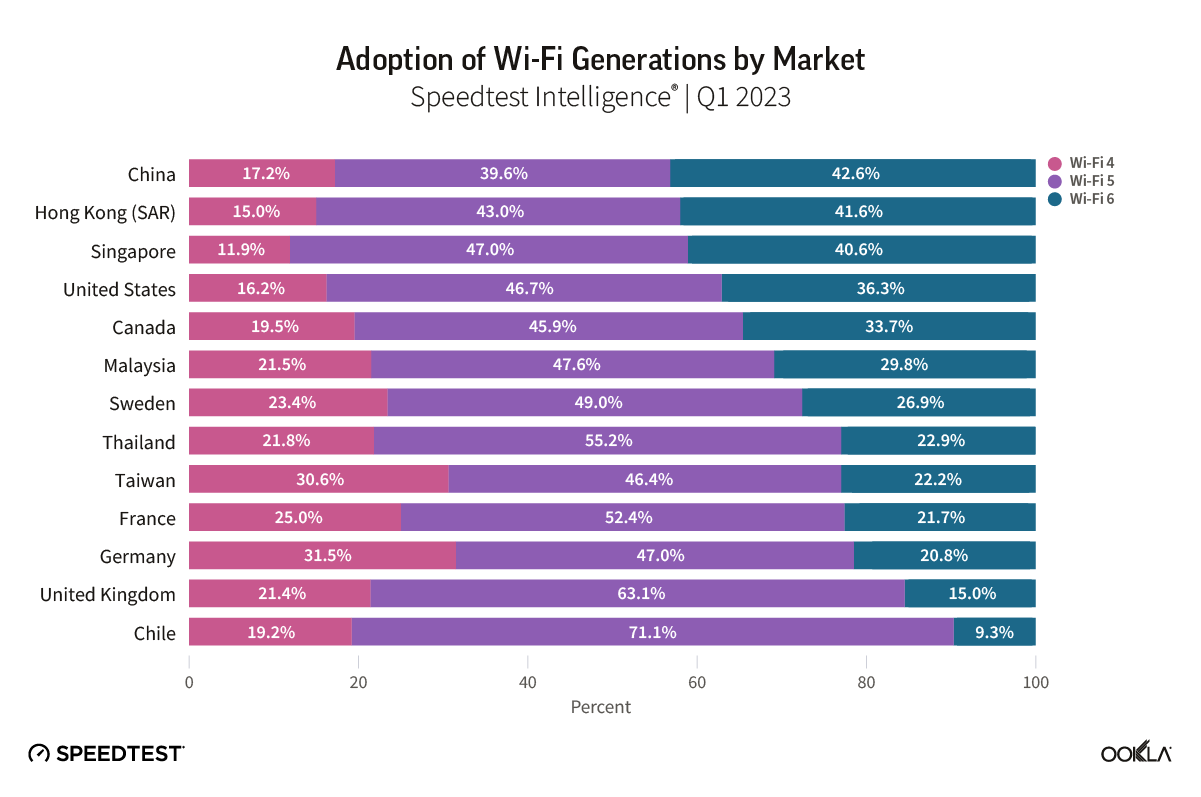
Markets in Asia led the way on Wi-Fi 6 adoption, with China and Hong Kong both recording 42% adoption, followed by Singapore with 37%. Outside of Asia, North America showed the next highest level of adoption, with the U.S. and Canada recording 32% and 30%, respectively. European fixed markets lagged behind, with adoption ranging from 13% in the U.K., to 24% in Sweden. For markets such as Chile, which placed towards the top of the Ookla Speedtest Global Index™ for median fixed broadband speeds, a relatively low-level of Wi-Fi 6 adoption (8% in Q4 2022) signals further opportunity for ISPs in the market to boost performance.
The fastest growing markets, in terms of increasing share of Wi-Fi 6 of Speedtest samples year-over-year in Q1 2023, were Canada and Malaysia (+15 ppts), Singapore (+14 ppts), and Hong Kong (+12 ppts). While there was considerable variance between ISPs within each market, leading ISPs such as SmarTone (Hong Kong), DiGi (Malaysia), and ViewQwest (Singapore), are prompting a competitive response so that even ISPs with lower levels of Wi-Fi 6 adoption are prioritizing the technology and seeing adoption grow steadily.
Country
ISP
Wi-Fi 6 %, Q1 2023
Hong Kong (SAR)
SmarTone
62.4%
Canada
Bell pure fibre
57.3%
Singapore
ViewQwest
53.7%
Singapore
MyRepublic
50.3%
Malaysia
Digi
50.2%
Malaysia
Maxis
49.0%
Hong Kong (SAR)
NETVIGATOR
44.2%
Canada
Rogers
43.4%
Singapore
M1
41.7%
Singapore
SingTel
41.4%
Canada
Telus PureFibre
41.0%
Hong Kong (SAR)
HKBN
41.0%
Canada
Shaw
39.0%
Singapore
StarHub
35.6%
Hong Kong (SAR)
HGC
30.0%
Malaysia
TIME
28.8%
Malaysia
TM
21.5%
In addition to providing newer routers, ISPs are increasingly positioned to help consumers solve Wi-Fi performance issues in the home, such as offering mesh Wi-Fi solutions. For some ISPs, this has even taken precedence over offering newer Wi-Fi 6E routers, as they look to improved coverage within the home as a faster route to improving Wi-Fi performance.
In the U.K., BT has prioritized whole-home coverage over Wi-Fi 6E with its BT Complete Wi-Fi (mesh) offer, despite the U.K. regulator Ofcom having released the lower portion of the 6 GHz band for unlicensed use in 2020. In Canada, Telus, while having recently released a Wi-Fi 6E router for its broadband users, also offers its WiFi Plus package, which includes professional installation and “wall-to-wall coverage” throughout the home. Rogers also offers guaranteed Wi-Fi coverage throughout the home, as well as Wi-Fi 6E routers. Plume offers a subscription-based service, HomePass, across a number of markets, which allows users to add additional access points to help eradicate not-spots or poor Wi-Fi signal within the home and also offers solutions for ISPs looking to improve their Wi-Fi offerings. In Hong Kong, China Mobile Hong Kong (CMHK) was the first ISP in the market to offer a fiber-to-the-room service, while it and other ISPs such as NETVIGATOR offer consumers the option to subscribe to multiple channels over fiber with separate IP addresses, allowing them to divide their activities across channels and thereby help avoid congestion.
To capture the full performance benefits of Wi-Fi 6E and Wi-Fi 7, countries must allocate 6 GHz spectrum for unlicensed use, therefore allowing Wi-Fi devices to access this higher frequency, higher capacity spectrum, and utilize wider channels. At present, according to the Wi-Fi Alliance, allocation of the lower portion of the 6 GHz spectrum band (5,925 MHz to 6,425 MHz) is common among developed economies, with some notable exceptions in some developed markets in Asia and Asia Pacific, in particular China, while allocation of the full 6 GHz band is more limited, available across North America and some Latin American markets, as well as Saudi Arabia and South Korea.
Wi-Fi 7 on the horizon as router vendors continue to push the envelope on performance
Wi-Fi performance continues to scale, and with Wi-Fi 7 routers and smartphones having launched in the second half of 2022, that trend is set to continue. In addition to higher throughput, successive Wi-Fi generations also support lower latency, helping to better support higher quality video streaming, cloud gaming, and future use cases linked to concepts such as the Metaverse and other uses of extended reality (XR).
The major silicon vendors, Broadcom, Qualcomm, and Mediatek, were quick to update their solutions to support the emerging Wi-Fi 7 standard, and hardware vendors have followed suit. Chinese vendor H3C was the first to launch with its H3C Magic BE18000 Wi-Fi 7 router in July 2022, and it has since been followed by other major vendors including tp-link, ASUS, and more recently NETGEAR. However, the prices of early Wi-Fi 7 routers that take advantage of Wi-Fi 7’s range of enhanced performance capabilities will be a barrier to entry for many, with tp-link’s flagship Archer BE900 currently retailing at a cost of $699.99.
Speedtest Intelligence data shows minimal Wi-Fi 7 adoption as of March 2023, however we are likely to see the same vendors drive Wi-Fi 7 adoption that are currently leading on Wi-Fi 6. Based on global Speedtest Intelligence samples, we see ASUS leading the market in Wi-Fi 6 penetration, with 39% of samples recorded using Wi-Fi 6 compatible routers. NETGEAR and Belkin followed, but for the remaining major router vendors, Wi-Fi 6 penetration currently stands at close to 10% or below. Wi-Fi 6E remains a small but growing subset of Wi-Fi 6 certified devices, currently standing at 7.7% of products based on the latest Wi-Fi Alliance data. Of these, a majority are either routers or smartphones, with an almost even split between the two.
Smartphone support indicates ISPs should focus on Wi-Fi 6E for now
With Samsung releasing its Galaxy S23 range in February 2023 without Wi-Fi 7 support, and Apple’s latest iPhone 14 smartphones limited to Wi-Fi 6, it’s clear that, for now, ISPs should prioritize the rollout of Wi-Fi 6/6E among their customer bases rather than consider leapfrogging to Wi-Fi 7. The Xiaomi Mi13 Pro was the first Wi-Fi 7 capable smartphone to hit the market, launching in December 2022, although it was limited to Wi-Fi 6E initially, requiring a software update to enable Wi-Fi 7. The availability of Wi-Fi 7 supporting Android smartphones will grow through 2023, enabled by SoCs from leading vendor Qualcomm with its flagship Snapdragon 8 Gen 2, and MediaTek with its Dimensity 9200. Apple, on the other hand, lags on the latest Wi-Fi standard support, with the iPhone 14 series featuring Wi-Fi 6, and with its fall 2023 models rumored to be adding Wi-Fi 6E to their feature list.
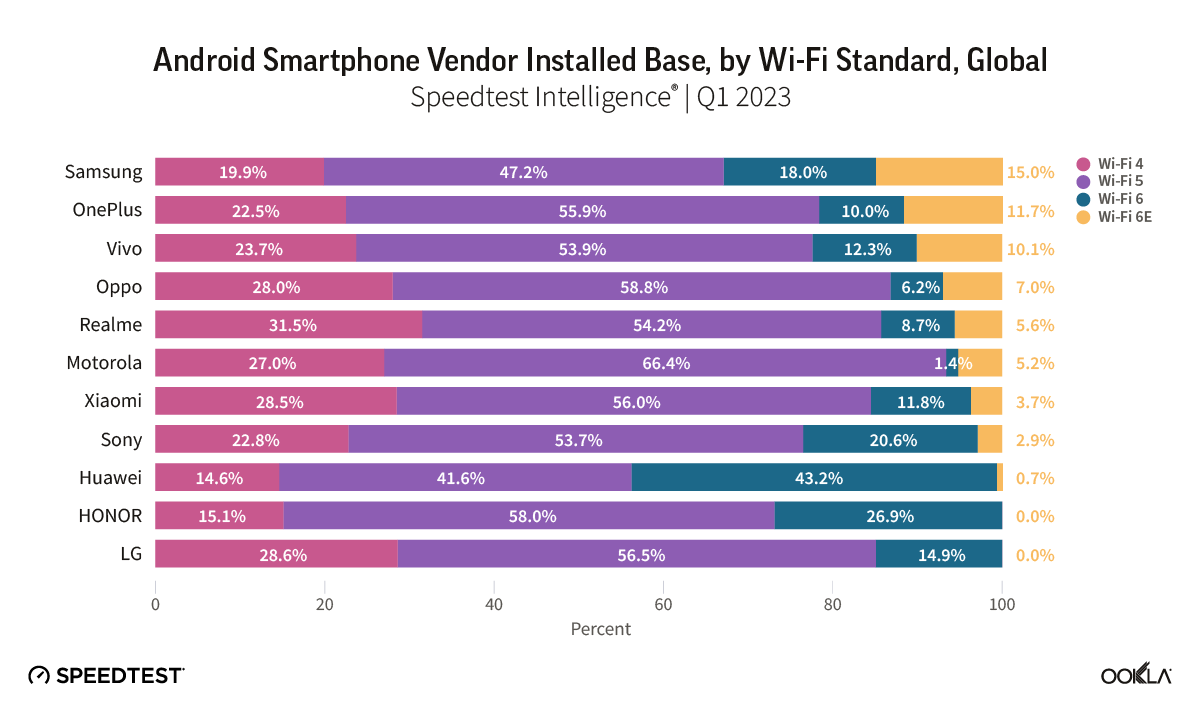
Samsung, as the leading Android smartphone vendor globally, has the largest installed base of smartphones supporting Wi-Fi 6 and Wi-Fi 6E, and has stolen a march on its main rivals Xiaomi, OPPO, and Vivo. While the major Chinese smartphone vendors have launched Wi-Fi 7 compatible devices, the lack of assignment of 6 GHz spectrum for unlicensed use in China does appear to have held them back relative to brands such as Samsung and ASUS.
The outlook for Wi-Fi in the home
It’s clear from the gap between Wi-Fi and ethernet performance that ISPs need to do more to improve the customer experience for Wi-Fi users within the home. Part of the solution lies in rolling out more advanced generations of Wi-Fi technology, given Wi-Fi 4 and 5 remain the dominant technologies deployed globally. However, evidence linking increased adoption of Wi-Fi 6 to overall Wi-Fi closing the gap to ethernet performance is mixed, and validates the approach of ISPs looking to also offer mesh networking Wi-Fi solutions. Contact us to find out more about how Ookla Research can help you monitor the performance of your networks, and stay ahead of the competition.
Ookla retains ownership of this article including all of the intellectual property rights, data, content graphs and analysis. This article may not be quoted, reproduced, distributed or published for any commercial purpose without prior consent. Members of the press and others using the findings in this article for non-commercial purposes are welcome to publicly share and link to report information with attribution to Ookla.
In this article, we will look at the real-life performance of mmWave in the United States, reflect on its progress so far across the globe, and discuss what the future holds.
Key takeaways
mmWave received additional spectrum as part of Release 17, in addition to the spectrum already allocated by Rel-15 and WRC-19. 5G connectivity using mmWave substantially improves 5G performance (increasing theoretical speeds to up to 5 Gbps). At the same time, it comes with a challenge because of its limited range, which can be easily blocked or obscured, necessitating a high degree of network densification, which comes with additional Capex.
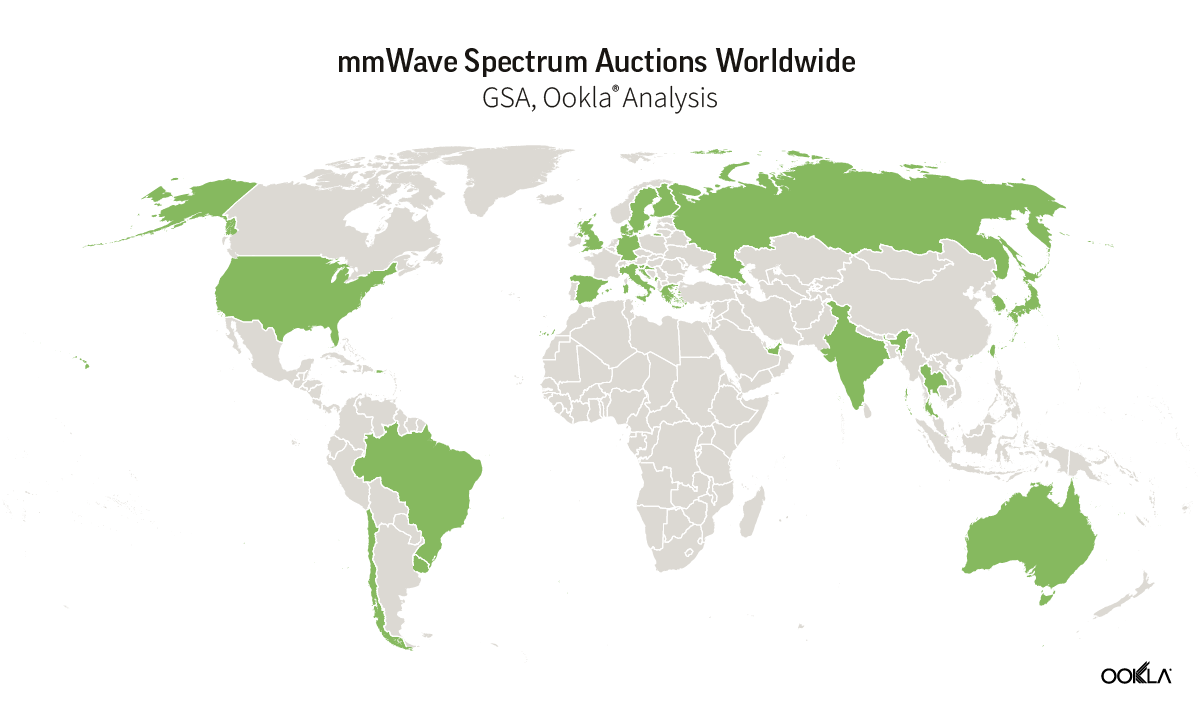
After initial enthusiasm, operators’ appetite for the mmWave band spectrum has been lackluster, with only two auctions taking place in 2022. However, we see a renewed interest, which could lead to more spectrum allocations and network launches.
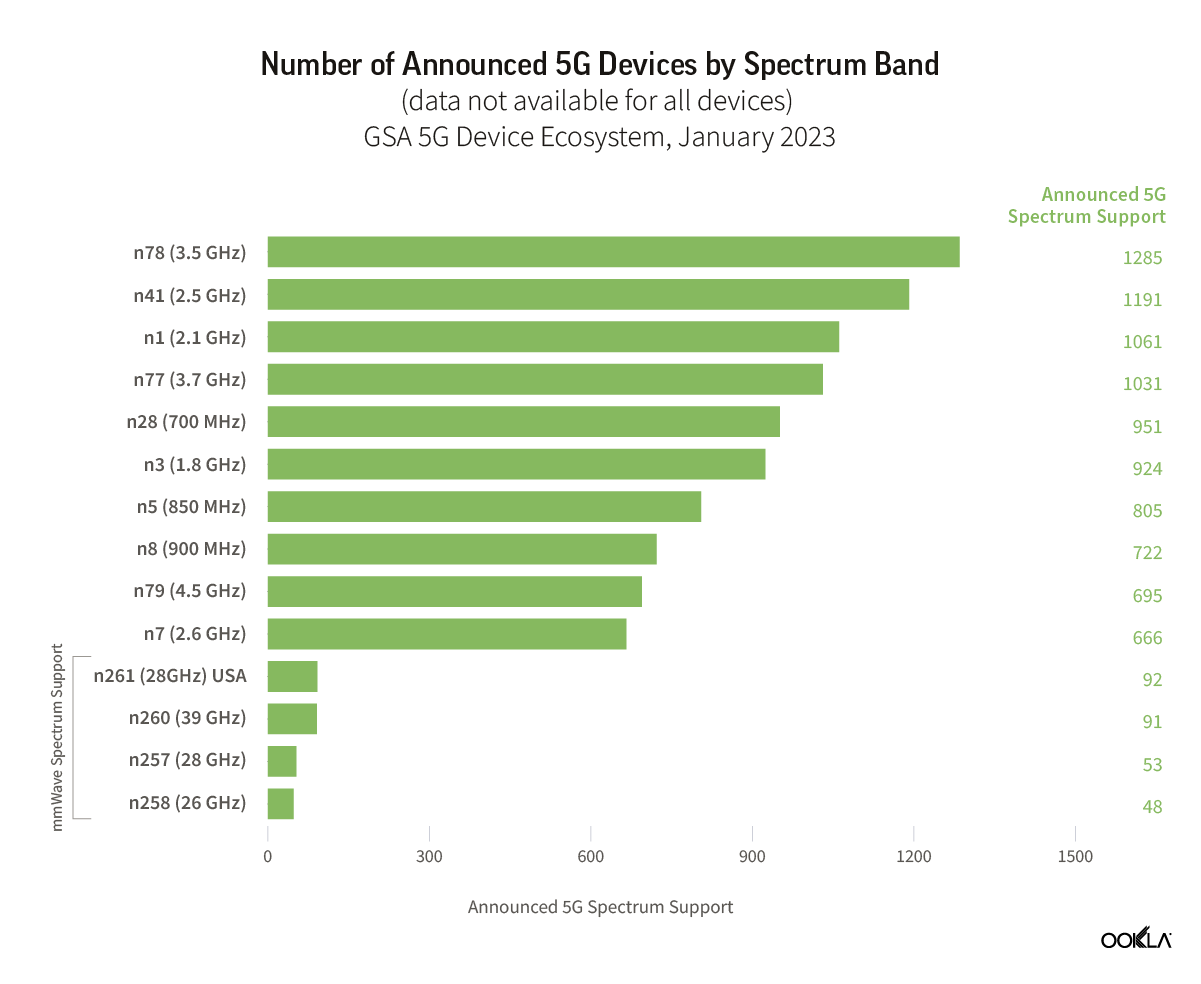
Due to the limited rollout of mmWave 5G networks, the device ecosystem has lagged behind other 5G spectrum bands. While support for mmWave spectrum bands across smartphones is skewed heavily towards the U.S., an increase in spectrum launches and networks combined with a declining ASP should lead to a growing adoption worldwide.
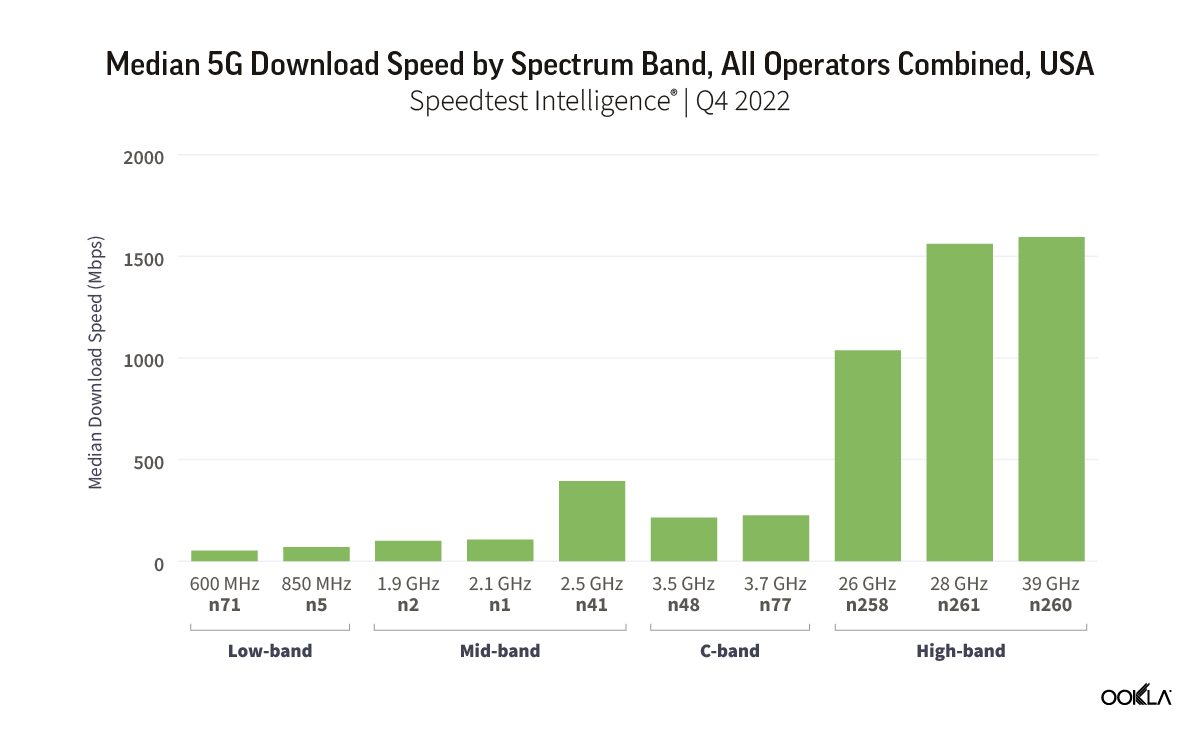
Ookla® Q4 2022 data from the U.S. shows mmWave is achieving mind blowing speeds — almost 1.6 Gbps median 5G download speed — 26 times faster than the median 5G speed on low-band, almost seven times faster than the C-band, and four times than mid-band.
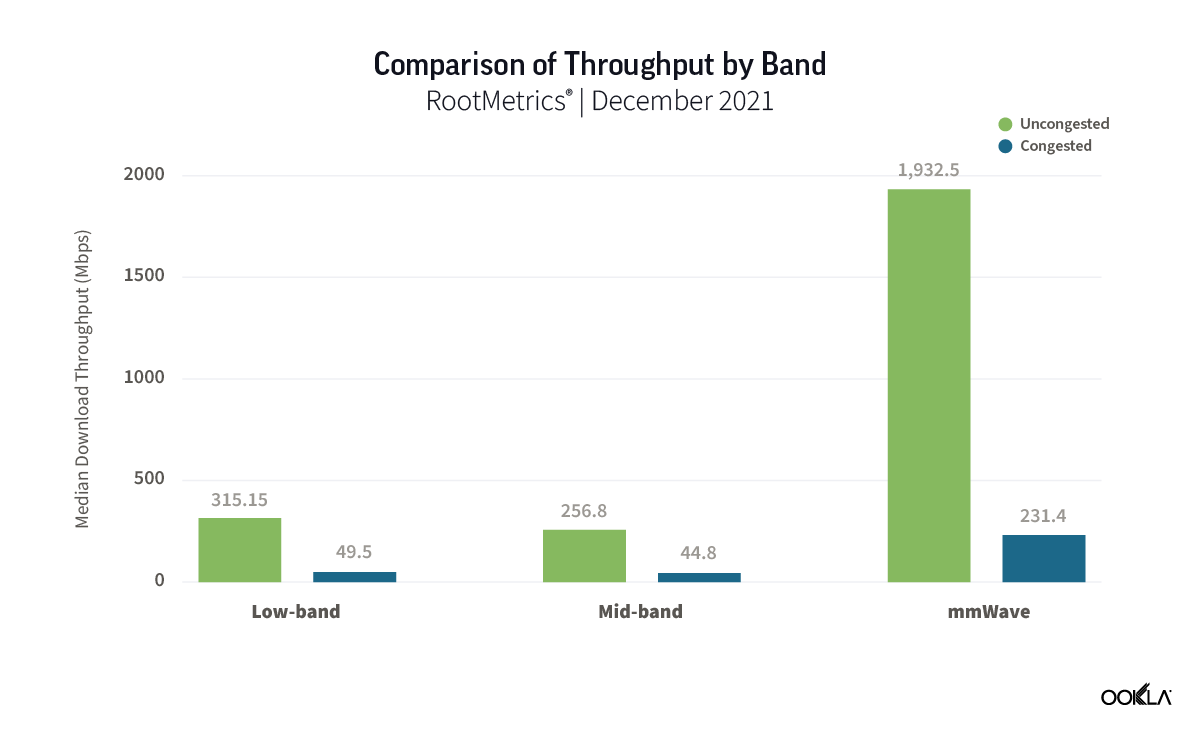
RootMetrics® tested mmWave performance simulating congested network environments and concluded that even in such conditions, mmWave spectrum could achieve four times faster throughput than mid- and low-band spectrum.
mmWave spectrum allocation and commercialization
Oftentimes, consumers complain about 5G speeds, sold on the promise of ultra-fast mobile networks. Such speeds can only be delivered utilizing the mmWave spectrum band. Up until and including 4G LTE, operators have been deploying networks in the sub-6 GHz spectrum. It was only with Release 15 that the telecom standards body 3GPP extended the spectrum ranges available for mobile networks. Frequency bands for 5G New Radio (NR) are separated into two frequency ranges:
Frequency Range 1 (FR1) refers to sub-6 GHz frequency bands, traditionally used by previous network generations, which have been further extended to cover potential new spectrum offerings from 410 MHz to 7125 MHz.
Frequency Range 2 (FR2) refers to frequencies above 24 GHz.
Furthermore, in November 2019, delegates of the World Radiocommunication Conference (WRC-19) identified additional radio frequency bands for IMT-2020 (the name ITU uses for 5G standards). These frequency bands are 24.25-27.5 GHz, 37-43.5 GHz, 45.5-47 GHz, 47.2-48.2, and 66-71 GHz. 3GPP’s recently completed Release 17 has further expanded the mmWave spectrum frequency range from 24.25-52.6 GHz up to 71 GHz, including support for the global 60 GHz unlicensed band.
So far, mmWave spectrum allocation has been lackluster across Europe, following initial enthusiasm in the U.S., Japan, and South Korea. According to Global Mobile Suppliers Association (GSA), 26 countries have licensed mmWave worldwide. In 2022, only two auctions took place in India and Spain in the 26 GHz frequency band. The Indian auction itself was a subject of intense debate and lobbying against its allocation in the 28 GHz band by the satellite providers. The regulator auctioned the 26 GHz band to minimize overlaps and interference issues.
However, the momentum for mmWave spectrum allocations is growing, especially in Europe. While 14 countries in Europe have licensed mmWave so far, more are planning to do so e.g., Hungary, Austria, and the United Kingdom, which should lead to more deployments and create economies of scale that the mmWave device ecosystem currently lacks.
Beyond consumers, mmWave can address the needs of enterprise applications that require higher bandwidth and lower latency, such as factory robots or AGVs. For example, Italian manufacturer Exor International partnered with Intel, TIM, and JMA Wireless to build an end-to-end smart factory in Verona to showcase the benefits that Industry 4.0 brings to manufacturing utilizing sub-6 GHz and 26 GHz spectrum. It is worth noting that several regulators have created an encouraging environment for enterprises to deploy their own dedicated networks by allocating spectrum for vertical use across mid- and high-frequency bands. So far, ten countries have set aside mmWave spectrum for enterprises, including Australia, Denmark, Germany, Greece, Japan, Hong Kong, Finland, Sweden, South Korea, and the U.K. Japanese Fujitsu deployed a private 5G network combining 4.7 GHz SA and 28 GHz.
The growing pains of the mmWave device ecosystem
The South Korean example offers a cautionary tale regarding 5G mmWave readiness.
In 2018, three operators — SK, KT, and LG U+ — spent 620 billion Won ($435 million) on a five-year license for the 28 GHz spectrum. As part of the license conditions, operators had to deploy 15,000 base stations by the end of 2021. Following an audit by the Ministry of Science and IT (MSIT), KT and LGU+ had their licenses revoked, and SK Telecom was reduced by six months. One key challenge operators pointed to was the need for a mature mmWave devices ecosystem in the market.
Looking at the latest GSA data, this is indeed the case. Across the commercially available 5G devices that GSA has identified spectrum support information, most devices (85.7%) support the sub-6GHz band and only 8.9% mmWave spectrum.
However, mmWave device availability differs depending on the geography with smartphone availability heavily skewed to the U.S. For instance, all iPhone 12-14 models in the U.S. support both mmWave and sub–6 GHz 5G connectivity; this was not the case in South Korea. Across Android-based smartphones, the story is similar. The Pixel 6 Pro includes mmWave 5G support only in the U.S., Australia, and Japan. There is also a price difference across devices that offer support for mmWave. For example, Google Pixel 6 is available in two versions in the U.S. — an unlocked version with sub-6 GHz 5G for $599 and another with mmWave 5G for $699. The latter is offered via operators such as Verizon and AT&T. The price difference is likely due to the mmWave requirement for specialized radio hardware and antennas. Yet, on average, the price delta between sub-6 GHz and mmWave smartphones is narrowing down to $10- $20, Counterpoint Research shows.
Furthermore, Counterpoint sees consumer awareness and adoption growing in the U.S. According to its U.S. smartphone users survey, 60% of users checked before purchasing whether a 5G Smartphone has 5G mmWave capability, while 43% of users in the future plan to subscribe to 5G mmWave services and smartphones. Beyond the U.S., Counterpoint sees one billion cumulative 5G mmWave smartphone shipments between 2019 and 2026, with mmWave smartphone penetration reaching 26% by 2026, compared to 13% in 2022.
mmWave supports FWA
Fixed Wireless Access (FWA) is often considered one of the most successful 5G use cases as we recently pointed out. Some operators leverage mmWave to offer FWA services, for example, in April 2022, US Cellular launched 5G Home Internet using mmWave spectrum (28 GHz and 39 GHz) in partnership with Qualcomm and Inseego across ten cities. In Italy, Fastweb collaborated with Qualcomm to commercialize 5G SA mmWave services in March 2022, following a partnership to deliver 5G FWA to 400 cities. Vendors are vying to address this opportunity too. Recently, Mavenir launched an FWA solution that supports massive MIMO and 5G mmWave for 4G, 5G NSA, and 5G SA deployments. This FWA platform has been deployed by several customers, such as 360 Communications, RINA Wireless, Triangle Communications in the U.S., and Quickline in the U.K.
mmWave delivers on the promise of gigabit speeds
The U.S. is a global leader in using mmWave spectrum, with AT&T, T-Mobile, and Verizon using mmWave to offer mobile service, while US Cellular deploys it for FWA. Speedtest Intelligence® data shows that 5G connectivity using mmWave can reach staggering speeds of up to 1.6 Gbps. Comparing 5G performance across spectrum bands across mobile operators in the U.S. used for 5G services — low-, mid-, C-band, and high-band (mmWave) — it is clear that mmWave delivers superior performance. Our data shows that users on 5G mmWave achieved speeds that are 4.29 times faster than mid-band, 6.86 times faster than C-band, and a staggering 26.1 times faster than a low band.
Due to its high throughput, mmWave is particularly useful for streaming and gaming. For example, at CES 2023, Razer unveiled its new Razer Edge, the first Android handheld gaming tablet on the market. The device can play games locally on the device or stream them remotely via 5G. The Razer Edge 5G became available from Verizon on January 26.
Mmwave also offers the advantage of lower latency — anything over 20 ms will give gamers a headache, according to Qualcomm.
mmWave helps with network congestion too
Speaking at the Citi 2023 Communications, Media & Entertainment conference, Kyle Malady — Verizon’s Executive VP, President of Global Networks & Technology, noted that the operator has deployed over 40,000 mmWave nodes, which support its 5G services in dense, urban environments. He also stated, “And now that millimeter wave technology turns into a tool for RF engineers to use in hotspots that they have and C-Band.”
A RootMetrics study supports this, based on several tests conducted in December 2021 to simulate the performance of the 5G spectrum in a congested environment. While, unsurprisingly, the results showed speeds in congested environments were slower on all bands than when congestion wasn’t present, there was a difference when it came to bands in use: mmWave 5G delivered a median download speed of 231.40 Mbps, which was over four times faster than the speeds recorded on either mid-band or low-band 5G, both of which were below 50 Mbps (44.80 Mbps on mid-band and 49.50 Mbps on low-band). To put mmWave’s capacity boost in a different perspective, its speed of 231.40 Mbps with congestion was nearly as fast as the 256.80 Mbps recorded on mid-band 5G without congestion. RootMetrics’ study showed that mmWave provides speeds 4-5 times faster than those of mid- and low-band in congested circumstances, delivering on its promise of providing greater capacity and faster speeds under heavy network load.
Millimeter wave also lends additional capacity in dense areas such as stadiums. Poor performance during events such as concerts stems from the networks needing to deal with extra demand and becoming congested. Constraints on the spectrum allocated to 5G today can impact performance more in places like stadiums than in other areas because many users are concentrated in a small space and share the same limited spectrum. To illustrate how mmWave enables better network performance, we can look to Ookla Wind® walk testing data, which can show the benefits of mmWave in terms of 5G bandwidth. Since each carrier is 100 MHz wide, a test showed that a stadium used four carriers aggregated 80% of the time, which resulted in 400 MHz of 5G bandwidth. In turn, this helped to achieve higher 5G capacity and lower latency.
Another benefit of mmWave that the Wind test showed is that with the mmWave 5G NSA network, most of the user data traffic is carried by mmWave spectrum only (contrary to other 5G bands in NSA). This reduces the load on the LTE network. This, in turn, allows legacy users with non-5G capable devices to use an LTE network that is less congested because it doesn’t have to support 5G devices as well.
We will examine the relationship between spectrum and 5G performance in future articles. Subscribe to Ookla Research™to stay up to date on our analyses.
Ookla retains ownership of this article including all of the intellectual property rights, data, content graphs and analysis. This article may not be quoted, reproduced, distributed or published for any commercial purpose without prior consent. Members of the press and others using the findings in this article for non-commercial purposes are welcome to publicly share and link to report information with attribution to Ookla.