Here’s what Chile’s 12-hour nationwide power outage looked like according to mobile Speedtest data
A major transmission line failure caused a massive power outage across most of Chile. The outage began in the afternoon of February 25th and lasted approximately 12 hours, into the early morning of February 26th. Critical facilities like hospitals had to rely on backup power generators and the outage was disruptive enough that a state of emergency was declared for the country.
How did mobile networks perform during the outage? This article looks at mobile networks’ performance through SpeedtestⓇ metrics of sample counts (i.e., the number of completed Speedtests) and download speeds.
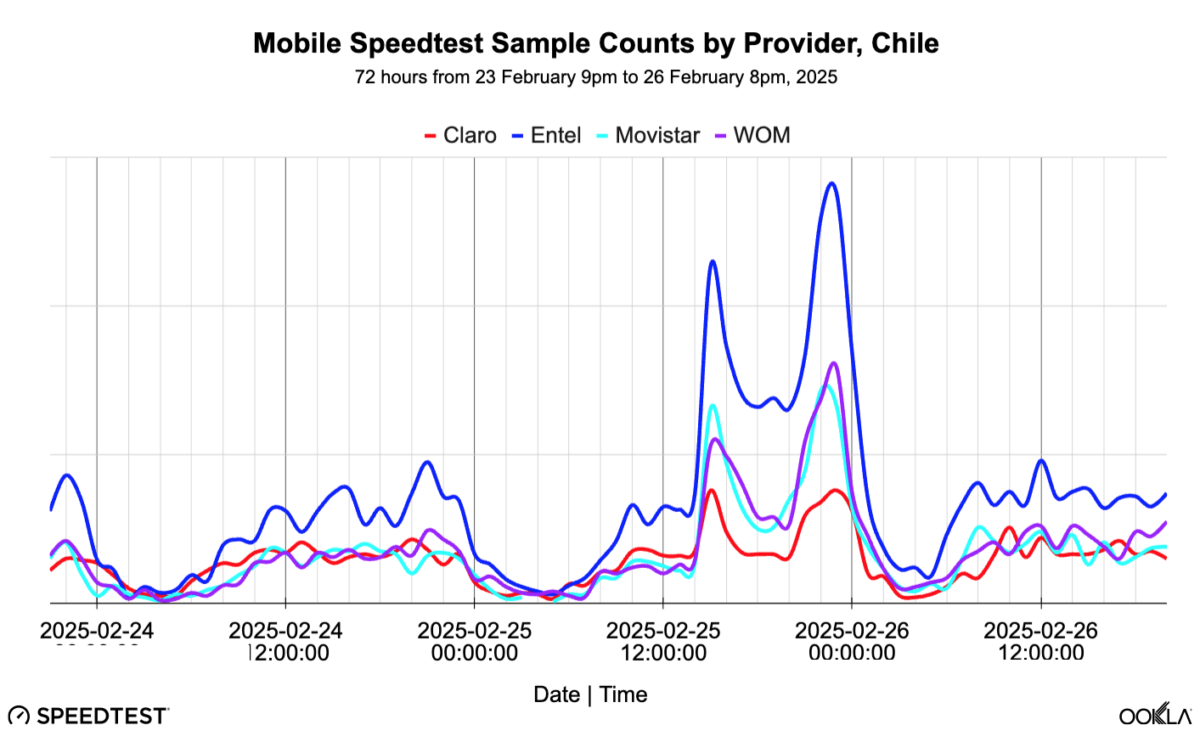
Ookla examined the hourly Speedtest sample counts of the main four mobile carriers in Chile over a 72-hour period. Prior to noon on February 25, 2025, the networks performed in a normal state with fewer samples in the night and more in the day.
The outage reportedly started at 3:16 p.m., which matches the spikes in the counts of Speedtest users checking on the network. Comparing the 12-hour outage to the same time the day before, the rate of testing was over 2.5x. This behavior is typical of, and similar to, mobile network outages seen around the world. Staying connected in an emergency is critically important, so checking the status of the network makes good sense.
By the morning of February 26, 2025, when the outage is over and power restored, there is more testing than the prior two mornings. This is likely due to many people checking their phones upon waking up, so it isn’t unusual to see more aggressive testing than usual.
How did the mobile networks perform?
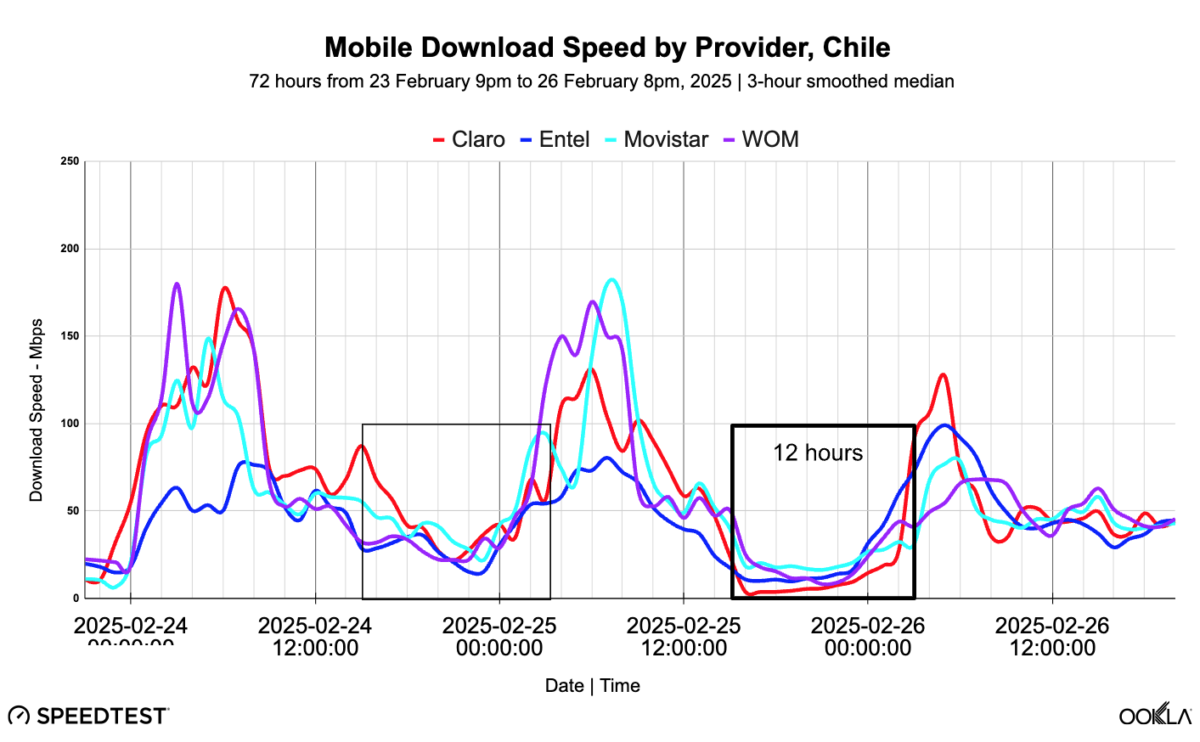
When mobile networks are “unloaded” — that is, not carrying much traffic — as they usually are at night, Speedtest users clock faster speeds. These are the peaks in the chart. The valleys are the times when most people are active and more loading occurs, resulting in slower speeds.
Selecting the 12 hours of the power outage (the labeled box) and the same 12 hours the prior day (the unlabeled box), the median download speed for the group of operators was effectively cut in half — 16.42 Mbps during the power outage compared to 33.68 Mbps before.
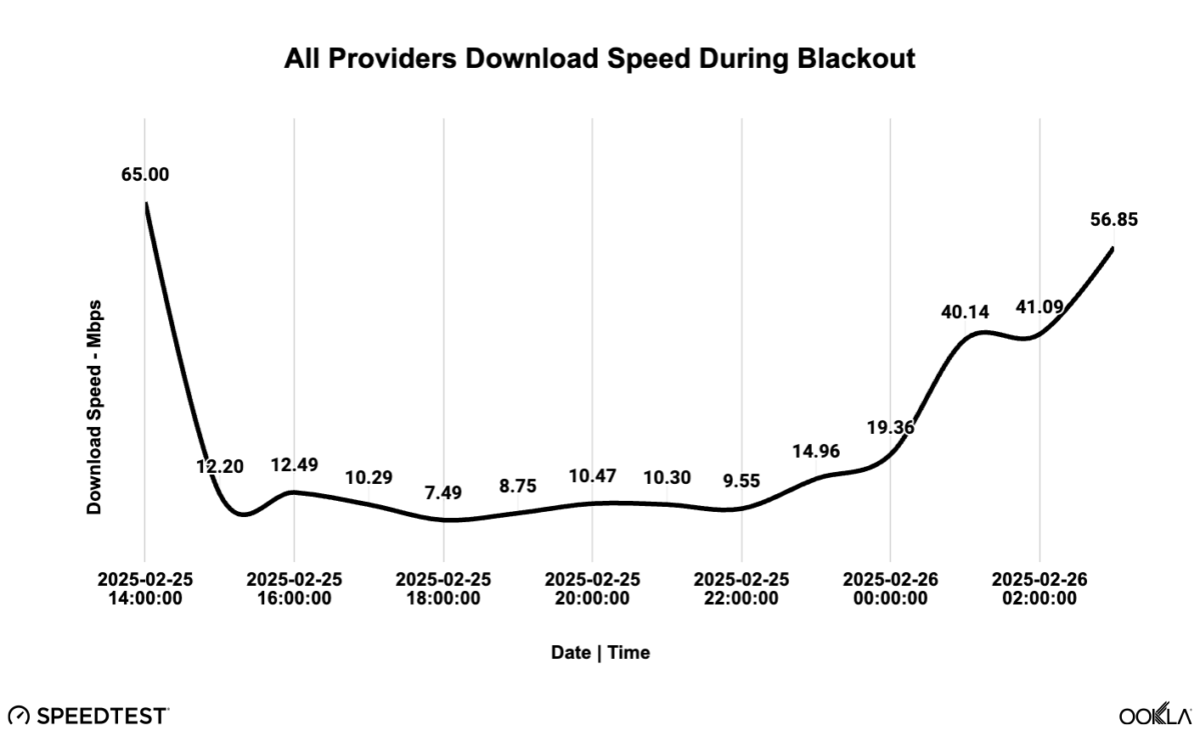
Taking a closer look at all the mobile service providers together, from the outage starting just after 3 p.m., median download speed initially held around 12+ Mbps, then dipped to its low point during the 6 p.m. hour at 7.49 Mbps. Thereafter and until recovery started around 11 p.m., download speeds remained in a narrow range around 9-10 Mbps through the 10 p.m hour. While these median download speeds wouldn’t be considered fast, they do suggest that the mobile networks were serviceable and customers were able to stay in touch.
However, noting that median means the middle, half of the Speedtest users were experiencing slower speeds than seen in the line chart. (And obviously, half were faster, but they wouldn’t have as poor an experience.) To get a sense of the bottom, the slowest 10th percentile for the day of the outage (February 25) compares unfavorably to the same three prior Tuesdays in February. On the day of the outage, the 10th percentile speed was below 1 Mbps – effectively unusable apart from a text message and hopefully holding a voice call. The prior three Tuesdays recorded 2.60 Mbps – still not great, but in older wireless network generations this was fast enough for watching a standard definition (SD) video.
Another observation from the closer look at All Providers Download Speed is the speed declined from early in the outage (3 p.m. to 4 p.m.) to the middle of the outage (5 p.m. to 10 p.m.). One explanation could be the network loading mentioned before, but this seems unlikely since the normal peak loading pattern would have been entirely disrupted by the power outage. A second explanation may be that backup battery power for the cell sites on mobile networks ran out. That is to say, if, for example, every site had a couple hours of battery backup, and some sites also had generators that came online after the batteries were used up, a pattern like this could be seen.
The Chilean telecoms regulator, SUBTEL, was cited in tech press to be looking into increasing the purported four-hour back up to six hours. Network hardening, whether against a power outage or other disruptions like natural disasters, is critical for network resilience.
Ookla data can offer insights into network performance, reliability, and resiliency. To find out more about Speedtest Intelligence® data and insights, please contact us here.
Cómo afectó un apagón eléctrico a la resiliencia de la red móvil de Chile
Así fue el apagón nacional de 12 horas en Chile según los datos de Speedtest móvil
Una importante avería en una línea de transmisión provocó un apagón masivo en la mayor parte de Chile. El corte comenzó en la tarde del 25 de febrero y duró aproximadamente 12 horas, hasta la madrugada del 26 de febrero. Las instalaciones críticas, como los hospitales, tuvieron que recurrir a generadores de energía de reserva y el apagón fue tan disruptivo que se declaró el estado de emergencia en el país.
¿Cómo funcionaron las redes móviles durante el apagón? Este artículo examina el rendimiento de las redes móviles a través de las métricas de recuento de muestras de SpeedtestⓇ (es decir, el número de Speedtests completados) y velocidades de descarga.
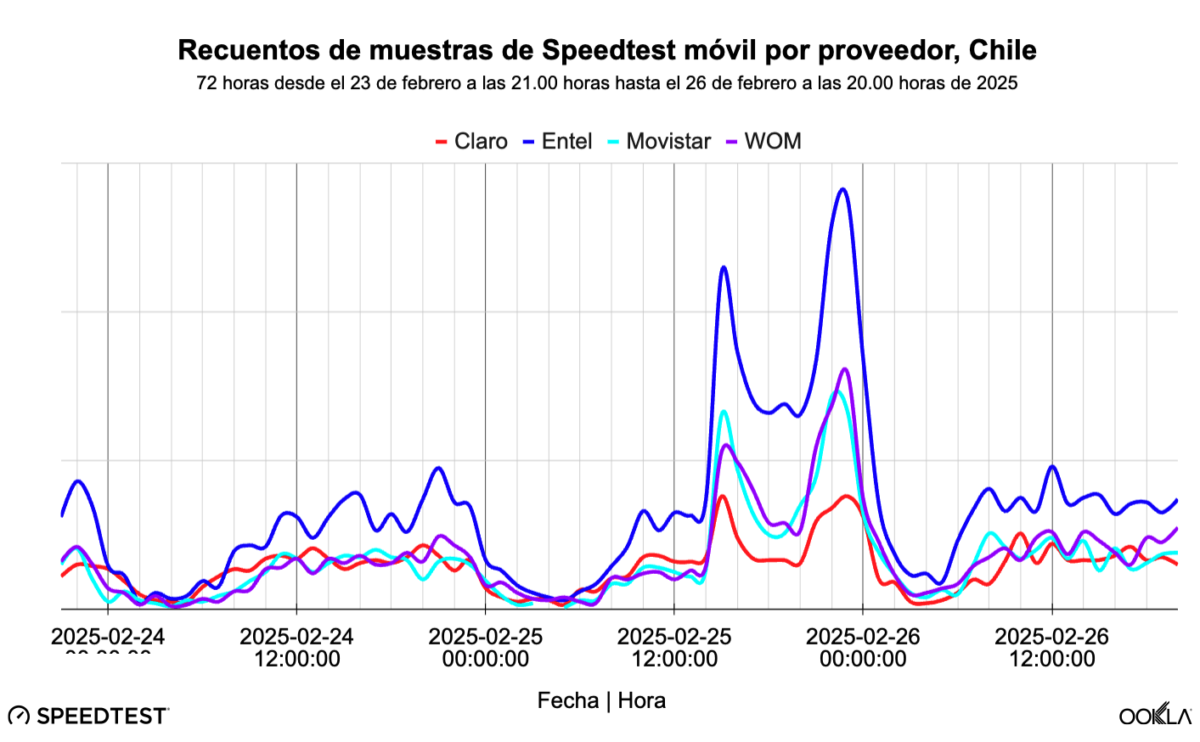
Ookla analizó los recuentos horarios de muestras Speedtest de los cuatro principales operadores de telefonía móvil de Chile durante un período de 72 horas. Antes del mediodía del 25 de febrero de 2025, las redes funcionaban de manera normal, con menos muestras durante la noche y más durante el día.
Al parecer, la interrupción comenzó a las 15.16 horas, lo que coincide con los picos en los recuentos de usuarios de Speedtest que comprueban la red. Si se compara la interrupción de 12 horas con la misma hora del día anterior, la tasa de comprobación se multiplicó por más de 2,5. Este comportamiento es típico y similar al de las interrupciones de la red móvil en todo el mundo. Mantenerse conectado en caso de emergencia es de vital importancia, por lo que comprobar el estado de la red tiene mucho sentido.
En la mañana del 26 de febrero de 2025, cuando terminó el apagón y se restableció el suministro eléctrico, se registraron más test que las dos mañanas anteriores. Esto se debe probablemente a que muchas personas comprueban sus teléfonos al despertarse, por lo que no es raro ver más pruebas de lo habitual.
¿Cómo funcionaron las redes móviles?

Cuando las redes móviles están “descargadas”, es decir, no tienen mucho tráfico, como suele ocurrir por la noche, los usuarios de Speedtest registran velocidades más rápidas. Esto es lo que representan son los picos en el gráfico. Los valles son los momentos en los que la mayoría de las personas están activas y se produce una mayor carga en la red, lo que da como resultado velocidades más lentas.
Seleccionando las 12 horas del apagón (el recuadro con la línea más gruesa) y las mismas 12 horas del día anterior (el recuadro con la línea más fina), la velocidad media de descarga del grupo de operadores se redujo efectivamente a la mitad: 16,42 Mbps durante el apagón frente a 33,68 Mbps antes.

Si analizamos todos los proveedores de servicios móviles en su conjunto, desde el apagón que comenzó justo después de las 15.00 horas, la velocidad mediana de descarga se mantuvo inicialmente en torno a los 12 Mbps o más, para descender a su punto más bajo a las 18.00 horas, con 7,49 Mbps. A partir de entonces, y hasta que comenzó la recuperación hacia las 23.00 horas, las velocidades de descarga se mantuvieron en un estrecho margen de entre 9 y 10 Mbps hasta las 22.00 horas. Aunque estas velocidades medianas de descarga no se pueden considerar rápidas, sugieren que las redes móviles estaban operativas y los clientes pudieron mantenerse en contacto.
Sin embargo, teniendo en cuenta que la mediana significa el medio, la mitad de los usuarios de Speedtest experimentaron velocidades más lentas que las que se ven en el gráfico lineal (y obviamente, la mitad eran más rápidos, pero no tendrían una experiencia tan mala). Para hacerse una idea de la parte inferior, el percentil 10 más lento para el día de la interrupción (25 de febrero) se compara desfavorablemente con los mismos tres martes anteriores de febrero. El día del apagón, la velocidad del percentil 10 estaba por debajo de 1 Mbps, prácticamente inutilizable salvo para enviar un mensaje de texto y, con suerte, mantener una llamada de voz. Los tres martes anteriores se registraron 2,60 Mbps, lo que sigue sin ser bueno, pero en las antiguas generaciones de redes inalámbricas era lo bastante rápido para ver un vídeo de definición estándar (SD).
Otra observación que se desprende del análisis de la velocidad de descarga de todos los proveedores es que la velocidad disminuyó desde el principio del apagón (de 15.00 a 16.00 horas) hasta la mitad del mismo (de 17.00 a 22.00 horas). Una explicación podría ser la carga de la red mencionada antes, pero parece poco probable, ya que el patrón normal de picos de carga se habría visto totalmente interrumpido por el apagón. Una segunda explicación podría ser que se agotaran las baterías de reserva de los emplazamientos de las redes móviles. Es decir, si, por ejemplo, cada emplazamiento tuviera un par de horas de batería de reserva, y algunos emplazamientos también tuvieran generadores que entraran en funcionamiento una vez agotadas las baterías, podría observarse un patrón como éste.
La SUBTEL, organismo regulador de las telecomunicaciones en Chile, ha sido citada en la prensa tecnológica por estudiar la posibilidad de aumentar a seis horas la supuesta reserva de cuatro horas. El refuerzo de la red, ya sea contra cortes de electricidad u otras interrupciones como catástrofes naturales, es fundamental para la resistencia de la red.
Los datos de Ookla pueden ofrecer información sobre el rendimiento, la fiabilidad y la resistencia de la red. Para obtener más información sobre los datos y perspectivas de Speedtest Intelligence, póngase en contacto con nosotros ®aquí.
Ookla retains ownership of this article including all of the intellectual property rights, data, content graphs and analysis. This article may not be quoted, reproduced, distributed or published for any commercial purpose without prior consent. Members of the press and others using the findings in this article for non-commercial purposes are welcome to publicly share and link to report information with attribution to Ookla.
