| June 11, 2025

How Spain's Mobile Networks Performed During the Iberian Grid Collapse [Visualized] | Cómo Se Comportaron Las Redes Móviles Españolas Durante El Colapso De La Red Ibérica

Spanish/Español

Variation in outage scale and duration across mobile operators during the April 28th event reinforces the case that robust power resilience is now the single most decisive factor in preserving service continuity in mobile networks

The Iberian grid collapse stands as the starkest demonstration yet of the fragility of mobile network infrastructure precisely when it is needed most. Public scrutiny following the historic event has centred on understanding and ultimately mitigating the societal vulnerabilities stemming from mobile networks’ inherent reliance on a constant grid power supply, which is increasingly difficult to guarantee as severe events become more frequent.

For the first time, and with the goal of fostering deeper understanding of the interdependence between mobile and power infrastructure in Europe, Ookla is publishing detailed data exposing the scale and geographic distribution of mobile network disruptions caused by the April 28th event. Building on our earlier analysis, this research reveals that the impact of the power outage on mobile network infrastructure varied significantly across operators, with differing levels of power backup penetration likely a critical factor shaping the severity experienced by end users.

Key Takeaways:

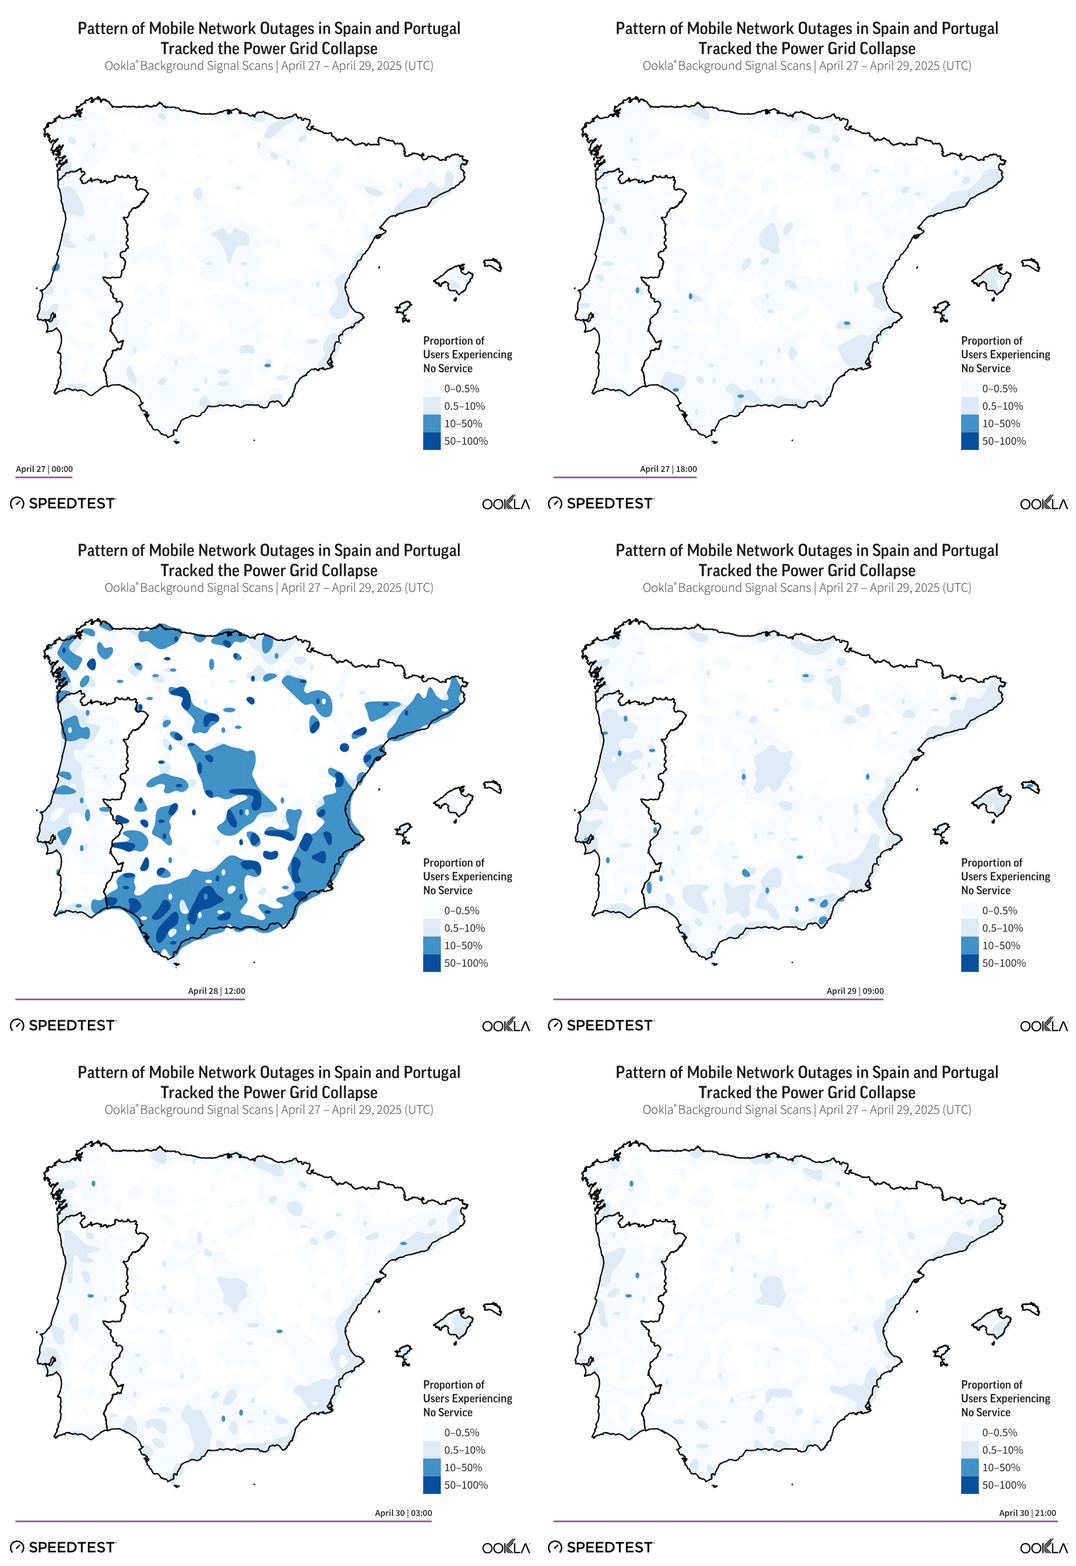
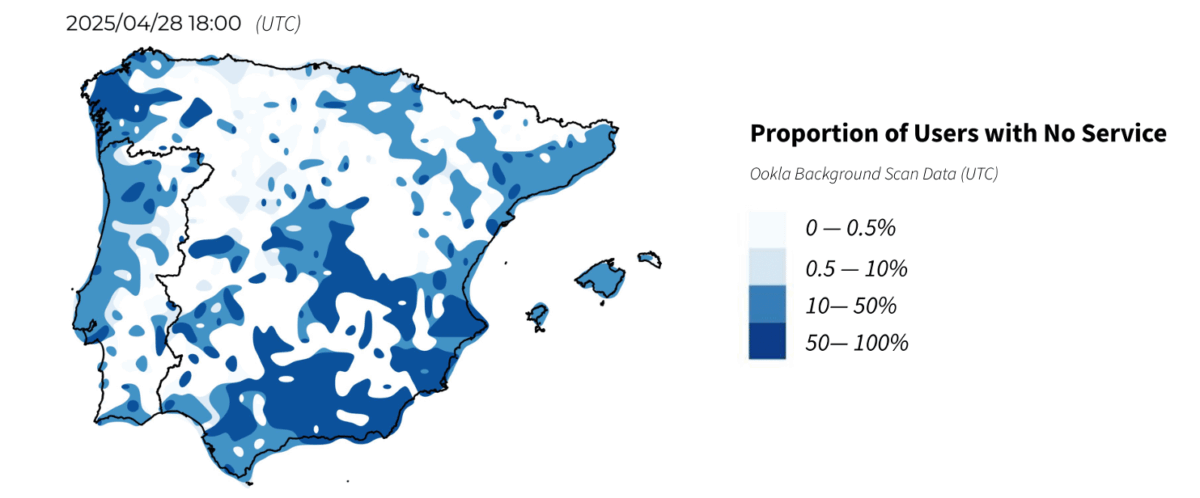
  • At the peak of the April 28th blackout, more than half of all mobile network users across large parts of Spain were left completely without mobile signal. The proportion of mobile network users experiencing complete service loss (unable to call, text, or use data due to sites going dark) surged from a pre-blackout baseline of under 0.5% to more than 50% across extensive areas of Spain at the peak late on April 28th. This indicates a severe, widespread, and historic collapse of the mobile site grid that deepened throughout the afternoon and evening on the day of the blackout as available power backups were progressively depleted.
  • The timing and distribution of mobile network outages closely tracked the pattern of power grid events, underlining the telecom infrastructure’s vulnerability to even brief interruptions in power supply. Within 30 minutes of the grid failure (by 13:00 CET), the proportion of users with no service surged as small cells and sites with minimal power backup and battery autonomy went offline. After two hours, about 12% of users on the most affected operator had no service. Outage growth then slowed, suggesting that remaining macro sites, likely equipped with four-to-six hour battery banks, kept operating until their reserves ran out, leading to a final sharp wave of service loss in the late evening. The restoration of mobile services tracked the geographically-phased re-energisation of the power grid, with network disruptions persisted longer into the night in parts of Andalusia and Galicia.
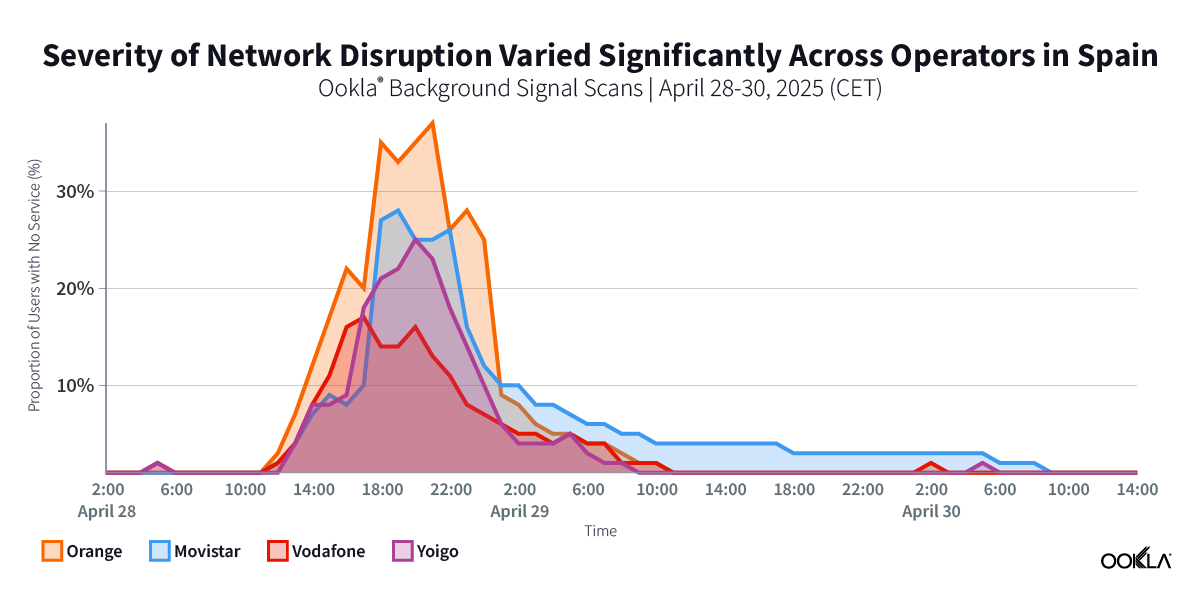
  • While severe network outages were observed across all Spanish operators during the blackout, mobile users on the Vodafone network were less likely to experience a complete service loss. Four-to-eight hours after the grid collapse, the interval in which every operator hit its worst point in terms of service loss, Vodafone’s subscribers were, on average, less than half as likely to be left without service as subscribers on Orange’s network and notably less likely than subscribers on Movistar or Yoigo as well.
  • Morocco’s mobile site footprint remained operational throughout April 28th since domestic grid supply was unaffected. However, the country’s reliance on Spain for international connectivity in deeper network layers resulted in cascading failures and severe service degradation. The proportion of mobile users experiencing no service on the Orange Maroc and Maroc Telecom networks remained consistent with the pre-blackout baseline on April 28th, confirming there were no sustained network disruptions at the mobile site level due to grid failure, unlike in Spain and Portugal. However, analysis of Speedtest Intelligence data reveals significant performance degradation still occurred in Morocco, with the median load time for popular websites increasing by more than 20% compared to the same day in the previous week. The quality of experience (QoE) for Orange Maroc subscribers was particularly impacted during the blackout, reportedly due to disruptions in upstream subsea connectivity between Morocco and mainland Spain.

Power Resilience and Energy Management Strategies Shape the Anatomy of Network Outages

The Iberian grid collapse exemplifies a type of stress test becoming increasingly common in Europe—the ability of mobile network infrastructure to withstand prolonged, severe external shocks beyond direct operator, ensuring continuity of service precisely when it is most critical for public safety and societal functioning.

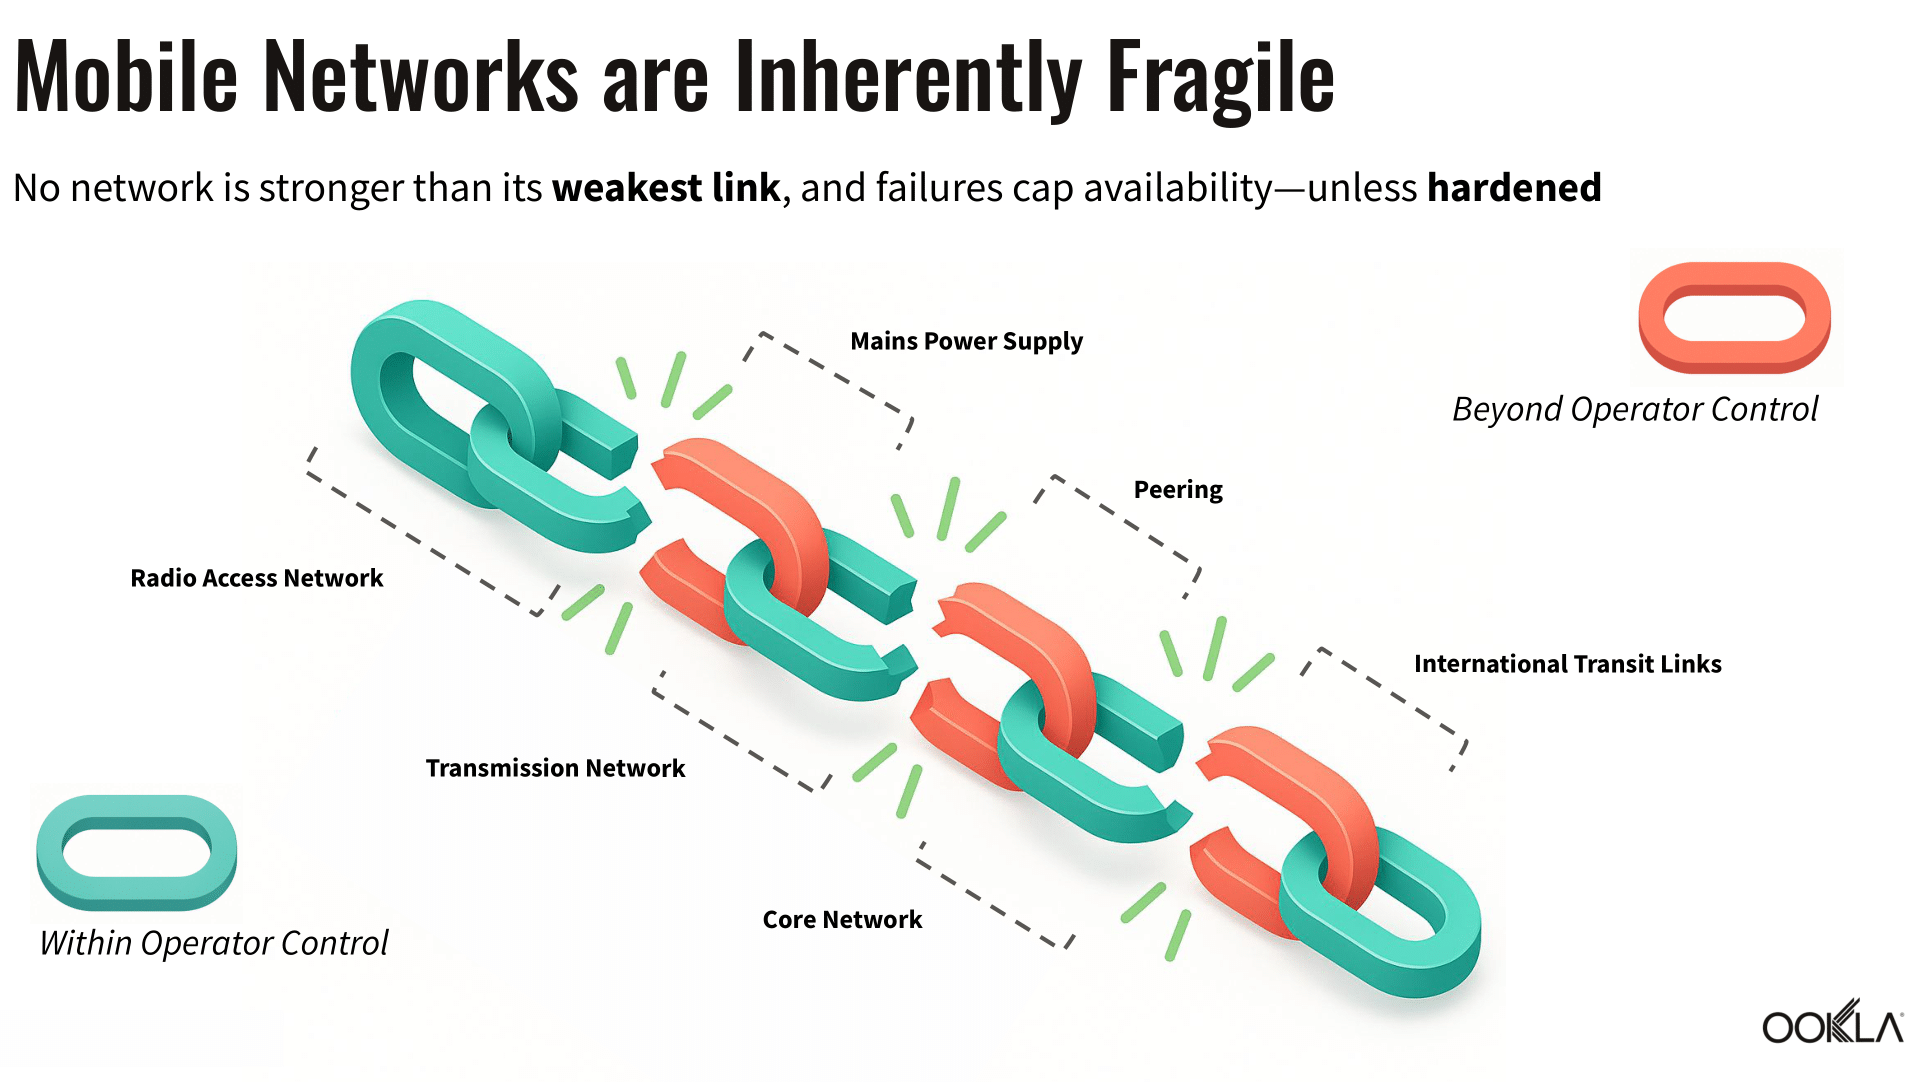
Beyond the April 28th blackout, recent events in the UK and Ireland, where winter storms (especially Storm Éowyn) caused extensive localized damage to electricity distribution networks, and in France, where substation vandalism resulted in brief but severe blackouts in Cannes and Nice, highlight electricity supply disruptions as a principal vulnerability for mobile networks reliant entirely on grid power. These disruptions add to other external vulnerabilities faced by operators, such as terrestrial or subsea fiber connectivity, upstream cloud links, and third-party peering connections.

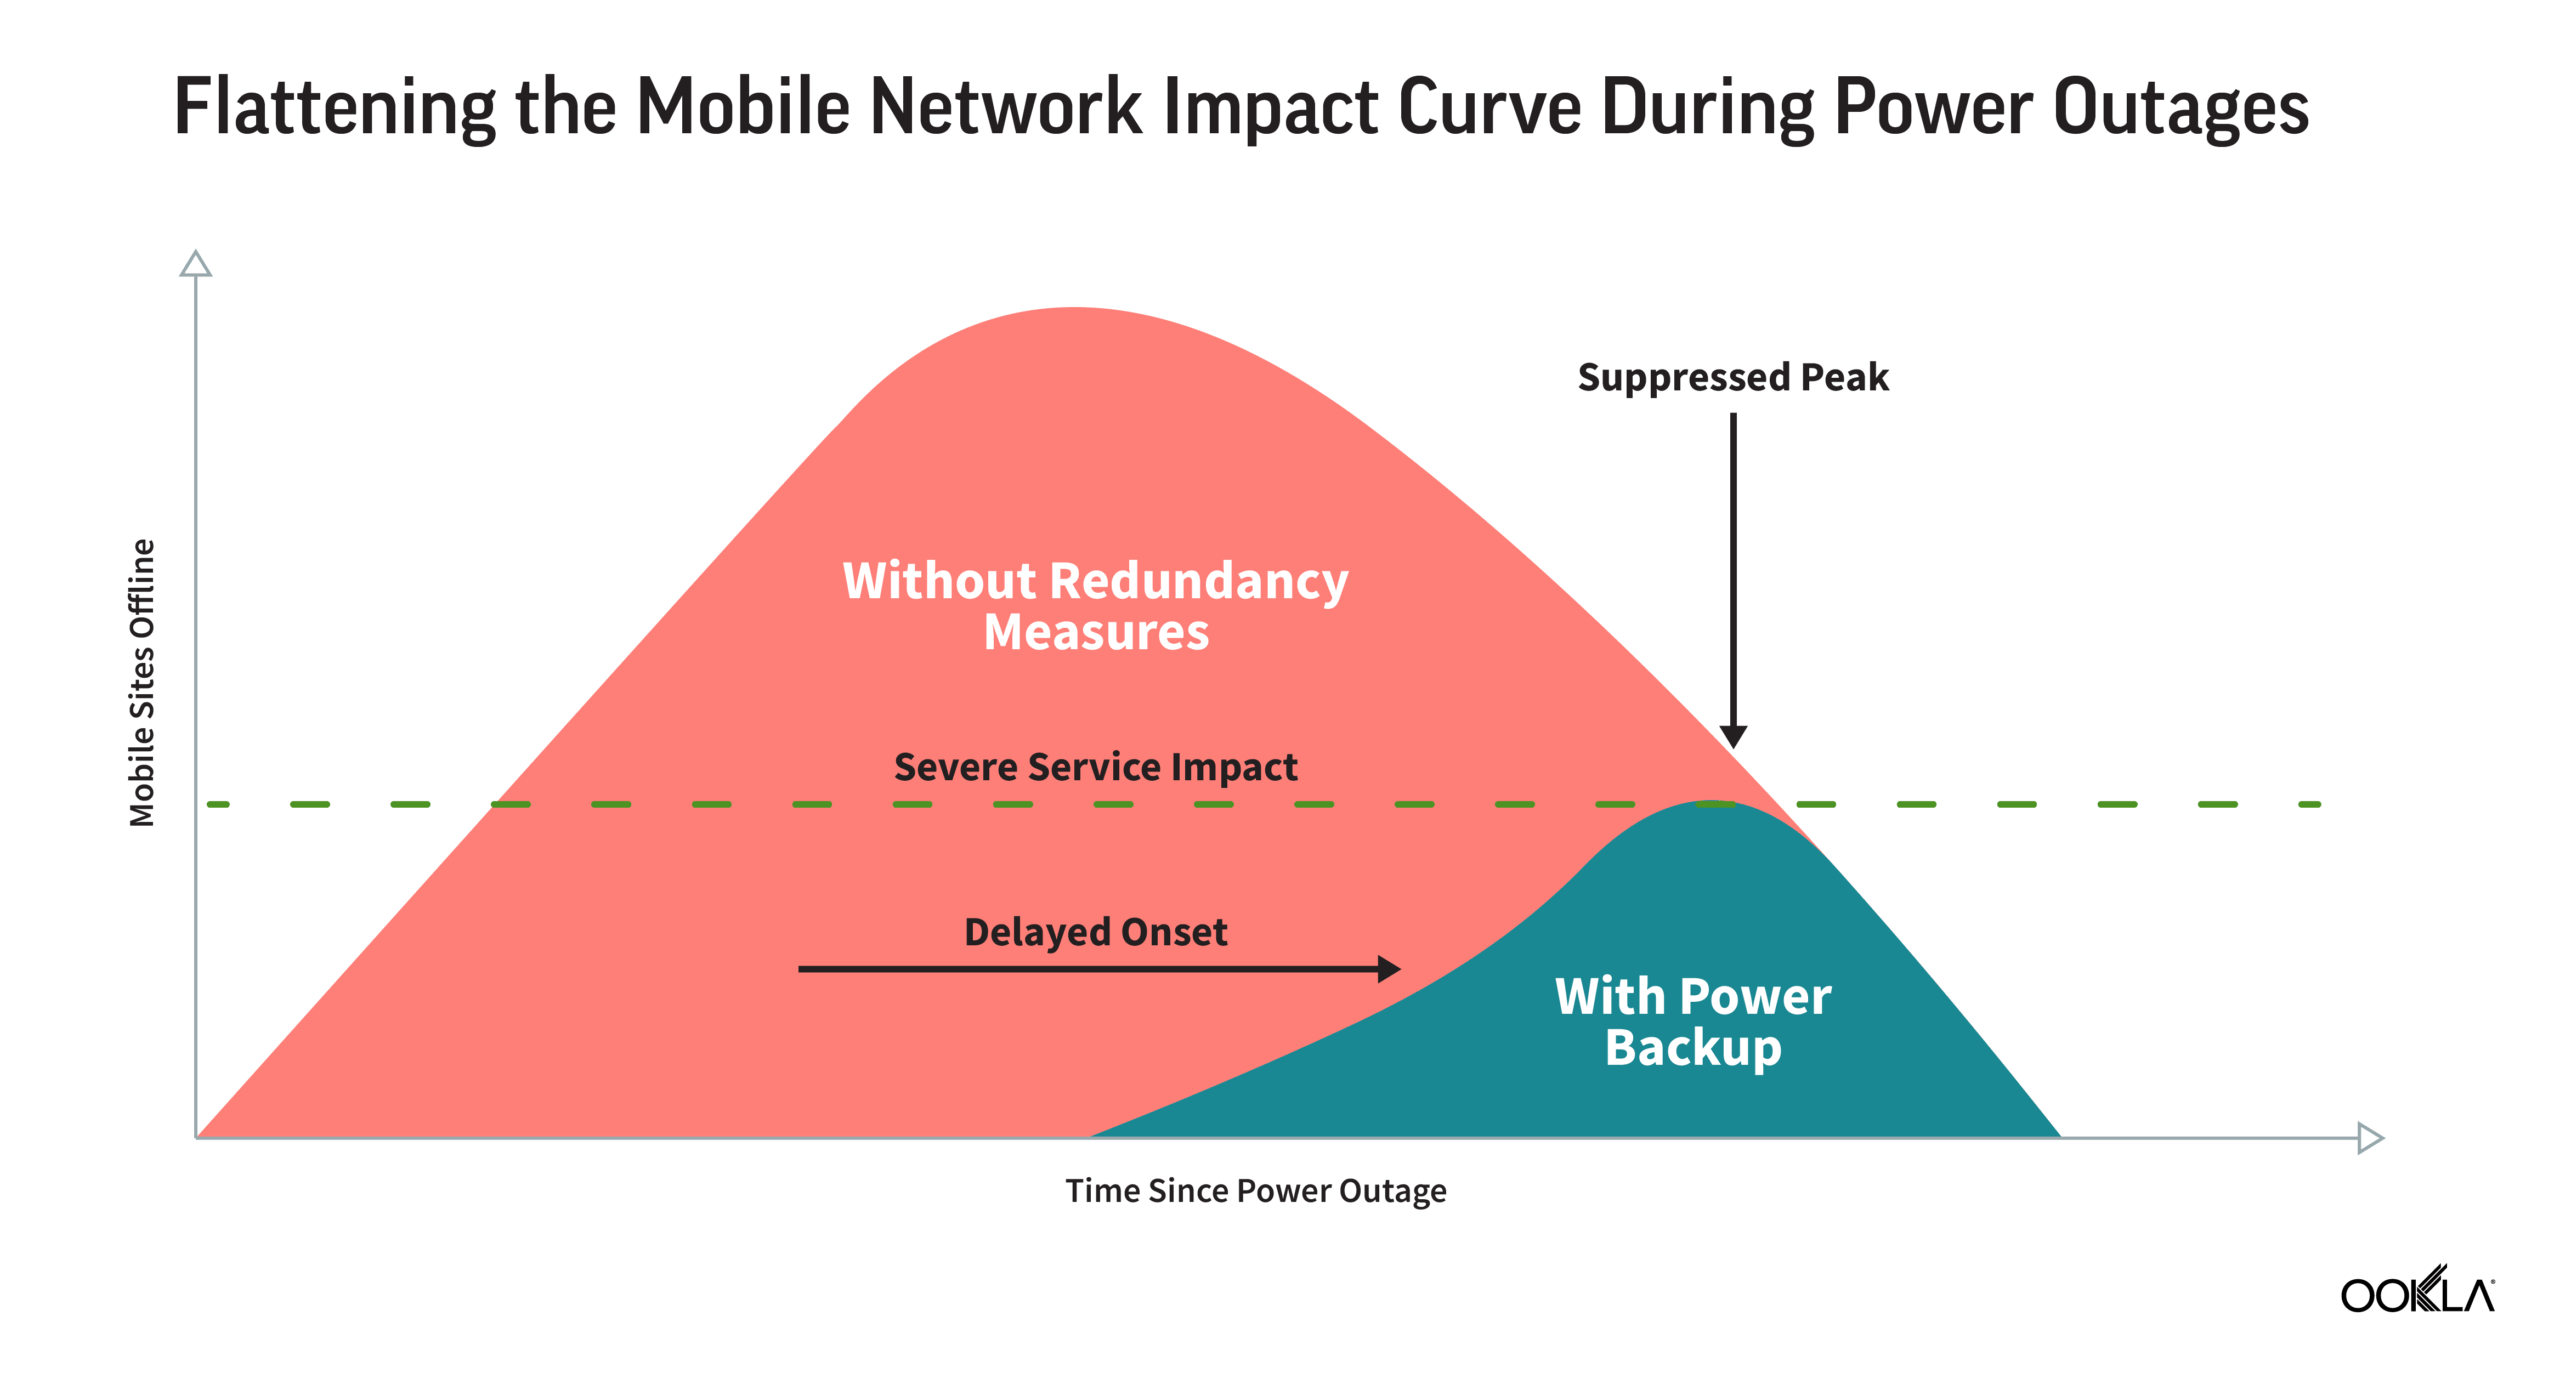
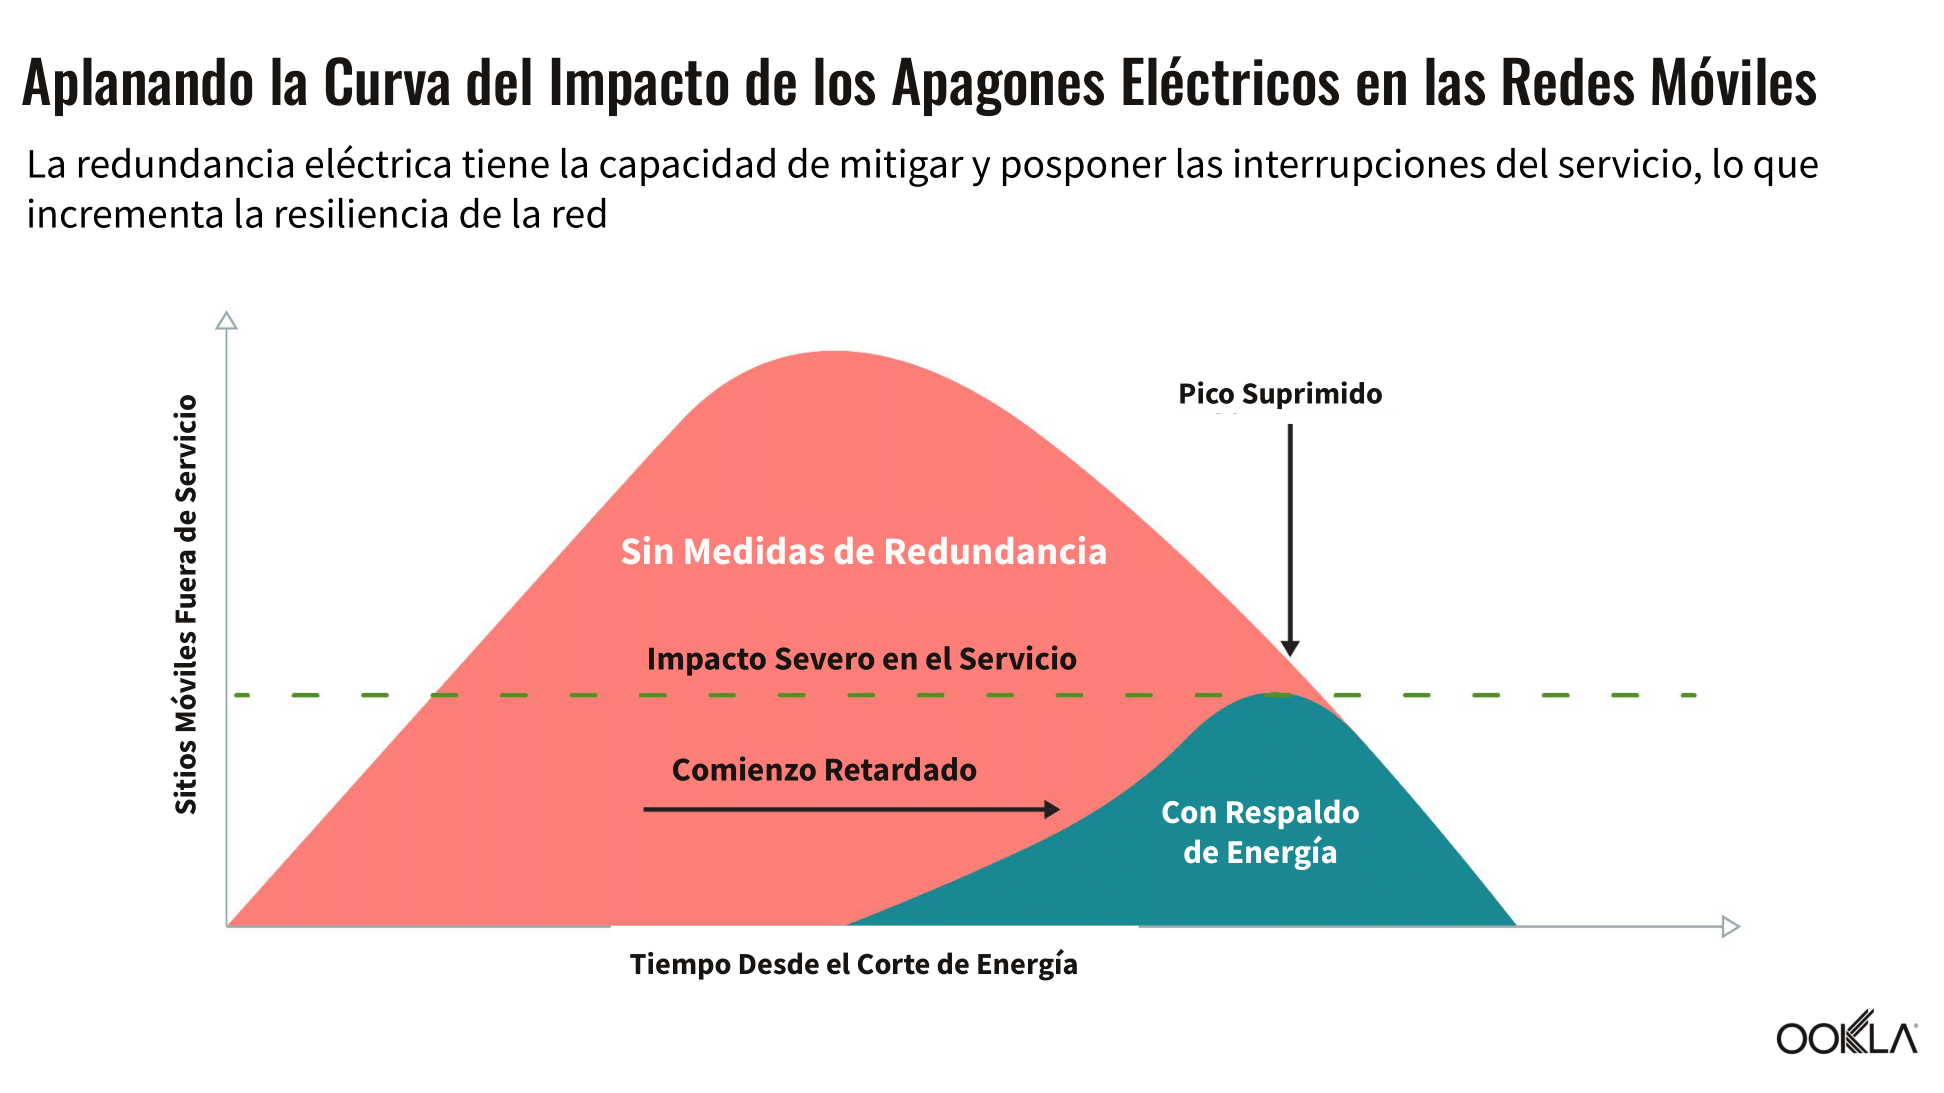
Power resilience, particularly through battery and generator backup systems at mobile sites, has emerged as a key proactive measure to mitigate network outages resulting from electricity grid disruptions. Simply put, backup power serves a role analogous to public health measures in a pandemic: it strategically delays the onset of outages (extending the operational hours before sites lose power) and reduces the peak severity (limiting the total number of sites simultaneously affected).

Capital investments in network hardening tools like power redundancy can therefore “flatten” the service-impact curve during an outage event in the same way public health measures flattened the infection curve during the coronavirus pandemic. Prolonged and wide-area grid disruptions like the one on April 28th, however, demonstrate that no single measure is a silver bullet and long-term power autonomy is often not economically viable across a large proportion of the site footprint. 

Recognizing this, mobile operators typically implement aggressive energy management measures during power disruptions to maximize site uptime and strategically allocate network resources based on user priority. These measures may include throttling site transmit power to reduce coverage footprints, limiting spectrum diversity to limit carrier aggregation and overall capacity, and temporarily disabling newer technologies such as 5G and Massive MIMO to extend battery and generator runtime.

Differences in the extent of power backup deployment and the strategic use of energy conservation and load-shedding measures shape the anatomy of network outages. Such variations among operators may arise from a diversity of fuel choices for backup power (e.g., batteries might offer long-term monetization potential, including opportunities for resale to the grid, but typically have shorter runtimes), network configurations (such as RAN sharing arrangements and site types, with dense urban small cells facing greater physical constraints for power backup deployments), and subscriber base characteristics (e.g., operators serving a larger rural subscriber base face more complex and costly challenges in enhancing network resilience).

Iberian Grid Collapse Cascaded through Mobile Networks in Spain, Moving in Lockstep with Power Disruptions

Analysis of Ookla® background signal scan data reveals that the April 28th event placed unprecedented stress on mobile networks in Spain, triggering a rapid collapse in site grid density. The historic scale of this collapse severely curtailed the coverage footprint of operator infrastructure, pushing a significant share of Spanish mobile subscribers into a ‘no service’ state, unable to connect to a nearby mobile site and thus temporarily unable to make calls, send texts, or use data.

Geospatial sequencing of the ‘no service’ data calculates the average probability that a mobile network user was left without signal during any given time window and serves as a proxy for the overall proportion of subscribers left with no network access. This methodology illustrates that the impact of the power blackout quickly cascaded through Spain’s mobile networks (closely mirroring the infection curve analogy described earlier):

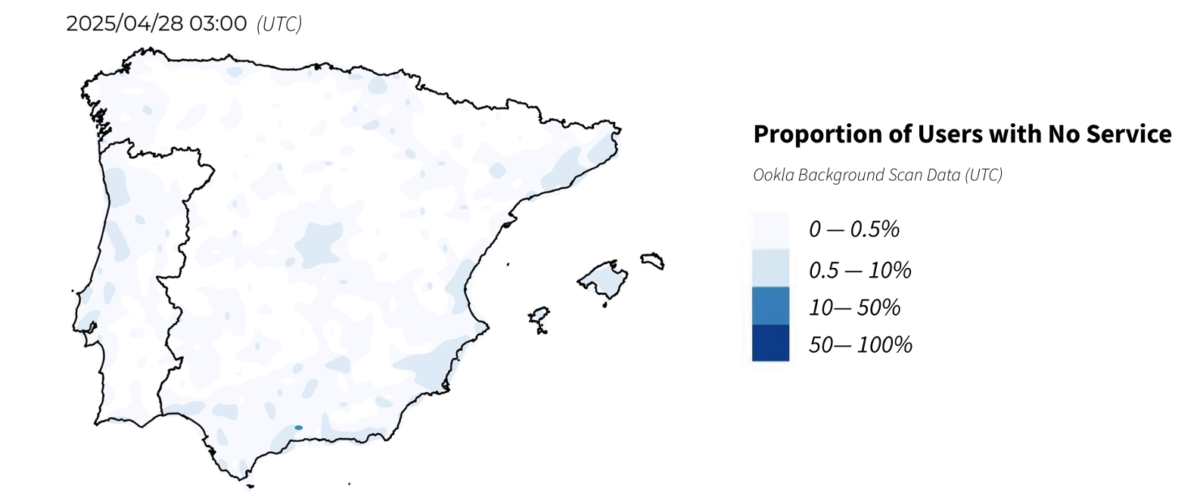
  • Baseline (Pre-Blackout): Mobile sites were operating as normal. The average proportion of subscribers without service was less than 0.5%, reflecting the very high levels of network availability typical of Spain.
  • Initial Impact (Immediate Aftermath of Blackout): The grid collapsed at ~12:33 CET across the Iberian Peninsula, triggering rectifiers or uninterruptible power supply (UPS) devices at mobile sites to switch over to backup batteries or generators (where these were installed and adequately charged or fueled).

    Within 30 minutes of the voltage drop, the proportion of subscribers without service had climbed well above the pre-event baseline across Spain and the outage curve entered a phase of runaway growth. This limited initial outage impact likely reflected the immediate loss of a small portion of the overall site footprint in areas where power backup was either absent or severely limited in capacity—most commonly at small cell sites in dense urban environments, where physical space restricts battery or generator installations, or at remote rural sites lacking redundancy (or featuring generators that took longer to switch over and come online).

    Notably, the balanced geographical spread of subscribers beginning to experience no service on their devices (i.e. losing network access) at the start of the network outages suggests that the timing of impacts was broadly consistent across Spain, affecting both rural and urban regions. However, the initial severity was more pronounced in areas along the east and south coasts, as well as in the interior of the country, potentially indicating a lower level of power autonomy at sites in these areas.
  • Ramp-Up (2-8 Hours After Blackout): Within two hours of the blackout, the most affected operator had already seen ~12% of users left with no service. After this point, the rate of outage growth slowed temporarily for several hours. This pattern suggests that the power backup profile of Spanish mobile sites was bi- or tri-modal, with a tiered approach to backup capacity employed by operators (i.e., site autonomy was clustered into configurations like two, four or six-hour power resilience, with battery discharge rates determined by amp-hour capacity and site load at each location).

    As a result of this tiered approach to power autonomy and site load variability, a portion of sites continued operating, likely in a reduced state with aggressive energy conservation measures in place (reflected in marked performance degradation observed in Speedtest Intelligence® data), throughout the afternoon and evening of April 28th.

    The eventual depletion of larger power reserves, typically found at major macro sites on lattice or monopole towers, triggered a final sharp wave of network outages four to eight hours after the blackout began. The loss of these wide-area ‘umbrella’ sites in the evening resulted in a substantial share of Spanish mobile subscribers experiencing no service by 21:00 CET, with severe network outages geographically distributed across all of Spain.
  • Peak (8-10 Hours After Blackout): The impact of the blackout on mobile network infrastructure in Spain peaked between 21:00 and 22:00 CET, with more than half of all mobile subscribers left without service across many regions by late evening, just before power began to return. By this stage (about ten hours after the initial power loss), even the most capable battery backups were likely exhausted, leaving only those sites powered by mobile or stationary generators still operational (especially where strategic fuel deliveries could extend uptime). 
  • Recovery (Remainder of April 28th and 29th): Cross-analysis of geospatial sequencing of the no service data with nighttime light emissions detailed in NASA satellite imagery reveals that the recovery of mobile services and the site grid footprint in Spain closely tracked the pattern of grid re-energization. The proportion of users without service began to decline in the mid-afternoon and early evening in the areas where power was first restored, as the grid operator carried out a phased nationwide black-start. This early network recovery was most evident in regions such as the Basque Country, Catalonia, and Castile and León.

    Significant network outages continued into the night in parts of Andalusia and Galicia, meanwhile, mirroring the slower pace of power restoration in these regions. In some parts of Andalusia, for example, more than half of subscribers remained without service by 6:00 a.m. the following morning, only regaining connectivity once power was restored shortly afterwards. The direct relationship between the timing of power restoration and mobile network recovery highlights that operators are wholly dependent on the grid for service continuity once backup systems are inevitably depleted.

Breadth and Depth of Power Autonomy Drives Differences in Network Resilience Outcomes 

The infection curve analogy provides a potent mechanism to visualize and compare network outage profiles and site resilience among Spain’s mobile operators during the blackout. The shape of these outage curves transforms the ‘no service’ data into a story about both network topology and the breadth and depth of power backup deployed across different operators.

In the context of the outage curves, the point where each curve rises from the baseline reflects the level of power autonomy or battery/generator depth. The height of the peak shows how evenly that autonomy is distributed across the site footprint, while the length of the tail can reveal the geographical skew of subscribers within each operator’s network.

On April 28th, Vodafone exhibited the earliest and lowest outage peak in Spain. The probability that a subscriber on its network was left without service peaked at about half that of Orange and notably below other operators. This early yet suppressed peak indicates a thin but widely deployed power autonomy layer in its network, with small cells (featuring short UPS reserves) dropping out quickly, while most large macro sites carrying modest batteries or generators with different configurations likely kept at least one carrier alive for several hours. This approach of spreading shallow reserves across most sites flattened Vodafone’s outage peak but also pulled it forward in time.

While Orange’s outage curve did not reach its peak until several hours after Vodafone, it is indicative of a strategy that concentrated on thick battery or generator backup at key sites but left a broad swath of sites vulnerable to synchronized collapse (as reflected in the sharp no service spikes), the higher peak suggests a larger share of its subscriber base was likely left with no service during the blackout.

Movistar’s outage profile fell between Vodafone and Orange in both the timing and height of its peak during the blackout, but the recovery of its site footprint was significantly more protracted—taking nearly twice as long (almost a day and a half) as the other operators for the proportion of subscribers with no service to drop below 2%. This is likely an artifact of the unique scale of its rural site and subscriber footprint in Spain, where power backup is often more reliant on generators that require manual intervention and are more limited in deployment due to the economic challenges posed by installation in remote areas. 

Network Resilience is about more than Power Redundancy

While the Iberian blackout may have been a black swan event, the wider global trend of escalating climate, energy, and security-driven shocks impacting multiple layers of telecom infrastructure—often beyond the direct control of mobile operators—has elevated network resilience from a secondary consideration to a core design principle. This shift is reflected in more robust policy oversight (as exemplified in countries like Norway and Finland) and is likely to be underpinned by fiscal subsidies that seek to support the deployment of more power resilience solutions at mobile sites.

Network resilience is, however, more than keeping the lights on; it also depends on other important factors like having diverse, independent paths to the wider internet. On the day of the blackout, Moroccan operators that funnel most of their international traffic through Spanish landing stations lost those paths when the grid collapse knocked Spanish routers and data centers offline.

Since the subsea capacity and routing of some Moroccan operators was dependent on a highly concentrated upstream Spain-centered corridor, there was limited immediate fail-over and users experienced sharp service degradation, even though power and equipment inside Morocco never went down. By contrast, operators that had additional fibers to France or Italy suffered more minor disruptions, highlighting how geographic and upstream diversity are just as critical to mobile network resilience as local power autonomy.


Cómo Se Comportaron Las Redes Móviles Españolas Durante El Colapso De La Red Ibérica

La variación en la escala y duración de las interrupciones entre los operadores de telefonía móvil durante el evento del 28 de abril refuerza la idea de que una sólida capacidad de recuperación energética es ahora el factor más decisivo para garantizar la continuidad del servicio en las redes móviles.

El colapso de la red ibérica es la demostración más clara de la fragilidad de la infraestructura de las redes móviles precisamente cuando más se necesita. El debate público tras el histórico suceso se ha centrado en comprender y, en última instancia, mitigar las vulnerabilidades sociales derivadas de la dependencia inherente de las redes móviles de un suministro constante de energía de la red, que es cada vez más difícil de garantizar a medida que los incidentes graves se hacen más frecuentes.

Por primera vez, y con el objetivo de fomentar una comprensión más profunda de la interdependencia entre la infraestructura móvil y la eléctrica en Europa, Ookla publica datos detallados que muestran la escala y la distribución geográfica de las interrupciones de la red móvil causadas por el apagón del 28 de abril. Sobre la base de nuestro análisis anterior, esta investigación revela que el impacto del corte de energía en la infraestructura de red móvil varió significativamente entre los operadores, y que los diferentes niveles de penetración de la energía de respaldo son probablemente un factor crítico que determina la gravedad que experimentan los usuarios finales.

Principales Conclusiones:

  • En el punto álgido del apagón del 28 de abril, más de la mitad de los usuarios de redes móviles de amplias zonas de España se quedaron completamente sin señal móvil. La proporción de usuarios de redes móviles que experimentaron una pérdida completa del servicio (sin poder llamar, enviar mensajes de texto o utilizar datos debido a que los sitios se habían quedado sin señal) pasó de un valor de referencia previo al apagón inferior al 0,5% a más del 50% en amplias zonas de España en el punto álgido del 28 de abril. Esto indica un colapso grave, generalizado e histórico de la red de telefonía móvil que se agravó durante la tarde y la noche del día del apagón a medida que se agotaban progresivamente las reservas de energía disponibles.
  • El momento y la distribución de los cortes de la red móvil siguieron el patrón de los incidentes de la red eléctrica, lo que evidencia la vulnerabilidad de la infraestructura de telecomunicaciones a las interrupciones, incluso breves, del suministro eléctrico. En los 30 minutos siguientes al fallo de la red (a las 13:00 CET), la proporción de usuarios sin servicio aumentó a medida que se desconectaban las células pequeñas y los emplazamientos con un mínimo de reserva de energía y autonomía de batería. Al cabo de dos horas, alrededor del 12% de los usuarios del operador más afectado carecían de servicio. El aumento de los cortes se ralentizó a continuación, lo que sugiere que los macroemplazamientos restantes, probablemente equipados con bancos de baterías de cuatro a seis horas de autonomía, siguieron funcionando hasta que se agotaron sus reservas, lo que provocó una última y brusca oleada de pérdidas de servicio a última hora de la tarde. El restablecimiento de los servicios móviles siguió el ritmo de la reenergización geográficamente escalonada de la red eléctrica, con interrupciones de la red que se prolongaron hasta bien entrada la noche en partes de Andalucía y Galicia. 
  • Aunque durante el apagón se observaron graves cortes de red en todos los operadores españoles, los usuarios de telefonía móvil de la red de Vodafone tuvieron menos probabilidades de sufrir una pérdida completa del servicio. Entre cuatro y ocho horas después del colapso de la red, el intervalo en el que cada operador alcanzó su peor punto en términos de pérdida de servicio, los abonados de Vodafone tuvieron, de media, menos de la mitad de probabilidades de quedarse sin servicio que los abonados de la red de Orange y notablemente menos probabilidades también que los abonados de Movistar o Yoigo.
  • La red de telefonía móvil de Marruecos permaneció operativa durante todo el 28 de abril, ya que el suministro de la red nacional no se vio afectado. Sin embargo, la dependencia del país de España para la conectividad internacional en capas más profundas de la red provocó fallos en cascada y una grave degradación del servicio. La proporción de usuarios de telefonía móvil sin servicio en las redes de Orange Maroc y Maroc Telecom se mantuvo el 28 de abril en el mismo nivel que antes del apagón, lo que confirma que no se produjeron interrupciones sostenidas de la red en los emplazamientos de telefonía móvil debido a fallos de la red, a diferencia de lo ocurrido en España y Portugal. Sin embargo, el análisis de los datos de Speedtest Intelligence revela que en Marruecos se siguió produciendo una degradación significativa del rendimiento, con un aumento de más del 20% en el tiempo medio de carga de los sitios web más populares en comparación con el mismo día de la semana anterior. La calidad de la experiencia (QoE) de los abonados de Orange Maroc se vio especialmente afectada durante el apagón, al parecer debido a interrupciones en la conectividad submarina ascendente entre Marruecos y España continental.

La resiliencia eléctrica y las estrategias de gestión de la energía determinan la anatomía de los cortes de red

El colapso de la red ibérica ejemplifica un tipo de prueba de resistencia cada vez más habitual en Europa: la capacidad de la infraestructura de redes móviles para resistir perturbaciones externas graves y prolongadas más allá del operador directo, garantizando la continuidad del servicio, precisamente cuando es más crítico para la seguridad pública y el funcionamiento de la sociedad.

Más allá del apagón del 28 de abril, los recientes sucesos en el Reino Unido e Irlanda, donde las tormentas invernales (especialmente la tormenta Éowyn) causaron grandes daños localizados en las redes de distribución eléctrica, y en Francia, donde el vandalismo en subestaciones provocó breves pero graves apagones en Cannes y Niza, ponen de manifiesto que las interrupciones del suministro eléctrico son una de las principales vulnerabilidades de las redes móviles que dependen totalmente de la red eléctrica. Estas interrupciones se suman a otras vulnerabilidades externas a las que se enfrentan los operadores, como la conectividad de fibra terrestre o submarina, los enlaces ascendentes en la nube y las conexiones igualitarias de terceros.

La resiliencia energética, en particular mediante sistemas de baterías y generadores de reserva en los emplazamientos móviles, ha surgido como una medida proactiva clave para mitigar los cortes de red derivados de las interrupciones de la red eléctrica. En pocas palabras, la energía de reserva desempeña un papel análogo al de las medidas de salud pública en una pandemia: retrasa estratégicamente el inicio de los cortes (ampliando las horas operativas antes de que los sites se queden sin energía) y reduce la gravedad máxima (limitando el número total de sitios afectados simultáneamente).

Por tanto, las inversiones de capital en herramientas de refuerzo de la red, como la redundancia de energía, pueden “aplanar” la curva de impacto del servicio durante un apagón, del mismo modo que las medidas de salud pública aplanaron la curva de infección durante la pandemia de coronavirus. Sin embargo, las interrupciones prolongadas y generalizadas de la red, como la del 28 de abril, demuestran que ninguna medida por sí sola es la panacea y que la autonomía energética a largo plazo no suele ser económicamente viable en una gran proporción de la huella del emplazamiento. 

Conscientes de ello, los operadores de telefonía móvil suelen aplicar medidas agresivas de gestión de la energía durante las interrupciones del suministro para maximizar el tiempo de actividad de los emplazamientos y asignar estratégicamente los recursos de red en función de la prioridad de los usuarios. Estas medidas pueden incluir el estrangulamiento de la potencia de transmisión del emplazamiento para reducir las huellas de cobertura, la limitación de la diversidad del espectro para limitar la agregación de portadoras y la capacidad global, y la desactivación temporal de tecnologías más nuevas como 5G y Massive MIMO para ampliar el tiempo de funcionamiento de la batería y el generador.

Las diferencias en el alcance del despliegue de respaldo de energía y el uso estratégico de medidas de conservación de la energía y reducción de la carga conforman la anatomía de los cortes de red. Estas variaciones entre operadores pueden deberse a la diversidad de combustibles elegidos para la energía de reserva (por ejemplo, las baterías pueden ofrecer un potencial de monetización a largo plazo, incluidas las oportunidades de reventa a la red, pero suelen tener tiempos de funcionamiento más cortos), configuraciones de red (como los acuerdos de compartición de RAN y los tipos de emplazamientos, con pequeñas células urbanas densas que se enfrentan a mayores limitaciones físicas para los despliegues de energía de reserva) y características de la base de abonados (por ejemplo, los operadores que atienden a una base de abonados rurales más grande se enfrentan a retos más complejos y costosos para mejorar la resiliencia de la red).

El colapso de la red ibérica se propagó en cascada a través de las redes móviles en España, moviéndose al unísono con las interrupciones del suministro eléctrico

El análisis de los datos de escaneo de señales de fondo de Ookla® revela que el incidente del 28 de abril provocó una tensión sin precedentes en las redes móviles de España, desencadenando un rápido colapso en la densidad de la red. La escala histórica de este colapso redujo gravemente la huella de cobertura de la infraestructura del operador, empujando a una parte significativa de los abonados móviles españoles a un estado de “sin servicio”, incapaces de conectarse a un sitio móvil cercano y, por tanto, temporalmente incapaces de hacer llamadas, enviar mensajes de texto o utilizar datos. 

La secuenciación geoespacial de los datos de “sin servicio” calcula la probabilidad media de que un usuario de red móvil se quedara sin señal durante una ventana temporal determinada y sirve como indicador de la proporción global de abonados que se quedan sin acceso a la red. Esta metodología ilustra que el impacto del apagón se propagó rápidamente en cascada por las redes móviles españolas (reflejando fielmente la analogía de la curva de infección descrita anteriormente):

  • Línea de base (antes del apagón). Los sitios móviles funcionaban con normalidad. La proporción media de abonados sin servicio era inferior al 0,5%, lo que refleja los altísimos niveles de disponibilidad de red típicos de España.
  • Impacto inicial (inmediatamente después del apagón). La red se colapsó en torno a las 12:33 CET en toda la Península Ibérica, lo que provocó que los rectificadores o los dispositivos de alimentación ininterrumpida (SAI) de las ubicaciones móviles pasaran a utilizar baterías o generadores de reserva (cuando éstos estaban instalados y adecuadamente cargados o alimentados). 

    A los 30 minutos de la caída de tensión, la proporción de abonados sin servicio había superado con creces la línea de base anterior al incidente en toda España y la curva de cortes entró en una fase de crecimiento descontrolado. Es probable que este impacto inicial limitado de los cortes reflejara la pérdida inmediata de una pequeña parte de la huella total del emplazamiento en zonas en las que no había suministro eléctrico de reserva o su capacidad era muy limitada, normalmente en emplazamientos de células pequeñas en entornos urbanos densos, donde el espacio físico restringe la instalación de baterías o generadores, o en emplazamientos rurales remotos sin redundancia (o con generadores que tardaron más en conectarse).

    Cabe destacar que la distribución geográfica equilibrada de los abonados que empezaron a quedarse sin servicio en sus dispositivos (es decir, a perder el acceso a la red) al inicio de los cortes de red sugiere que el momento de los impactos fue en general coherente en toda España, afectando tanto a regiones rurales como urbanas. Sin embargo, la gravedad inicial fue más pronunciada en las zonas situadas a lo largo de las costas este y sur, así como en el interior del país, lo que podría indicar un menor nivel de autonomía eléctrica en los emplazamientos de estas zonas. 
  • Recuperación (2-8 horas después del apagón). A las dos horas del apagón, el operador más afectado ya había visto cómo en torno al 12% de los usuarios se quedaban sin servicio. A partir de ese momento, el ritmo de crecimiento de los cortes disminuyó temporalmente durante varias horas. Este patrón sugiere que el perfil de reserva de energía de los sitios móviles españoles era bimodal o trimodal, con un enfoque escalonado de la capacidad de reserva empleada por los operadores (es decir, la autonomía de los sitios se agrupaba en configuraciones como resiliencia de energía de dos, cuatro o seis horas, con tasas de descarga de la batería determinadas por la capacidad de amperios-hora y la carga del sitio en cada ubicación).

    Como resultado de este enfoque escalonado de la autonomía energética y de la variabilidad de la carga del emplazamiento, una parte de los emplazamientos siguieron funcionando, probablemente en un estado reducido con medidas agresivas de conservación de la energía (reflejadas en la marcada degradación del rendimiento observada en los datos de Speedtest Intelligence®), durante toda la tarde y noche del 28 de abril. 

    El agotamiento final de las grandes reservas de energía, que suelen encontrarse en los principales macro-emplazamientos situados en torres de celosía o monoposte, desencadenó una última oleada de cortes de red entre cuatro y ocho horas después del inicio del apagón. La pérdida de estos emplazamientos “paraguas” de área amplia por la noche provocó que una parte sustancial de los abonados móviles españoles se quedaran sin servicio a las 21:00 CET, con graves cortes de red distribuidos geográficamente por toda España.
  • Pico (8-10 horas después del apagón). El impacto del apagón en la infraestructura de la red móvil en España alcanzó su punto álgido entre las 21:00 y las 22:00 CET, con más de la mitad de todos los abonados móviles sin servicio en muchas regiones a última hora de la tarde, justo antes de que empezara a volver la electricidad. Para entonces (unas diez horas después de la pérdida inicial de energía), incluso las baterías de reserva más potentes estaban probablemente agotadas, por lo que sólo quedaban operativas las instalaciones alimentadas por generadores móviles o fijos (especialmente en los casos en que el suministro estratégico de combustible podía prolongar el tiempo de actividad).

  • Recuperación (resto de los días 28 y 29 de abril). El análisis cruzado de la secuencia geoespacial de los datos de ausencia de servicio con las emisiones de luz nocturnas detalladas en las imágenes de satélite de la NASA revela que la recuperación de los servicios móviles y la huella de la red de los emplazamientos en España siguieron de cerca el patrón de reenergización de la red. La proporción de usuarios sin servicio empezó a disminuir a media tarde y a primera hora de la noche en las zonas donde primero se restableció el suministro eléctrico, a medida que el operador de la red realizaba un arranque en negro por fases en todo el país. Esta recuperación temprana de la red fue más evidente en regiones como el País Vasco, Cataluña y Castilla y León.

    Mientras tanto, en algunas zonas de Andalucía y Galicia los cortes de red continuaron durante la noche, reflejando el ritmo más lento del restablecimiento del suministro eléctrico en estas regiones. En algunas zonas de Andalucía, por ejemplo, más de la mitad de los abonados seguían sin servicio a las 6 de la mañana del día siguiente, y sólo recuperaron la conectividad cuando se restableció el suministro poco después. La relación directa entre el momento del restablecimiento del suministro eléctrico y la recuperación de la red móvil pone de manifiesto que los operadores dependen totalmente de la red para la continuidad del servicio una vez que los sistemas de reserva se agotan inevitablemente.

La amplitud y la profundidad de la autonomía eléctrica determinan las diferencias en los resultados de la recuperación de la red 

La analogía de la curva de infección proporciona un potente mecanismo para visualizar y comparar los perfiles de interrupción de la red y la capacidad de recuperación de los emplazamientos entre los operadores móviles españoles durante el apagón. La forma de estas curvas de cortes transforma los datos de “ausencia de servicio” en una historia sobre la topología de la red y la amplitud y profundidad de la reserva de energía desplegada por los distintos operadores.

En el contexto de las curvas de interrupciones, el punto en el que cada curva se eleva desde la línea de base refleja el nivel de autonomía eléctrica o la profundidad de la batería/generador. La altura del pico muestra hasta qué punto la autonomía se distribuye uniformemente a través de la huella del sitio, mientras que la longitud de la cola puede revelar el sesgo geográfico de los abonados dentro de la red de cada operador.

El 28 de abril, Vodafone exhibió el pico de cortes más temprano y más bajo de España. La probabilidad de que un abonado de su red se quedara sin servicio alcanzó un máximo de aproximadamente la mitad que el de Orange y notablemente por debajo de otros operadores. Este pico, temprano pero suprimido, indica una capa de autonomía energética delgada pero ampliamente desplegada en su red, con células pequeñas (que cuentan con reservas cortas de SAI) que se quedan sin servicio rápidamente, mientras que la mayoría de los grandes macroemplazamientos que llevan baterías modestas o generadores con diferentes configuraciones probablemente mantuvieron vivo al menos a un operador durante varias horas. Este planteamiento de repartir reservas poco profundas entre la mayoría de los emplazamientos aplanó el pico de cortes de Vodafone, pero también lo adelantó en el tiempo.

Aunque la curva de cortes de Orange no alcanzó su pico hasta varias horas después que la de Vodafone, es indicativa de una estrategia que se concentró en una reserva de baterías o generadores de gran capacidad en los emplazamientos clave, pero que dejó una amplia franja de emplazamientos vulnerables al colapso sincronizado (como reflejan los fuertes picos sin servicio), el pico más alto sugiere que una mayor parte de su base de abonados probablemente se quedó sin servicio durante el apagón.

El perfil de interrupción de Movistar se situó entre el de Vodafone y Orange tanto en el momento como en la altura de su pico durante el apagón, pero la recuperación de su huella de sitios fue significativamente más prolongada, tardando casi el doble de tiempo (casi un día y medio) que los otros operadores para que la proporción de abonados sin servicio cayera por debajo del 2%. Es probable que esto se deba a la escala única de su presencia rural y de abonados en España, donde la energía de reserva suele depender más de generadores que requieren intervención manual y cuyo despliegue es más limitado debido a las dificultades económicas que plantea la instalación en zonas remotas.

La resiliencia de la red va más allá de la redundancia energética

Si bien el apagón en la Península Ibérica pudo haber sido un evento inesperado, la creciente tendencia global de crisis climáticas, energéticas y de seguridad que impactan múltiples capas de la infraestructura de telecomunicaciones —a menudo fuera del control directo de los operadores móviles— ha elevado la resiliencia de la red de una consideración secundaria a un principio de diseño fundamental. Este cambio se refleja en una supervisión política más exhaustiva (como se ejemplifica en países como Noruega y Finlandia) y es probable que se sustente en subsidios fiscales que buscan apoyar el despliegue de más soluciones de resiliencia energética en las estaciones móviles.

La resiliencia de la red, sin embargo, va más allá de mantener las luces encendidas; también depende de otros factores importantes, como contar con rutas diversas e independientes hacia una internet más amplia. El día del apagón, los operadores marroquíes que canalizan la mayor parte de su tráfico internacional a través de estaciones de aterrizaje españolas perdieron esas rutas cuando el colapso de la red dejó fuera de servicio a los routers y centros de datos españoles.

Dado que la capacidad submarina y el enrutamiento de algunos operadores marroquíes dependían de un corredor de aguas arriba altamente concentrado y centrado en España, la conmutación por error inmediata fue limitada y los usuarios experimentaron una fuerte degradación del servicio, a pesar de que el suministro eléctrico y los equipos dentro de Marruecos nunca se interrumpieron. Por el contrario, los operadores que contaban con fibra adicional con Francia o Italia sufrieron interrupciones menores, lo que pone de manifiesto cómo la diversidad geográfica y de aguas arriba es tan crucial para la resiliencia de la red móvil como la disponibilidad de energía local.

Ookla retains ownership of this article including all of the intellectual property rights, data, content graphs and analysis. This article may not be quoted, reproduced, distributed or published for any commercial purpose without prior consent. Members of the press and others using the findings in this article for non-commercial purposes are welcome to publicly share and link to report information with attribution to Ookla.

| April 29, 2025

Power Outages in Spain and Portugal Test the Resilience of Europe’s Telecoms Infrastructure

The April 28th event highlights concerns about the critical need for resilience and continuity of service for telecom providers

Spain and Portugal are in recovery mode after a historic power outage crippled their national grids on April 28, triggering a cascading failure across mobile network infrastructure. Analysis of Speedtest Intelligence® and Downdetector® data reveals that network performance progressively deteriorated as battery backups, where available, were exhausted, and shifting traffic patterns placed maximum strain on an already stretched mobile site grid. The scale of the disruption—with near-synchronous impact across all operators in both countries—marks the largest stress test of telecommunications infrastructure in Europe in recent memory.

Key Takeaways:

Power outages triggered a rapid, severe, and sustained decline in mobile performance across all operators in Spain and Portugal on April 28, with impacts peaking in the mid-afternoon as backup batteries became depleted. The share of Spanish mobile users experiencing a consistent network connection (defined as minimum 5 Mbps download speeds and 1 Mbps upload speeds) dropped from a baseline of over 90% at 9:00 AM CET on April 28 to 50% by 12:00 PM, reaching a low of 40% by 3 PM. The decline in network consistency was even more pronounced on Portuguese mobile networks, falling below 40% by 2 PM and initially recovering more slowly than in Spain. Median mobile download speeds on April 28 were 73% lower in Spain and 75% lower in Portugal compared to the previous day.

Mobile Network Performance Collapsed in Close Synchrony with Power Grid Outage in Spain and Portugal
Speedtest Intelligence® | 28 April 2025 (CET)

While substantial service disruptions affected all operators, mobile performance remained relatively stronger on Orange and Movistar in Spain, and Vodafone in Portugal, compared to others on April 28. In Spain, Movistar delivered higher mobile download speeds (1.01 Mbps), upload speeds (0.30 Mbps), and lower multi-server latency (190 ms) at the 10th percentile—meaning for the worst-performing user —on April 28 compared to other Spanish operators, with Orange close behind. This suggests that, even in the worst cases, Movistar’s weakest network performance was materially better than that of Yoigo or Vodafone on average. In Portugal, Vodafone showed a clear lead over both NOS and MEO in metrics such as median download speed and latency on April 28, marking a shift from the pre-event trend in which NOS had led on several performance measures.

Consistency Remained Materially Depressed Across All Operators by Midnight on April 28
Speedtest Intelligence® | 28 April 2025 (CET)

The magnitude of service disruption varied across Spain and Portugal, reflecting differences in regional telecoms infrastructure resilience and the timing of power restoration. In Spain, the outer fringes of the mainland—including the northern and Mediterranean coasts as well as the southern and northeastern border regions—experienced the sharpest declines in mobile performance on April 28, but also showed faster recovery throughout the day, closely tracking grid restoration patterns. Median download speeds fell by more than 85% across areas such as the Valencian Community, Galicia, Andalusia, and the Region of Murcia, compared to declines of around 60% in central regions like Castile-La Mancha, Castile and León, and the Community of Madrid. In Portugal, the most significant impacts were likewise concentrated along the north-south and coastal corridor—from Braga and Porto down through Vila Real and Santarém—where download speeds fell by as much as 90%. In contrast, the interior highlands experienced milder declines of less than 40%, possibly reflecting earlier network hardening efforts in response to wildfire risks.

Outer Regions of the Spanish Mainland Suffered Largest Mobile Network Impacts
Speedtest Intelligence® | Comparison of Median Download Speed on April 27 and April 28

Network outages extended beyond declines in mobile performance to include complete loss of service

In practical terms, the service disruptions and declines in mobile performance in Spain and Portugal led to a significant deterioration in quality of experience (QoE) outcomes. Speedtest Intelligence data revealed a sharp rise in web page load times, a decrease in the proportion of mobile users able to stream Full HD videos, and a substantial increase in latency to key gaming and hyperscaler services across both countries on April 28. In Spain, for example, median web page load time rose by more than 20% where access remained available, while in Portugal it increased by more than 27%.

In the few locations where substantial power backup was available at mobile sites, either through batteries or stationary generators, site uptime was more resilient. However, the cascading effects of increased load, driven both by users migrating from nearby offline sites and by subscribers relying on the mobile network as a substitute for fixed broadband, likely played a significant role in depressing mobile network performance.

The large number of mobile users who were left without any network connection for a prolonged period, with no access to data services and only limited access to voice and text, was reflected in a record volume of partial or failed Speedtest sessions observed on the day of the outage, as large numbers of network subscribers attempted to diagnose connectivity issues but lacked a connection altogether to complete a test.

Power Cuts Produced a Major Spike in Telecoms Outage Reports Across Spain and Portugal
Downdetector® | 28 April 2025 (CET)

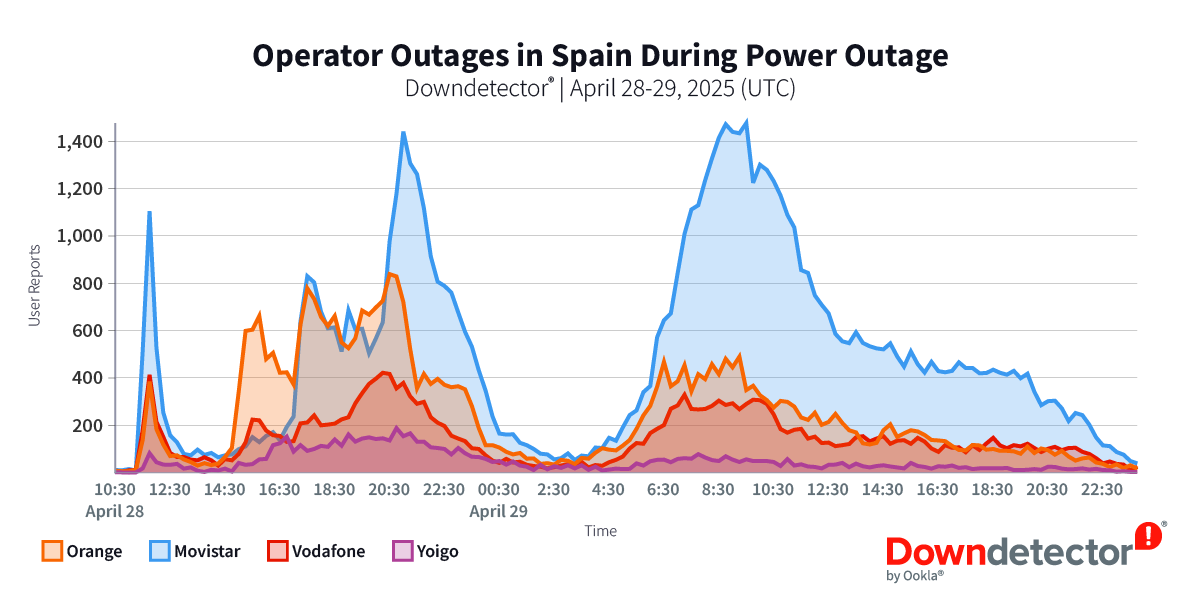
This likely also explains the unusual pattern of Downdetector outage reports on April 28, which spiked in Spain and Portugal immediately after the power outage took hold, declined during the afternoon as network performance reached its lowest point with backup batteries depleted, and then surged again in the evening as power was restored and users were better able to access a connection to report outages affecting one of their access paths.

The best time to strengthen mobile networks is before the lights go out

The limited penetration of battery backup solutions in the mobile site grids across Spain and Portugal was a key contributor to the scale of network disruption caused by the collapse of the power grid on April 28, providing a historic lesson on the importance of infrastructure redundancy.

The policy success of Nordic countries such as Norway and Finland, where local regulators NKOM and Traficom have intervened with legislative instruments to stipulate a minimum number of hours of continuity of mobile service post-power outage, demonstrates that there are viable solutions to harden mobile network infrastructure. Similar efforts have been observed in Australia, where the government subsidized a ‘Mobile Network Hardening’ program to retrofit 467 cell sites with 12 hours power backup capability.

Ookla retains ownership of this article including all of the intellectual property rights, data, content graphs and analysis. This article may not be quoted, reproduced, distributed or published for any commercial purpose without prior consent. Members of the press and others using the findings in this article for non-commercial purposes are welcome to publicly share and link to report information with attribution to Ookla.

| March 12, 2025

How a Power Outage Impacted Chile’s Mobile Network Resiliency

Spanish / Español

Here’s what Chile’s 12-hour nationwide power outage looked like according to mobile Speedtest data

A major transmission line failure caused a massive power outage across most of Chile. The outage began in the afternoon of February 25th and lasted approximately 12 hours, into the early morning of February 26th. Critical facilities like hospitals had to rely on backup power generators and the outage was disruptive enough that a state of emergency was declared for the country. 

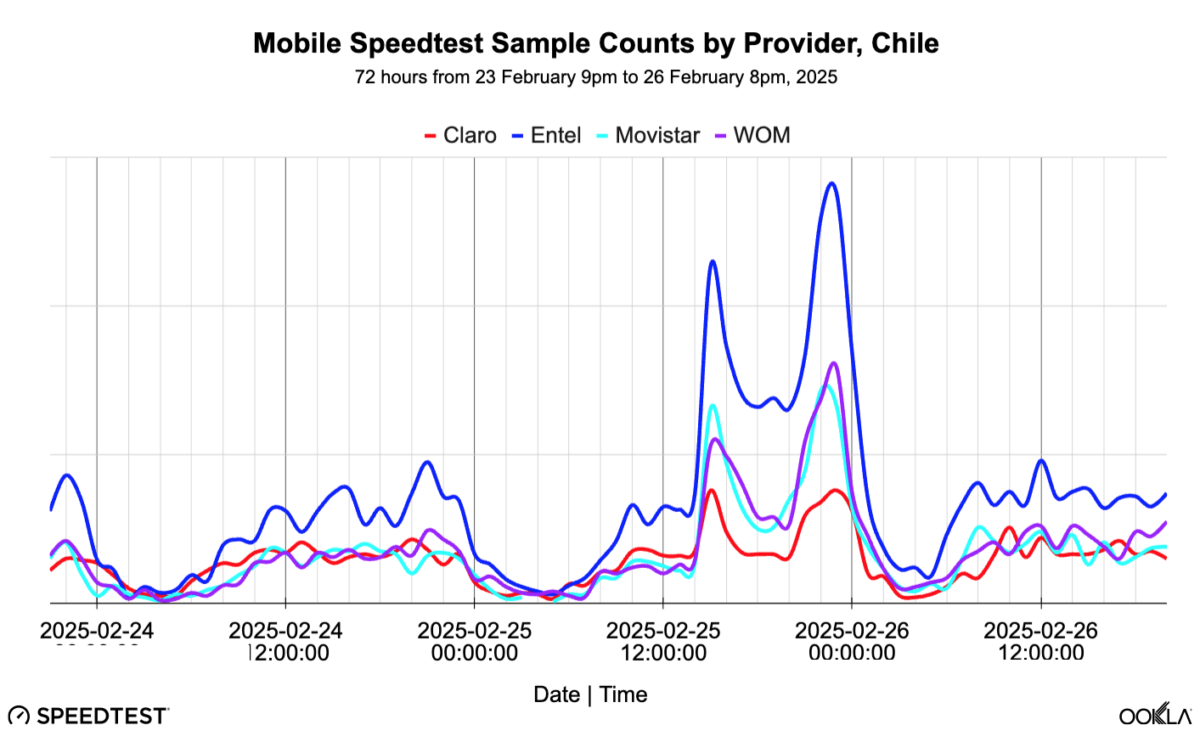
How did mobile networks perform during the outage? This article looks at mobile networks’ performance through Speedtest metrics of sample counts (i.e., the number of completed Speedtests) and download speeds. 

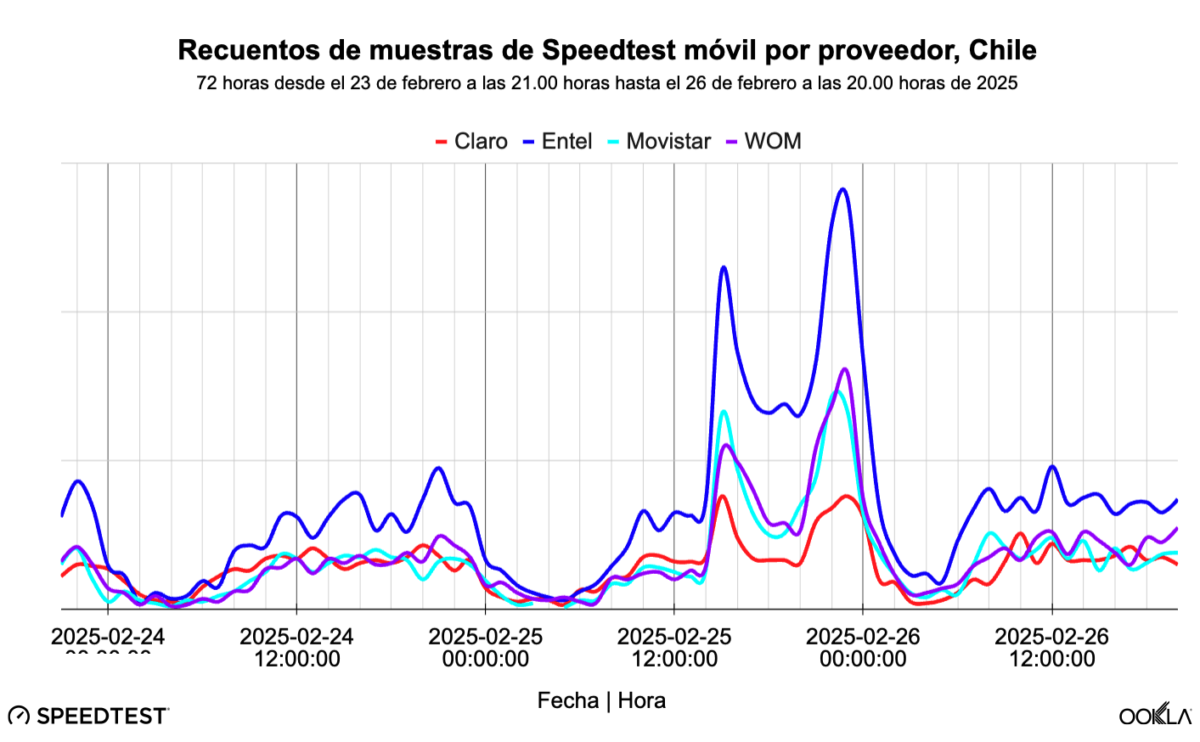
Ookla examined the hourly Speedtest sample counts of the main four mobile carriers in Chile over a 72-hour period. Prior to noon on February 25, 2025, the networks performed in a  normal state with fewer samples in the night and more in the day. 

The outage reportedly started at 3:16 p.m., which matches the spikes in the counts of Speedtest users checking on the network. Comparing the 12-hour outage to the same time the day before, the rate of testing was over 2.5x. This behavior is typical of, and similar to, mobile network outages seen around the world. Staying connected in an emergency is critically important, so checking the status of the network makes good sense.

By the morning of February 26, 2025, when the outage is over and power restored, there is more testing than the prior two mornings. This is likely due to many people checking their phones upon waking up, so it isn’t unusual to see more aggressive testing than usual.

How did the mobile networks perform?

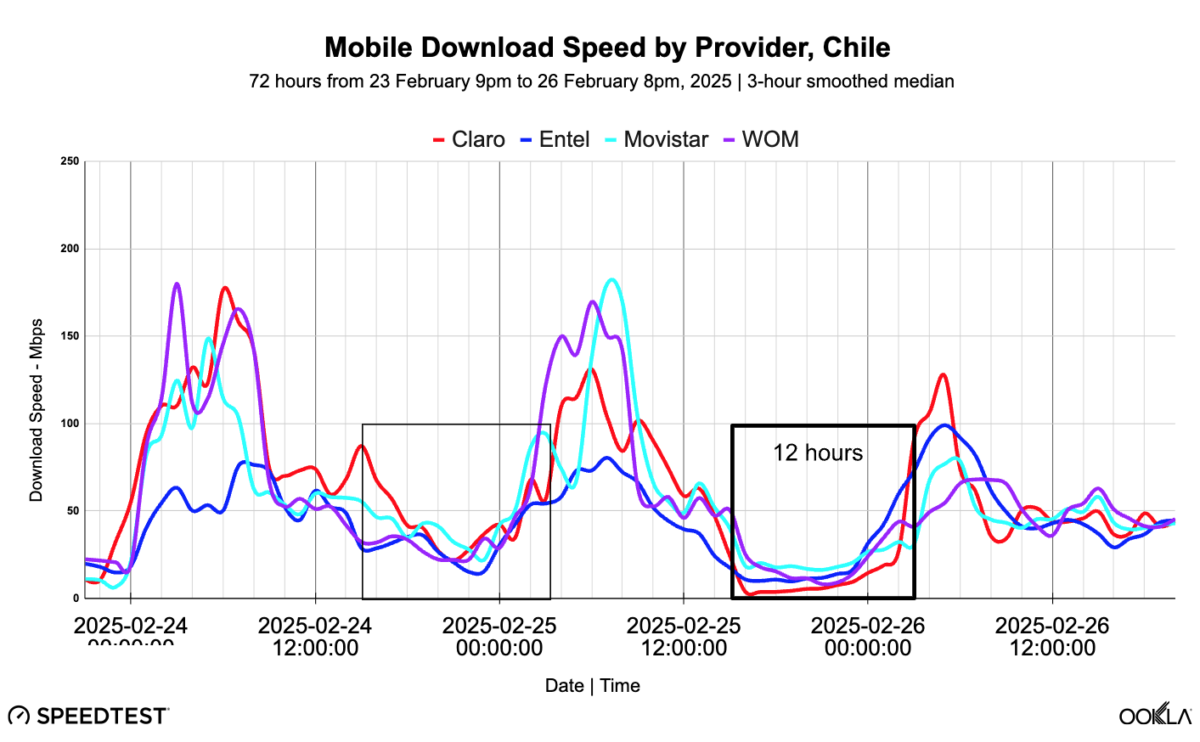
When mobile networks are “unloaded” — that is, not carrying much traffic — as they usually are at night, Speedtest users clock faster speeds. These are the peaks in the chart. The valleys are the times when most people are active and more loading occurs, resulting in slower speeds. 

Selecting the 12 hours of the power outage (the labeled box) and the same 12 hours the prior day (the unlabeled box), the median download speed for the group of operators was effectively cut in half — 16.42 Mbps during the power outage compared to 33.68 Mbps before.

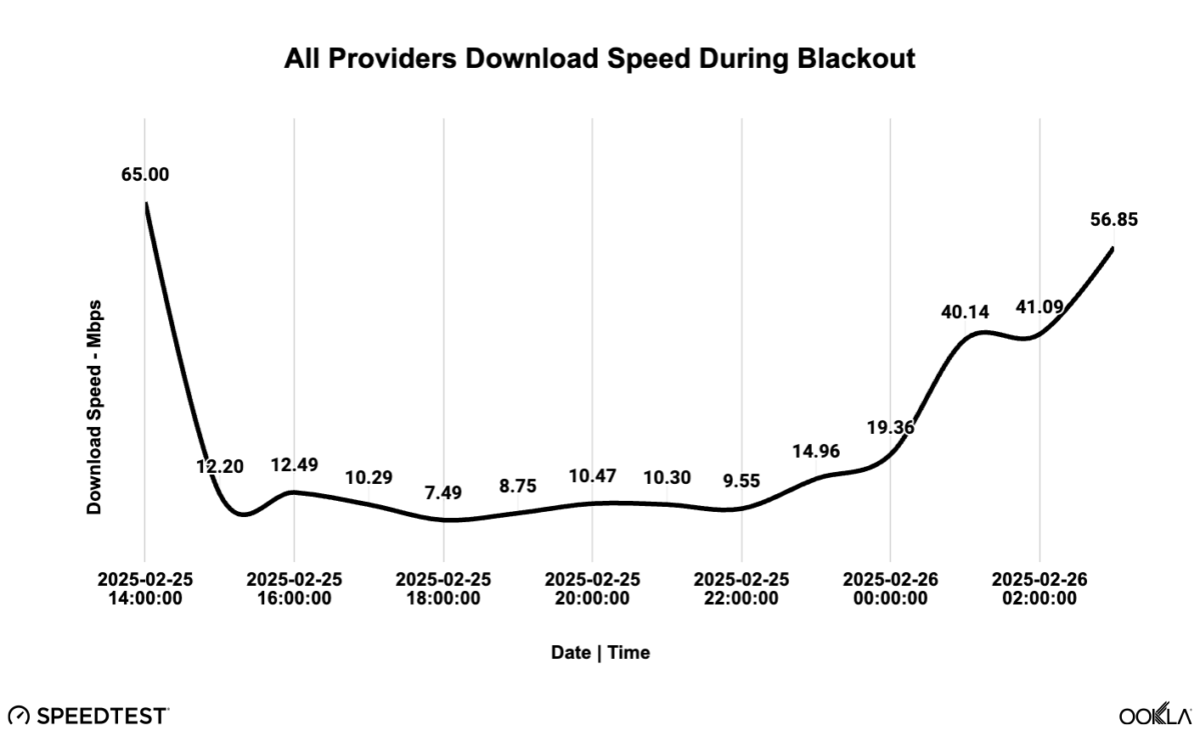
Taking a closer look at all the mobile service providers together, from the outage starting just after 3 p.m., median download speed initially held around 12+ Mbps, then dipped to its low point during the 6 p.m. hour at 7.49 Mbps. Thereafter and until recovery started around 11 p.m., download speeds remained in a narrow range around 9-10 Mbps through the 10 p.m hour. While these median download speeds wouldn’t be considered fast, they do suggest that the mobile networks were serviceable and customers were able to stay in touch.

However, noting that median means the middle, half of the Speedtest users were experiencing slower speeds than seen in the line chart. (And obviously, half were faster, but they wouldn’t have as poor an experience.) To get a sense of the bottom, the slowest 10th percentile for the day of the outage (February 25) compares unfavorably to the same three prior Tuesdays in February. On the day of the outage, the 10th percentile speed was below 1 Mbps – effectively unusable apart from a text message and hopefully holding a voice call. The prior three Tuesdays recorded 2.60 Mbps – still not great, but in older wireless network generations this was fast enough for watching a standard definition (SD) video.

Another observation from the closer look at All Providers Download Speed is the speed declined from early in the outage (3 p.m. to 4 p.m.) to the middle of the outage (5 p.m. to 10 p.m.). One explanation could be the network loading mentioned before, but this seems unlikely since the normal peak loading pattern would have been entirely disrupted by the power outage. A second explanation may be that backup battery power for the cell sites on mobile networks ran out. That is to say, if, for example, every site had a couple hours of battery backup, and some sites also had generators that came online after the batteries were used up, a pattern like this could be seen.

The Chilean telecoms regulator, SUBTEL, was cited in tech press to be looking into increasing the purported four-hour back up to six hours. Network hardening, whether against a power outage or other disruptions like natural disasters, is critical for network resilience.  

Ookla data can offer insights into network performance, reliability, and resiliency. To find out more about Speedtest Intelligence® data and insights, please contact us here.


Cómo afectó un apagón eléctrico a la resiliencia de la red móvil de Chile

Así fue el apagón nacional de 12 horas en Chile según los datos de Speedtest móvil

Una importante avería en una línea de transmisión provocó un apagón masivo en la mayor parte de Chile. El corte comenzó en la tarde del 25 de febrero y duró aproximadamente 12 horas, hasta la madrugada del 26 de febrero. Las instalaciones críticas, como los hospitales, tuvieron que recurrir a generadores de energía de reserva y el apagón fue tan disruptivo que se declaró el estado de emergencia en el país. 

¿Cómo funcionaron las redes móviles durante el apagón? Este artículo examina el rendimiento de las redes móviles a través de las métricas de recuento de muestras de Speedtest (es decir, el número de Speedtests completados) y velocidades de descarga.

Ookla analizó los recuentos horarios de muestras Speedtest de los cuatro principales operadores de telefonía móvil de Chile durante un período de 72 horas. Antes del mediodía del 25 de febrero de 2025, las redes funcionaban de manera normal, con menos muestras durante la noche y más durante el día. 

Al parecer, la interrupción comenzó a las 15.16 horas, lo que coincide con los picos en los recuentos de usuarios de Speedtest que comprueban la red. Si se compara la interrupción de 12 horas con la misma hora del día anterior, la tasa de comprobación se multiplicó por más de 2,5. Este comportamiento es típico y similar al de las interrupciones de la red móvil en todo el mundo. Mantenerse conectado en caso de emergencia es de vital importancia, por lo que comprobar el estado de la red tiene mucho sentido.

En la mañana del 26 de febrero de 2025, cuando terminó el apagón y se restableció el suministro eléctrico, se registraron más test que las dos mañanas anteriores. Esto se debe probablemente a que muchas personas comprueban sus teléfonos al despertarse, por lo que no es raro ver más pruebas de lo habitual. 

¿Cómo funcionaron las redes móviles?

Cuando las redes móviles están “descargadas”, es decir, no tienen mucho tráfico, como suele ocurrir por la noche, los usuarios de Speedtest registran velocidades más rápidas. Esto es lo que representan son los picos en el gráfico. Los valles son los momentos en los que la mayoría de las personas están activas y se produce una mayor carga en la red, lo que da como resultado velocidades más lentas.

Seleccionando las 12 horas del apagón (el recuadro con la línea más gruesa) y las mismas 12 horas del día anterior (el recuadro con la línea más fina), la velocidad media de descarga del grupo de operadores se redujo efectivamente a la mitad: 16,42 Mbps durante el apagón frente a 33,68 Mbps antes.

Si analizamos todos los proveedores de servicios móviles en su conjunto, desde el apagón que comenzó justo después de las 15.00 horas, la velocidad mediana de descarga se mantuvo inicialmente en torno a los 12 Mbps o más, para descender a su punto más bajo a las 18.00 horas, con 7,49 Mbps. A partir de entonces, y hasta que comenzó la recuperación hacia las 23.00 horas, las velocidades de descarga se mantuvieron en un estrecho margen de entre 9 y 10 Mbps hasta las 22.00 horas. Aunque estas velocidades medianas de descarga no se pueden considerar rápidas, sugieren que las redes móviles estaban operativas y los clientes pudieron mantenerse en contacto.

Sin embargo, teniendo en cuenta que la mediana significa el medio, la mitad de los usuarios de Speedtest experimentaron velocidades más lentas que las que se ven en el gráfico lineal (y obviamente, la mitad eran más rápidos, pero no tendrían una experiencia tan mala). Para hacerse una idea de la parte inferior, el percentil 10 más lento para el día de la interrupción (25 de febrero) se compara desfavorablemente con los mismos tres martes anteriores de febrero. El día del apagón, la velocidad del percentil 10 estaba por debajo de 1 Mbps, prácticamente inutilizable salvo para enviar un mensaje de texto y, con suerte, mantener una llamada de voz. Los tres martes anteriores se registraron 2,60 Mbps, lo que sigue sin ser bueno, pero en las antiguas generaciones de redes inalámbricas era lo bastante rápido para ver un vídeo de definición estándar (SD).

Otra observación que se desprende del análisis de la velocidad de descarga de todos los proveedores es que la velocidad disminuyó desde el principio del apagón (de 15.00 a 16.00 horas) hasta la mitad del mismo (de 17.00 a 22.00 horas). Una explicación podría ser la carga de la red mencionada antes, pero parece poco probable, ya que el patrón normal de picos de carga se habría visto totalmente interrumpido por el apagón. Una segunda explicación podría ser que se agotaran las baterías de reserva de los emplazamientos de las redes móviles. Es decir, si, por ejemplo, cada emplazamiento tuviera un par de horas de batería de reserva, y algunos emplazamientos también tuvieran generadores que entraran en funcionamiento una vez agotadas las baterías, podría observarse un patrón como éste.

La SUBTEL, organismo regulador de las telecomunicaciones en Chile, ha sido citada en la prensa tecnológica por estudiar la posibilidad de aumentar a seis horas la supuesta reserva de cuatro horas. El refuerzo de la red, ya sea contra cortes de electricidad u otras interrupciones como catástrofes naturales, es fundamental para la resistencia de la red.  

Los datos de Ookla pueden ofrecer información sobre el rendimiento, la fiabilidad y la resistencia de la red. Para obtener más información sobre los datos y perspectivas de Speedtest Intelligence, póngase en contacto con nosotros ®aquí.


Ookla retains ownership of this article including all of the intellectual property rights, data, content graphs and analysis. This article may not be quoted, reproduced, distributed or published for any commercial purpose without prior consent. Members of the press and others using the findings in this article for non-commercial purposes are welcome to publicly share and link to report information with attribution to Ookla.

| March 12, 2025

Cyclone Alfred Tests the Resilience of Telecom Infrastructure in Queensland, Australia

Ex-cyclone caused widespread power outages across south Queensland and north New South Wales, putting the focus on Australian network resilience and the efforts of local government, utilities and telecom operators in restoring power and connectivity.

South Queensland and north New South Wales are in recovery mode after ex-cyclone Alfred made landfall over the weekend, leading to widespread flooding and power outages and severely impacted the availability and performance of telecom networks across the region. While the recovery effort is underway, we examine the impact of the ex-cyclone on Speedtest users in the region. Australia is an interesting case.

Key Takeaways:

  • Cyclone Alfred triggered a severe decline in mobile performance across all operators in Queensland. On the day the storm made landfall (early on March 8th local time), we saw a substantial uptick in outages reported on Downdetector across all mobile operators and the National Broadband Network (NBN), while median mobile download speeds declined strongly – Telstra’s dipped from 111.33 Mbps on Thursday March 6th, to a low of 51.76 Mbps on March 8th, with significant declines also observed for Optus and Vodafone.
  • Network hardening efforts and cyclone predictability appear to have helped reduce the impact on network infrastructure. In contrast to other major weather events that have impacted telecom networks, for example Storm Éowyn in Ireland and the UK, network performance in Queensland has shown a somewhat milder impact, and started to rebound quicker. The impact in Ireland was greater — with over 725,000 premises affected vs. over 450,000 in Queensland — but the predictable arrival of the cyclone combined with the targeted grant funding as part of the Mobile Network Hardening program likely played a role in Queensland ability to rebound. The program, currently in its third stage, specifically targets improved resilience and response to network outages from natural disasters.
  • The resulting impact on Starlink’s low-Earth orbit (LEO) service underscores user needs during severe network outages, and reinforces the importance of direct-to-cellular (D2C ) satellite services in outage scenarios. Cyclone Alfred reinforced the importance of planned D2C services as a “game changer,” in ensuring the continuity of connectivity during natural disasters, especially for a market such as Australia, with low population density and vast stretches of rural black spots. This comes hot on the heels of a recent government announcement that mobile operators will need to cover the bulk of the Australian continent by 2027 with voice, SMS and emergency service, as part of as revised Universal Service Obligation. Starlink Speedtest samples climbed by 166% on the day cyclone Alfred made landfall, and performance deteriorated under increased demand, highlighting the severity of the telecoms infrastructure disruptions as consumers scrambled to troubleshoot issues and turned to alternative connectivity solutions such as satellite.

Regional energy grid operator Energex, which manages the electricity grid in the parts of south Queensland hardest hit by the cyclone, reported “the greatest number of power outages in Queensland history caused by a natural disaster,” with more than 450,000 premises affected. Recovery efforts have proceeded rapidly, with 392,000 premises back online as of Wednesday March 12th. Energex forecasted that theremaining customers in the more challenging locations will have power restored by March 16th.

This cyclone, the first to hit this far south since Tropical Cyclone Zoe in 1974, has reinforced the importance of recent measures to ensure adequate communication with customers around network outages, introduced at the end of last year by the Australian Communications and Media Authority (ACMA). While outages linked to natural disasters are currently excluded from the ACMA’s rules, it has indicated it is set to examine how to incorporate these kinds of outages in future, but with a view to avoiding impact on critical communications from emergency services. In the meantime, it is clear that the Australian network operators have really stepped up their communications during the outage, and have quickly moved to start restoring connectivity to affected areas. The relatively predictable path and timing of this cyclone has aided preparatory efforts.

Downdetector users highlight the impact of Cyclone Alfred across fixed and mobile services

Analysis of Downdetector® data highlights the uptick in outage reports as Cyclone Alfred made landfall, and began to disrupt the power grid and impact telecommunications infrastructure early on Saturday local time. While Telstra saw the highest number of outage reports, Optus, Vodafone and the NBN also saw spikes in user outage reports, which as of Tuesday, March 11th had still not returned to their pre-cyclone values.

Cyclone Alfred Triggers Surge in Downdetector Network Outage Reports
Downdetector® | March 2025

Mobile users in Queensland see marked declines across all performance metrics, with network impacts continuing

The impact of the cyclone has been significant across all network operators. Optus noted a total of 419 mobile sites down, with just over 60% of those restored as of 8am AEDT on March 12th, via a combination of generators, and satellite-powered mobile base stations (SatCats). At the same time, Vodafone reported they had restored power to more than 100 mobile sites, but that 117 remained without power, of which only 15 lacked overlapping coverage. In addition, Telstra noted on X that it had been able to bring 85% of its impacted mobile sites back online as of the same timeline. The NBN, the national wholesale provider which manages the fixed broadband access infrastructure across Australia, mapped out a peak of 252,000 of its connections (both wired and FWA) impacted by the cyclone on Sunday March 9th, which by March 11th had fallen to 147,000. Network outages such as these present a dual strain: increased network load as fixed broadband outages shift traffic to mobile infrastructure, and a diminished mobile site grid due to power outages at mobile sites. Together, these factors significantly degrade mobile network performance, reducing overall network availability and pushing more subscribers into the cell edge, or into overlapping cells which will tend to have poorer performance.

Analysis of Speedtest Intelligence® data highlights the significant impact of Cyclone Alfred on mobile network performance in Queensland. Download and upload speeds have witnesses sustained declines, accompanied by increased latency and jitter across all operators in the state. While some recovery has been observed from Sunday (March 9th) onwards, all performance metrics remain materially below pre-storm levels. Outages such as this will reinforce calls for greater national roaming provision and mutual assistance in the event of outages, as outlined in the recommendations of a Parliamentary report presented following the review of Optus’ major network outage in November 2023.

Cyclone Alfred Blows Down Mobile Performance in Queensland Across All Metrics and Operators
Speedtest Intelligence® | March 2025

In addition to a decline in metrics like Consistency—designed to measure the proportion of Speedtest samples reflecting a consistent quality of experience (QoE)—the storm-induced network disruptions led to a substantial increase in failed or partially completed Speedtest sessions across all operators on the day of the storm. Similarly, the severe decline in 10th percentile performance—where aggregate download speeds fell, from a high of 9.10 Mbps on March 4th, to a low of 2.56 Mbps on March 8th. 10th percentile upload speeds plummeted to a low of just 0.24 Mbps, while latency rocketed to 293 ms—highlighting the extent of performance degradation experienced by mobile users at the bottom end of the scale.

Cyclone Alfred Triggers Deterioration in Consistency Across All Operators
Speedtest Intelligence® | March 2025

LEO satellites pick up some of the slack

While significant amounts of fixed traffic will have migrated to mobile as power outages occurred, and where mobile signal was still available, we also witnessed an uptick in Starlink Speedtest samples during the ex-cylone’s passage across southern Queensland. Starlink samples hit a high on Sunday March 9th, representing an increase of 166% over samples observed at the start of March. This additional demand on the service pushed performance levels down, hitting a low of 47.11 Mbps median download speed, but recovering swiftly afterwards.

Starlink Performance During Cyclone Alfred – Queensland
Speedtest Intelligence® | March 2025

Starlink’s performance here is interesting to observe in light of the recent Australian government announcement that all mobile providers in the country should provide near nationwide coverage for voice and SMS and Triple Zero (emergency) services by 2027, as part of the Universal Outdoor Mobile Obligation (UOMO), itself part of an updated Universal Service Obligation (USO). D2C services via LEO satellites are imminent in the country, with both Telstra and Optus having inked deals with Starlink, while Vodafone (TPG Group) has an agreement in place with Lynk Global. We will continue to monitor network resilience around the world in the face of severe network outages, and highlight best practice. For more information on how Downdetector and Speedtest can help respond to outages, detect areas of poor performance and optimise networks, please contact us.

Ookla retains ownership of this article including all of the intellectual property rights, data, content graphs and analysis. This article may not be quoted, reproduced, distributed or published for any commercial purpose without prior consent. Members of the press and others using the findings in this article for non-commercial purposes are welcome to publicly share and link to report information with attribution to Ookla.

| January 27, 2025

Impact Analysis: Storm Éowyn Tests the Resilience of Telecoms Infrastructure in the UK and Ireland

Record power outages have crippled mobile network infrastructure, underscoring the need for network hardening as severe weather events become more frequent.

The UK and Ireland are in recovery mode after Storm Éowyn wreaked havoc on electricity and telecoms infrastructure in recent days. With record wind gusts exceeding 180 km/h recorded in Ireland and a ‘major incident’ declared on the Isle of Man, the storm has been historic in both its strength and the extent of the damage caused across the islands.

Key Takeaways:

  • Storm Éowyn triggered a rapid, severe and sustained decline in mobile performance across all operators in Ireland and parts of the UK, particularly Northern Ireland and Scotland, on a scale not seen before. On the day the storm made landfall (24th January), median mobile download speeds in Ireland (10.04 Mbps) were 78% lower than the preceding 7-day average of 47.43 Mbps, while median latency was 23% higher at 47.6 ms. In Scotland and Northern Ireland, mobile download speeds at the 10th percentile—a critical metric reflecting the poorest network performance—dropped significantly on the same day, falling by 63% to 2.19 Mbps and by 74% to 1.31 Mbps, respectively, compared to the 7-day average. 
  • Network disruptions drove a dramatic deterioration in quality of experience (QoE) in bread-and-butter consumer applications. Consistency—an important metric indicating the proportion of Speedtest samples meeting minimum download and upload speed thresholds—dropped sharply on the day of the storm, falling by over 20 percentage points to 60.3% in Northern Ireland and by nearly 40 percentage points to 52.3% in Ireland compared to the preceding 7-day average. On the day following the storm (25th January), as power restoration efforts were still in their early stages, Video Score—a key indicator of QoE in gaming activities—remained significantly suppressed, falling by over 23 points compared to the preceding 7-day average in Northern Ireland.
  • The unprecedented scale of impact on telecoms infrastructure serves as the latest and most high-profile call to action for hardening networks against increasingly frequent and severe storms in the UK and Ireland. Record daily consumer-initiated Speedtest volumes and a 62% surge in Speedtests conducted on Starlink connections in Ireland on the storm day, compared to the preceding 7-day average, highlight the severity of the telecoms infrastructure disruptions as consumers scrambled to troubleshoot issues and turned to alternative connectivity solutions like satellite.

Ireland’s state electricity supplier, ESB Networks, reported “unprecedented” power outages affecting over 725,000 premises (equivalent to as much as one-third of all homes in the country), with restoration times expected to exceed a week in the hardest-hit areas. The extensive damage to the electricity grid has had severe knock-on effects on both fixed and mobile network infrastructure, with well over a thousand mobile sites taken offline due to disruptions to mains power and downed trees causing damage to overhead fibre cabling along roads.

The impacts have been significant across operators. In Ireland, Eir reported that fixed broadband faults were affecting 160,000 premises, with more than 900 mobile sites knocked offline, while Vodafone said more than 10% of its mobile site footprint was affected. Similarly, in the UK, there were elevated reports of network outages across telecoms operators on Downdetector, with the largest concentration of disruptions in the worst hit areas in Scotland and Northern Ireland.

This storm, the most severe to date, follows a series of disruptive weather events across the UK and Ireland during recent winter months. In December, Ookla published detailed research on the impact of Storm Darragh, highlighting the unique challenges posed by widespread, prolonged power outages on mobile networks. These challenges included a dual strain: increased network load as fixed broadband outages shifted traffic to mobile infrastructure and a diminished mobile site grid due to power outages at mobile sites. Together, these factors significantly degrade mobile network performance, reducing overall network availability and pushing more subscribers into the cell edge.


Mobile users in Ireland see marked declines across all performance metrics, with network impacts continuing

Analysis of Speedtest Intelligence® data highlights the significant impact of Storm Éowyn on mobile network performance in Ireland. Download and upload speeds saw sharp and sustained declines, accompanied by increased latency and jitter across all operators nationwide. The deterioration started early on Friday morning, 24th January, as the storm made landfall. While some recovery was observed the following day (25th January), all performance metrics remain materially below pre-storm levels nationally.

Despite the absence of active network sharing in Ireland—limited to cooperation on passive infrastructure, which relies on a common mains power supply at shared sites—the storm’s impacts were felt similarly across operators. Notably, the performance profile across operators during the storm closely mirrored pre-storm trends. For instance, Three maintained its lead in download speed and demonstrated a faster recovery on this metric compared to other operators.

Storm Éowyn Blows Down Mobile Performance in Ireland Across All Metrics and Operators
Speedtest Intelligence® | January 2025

In addition to a decline in metrics like Consistency—designed to measure the proportion of Speedtest samples reflecting a consistent quality of experience (QoE)—the storm-induced network disruptions led to a substantial increase in failed or partially completed Speedtest sessions across all operators on the day of the storm. Similarly, the severe decline in 10th percentile performance—where aggregate download speeds plummeted by over 87%, from a 7-day average of 3.97 Mbps to just 0.51 Mbps—highlights the extent of performance degradation experienced by Irish mobile users at the bottom end.

Storm Éowyn Triggers Sharp Deterioration in Consistency Across All Operators
Speedtest Intelligence® | January 2025

On the day of the storm, Consistency dropped to a low of 38% at 09:00 on Friday nationally and remained below 55% in the evening. While there was an improvement the following day (25th January), reaching a high of 66% at 16:00, the overall profile remains significantly below the pre-storm baseline.

Storm Éowyn Triggers Sharp, Sustained Decline in Consistency Across Ireland
Speedtest Intelligence® | January 2025

It is notable that the limited penetration of battery backup solutions in Ireland’s mobile site grid—typically providing only four to eight hours of power where available—stands in sharp contrast to regions like the Nordics and Australia, which have implemented comprehensive policy measures to harden telecoms infrastructure, as highlighted in a recent Ookla article. This shortfall has resulted in a disproportionate reliance on stationary and mobile generators in the Irish context.

While mobile generators have high operating costs, which limit their feasibility for prolonged or widespread deployment across the mobile site grid in Ireland, they offer operators valuable deployment flexibility. Mobile operators can proactively position generators at key sites based on forecasted storm tracks and leverage distributed fuel dumps across the country to enable rapid refueling during post-storm operations.

Analysis of Speedtest Intelligence data underlines the impact of these efforts on service continuity and restoration. On the morning of the storm, Eir publicly reported deploying mobile generators to key sites in County Cork—one of the worst-affected areas—to restore mobile services ahead of mains power being restored. This proactive approach (which all operators adopted) is reflected in a sharp recovery of Eir’s Consistency score in Cork, which rebounded from as low as 59% on the day of the storm to as high as 95% the following day. This rate of recovery outpaced other operators in the county for this metric, highlighting the important role of rapid power restoration using generator solutions.


Mobile network disruptions extend to Scotland and Northern Ireland

While Ireland experienced some of the most severe and widespread impacts of Storm Éowyn, it was not alone. In Northern Ireland, power outages affecting 30% of premises at their peak were reported by NIE Networks, the primary energy provider in the region. Similarly, in Scotland, over 100,000 homes were left without power, with restoration efforts expected to continue for several days. These widespread power outages have impacted mobile site uptime in both regions.

Storm Éowyn's Impact on Consistency was more pronounced in Northern Ireland than Scotland
Speedtest Intelligence® | January 2025

Speedtest Intelligence data indicates a decline in mobile performance across multiple metrics among operators in Northern Ireland and Scotland, with Northern Ireland experiencing the greatest impact. Mobile download speeds at the 10th percentile plummeted on the day of the storm, falling 63% to 2.19 Mbps in Scotland and 74% to 1.31 Mbps in Northern Ireland relative to the seven-day average before the storm.

Storm Éowyn Pulls Down Mobile Performance Across Several Metrics in Scotland and Northern Ireland
Speedtest Intelligence® | January 2025

Similar to Ireland, the penetration of battery backup solutions installed at mobile sites in the UK remains limited. In its latest annual ‘Connected Nations‘ report, Ofcom noted that only around 20% of all mobile sites in the UK have some backup functionality at the RAN for more than 15 minutes, while only around 5% of sites are able to withstand a six-hour power loss (excluding battery backup for transmission traffic). It has consulted on revised ‘Resilience Guidance’ for the UK’s telecoms operators, published a call for input (CFI) on power backup for mobile networks and is now working with the government to determine if additional resilience measures are needed. 

Ookla retains ownership of this article including all of the intellectual property rights, data, content graphs and analysis. This article may not be quoted, reproduced, distributed or published for any commercial purpose without prior consent. Members of the press and others using the findings in this article for non-commercial purposes are welcome to publicly share and link to report information with attribution to Ookla.

| December 11, 2024

Mobile Network Resilience Under the Spotlight in Ireland During Storm Darragh

Climate change is placing new demands on operators and regulators to harden telecoms infrastructure against severe weather events

Storm Darragh caused widespread mobile network outages across Ireland in recent days, impacting all operators. The storm resulted in the most extensive damage to the country’s electricity infrastructure in a decade, leaving nearly 400,000 premises without power at its peak.

This led to significant disruptions to mobile site uptime, prompting the swift deployment of mobile generators across affected areas and a seismic shift in mobile network usage patterns, with increased demand in locations where power cuts or other disruptions rendered fixed broadband unusable.


Mobile networks came under strain during Storm Darragh, pulling down performance nationwide

Analysis of Speedtest Intelligence® data reveals the substantial impact of the storm on mobile network performance in Ireland. A marked and sustained decline in download and upload speeds, as well as increased latency and jitter, was observed across all operators nationally. The deterioration escalated rapidly on Friday night (6th December) as the storm made landfall, peaking on Saturday (7th December) and is only slowly returning to the pre-storm performance baseline as power outages persist through this week in the worst-affected areas.

Consistency Deteriorated Across All Mobile Operators in Ireland During Storm Darragh
Speedtest Intelligence® | December 2024

Median download speeds on Saturday were nearly 70% lower than the 7-day average preceding the storm across all operators and technologies, while median latency increased by nearly 17%. Consistency—a measure of the percentage of an operator’s samples meeting or exceeding minimum download and upload thresholds—dropped to some of its lowest one-day levels recorded in Ireland in recent years. Around 40% of all samples failed to meet the minimum thresholds across 4G (5 Mbps download, 1 Mbps upload) and 5G (25 Mbps download, 3 Mbps upload) on Saturday.

This performance analysis is based on the national picture, highlighting that the impact was significant enough to lower the overall country-wide performance profile. A closer examination of the worst-affected areas along the western seaboard revealed even more pronounced declines in performance outcomes in the aftermath of the storm.

Latency Performance Deteriorated Across All Mobile Operators in Ireland During Storm Darragh
Speedtest Intelligence® | December 2024


The volume of Speedtests initiated by Irish users increased significantly above typical levels over the weekend, serving as a proxy for the connectivity challenges. This surge also reflects the impact of a shift in usage patterns, with households resorting to tethering mobile connections when fixed broadband became unavailable and thereby increasing further the strain on a depleted mobile site grid.

Download Speed Performance Deteriorated Across All Operators in Ireland During Storm Darragh

Upload Speed Performance Deteriorated Across All Mobile Operators in Ireland During Storm Darragh
Speedtest Intelligence® | December 2024

10th Percentile Download Speed Performance is Recovering As Power Outages Recede and Network Load Normalises
Speedtest Intelligence® | December 2024


Battery backup is needed for future resilience but costs remain a barrier

Lead-acid and lithium-ion batteries are widely deployed across mobile sites in Ireland and other countries, providing short-term resilience in the event of power outages. The fact that only a small proportion of deployed backup batteries provide sufficient capacity to last for multiple hours means that operators rely heavily on stationary and mobile generators during prolonged power outages.

Ireland is no exception to this trend. The UK’s Ofcom reported recently that “around 20% of all mobile sites have some backup functionality at the RAN [in the UK] for more than 15 minutes, with around 5% of sites able to withstand a six-hour power loss (excluding battery backup for transmission traffic)”. It has consulted on revised ‘Resilience Guidance’ for the UK’s telecoms operators, published a call for input (CFI) on power backup for mobile networks and is now working with the government to determine if additional resilience measures are needed. 

Mobile operators in Ireland and elsewhere proactively ensure that generators are refuelled in advance of adverse weather events like Storm Darragh and leverage strategic fuel dumps across the country to enable rapid refuelling where needed. The high upfront cost of battery backup and the high operating cost of generators, however, prohibits universal deployment in the current capital environment, with dedicated solutions needed for each operator, even at shared sites—necessitating targeted policy support and new solutions to improve network resilience as the frequency and severity of these weather events increases.

Network resilience lessons from around the world

The policy success of Nordic countries such as Norway and Finland, where local regulators NKOM and Traficom have intervened with legislative instruments to stipulate a minimum number of hours of continuity of mobile service post-power outage, demonstrates that there are viable solutions to harden mobile network infrastructure. Similar efforts have been observed in Australia, where the government subsidised a ‘Mobile Network Hardening’ programme to retrofit 467 cell sites with 12 hours power backup capability.

Ofcom’s aforementioned consultations have not yet led to the proposal of any specific measures relating to the provision of battery backup solutions in the UK. The regulator’s preliminary assessment of the feasibility of any such measures concluded that the exorbitant costs involved in providing a minimum of one hour of power resilience at every cell site in the country would not be proportionate to the potential economic benefit accrued—with cost projections in the region of £0.9-1.8 billion.

Nonetheless, Ofcom has expressed hope that the continued reduction in the cost of battery backup solutions will make interventions viable in the future. Progress in developing new business models to monetise battery backup solutions is also likely to improve their allure over time for operators, with new use cases emerging in grid frequency restoration.

Finland’s Elisa has been a global leader in this space through the success of its ‘Distributed Energy Storage’ solution, which provides energy to the grid at peak times and charges from the grid in off-peak times. The operator claims to have reduced the payback period of its mobile site battery installations to 3-5 years.

Ookla retains ownership of this article including all of the intellectual property rights, data, content graphs and analysis. This article may not be quoted, reproduced, distributed or published for any commercial purpose without prior consent. Members of the press and others using the findings in this article for non-commercial purposes are welcome to publicly share and link to report information with attribution to Ookla.