| February 28, 2023

Chile Writes the Blueprint for Fixed Network Improvement in Latin America

Key messages

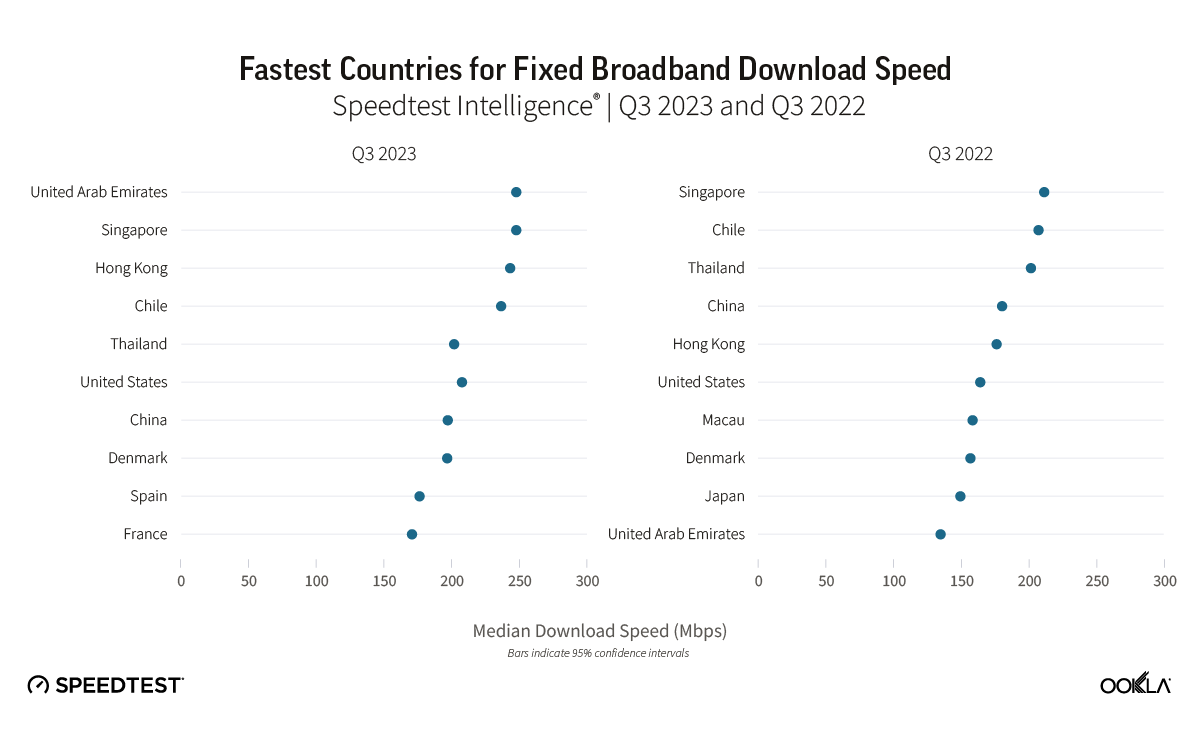
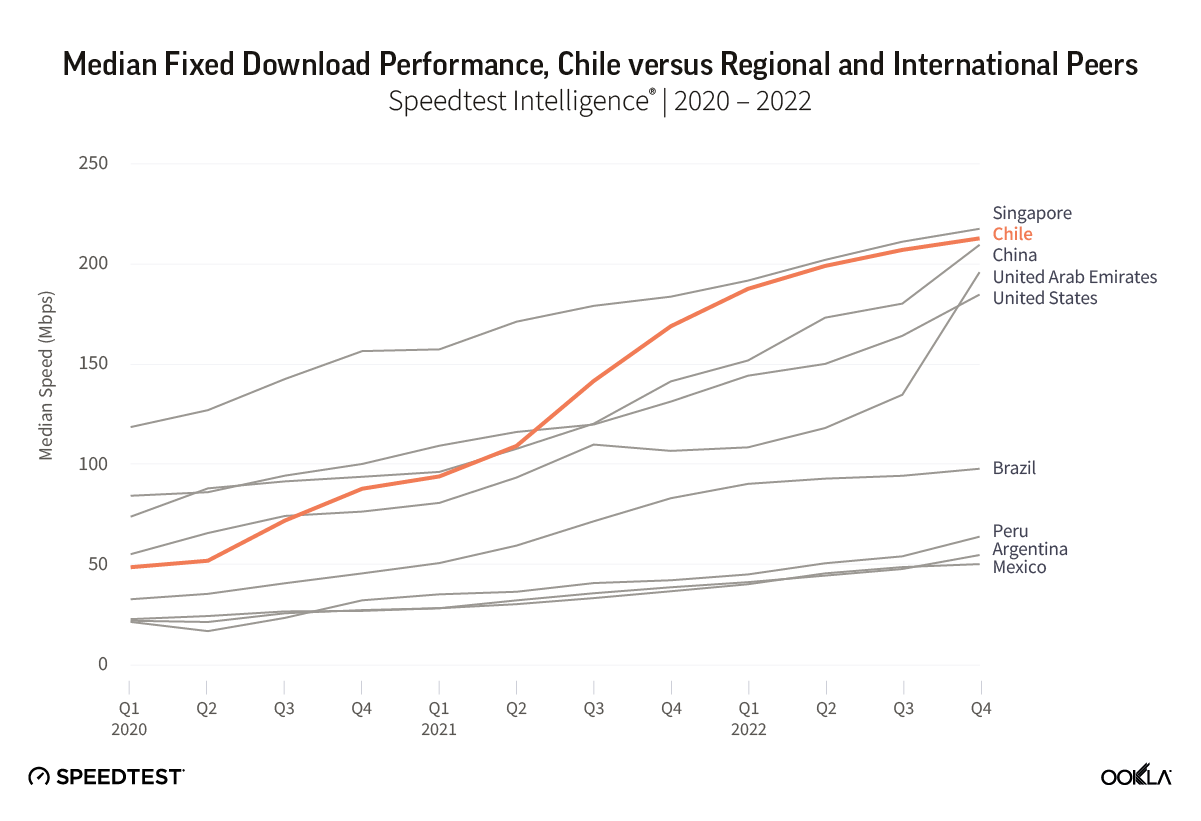
  • From a median download speed of 50.23 Mbps in Q1-Q2 2020 to 205.96 Mbps in Q3-Q4 2022 – Chile punches up on fixed line performance. Chile has been the top performing fixed broadband market across Latin America, consistently outperforming other markets in the region. Over the last three years it has also closed the performance gap to other leading markets globally, and during 2022 consistently featured in the top five of Ookla®’s Speedtest Global Index™, where as of January it placed second.
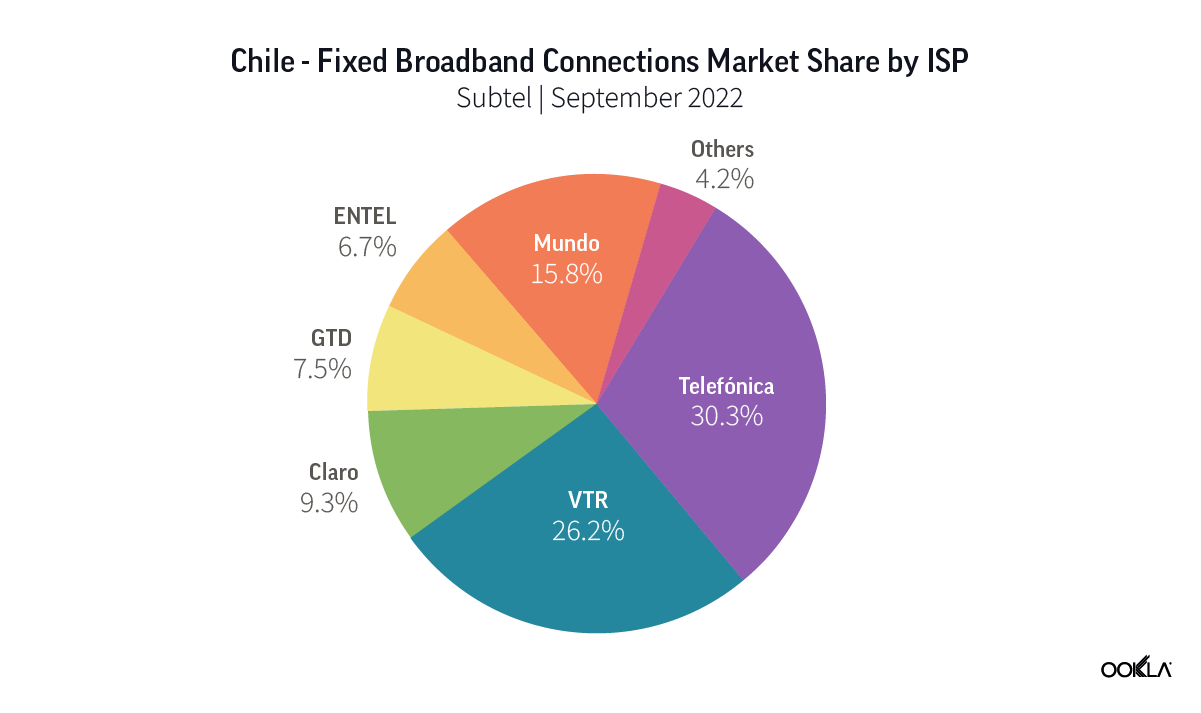
  • Strong competition the primary driver. Chile’s strong fixed broadband performance — an anomaly in the region — is due primarily to strong competition among Chilean ISPs. Chile has six ISPs with more than 5% market share, all of which are heavily focused on migrating customers to fiber, and five of which recorded median download speeds in excess of 100 Mbps during Q4 2022.
  • Fixed-line investment focused on driving rapid migration to fiber. Strong competition has promoted heavy fixed-line network investment, with reported data indicating capital intensity ratios in excess of 20% in the market. This has translated into a rapid technology migration, shifting the market from a majority of connections via cable (HFC) at the end of 2019, to fiber now comprising almost two-thirds of connections. Furthermore, it has also seen the formation of a neutral network, On*Net, which offers wholesale fiber access to other ISPs.
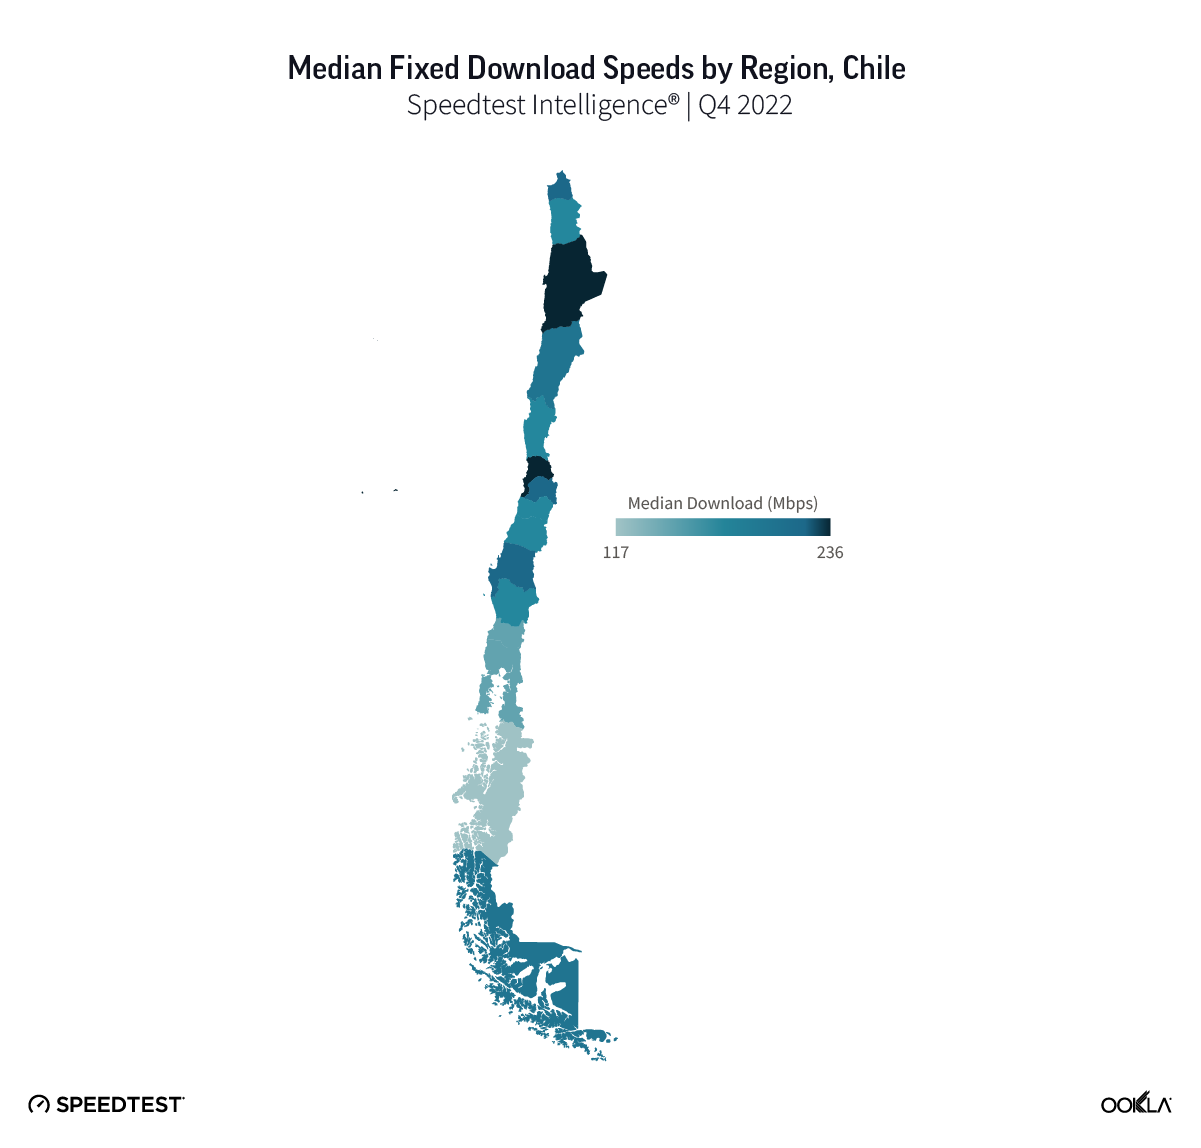
  • Supporting economic growth in the market. Subject to rising inflation and a market overheated following government intervention post the COVID-19 pandemic, Chile’s economy is expected to contract in 2023 before returning to growth in 2024. Despite this, broadband adoption among businesses continues to advance at a rapid pace, a positive sign in helping support the market’s future growth potential. In addition, broadband performance across the entire market is strong, with median download speeds in all Chilean regions in excess of 100 Mbps as of Q4 2022.

Chile punches up on fixed-line performance

Chile has been a regional leader in fixed line performance in Latin America since 2016, and since then has continually widened its advantage over its regional peers. Over the past three years Chile has driven fixed-line performance increases, from a median download speed of 50.23 Mbps in Q1-Q2 2020 to 205.96 Mbps in Q3-Q4 2022. This makes Chile now a clear anomaly among Latin American markets, having closed the performance gap to the top-performing fixed-line markets worldwide during 2022.

chart of median fixed download performance, chile versus regional and international peers

Chile’s population is predominantly urban-based, with a rural population of just 12.2% in 2021 according to the World Bank. While connecting rural premises with advanced fixed access networks is more costly and less profitable than in urban environments, the urban nature of Chile is not markedly different compared to its peers in Latin America. Brazil has only a marginally greater rural share of population at 12.7%, while Argentina has a lower share, at only 7.8%.

Speedtest Intelligence® data shows that at a regional level within Chile, ISPs are supporting median download speeds in excess of 100 Mbps across all regions during Q4 2022. Santiago Metropolitan Region is the most populous region in Chile, and recorded a median download speed of 215.73, while the region with the largest rural share of population, Maule, recorded a median download of 189.36 Mbps. The lowest median speed was observed in Aysén, with 117.34 Mbps. This relative equity in fixed line performance across regions echoes a 2020 OECD country report on Chile, which highlighted that while economic disparities between Chile’s regions are above the OECD average, it has shown the largest reduction in regional economic inequality among OECD countries since 2008.

map of median fixed download speeds by region in chile

Hyper-competitive fixed broadband market

Of the top eight markets in the Speedtest Global Index, Chile had the greatest concentration of ISPs supporting high-speed broadband services. Speedtest data shows eight ISPs active in the Chilean market with more than 3% share of samples, and of these seven supported median download speeds in excess of 100 Mbps. According to the regulator Subtel, Telefonica led the market with 30.3% market share, ahead of second-placed VTR with 26.2%.

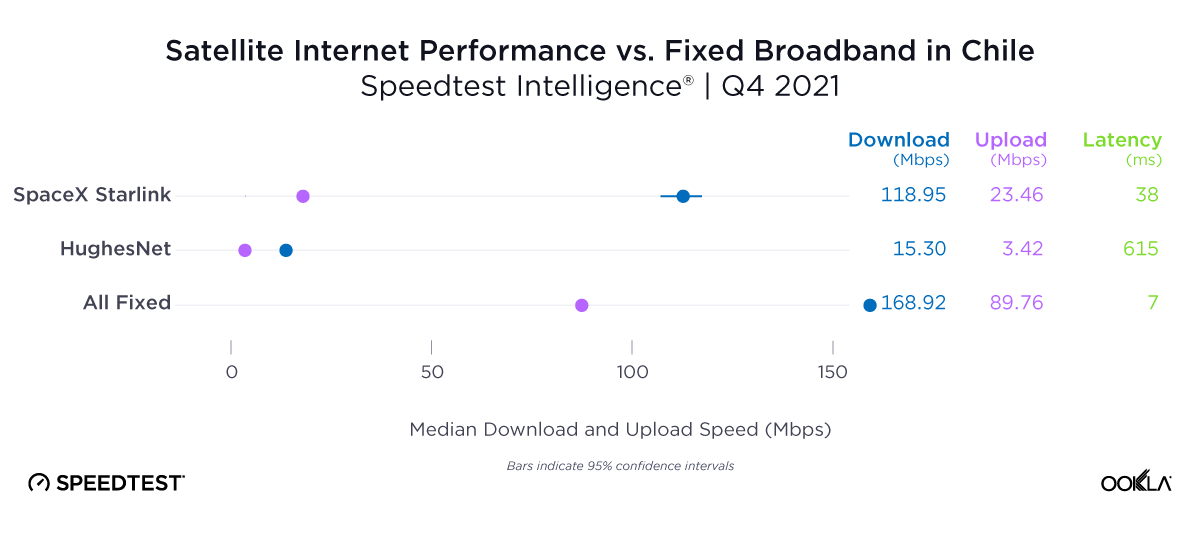
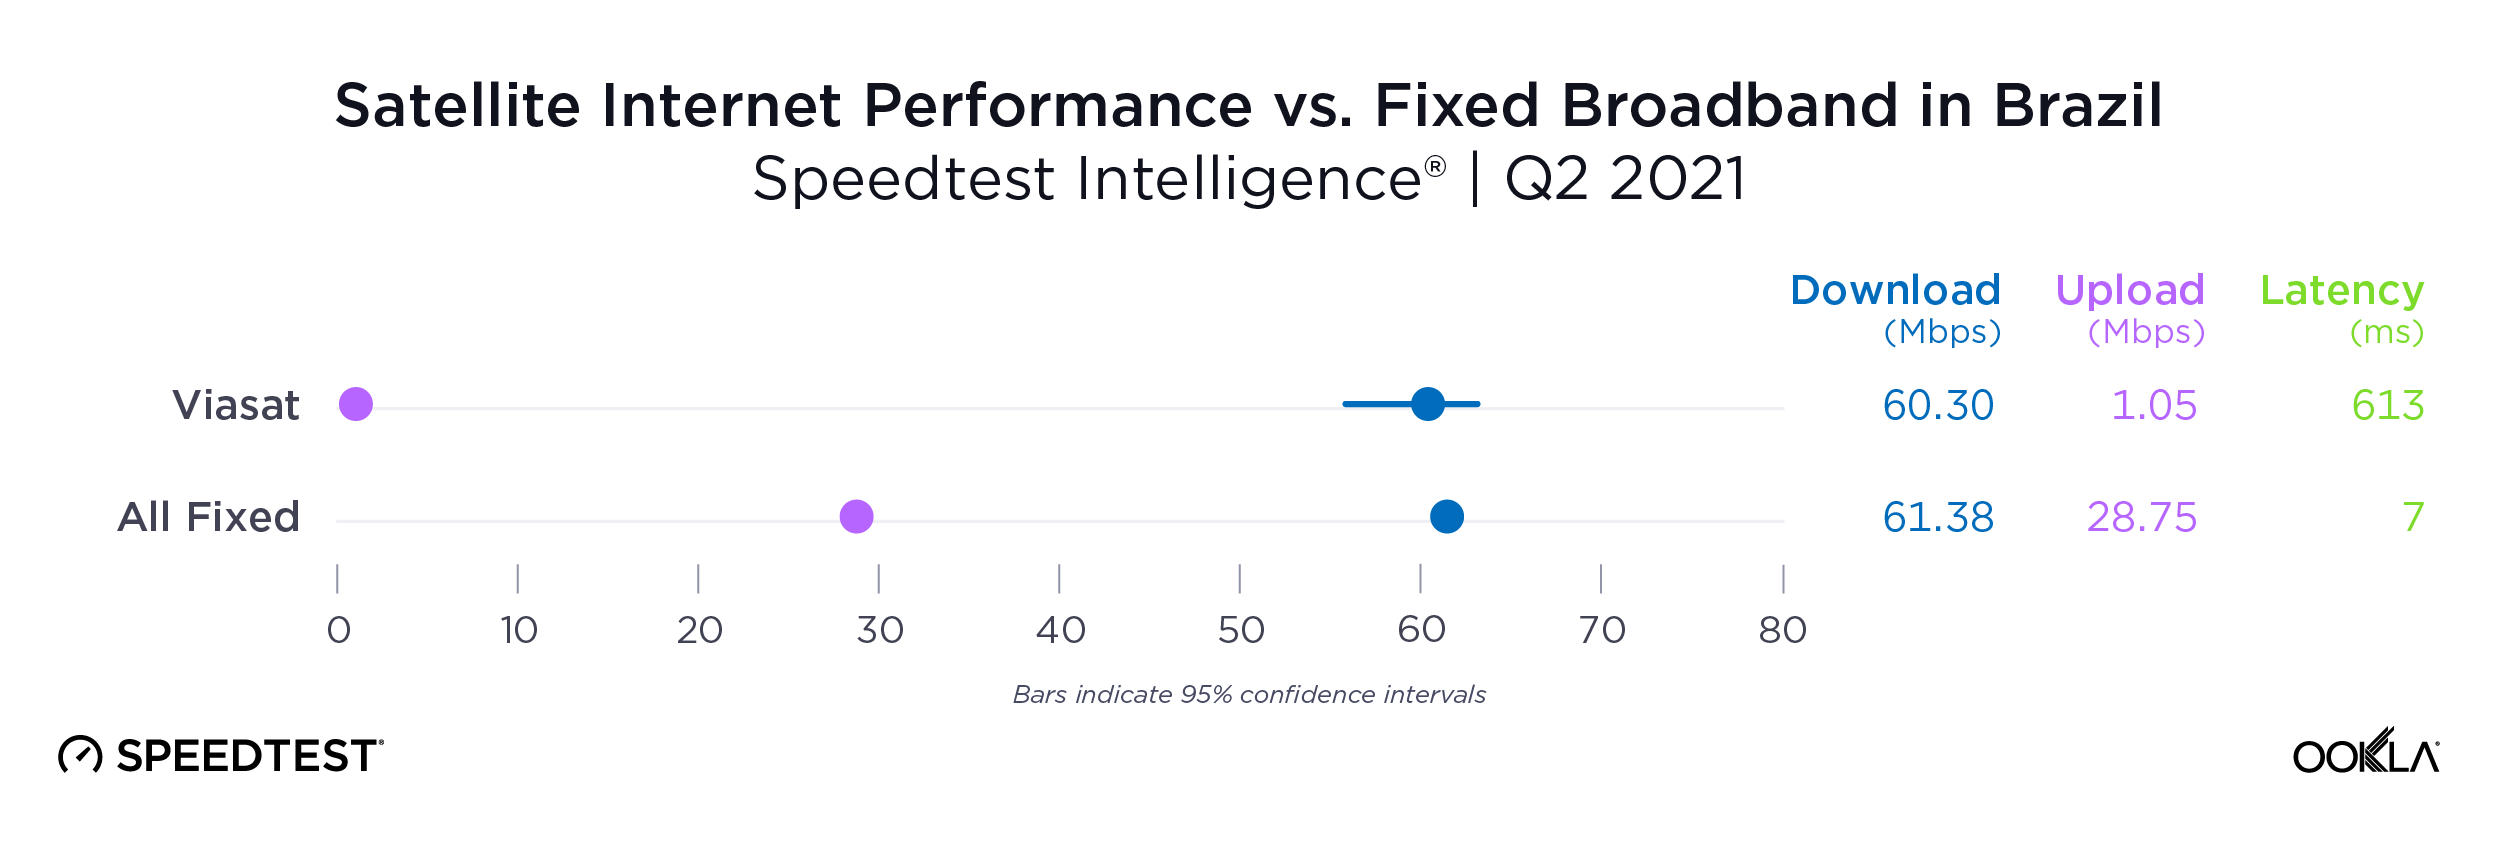
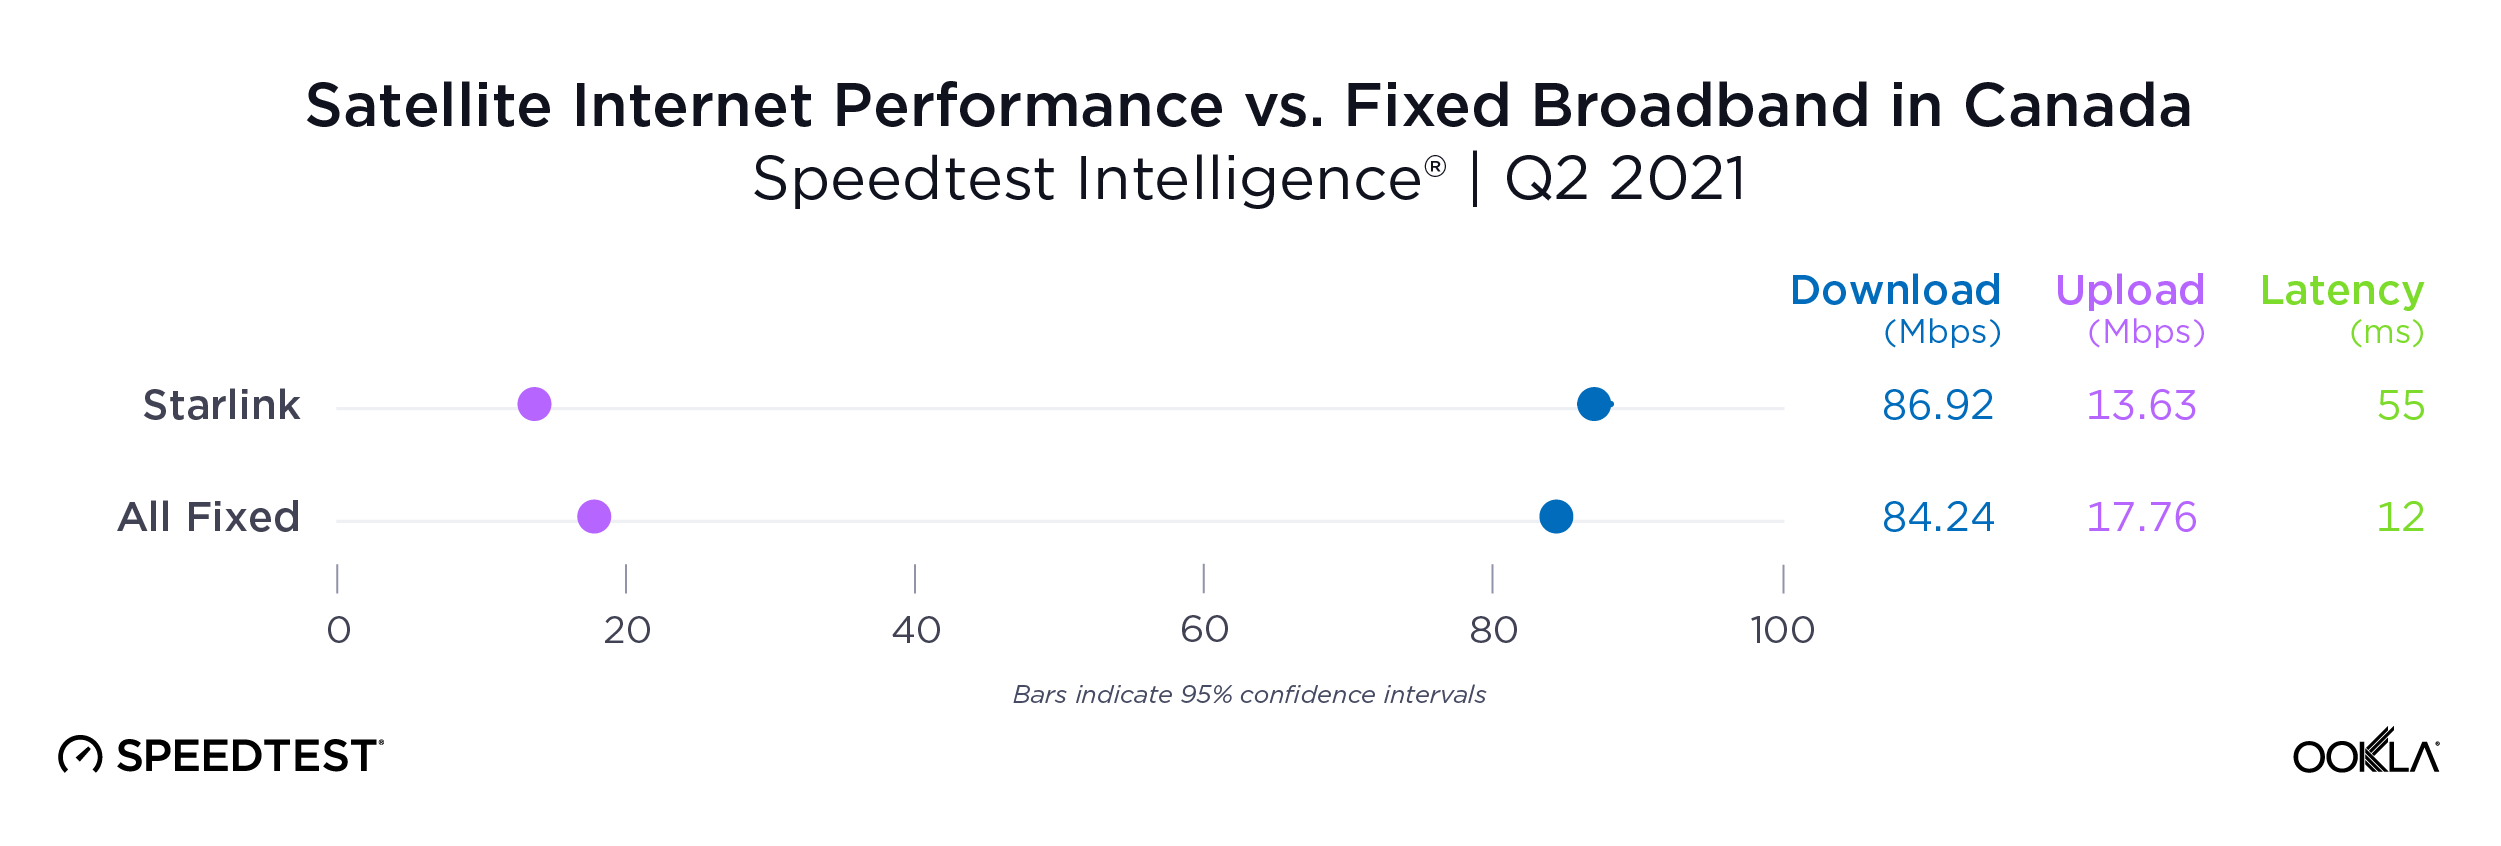
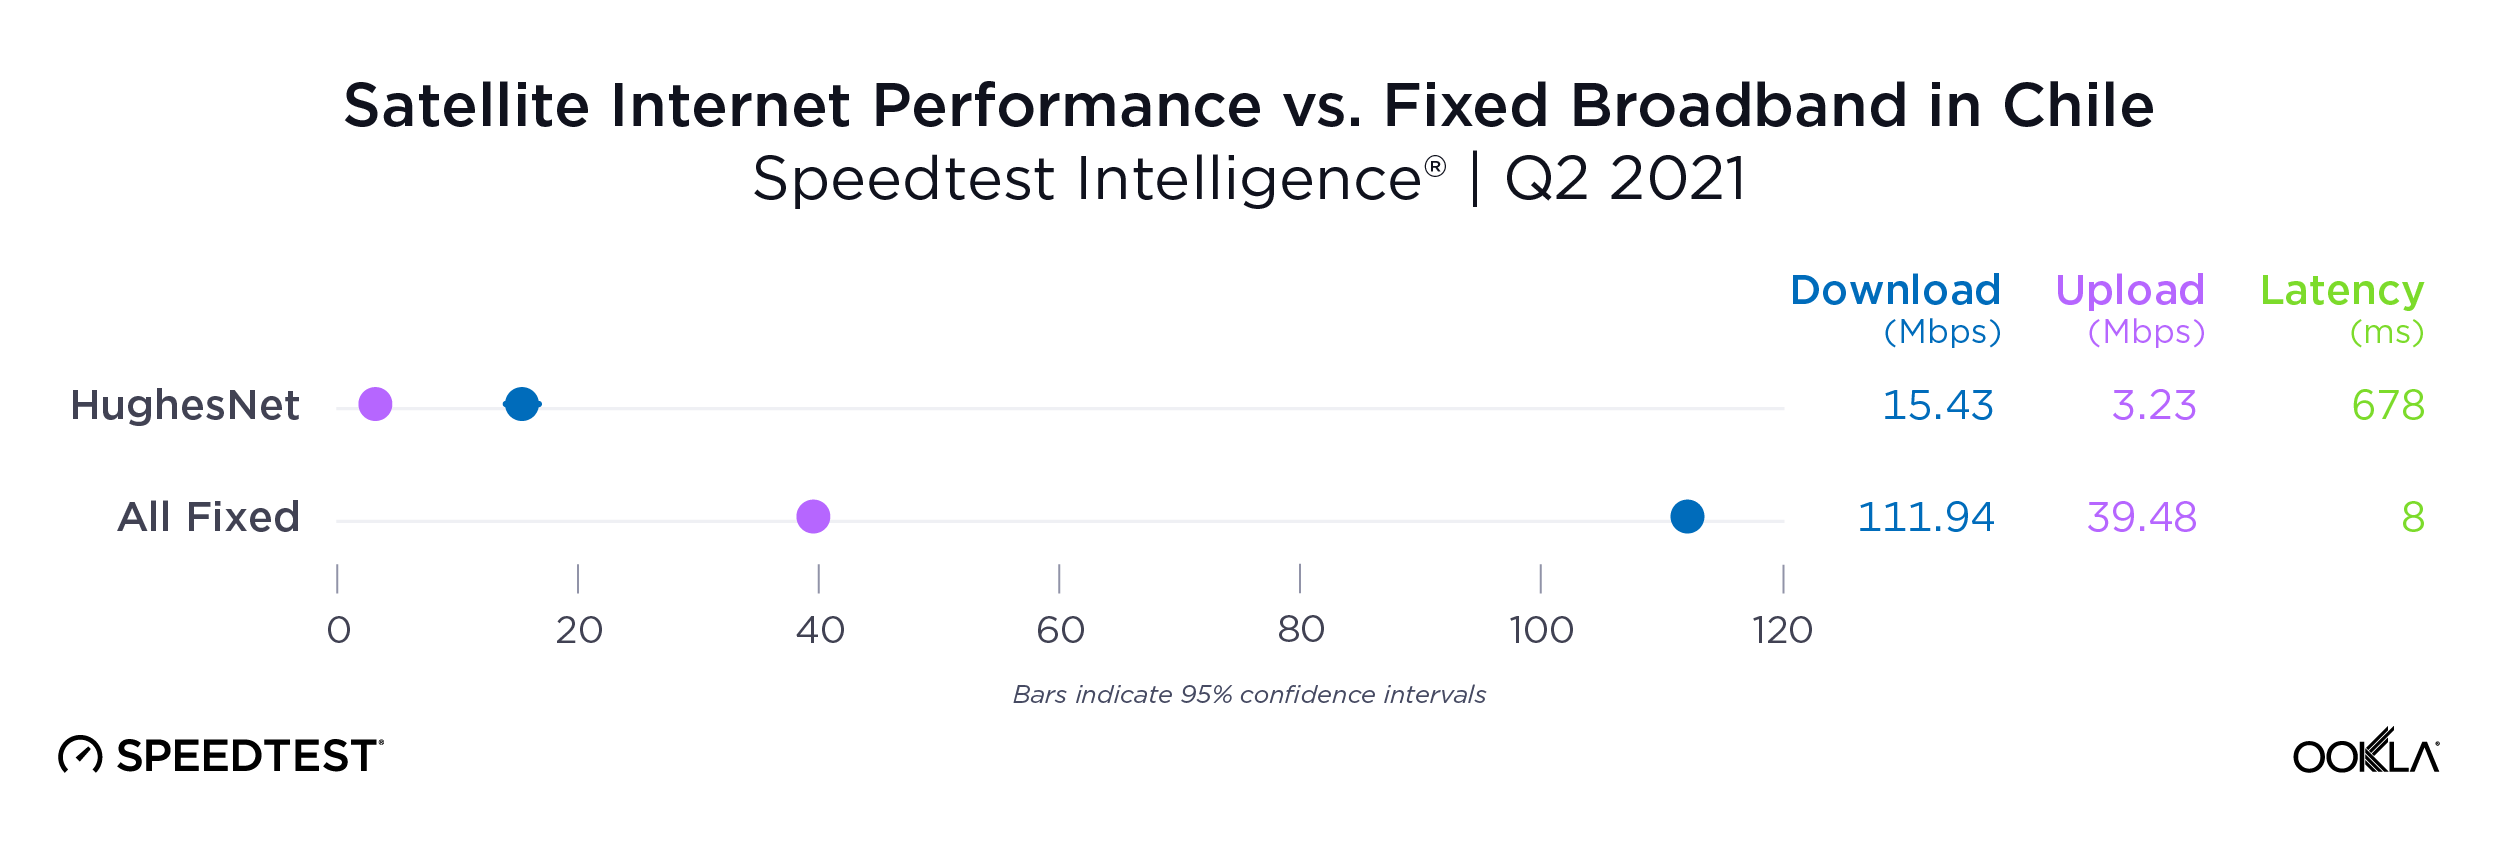
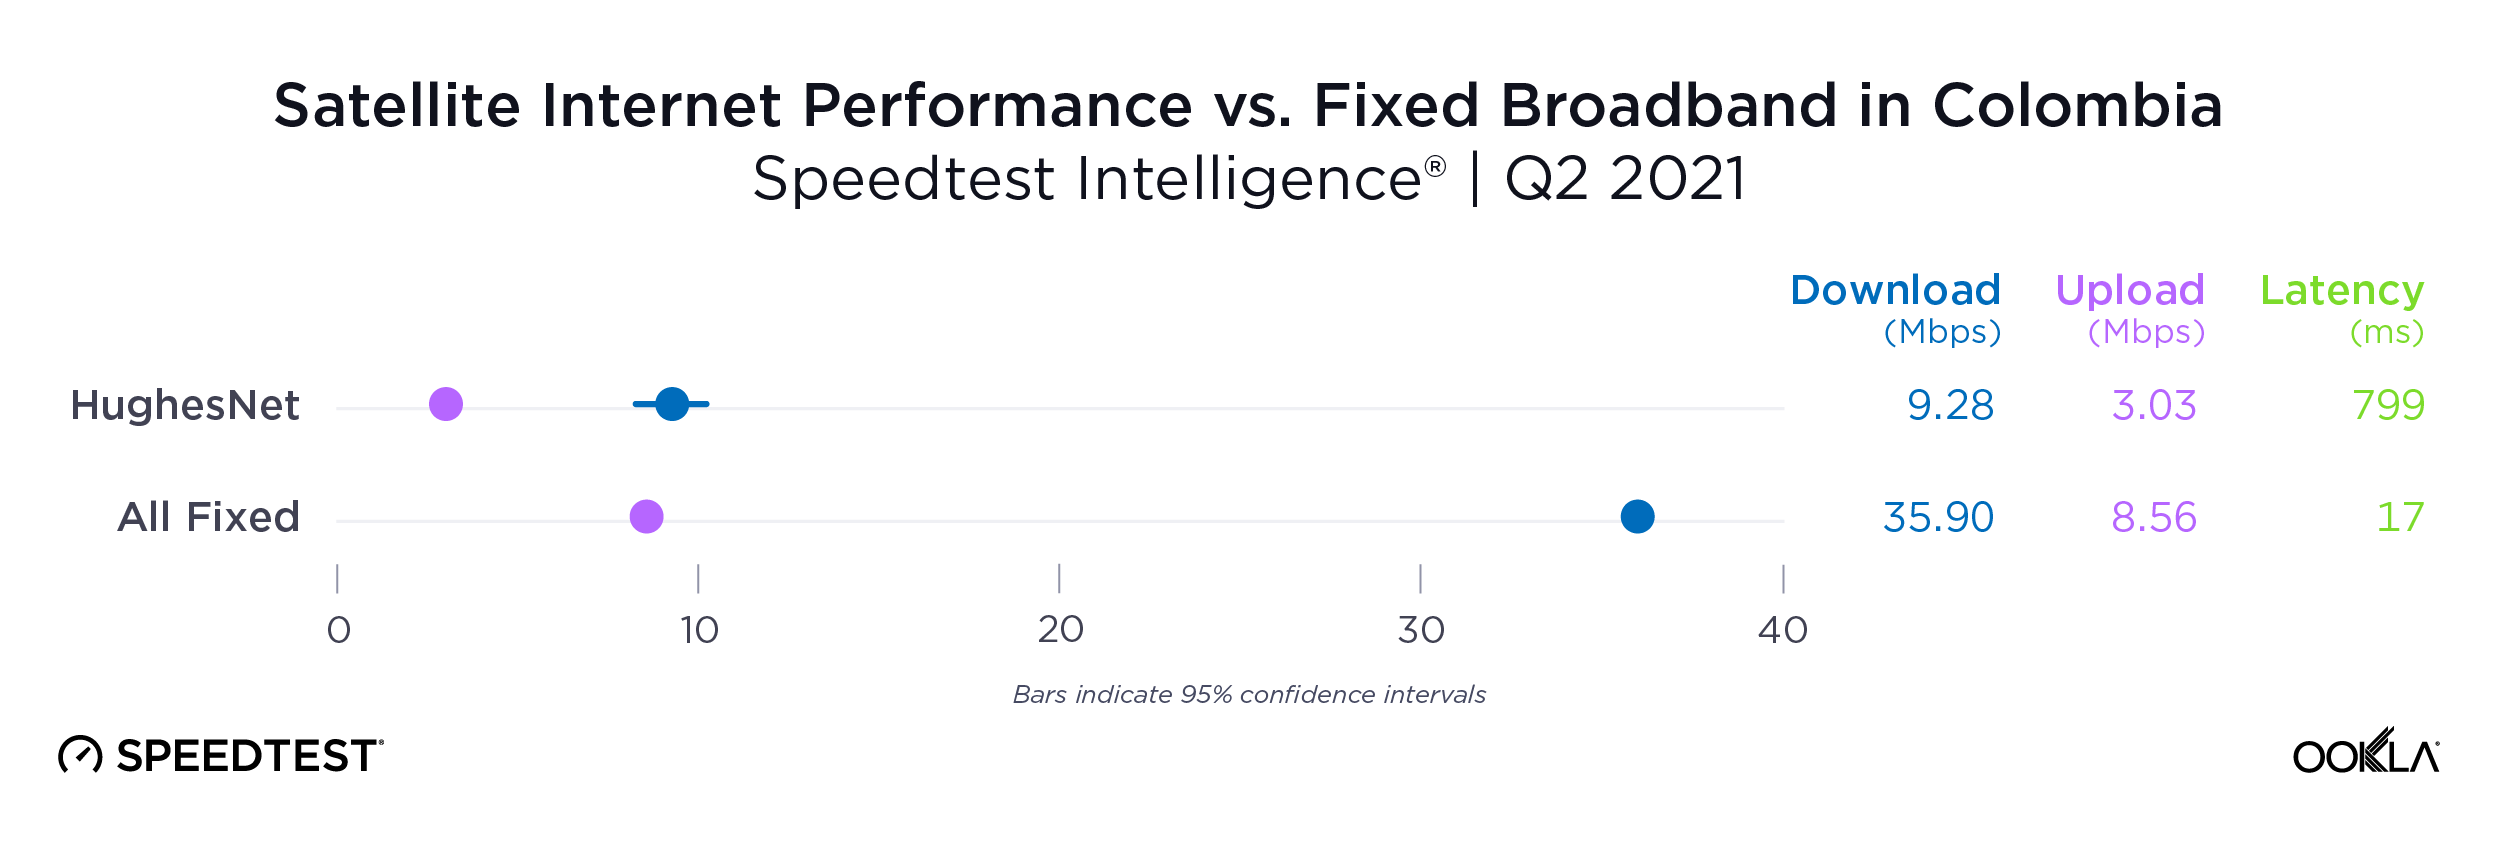
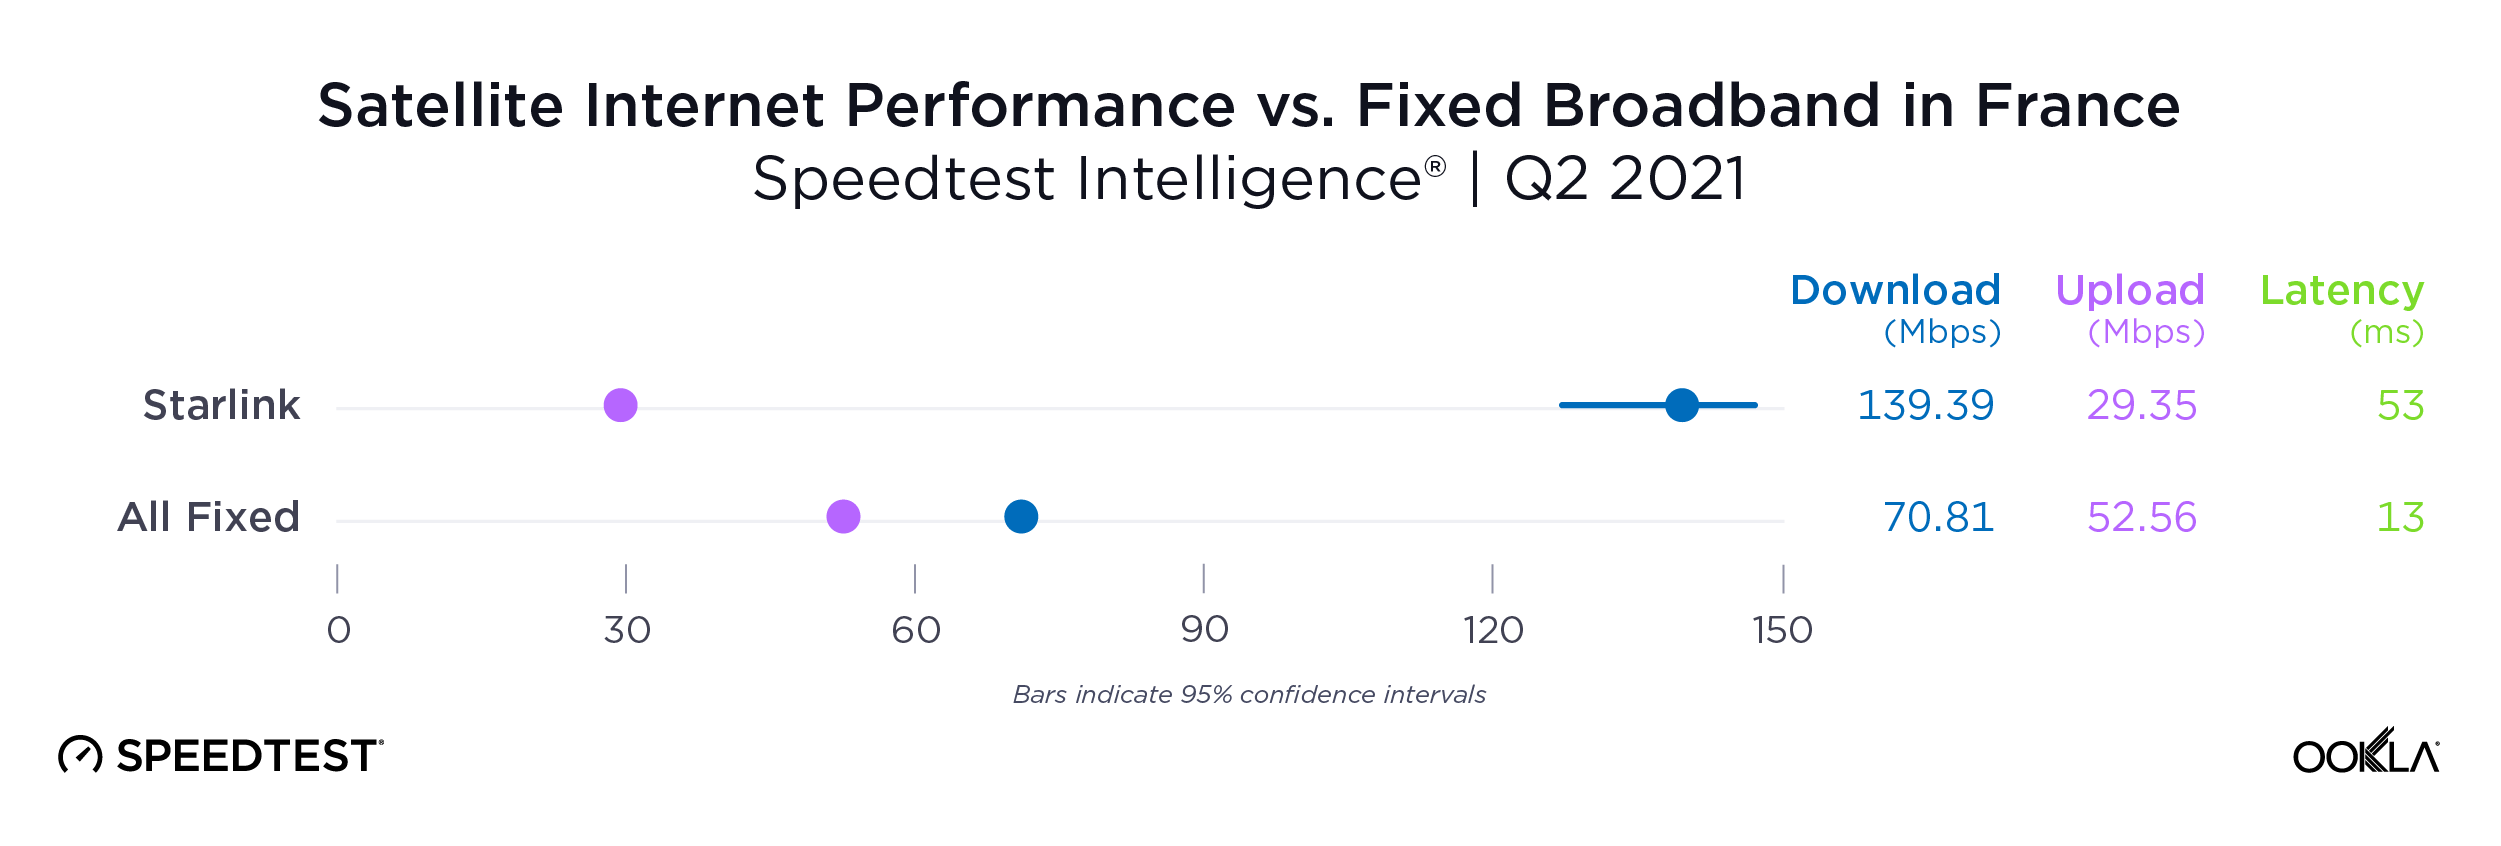
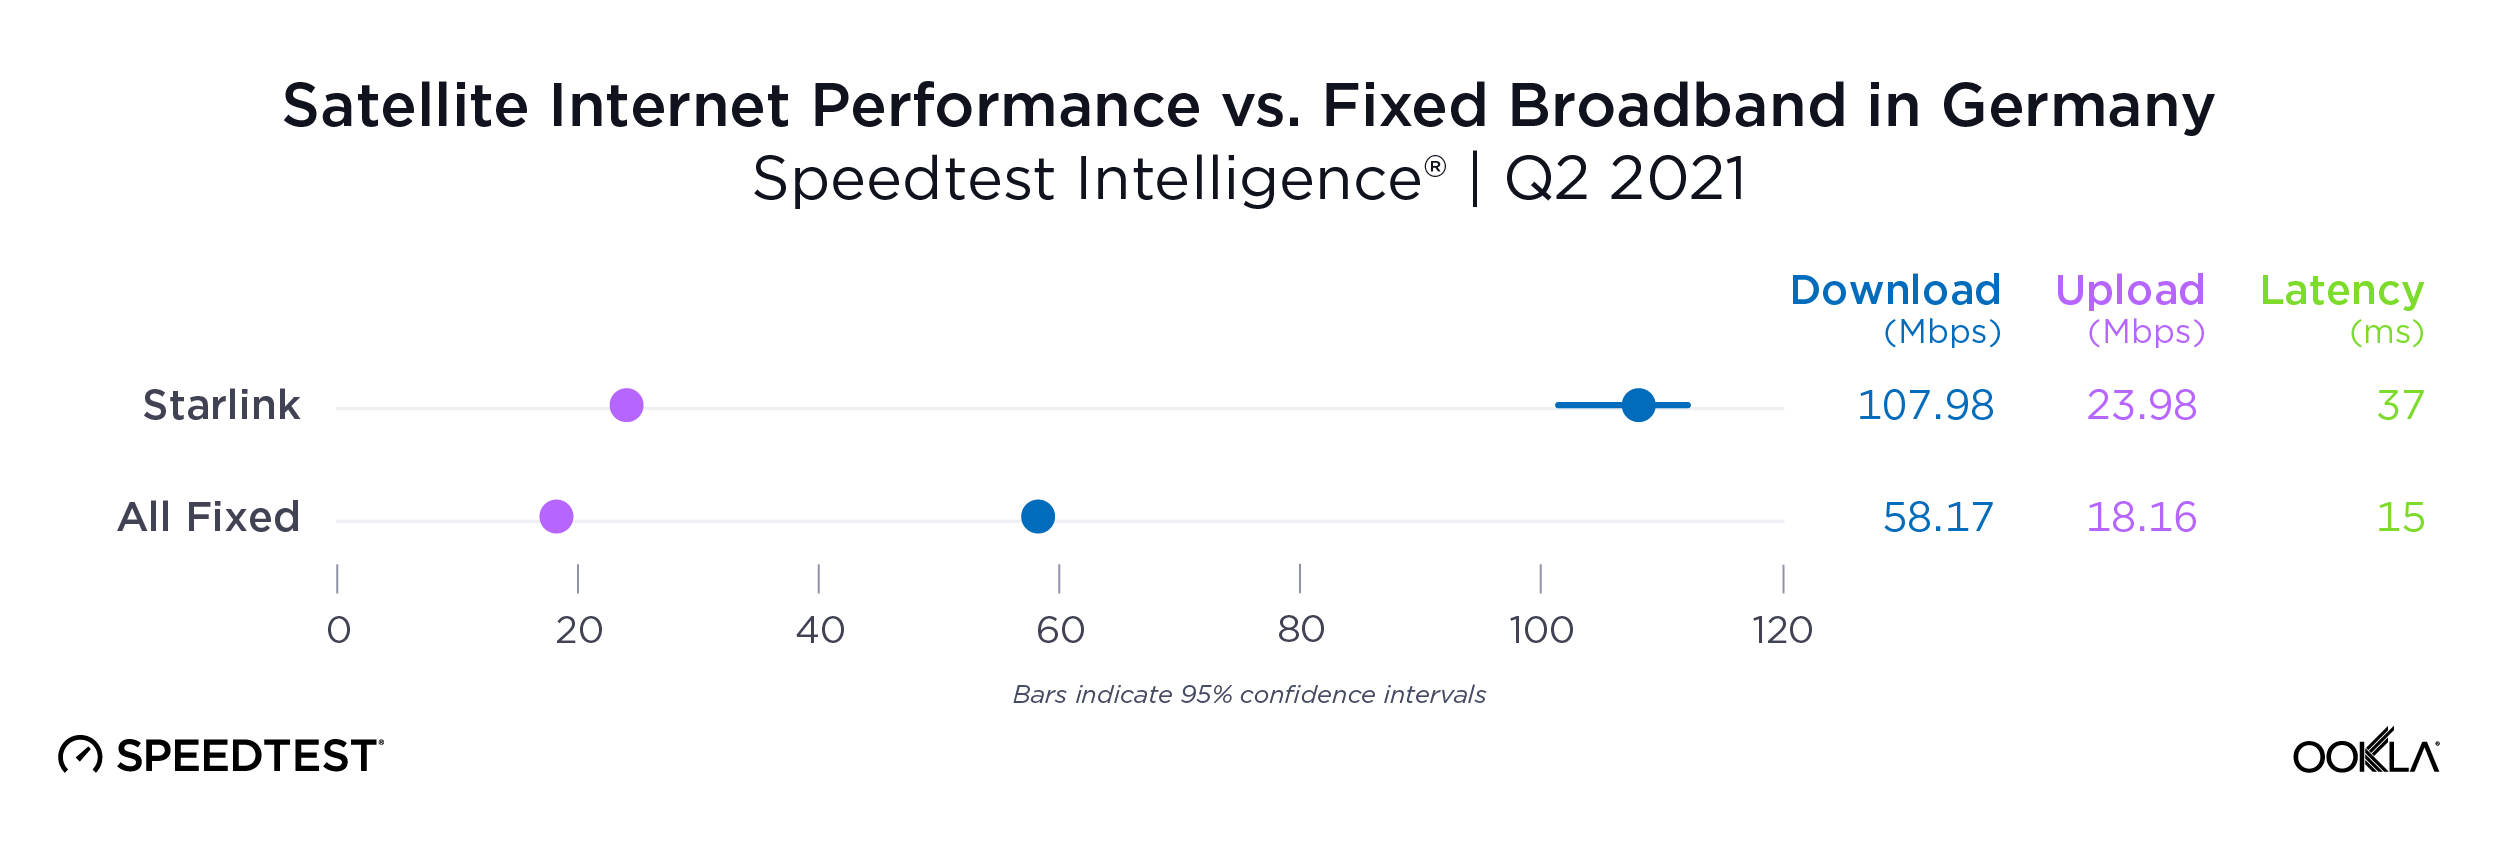
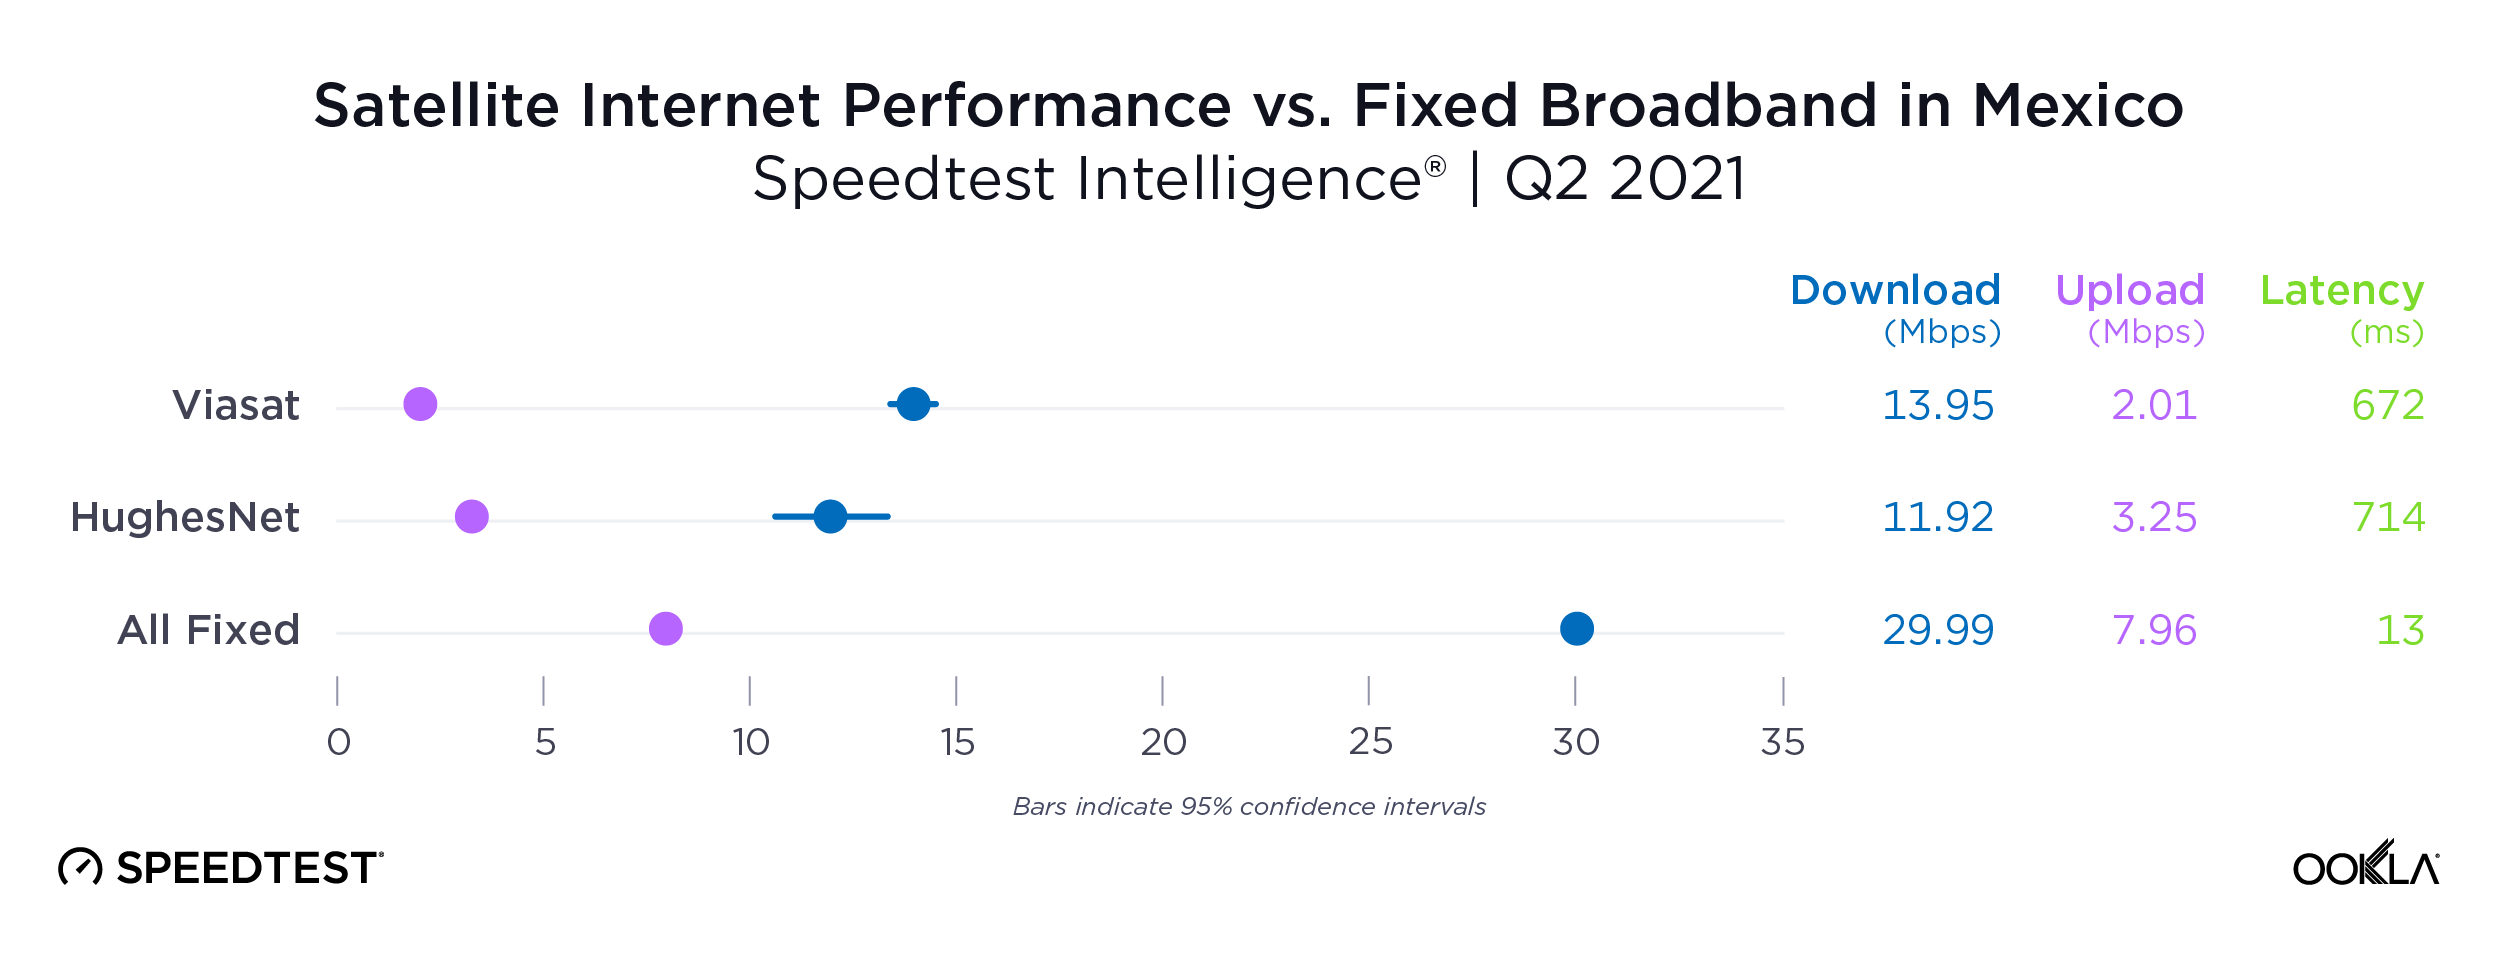
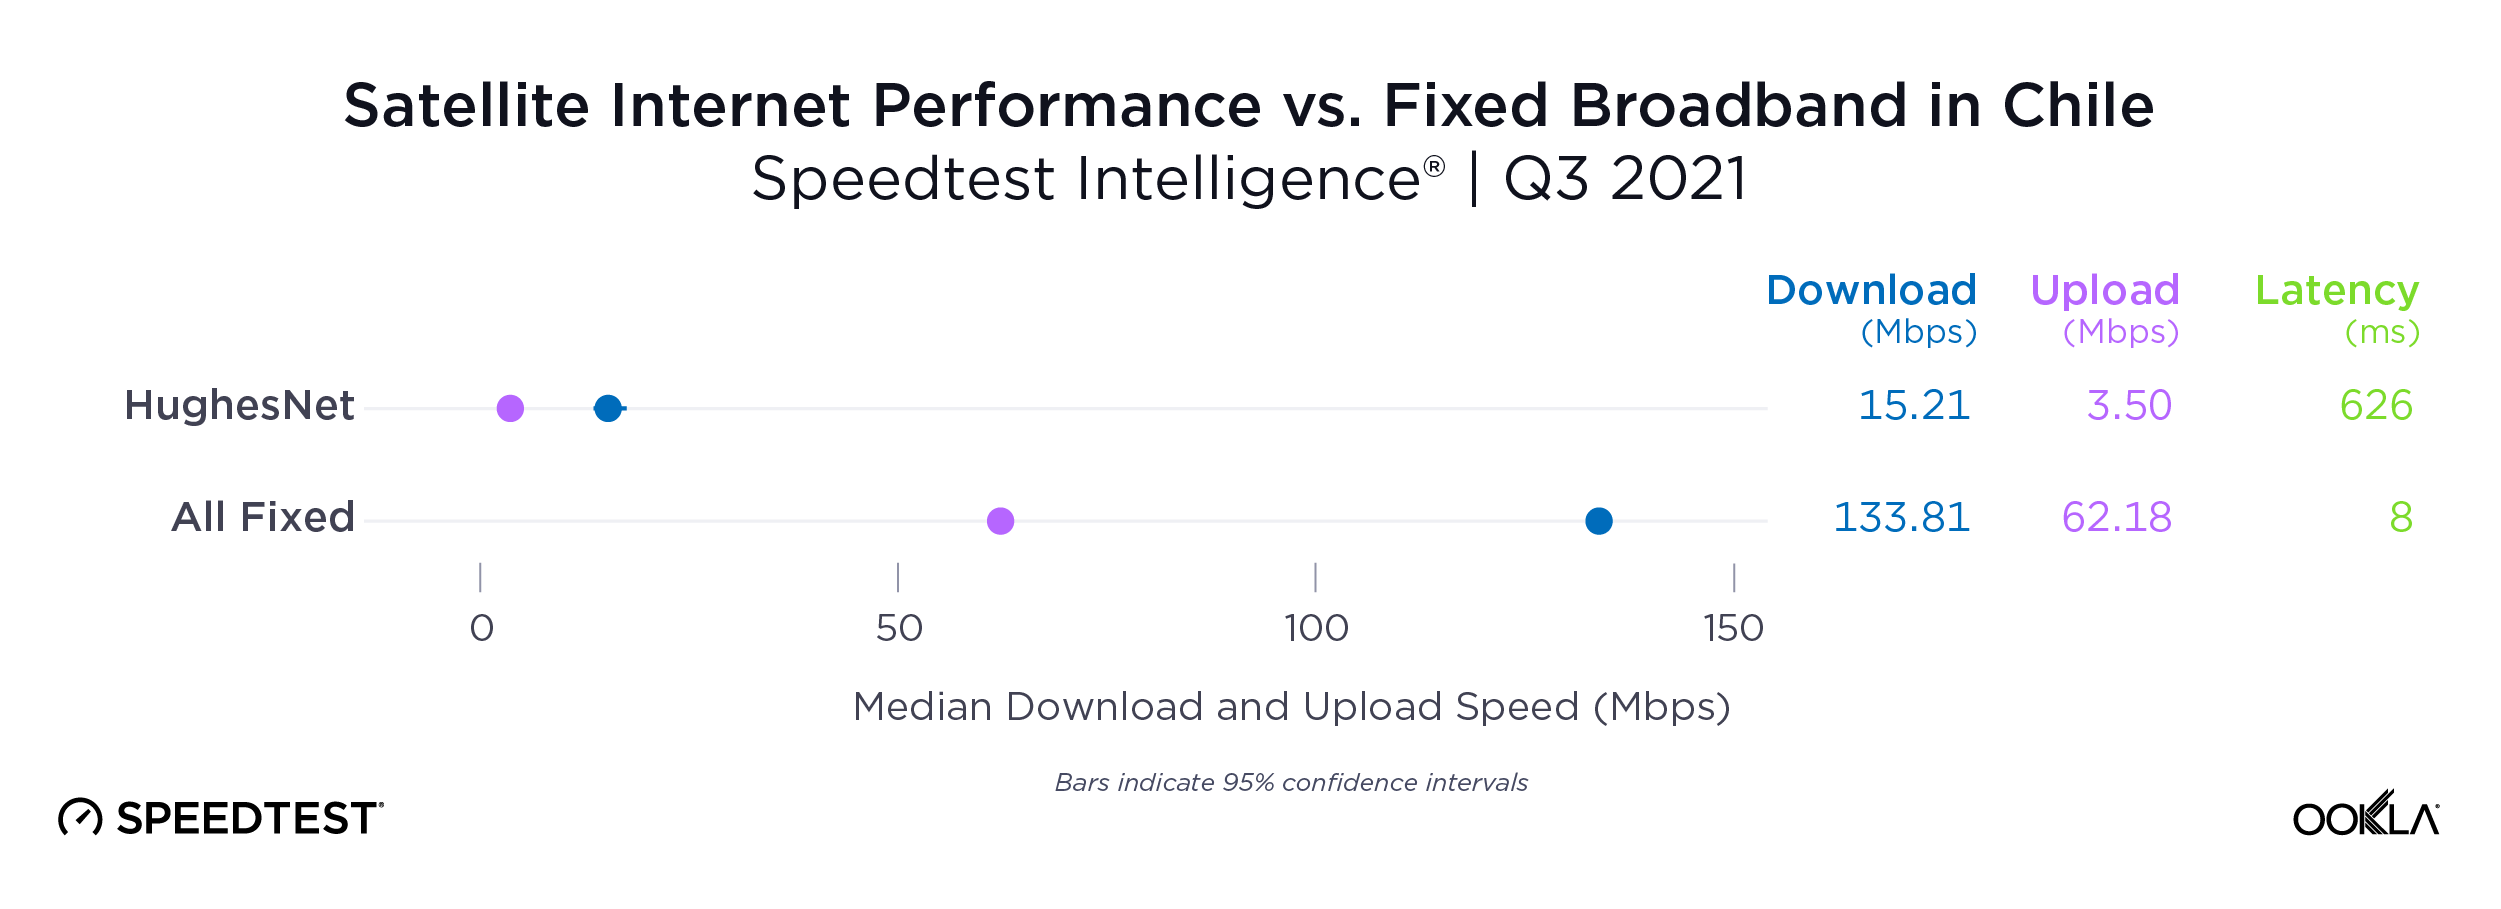
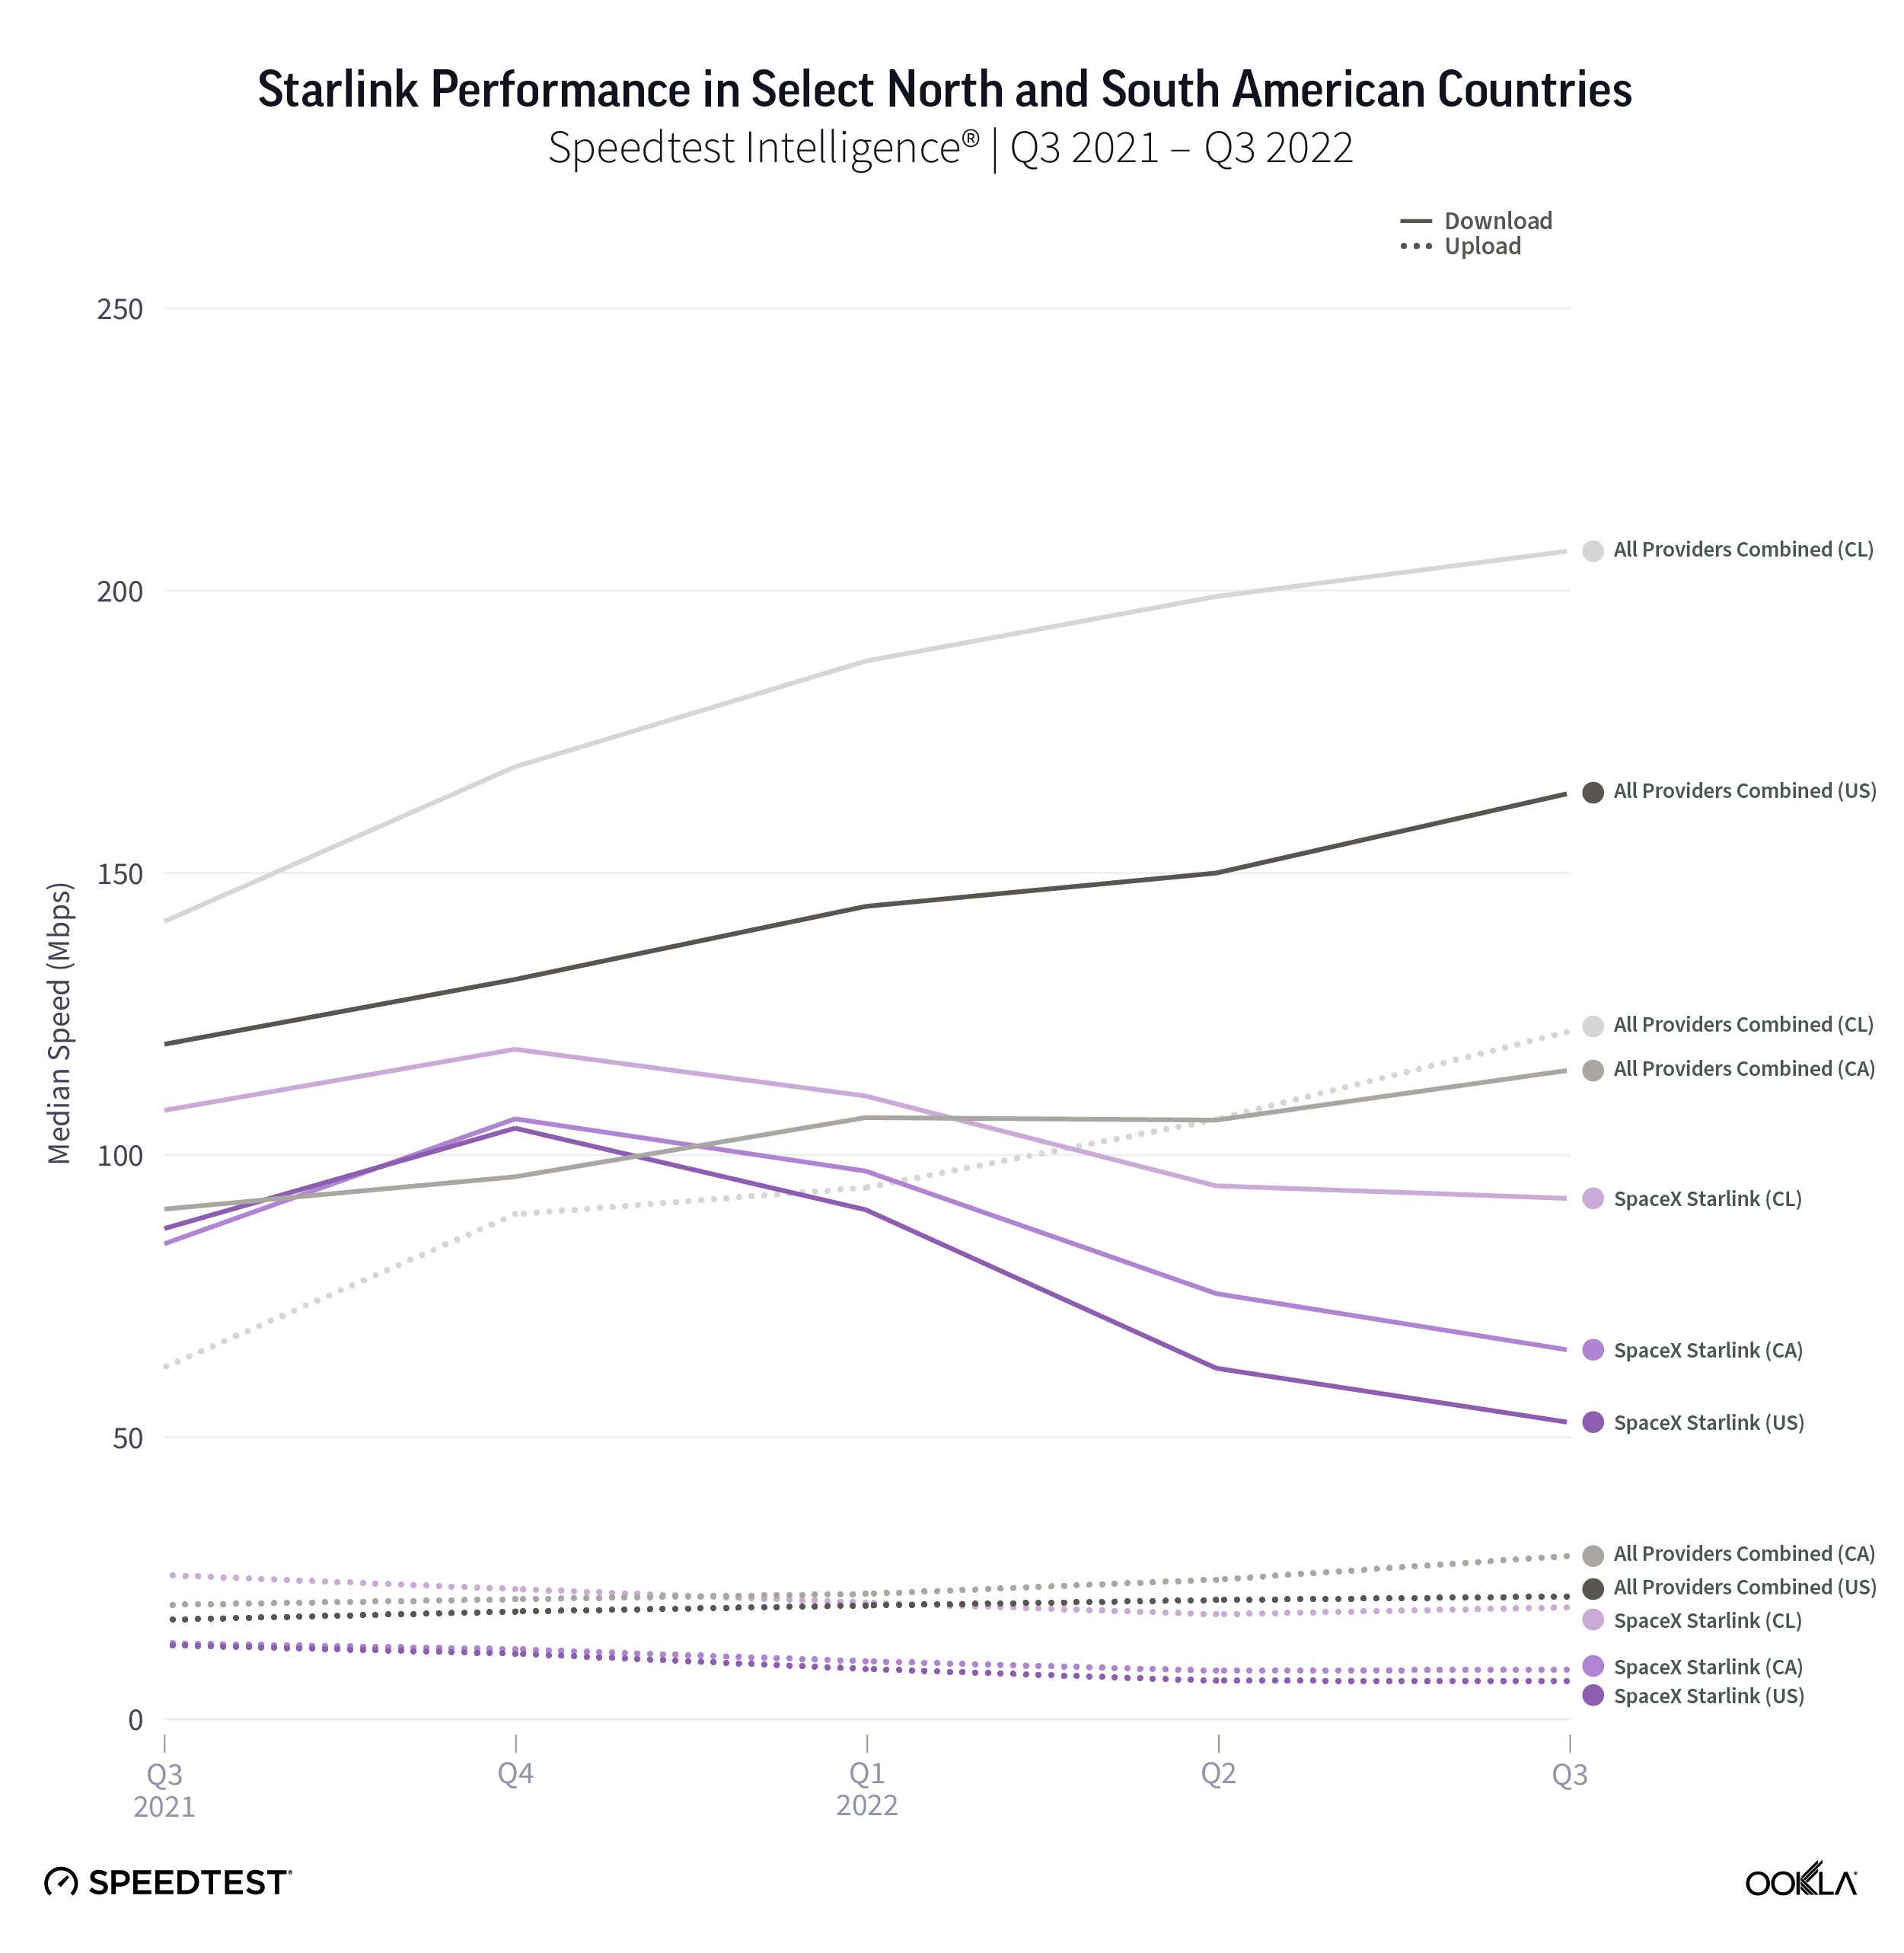
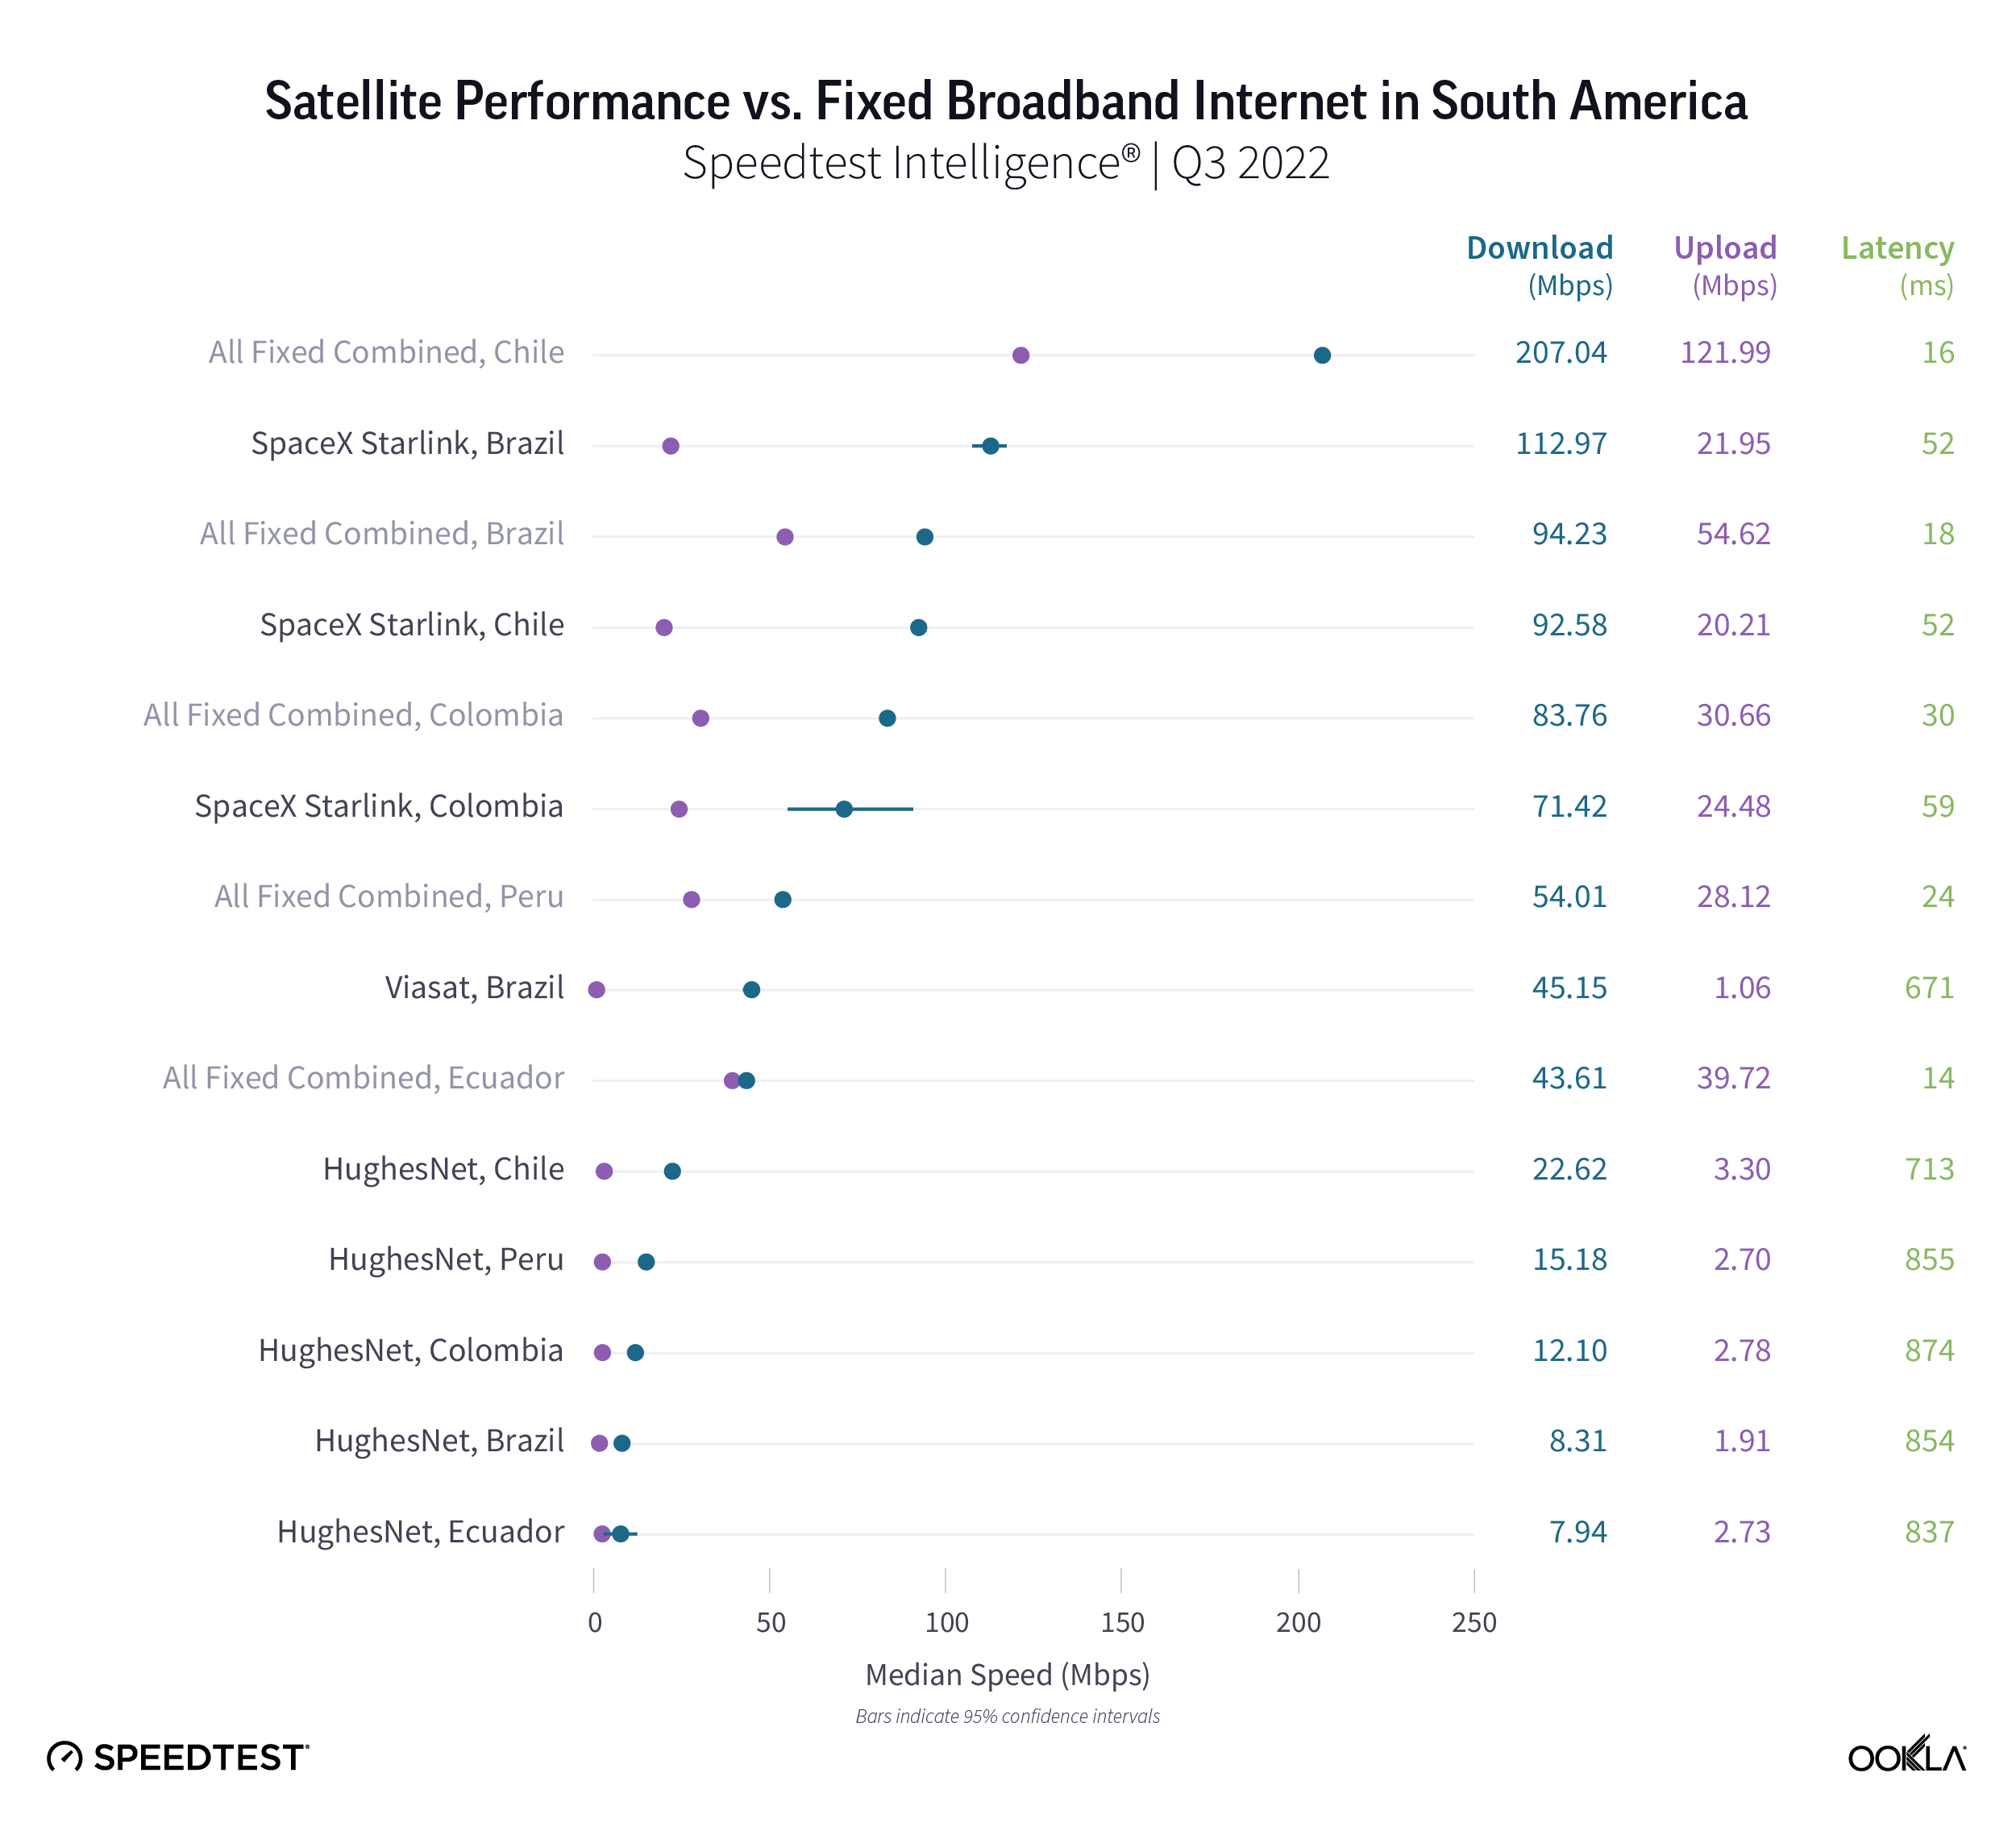
Telefonica also led the market in terms of fiber connections, with a market share of 45.7%, followed by Mundo with 25.0%, which in January 2023 announced that it had completed the migration of its customer base from HFC (hybrid fiber-coaxial cable) to fiber-to-the-home (FTTH). Other smaller ISPs are actively deploying fiber or looking for alternative solutions to boost their reach. Entel agreed to sell its fiber network to On*Net Fibra, a joint venture between KKR and Telefonica Chile to provide a neutral fiber network in Chile, in October 2022. This will allow Entel to continue provisioning new households over the larger OnNet network. We also see SpaceX’s Starlink active in the market, alongside Hughesnet, although satellite remains a very small but growing technology within the market.

chart of chile, fixed broadband connections market share by isp

Strong competition driving network investment

Strong competition in Chile’s fixed line market has helped drive network investment, with Chilean ISPs focused on expanding the number of homes passed and migrating to more advanced fiber access. The relatively late launch of 5G networks in the region has enabled operators to focus more heavily on fiber deployment, with a view to increasing fixed broadband adoption and also supporting 5G networks.  The first 5G networks in the market launched in December 2021.

While there is limited reported fixed-line financial data in the market, Telefonica Chile has reported capex historically. Its data shows strong early investment in the market, with capital intensity (capex as a share of revenues) well above 20% from 2015 onwards, peaking at 28.8% of revenues in 2018.

chart of telefonica chile, fixed capex and capital intensity

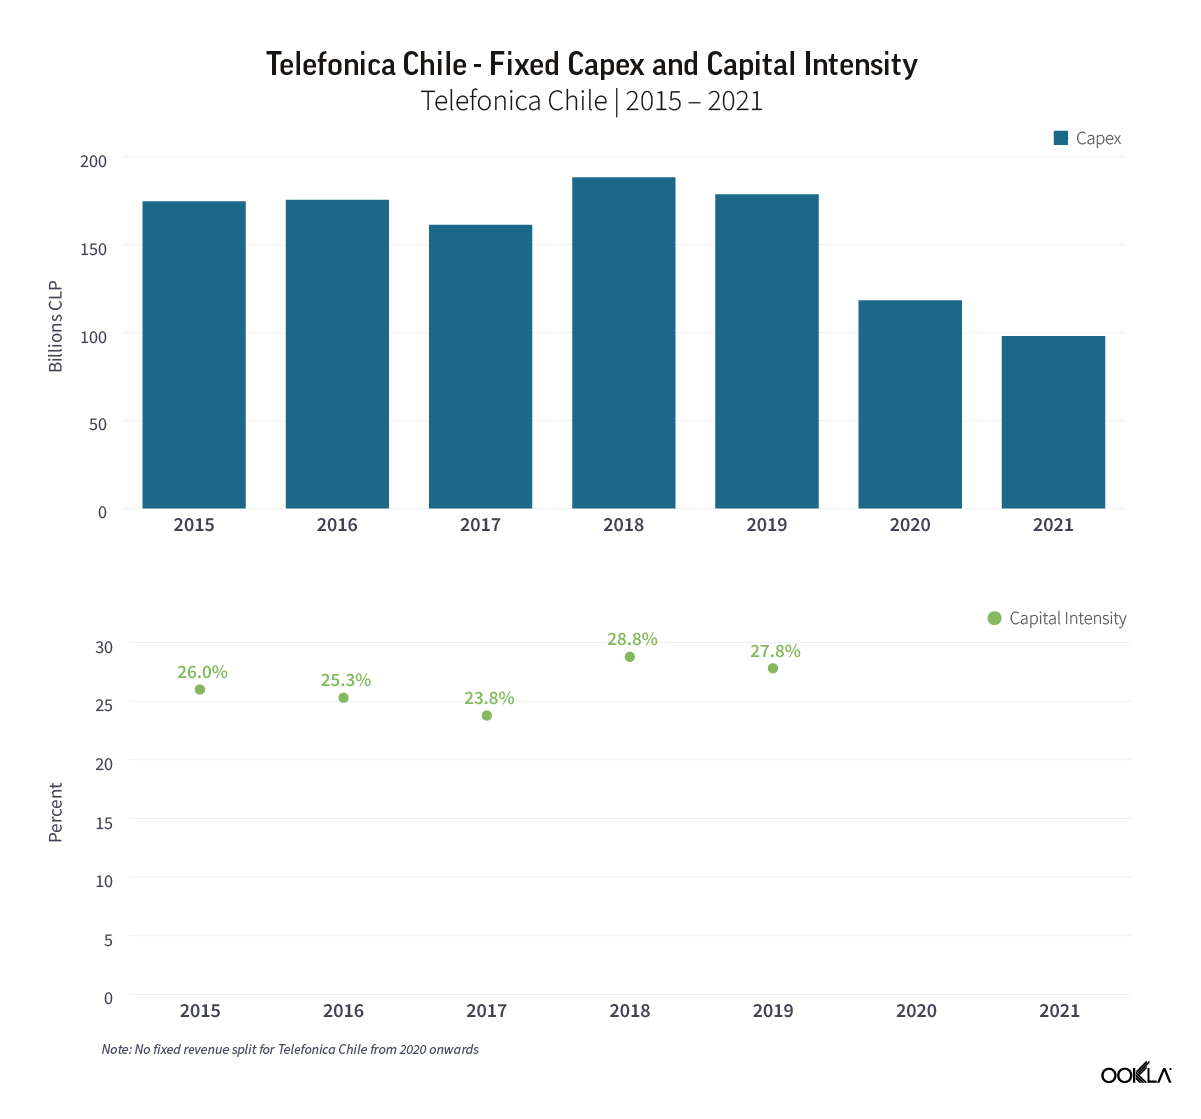
Telefonica Chile stopped reporting fixed revenues in 2020, however its fixed capex dipped significantly, highlighting the change in strategy from its parent group to deleverage its Latin American operation. This eventually led to KKR’s acquisition of a 60% share in InfraCom from Telefonica, creating On*Net Fibra, a neutral FTTH network joint-venture, which began offering wholesale services in July 2021. Rival ISP VTR confirms the overall trend of strong fixed-line investment in the country, reporting capital intensity in excess of 20% over the past three years. In addition, Mundo announced in early 2022 that it planned to invest $200 million expanding its fiber infrastructure in Chile, and the ISP is targeting 4.5 million homes passed, by the end of 2023.

Accelerating migration to fiber

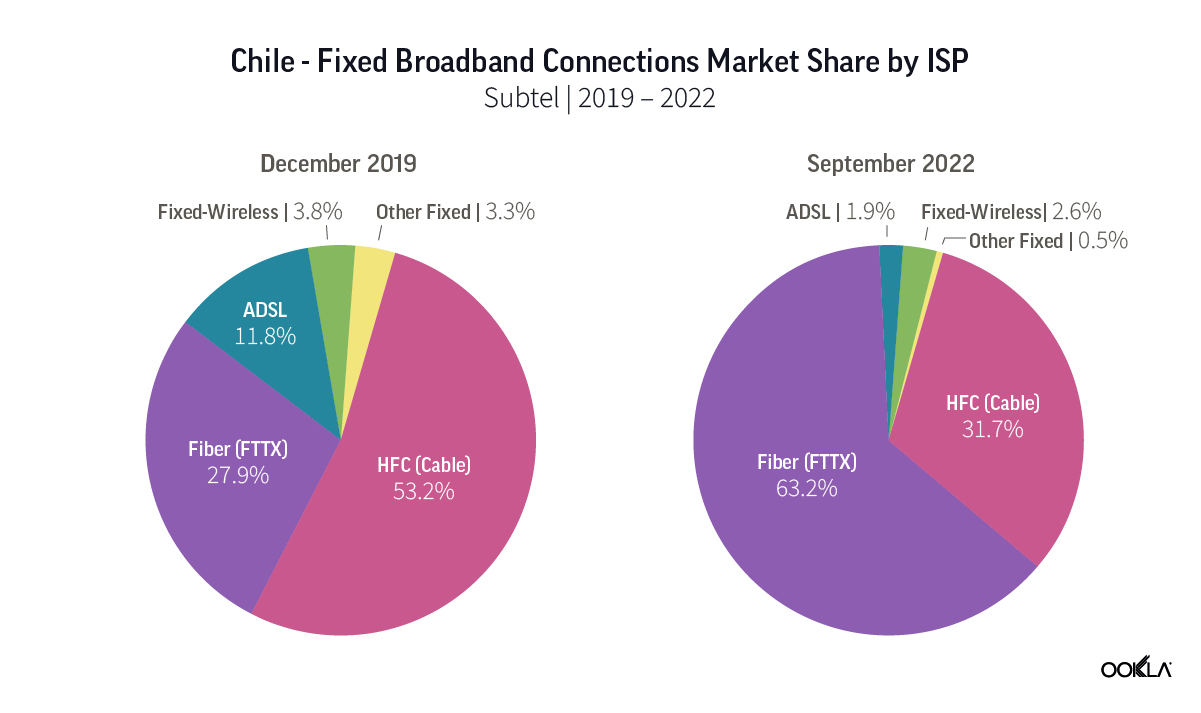
As of 2019, a majority of Chilean broadband connections were supported by hybrid fiber-coaxial (HFC) services, with fiber the second most frequently used technology, followed by ADSL. The transformation of the Chilean fixed broadband market since then has been rapid, with the latest data for September 2022 showing that fiber makes up the majority of broadband connections, with HFC’s share declining strongly, and ADSL’s share dropping below that of wireless broadband connections.

chart of chile, fixed broadband connections market share by isp

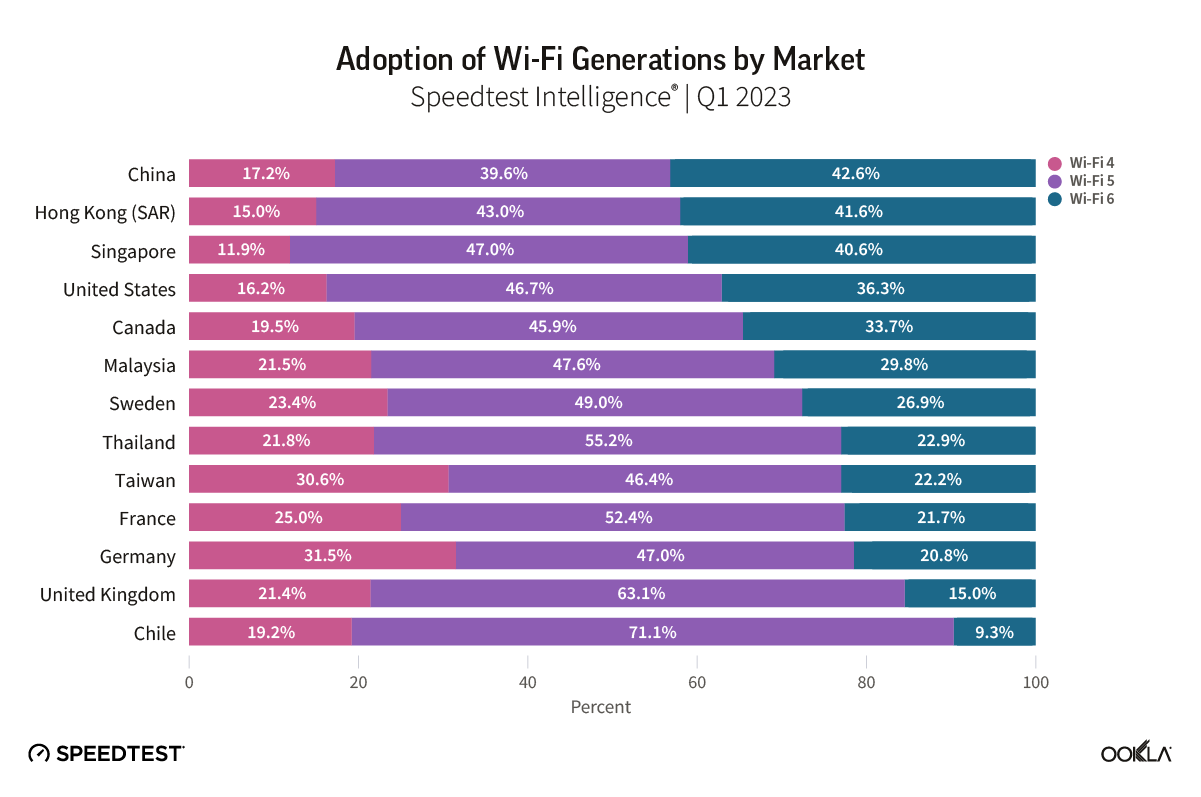
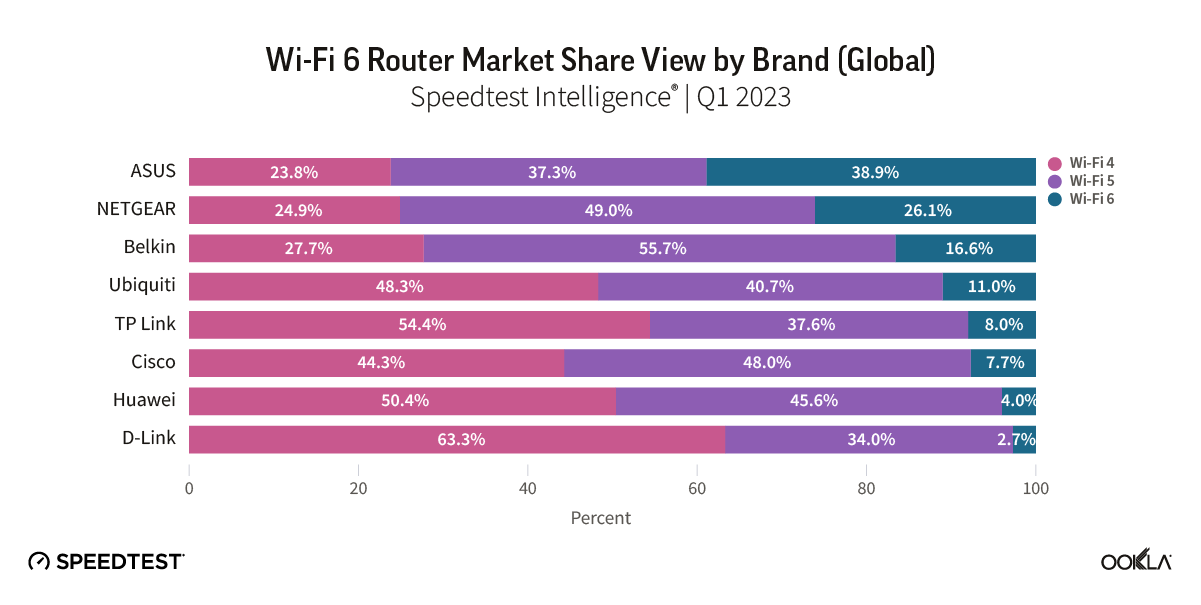
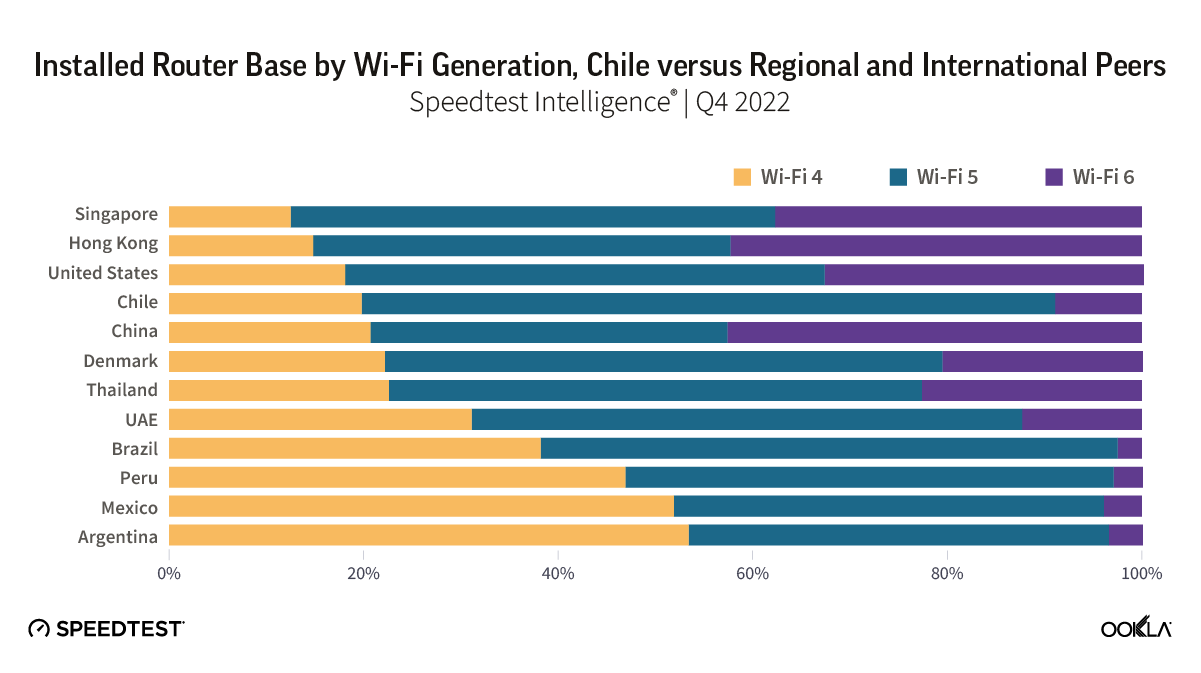
This rapid tech migration has also led to Chile being among the strongest adopters of Wi-Fi 5 and 6 in Latin America, which support faster speeds within business and in the home. In Q4 2022, 71.3% of Chile’s Speedtest samples utilized Wi-Fi 5, with less than 20% utilizing Wi-Fi 4. By contrast, Brazil had 38.2% of samples utilizing Wi-Fi 4, and Argentina 53.4%. Adoption of the newer Wi-Fi 6 routers is slower in Chile compared to international peers, standing at 8.5% as of Q4 2022, however it still leads within Latin America by a significant margin. Within Chile GTD led the pack with 33.5% of samples utilizing Wi-Fi 6 during Q4 2022, followed by WOM with 25.9%, Entel with 21.9% and Telefonica del Sur with 19.4%. By contrast, Claro, Movistar, Mundo and VTR all returned less than 10% in Wi-Fi 6 samples, indicating there is plenty of scope to increase median fixed-line performance yet further in the market. Our analysis of the median download speeds shows a strong correlation with adoption of Wi-Fi routers utilizing 5 GHz spectrum (WiFi 5 and above).

chart of installed router base by wi-fi generation, chile versus regional and international peers

Driving increased fixed broadband adoption

The growth in fixed broadband adoption in Chile was disrupted significantly by the COVID-19 pandemic, and resultant move towards remote working and more people staying at home. Connections growth increased from 5.5% in 2019, to 10.7% in 2020 and 12.8% in 2021, as the importance of home internet connectivity grew.

chart of chile growth in fixed broadband connections by residential and business users

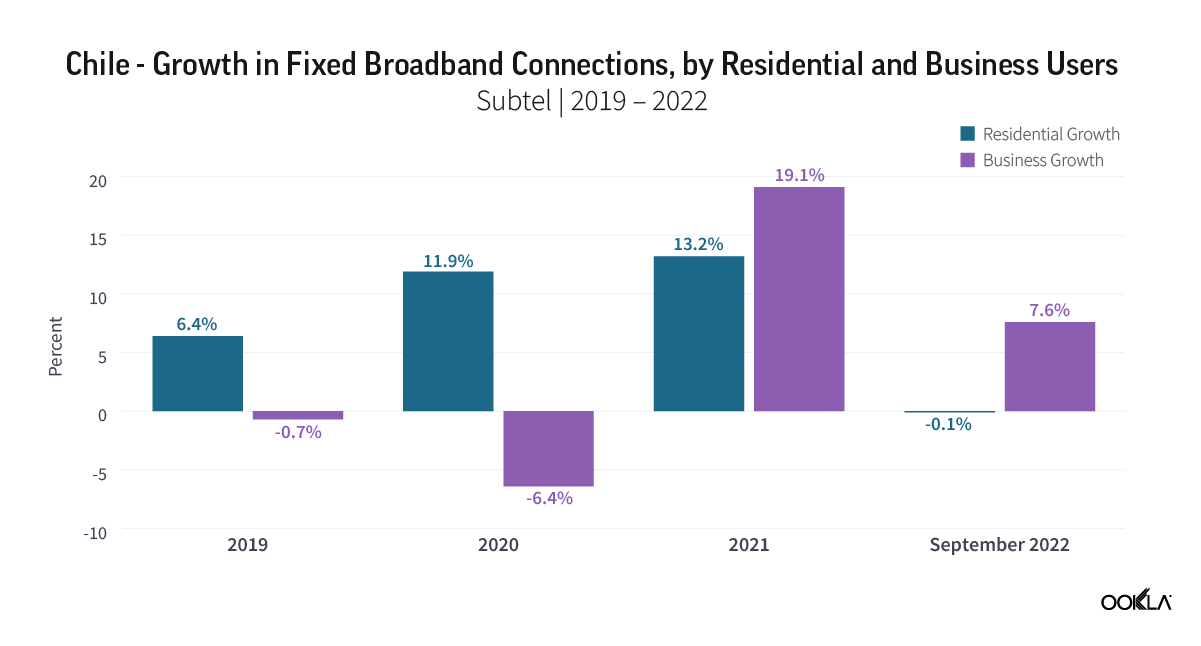
The initial acceleration in connection growth in 2020 was due to growth in residential fixed broadband adoption, with connections increasing by 13% in 2020 and 12% in 2021. Business fixed broadband connections declined in 2020 as the economy contracted, but rebounded strongly in 2021 on the back of government economic stimuli, increasing 19%, and a further 8% in the first three quarters of 2022, demonstrating the important role of broadband in supporting economic growth in the market.

Chile’s economy is forecast to contract in 2023, as inflation continues to impact the market, and fiscal stimuli following the COVID-19 pandemic are unwound. However, the Chilean Central Bank forecasts that the market will rebound in 2024, with growth ranging from 2.25% – 3.25%. A key component of Chile’s future growth will be the ability of businesses to secure fast and reliable internet connections. From an infrastructure point of view, Chile is very well served in this regard, with a very dynamic fixed infrastructure market, as demonstrated by its operators continuing to push on fiber rollout, the emergence of a neutral fiber network with broad coverage, and even the increasing role of satellite connectivity in the market. Such is the success of its Chilean operation, that Telefonica is using the market as a blueprint for its other operations across Latin America. We’ll continue to monitor the rapid progress of Chile’s fixed broadband market as it continues to vie with other leading markets internationally at the top of Ookla’s Global Index. To find out more about Speedtest Intelligence, please get in touch.

Ookla retains ownership of this article including all of the intellectual property rights, data, content graphs and analysis. This article may not be quoted, reproduced, distributed or published for any commercial purpose without prior consent. Members of the press and others using the findings in this article for non-commercial purposes are welcome to publicly share and link to report information with attribution to Ookla.

| May 17, 2023

ISPs Need to Do More to Improve Wi-Fi Performance in the Home

Key messages

  • Wi-Fi woes continue. Ookla® Speedtest Intelligence® data shows Wi-Fi performance continues to lag behind ethernet performance within home networks in many advanced fixed broadband markets, with Wi-Fi speeds typically ranging from between 30-40% of ethernet speeds during Q1 2023.
  • Developed Asian and North American markets lead the charge to Wi-Fi 6/6E. Wi-Fi 4 and 5 remain the dominant Wi-Fi access technologies globally, accounting for a combined 89% of Speedtest® samples during Q1 2023. However, a number of advanced fixed broadband markets are rapidly migrating to Wi-Fi 6 and 6E, with China, Hong Kong (SAR), Singapore, Canada, and the U.S. leading the charge.
  • Growing Wi-Fi 6/6E adoption helps narrow the gap in Wi-Fi performance. In markets such as Canada, France, Germany, Singapore, Sweden, and the U.S., where the transition to fiber is more advanced, and where ISPs are actively driving adoption of Wi-Fi 6/6E routers, we see Wi-Fi performance closing the gap to ethernet. However, more needs to be done in other markets, where migration to more advanced fixed access networks is exposing the limitations of the installed base of Wi-Fi routers.
  • Router vendors pushing the envelope with Wi-Fi 7 capable launches. ASUS leads the market for Wi-Fi 6/6E routers among Speedtest samples, and both ASUS and other leading router vendors have been quick to launch Wi-Fi 7 capable routers. Despite this, Wi-Fi 6 and 6E remain the growing component of their installed bases. ASUS leads the market according to Speedtest Intelligence with 39% of its routers we sampled supporting Wi-Fi 6/6E during Q1 2023, well ahead of second placed NETGEAR with 26%.
  • Smartphone device support indicates Wi-Fi 6/6E should remain the immediate focus for ISPs. With the two largest smartphone vendors globally, Samsung and Apple, currently shunning Wi-Fi 7, ISPs waiting to see if they can leapfrog Wi-Fi 6E to Wi-Fi 7 should stay their hands. The fact that China still needs to allocate the 6 GHz spectrum band — key for Wi-Fi 6E and 7 — for unlicensed use is also significant, and appears to have weighed on the Wi-Fi 6E adoption among China’s leading Android smartphone manufacturers.

Wi-Fi performance continues to lag ethernet within the home

ISPs in advanced fixed broadband markets are increasingly looking to offer more advanced Wi-Fi routers and solutions such as mesh networks, which are designed to improve Wi-Fi coverage and performance. However, Speedtest Intelligence data shows that more needs to be done to improve Wi-Fi performance, which typically ranged from between 30-40% of ethernet speeds. Median Wi-Fi performance as measured by Speedtest will tend to lag behind median ethernet performance, depending on distance of the end-user device from the router, including any obstacles and signal interference the Wi-Fi signal needs to traverse to reach the device.

Chart of Ratio of Wi-Fi to Ethernet Performance

Our analysis of Speedtest Intelligence data reveals that driving greater adoption of more advanced Wi-Fi routers can help ISPs narrow the gap between Wi-Fi and ethernet performance, with ISPs in Canada, France, Germany, Singapore, Sweden, and the U.S. already successfully doing so over the past year.

Chart of Closing the Gap on Wi-Fi Performance

Despite this, the results are not always positive, with the gap between Wi-Fi and ethernet performance widening, in particular in the U.K. and Taiwan. Where markets are rapidly migrating from more legacy fixed broadband technology to advanced cable and fiber connections, Wi-Fi performance can lag relative to ethernet, indicating a need to accelerate the adoption of more advanced Wi-Fi technologies.

Older generations of Wi-Fi 4 and Wi-Fi 5 remain dominant globally

While much of the focus of the device ecosystem is on spurring adoption of the latest Wi-Fi standards, there is a long way to go before even Wi-Fi 6 becomes a dominant standard globally. Based on Speedtest Intelligence data, the proportion of Wi-Fi tests by generation (a good proxy for adoption) shows that Wi-Fi 4 and Wi-Fi 5 remain the dominant router technology, with Wi-Fi 6 representing just under 10% as of February 2023, and Wi-Fi 7 showing very few samples. The share of samples from Wi-Fi 4 routers has fallen by 6 ppts year-over-year, while Wi-Fi 5’s share of samples has marginally increased.

Chart of Share of wi-Fi Samples by Generation

Asian and North American ISPs lead the charge to Wi-Fi 6 and beyond

ISPs are the main driver behind the adoption of new Wi-Fi standards, as highlighted by a 2022 study by Parks Associates, which found that 52% of U.S. consumers acquired their router from their ISP. Rolling out more advanced routers to their customer bases enables them to take advantage of the increased performance of newer generations of Wi-Fi technology, and helps to ensure ISPs deliver faster speeds, particularly over fiber access networks.

Adoption of Wi-Fi 6 varies by market, even among the most developed fixed broadband markets globally. ISPs in a number of advanced fixed markets have already begun offering Wi-Fi 6E routers to their customer bases, with ISPs in North America in particular moving in this direction, including Bell Canada, Rogers, Telus, Verizon, XFINITY, Charter, and Frontier, as well as leading ISPs in advanced Asian and European markets.

Markets in Asia led the way on Wi-Fi 6 adoption, with China and Hong Kong both recording 42% adoption, followed by Singapore with 37%. Outside of Asia, North America showed the next highest level of adoption, with the U.S. and Canada recording 32% and 30%, respectively. European fixed markets lagged behind, with adoption ranging from 13% in the U.K., to 24% in Sweden. For markets such as Chile, which placed towards the top of the Ookla Speedtest Global Index™ for median fixed broadband speeds, a relatively low-level of Wi-Fi 6 adoption (8% in Q4 2022) signals further opportunity for ISPs in the market to boost performance.

Chart of Adoption of Wi-Fi Generations by Market

The fastest growing markets, in terms of increasing share of Wi-Fi 6 of Speedtest samples year-over-year in Q1 2023, were Canada and Malaysia (+15 ppts), Singapore (+14 ppts), and Hong Kong (+12 ppts). While there was considerable variance between ISPs within each market, leading ISPs such as SmarTone (Hong Kong), DiGi (Malaysia), and ViewQwest (Singapore), are prompting a competitive response so that even ISPs with lower levels of Wi-Fi 6 adoption are prioritizing the technology and seeing adoption grow steadily.

CountryISPWi-Fi 6 %, Q1 2023
Hong Kong (SAR)SmarTone62.4%
CanadaBell pure fibre57.3%
SingaporeViewQwest53.7%
SingaporeMyRepublic50.3%
MalaysiaDigi50.2%
MalaysiaMaxis49.0%
Hong Kong (SAR)NETVIGATOR44.2%
CanadaRogers43.4%
SingaporeM141.7%
SingaporeSingTel41.4%
CanadaTelus PureFibre41.0%
Hong Kong (SAR)HKBN41.0%
CanadaShaw39.0%
SingaporeStarHub35.6%
Hong Kong (SAR)HGC30.0%
MalaysiaTIME28.8%
MalaysiaTM21.5%

In addition to providing newer routers, ISPs are increasingly positioned to help consumers solve Wi-Fi performance issues in the home, such as offering mesh Wi-Fi solutions. For some ISPs, this has even taken precedence over offering newer Wi-Fi 6E routers, as they look to improved coverage within the home as a faster route to improving Wi-Fi performance. 

In the U.K., BT has prioritized whole-home coverage over Wi-Fi 6E with its BT Complete Wi-Fi (mesh) offer, despite the U.K. regulator Ofcom having released the lower portion of the 6 GHz band for unlicensed use in 2020. In Canada, Telus, while having recently released a Wi-Fi 6E router for its broadband users, also offers its WiFi Plus package, which includes professional installation and “wall-to-wall coverage” throughout the home. Rogers also offers guaranteed Wi-Fi coverage throughout the home, as well as Wi-Fi 6E routers. Plume offers a subscription-based service, HomePass, across a number of markets, which allows users to add additional access points to help eradicate not-spots or poor Wi-Fi signal within the home and also offers solutions for ISPs looking to improve their Wi-Fi offerings. In Hong Kong, China Mobile Hong Kong (CMHK) was the first ISP in the market to offer a fiber-to-the-room service, while it and other ISPs such as NETVIGATOR offer consumers the option to subscribe to multiple channels over fiber with separate IP addresses, allowing them to divide their activities across channels and thereby help avoid congestion.

To capture the full performance benefits of Wi-Fi 6E and Wi-Fi 7, countries must allocate 6 GHz spectrum for unlicensed use, therefore allowing Wi-Fi devices to access this higher frequency, higher capacity spectrum, and utilize wider channels. At present, according to the Wi-Fi Alliance, allocation of the lower portion of the 6 GHz spectrum band (5,925 MHz to 6,425 MHz) is common among developed economies, with some notable exceptions in some developed markets in Asia and Asia Pacific, in particular China, while allocation of the full 6 GHz band is more limited, available across North America and some Latin American markets, as well as Saudi Arabia and South Korea.

Wi-Fi 7 on the horizon as router vendors continue to push the envelope on performance

Wi-Fi performance continues to scale, and with Wi-Fi 7 routers and smartphones having launched in the second half of 2022, that trend is set to continue. In addition to higher throughput, successive Wi-Fi generations also support lower latency, helping to better support higher quality video streaming, cloud gaming, and future use cases linked to concepts such as the Metaverse and other uses of extended reality (XR).

The major silicon vendors, Broadcom, Qualcomm, and Mediatek, were quick to update their solutions to support the emerging Wi-Fi 7 standard, and hardware vendors have followed suit. Chinese vendor H3C was the first to launch with its H3C Magic BE18000 Wi-Fi 7 router in July 2022, and it has since been followed by other major vendors including tp-link, ASUS, and more recently NETGEAR. However, the prices of early Wi-Fi 7 routers that take advantage of Wi-Fi 7’s range of enhanced performance capabilities will be a barrier to entry for many, with tp-link’s flagship Archer BE900 currently retailing at a cost of $699.99. 

Speedtest Intelligence data shows minimal Wi-Fi 7 adoption as of March 2023, however we are likely to see the same vendors drive Wi-Fi 7 adoption that are currently leading on Wi-Fi 6. Based on global Speedtest Intelligence samples, we see ASUS leading the market in Wi-Fi 6 penetration, with 39% of samples recorded using Wi-Fi 6 compatible routers. NETGEAR and Belkin followed, but for the remaining major router vendors, Wi-Fi 6 penetration currently stands at close to 10% or below. Wi-Fi 6E remains a small but growing subset of Wi-Fi 6 certified devices, currently standing at 7.7% of products based on the latest Wi-Fi Alliance data. Of these, a majority are either routers or smartphones, with an almost even split between the two.

Chart of Wi-Fi 6 Router Market Share view by Brand (Global)

Smartphone support indicates ISPs should focus on Wi-Fi 6E for now

With Samsung releasing its Galaxy S23 range in February 2023 without Wi-Fi 7 support, and Apple’s latest iPhone 14 smartphones limited to Wi-Fi 6, it’s clear that, for now, ISPs should prioritize the rollout of Wi-Fi 6/6E among their customer bases rather than consider leapfrogging to Wi-Fi 7. The Xiaomi Mi13 Pro was the first Wi-Fi 7 capable smartphone to hit the market, launching in December 2022, although it was limited to Wi-Fi 6E initially, requiring a software update to enable Wi-Fi 7. The availability of Wi-Fi 7 supporting Android smartphones will grow through 2023, enabled by SoCs from leading vendor Qualcomm with its flagship Snapdragon 8 Gen 2, and MediaTek with its Dimensity 9200. Apple, on the other hand, lags on the latest Wi-Fi standard support, with the iPhone 14 series featuring Wi-Fi 6, and with its fall 2023 models rumored to be adding Wi-Fi 6E to their feature list.

Chart of Android Smartphone Vendor Installed Base, by Wi-Fi Standard, Global

Samsung, as the leading Android smartphone vendor globally, has the largest installed base of smartphones supporting Wi-Fi 6 and Wi-Fi 6E, and has stolen a march on its main rivals Xiaomi, OPPO, and Vivo. While the major Chinese smartphone vendors have launched Wi-Fi 7 compatible devices, the lack of assignment of 6 GHz spectrum for unlicensed use in China does appear to have held them back relative to brands such as Samsung and ASUS.

The outlook for Wi-Fi in the home

It’s clear from the gap between Wi-Fi and ethernet performance that ISPs need to do more to improve the customer experience for Wi-Fi users within the home. Part of the solution lies in rolling out more advanced generations of Wi-Fi technology, given Wi-Fi 4 and 5 remain the dominant technologies deployed globally. However, evidence linking increased adoption of Wi-Fi 6 to overall Wi-Fi closing the gap to ethernet performance is mixed, and validates the approach of ISPs looking to also offer mesh networking Wi-Fi solutions. Contact us to find out more about how Ookla Research can help you monitor the performance of your networks, and stay ahead of the competition.

Ookla retains ownership of this article including all of the intellectual property rights, data, content graphs and analysis. This article may not be quoted, reproduced, distributed or published for any commercial purpose without prior consent. Members of the press and others using the findings in this article for non-commercial purposes are welcome to publicly share and link to report information with attribution to Ookla.

| March 16, 2022

Starlink Hits 100+ Mbps Download Speed in 15 Countries During Q4 2021

Fast satellite internet has become increasingly available to more and more people across the globe. It’s already a huge boon to rural communities that might otherwise be too remote for fixed broadband service. Starlink, Viasat, HughesNet, and other satellite providers are all placing big bets on low-earth orbital (LEO) satellite constellations, and Starlink is even introducing a new premium service with speeds expected to be around 150-500 Mbps. It’s a gamble, as Starlink recently learned after losing about 40 satellites to a geomagnetic storm, but it’s a gamble worth making. The European Commission is even planning a multibillion Euro investment to connect the continent to satellite internet. 

We’ve analyzed fresh satellite internet performance data from Q4 2021 including results from seven additional countries to update our ongoing series.

United States: Starlink was the fastest satellite provider during Q4 2021 and speeds increased over Q3 2021

Satellite Internet Performance vs Fixed in USA

U.S. consumers saw mixed satellite performance when comparing Q3 2021 to Q4 2021, while the United States government has been trying to increase satellite internet competition. Starlink’s median download speed increased from 87.25 Mbps during Q3 2021 to 104.97 Mbps in Q4 2021 — an important benchmark that inches Starlink closer to reaching the Rural Digital Opportunity Fund’s (RDOF) baseline of download speeds greater than 100 Mbps. Viasat overtook HughesNet to follow Starlink distantly at 21.81 Mbps (comparable to the 18.75 Mbps we saw in Q3 2021) and HughesNet followed at 20.92 Mbps (19.30 Mbps in Q3 2021). SES, new to our list this quarter, trailed far behind at 2.19 Mbps. For comparison, the median download speed for all fixed broadband providers rose moderately in the U.S. during Q4 2021 from 119.84 Mbps in Q3 2021 to 131.30 Mbps in Q4 2021.

Starlink saw a slight decrease in median upload speed from 13.54 Mbps during Q3 2021 to 12.04 Mbps in Q4 2021, still short of the median upload speed for all fixed broadband, which rose to 19.49 Mbps in Q4 2021 from 18.03 Mbps in Q3 2021. Viasat followed at 2.88 Mbps (2.96 Mbps in Q3 2021), then HughesNet at 2.54 Mbps (2.13 Mbps in Q3 2021), and SES at 1.19 Mbps.

As we’ve seen over the past year, Starlink, which uses only low earth orbit (LEO) satellites, was once again the only satellite internet provider with a median latency anywhere close to fixed broadband in Q4 2021 (40 ms and 14 ms, respectively). SES, Viasat, and HughesNet, which all utilize higher geosynchronous earth orbit (GEO) satellites for now, had much higher median latencies at 613 ms, 627 ms, and 725 ms, respectively.

Starlink performance continues to vary widely at the county level

Median Download Speed for Starlink in Selected US Counties

During Q4 2021, we saw about a 130 Mbps range in performance between the U.S. county with the fastest median download speed over Starlink (Miami Dade County in Florida at 191.08 Mbps) and the county with the slowest median download speed (Columbia County in Oregon at 64.95 Mbps). Even the lower-end speeds were well above the FCC’s baseline performance tier for broadband internet of at least a 25 Mbps download speed.

Satellite internet performance elsewhere in the world

We examined satellite internet performance in countries with an established market share to see how well their speeds compare to local fixed broadband. We’re excited to add analyses on satellite performance in Austria, Ireland, Italy, Mexico, Netherlands, Poland, and Portugal this quarter. We’ve also added Starlink to the list of providers in Chile. With Starlink continuing to launch in additional countries, we’re looking forward to seeing how Starlink performs during Q1 2021.

Australia: Starlink nearly triples fixed broadband download average

Starlink performed well in Australia during Q4 2021 with a median download speed of 141.55 Mbps. The median download speed for all fixed broadband providers was 51.35 Mbps. Starlink’s 14.84 Mbps median upload speed fell behind fixed broadband providers’ 18.01 Mbps. Starlink is a clear alternative to traditional fixed broadband for speeds, however Starlink can’t yet compete for latency, with Starlink showing a median latency of 43 ms vs. 10 ms for all fixed broadband combined.

Austria: Starlink download speed outpaces fixed broadband by more than double

New to our list this quarter, Austrian consumers had fast speeds over Starlink during Q4 2021, achieving faster median download speeds than that of all fixed broadband providers combined at 131.84 Mbps vs. 50.33 Mbps on fixed broadband. Starlink also had a faster median upload speed at 19.91 Mbps vs. 14.34 Mbps on fixed broadband. Starlink trailed fixed broadband on median latency during Q4 2021, 52 ms vs. 13 ms.

Satellite Internet Performance vs Fixed Broadband in Austria

Belgium: Starlink much faster than fixed broadband

Starlink’s median download speed of 155.15 Mbps during Q4 2021 was much faster than the country’s median download for all fixed broadband of 76.94 Mbps. That’s also a large increase from Starlink’s median download speed of 127.46 Mbps in Q3 2021. For median upload speed, Starlink was only slightly slower at 15.15 Mbps than the median fixed broadband upload speed of 18.05 Mbps. However, Starlink’s 45 ms latency was higher than the country’s median latency of 13 ms. Starlink was the only satellite internet provider with adequate samples to analyze in Belgium during Q4 2021. For rural Belgians, Starlink is a strong option.

Satellite Internet Performance vs Fixed Broadband in Belgium

Brazil: Viasat fell further behind as national fixed broadband sped up

Viasat’s median download speed in Brazil dipped slightly from 66.32 Mbps during Q3 2021 to 62.80 Mbps during Q4 2021. This fell further away from the national median for fixed broadband, which sped up to 83.03 Mbps during Q4 2021 (71.50 Mbps in Q3 2021). Viasat’s median upload speed (1.07 Mbps) was much slower than that on fixed broadband (40.76 Mbps), and Viasat’s latency was much higher (610 ms vs 6 ms). With Starlink slated to enter the Brazilian market soon, we’ll be watching these numbers closely to see if additional competition spurs the market.

Satellite Internet Performance vs Fixed Broadband in Brazil

Canada: Starlink performance reaches milestone during Q4 2021

In our last article, Starlink’s median download speed decreased to slower than fixed broadband in Canada during Q3 2021 (84.55 Mbps vs. 90.67 Mbps). But in Q4 2021, Starlink’s median download speed leapt ahead, achieving 106.64 Mbps while median download speed for fixed broadband increased to 96.39 Mbps. Starlink’s median upload speed was slower than fixed broadband (12.82 Mbps vs. 21.66 Mbps) and latency on Starlink was still much higher (55 ms vs. 11 ms). Starlink should be considered a viable option compared to fixed broadband in Canada, especially for rural consumers or those without access to fast fixed broadband options like fiber.

Satellite Internet Performance vs Fixed Broadband in Canada

Starlink faster than overall fixed broadband in nearly every province

Median Download Speed for Starlink in Canadian Provinces

Starlink showed enough samples to analyze performance in all 10 provinces in Canada during Q4 2021 — all of which showed substantial increases in Starlink’s download speed during Q4 2021 compared to Q3 2021. Starlink’s median download speed was faster than the median download for all fixed broadband in seven provinces during Q4 2021: Manitoba (101.66 Mbps vs. 83.06 Mbps), Newfoundland and Labrador (195.30 Mbps vs. 131.58 Mbps), Nova Scotia (143.52 Mbps vs. 121.57 Mbps), Ontario (106.24 Mbps vs. 95.06 Mbps), Prince Edward Island (139.11 Mbps vs. 75.95 Mbps), Quebec (123.50 Mbps vs. 84.50 Mbps), and Saskatchewan (116.24 Mbps vs. 68.43 Mbps).

Download speeds were comparable between Starlink and overall fixed broadband in New Brunswick (130.67 Mbps vs. 132.65 Mbps), and overall fixed broadband was faster than Starlink in Alberta (107.32 Mbps vs. 96.56 Mbps) and British Columbia (130.97 Mbps vs. 94.74 Mbps) — with the latter two provinces having better access to fiber-to-the-home (FTTH).

Chile: Starlink debuts fast speeds, but still much slower than scorching fast fixed broadband

Chilean fixed broadband providers have continued to achieve some of the fastest speeds in the world, recording the fastest speed on the Speedtest Global Index during February 2022, and we were interested to see how Starlink would compete. Starlink reached 118.95 Mbps in Chile during Q4 2021, which was faster than HughesNet (15.30 Mbps) but much slower than Chile’s median download speed for all fixed broadband providers (168.92 Mbps). 

Median upload speeds also showed a wide gap in Chile between satellite and fixed broadband during Q4 2021 (23.46 Mbps for Starlink and 3.42 Mbps for HughesNet vs. 89.76 Mbps on fixed broadband). Fixed broadband was also much faster for latency: 7 ms for fixed broadband vs. 38 ms for Starlink and 615 ms for HughesNet.

Satellite Internet Performance vs Fixed Broadband in Chile

Colombia: HughesNet decreased over download and upload speeds

HughesNet’s median download speed decreased in Q4 2021 to 11.75 Mbps from 12.12 Mbps during Q3 2021, while Colombia’s fixed broadband increased to 54.60 Mbps (46.08 Mbps in Q3 2021). Median upload speed was also slower for HughesNet than fixed broadband (2.88 Mbps vs. 11.86 Mbps), and latency was much higher on HughesNet (717 ms vs. 14 ms).

Satellite Internet Performance vs Fixed Broadband in Colombia

France: Starlink download speed increased, still faster than fixed broadband

Starlink users in France saw a median download speed of 121.21 Mbps in Q4 2021 (up from 102.15 Mbps in Q3 2021). Starlink’s download speed easily beat the country-wide median for fixed broadband of 90.88 Mbps (up from 75.47 Mbps in Q3 2021). Starlink’s upload speed during Q4 2021 was slower than the fixed broadband median (17.20 Mbps vs. 69.49 Mbps), and Starlink’s latency was higher (51 ms vs. 12 ms). Satellite provider SES, on this list for the first time, trailed behind both Starlink and fixed broadband with a 14.88 Mbps download speed, 1.83 Mbps upload speed, and 649 ms latency. Starlink remains an good option for rural French consumers.

Satellite Internet Performance vs Fixed Broadband in France

Germany: Starlink blazes ahead of fixed broadband download speed

Starlink’s median download speed in Germany of 115.58 Mbps was much faster than the fixed broadband median of 65.86 Mbps during Q4 2021 (and Starlink’s Q3 2021 download speed of 95.40 Mbps). Starlink was slightly slower for upload speed than overall fixed broadband (15.17 Mbps vs. 22.40 Mbps) and Starlink showed a higher latency (47 ms) than fixed broadband (14 ms).

Satellite Internet Performance vs Fixed Broadband in Germany

Ireland: Starlink download debuts nearly double that of fixed broadband

Starlink’s debut on our list is noteworthy in Ireland, where it achieved a download speed almost double that of Ireland’s combined fixed broadband average during Q4 2021 (123.51 Mbps vs. 65.89 Mbps). Median upload speeds were almost level, with Starlink recording a median upload speed at 24.35 Mbps vs. 22.63 Mbps for fixed broadband. Starlink lagged for latency at 45 ms vs. 11 ms for fixed broadband. Starlink is a great option for those who are looking for fast speeds in Ireland and can’t get access to fixed broadband.

Satellite Internet Performance vs Fixed Broadband in Ireland

Italy: Starlink dominates against fixed broadband

Starlink enters our list in Italy with a decisive statement during Q4 2021: It achieved a median download speed of 124.39 Mbps, a huge leap ahead of Italy’s fixed broadband average of 49.56 Mbps. Upload speeds were comparable between the two, with Starlink recording a median of 18.90 Mbps to 18.29 on fixed broadband. Starlink had a higher latency at 52 ms vs. 14 ms on fixed broadband. Starlink is an attractive option for fast internet in Italy.

Satellite Internet Performance vs Fixed Broadband in Italy

Mexico: Starlink impresses during Q4 2021 debut

Starlink, which only became commercially available in Mexico during November 2021, made a significant splash during its brief Q4 2021 debut, achieving a median download speed of 141.94 Mbps. That was significantly faster than Viasat (16.34 Mbps), HughesNet (10.63 Mbps), and all fixed broadband providers combined (36.56 Mbps). 

Starlink also outpaced fixed broadband for fastest upload speed (22.32 Mbps vs. 9.53 Mbps). HughesNet and Viasat followed at 3.10 Mbps and 2.06 Mbps, respectively. Starlink was the only satellite provider that came close to fixed broadband median latency, 64 ms to 11 ms. Viasat and HughesNet were distantly behind at 676 ms and 763 ms, respectively. With Starlink making such an impressive entrance into Mexico, we’ll be interested to see if the performance holds up in the coming months.

Satellite Internet Performance vs Fixed Broadband in Mexico

Netherlands: Starlink faster for median download, lagging on upload and latency

The Netherlands, which is new to this list, has some of the fastest median mobile and fixed broadband speeds in the world according to the Speedtest Global Index. We were eager to see how Starlink would perform against this competition. During Q4 2021, Starlink achieved a median download speed of 138.40 Mbps compared to 95.55 Mbps over fixed broadband. Starlink lagged noticeably behind for upload speed at 15.60 Mbps vs. 30.87 Mbps on fixed broadband. Starlink also had a higher latency at 45 ms vs. 11 ms on fixed broadband.

Satellite Internet Performance vs Fixed Broadband in Netherlands

New Zealand: Starlink slowed slightly, still faster than fixed broadband download

Starlink’s Q4 2021 median download speed (116.44 Mbps, down slightly from 120.10 Mbps Mbps in Q3 2021, likely due to increased adoption) was faster than New Zealand’s median fixed broadband download speed (98.61 in Q4 2021, up from 84.98 Mbps in Q3 2021). Starlink was much slower than New Zealand’s median fixed broadband upload speed for Q4 2021 (13.79 Mbps vs. 59.26 Mbps, which was a huge increase from 23.62 Mbps on fixed broadband during Q3 2021). Starlink’s median latency during Q4 2021 was comparable to Q3 2021 (79 ms vs. 81 ms) which was still much slower than New Zealand’s median for all fixed broadband of 6 ms during Q4 2021.

Satellite Internet Performance vs Fixed Broadband in New Zealand

Poland: Starlink a fast option for Poles

Starlink launched in Poland during September 2021 and is already recording fast speeds. The median download speed for Starlink was much faster than fixed broadband at 129.29 Mbps to 83.88 Mbps during Q4 2021. Upload speed was roughly comparable, with Starlink recording a slightly slower median upload speed of 24.17 Mbps and fixed broadband ahead at 28.60 Mbps. Starlink’s latency was higher at 58 ms to 10 ms on fixed broadband. That’s still acceptable for online gaming, but higher than what’s considered optimal.

Satellite Internet Performance vs Fixed Broadband in Poland

Portugal: Starlink far ahead on download speed in debut, fixed broadband much faster on upload

Another newcomer to this list this quarter, Portugal was a place where Starlink dominated with a much faster median download speed than fixed broadband at 140.35 Mbps to 94.62 Mbps, respectively, during Q4 2021. Upload speed was a different story, with fixed broadband notching a median upload speed of 65.52 Mbps to Starlink’s 30.16 Mbps. Starlink also had a much higher latency than fixed broadband at 44 ms to 7 ms. Starlink remains a good option if you don’t have access to good fixed broadband in Portugal. 

Satellite Internet Performance vs Fixed Broadband in Portugal

United Kingdom: Starlink still nearly twice as fast as fixed broadband median

Starlink showed a faster median download speed in the U.K. (121.94 Mbps in Q4 2021, up from 111.66 Mbps in Q3 2021) than the country’s median for fixed broadband (57.66 Mbps in Q4 2021, up from 53.16 Mbps in Q3 2021). Starlink’s median upload speed (13.96 Mbps) was comparable to the median upload for all fixed broadband in the U.K. (16.84 Mbps), and the latency was relatively fast given the distance traveled (36 ms for Starlink vs. 15 ms for all fixed broadband) — enough to be able to reliably play online multiplayer games. Satellite provider SES trailed far behind during Q4 2021 with a 3.79 Mbps median download speed, 3.74 Mbps median upload, and 636 ms median latency.

Satellite Internet Performance vs Fixed Broadband in United Kingdom

Competition among satellite providers is rapidly increasing and we’ll continue watching closely

We look forward to updating this data again next quarter with new locations as satellite internet continues to become a more viable option for many. If you’re using satellite internet, take a Speedtest® to help us provide an accurate picture of real-world performance.

Editor’s note: The section on Australia was amended on March 24 to remove performance details for Viasat which was determined not to be a consumer offering at this time.

Ookla retains ownership of this article including all of the intellectual property rights, data, content graphs and analysis. This article may not be quoted, reproduced, distributed or published for any commercial purpose without prior consent. Members of the press and others using the findings in this article for non-commercial purposes are welcome to publicly share and link to report information with attribution to Ookla.

| May 8, 2023

New Speedtest Data Shows Starlink Users Love Their Provider

Satellite internet competition is heating up and Ookla® has exciting, fresh data from Q4 2022 and Q1 2023 for HughesNet, SpaceX’s Starlink, and Viasat in North America, South America, and the Caribbean, as well as new Starlink markets we haven’t yet featured in our ongoing satellite internet series

This analysis includes Starlink Net Promoter Score (NPS) for metro and nonmetro internet connections in the United States, year-over-year data for Starlink in Canada, Chile, Mexico, and the U.S., and Starlink results from three new countries (Philippines, Nigeria, and Peru).

Starlink users in metro and nonmetro areas love Starlink, fixed broadband users dislike their internet service providers

Using Speedtest Intelligence®, we examined NPS ratings by Starlink users and all fixed broadband providers combined for “metropolitan” and “nonmetropolitan” counties as defined by the U.S. Office of Management and Budget. NPS based on Speedtest® user responses after being asked how likely they are to recommend their provider to friends or family on a 0 to 10 scale. NPS ratings are categorized into Detractors (score 0-6), Passives (score 7-8), and Promoters (score 9-10), and is calculated as (% Promoters – % Detractors) x 100. Any NPS score above 0 indicates that a provider’s audience is more loyal than not.

Chat of Metropolitan vs. Nonmetropolitan NPS and Performance in the United States

As you see above, the difference in NPS between Starlink and all fixed broadband providers combined is stark: both metro and nonmetro Starlink far outperformed metro and nonmetro ISPs combined for NPS. Metro Starlink had a score of 31.94 compared to -23.62 for all metro fixed broadband providers combined, despite Starlink having a median download speed of 65.29 Mbps compared to 203.93 Mbps for all metro fixed broadband providers combined. Nonmetro Starlink had an even higher NPS at 42.21 compared to nonmetro ISPs at -21.27 — that’s especially notable given that Starlink’s median download speed was much closer to the median nonmetro fixed broadband speed at 72.18 Mbps to 100.41 Mbps. 

Clearly, Starlink provides a much loved option for more rural, nonmetro users who often don’t have many good — if any — internet options. And the message is loud and clear: Starlink users are more than willing to recommend the service and love the internet they are getting.

Starlink speeds increased in Canada and the U.S. over the past two quarters, but are mixed year-over-year

Chart of Starlink Performance in Select Countries in North and South America

As Starlink continues to become an increasingly popular and beloved option for users, especially those in more rural areas, steady increases in speeds in two large markets like Canada and the U.S. bode well for the internet provider. These increases come as major upgrades to Starlink’s satellite array are beginning, with Starlink having just launched 46 nextgen satellites on April 27, so we wouldn’t be surprised if speeds keep climbing across the globe.

In North America, all of the countries we surveyed saw slower median download and upload speeds during Q1 2023 than Q1 2022. However, Canada saw just about a 3 Mbps decrease in download speed from Q1 2022 to Q1 2023, with about a 28 Mbps increase over the past two quarters. The U.S., where Starlink has many more users, saw about a 24 Mbps decrease year-over-year for median download speeds, but at least a 13 Mbps increase during Q4 2022 and Q1 2023. Mexico, which saw 100+ Mbps median download speeds during Q1 2022, saw a roughly 49 Mbps dip year-over-year as more users signed up for the service; however, speeds leveled slightly with only an overall dip of about 8 Mbps during the past two quarters.

In South America, Chilean Starlink speeds slowed about 22 Mbps from Q1 2022 to Q1 2023, however, speeds only slowed about 8 Mbps over the past two quarters. Chile has continually ranked in the top four for fastest fixed broadband speeds on the Speedtest Global Index™ for over a year now. 

Starlink in Canada blazed ahead as the fastest satellite provider in mainland North America

Chart of Satellite vs. Fixed Broadband Internet in North America

Speedtest Intelligence reveals that Starlink in Canada had the fastest download speed among satellite providers in mainland North America at 93.97 Mbps. That was about 40% faster than the runner-up, which was Starlink in the U.S. at 66.59 Mbps. Starlink in Mexico was next at 56.42 Mbps, and was faster than all fixed broadband providers in Mexico combined at 50.46 Mbps. 

Viasat in Canada, Mexico, and the U.S. made noticeable performance leaps over download speed from Q3 2022 when we last measured North American satellite providers. Canada went from 24.36 Mbps in Q3 2022 to 48.24 Mbps in Q1 2023, the U.S. from 28.07 Mbps to 36.47 Mbps, and Mexico from 16.14 Mbps to 24.06 Mbps. Hughesnet trailed over download speed in the U.S. (16.32 Mbps) and in Mexico (12.98 Mbps).

For upload speeds, all satellite providers trailed fixed broadband speeds in their respective countries, with Starlink in Canada achieving the fastest satellite upload speed at 9.60 Mbps, followed by Starlink in Mexico (8.47 Mbps) and the U.S. (7.74 Mbps). Viasat and HughesNet trailed behind.

Multi-server latency showed the stark difference of satellite internet’s real limitations, with the huge distances between satellite and users adding up to longer lag times than fixed broadband. Starlink had the only latencies under 100 ms among satellite providers, with Starlink in the U.S. having the lowest latency at 62 ms, followed by Canada (70 ms) and Mexico (97 ms). Viasat and HughesNet, which have farther geosynchronous orbits (GEO) than Starlink’s low-earth orbit (LEO), had much higher latencies.

Starlink in Chile raced ahead as the fastest satellite provider in South America

Chart of Satellite vs. Fixed Broadband Internet in South America

Starlink in Chile was the fastest satellite provider in South America during Q1 2023, edging out Starlink in Peru by about 5% with a median download speed at 84.62 Mbps to 77.17 Mbps. No satellite provider outperformed all fixed broadband providers combined in Q1 2023, but Starlink in Colombia and Brazil both reached median download speeds above 70 Mbps at 73.51 Mbps and 70.92 Mbps, respectively. HughesNet in Chile broke 20 Mbps at 21.01 Mbps, while Viasat in Brazil only reached 14.41 Mbps.

Satellites were outperformed by fixed broadband over upload speed in South America during Q1 2023, but Starlink had median upload speeds that ranged from 13.90 Mbps to 22.08 Mbps, the fastest being in Peru. HughesNet ranged from 2.12 Mbps to 3.21 Mbps, and Viasat in Brazil was at 1.42 Mbps.

Starlink’s multi-server latency dipped below 60 ms in three South American markets during Q1 2023: Peru (48 ms), Chile (54 ms), and Colombia (55 ms). Brazil followed at 75 ms, which was the next lowest. Viasat and HughesNet trailed far behind.

Starlink in Jamaica was the fastest Caribbean satellite provider

Chart of Satellite vs. Fixed Broadband Internet in the Caribbean

Speedtest Intelligence reveals that Starlink in Jamaica was the fastest satellite provider in the Caribbean at 83.79 Mbps during Q1 2023. Starlink was faster than all fixed broadband providers in Jamaica, and both Starlink and Viasat were faster than all providers combined in the Dominican Republic during Q1 2023. Starlink reached median download speeds of over 50 Mbps during Q1 2023 in Jamaica (83.79 Mbps), Puerto Rico (74.61 Mbps), and the U.S. Virgin Islands (57.08 Mbps), while it fell just short of that benchmark in the Dominican Republic (46.24 Mbps). Viasat had median download speeds of 37.07 Mbps and 33.37 Mbps in Puerto Rico and the Dominican Republic, respectively, during Q1 2023, while HughesNet had a median download speed of 23.74 Mbps in Puerto Rico during Q1 2023.

Upload speeds showed a bit more parity between satellite providers with only Starlink in Jamaica rising above 10 Mbps with a median upload speed of 13.45 Mbps during Q1 2023. Starlink had median upload speeds ranging from 6.65 Mbps to 13.45 Mbps, HughesNet had a median upload speed at 3.78 Mbps in Puerto Rico, and Viasat had upload speeds of 1.02 Mbps and 1.03 Mbps in Puerto Rico and the Dominican Republic, respectively, during Q1 2023. 

For multi-server latency, Caribbean satellite users saw higher multi-server latencies than mainland North and South America with only Starlink in Jamaica breaking under 100 ms. While fast speeds for remote users are always going to be appreciated, multi-server latencies of over 100 ms do make some internet uses much harder to do well like live gaming and video conferencing.

New Q1 2023 Starlink countries show promising initial results

Chart of Satellite vs. Fixed Broadband Internet in Select Countries

Speedtest Intelligence data shows new Starlink data in three countries during Q1 2023, including Nigeria, Peru, and the Philippines, where Starlink is still a nascent provider with limited market share. Median download speeds for new Starlink countries were: 110.78 Mbps in the Philippines, 77.17 Mbps in Peru, and 61.75 Mbps in Nigeria during Q1 2023. 

Starlink had slower upload speeds than all fixed broadband providers combined in all of the new countries except Nigeria, which was too close to call at 11.17 Mbps to 10.70 Mbps. Starlink had a much higher latency than fixed broadband providers in the Philippines (162 ms) in Q1 2023, though it came very close in Nigeria 57 ms to 46 ms. 

It should be noted that satellite constellations have limited network bandwidth capacity, which may affect the consumer experience as more users sign up for the service. Starlink’s reach within these markets will also be limited by the cost of equipment (CPE) in particular, which ranges from PEN 1,750 ($470) in Peru, to PHP 29,320 ($530) in the Philippines and NGN 268,584 ($590) in Nigeria (prices correct at time of publication).

The 2023 space revolution is off to a huge start

Here are some major updates about what’s next for various different satellite competitors:

Amazon’s Project Kuiper showcases low-cost customer satellite terminals

After Amazon’s Project Kuiper 3,236 satellite LEO constellation was greenlit by the FCC, Amazon swiftly moved to showcase its consumer terminals in March. These new terminals have different tiered models, which are promised to deliver 100 Mbps and 400 Mbps models for consumers and businesses, and 1 Gbps models for “enterprise, government, and telecommunications applications that require even more bandwidth.” Furthermore, Amazon is getting into the chipset business and producing their own 5G modem chip, which will feature in each terminal.

Viasat launched its Viasat-3 arrays

On April 30, 2023, Viasat launched the first of three long-awaited Viasat-3 arrays, which aims to provide 1 Terabit per second (Tbps) of network capacity on each satellite, double that of the entire operating fleet. Add two more satellites and Viasat could raise the throughput up to 500-600% of its current network capacity. That could allow its users to experience 100+ Mbps connections — a huge improvement for many consumers. We’ll be eagerly anticipating results in the coming quarters.

Eutelsat, OneWeb, and Intelsat are making big moves

While the merger of Eutelsat and OneWeb has yet to be fully completed, both satellite operators inked major deals with Intelsat to add more global satellite capacity. Furthermore, OneWeb launched an additional 36 LEO satellites into orbit in late March 2023, providing additional options for many of its resellers. 

European Union greenlights multi-orbit constellation

The European Union has approved its multi-orbit, €6 billion constellation plan, which includes GEO, MEO, and LEO arrays, and will offer connectivity to all EU citizens. The project will support EU connectivity priorities including the economy, environment, security and defense, and is hoping to launch in 2024, and be fully operational by 2027.

HughesNet aiming to launch Jupiter 3 array in Q2 2023

Incumbent satellite internet provider HughesNet has revealed its new Jupiter 3 array, which is designed to offer 500 Gbps over Ka-band and will allow HughesNet to provide consumers offerings of 50 Mbps and 100 Mbps. While the array still doesn’t have an official launch, the Jupiter 3 array is “doubling the size of the Hughes JUPITER fleet over North and South America.”

Ookla will continue monitoring new satellite internet developments

As 2023 continues to shape up as a pivotal year for satellite internet providers, we’ll be watching the sky to make sure providers are providing the connectivity consumers need. We’ll continue our series next quarter with Q1 and Q2 2023 data from Asia, Europe, Oceania, and any new countries where Starlink launches, and be back with Africa, North America, and South America data in Q4 2023. In the meantime, be sure to download the Speedtest® app for Windows and Mac computers or for iOS or Android for devices and see how your satellite internet stacks up to our findings.

Editor’s note: This article was updated on May 10 with clarifying details and an updated chart.

Ookla retains ownership of this article including all of the intellectual property rights, data, content graphs and analysis. This article may not be quoted, reproduced, distributed or published for any commercial purpose without prior consent. Members of the press and others using the findings in this article for non-commercial purposes are welcome to publicly share and link to report information with attribution to Ookla.

| August 4, 2021

How Starlink’s Satellite Internet Stacks Up Against HughesNet and Viasat around the Globe

The satellite internet race is heating up, with more competitors serving more areas than even a quarter ago. We’re back with a broader look at internet network performance for satellite providers across the globe based on Q2 2021 data from Speedtest Intelligence.

Starlink speeds beat competitors in the U.S., can’t top fixed broadband

Given that satellite internet is often the only solution for folks with little to no fixed broadband access, the Speedtest® results we saw coming from HughesNet, Starlink and Viasat during Q2 2021 were encouraging. However, Starlink was the only satellite internet provider in the United States with fixed-broadband-like latency figures, and median download speeds fast enough to handle most of the needs of modern online life at 97.23 Mbps during Q2 2021 (up from 65.72 Mbps in Q1 2021). HughesNet was a distant second at 19.73 Mbps (15.07 Mbps in Q1 2021) and Viasat third at 18.13 Mbps (17.67 Mbps in Q1 2021). None of these are as fast as the 115.22 Mbps median download speed for all fixed broadband providers in the U.S. during Q2 2021, but it beats digging twenty miles (or more) of trench to hook up to local infrastructure.

ookla_satellite_internet_comparison_us_0821

Starlink’s median upload speed of 13.89 Mbps (up from 13.77 Mbps in Q1 2021) was much closer to that on fixed broadband (17.18 Mbps in Q2 2021, 15.99 Mbps in Q1 2021). Viasat had the second fastest upload speed among satellite providers at 3.38 Mbps (3.48 in Q1 2021). HughesNet was third (2.43 Mbps in Q1 and Q2 2021).

Critically, Starlink was the only satellite internet provider with a median latency that was anywhere near that seen on fixed broadband in Q2 2021 (45 ms and 14 ms, respectively). A low latency connection is more responsive, making it essential for many common applications such as voice and video calling, gaming and live streaming of content. Starlink is able to achieve these lower latency numbers through the use of their low earth orbit (LEO) satellite constellation. At altitudes between 550-1200 km, these satellites are physically closer to the earth’s surface than traditional satellite providers. Therefore it takes less time for the signal to relay back to a downlink station on earth, ensuring a much more responsive connectivity experience for the user. Viasat and HughesNet both utilize considerably higher “geosynchronous” orbits of around 35,000 km for their satellites. This allows them to serve much wider swaths of the Earth’s surface with fewer satellites, but with a dramatic increase in latency in our data of 630 ms and 724 ms respectively.

Satellite internet speeds in the U.S. are increasing, mostly

Consumers are used to incremental increases in fixed broadband performance as that’s a developed technology with a stable market share. Satellite internet is newer and speeds fluctuate as technologies improve and as more users are added to sometimes crowded networks. Data from Speedtest Intelligence during Q1-Q2 2021 shows some of these struggles as median download speeds for both Starlink and HughesNet dipped in February and then rose again through the period only to dip again in June. This could be related to seasonal weather patterns. Viasat’s median download speed rose slightly from January through April and then started to decline slightly in May and June. We’ll continue watching the performance of these companies over time to see if they reach the steady climb that fixed broadband enjoys.

ookla_satellite_internet_monthly_comparison_us_0821

Starlink performance varies at the county level, but not widely

We saw sufficient samples during Q2 2021 to analyze Starlink performance in 458 counties in the U.S. While there was about a 100 Mbps range in performance between the county with the fastest median download speed (Morgan County, Alabama at 168.30 Mbps) and the county with the slowest median download speed (Madison County, Indiana at 64.51 Mbps), even the lower-end speeds are well above the FCC’s Baseline performance tier of at least a 25 Mbps download speed. We also saw many more counties qualify for analysis during Q2 2021 than we saw in Q1 2021.

ookla_united_states_download_speeds_starlink_map_0821

Satellite internet performance elsewhere in the world

The ambition and potential of satellite internet providers is of course to increase internet access across the globe. To that end, we examined satellite internet performance in countries with an established market share.

Brazil: Viasat download speed is comparable to fixed broadband, upload is not

Viasat’s 60.30 Mbps median download speed during Q2 2021 in Brazil was very close to the national average for fixed broadband of 61.38 Mbps. Viasat’s median upload speed (1.05 Mbps) was much slower, however, than that on fixed broadband (28.75 Mbps), and Viasat’s latency was much higher (613 ms vs 7 ms).

ookla_satellite_internet_comparison_br_0821

Canada: Starlink beats fixed broadband download speeds

Our previous article showed that Starlink’s median download speed was slower than fixed broadband in three provinces and faster in two. Data from Q2 2021 shows that Starlink’s median download speed exceeded that of fixed broadband in Canada (86.92 Mbps vs. 84.24 Mbps), making Starlink a reasonable alternative to fixed broadband in Canada. Starlink’s median upload speed was slower than fixed broadband (13.63 Mbps vs. 17.76 Mbps). Latency on Starlink was much higher (55 ms vs. 12 ms), but many customers in remote areas would gladly accept a latency in that range in exchange for having access to internet service.

ookla_satellite_internet_comparison_ca_0821

Starlink performance varies at the province level, but not widely

Starlink showed enough samples to analyze performance in 8 provinces in Canada during Q2 2021. Starlink’s Q2 2021 median download speed was faster than fixed broadband in five provinces (Manitoba, New Brunswick, Nova Scotia, Quebec and Saskatchewan), though samples in Nova Scotia were few enough and showed enough variability that there is room for interpretation. Download speeds were comparable between Starlink and overall fixed broadband in two provinces (Alberta and Ontario) and fixed broadband was faster in British Columbia.

ookla_canada_download_speeds_starlink_map_0821

Chile: HughesNet shows comparable speeds here and in the U.S.

At 15.43 Mbps, the median download speed for HughesNet in Chile during Q2 2021 was not fast, especially compared with the country’s fixed broadband average of 111.94 Mbps. Median upload speeds also showed a wide gap (3.23 Mbps for HughesNet to 39.48 Mbps on fixed broadband), and HughesNet’s latency was very high (678 ms vs. 8 ms).

ookla_satellite_internet_comparison_cl_0821

Colombia: HughesNet is slowest

The slowest performance we saw for HughesNet was in Colombia, where fixed broadband speeds are also slower than in other countries surveyed. HughesNet showed a median download speed of 9.28 Mbps during Q2 2021, compared with Colombia’s 35.90 Mbps for fixed broadband overall. Median upload speed was also slower using the satellite internet provider (3.03 Mbps) than fixed broadband (8.56 Mbps), and latency was much higher on satellite (799 ms vs. 17 ms).

ookla_satellite_internet_comparison_co_0821

France: Where the fastest Starlink download speeds are

Satellite internet users in France saw the fastest median download speeds from Starlink of all countries we surveyed during Q2 2021. At 139.39 Mbps, Starlink’s download speed easily beat the country-wide average for fixed broadband of 70.81 Mbps. Starlink’s upload speed was slower than the fixed broadband average, but still respectable (29.35 Mbps vs. 52.56 Mbps), and Starlink’s latency was higher (53 ms vs. 13 ms).

ookla_satellite_internet_comparison_fr_0821

Germany: Starlink far surpasses local fixed broadband

Consumers looking for fast internet in Germany have a great option in Starlink. Starlink’s median download and upload speeds were much faster than the country averages for fixed broadband in Q2 2021. The only drawback is Starlink’s 37 ms latency, compared to the 15 ms average for fixed broadband.

ookla_satellite_internet_comparison_de_0821

Mexico: Viasat and HughesNet are comparable, though slower than fixed broadband

Mexico has options when it comes to satellite internet, and the faster of the two options appears to be Viasat, for now. With a median download speed of 13.95 Mbps in Mexico during Q2 2021, Viasat was faster than HughesNet (11.92 Mbps) but slower than the country’s average for fixed broadband (29.99 Mbps). Median upload speed told a similar story, though HughesNet was slightly faster than Viasat (3.25 Mbps vs. 2.01 Mbps). While Viasat’s latency was high (672 ms vs 13 ms for fixed broadband), it was lower than HughesNet’s (714 ms).

ookla_satellite_internet_comparison_mx_0821

New Zealand: Starlink is faster than fixed broadband

Data from Speedtest Intelligence shows that Starlink’s median download speed was much faster than New Zealand’s average fixed broadband download speed during Q2 2021 (127.02 Mbps vs. 78.85 Mbps), and the upload speeds were nearly identical (23.61 Mbps vs. 23.51 Mbps). Starlink did have a much higher latency (101 ms vs. 7 ms). Starlink is relatively new in the country and does not have a large market share yet; we’ll be interested to see how their speeds hold up under heavier use.

ookla_satellite_internet_comparison_nz_0821

United Kingdom: Starlink beats fixed broadband providers

Starlink showed a much faster median download speed in the U.K. during Q2 2021 (108.30 Mbps) than the country’s average for fixed broadband (50.14 Mbps). Starlink’s upload speed was also slightly faster (15.64 Mbps vs. 14.76 Mbps), and the latency was pretty good, given the distance traveled (37 ms vs. 15 ms). This brings Starlink closer to contender status for consumers across the U.K., not just those stranded in internet-free zones in Northern Scotland, once the service interruptions are under control. It also shows that because satellite internet is not constrained by the infrastructure of a given country, there is the potential to radically outperform fixed broadband.

ookla_satellite_internet_comparison_uk_0821

This data is changing rapidly as satellite internet providers launch new service locations and improve their technology. We’ll be excited to see if Starlink is still the satellite provider to beat next quarter and in what other countries satellite internet provides a viable alternative to fixed broadband.

Ookla retains ownership of this article including all of the intellectual property rights, data, content graphs and analysis. This article may not be quoted, reproduced, distributed or published for any commercial purpose without prior consent. Members of the press and others using the findings in this article for non-commercial purposes are welcome to publicly share and link to report information with attribution to Ookla.

| December 19, 2023

The State of Worldwide Connectivity in 2023

To gain insight into the current performance of networks, we analyzed Speedtest® data in Q3 2023. Our analysis compares changes in 5G performance to the previous year, identifies the top 10 countries with the best performance, and discusses customer satisfaction with 5G. We also ranked countries based on the performance of their fixed networks and investigated the connectivity gap across the world.

5G | Fixed | Connectivity for All

Key takeaways 

  • Global 5G download speed improved. The median global 5G download speed experienced a substantial 20% increase in Q3 2023, reaching 203.04 Mbps, compared to 168.27 Mbps in Q3 2022. This improvement aligns with a significant rise in global 5G subscriptions, indicating positive progress in user adoption of 5G and the performance of 5G networks. 
  • Top 5G performers have shifted. The top 10 countries for 5G performance witnessed notable changes, with the United Arab Emirates claiming the top spot, surpassing South Korea. Malaysia, India, and the Dominican Republic also made significant strides, showcasing a dynamic shift in the global 5G landscape.
  • Speedtest user ratings indicate room for 5G improvement. Despite advancements in 5G technology, there has been a decline in the Net Promoter Score (NPS) among 5G users. Factors contributing to this dissatisfaction could include unmet expectations and discrepancies between actual 5G speeds and advertised speeds.
  • Fixed Networks Advancements. On a global scale, fixed networks demonstrated significant performance improvement, with a 19% increase in median download speed (83.95 Mbps) and a 28% increase in upload speed (38.32 Mbps) in Q3 2023 compared to the previous year. This highlights the ongoing transition to more advanced broadband technologies, particularly Fiber-to-the-Home (FTTH).
  • The imperative of closing the connectivity gaps. Despite improvements in global connectivity, there are still areas that fall outside of network coverage. Speedtest® data highlights disparities in internet performance between fixed and mobile networks across different regions, emphasizing the importance of addressing connectivity challenges worldwide.

5G Networks

Global 5G download speed improvements

Illustration of 5G Median Performance Worldwide

The median global 5G download speed has experienced a noteworthy surge, registering a 20% increase and reaching 203.04 Mbps in Q3 2023, compared to 168.27 Mbps in Q3 2022, according to Speedtest Intelligence® data. This improvement coincides with a substantial rise in global 5G connections, reaching 1.4 billion according to GSMA Intelligence, representing a 65% year-on-year increase from 872 million a year ago. 

In terms of upload speed and latency, only a very modest improvement of 1% occurred. Median 5G upload speeds reached 18.93 Mbps in Q3 2023, compared to 18.71 Mbps in the same period last year; multi-server latency, a critical metric for network responsiveness, improved from 45 ms in Q3 2022 to 44 ms in Q3 2023. 

Speedtest users experiencing the top 10% of 5G download speeds globally have seen a 9% increase, rising from 525.54 Mbps in Q3 2022 to 573.12 Mbps in Q3 2023. However, speeds have not yet reached Gigabit levels, primarly because of network economics. 5G was originally designed to deliver peak data rates of up to 20 Gbps based on IMT-2020 requirements, but we are still a ways off before gigabit speeds become the new normal. For instance, symmetrical download, upload speeds, and ultra-low latency haven’t been realized, partially because the vast majority of 5G networks are not ‘true 5G’ as they have been deployed in Non-Standalone (NSA) mode, meaning they rely on a 4G LTE network core. According to GSA, over 40 operators have launched 5G standalone (SA) in public networks, but the rollout is not yet complete. Nevertheless, the industry is actively exploring the prospect of 5G Advanced, which promises symmetrical upload and download speeds and ultra-low latency, signaling a proactive stance ahead of the eventual transition to 6G.

Malaysia joined South Korea and the U.A.E at 5G speeds podium

Chart of Fastest Countries for Median 5G Download Speed

During Q3 2023, the United Arab Emirates and South Korea stood out as leaders in 5G performance, boasting the fastest median 5G download speeds globally at 592.01 Mbps and 507.59 Mbps, respectively. Our top 10 list also includes Malaysia, Qatar, Brazil, the Dominican Republic, Kuwait, Macau, Singapore, and India. The shift in the top 10 rankings reveals dynamic changes, with Malaysia, the Dominican Republic, and India making significant strides, while Bulgaria, Saudi Arabia, New Zealand, and Bahrain dropped out of the rankings.

The U.A.E showcased a 14% increase in its median 5G download speed, reaching 592.01 Mbps in Q3 2023, up from 511.68 Mbps in Q3 2022, allowing the U.A.E to take the top spot from South Korea. Key factors contributing to the U.A.E.’s 5G leadership include fierce market competition driven by Etisalat and du, resulting in extensive 5G coverage and widespread access to 5G services. Additionally, the allocation of a 100 MHz of contiguous spectrum, as discussed in our 5G spectrum article, has played a pivotal role in achieving faster speeds, lower latency, and improved spectral efficiency.

The regional shift in 5G performance leadership is noteworthy. In 2022, half of the top 10 countries were from the Middle East, while in 2023, the same proportion hailed from the Asia Pacific region. Our analysis suggests that early adopters in the Asia Pacific region have outperformed major European markets in 5G performance, due to factors such as early spectrum availability and supportive government policies.

Malaysia’s remarkable achievement in reaching the third spot globally for 5G download speed, with a reported speed of 485.24 Mbps in Q3 2023, is particularly noteworthy. Despite launching its nationwide 5G network less than two years ago, Malaysia’s unconventional deployment strategy has proven effective. India has also made a significant leap, with its median 5G download speed of 312.26 Mbps allowing India to reach the top 10 worldwide. The country’s climb of 72 places on the Speedtest Global Index™ between September 2022 and August 2023 is primarily credited to the launch of 5G. Following a 5G spectrum auction in India, operators have successfully addressed network congestion issues by offloading 4G traffic onto 5G networks.

In Brazil, 5G download speed increased 1.4 times, jumping from 312.09 Mbps in Q3 2022 to 443.93 Mbps in Q3 2023. Before Brazil’s 5G spectrum auction, operators had offered 5G using DSS since July 2020. While DSS can provide broad 5G coverage, its speeds are often similar to those on 4G LTE networks. In November of 2021, however, Brazil’s multi-band 5G spectrum auction closed, which not only generated BRL47.2 billion ($8.5 billion) in total commitments, but it also allowed operators to deliver much faster speeds on dedicated 5G spectrum compared to DSS. National operators – Telefonica Brasil (Vivo), Claro Brazil, and TIM Brazil – ended up with 40 MHz or 50 MHz in the 2.3 GHz spectrum band and 100 MHz each in the 3.5 GHz band. The subsequent simultaneous activation of 5G networks in July 2022 marked a transformative moment with the continuous expansion of 5G services to 623 municipalities by December 2023. An upcoming spectrum auction expects to improve Brazil’s 5G standing even further.

The Dominican Republic’s entry into the top 10 fastest 5G countries was marked by its official launch of 5G services in December 2021, making it the first Caribbean nation and the third in Latin America to adopt a 5G network.

Disparity Between 5G Performance and Consumer Perception

The Net Promoter Score (NPS) is a tool that gauges customer loyalty and satisfaction. At the end of Speetest, users may be asked to answer “How likely is it that you would recommend [provider] to a friend or colleague?” on a scale from 0-10. Net Promoter Scores are applied to both users and providers. Users are categorized into Detractors (score 0-6), Passives (score 7-8), and Promoters (score 9-10). NPS is the percent of Promoters minus the percent of Detractors and is displayed in the range from -100 to 100. Providers are ranked in descending order of NPS. NPS categorizes users into Detractors (those that score 0-6), Passives (scores between 7 and 8), and Promoters (scores of 9-10). NPS represents the percentage of Promoters minus the percent of Detractors displayed in the range from -100 to 100. 

In our article discussing whether 5G was meeting customer expectations, we found that 5G users typically rate their network operator with NPS scores universally higher than those for 4G LTE users. In Q3 2023, that trend continued, as 5G  users that were on 5G network when answering the NPS question still scored higher than those on 4G across all markets analyzed. It isn’t surprising given that at a global level, 5G had a 637% better median download speed than 4G and a 130% better median upload speed. 

Chart of NPS Score, 5G Compared to 4G

While 5G NPS still outpaces scores on 4G, our data shows that 5G NPS has been decreasing annually. This could point to the fact that excitement about 5G as a new technology is waning as users become used to faster speeds, or as customers await new use cases that can take advantage of the faster speeds that 5G can provide. After all, we are still waiting for that killer app for 5G, the way the video and streaming were for 4G. 

While it is difficult to fully explain the reasons behind the 5G NPS decrease without further research, we can clearly see that network performance isn’t the only factor at play influencing NPS declines. Others can include customer care, pricing, and other services. For example, in South Korea, one of the first countries to launch 5G with one of the world’s fastest speeds, consumers scored 5G networks -41.47 in Q3 2023 compared to -20.51 in Q3 2022. 

In March 2021, South Korean consumers launched a class action suit against operators because they felt they were being misled by the promises of 5G in the country. Recently, South Korea’s antitrust regulator fined three 5G operators a total of 33.6 billion won ($25.06 million) for making exaggerated claims about the level of performance their networks could achieve. South Korean operators claimed consumers could experience theoretical 5G speeds, which are not practically achievable in a “real world” environment, as factors such as spectrum usage, network densification, user location, and device capability significantly affect actual performance. Our data shows that the top 10% of 5G users in South Korea experienced speeds of 1.004 Gbps in Q3 2023, which, although impressive, are far lower than the advertised 20 Gbps speeds. 

Chart of 5G NPS Score Change Year on Year

Fixed Networks

Fiber driving fixed performance gains 

Illustration of Fixed Median Performance Worldwide

On a global scale, fixed networks have demonstrated significant advancements, achieving a median download speed of 83.95 Mbps and an upload speed of 38.32 Mbps in Q3 2023, per Speedtest Intelligence data. This signifies a substantial 19% improvement in download speed and an impressive 28% enhancement in upload speed compared to those in 2022. This also indicates that more fixed connections have migrated to fiber networks.

According to the World Broadband Association (WBBA) report titled “Next Generation Broadband Roadmap 2023 to 2030” Fiber-to-the-Home (FTTH) is identified as the natural progression from copper-based xDSL broadband networks. The shift towards FTTH varies across different countries and regions, but the industry is committed to embracing more advanced and efficient broadband technologies. 

Oftentimes, despite improvement in underlying broadband technology, Wi-Fi is the bottleneck that reduces customer experience. Our research has shown that Wi-Fi performance can lag behind ethernet in markets where advanced cable and fiber connections are replacing legacy broadband technology (such as DSL or coax cable). Wi-Fi speeds typically range from 30-40% of ethernet, indicating a need to accelerate the adoption of more advanced Wi-Fi technologies and optimize the home network environment.

The UAE, Singapore, and Hong Kong are in the lead for fixed

Chart of Fastest Countries for Fixed Broadband Download Speed

The United Arab Emirates (UAE) and Singapore led the way in fixed network performance.

The UAE achieved a median download speed of 247.63 Mbps in Q3 2023, representing a notable 1.83 times increase compared to the previous year. Most customers in the UAE have access to fiber networks, and additional measures have been implemented by operators in the region to enhance internet speeds, such as increasing the minimum download speed from 250 Mbps to 500 Mbps and offering price discounts to incentivize users to upgrade to higher-tier plans. 

Singapore also leads on the 2023 Fiber Development Index (FDI), with maximum scores in seven of the nine metrics. Singapore, along with Qatar and South Korea, has achieved 100% FTHH coverage. One of the reasons for this success, besides having a smaller area, is that Singapore’s regulator mandates building owners and real estate developers to provide adequate space, facilities, and accessibility for network operators to pre-install fiber networks.

Hong Kong also demonstrated significant progress, with a 37% increase in median download speed and a 40% increase in upload speed. To track broadband adoption, the Office of the Communications Authority (OFCA) in Hong Kong monitors broadband adoption by advertised speed and technology mix; as of August 2023, 66% of residential clients already subscribed to the Internet with a download speed equal to or greater than 1 Gbps.

Chile has seen a 14% improvement in median download speed and a 29% improvement in upload speed on the back of a greater fiber adoption. Chile has been the top-performing fixed broadband market across Latin America, consistently outperforming other regional markets but over the last three years, it has also closed the performance gap with other leading markets globally. Chile’s strong fixed broadband performance — an anomaly in the region — is primarily due to strong competition among Chilean ISPs. Chile has seven ISPs with over 5% market share, all heavily focused on migrating customers to fiber. 

Thailand is a newcomer to the ranking as FTTH continues to grow strongly. FTTH constitutes an impressive 95% of fixed broadband users in Thailand, equivalent to around 58.96% of household penetration. Operators have been actively rolling out fiber in adherence to the Digital Thailand National Policy.

In the United States, there has been a 26% improvement in median download speed and a 7% improvement in upload speed. In this very competitive market, with a range of access technologies vying for customers, a combination of migration to fiber, 5G fixed-wireless access (FWA), and faster cable connections is helping drive higher performance levels. In line with the demand for faster network performance in the market, the FCC recently announced that it is seeking input on a planned increase to its definition of broadband/high-speed internet to 100 Mbps download and 20 Mbps upload, up from the current 25 Mbps download and 3 Mbps upload standard.

As discussed in our recent article, several European countries are making substantial progress in offering high-speed broadband. Across Europe, Denmark had the fastest median download speed for fixed broadband (196.43 Mbps), followed by Spain (176.08 Mbps) and France (170.51 Mbps). Denmark experienced a 25% improvement in median download speed and a 16% improvement in upload speed. Spain also showed significant improvement, with a 32% increase in median download speed and a 29% increase in upload speed. France exhibited even stronger progress, with a 53% increase in median download speed and a 41% increase in upload speed. The speed gains we’ve seen in Spain and France are correlated with an increase in fiber adoption; for example, Spain boasts nearly 90% fiber optic coverage, thanks to private initiatives and government support, while France expects a full-fiber rollout by 2025.

Connectivity for All

The imperative of closing the connectivity gap

Massive investments are being made to bridge the connectivity gap as recognition of connectivity as a fundamental human right is growing. According to a WBBA Whitepaper, a high level of broadband penetration is critical to the country’s socioeconomic development. However, it’s not only about being connected to the network per se; the quality of that broadband connection is equally crucial. Unlike other utility services like gas and electricity, where quality is generally stable, with broadband, the quality of the network experience is crucial to ensure users can benefit fully from multiple applications.

To assess the digital divide, we mapped mobile and fixed internet performance using data from the Open Data Initiative, which Ookla provides as part of Ookla for Good

Determining where a digital divide exists is a complex issue that involves identifying where network infrastructure is located, where people need connectivity, and how affordable it is. Although it can be challenging to dig into a specific location, it is evident that there are varying levels of Internet performance worldwide. A quick glance at our data shows that fixed broadband customers are more likely to experience faster networks (measured as an average download speed of 100 Mbps and above) than mobile across the Americas and Europe. The opposite is true for mobile networks across Africa and APAC, where mobile networks are often the primary means of connectivity. Compared to urban areas, rural communities are often ill-equipped for broadband access. Due to a lack of bandwidth (and therefore slower speeds), people in these areas need help doing many things on the internet, such as streaming videos. The US regulator FCC defines broadband in the United States as access to  25 Mbps download and 3 Mbps upload speeds. Areas without those speeds are classified as broadband “digital deserts,” even if those areas have internet access. Although broadband definitions can vary considerably from country to country, we can see in the next section that many areas fall outside any standards of connectivity globally.

Despite the world becoming increasingly connected, many rural and remote areas still struggle to access the internet. For example, large swathes of South America and Africa fall outside terrestrial network coverage. As discussed in our recent article, cellular networks are critical to connecting individuals and businesses as internet access in Africa is predominantly mobile. Before we can start discussing 5G, connecting communities with the internet in general is a priority. Affordable 4G smartphones and targeted financing for under-served demographics are key for bridging the digital divide and reducing poverty, as a World Bank study found that 4G coverage can help cut poverty by up to 4.3%. 

5G technology can potentially replace fixed internet access in situations where the cost of fiber deployments is high and rolling out traditional fixed broadband networks isn’t commercially viable. However, in countries like Indonesia, satellite technology may be a more effective solution for connecting remote areas. While 5G Fixed Wireless Access (FWA) and satellite technology can complement each other, the adoption of satellite technology is currently limited by factors such as coverage, device affordability, and service cost. As revealed in our recent article, Starlink outperforms GEO satellites and is a suitable replacement for fixed networks in rural areas. While it may not match the leading cable or fiber providers in terms of median speeds or multi-server latency, satellite internet provides a viable alternative in places where cable and fiber access networks are unavailable. This is mainly due to a more consistent distribution of download performance across Speedtest samples, unlike FWA and DSL-based services, where performance is impacted by the distance from the cell site or exchange/DSLAM.

Fixed and mobile network operators across the globe widely use Speedtest data to enhance Internet quality, improve accessibility, and inform network expansion. The United States Federal Communications Commission and the Malaysian Communications and Multimedia Commission rely on Speedtest data to ensure accountability of telecommunications entities and allocate funds for rural and urban connectivity development. Ookla also licenses data to NGOs and educational institutions to help bridge the digital divide between areas with and without modern Internet access. Our mapping data is used to track results and determine whether broadband infrastructure can handle growth as more people connect devices and technologies demand more bandwidth. We are also actively involved in discussing best practices for ensuring digital transformation and connectivity for all in the APAC region, Central Asia, and Europe. If you are interested in working with us, please reach out. 

Keep track of how well your country is performing on Ookla’s Speedtest Global Index and get advice on how to plan and optimize your network.

Ookla retains ownership of this article including all of the intellectual property rights, data, content graphs and analysis. This article may not be quoted, reproduced, distributed or published for any commercial purpose without prior consent. Members of the press and others using the findings in this article for non-commercial purposes are welcome to publicly share and link to report information with attribution to Ookla.

| March 12, 2025

How a Power Outage Impacted Chile’s Mobile Network Resiliency

Spanish / Español

Here’s what Chile’s 12-hour nationwide power outage looked like according to mobile Speedtest data

A major transmission line failure caused a massive power outage across most of Chile. The outage began in the afternoon of February 25th and lasted approximately 12 hours, into the early morning of February 26th. Critical facilities like hospitals had to rely on backup power generators and the outage was disruptive enough that a state of emergency was declared for the country. 

How did mobile networks perform during the outage? This article looks at mobile networks’ performance through Speedtest metrics of sample counts (i.e., the number of completed Speedtests) and download speeds. 

Ookla examined the hourly Speedtest sample counts of the main four mobile carriers in Chile over a 72-hour period. Prior to noon on February 25, 2025, the networks performed in a  normal state with fewer samples in the night and more in the day. 

The outage reportedly started at 3:16 p.m., which matches the spikes in the counts of Speedtest users checking on the network. Comparing the 12-hour outage to the same time the day before, the rate of testing was over 2.5x. This behavior is typical of, and similar to, mobile network outages seen around the world. Staying connected in an emergency is critically important, so checking the status of the network makes good sense.

By the morning of February 26, 2025, when the outage is over and power restored, there is more testing than the prior two mornings. This is likely due to many people checking their phones upon waking up, so it isn’t unusual to see more aggressive testing than usual.

How did the mobile networks perform?

When mobile networks are “unloaded” — that is, not carrying much traffic — as they usually are at night, Speedtest users clock faster speeds. These are the peaks in the chart. The valleys are the times when most people are active and more loading occurs, resulting in slower speeds. 

Selecting the 12 hours of the power outage (the labeled box) and the same 12 hours the prior day (the unlabeled box), the median download speed for the group of operators was effectively cut in half — 16.42 Mbps during the power outage compared to 33.68 Mbps before.

Taking a closer look at all the mobile service providers together, from the outage starting just after 3 p.m., median download speed initially held around 12+ Mbps, then dipped to its low point during the 6 p.m. hour at 7.49 Mbps. Thereafter and until recovery started around 11 p.m., download speeds remained in a narrow range around 9-10 Mbps through the 10 p.m hour. While these median download speeds wouldn’t be considered fast, they do suggest that the mobile networks were serviceable and customers were able to stay in touch.

However, noting that median means the middle, half of the Speedtest users were experiencing slower speeds than seen in the line chart. (And obviously, half were faster, but they wouldn’t have as poor an experience.) To get a sense of the bottom, the slowest 10th percentile for the day of the outage (February 25) compares unfavorably to the same three prior Tuesdays in February. On the day of the outage, the 10th percentile speed was below 1 Mbps – effectively unusable apart from a text message and hopefully holding a voice call. The prior three Tuesdays recorded 2.60 Mbps – still not great, but in older wireless network generations this was fast enough for watching a standard definition (SD) video.

Another observation from the closer look at All Providers Download Speed is the speed declined from early in the outage (3 p.m. to 4 p.m.) to the middle of the outage (5 p.m. to 10 p.m.). One explanation could be the network loading mentioned before, but this seems unlikely since the normal peak loading pattern would have been entirely disrupted by the power outage. A second explanation may be that backup battery power for the cell sites on mobile networks ran out. That is to say, if, for example, every site had a couple hours of battery backup, and some sites also had generators that came online after the batteries were used up, a pattern like this could be seen.

The Chilean telecoms regulator, SUBTEL, was cited in tech press to be looking into increasing the purported four-hour back up to six hours. Network hardening, whether against a power outage or other disruptions like natural disasters, is critical for network resilience.  

Ookla data can offer insights into network performance, reliability, and resiliency. To find out more about Speedtest Intelligence® data and insights, please contact us here.


Cómo afectó un apagón eléctrico a la resiliencia de la red móvil de Chile

Así fue el apagón nacional de 12 horas en Chile según los datos de Speedtest móvil

Una importante avería en una línea de transmisión provocó un apagón masivo en la mayor parte de Chile. El corte comenzó en la tarde del 25 de febrero y duró aproximadamente 12 horas, hasta la madrugada del 26 de febrero. Las instalaciones críticas, como los hospitales, tuvieron que recurrir a generadores de energía de reserva y el apagón fue tan disruptivo que se declaró el estado de emergencia en el país. 

¿Cómo funcionaron las redes móviles durante el apagón? Este artículo examina el rendimiento de las redes móviles a través de las métricas de recuento de muestras de Speedtest (es decir, el número de Speedtests completados) y velocidades de descarga.

Ookla analizó los recuentos horarios de muestras Speedtest de los cuatro principales operadores de telefonía móvil de Chile durante un período de 72 horas. Antes del mediodía del 25 de febrero de 2025, las redes funcionaban de manera normal, con menos muestras durante la noche y más durante el día. 

Al parecer, la interrupción comenzó a las 15.16 horas, lo que coincide con los picos en los recuentos de usuarios de Speedtest que comprueban la red. Si se compara la interrupción de 12 horas con la misma hora del día anterior, la tasa de comprobación se multiplicó por más de 2,5. Este comportamiento es típico y similar al de las interrupciones de la red móvil en todo el mundo. Mantenerse conectado en caso de emergencia es de vital importancia, por lo que comprobar el estado de la red tiene mucho sentido.

En la mañana del 26 de febrero de 2025, cuando terminó el apagón y se restableció el suministro eléctrico, se registraron más test que las dos mañanas anteriores. Esto se debe probablemente a que muchas personas comprueban sus teléfonos al despertarse, por lo que no es raro ver más pruebas de lo habitual. 

¿Cómo funcionaron las redes móviles?

Cuando las redes móviles están “descargadas”, es decir, no tienen mucho tráfico, como suele ocurrir por la noche, los usuarios de Speedtest registran velocidades más rápidas. Esto es lo que representan son los picos en el gráfico. Los valles son los momentos en los que la mayoría de las personas están activas y se produce una mayor carga en la red, lo que da como resultado velocidades más lentas.

Seleccionando las 12 horas del apagón (el recuadro con la línea más gruesa) y las mismas 12 horas del día anterior (el recuadro con la línea más fina), la velocidad media de descarga del grupo de operadores se redujo efectivamente a la mitad: 16,42 Mbps durante el apagón frente a 33,68 Mbps antes.

Si analizamos todos los proveedores de servicios móviles en su conjunto, desde el apagón que comenzó justo después de las 15.00 horas, la velocidad mediana de descarga se mantuvo inicialmente en torno a los 12 Mbps o más, para descender a su punto más bajo a las 18.00 horas, con 7,49 Mbps. A partir de entonces, y hasta que comenzó la recuperación hacia las 23.00 horas, las velocidades de descarga se mantuvieron en un estrecho margen de entre 9 y 10 Mbps hasta las 22.00 horas. Aunque estas velocidades medianas de descarga no se pueden considerar rápidas, sugieren que las redes móviles estaban operativas y los clientes pudieron mantenerse en contacto.

Sin embargo, teniendo en cuenta que la mediana significa el medio, la mitad de los usuarios de Speedtest experimentaron velocidades más lentas que las que se ven en el gráfico lineal (y obviamente, la mitad eran más rápidos, pero no tendrían una experiencia tan mala). Para hacerse una idea de la parte inferior, el percentil 10 más lento para el día de la interrupción (25 de febrero) se compara desfavorablemente con los mismos tres martes anteriores de febrero. El día del apagón, la velocidad del percentil 10 estaba por debajo de 1 Mbps, prácticamente inutilizable salvo para enviar un mensaje de texto y, con suerte, mantener una llamada de voz. Los tres martes anteriores se registraron 2,60 Mbps, lo que sigue sin ser bueno, pero en las antiguas generaciones de redes inalámbricas era lo bastante rápido para ver un vídeo de definición estándar (SD).

Otra observación que se desprende del análisis de la velocidad de descarga de todos los proveedores es que la velocidad disminuyó desde el principio del apagón (de 15.00 a 16.00 horas) hasta la mitad del mismo (de 17.00 a 22.00 horas). Una explicación podría ser la carga de la red mencionada antes, pero parece poco probable, ya que el patrón normal de picos de carga se habría visto totalmente interrumpido por el apagón. Una segunda explicación podría ser que se agotaran las baterías de reserva de los emplazamientos de las redes móviles. Es decir, si, por ejemplo, cada emplazamiento tuviera un par de horas de batería de reserva, y algunos emplazamientos también tuvieran generadores que entraran en funcionamiento una vez agotadas las baterías, podría observarse un patrón como éste.

La SUBTEL, organismo regulador de las telecomunicaciones en Chile, ha sido citada en la prensa tecnológica por estudiar la posibilidad de aumentar a seis horas la supuesta reserva de cuatro horas. El refuerzo de la red, ya sea contra cortes de electricidad u otras interrupciones como catástrofes naturales, es fundamental para la resistencia de la red.  

Los datos de Ookla pueden ofrecer información sobre el rendimiento, la fiabilidad y la resistencia de la red. Para obtener más información sobre los datos y perspectivas de Speedtest Intelligence, póngase en contacto con nosotros ®aquí.


Ookla retains ownership of this article including all of the intellectual property rights, data, content graphs and analysis. This article may not be quoted, reproduced, distributed or published for any commercial purpose without prior consent. Members of the press and others using the findings in this article for non-commercial purposes are welcome to publicly share and link to report information with attribution to Ookla.

| December 20, 2021

Starlink Expands but Q3 2021 Performance Flattens in Some Areas


Satellite internet is making headlines across the globe as Starlink continues to launch service in new countries and Viasat plans to acquire Inmarsat. We’re here to check in on our ongoing series on satellite internet performance around the globe with fresh data from Q3 2021 to see if Starlink’s performance is holding up and how satellite internet compares to fixed broadband in 12 countries.

United States: Starlink fastest, speeds decreasing

Consumers in the U.S. looking to use satellite service to connect to the internet will find that performance was mostly flat when comparing Q3 2021 to Q2 2021. Starlink’s median download speed decreased from 97.23 Mbps during Q2 2021 to 87.25 Mbps in Q3 2021, which could be a function of adding more customers. HughesNet followed distantly at 19.30 Mbps (comparable to the 19.73 Mbps we saw in Q2 2021) and Viasat third at 18.75 Mbps (18.13 Mbps in Q2 2021). For comparison, the median download speed for all fixed broadband providers in the U.S. during Q3 2021 was 119.84 Mbps (115.22 Mbps in Q2 2021).

ookla_satellite-performance_us_1221-01-1

Starlink’s median upload speed of 13.54 Mbps (down from 13.89 Mbps in Q2 2021) was much closer to that on all fixed broadband (18.03 Mbps in Q3 2021 and 17.18 Mbps in Q2 2021). Viasat and HughesNet followed at 2.96 Mbps (3.38 Mbps in Q2 2021) and 2.54 Mbps (2.43 Mbps in Q2 2021), respectively.
As we saw last quarter, Starlink, which uses low earth orbit (LEO) satellites, was the only satellite internet provider with a median latency anywhere near that seen on fixed broadband in Q3 2021 (44 ms and 15 ms, respectively). Viasat and HughesNet, which both utilize higher “geosynchronous” orbits, had median latencies of 629 ms and 744 ms, respectively.

Starlink performance varies at the county level

We saw sufficient samples during Q3 2021 to analyze Starlink performance in 304 counties in the U.S. While there was about a 100 Mbps range in performance between the county with the fastest median download speed (Santa Fe County, New Mexico at 146.58 Mbps) and the county with the slowest median download speed (Drummond Township, Michigan at 46.63 Mbps), even the lower-end speeds are well above the FCC’s Baseline performance tier of at least a 25 Mbps download speed.

ookla_united_states_median_download_starlink_map_1221g-01-1

Satellite internet performance elsewhere in the world

We examined satellite internet performance in countries with an established market share to see how well their speeds compare to local fixed broadband. We’re excited to add analysis on satellite performance in Australia and Belgium this quarter.

Australia: Starlink outperformed Viasat and fixed broadband average

Starlink radically outperformed Viasat in Australia during Q3 2021 with a median download speed of 138.12 Mbps to Viasat’s 15.60 Mbps. Starlink also outpaced Viasat for median upload speed at 22.63 Mbps and 1.04 Mbps, respectively. Compared to the median download speed over all fixed broadband of 51.17 Mbps, Starlink could be an attractive alternative to traditional fixed broadband on all levels except latency where Starlink showed 42 ms vs. 10 ms for all fixed broadband combined.

ookla_satellite-performance_au_1221-01-1

Belgium: Starlink dramatically faster than fixed broadband

Starlink’s median download speed of 127.46 Mbps during Q3 2021 was dramatically faster than the country’s median download for all fixed broadband of 72.90 Mbps. At 16.73 Mbps, Starlink’s median upload speed was only slightly slower than the overall median of 17.98 Mbps. However, Starlink’s 49 ms latency was higher than the country’s average of 13 ms. Starlink was the only satellite internet provider with adequate samples to analyze in Belgium during Q3 2021.

ookla_satellite-performance_be_1221-01

Brazil: Viasat close to national average

Viasat’s median download speed in Brazil improved to 66.32 Mbps during Q3 2021 (up from 60.30 Mbps in Q2 2021. This was close to the national median for fixed broadband of 71.50 Mbps. Viasat’s median upload speed (1.06 Mbps) was much slower, however, than that on fixed broadband (36.37 Mbps), and Viasat’s latency was much higher (615 ms vs 6 ms).

ookla_satellite-performance_br_1221-01-1

Canada: Starlink performance relatively flat

Our previous article showed that Starlink’s median download speed exceeded that of fixed broadband in Canada during Q2 2021 (86.92 Mbps vs. 84.24 Mbps). In Q3 2021, Starlink’s median download speed decreased slightly to 84.55 Mbps while that over all fixed broadband increased to 90.67 Mbps. This is in line with what we expect to see on new technologies as additional users are added to a system. Starlink’s median upload speed was slower than fixed broadband (13.87 Mbps vs. 20.67 Mbps). Latency on Starlink was much higher (56 ms vs. 12 ms). Starlink is still a viable alternative to fixed broadband in Canada, especially for consumers without access to other options.

ookla_satellite-performance_ca_1221-01-1

Starlink faster than overall fixed broadband in 5 provinces

Starlink showed enough samples to analyze performance in nine out of 10 provinces in Canada during Q3 2021. Starlink’s Q3 2021 median download speed was faster than the median for all fixed broadband in five provinces: Manitoba (81.04 Mbps vs. 65.91 Mbps), Nova Scotia (109.60 Mbps vs. 99.82 Mbps), Prince Edward Island (118.02 Mbps vs. 46.86 Mbps), Quebec (92.59 Mbps vs. 72.07 Mbps) and Saskatchewan (97.67 Mbps vs. 57.59 Mbps). Download speeds were comparable between Starlink and overall fixed broadband in New Brunswick (104.56 Mbps vs. 104.28 Mbps), and overall fixed broadband was faster than Starlink in Alberta (92.65 Mbps vs. 82.48 Mbps), British Columbia (111.36 Mbps vs. 87.34 Mbps) and Ontario (86.26 Mbps vs. 79.54 Mbps).

ookla_canada_median_download_starlink_map_1221g-01

Chile: HughesNet slower than fixed broadband average

HughesNet was hard pressed to compete with Chile’s fixed broadband, which ranked fourth in the world during October 2021. HughesNet showed a 15.21 Mbps median download speed compared during Q3 2021 with the country’s fixed broadband average of 133.81 Mbps during the same period. Median upload speeds also showed a wide gap (3.50 Mbps for HughesNet to 62.18 Mbps on fixed broadband), and HughesNet’s latency was very high (626 ms vs. 8 ms).

ookla_satellite-performance_cl_1221-01-1

Colombia: HughesNet slow but improving

HughesNet’s median download speed increased in Q3 2021 to 12.12 Mbps (up from 9.28 Mbps during Q2 2021), compared with Colombia’s 46.08 Mbps for fixed broadband overall (35.90 Mbps in Q2 2021). Median upload speed was also slower using the satellite internet provider (3.05 Mbps) than fixed broadband (10.50 Mbps), and latency was much higher on satellite (753 ms vs. 15 ms).

ookla_satellite-performance_co_1221-01-1

France: Starlink speeds decreasing, remains faster than fixed broadband average

Starlink users in France saw a median download speed of 102.15 Mbps in Q3 2021 (down from 139.39 Mbps in Q2 2021, likely due to increased usage). Starlink’s download speed easily beat the country-wide median for fixed broadband of 75.47 Mbps (up from 70.81 Mbps in Q2 2021). Starlink’s upload speed during Q3 2021 was slower than the fixed broadband median (19.84 Mbps vs. 56.66 Mbps), and Starlink’s latency was higher (54 ms vs. 13 ms).

ookla_satellite-performance_fr_1221-01

Germany: Starlink faster than country average for fixed broadband

Starlink’s median download speed in Germany of 95.40 Mbps was much faster than the country median of 60.99 Mbps during Q3 2021. Starlink was slightly slower for upload speed than overall fixed broadband (17.63 Mbps vs. 21.05 Mbps) and Starlink showed a higher latency (45 ms vs. 15 ms).

ookla_satellite-performance_de_1221-01-1

Mexico: Viasat faster than HughesNet for downloads

Viasat, with a median download speed of 14.94 Mbps during Q3 2021 (up from 13.95 Mbps in Q2 2021), was faster than HughesNet (10.64 Mbps in Q3 2021, down from 11.92 Mbps in Q2 2021) but slower than the country’s median for fixed broadband (33.14 Mbps in Q3 2021, 29.99 Mbps in Q2 2021). HughesNet was slightly faster than Viasat for upload speed during Q3 2021 (3.21 Mbps vs. 2.03 Mbps). While Viasat’s latency was high (675 ms vs 12 ms for fixed broadband), it was lower than HughesNet’s (748 ms).

ookla_satellite-performance_mx_1221-01-1

New Zealand: Starlink slowed slightly, remained faster than fixed broadband average

Starlink’s Q3 2021 median download speed (120.10 Mbps, down from 127.02 Mbps in Q2 2021, likely due to increased usage) was much faster than New Zealand’s median fixed broadband download speed (84.98 in Q3 2021 up from 78.85 Mbps in Q2 2021). Starlink was slower than New Zealand’s overall fixed broadband for Q3 2021 upload speed (16.87 Mbps vs. 23.62 Mbps). While Starlink’s median latency improved from 101 ms in Q2 2021 to 81 ms in Q3 2021, it was still slower than New Zealand’s median for all fixed broadband of 7 ms during Q3 2021.

ookla_satellite-performance_nz_1221-01-1

United Kingdom: Starlink nearly twice as fast as fixed broadband average

Starlink showed a much faster median download speed in the U.K. during Q3 2021 (111.66 Mbps, up from 108.30 Mbps in Q2 2021) than the country’s median for fixed broadband (53.16 Mbps in Q3 2021, up from 50.14 Mbps in Q2 2021). Starlink’s upload speed was comparable to the median for all fixed broadband in the U.K. (16.02 Mbps vs. 15.77 Mbps), and the latency was pretty good, given the distance traveled (37 ms vs. 15 ms).

ookla_satellite-performance_uk_1221-01-1

We look forward to updating this data again next quarter with new locations as satellite internet continues to become a more viable option for many. If you’re using satellite internet, take a Speedtest to help us provide an accurate picture of real-world performance.

Ookla retains ownership of this article including all of the intellectual property rights, data, content graphs and analysis. This article may not be quoted, reproduced, distributed or published for any commercial purpose without prior consent. Members of the press and others using the findings in this article for non-commercial purposes are welcome to publicly share and link to report information with attribution to Ookla.

| November 30, 2022

Starlink Speeds Dipped Slightly During Q3 2022 as the Space Race Heats up

Ookla® has exciting, fresh data from Q3 2022 for SpaceX’s Starlink, HughesNet, and Viasat in North and South America, as well as new Starlink markets we haven’t yet featured in our ongoing series on satellite internet. With accelerating competition on the horizon for 2023, we’ve been eager to see how Starlink continues to perform, especially as building new fiber connections continues to be costly around the world. 

This analysis includes results from five additional countries, two new providers, and expanded data for Starlink, HughesNet, and Viasat. We also examine how Starlink’s internet performance has changed over the past year in Canada, Chile, and the United States.

Starlink performance dipped once again during Q3 2022 (though only slightly)

Chart of Starlink perfromance in select North and South American countries

Perhaps a victim of their own success, Starlink download speeds dropped once again in Canada (at least 14%) and the U.S. (at least 17%) from Q2 to Q3 2022, while speeds remained roughly the same in Chile quarter over quarter. During the same period, fixed broadband performance raced ahead, improving at least 8% to 115.18 Mbps in Canada, at least 4% to 207.04 Mbps in Chile, and at least 8% to 164.13 Mbps in the U.S. 

Over the past year, as we’ve seen more users flock to sign up for Starlink (reaching 400,000 users worldwide during Q2 2022), speeds have started to decrease. Without a doubt, Starlink often can be a life-changing service for consumers where connectivity is inadequate or nonexistent. Even as speeds slow, they still provide more than enough connectivity to do almost everything consumers normally need to do, including streaming 4K video and video messaging. The biggest thing you might have issues with is if you’re trying to play multiplayer online games — even being a low-earth orbit (LEO) satellite, latency still lags far behind low-latency fixed broadband connections.

Starlink upload speeds remained roughly unchanged in all three countries we surveyed during Q3 2022, improving marginally in Canada and Chile, and essentially staying the same in the U.S. 

Starlink remains a boon for rural U.S. consumers who can afford it

Map of Starlink expansion in U.S. counties

Over the past year, Starlink has proliferated across the U.S., going from having at least 10 unique users in 776 U.S. counties, or roughly 25% of all counties during Q2-Q3 2021 to 2,399 counties in Q2-Q3 2022, or roughly 75% of counties. That marks about a 200% increase year over year, indicating consumer confidence in the provider. 

Looking at only “nonmetro” counties as defined by the U.S. Office of Management and Budget, 336 counties showed at least 10 Starlink users in Q2-Q3 2021. That was about 17% of all nonmetro counties. In Q2-Q3 2022, that rose to 1359 counties, or about 69% of nonmetro counties, marking about a 300% increase year over year. 

Starlink in Puerto Rico and the U.S. Virgin Islands had the fastest satellite internet in North America

Chart of satellite performance compared to fixed broadband internet in North America

Speedtest Intelligence® reveals that Starlink in Puerto Rico and the U.S. Virgin Islands had the fastest median download speed among satellite providers in North America at 85.88 Mbps and 85.57 Mbps during Q3 2022. Starlink in the Dominican Republic (72.01 Mbps), Canada (65.80 Mbps), Mexico (64.30 Mbps), and the U.S. (53.00 Mbps) followed. Starlink had faster median download speeds than all fixed broadband providers combined in all of these countries except Canada and the U.S., and Viasat outperformed fixed broadband in the Dominican Republic (22.92 Mbps). 

Viasat and HughesNet recorded their fastest median download speeds in Puerto Rico at 36.65 Mbps and 22.19 Mbps, respectively. Almost every satellite provider on our list reached speeds fast enough to stream high-quality video at around 20 Mbps, though latency still was much higher than fixed broadband internet.

For upload speeds, Starlink outperformed fixed broadband providers combined in the Dominican Republic (14.68 Mbps to 5.83 Mbps) and the U.S. Virgin Islands (12.59 Mbps to 8.37 Mbps). Fixed broadband providers in Canada had the fastest upload on our list at 29.29 Mbps.

Multi-server latency showed satellite internet’s limits, with the huge distances between satellite and receivers adding up to long lags — and every satellite provider with higher latencies than fixed broadband providers. However, the Dominican Republic and U.S. Virgin Islands still had higher fixed broadband multi-server latencies at 55.45 ms and 76.15 ms, respectively. Starlink in the U.S. had the lowest multi-server latency at 67.16 ms, followed by Canada (77.32 ms), and Mexico (96.42 ms), which were the only satellite options that had a multi-server latency under 100 ms.

Starlink in Brazil was the fastest satellite provider in South America

Chart of satellite performance compared to fixed broadband internet in South America

Brazilian satellite consumers weren’t lacking for fast internet options during Q3 2022, with Starlink blazing ahead among satellite providers in South America at 112.97 Mbps. Even Viasat notched a respectable median download speed of 45.15 Mbps. Starlink in Brazil was also the only satellite provider to outperform its country’s fixed broadband speeds, with ultrafast fixed broadband in Chile pulling ahead of Starlink 207.04 Mbps to 92.58 Mbps. Colombia was statistically too close to call in Q3 2022 with Starlink at 71.42 Mbps and fixed broadband at 83.76 Mbps. HughesNet trailed far behind with its fastest speed in Chile at 22.62 Mbps during Q3 2022.

For upload speeds, fixed broadband providers in every country we surveyed were faster than their satellite counterparts during Q3 2022. Starlink in Colombia had the fastest upload speed among satellite providers at 24.48 Mbps.

Speedtest Intelligence reveals multi-server latency told a similar story, with every country’s fixed broadband providers having a lower multi-server latency than their satellite counterparts. However, Starlink in Brazil and Chile had the lowest satellite multi-server latencies at 52.21 ms and 52.32 ms, respectively, during Q3 2022. Viasat and HughesNet lowest latencies were far behind with Viasat in Brazil at 670.63 ms and HughesNet in Chile at 713.04 ms.

New Q3 2022 Starlink countries have mixed results

Chart of satellite performance compared to fixed broadband internet in select countries

Speedtest Intelligence data shows Starlink data in six new countries during Q3 2022, including Colombia, the Dominican Republic, Estonia, Moldova, Norway, and the U.S. Virgin Islands. Starlink in Estonia (93.48 Mbps), the U.S. Virgin Islands (85.57 Mbps), and the Dominican Republic (72.01 Mbps) were much faster options than fixed broadband providers in their respective countries during Q3 2022. Starlink in Norway (113.86 Mbps) and Colombia (71.42 Mbps) were statistically in the same range as fixed broadband providers in their respective countries during the same time period. Starlink in Moldova (53.11 Mbps) was much slower than all fixed broadband providers combined (105.65 Mbps), though for rural folks with fewer options, still provides a speedy connection.

In all six countries, Starlink underperformed all fixed broadband providers combined for upload speed during Q3 2022, lagging behind from 12.59 Mbps to 24.48 Mbps, while median fixed broadband upload speeds ranged from 30.66 Mbps to 93.80 Mbps.

Multi-server latency was generally much higher than fixed broadband, with Starlink in Colombia showing the lowest multi-server latency at 58.65 ms, followed by Norway (73.00 ms), Estonia (85.37 ms), Moldova (105.26 ms), the Dominican Republic (110.62 ms), and the U.S. Virgin Islands (113.12 ms). 

The great space race is on

There is no doubt a new space race for connectivity is being waged across the world. Competitors are pouring hundreds of millions and even billions into unlocking the celestial connectivity dilemma. Here are some major updates about what’s next for various different satellite competitors:

With the competition for satellite connectivity heating up and Starlink facing potentially more competition in the coming months, we’ll be keeping our eyes to the sky to see how connectivity is performing. We’ll continue our series next quarter with Q3-Q4 2022 data from Europe and Oceania and any new countries where Starlink launches, and be back with North and South America data in Q2 2023. In the meantime, be sure to download the Speedtest app for Windows and Mac computers or for iOS or Android for devices and see how your satellite internet stacks up to our findings.

Ookla retains ownership of this article including all of the intellectual property rights, data, content graphs and analysis. This article may not be quoted, reproduced, distributed or published for any commercial purpose without prior consent. Members of the press and others using the findings in this article for non-commercial purposes are welcome to publicly share and link to report information with attribution to Ookla.

| September 20, 2022

Starlink Slowed in Q2, Competitors Mounting Challenges

Ookla® has covered SpaceX’s Starlink satellite internet for over a year now with our ongoing series on satellite internet performance. We’ve seen Starlink launch in new locations across the world, and while some speeds have shown signs of slowing down from their initial launches, the newly announced T-Mobile partnership with Starlink could extend the benefit of satellite connections to the mobile market.

Today, we have fresh data on satellite performance during Q2 2022 in Europe, Oceania, North America, and South America. This analysis includes results from eight additional countries, two new providers, and expanded data for Starlink, HughesNet, and Viasat. We also examine how Starlink’s internet performance has changed over the past year in Canada, France, Germany, New Zealand, the United Kingdom, and the United States.

Starlink speeds decreased in every country we surveyed over the past year as more users sign up for service

Chart of Starlink performances in select countries

Speedtest Intelligence® reveals that median download speeds for Starlink fell across Canada, France, Germany, New Zealand, the U.K, and the U.S., dropping between 9% and 54% from Q2 2021 to Q2 2022 as more users signed up for the service. However, Starlink still reached a median download speed of at least 60 Mbps in North America during Q2 2022, which is more than enough for at least one connected device to do most everything on the internet including streaming video, downloading games, and chatting on video with friends and family.

Upload speeds also slowed on Starlink, with speeds decreasing across all of the countries we’ve tracked over the past year. Latency fared a little better with latency remaining relatively flat (though high when compared to fixed broadband) in most countries. New Zealand was the outlier, with latency dropping 23 ms. For most users, we still suspect these dips are still worthwhile for areas that have no service, slow service, or few affordable options for fast internet.

Starlink in Puerto Rico was the fastest satellite provider in North America

Chart of Satellite performance versus fixed broadband internet in North America

Starlink in Puerto Rico had the fastest satellite internet in North America during Q2 2022 with a median download speed of 112.22 Mbps, followed by Starlink in Mexico (80.17 Mbps), Canada (75.73 Mbps), and the U.S. (62.53 Mbps). Starlink in Puerto Rico and Mexico was faster than their countries’ fixed broadband providers combined (74.80 Mbps and 45.50 Mbps, respectively), while fixed broadband in the U.S. (150.12 Mbps) and Canada (106.41 Mbps) was faster than each country’s satellite providers.

In every country except Mexico, fixed broadband upload speeds were faster than satellite speeds. Starlink in Mexico edged out fixed broadband providers 14.48 Mbps to 12.20 Mbps. Latency was higher for every satellite provider compared to fixed broadband. Starlink in the U.S. had the lowest median latency among satellite providers at 48 ms.

Starlink outperformed fixed broadband average in 16 European countries

Chart of Satellite performance versus fixed broadband internet in Europe

Speedtest Intelligence shows Starlink was fast in Europe during Q2 2022, outperforming fixed broadband median download speed in 16 countries and reached download speeds over 100 Mbps in 10 countries. In contrast, fixed broadband only achieved median download speeds over 100 Mbps in six countries: Romania, Spain, Portugal, France, Hungary, and the Netherlands during Q2 2022. Starlink was fastest for median download speed in Portugal at 123.01 Mbps, the Netherlands (122.43 Mbps), Austria (112.01 Mbps), France (110.98 Mbps), and Belgium (110.40 Mbps). Romania and Spain were the only countries to have fixed broadband beat Starlink for fastest median download speed, achieving 131.41 Mbps and 127.19 Mbps, respectively.

For upload, Starlink in Greece and Austria was the only satellite provider to achieve faster upload speeds than all fixed broadband providers combined at 19.34 Mbps to 5.14 Mbps, and to 17.14 Mbps to 15.90 Mbps, respectively. Fixed broadband providers in Spain (99.21 Mbps), Romania (94.23 Mbps), Sweden (92.77 Mbps), France (88.22 Mbps), Lithuania (83.54 Mbps), and Portugal (73.13 Mbps) all recorded median upload speeds greater than 70 Mbps, with the closest satellite provider being Starlink in Portugal at 28.52 Mbps.

All satellite providers fell far behind fixed broadband providers in the whole of Europe for latency during Q2 2022. Starlink in Spain and the United Kingdom recorded the lowest satellite latencies at 37 ms and 39 ms, respectively — still a far cry from the closest fixed broadband latency, which was 14 ms in Germany, Greece, and Italy.

Starlink in Brazil was the fastest satellite provider in South America

Chart of Satellite performance versus fixed broadband internet in South America

Our analysis of Speedtest Intelligence data found Starlink in Brazil was the fastest satellite provider in South America with a median download speed of 128.38 Mbps during Q2 2022, followed by Starlink in Chile at 94.79 Mbps. Chilean fixed broadband internet was still much faster for those who could get access to it. The Speedtest Global Index™ found Chile had the second fastest fixed broadband internet in the world with a median download speed of 211.43 Mbps during August 2022. Starlink in Brazil was the only satellite provider to be faster than its country’s fixed broadband providers combined.

Like last quarter, South American fixed broadband providers surpassed satellite providers in each respective upload speeds during Q2 2022. All satellite providers had a higher median latency than fixed broadband, though Starlink in Brazil and Chile had latencies of 38 ms.

Starlink in New Zealand was the fastest satellite provider in Oceania 

Chart of Satellite performance versus fixed broadband internet in Oceania

Starlink’s fastest median download speed in Oceania was in New Zealand at 105.99 Mbps, though this still fell short of fixed broadband providers in the country. Starlink in Australia was faster than fixed broadband providers by a wide margin at 102.76 Mbps to 51.46 Mbps during Q2 2022. Starlink outperformed fixed broadband providers in new-to-our-list Tonga 45.25 Mbps to 22.32 Mbps. 

New Zealand’s fixed broadband dominated for the fastest median upload speed in Oceania at 87.29 Mbps during Q2 2022, while Australia’s fixed broadband fell far behind with an upload speed of 17.86 Mbps. Both speeds were still faster than Starlink’s median upload speeds in New Zealand and Australia (12.31 Mbps and 10.45 Mbps, respectively). Tonga didn’t have a statistical winner for fastest upload speed, but Starlink reached 19.26 Mbps and fixed broadband 18.11 Mbps. Fixed broadband also had a lower median latency than Starlink during Q1 2022, which clocked in at 49 ms in Australia, 78 ms in New Zealand, and 98 ms in Tonga.

Biggest questions lie ahead, but competition will be good for consumers

Satellite connectivity is coming to mobile, with Starlink’s new partnership with T-Mobile and new mobile devices becoming satellite enabled. This will cause ripples across North America, which is a net positive for consumers who live in areas with low mobile and fixed broadband connectivity. Connecting with the world won’t be a question of how anymore, it will be a question of how good your experience is. That’s hopefully a win-win for consumers, especially as more providers vie for the fastest and best satellite experience — a true global space race.

Starlink isn’t stopping there — they’re trying to get into airplanes, cruise ships, and cars. But they’re not the only satellite provider making moves; Viasat is launching its Viasat-3 fleet, OneWeb is combining business with Eutelsat, and Amazon is sending 3,236 Project Kuiper satellites into orbit. We’ll be here monitoring the skies in our ongoing satellite series. Take a Speedtest® to help us provide an accurate and more complete picture of real-world performance. And if we’re missing data on your satellite network, send us a screenshot of your speed on Twitter or Facebook.

Ookla retains ownership of this article including all of the intellectual property rights, data, content graphs and analysis. This article may not be quoted, reproduced, distributed or published for any commercial purpose without prior consent. Members of the press and others using the findings in this article for non-commercial purposes are welcome to publicly share and link to report information with attribution to Ookla.