
After years of preparation, 5G is finally rolling out in city after city around the world. Also known as “Fifth Generation” Wireless Technology, 5G is the biggest thing to come to mobile after nearly a decade of 4G LTE, offering theoretical speeds up to 5 times faster. Not every city currently benefits, however, as 5G availability depends on a variety of factors including government regulation and technological improvements by mobile operators. If you’re as eager as we are to see which cities are 5G ready, you’ll love the Ookla 5G Map™.
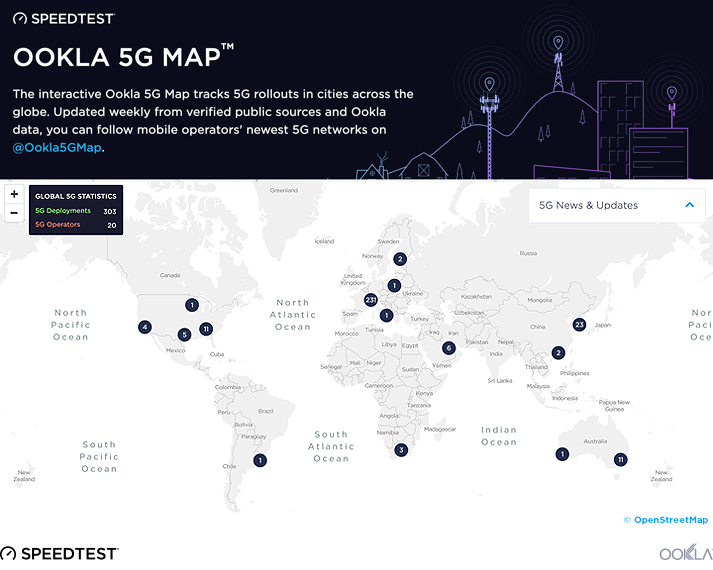
Introducing the Ookla 5G Map™
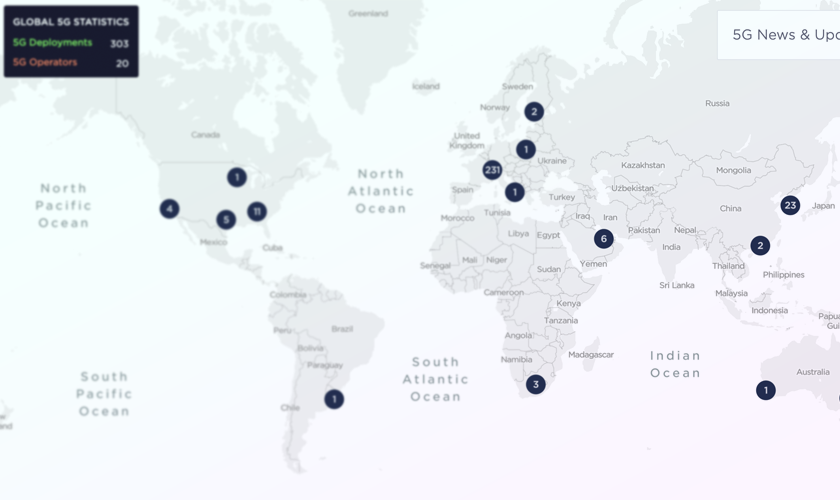
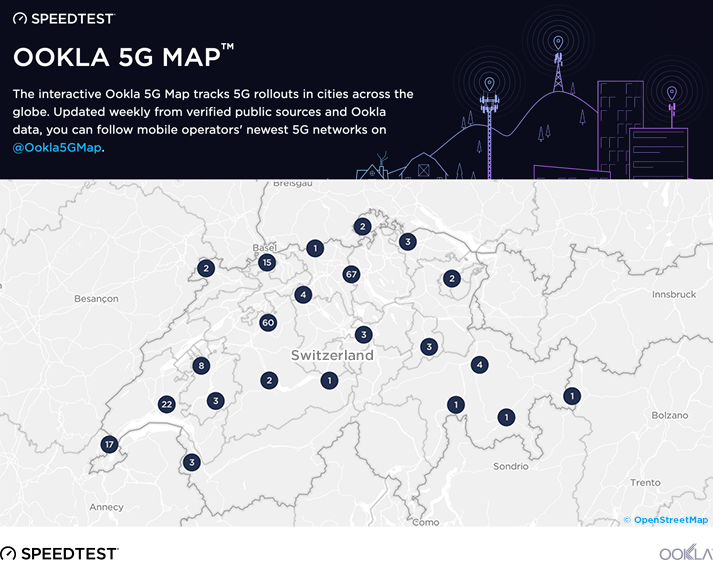
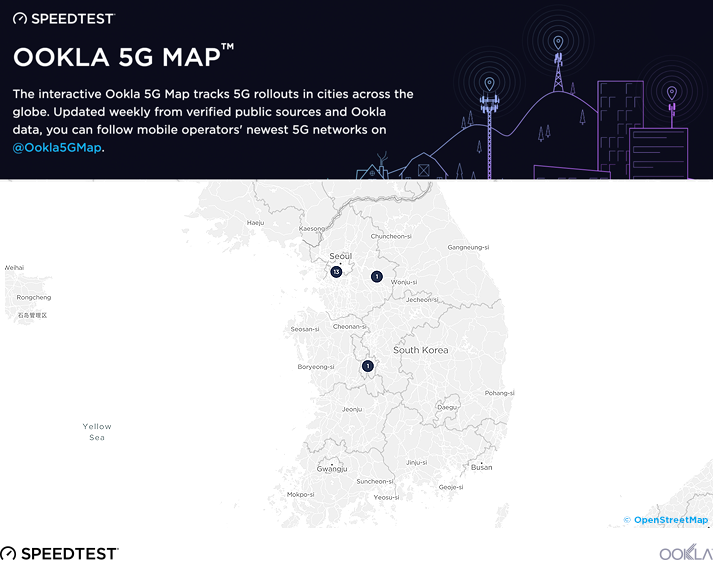
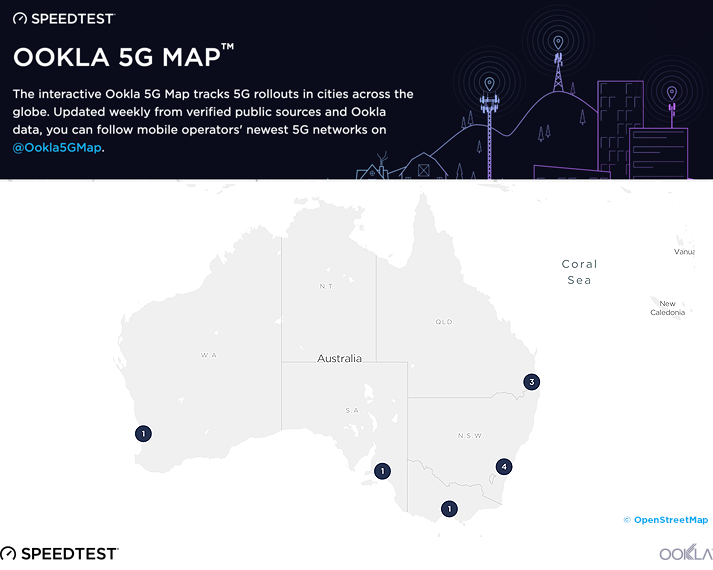
The interactive Ookla 5G Map tracks 5G rollouts in cities across the globe. We update the map weekly with the information available to us about 5G deployments as they occur.
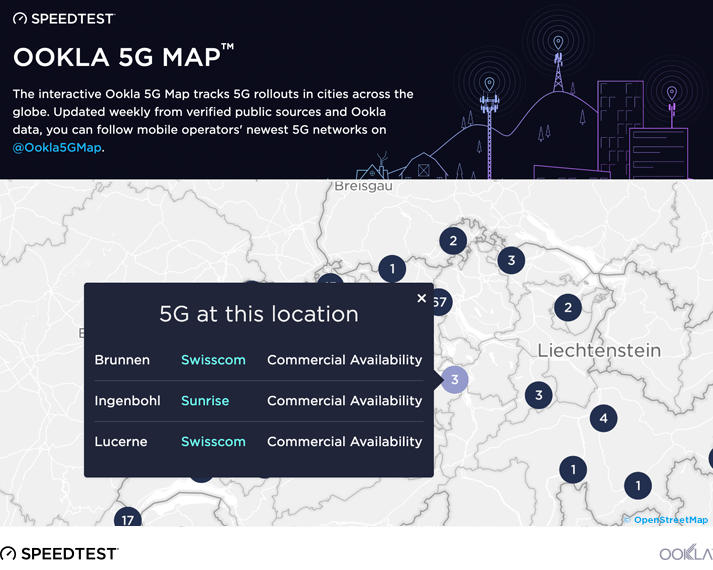
Click on an individual pin to see more detailed information including city name, a list of operators who have rolled out 5G, and the status of the 5G network in the area. The status is divided into two types of availability: limited and commercial. Limited availability is when a 5G network is present but devices are limited to select users, usually in a testing environment. Commercial availability refers to a 5G network where any consumer can purchase a device for use on this network.
At this point all of the deployments we’ve mapped are 5G New Radio (NR). To learn more about the types of 5G and other network intricacies, visit our comprehensive 5G guide. As different types of networks launch we’ll continue to expand this map to provide you with accurate, in-depth information.
Currently, the majority of identified deployments are based on corporate press releases and other publicly available communications. As deployments continue to become commercially available and tests taken with Speedtest use a 5G connection, identified deployments will also be based on Ookla data.
Get regular updates on the progress of 5G by following @Ookla5GMap on Twitter where we will share network rollouts as they are added. You can also find this Twitter feed directly to the right of the interactive 5G map where the ten most recent updates will be displayed.
Where we’ve seen 5G so far
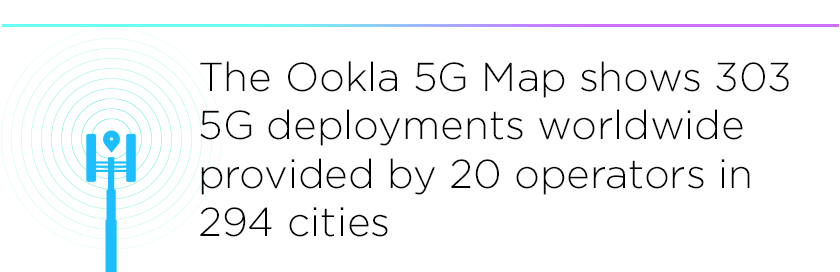
At time of launch, we’ve identified 20 operators that have deployed 5G networks in 294 locations across the globe. As certain locations benefit from multiple rollouts, the total number of deployments comes to 303. Swiss operators Swisscom and Sunrise are leading the 5G charge by providing 5G network accessibility in a combined total of 217 cities, each with commercial availability. Across the ocean, 21 cities in the United States have 5G availability. All but two of these rollouts being launched by AT&T with limited availability. Verizon launched their 5G network with commercial availability in two Midwest cities: Chicago and Minneapolis.
In South Korea we are tracking 16 cities with limited availability and two with commercial availability for 18 total 5G rollouts. The country’s capital city of Seoul benefits from 5G accessibility served by all three major operators: SK Telecom, LG Uplus and KT Telecom.
Telstra and Optus in Australia operate limited availability 5G networks in 10 cities, many of these in the more populated coastal regions. We’re also tracking 5G rollouts in a number of European countries (Estonia, Finland, Spain and Italy) as well as in Qatar, South Africa and United Arab Emirates.
If you’re a consumer who is already on 5G, share your Speedtest results by tweeting to @Speedtest.
If you are an operator planning to release your 5G network, we welcome your feedback. Tweet details of your release @Ookla5GMap or e-mail press@ookla.com and we will add your location to the map when it’s live. In the meantime, our researchers will be hard at work tracking global 5G announcements as they happen.
Editor’s note: This article was updated on May 14, 2019 to clarify the number of deployments in Switzerland and Australia versus the number of cities served. We’ve also since updated the map to include a new “Pre-Release” status. Check the Ookla 5G Map for the latest information.
Ookla retains ownership of this article including all of the intellectual property rights, data, content graphs and analysis. This article may not be quoted, reproduced, distributed or published for any commercial purpose without prior consent. Members of the press and others using the findings in this article for non-commercial purposes are welcome to publicly share and link to report information with attribution to Ookla.