| June 27, 2022

Dtac and True Merger Talks Point to a Need to Address Unequal Footing in Thailand's 5G

The planned merger between True Corporation (“True”) and Total Access Communication (“dtac”) in Thailand is currently awaiting regulatory approval. The announcement of the merger or “amalgamation” as the involved companies like to call it, wasn’t unexpected as rumors around dtac’s owner Telenor’s plans to exit Thailand circulated for a while. Besides, Telenor hopes to merge its Malaysian operations and it sold its operations in Myanmar in March 2022. On November 20, 2021, True and dtac entered a non-binding memorandum of understanding to pursue the “amalgamation.” In April 2022, the two companies received the approval from their shareholders for the merger and to create a new listed company — NewCo — despite not knowing what the conditions or measures of the deal will be. In June 2022, a legal subcommittee of NBTC concluded that the telecom regulator has the power to approve or dissolve the planned merger. In this article we will assess the impact of the proposed merger on the Thai telecommunications market by examining its current state.

Key takeaways

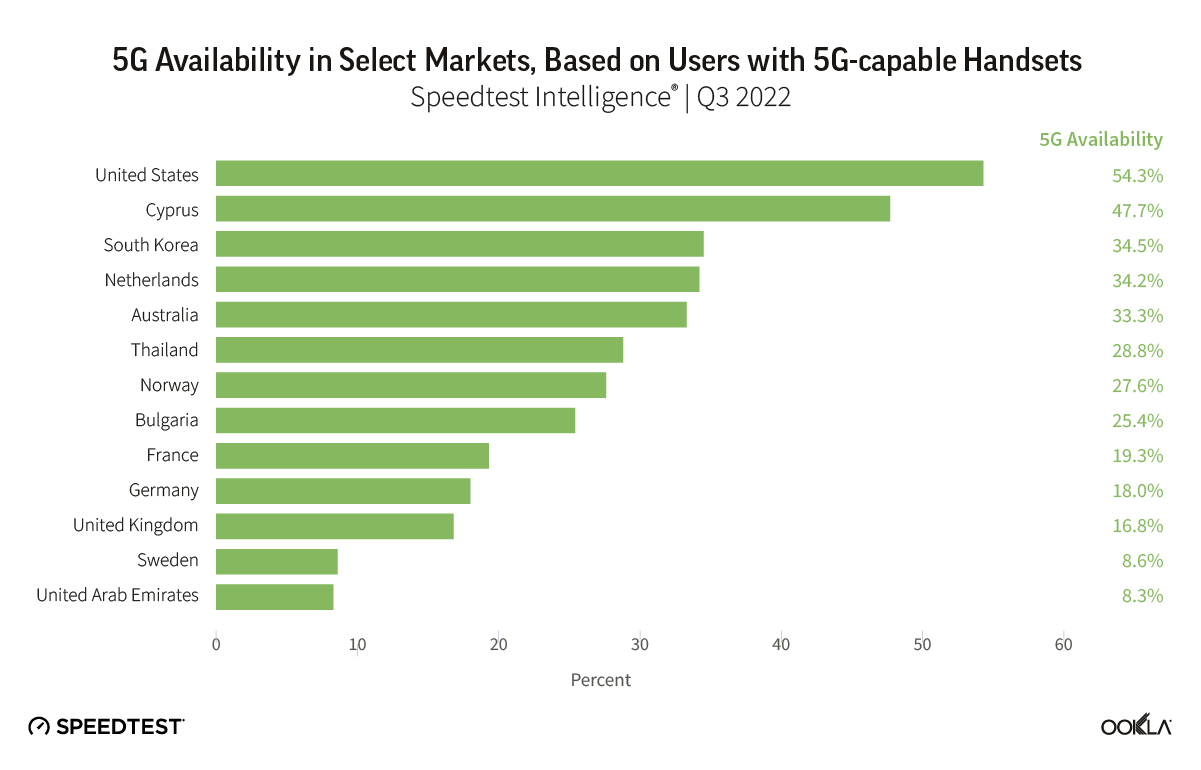
  • Thailand’s 5G performed well compared to its regional counterparts due to a timely 5G network roll out and dedicated 5G spectrum availability.
  • Based on mobile performance, Thailand is a market dominated by one player — AIS. It had a lead in terms of 4G performance and that lead has been extended further with 5G. The third operator in the market, dtac, is not competitive on 5G due to its limited spectrum holdings (dtac’s 5G performance is equivalent to AIS’ 4G).
  • The merged operator, NewCo, could provide more robust competition to AIS while also having the scale to invest in 5G. While this will turn Thailand into a two-player market, examples of mergers and acquisitions in other countries suggest a number of measures will be most likely put in place: spectrum divestment, more capacity allocated to MVNOs, converged and innovative offerings, all of which can potentially offset its negative impact.

Thailand’s 5G performs well compared to its regional counterparts

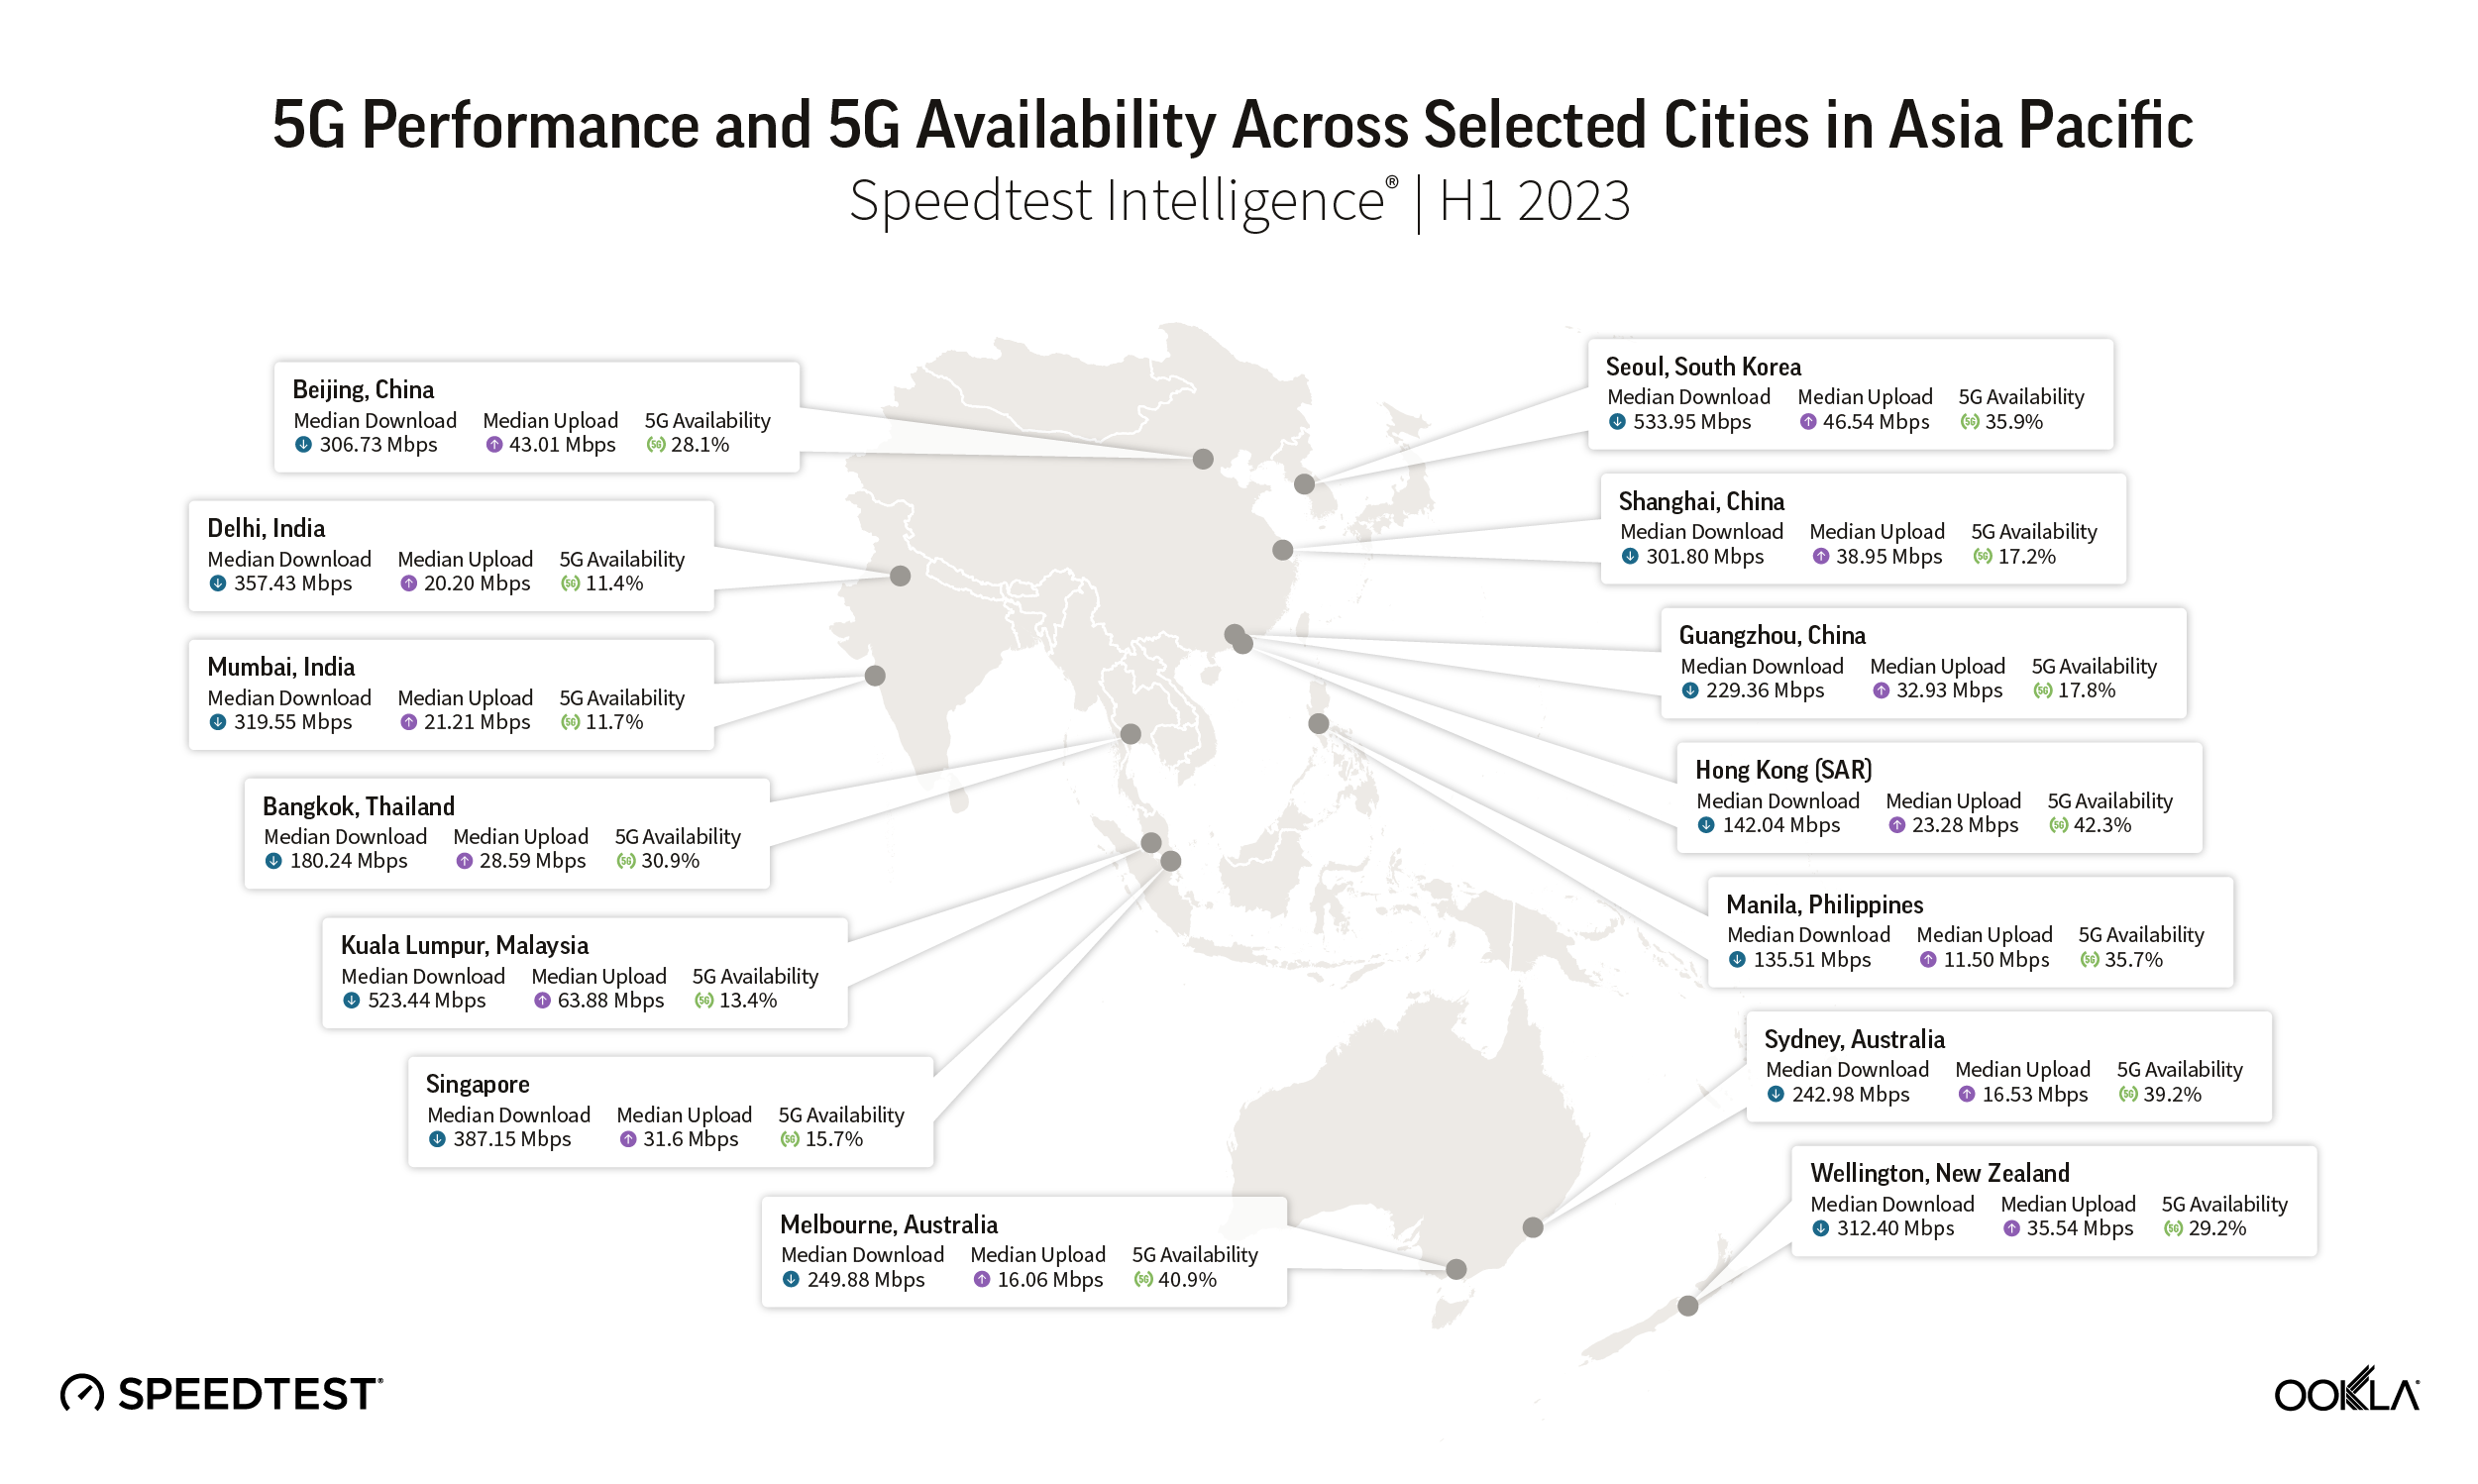
5G deployment in Thailand is comparable in terms of 5G speeds and 5G Availability with more developed countries in the region such as Singapore, even though the country previously lagged behind its peers in assigning 3G and LTE spectrum.

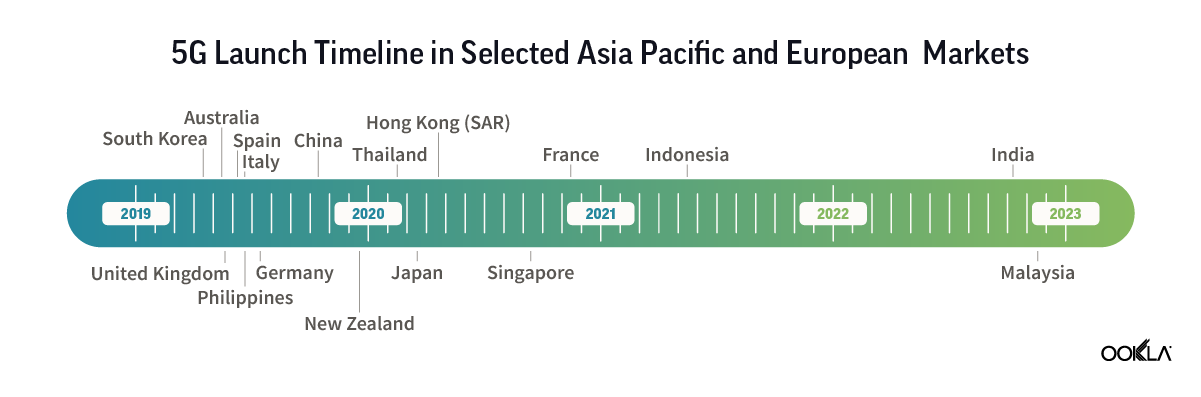
In our recent article, we concluded that the country’s regulator, The National Broadcasting and Telecommunications Commission (NBTC), has been instrumental in establishing Thailand as a leading 5G market in the region. In fact, Thailand was one of the first markets to launch 5G in the Asia-Pacific region, with AIS and TrueMove H both launching commercial 5G services in Q1 2020, shortly after the conclusion of the country’s 5G auction. The Thai government plays an active role in ensuring 5G can bring societal benefits, e.g., improving government services and extending healthcare access. Some of the campaigns include establishing a telemedicine center, setting up a 5G network for smart city management, developing a pilot project on digital farming in Songkhla Lake Basin, and using 5G connectivity for pandemic related measures as tourism was reopening in Phuket.  

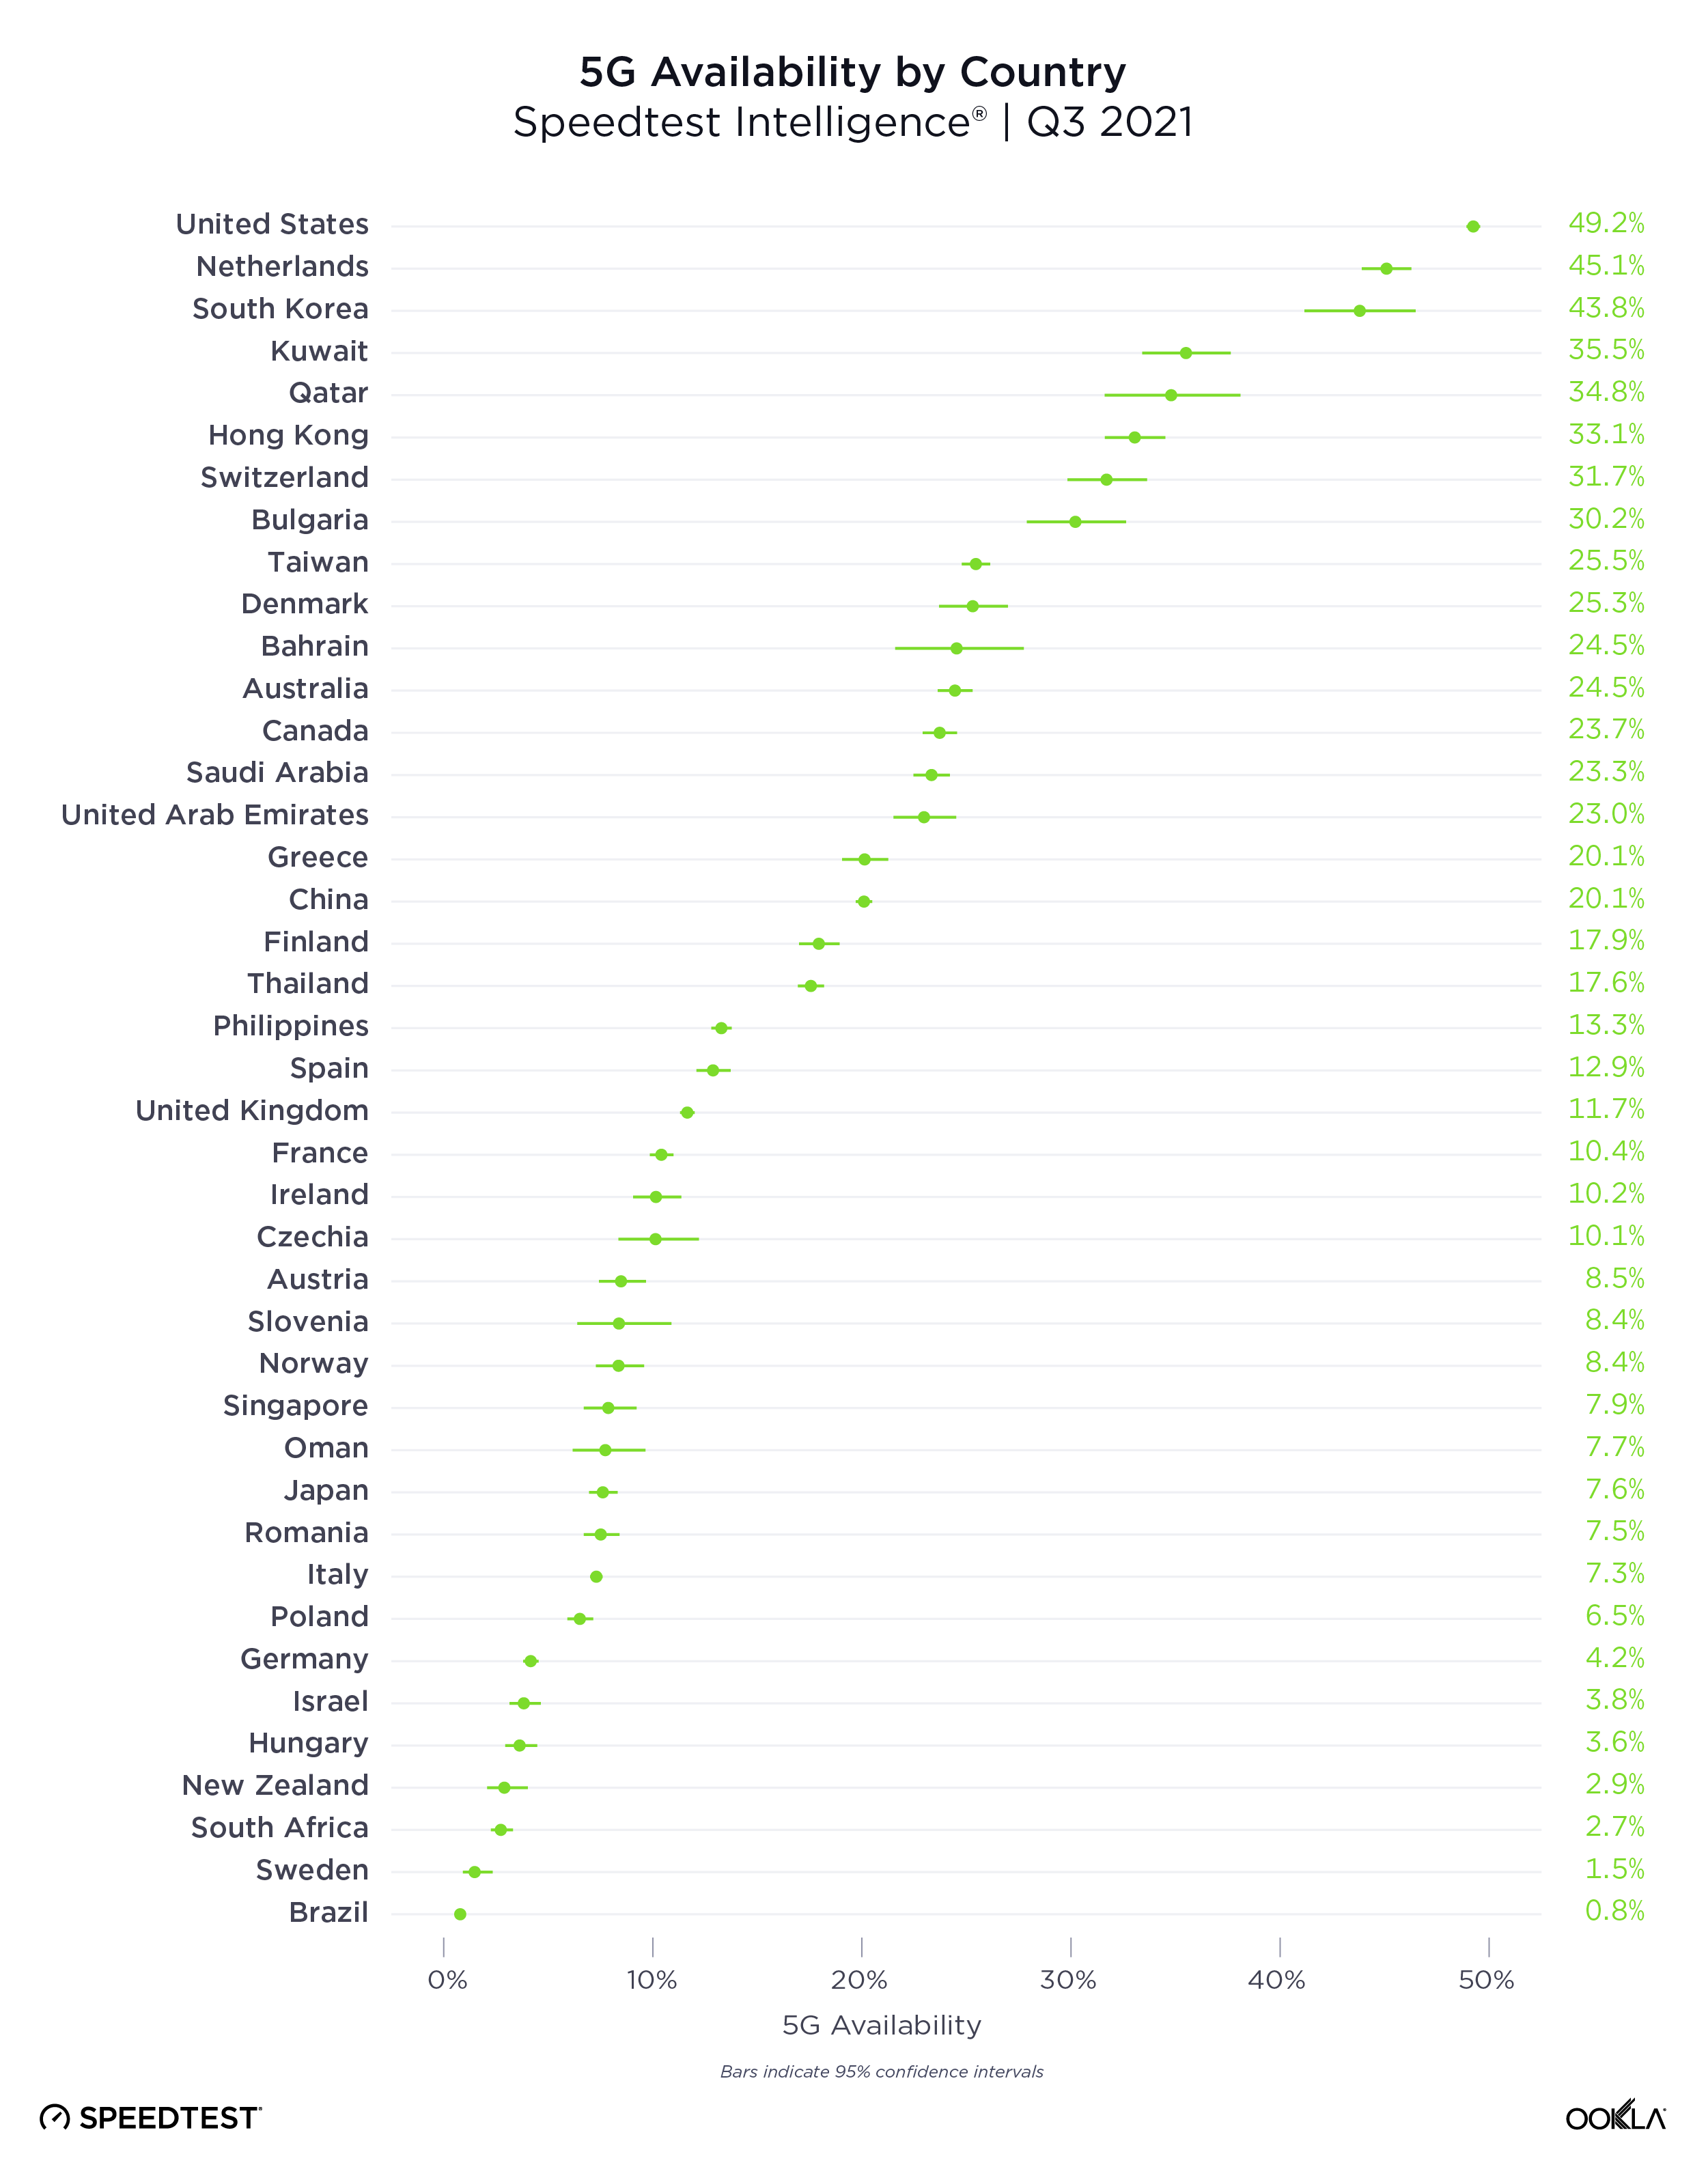
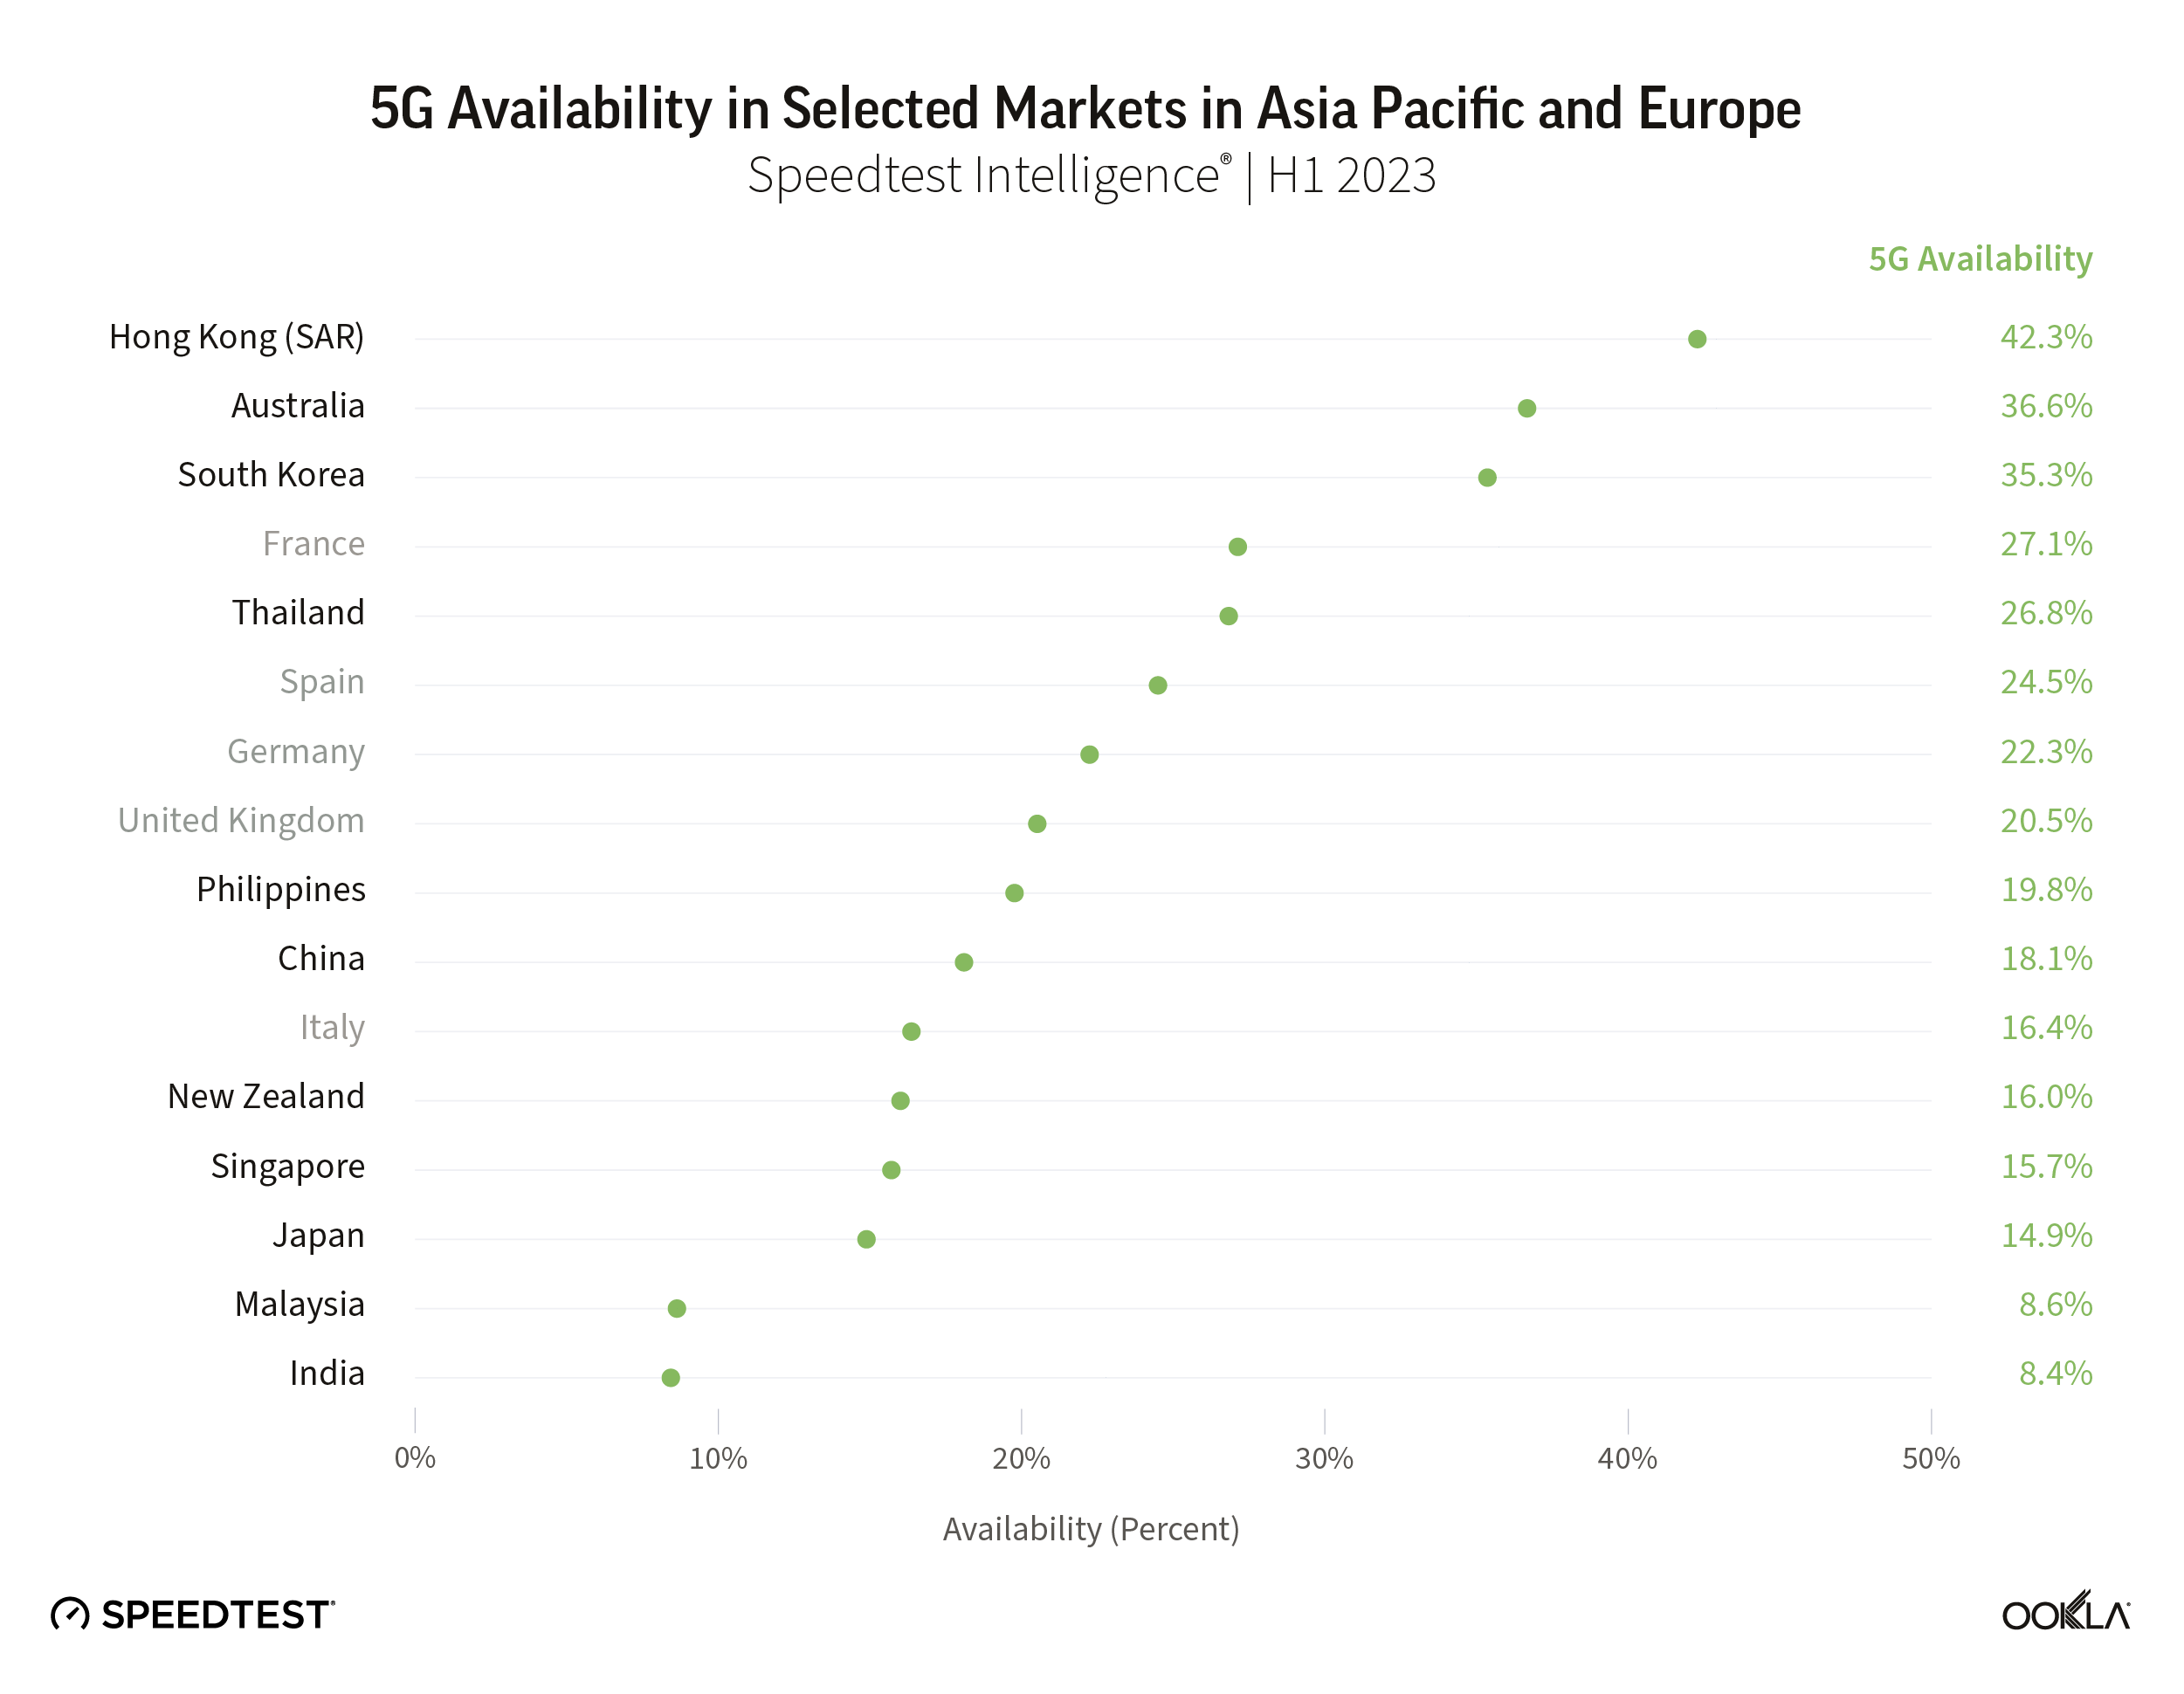
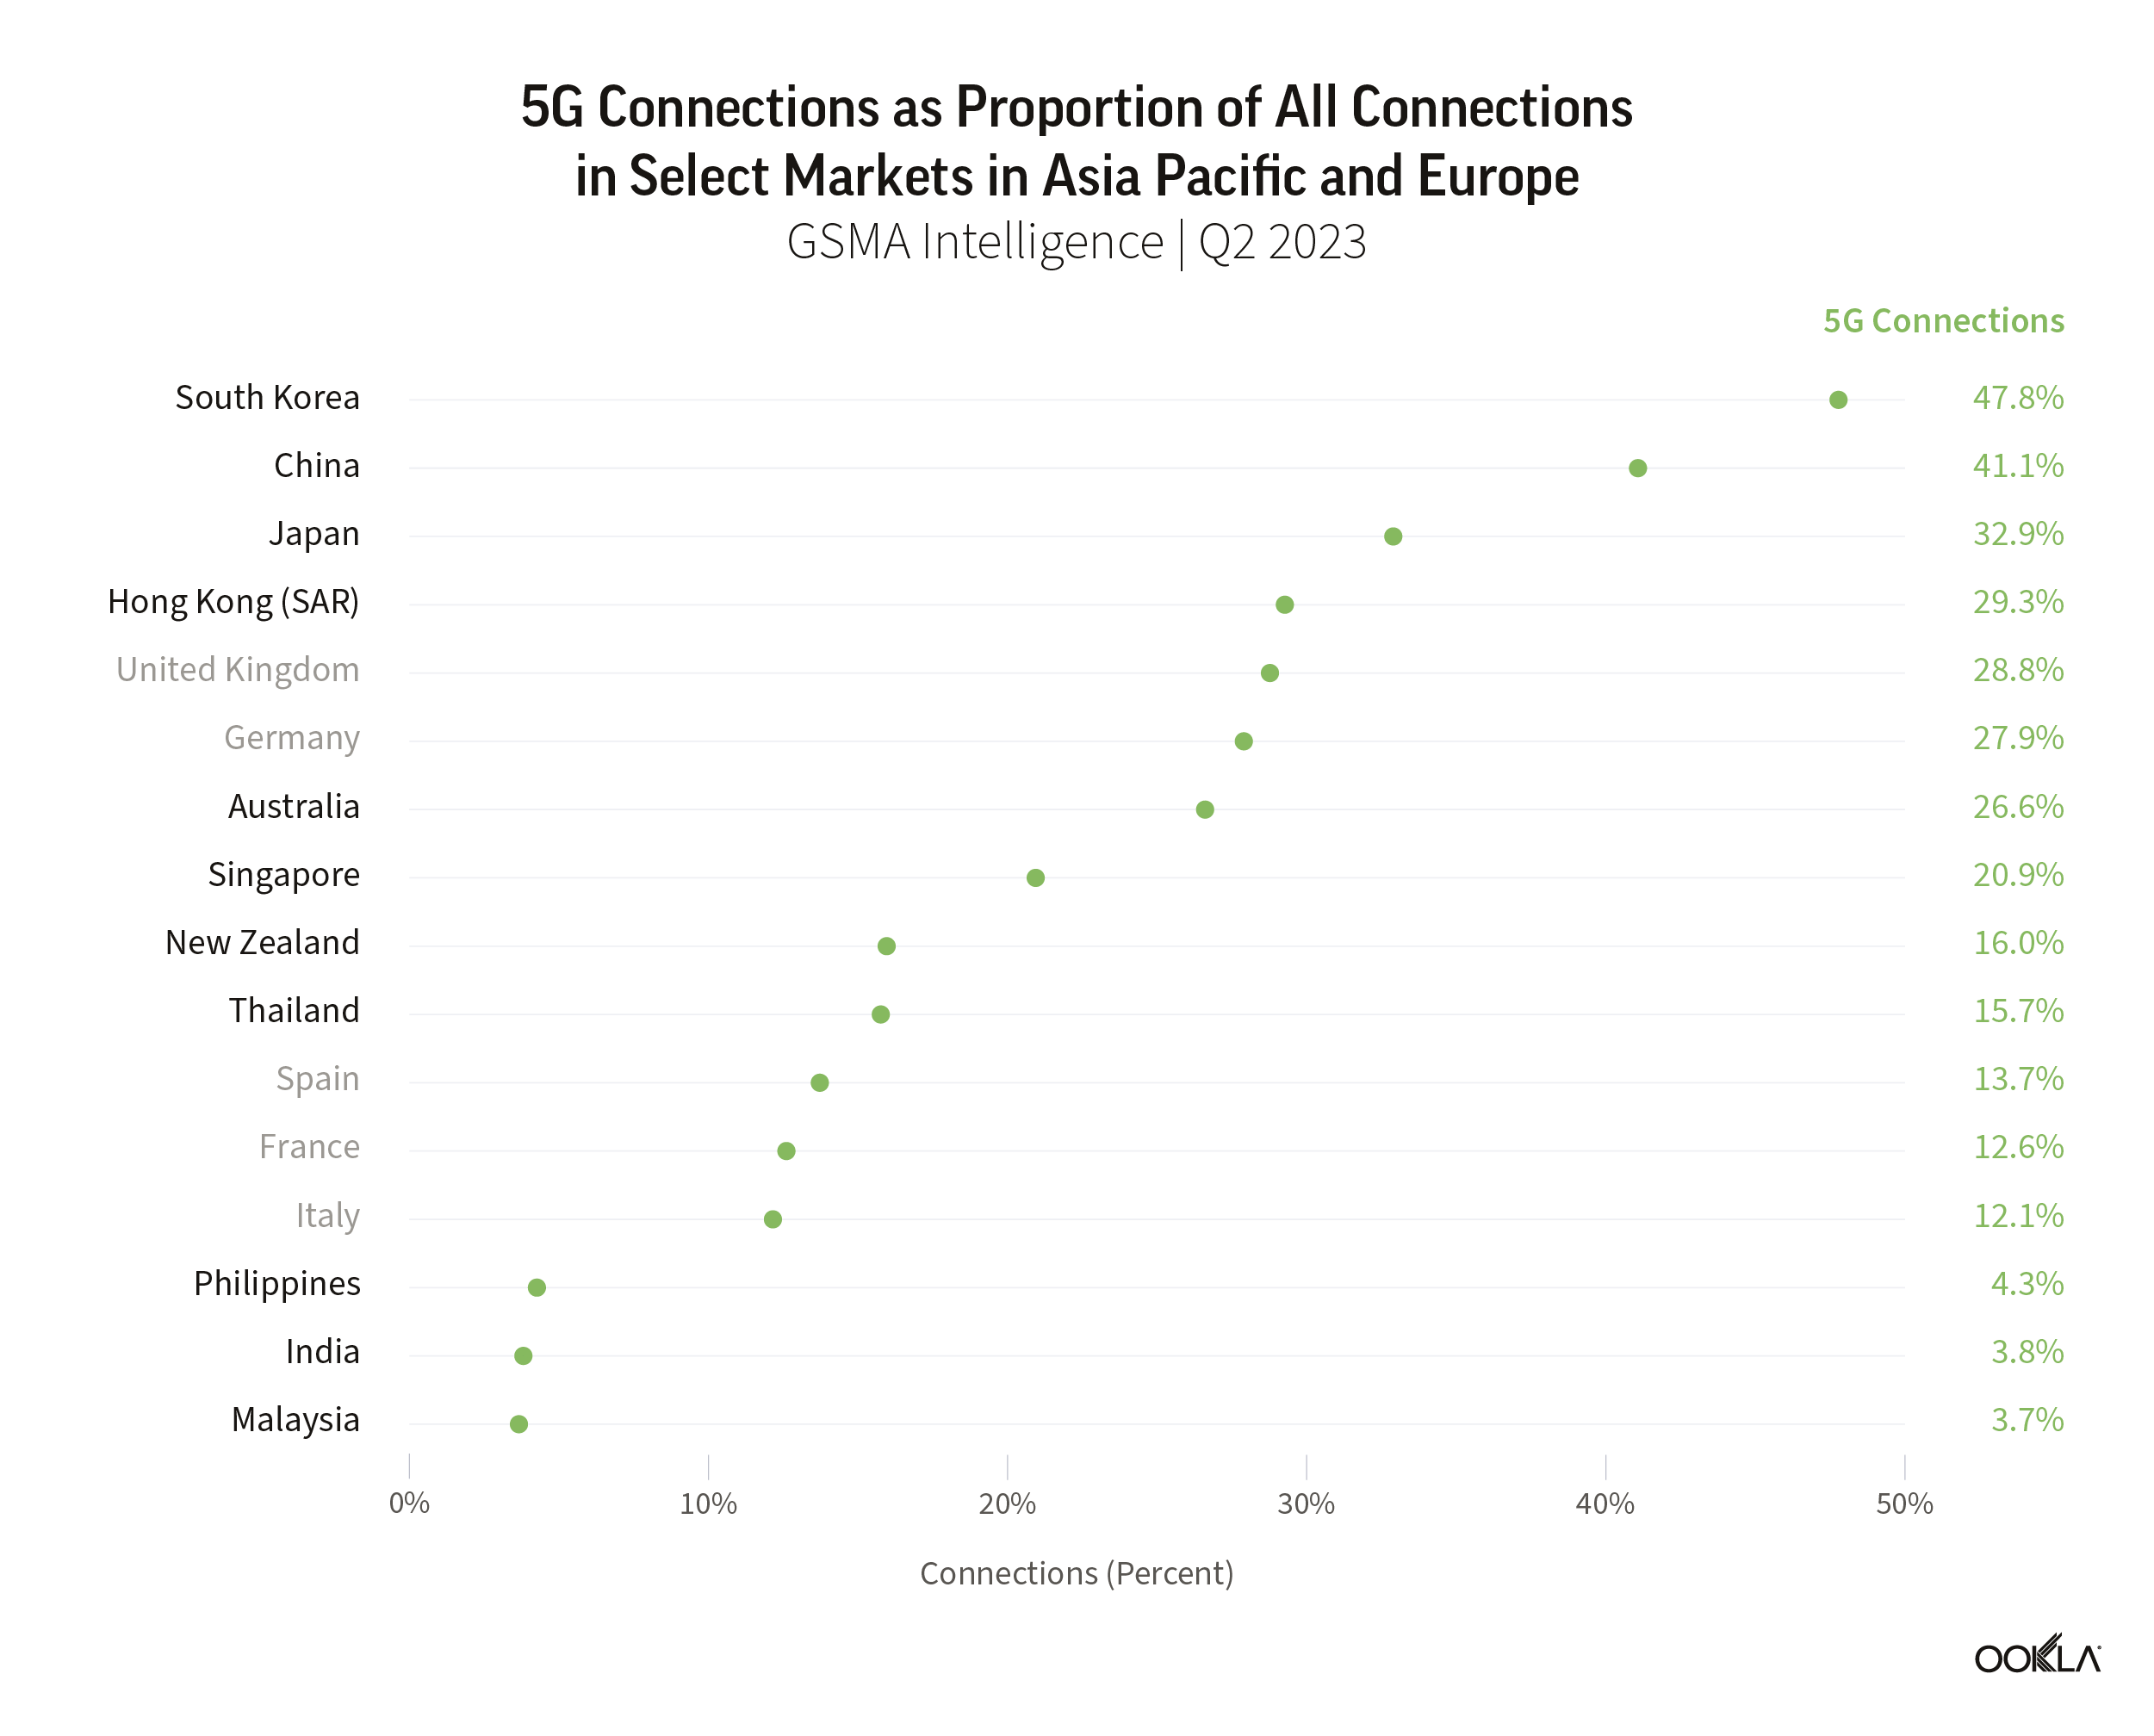
In Q1 2022, Speedtest Intelligence® data put Thailand on par with its regional peers such as Australia and China and ahead of the Philippines, Japan, Singapore and New Zealand in terms of 5G Availability (the proportion of users on 5G-capable devices who spend a majority of their time on 5G networks). 

Chart of internet performance in Thailand compared to other regional countries
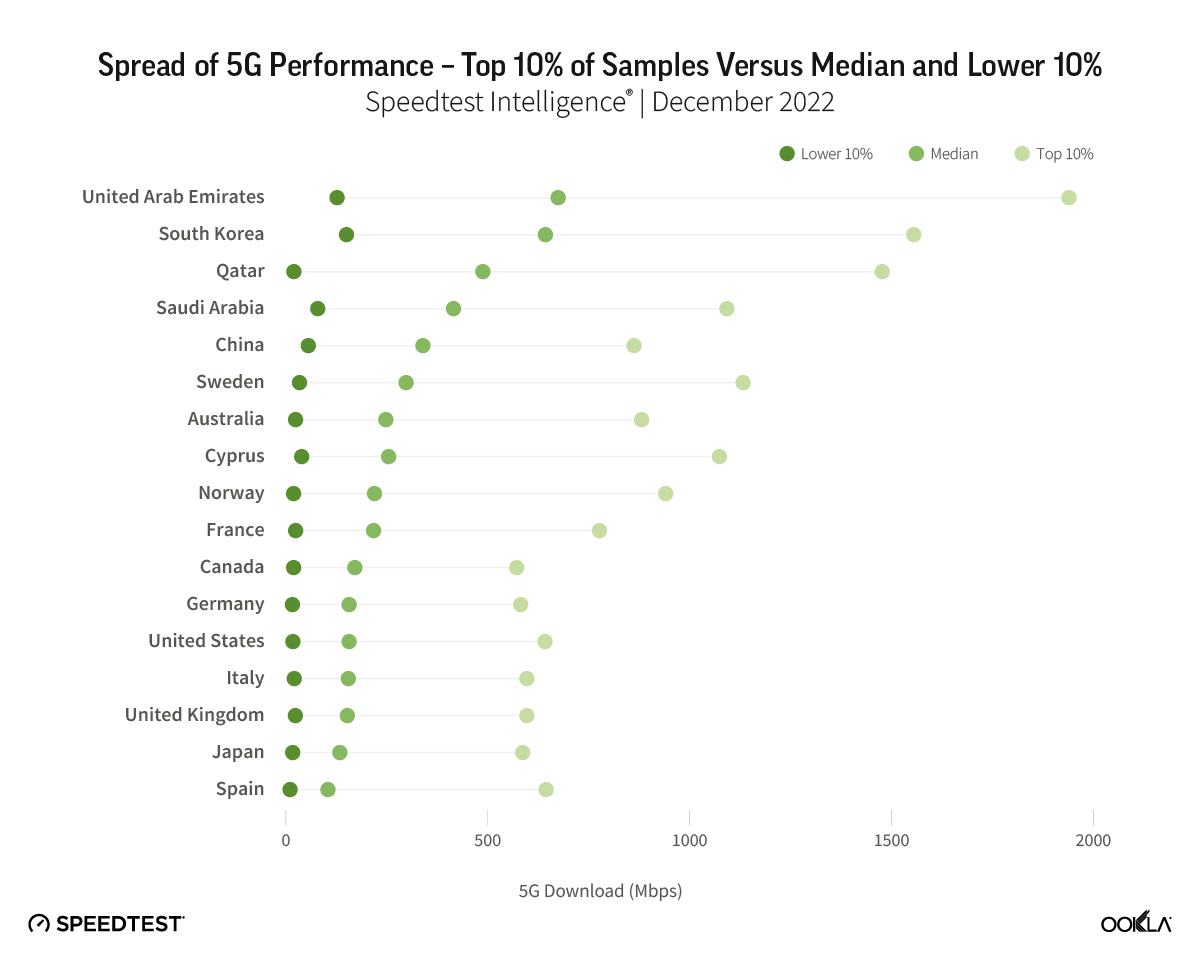
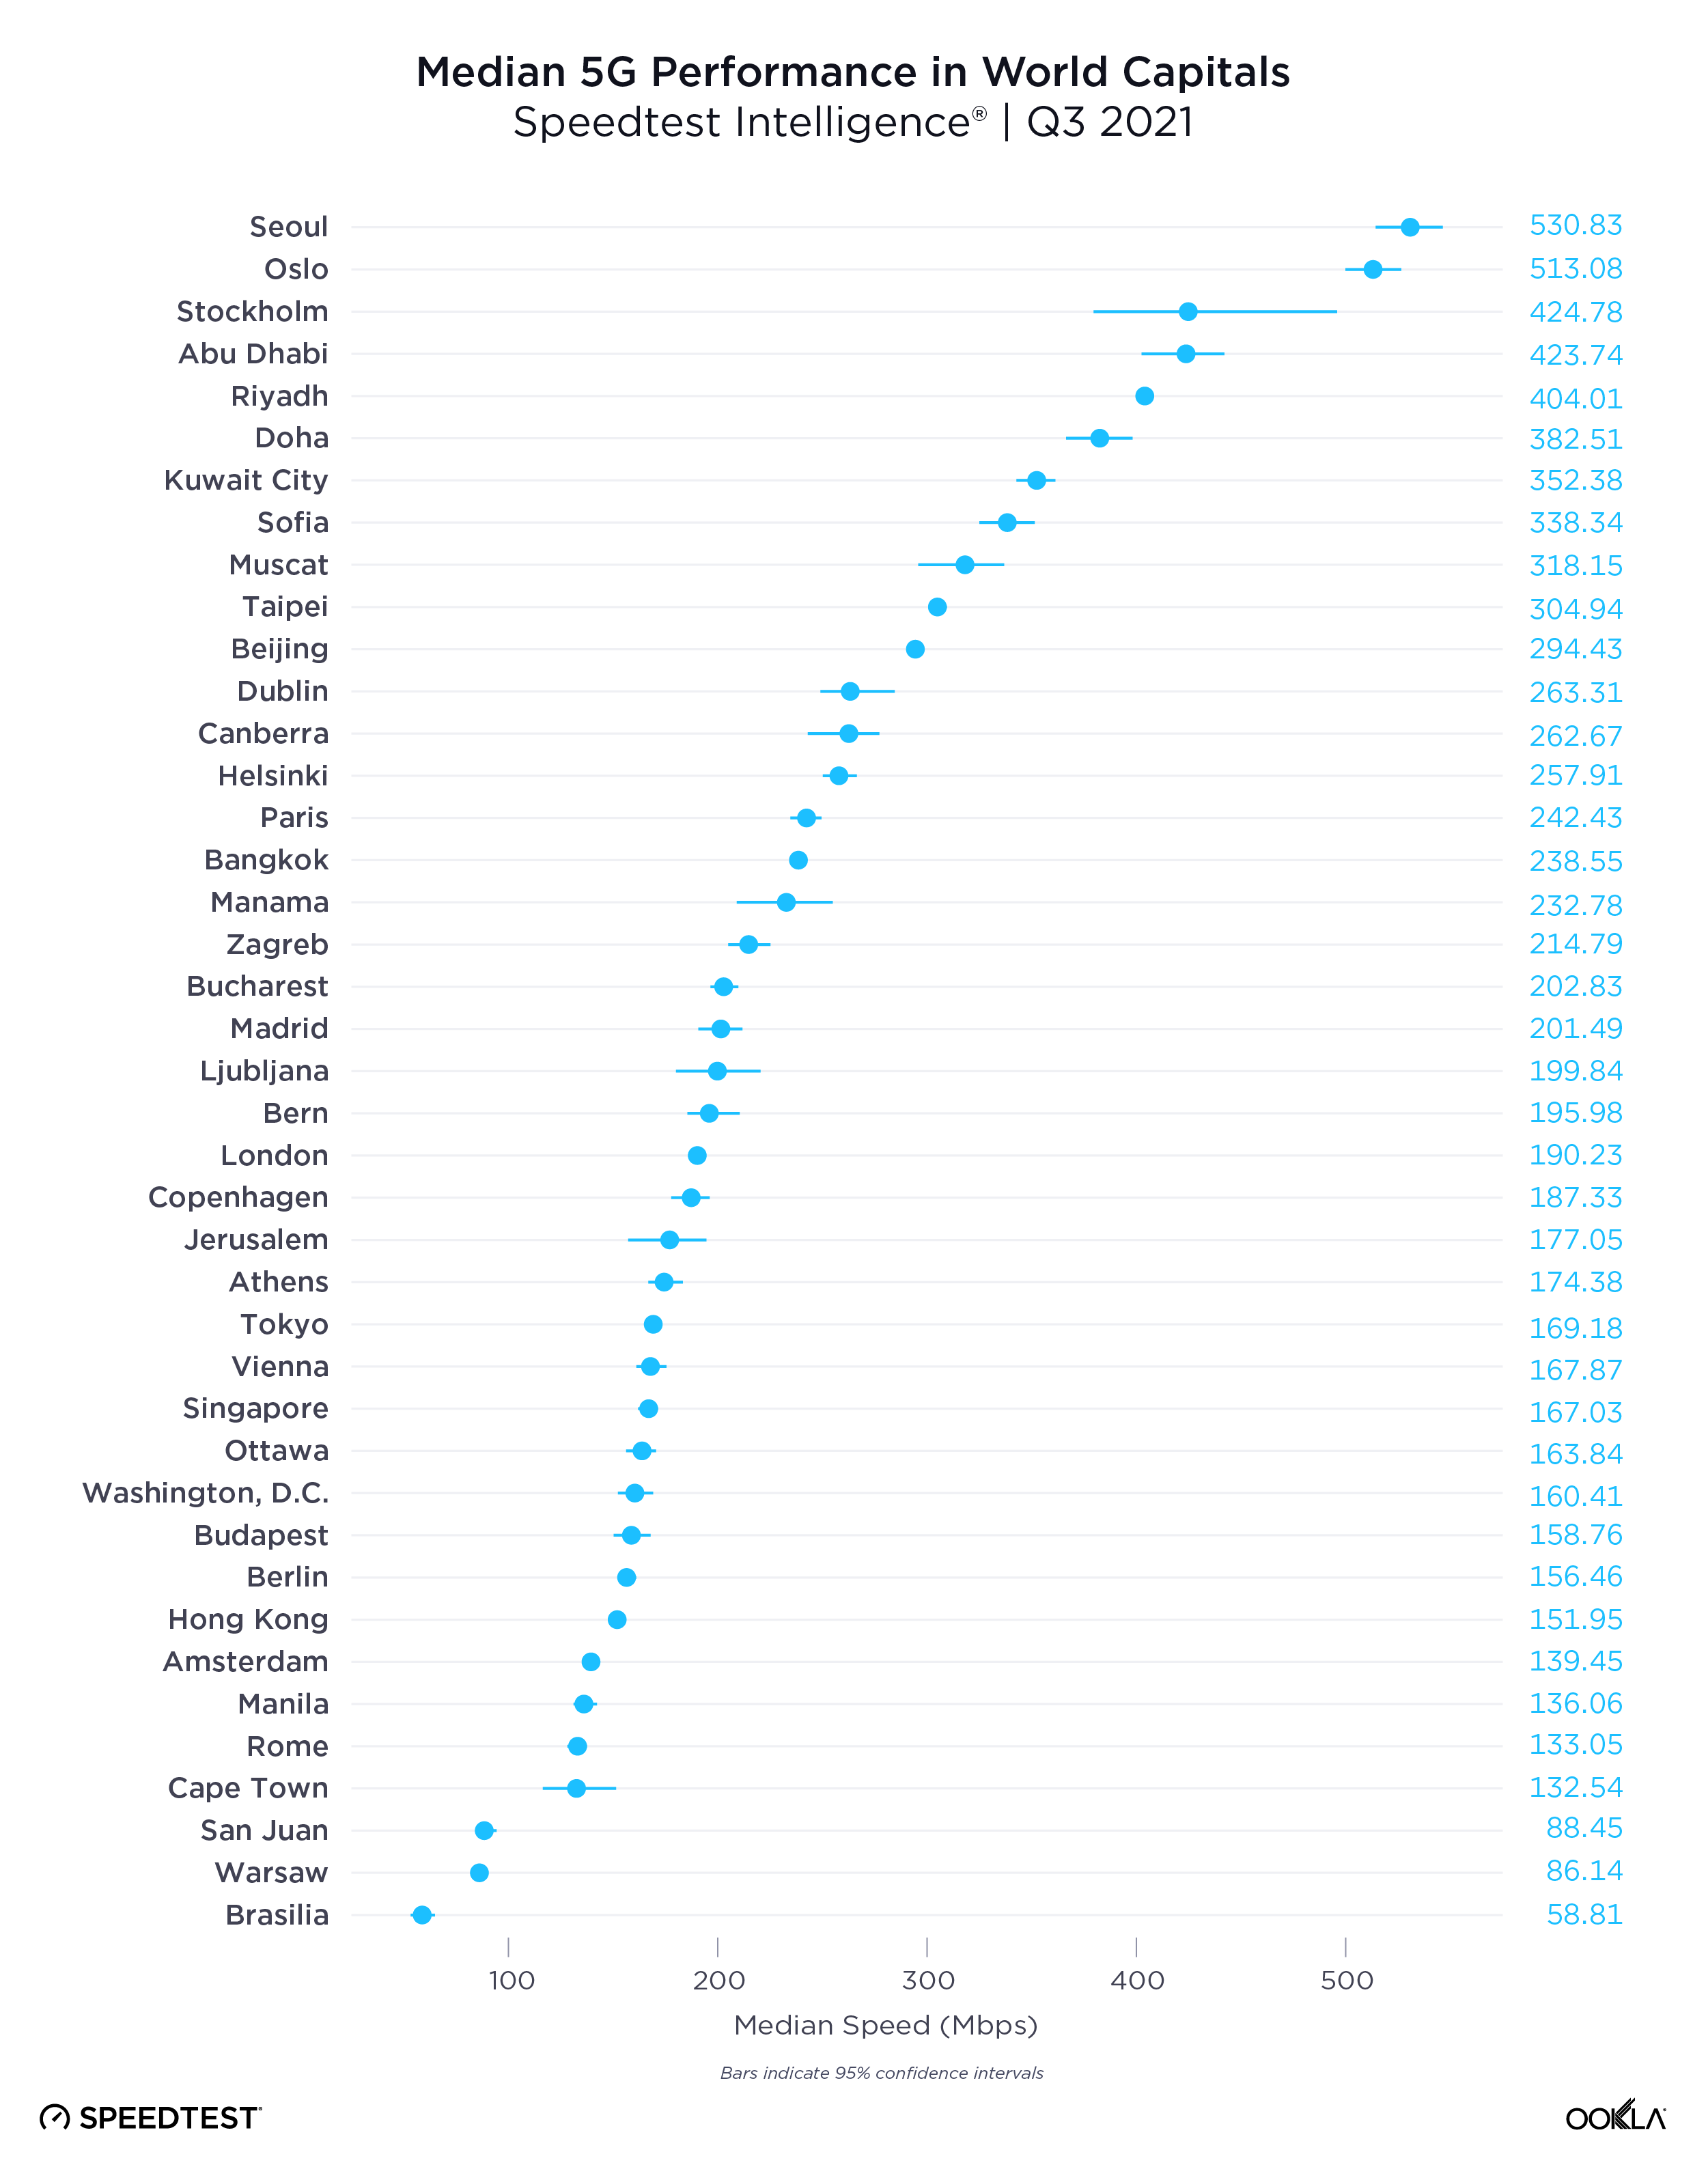
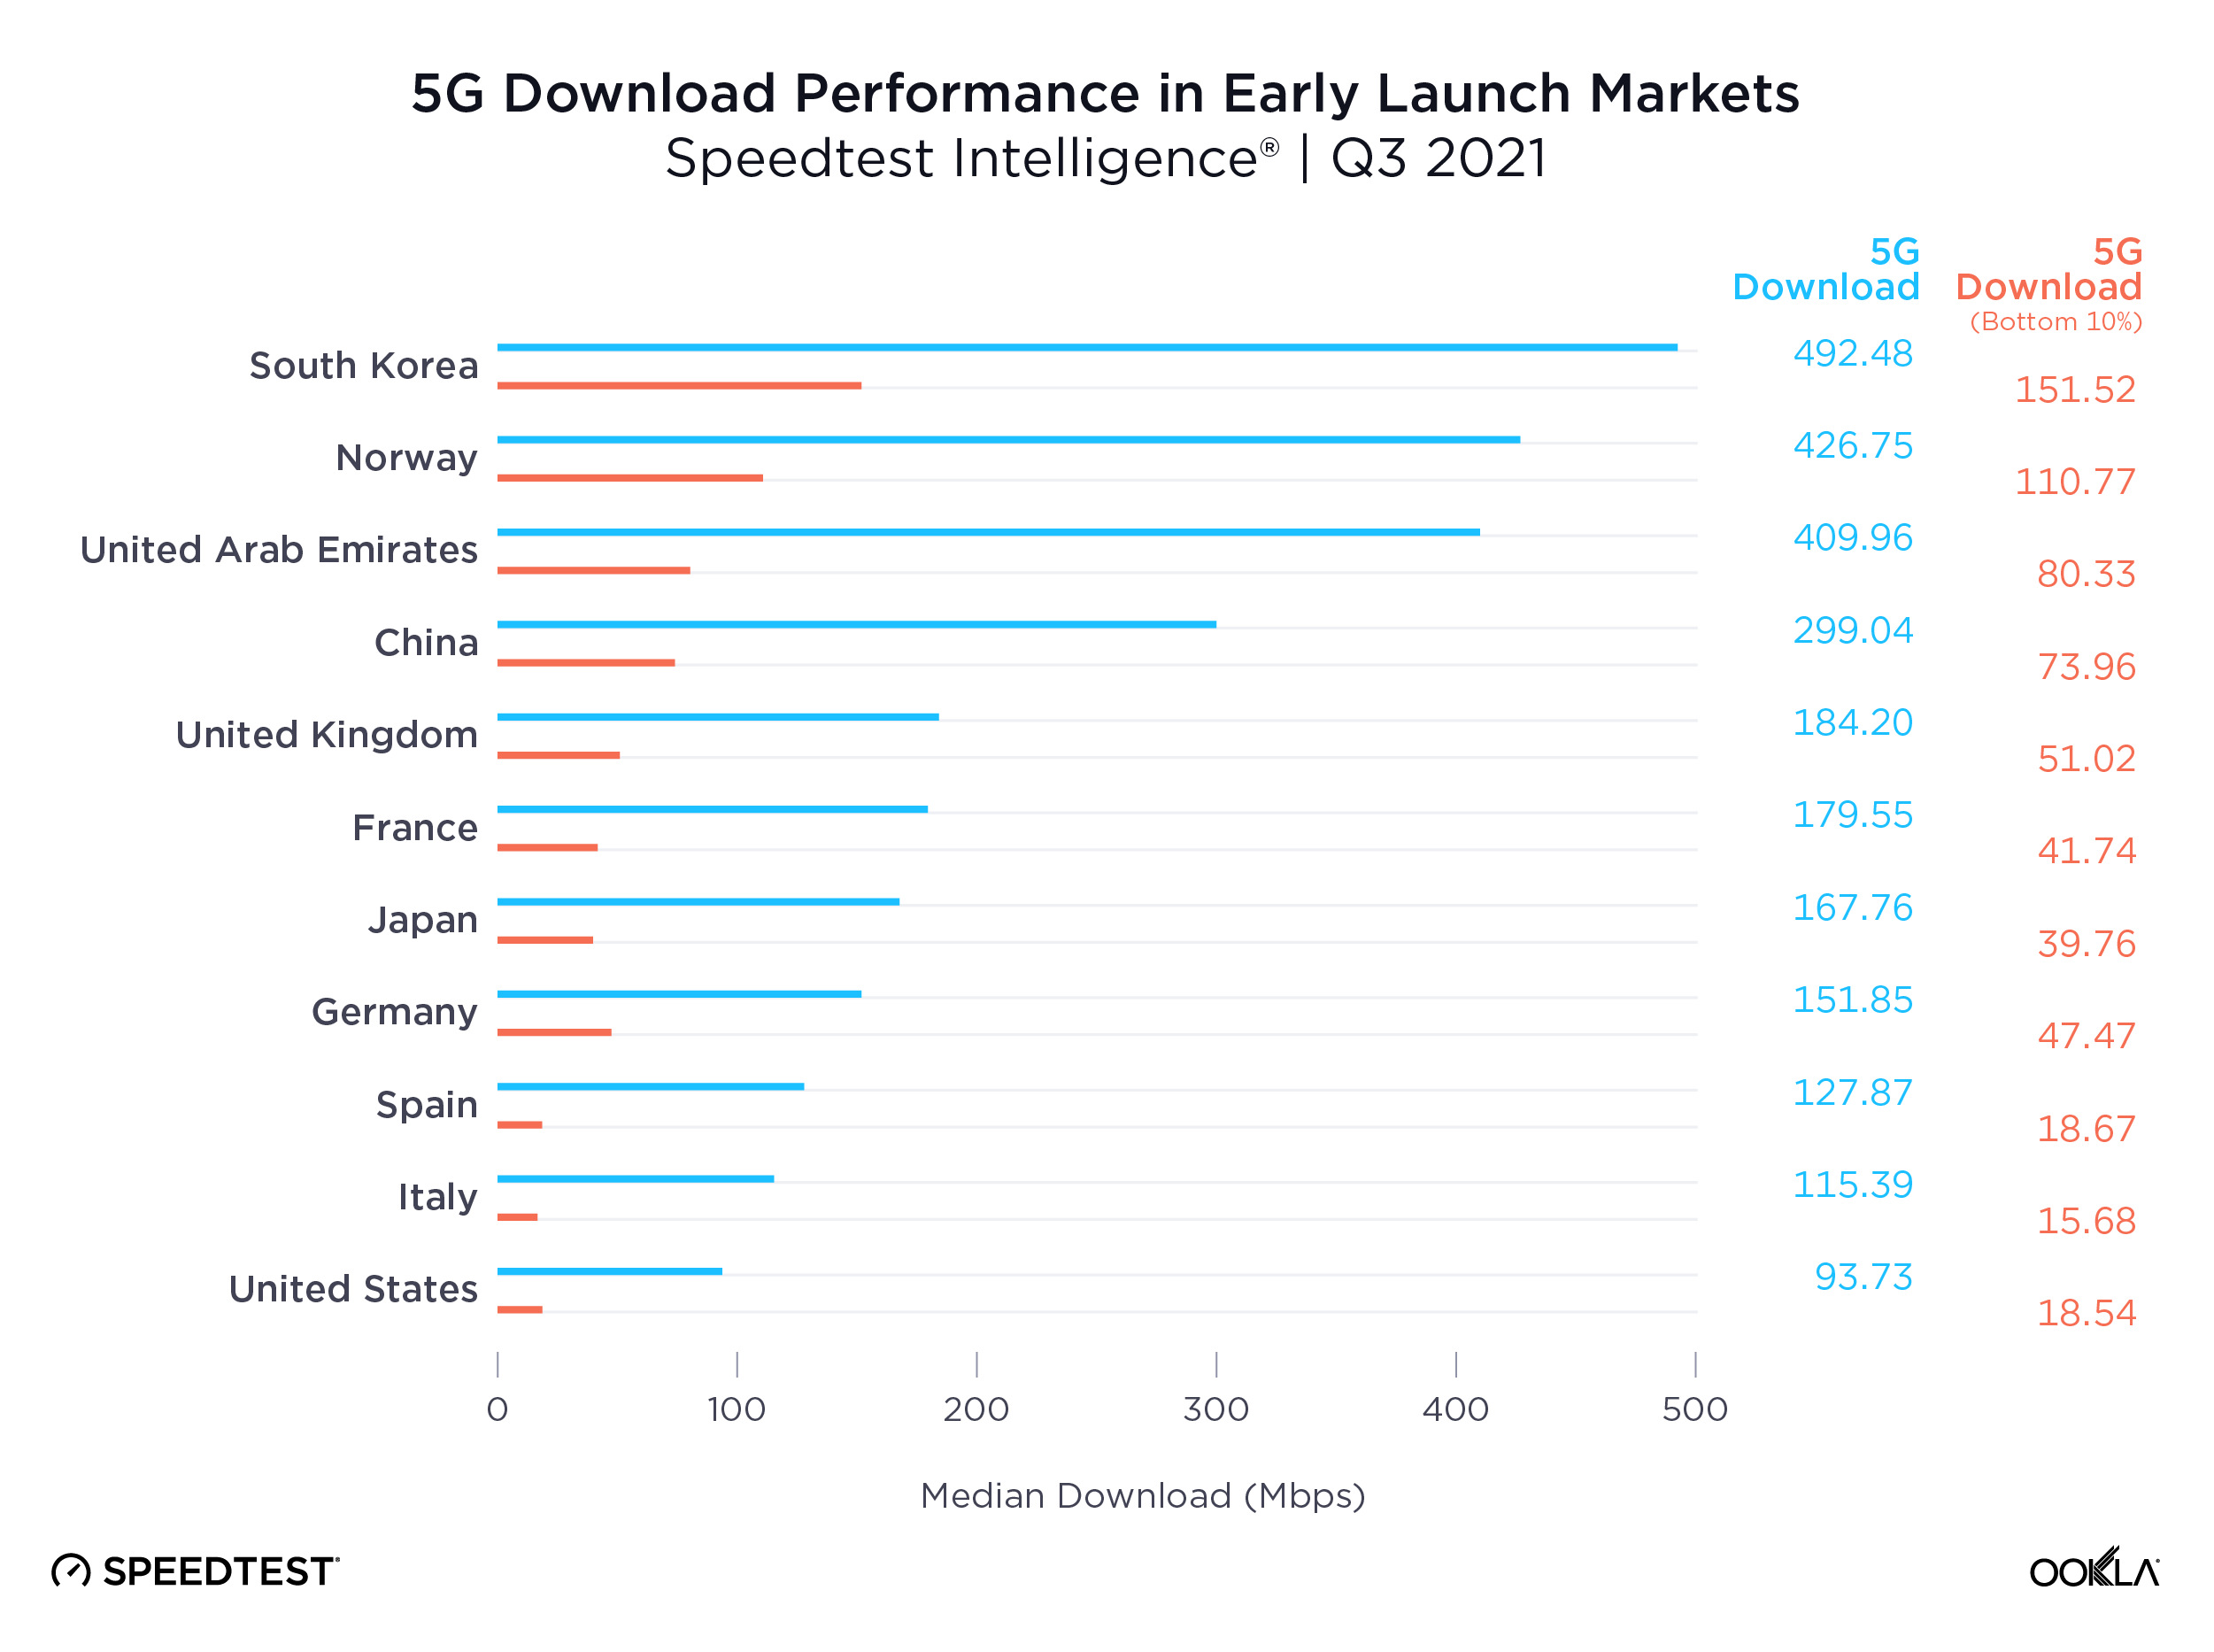
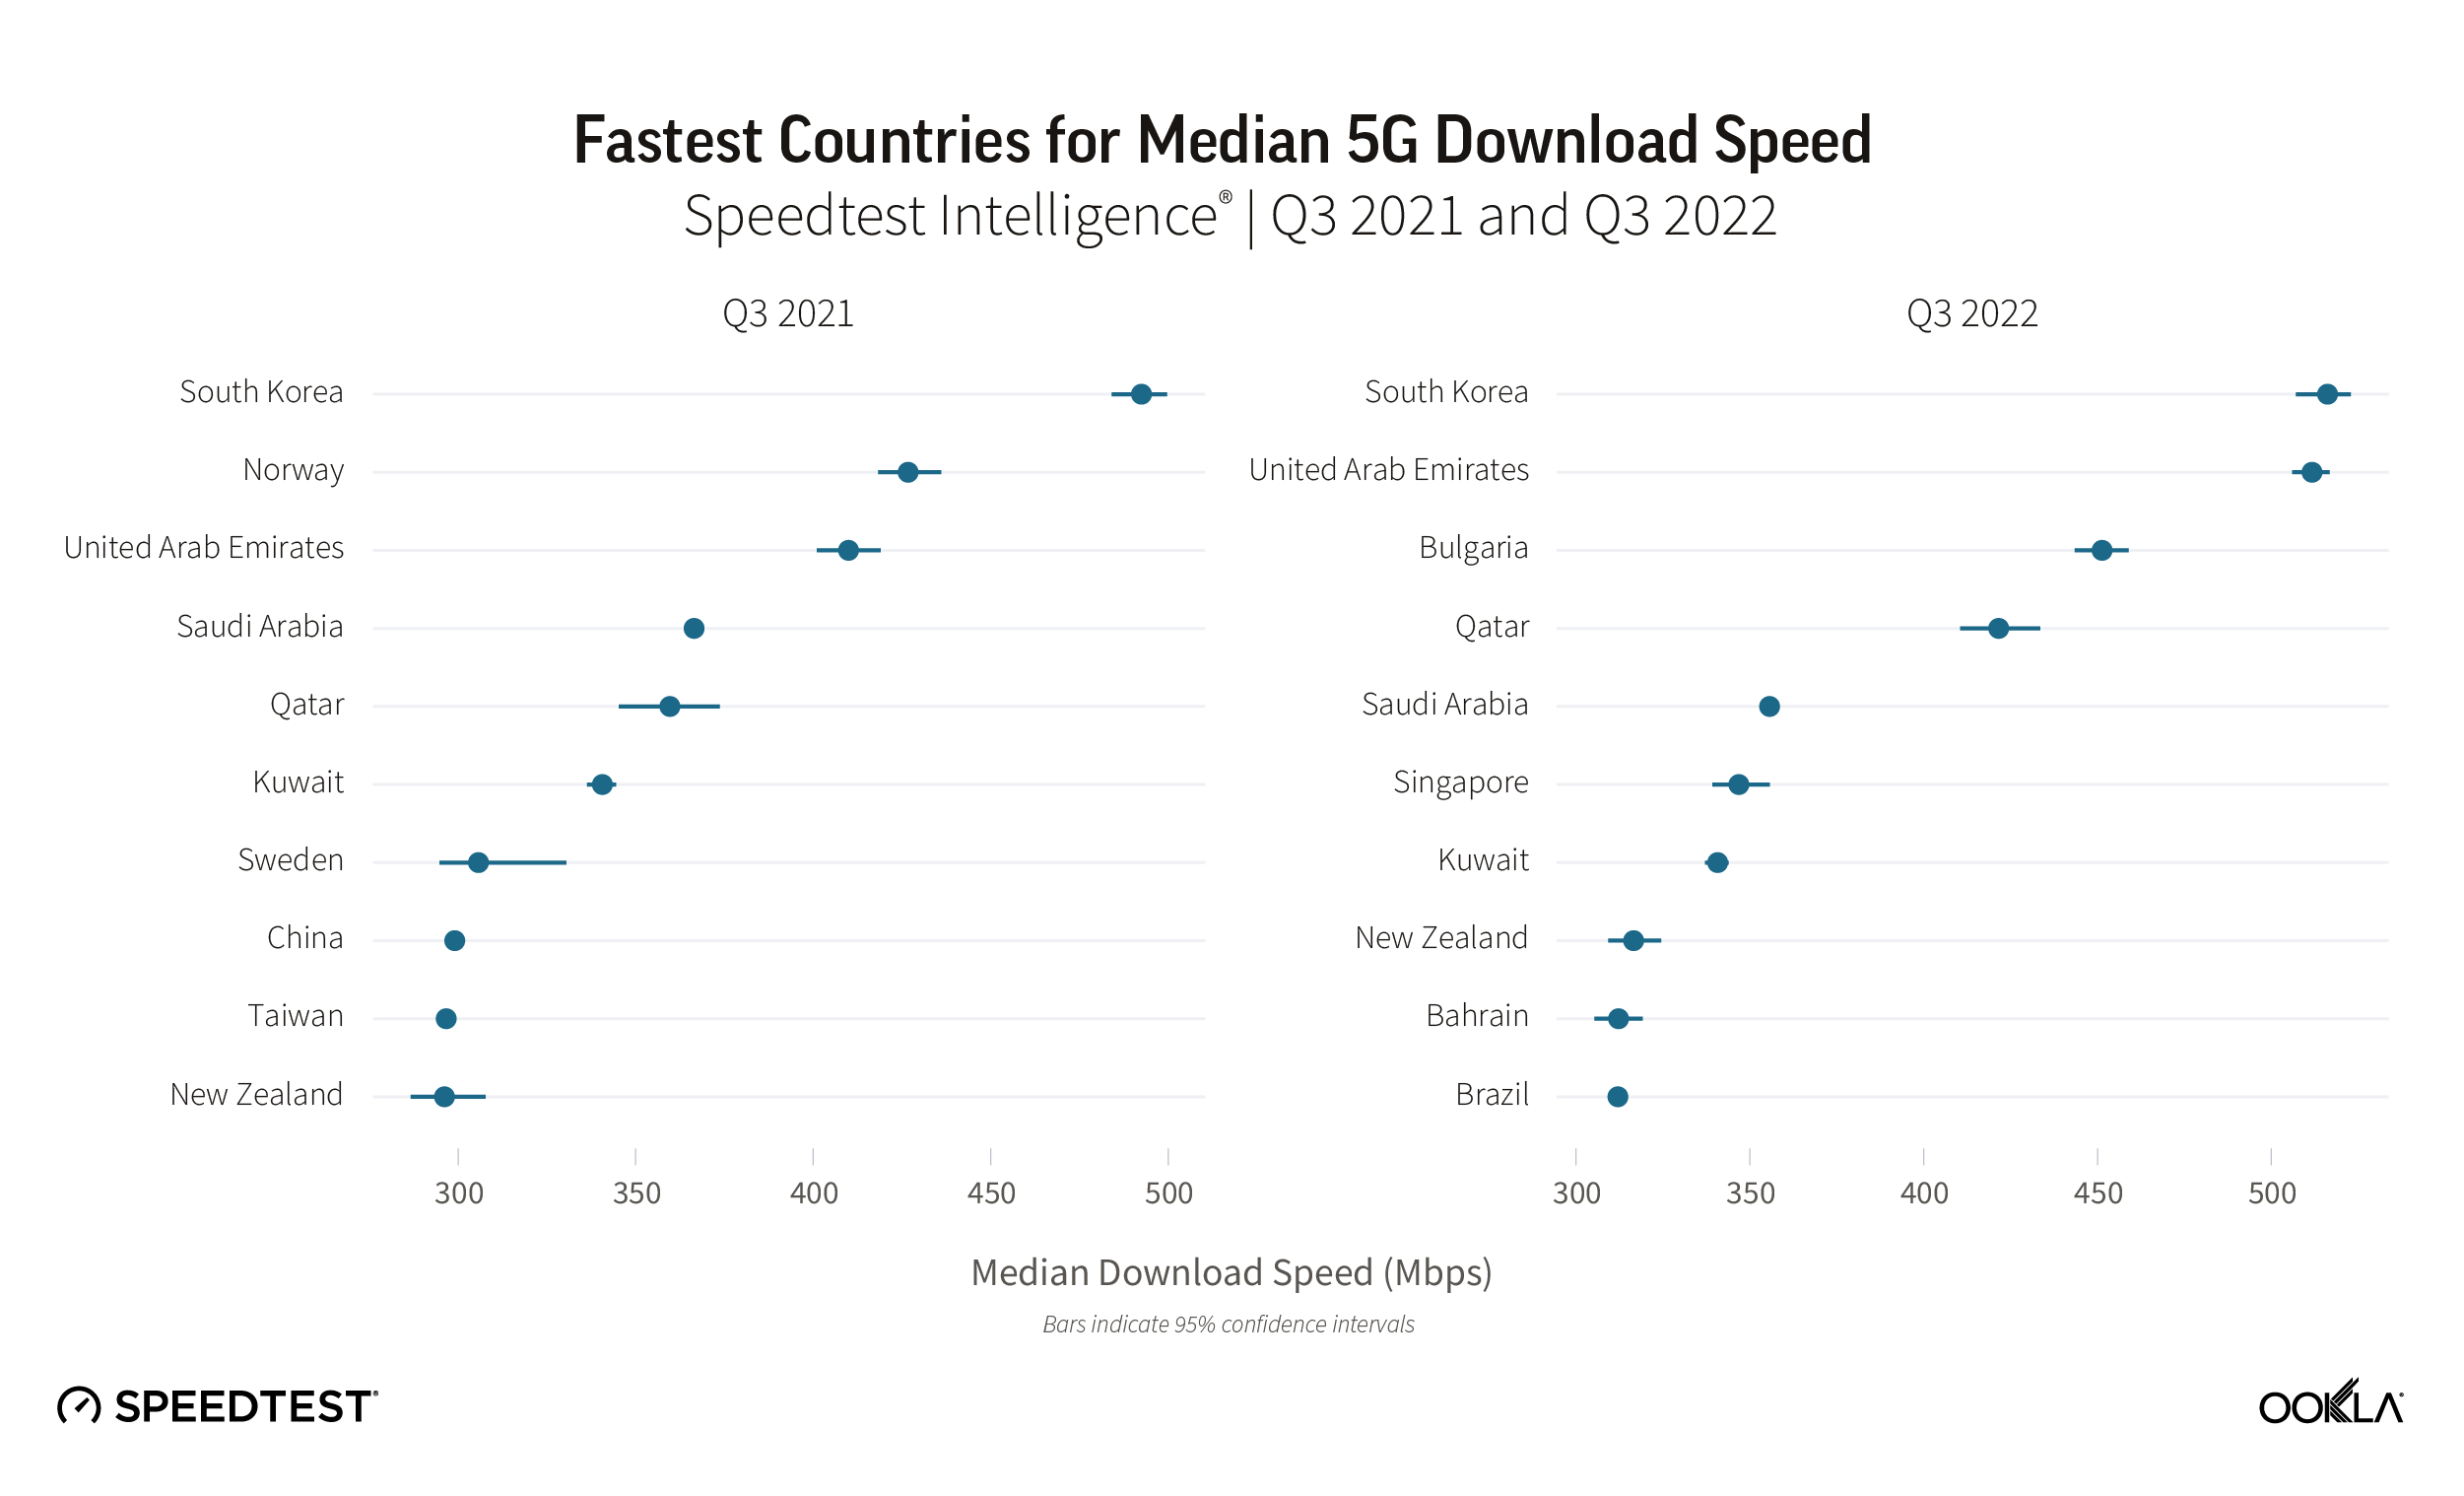
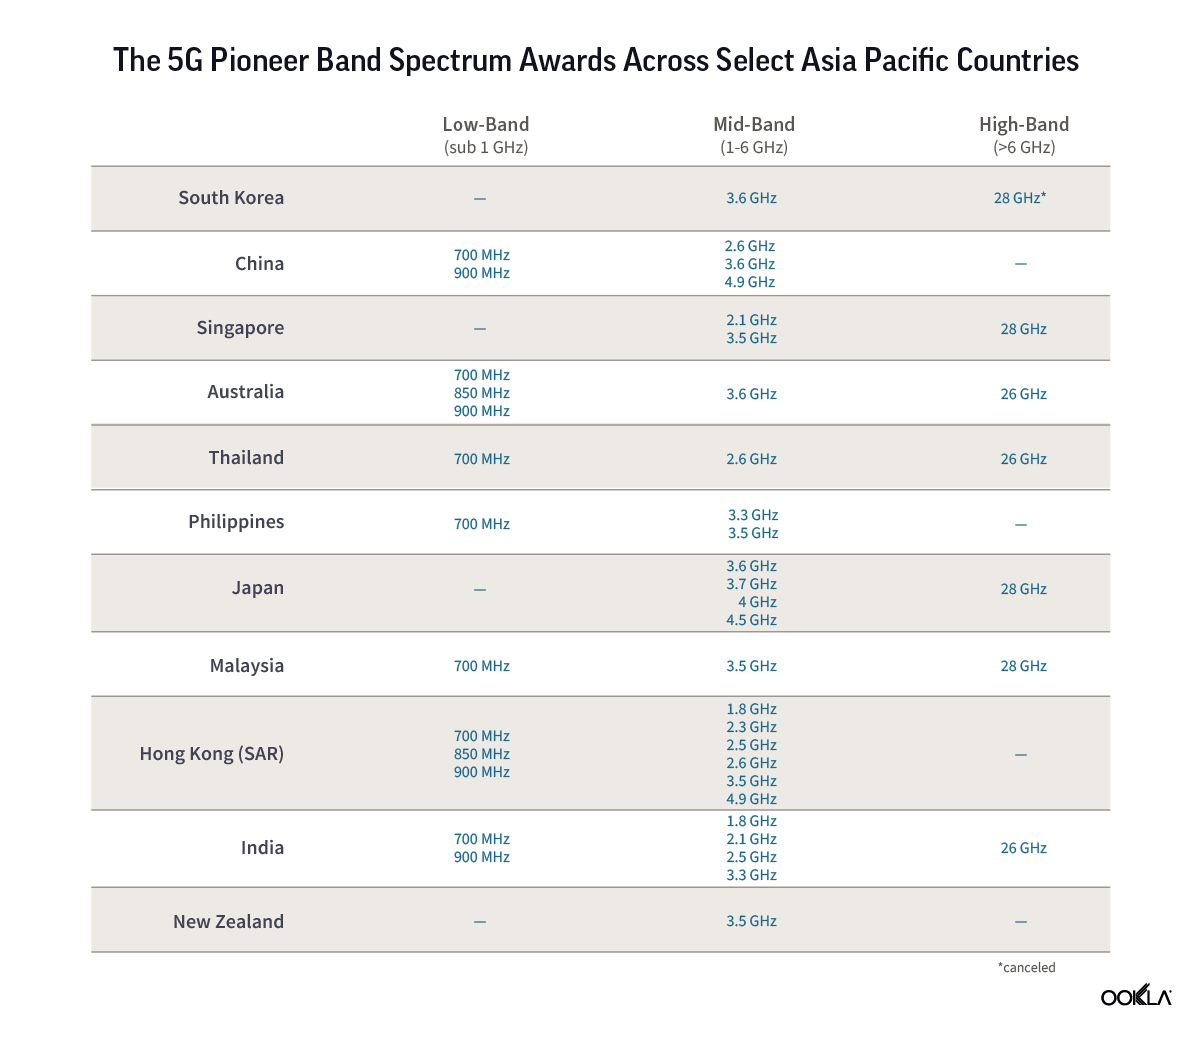
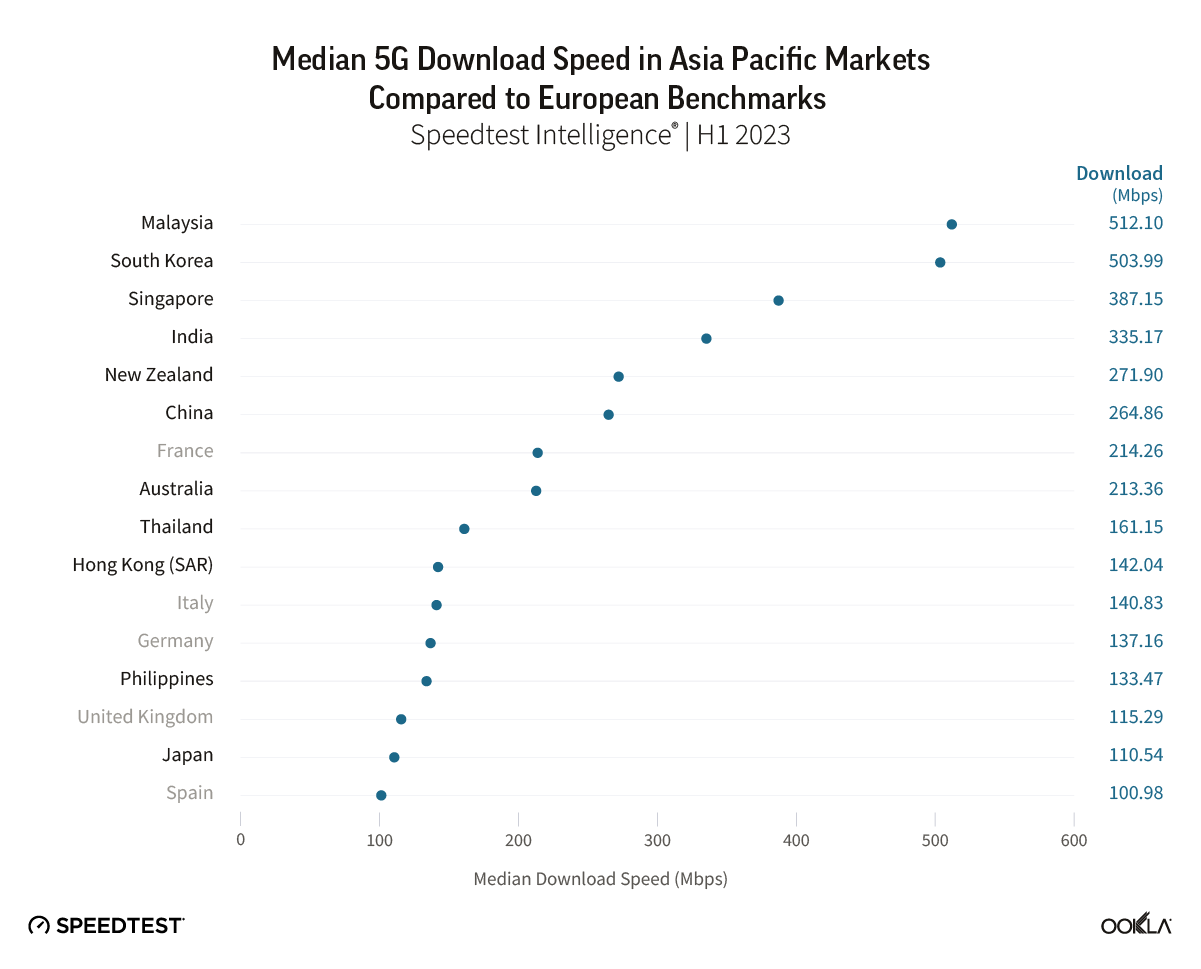
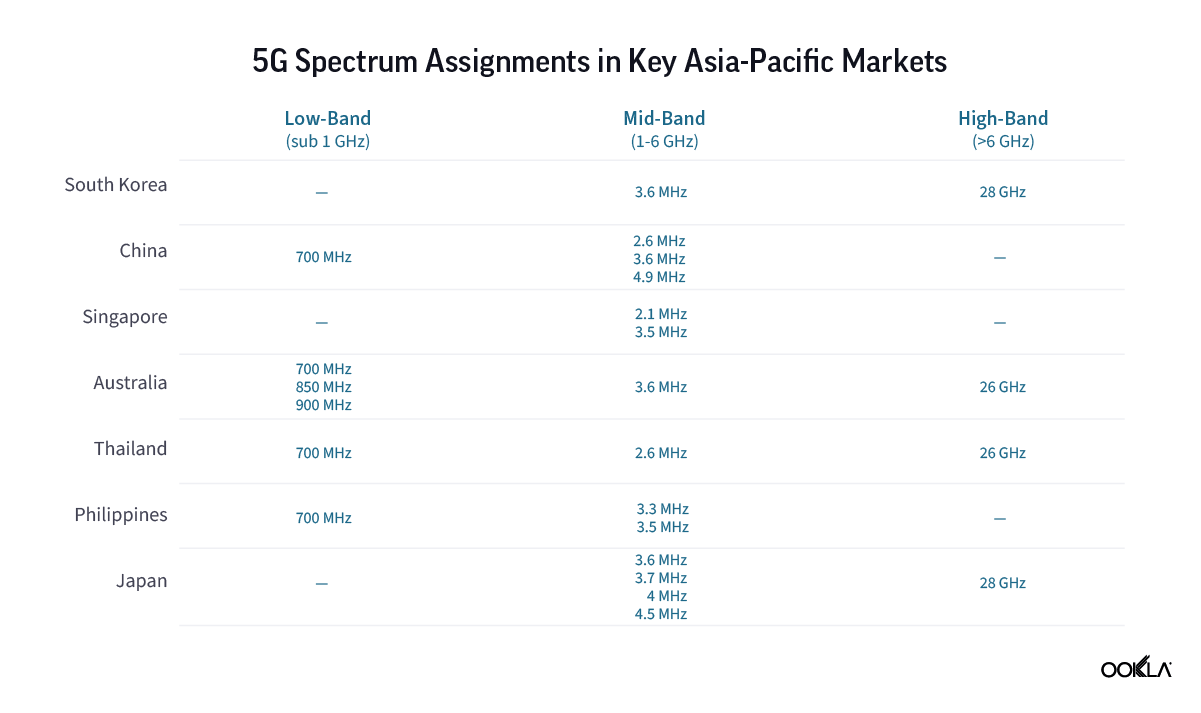
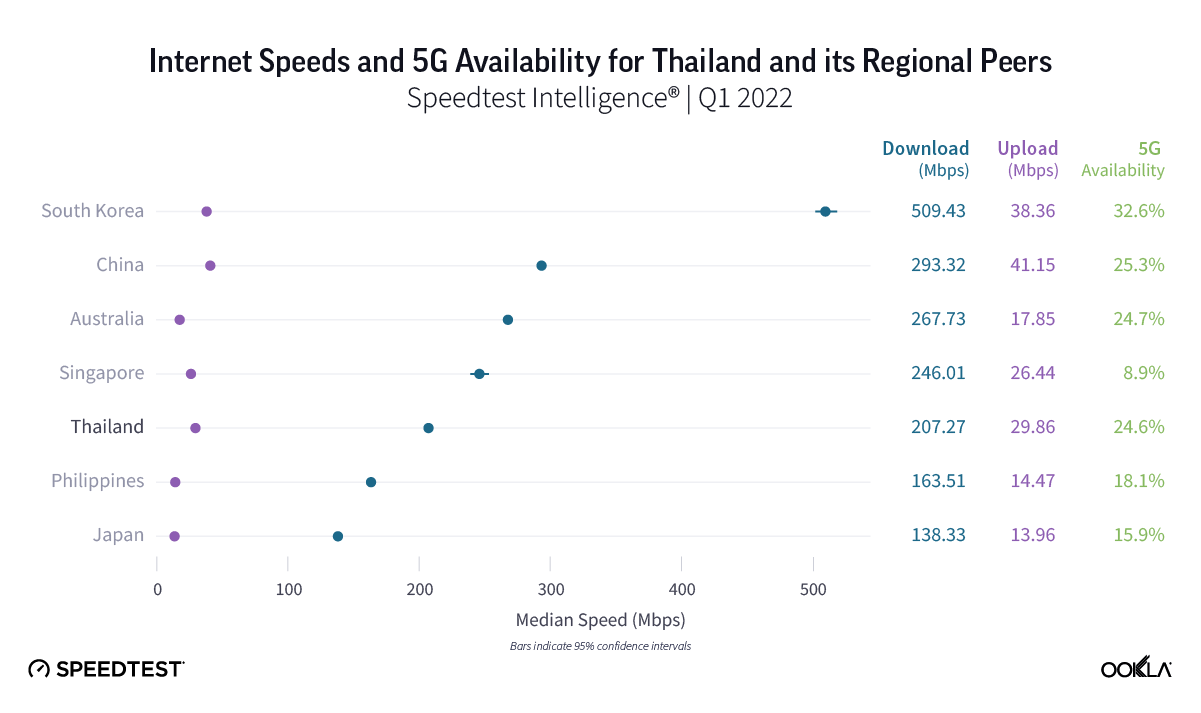
In February 2020, NBTC assigned spectrum for 5G use across low (700 MHz), mid (2,600 MHz), and high (26 GHz) frequency bands. It also plans a further auction of mid-band spectrum in 2022 in the 3.5 GHz band, which was vacated in September 2021 by Thaicom, a satellite provider. All of the countries in the comparison above assigned spectrum in the mid-band frequency, which is the sweet spot for 5G in terms of coverage and capacity. In South Korea, which came first in terms of median 5G download speed, the government allocated a total of 2,680 MHz of spectrum including 280 MHz in the 3.5 GHz band and 2,400 MHz in the 28 GHz spectrum band. Korean provider KT is also using a standalone 5G network, a form of 5G that doesn’t rely on 4G LTE as the foundation of the 5G experience, which should provide faster speeds and lower latency than non-standalone (NSA) 5G networks. In fact, a few operators in the analyzed countries have launched 5G SA including China (all operators), Singapore (M1, Singtel, and Starhub), Australia (Telstra and Vodafone), Japan (Softbank), and Thailand (AIS).

Chart of 5G spectrum in key Asia-Pacific markets

AIS wins on 5G performance in Thailand, TrueMove H on 5G Availability

In Q1 2022, AIS came as the fastest operator in terms of 5G speeds, this was also the case in Q4 2021 as per our recent article. According to Speedtest Intelligence, AIS recorded a median 5G download speed of 261.19 Mbps and 5G upload speed of 40.57 Mbps during Q1 2022. AIS launched 5G NSA (non-standalone) in February 2020 using the 700 MHz, 2.6 GHz and 26 GHz bands, followed by 5G SA in July 2020 in cooperation with Huawei. AIS deployed 5G CA (New Radio Carrier Aggregation) by integrating its mid-band (2600 MHz) and low band (700 MHz) spectrum. This in turn gave a 1.7x boost to the operator’s data transmission capabilities. TrueMove H was second for 5G download speed, with a median of 197.79 Mbps and a 5G upload speed of 25.52 Mbps. The lack of mid-band spectrum limits dtac’s performance, which showed a median 5G download speed of 32.70 Mbps and 19.18 Mbps upload.

Chart of 5G performance among operators in Thailand

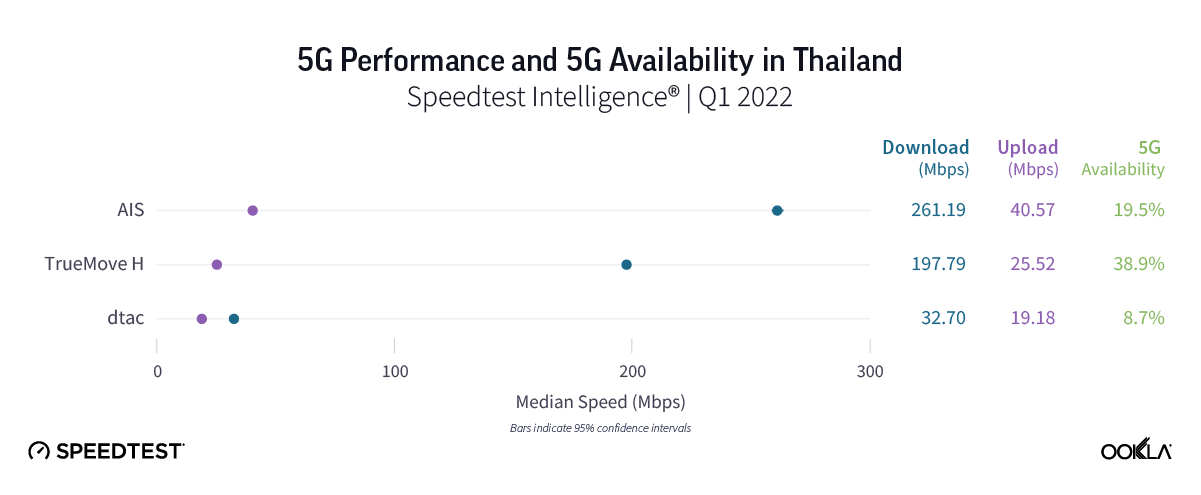
The ranking shifts when we compare 5G Availability – the percentage of users on 5G-capable devices that spend a majority of time with access to 5G networks. TrueMove H came first for 5G Availability at 37.9% during Q1 2022, a three percentage point improvement over Q4 2021. This was well above the rest of the Thai operators: AIS (18.7%), and dtac (7.9%). Based on our data AIS & TrueMove H had 5G Availability in all 77 provinces but TrueMove H 5G Availability was higher in most of the provinces as per Q1 2022. 

This disparity we see between TrueMove H and AIS is largely down to the fact that AIS requires users to subscribe to a 5G tariff, as opposed to TrueMove H which allows greater access to 5G-enabled devices on its network. TrueMove H’s 5G Availability remains the highest via a combination of coverage and 5G handsets. The operator’s initial focus was to roll out 5G to most densely populated areas such as the Bangkok metropolitan area, in which over 90% of population is covered by 5G, followed by key locations. At the time of 5G network launch, TrueMove H offered 30 models of 5G smartphone under promotional prices, True 5G VR4K vision and True5G VR Headset, IoT equipment as well as gadgets. AIS rolled out a 5G network out to all 77 provinces, covering 78% of the population in Q1 2022, with a year end target of 85% population coverage.

At the same time, Thai operators continue to grow the number of 5G users, expanding the addressable market beyond early adopters; for example TrueMove H saw its 5G user base increase to 2.6 million in Q1 2022, AIS had 2.8 million 5G package subscribers and 3 million 5G handset on AIS network in Q1 2022.

Songkhla tops the charts for median 5G download speed

Every operator takes a unique approach to regional strategy, so we looked closely at 5G performance in select regions during Q1 2022. Songkhla came top when it comes to median 5G download speed (253.44 Mbps), but ranked last in 5G Availability (8.9%), which points to low network congestion due to a lower number of users.

Chart comparing 5G performance by provinces in Thailand

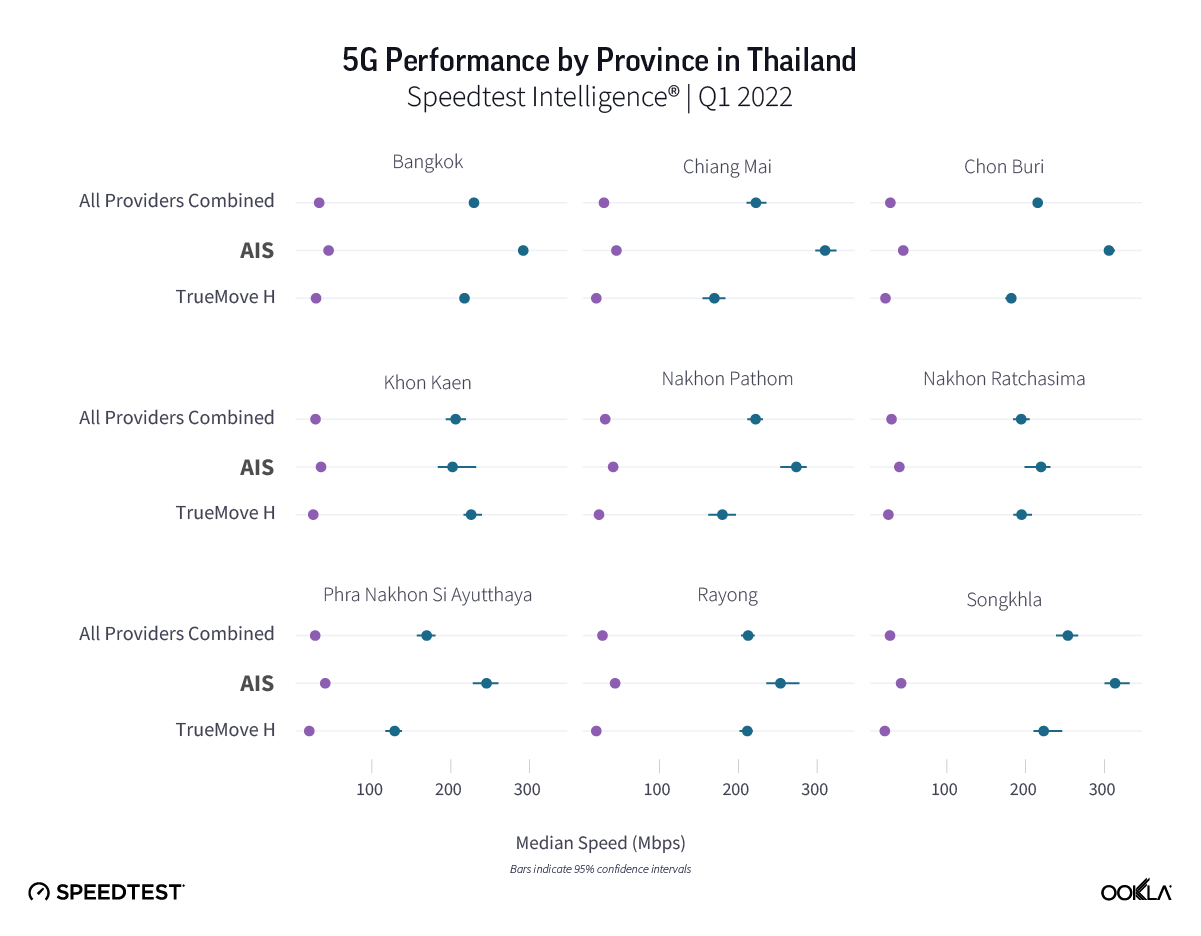
We removed dtac from the operator level comparison due to the low sample size. AIS came top in almost all regions, apart from Khon Kaen. AIS’s fastest median 5G download speed (313.35 Mbps) was in Songkhla.

Bangkok has the highest 5G Availability

Chart comparing 5G availability by provinces in Thailand

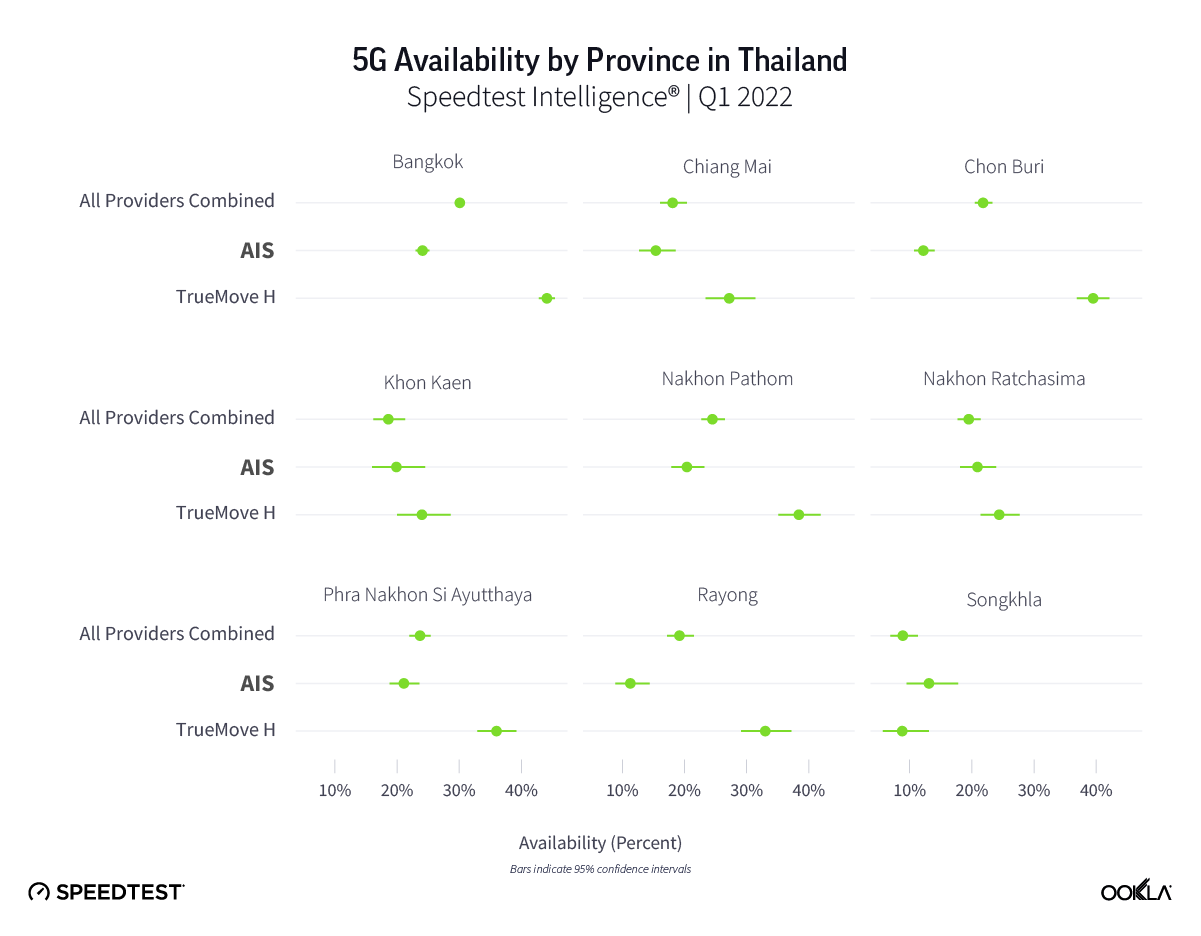
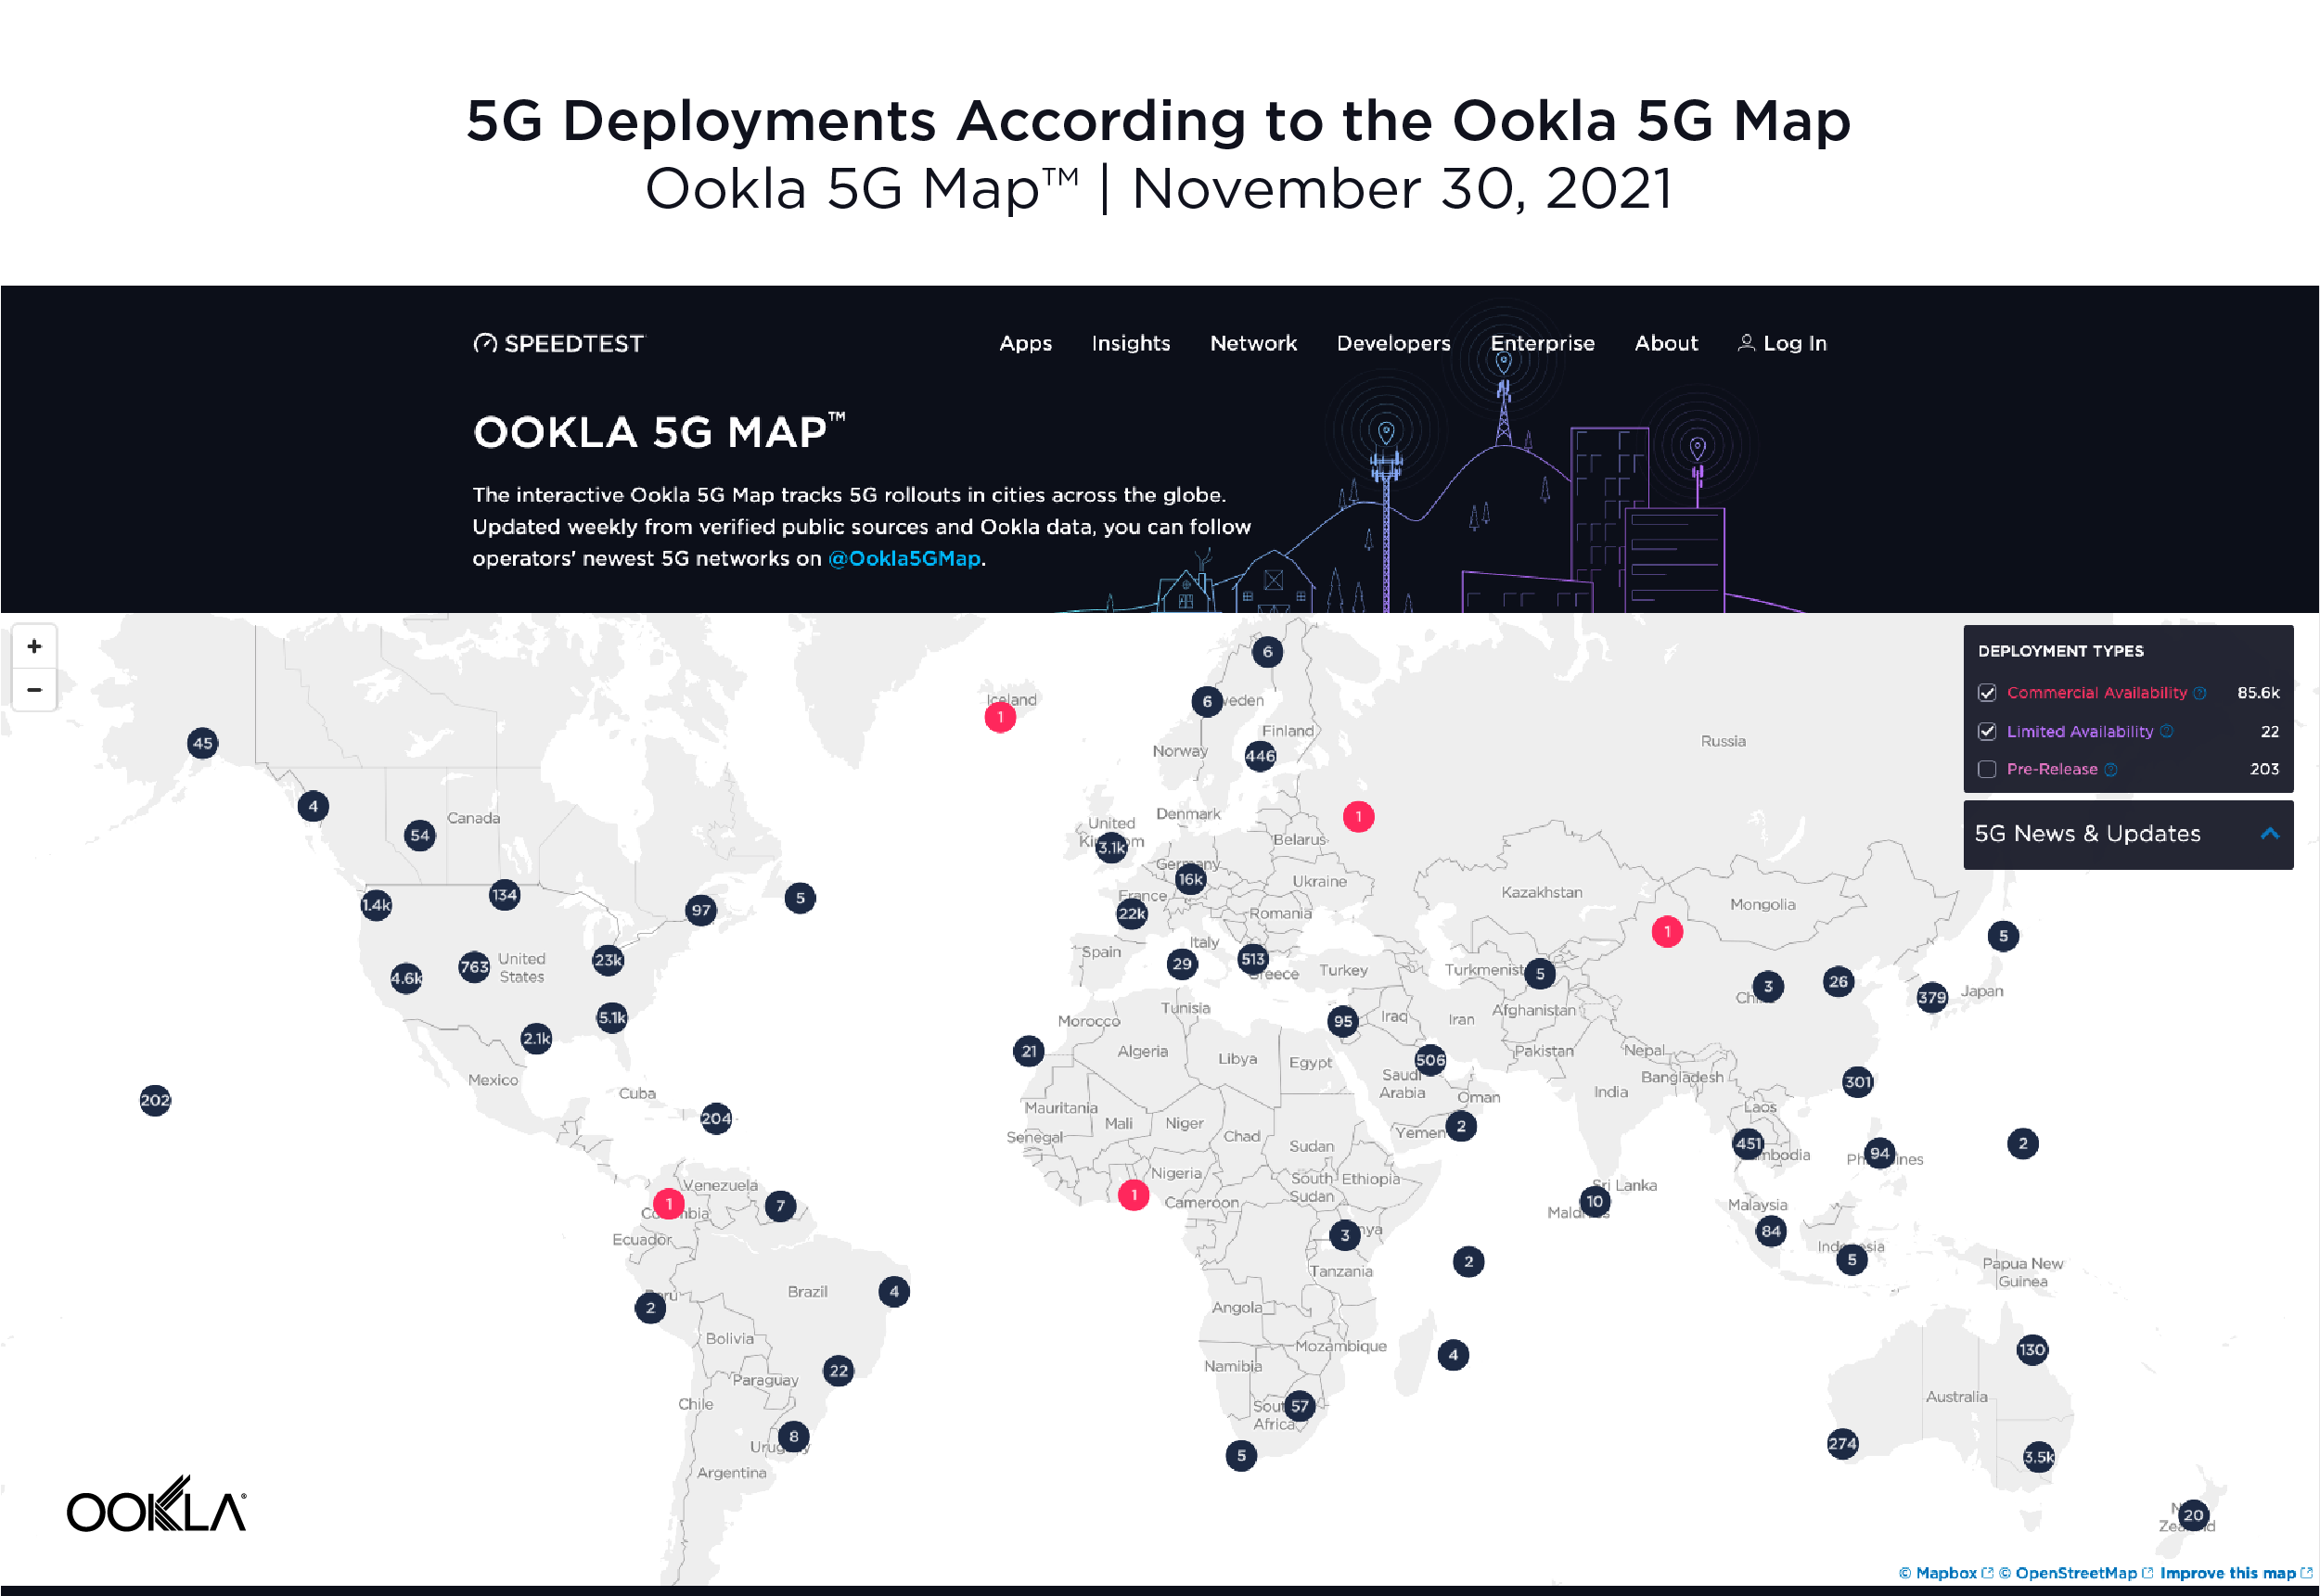
In Q1 2022, Bangkok had the highest 5G Availability (30.1%), Songkhla ranked last in 5G Availability (8.9%). Ookla 5G Map®  shows 215 commercial 5G deployments in the Bangkok area. What’s more, because Bangkok is more affluent than the rest of the country, smartphone adoption, including 5G, is higher than in the rest of the country. Due to the pandemic, Thai operators have actually accelerated their 5G rollout, starting with hospitals in Bangkok. At the end of 2021, AIS reported that its 5G network covered more than 99% of the population in Bangkok compared to 76% across the whole country. At the end of Q1 2022, dtac’s 5G network covered 34 provinces, though we have excluded dtac from the above ranking due to low sample count. Dtac has been focusing on network expansion using the 700 MHz band, resulting in capacity and coverage uplift, yet it is still lagging behind competition in uptake. Dtac reported that it will prioritize 5G expansion by expanding coverage to all of Thailand’s 77 provinces within the Q3 2022.

4G Availability close enough, AIS in the lead for 4G speeds

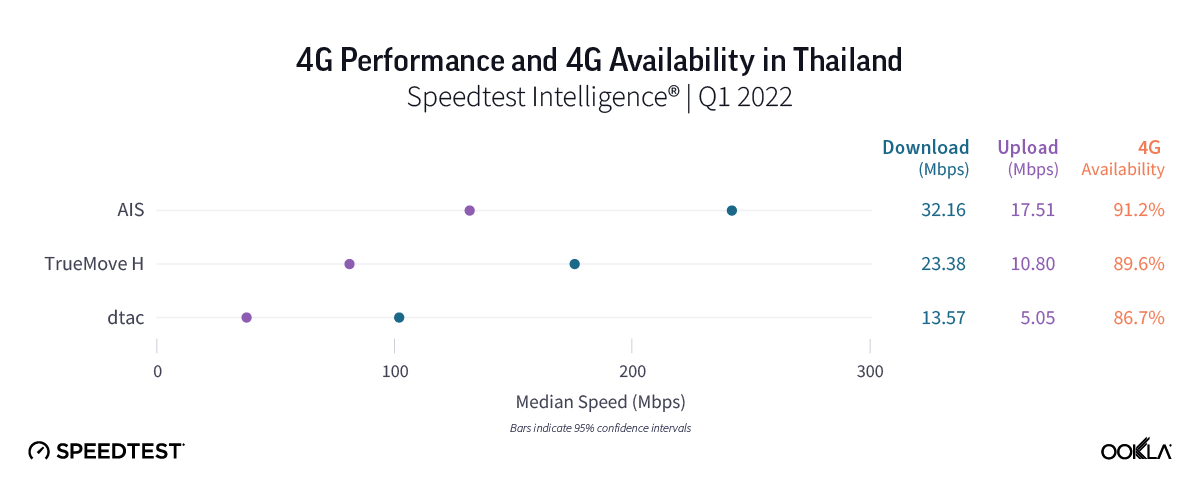
The leaderboard for 4G LTE performance in Thailand looked very similar to the 5G one during Q1 2022. AIS was in the lead (31.16 Mbps for download/17.51 Mbps upload), followed by TrueMove H (23.38 Mbps for download/10.80 Mbps for upload), and dtac (13.57 Mbps for download/ 5.05 Mbps upload), there was a major difference, however, when 4G performance is considered separately to that on 5G. AIS’s median download speed on all technologies combined was almost eight times higher than dtac’s, but AIS’s median download speed on 4G was just double of dtac’s. Furthermore, there was no substantial difference in terms of 4G Availability –  the percentage of users on all devices who spend the majority of their time connected to 4G technology both roaming and on-network – across Thai mobile networks.

Chart of 4G performance among operators in Thailand

Consolidation wave across Asia-Pacific could stifle competition

Merger and acquisitions activity is heating up across the Asia-Pacific region with deals on the table across a number of countries including Thailand, Malaysia, Taiwan, and Indonesia. Thus far, only the merger between Indosat and Tri in Indonesia has received regulatory approval and been completed. This is true in Europe as well, as we discussed in our recent article, with recent examples including the agreed joint venture between MasMovil and Orange in Spain and Iliad’s recent bid for Vodafone Italy. 

A number of studies have attempted to assess the impact of mergers. For instance, in 2017 GSMA analyzed the impact of the 2012 Hutchison/Orange merger in Austria (a 4-to-3 merger) on quality using difference-in-differences (DD) and synthetic control methods. The study concluded that the merger in Austria had a positive and statistically significant effect on quality outcomes. The U.K. telecom regulator, Ofcom, in its Economic Discussion Paper on Market structure, investment and quality in the mobile industry analyzed a number of M&A activities. It concluded that the results of merger-specific analysis are mixed, as there is no evidence that mergers have generated improvements in network quality to the benefit of consumers. Instead, there is some evidence that both investment and average download speeds declined following some of these mergers. Closer to Thailand, Indosat Ooredoo and Hutchison 3 Indonesia (Tri) merged into Indosat Ooredoo Hutchison (IOH) to create a number two player in Indonesia with 26.3% market share as of Q1 2022. It was conditioned upon a number of factors, though, around improved geographic reach and network performance. 

However, there are rare examples of a market moving towards duopoly. In 2011, Philippines mobile market became a duopoly after PLDT acquired Digitel. The deal was studied by regulators for seven months, the main issue being the large amount of the country’s 3G spectrum that the merged operator would control. It eventually passed on condition that PLDT gave up the 10 MHz 3G license held by one of its subsidiaries. Almost a decade later, a third player entered the Philippines, which we will discuss in an upcoming article. 

The shape of the Thai mobile market  

If approved, M&A would bring more MVNOs to the market

With close to 100 million mobile connections, Thailand’s SIM penetration of the population is 140%, meaning that on average a mobile subscriber has 1.58 SIMs. The market is served by four operators: AIS, DTAC, TrueMove H and the government owned National Telecom (NT). NT was formed in January 2021 via a merger of Communications Authority of Thailand (CAT) Telecom and TOT (Telephone Organization of Thailand). 

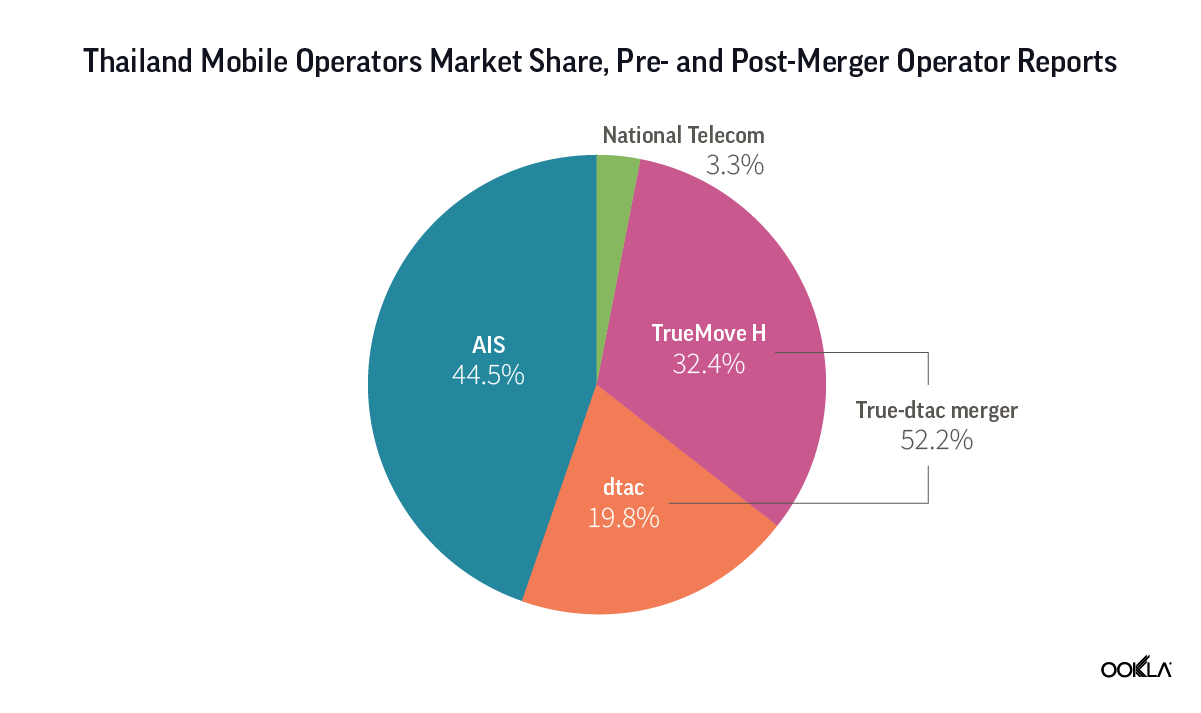
AIS, whose backers include Singtel Group, led the market with 44.5% of all mobile subscriptions, equivalent to 44.6 million subscribers, at the end of March 2022. By contrast, TrueMove H held 33.4% of the market share (32.5 million subscribers), with dtac claiming a 19.8% market share with 19.9 million subscribers. According to industry estimates, NT had less than 3.5 million subscribers in Q1 2022, equating to 3.3% market share. Currently, MVNOs hold a miniscule market share of the Thai market, under 1% combined. NT is the sole operator hosting MVNOs in Thailand since MVNOs were introduced in 2009, despite the fact that all of operators licenses’ terms and conditions have a clause that a minimum 10% of their spectrum capacity should be allocated to MVNOs. Opening up the market to MVNOs is often one of the conditions for M&A to go ahead. 

Chart of mobile operators market share in Thailand

The topic of mergers is widely discussed in Thailand; there have been a number of concerns raised. Thai consumer advocates and academics voice their disapproval of the M&A, saying consumers will be at a disadvantage due to less competition in the market. For instance, the People’s Network Protecting Public Interest claimed that the market would become a de facto duopoly with foreseen price increases of 20-30% in the long term. NT Telecom, which is both a competitor and a minority stakeholder in dtac, disapproved of the True-dtac merger. 

The discussion as to who should approve the merger was put to rest when a legal subcommittee of the National Broadcasting and Telecommunications Commission (NBTC) concluded the telecom regulator has the power to approve or prohibit the planned merger. NBTC is still conducting studies on the impact of the merger, both short-term and long-term, as well setting up a number of independent committees to advise on the best course of action. Most recently, a panel that was tasked with determining whether the merger would have economic impact, M&A could reduce Thailand’s GDP growth by between 0.05% and 1.99%, and increase mobile prices by 2.03%-19.5% depending on the degree of collusion. Against this backdrop, it is hard to imagine that the merger would get a green light. 

If the merger goes ahead, the newly combined entity will become the number one player in Thailand with a 52.2% market share, ahead of the current market leader, AIS. However, it takes time for the companies to merge their operations and it is most likely that in the short term both companies will use their separate brands while working out the go to market proposition. Also the companies’ execs at a recent seminar were at pains to assure that there will be no price hikes if the merger goes ahead, instead because of the economies of scale there will be more investment into the market resulting in more innovation and better customer experience. 

If approved, M&A would change the spectrum landscape 

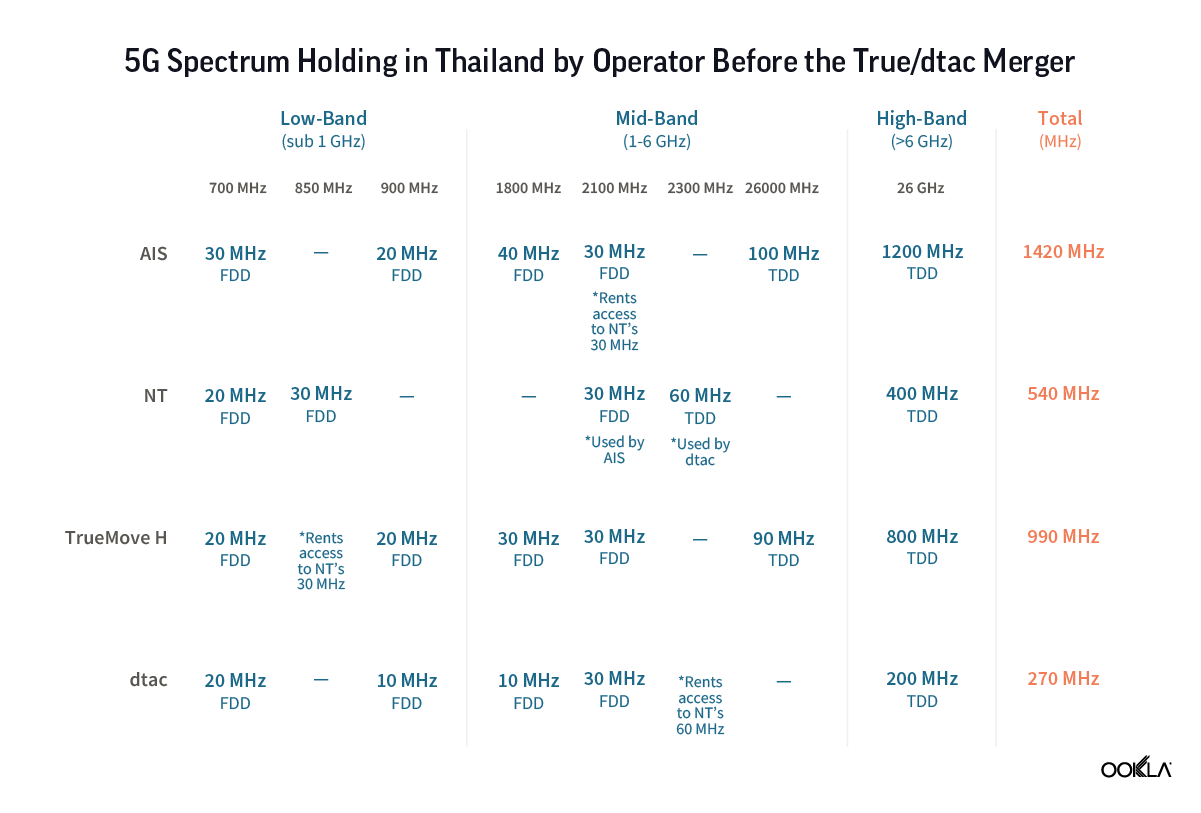
As it stands right now, AIS has the largest amount of 5G spectrum — a total of 1,330 MHz — across low-, mid-, and high-frequency bands. In May 2022, AIS added a further 10 MHz of bandwidth on the 700 MHz spectrum from NT due to the deal with NT Telecom. With this deal, AIS will increase its bandwidth to 40 MHz from August 2022 onward, which should improve its 5G coverage. 

AIS and TrueMove H deployed their initial 5G networks on the 2600 MHz spectrum, while dtac used frequencies in the 26 GHz band. All operators, except for NT, also deployed 5G in the 700 MHz spectrum band when it became available for use in early 2021, following the completion of broadcasting service migration. NT is yet to deploy 5G. 

Chart of 5G holdings in Thailand before TrueMove H and dtac merger

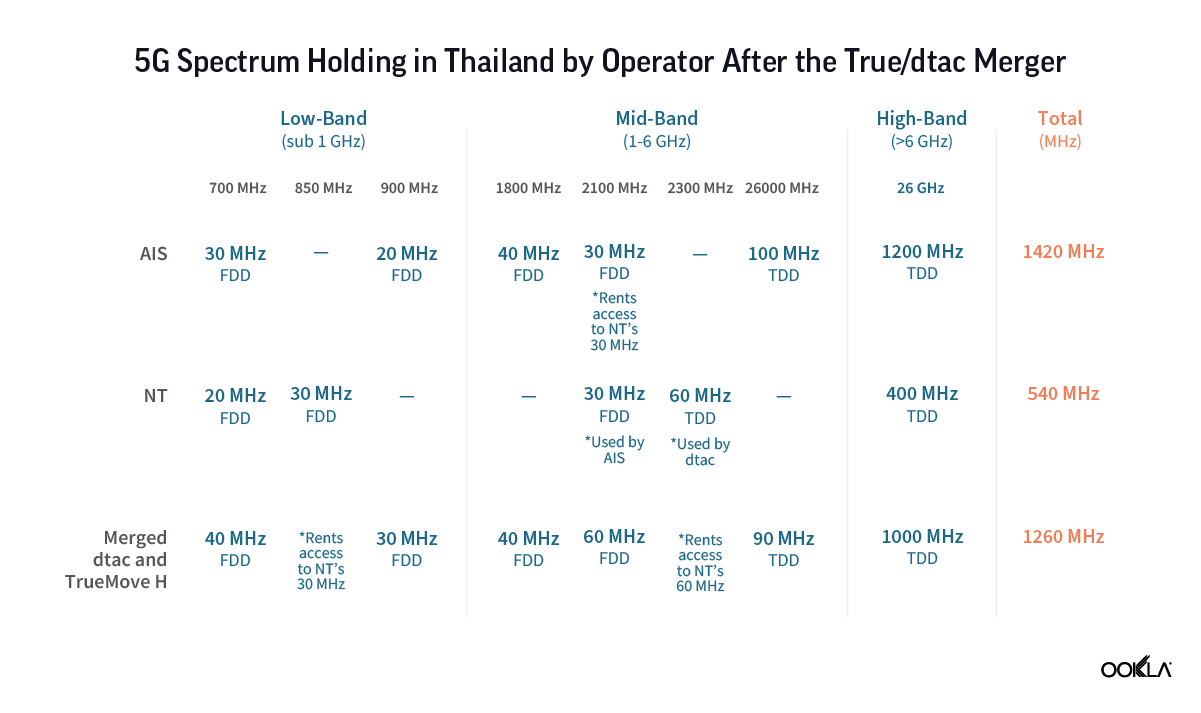
Thanks to the merger, dtac would have access to True’s mid-band spectrum, which should substantially improve its performance. Furthermore, there is another C-band spectrum auction planned in 2022 (3.4-3.7 GHz band). This should have a positive effect on the 5G download speeds as we have seen in the USA when since deployment in the C-band, Verizon’s 5G speeds have set it apart from AT&T.

Chart of 5G holdings in Thailand after TrueMove H and dtac merger

However, it is common practice that operators that undergo mergers have to divest part of their spectrum as an M&A condition. For example, this was the case when Hutchison 3G acquired Orange in Austria, Hutchison 3G bought Telefonica in Ireland and Telefonica merged with E-Plus in Germany. 

The benefits of scale are obvious 

Fixed Mobile Convergence (FMC) bundling is offered by most operators in Thailand due to competitive pressures coming from TrueMove H and AIS. The merger could enable convergent offerings from dtac too, which is solely a mobile player, and would allow it to offer better service in terms of coverage and further expand its market share. According to Analysys Mason, FMC penetration will continue to increase in Thailand, and if the merger is blocked, dtac’s competitive standing will be further disadvantaged. 

On the other hand, True Corporation has a portfolio of services:

  • TrueMove H — mobile operator, which also offers NB-IoT (Narrowband IoT).
  • TrueOnline — broadband internet and fixed-line. It is the largest fixed broadband provider with a 46.7% market share.
  • TrueVision — Pay TV, digital TV and content provider and an online game and influencer network; 3.5M subscribers.
  • True Digital Group — Digital media, data analytics, cybersecurity, IoT, integrated digital health, digital solutions and True Digital Academy.

The merged operator NewCo would remain at its core a telecommunication player but would extend its reach to support the digital transformation of Thailand, in line with Thailand 4.0 vision. The quoted benefits of the “amalgamation” include:

  • Improved 5G coverage with better network quality, reliability and speed.
  • More value-driven convergence or products and services thanks to access to a wider ecosystem of partners.
  • Utilization of consolidated infrastructure such as outlets to expand its outreach to deliver on Thailand 4.0 policy.
  • Greater opex and capex cost efficiencies when deploying 5G networks thanks to the benefit of scale. As a result improving the quality of telecom infrastructure and customer satisfaction.
  • Streamlined efficiencies will deliver better consumer experience and will enable NewCo to invest in future technologies and networks.
  • Positioning Thailand as a regional technology hub.

The NewCo will operate: 

  • Telecom services and the sale and distribution of mobile devices via subsidiaries dtac, TriNet, and TrueMove H — using the 700 MHz, 850 MHz (under agreement with NT), 900 MHz, 1800 MHz, 2100 MHz, and 2300 MHz (under agreement with NT) spectrum.
  • Broadband internet provider via TrueOnline.
  • Pay TV, digital TV, and content provider via TrueVisions.
  • Portfolio of digital services via True Digital Group, and new businesses through artificial intelligence, cloud technology, smart devices, smart cities, amongst others.
  • Venture capital investments, with the intention to raise VC funding of USD 100-200 million with partners to invest in promising digital startups.

The merged operator could provide more competition to AIS across all market segments, not only mobile. AIS Fiber, for instance, holds a 14% market share and differentiated its services with value added and bundling packages. NewCo would build on existing TrueOnline offering and could take a convergent offering to a new level, e.g. quadplay. 

While we await the final decision on the merger, it is clear that dtac is falling behind its competitors when it comes to 5G performance. The recently announced National 5G Alliance aims to further promote the role of 5G in enabling digital transformation. We will monitor Thai operators’ performance and wait for the results for the upcoming mid-band spectrum auction to see whether this will close the performance gap. In the meantime, you can compare mobile performance across operators and countries using Speedtest Intelligence

Ookla retains ownership of this article including all of the intellectual property rights, data, content graphs and analysis. This article may not be quoted, reproduced, distributed or published for any commercial purpose without prior consent. Members of the press and others using the findings in this article for non-commercial purposes are welcome to publicly share and link to report information with attribution to Ookla.

| February 15, 2023

Are 5G Networks Meeting Consumers’ Expectations?

Key messages

  • In-market 5G performance varies widely. Reviewing the top 10% and worst 10% of Ookla® Speedtest Intelligence® samples reveals significant variance in the consumer experience on today’s 5G networks, with 5G speeds peaking at over 1 Gbps for the top 10% of users in the U.A.E on average, but falling to below 20 Mbps for the lower 10% in Norway, the U.S., Japan, Germany, and Spain.
  • Median 5G performance is declining in many early launch 5G markets. While understandable as 5G adoption grows and users in more remote locations access 5G, declining median download speeds also point to investment and deployment challenges in some markets. At the same time, many of these markets are facing economic headwinds, placing more emphasis than ever on cost control. As a result, operators must carefully balance network investment priorities.
  • 5G Net Promoter Scores (NPS) significantly higher than 4G LTE in most markets, but waning. With the exception of Sweden and Qatar, all the early launch 5G markets in our analysis saw 5G NPS fall year-over-year. Operators’ 5G NPS still trade at a premium compared to 4G, and while performance is just one part of the equation, operators should take care to build on the positive sentiment that 5G has brought to date.

Despite impressive headline speeds, 5G performance varies a lot

Median 5G performance allows us to gauge the midpoint of user experience on 5G networks, however it doesn’t paint the full picture. While headline 5G speeds impress, Speedtest Intelligence data lays bare the ups and downs of 5G performance for consumers, even in early launch, advanced 5G markets. We recently looked at 5G network performance over high frequency (mmW) bands, painting a view of the true potential of 5G networks. However, if we look at performance on today’s 5G networks, looking beyond the median at the range of performance between users in the top 10% and those in the lower 10%, Speedtest Intelligence data reveals huge variance in the performance users experience.

Chart of psread of 5g performance, top 10% of samples versus median and lower 10%

The U.A.E. was the fastest 5G market in our analysis, based on median download performance of 545.53 Mbps in December 2022, followed by South Korea and Qatar. However, the top 10% of users in the U.A.E. recorded speeds of at least 1,266.49 Mbps on average, while the lowest 10% of users experienced speeds of 127.52 Mbps or slower on average. At the other end of the scale, Spain recorded a median 5G speed of 94.14 Mbps, but also demonstrated wide variance between the top 10% of samples at 537.95 Mbps or faster and the lowest 10% with 10.67 Mbps or less.

Based on many of the marketing messages around 5G, consumers are led to expect a big bang change in performance. However, with 5G operating over a greater range of spectrum bands than previous generations, including high frequency spectrum which has relatively poorer propagation, it’s understandable that 5G performance will vary more than previous generations of mobile network technology.

5G markets set to face performance challenges during 2023

While globally 5G speeds have remained stable, for many of the markets in our analysis, median 5G download speeds have fallen over the past year. The U.S. was the main outlier, recording the strongest uplift in 5G performance as T-Mobile continued to drive home its performance advantage in the market, while Verizon’s performance improved early in 2022 through its deployment of 5G in C-band spectrum. This trend is likely to continue in 2023 in the U.S., as more C-band spectrum is made available. However, the picture remains concerning for a number of other 5G markets, particularly those where median 5G speeds are at the lower end of the spectrum.

Chart of Year-over-Year change in median 5G download performance

In some markets, 5G was initially priced at a premium to 4G, with operators focused on driving incremental returns on the new network technology. However, operators have been increasingly opening up 5G access by removing incremental costs for consumers and adding prepaid plans too. As 5G adoption scales, it places more strain on the new networks. The challenge for many of these markets is that network performance is likely to degrade further unless network densification picks up. 

For network operators, this investment imperative is occuring amidst macroeconomic headwinds, which are driving up operating costs and putting pressure on consumer and enterprise spend. In addition, there remain challenges in deploying additional 5G cell sites in dense urban areas where demand is strongest, while in some markets EMF limits and other regulations can limit the deployment of high-capacity 5G sites.

Degrading 5G performance impacts consumer sentiment

Net Promoter Score (NPS) from Speedtest Intelligence paints a largely positive picture of current 5G networks. NPS is a key performance indicator of customer experience, categorizing users into Detractors (score 0-6), Passives (score 7-8), and Promoters (score 9-10), with the NPS representing the percentage of Promoters minus the percent of Detractors, displayed in the range from -100 to 100. Across the markets we analyzed, 5G users on average rated their network operator with NPS scores that were universally higher than those for 4G LTE users. However, consumer sentiment for users on 5G networks is beginning to shift, with NPS scores falling, coinciding with lower median 5G performance in many of the markets we analyzed.

Chart of 5G uplift in Net Promoter Scores vs. 4G LTE

Declining performance levels will be a factor driving NPS down for some 5G users. It’s also important to remember that as 5G scales in many of these early launch markets, the profile of 5G users is also changing from predominantly urban-based users, to more of a mix of urban, suburban, and rural users, which brings additional coverage and performance challenges for network operators. We plan to examine the relationship between 5G performance and spectrum in an up-coming content piece. Please get in touch if you’d like to learn more about Speedtest Intelligence data.

Ookla retains ownership of this article including all of the intellectual property rights, data, content graphs and analysis. This article may not be quoted, reproduced, distributed or published for any commercial purpose without prior consent. Members of the press and others using the findings in this article for non-commercial purposes are welcome to publicly share and link to report information with attribution to Ookla.

| December 20, 2021

Growing and Slowing: The State of 5G Worldwide in 2021


5G continues to offer new and exciting ways of rethinking everything from streaming video to performing remote surgery. However, not everyone shares equally in these possibilities as many countries do not have access to 5G and even those that do, do not experience the same level of performance from their 5G connections. We examined Speedtest Intelligence® data from Q3 2021 Speedtest® results to see how 5G speeds have changed, where download speeds are the fastest at the country and capital level, where 5G deployments have increased and what worldwide 5G Availability looked like in Q3 2021. We also looked at countries that don’t yet have 5G to understand where consumers are seeing improvements in 4G access.

5G slowed down at the global level

Median-Speeds-Worldwide_1221-01

It’s common to see new mobile access technologies slow down as adoption scales, particularly early on in the tech cycle. Over the past year from Q3 2020 to Q3 2021, the median global 5G download speed fell to 166.13 Mbps, down from 206.22 Mbps in Q3 2020. Median upload speed over 5G also slowed to 21.08 Mbps (from 29.52 Mbps) during the same period.

More users are logging on to existing 5G networks, and we’re also at the stage in the evolution of 5G where countries that have historically had slower speeds are starting to offer 5G. In addition, the widespread use of dynamic spectrum sharing that has been used to boost early 5G coverage weighs on 5G download speeds. While the dip in speeds looks like a letdown, it’s more of a compromise to enable broader access. With additional spectrum and further deployments slated for 2022, we anticipate speeds will begin to pick up again.

South Korea had the fastest 5G in the world

ookla_5g-download_performance_countries_1221-01-1

South Korea had the fastest median download speed over 5G during Q3 2021, leading a top 10 list that included Norway, United Arab Emirates, Saudi Arabia, Qatar, Kuwait, Sweden, China, Taiwan and New Zealand. Sweden, China, Taiwan and New Zealand were new to the top 10 in 2021 while South Africa (whose 5G was brand new last year), Spain and Hungary fell out of the top 10.

5G expanded to 13 additional countries

ookla_5G-map_1221-01

According to the Ookla® 5G Map, there were 5G deployments in 112 countries as of November 30, 2021. That’s up from 99 countries on the same date a year ago. The total number of deployments increased dramatically during the same time period with 85,602 deployments on November 30, 2021 compared to 17,428 on November 30, 2020, highlighting the degree to which 5G networks scaled during the year. Note that there are often multiple deployments in a given city.

Seoul and Oslo lead world capitals for 5G

ookla_5g-download_performance_capitals_1221-01

Speedtest Intelligence data from Q3 2021 shows a wide range of median 5G speeds among global capitals. Seoul, South Korea and Oslo, Norway were in the lead with 530.83 Mbps and 513.08 Mbps, respectively; Abu Dhabi, United Arab Emirates; Riyadh, Saudi Arabia and Doha Qatar followed. Brasilia, Brazil had the slowest median download speed over 5G on our list, followed by Warsaw, Poland; Cape Town, South Africa and Rome, Italy. Stockholm, Sweden and Oslo, Norway had some of the the fastest median upload speeds over 5G at 56.26 Mbps and 49.95 Mbps, respectively, while Cape Town had the slowest at 14.53 Mbps.

The U.S. had the highest 5G Availability

The presence of 5G is only one indicator in a market, because even in markets where 5G has launched, coverage and adoption can be pretty low. We analyzed 5G Availability to see what percent of users on 5G-capable devices spent the majority of their time on 5G, both roaming and on-network during Q3 2021.

ookla_5g-availability_countries_1221-01

The United States had the highest 5G Availability at 49.2%, followed by the Netherlands (45.1%), South Korea (43.8%), Kuwait (35.5%) and Qatar (34.8%). Brazil had the lowest 5G Availability on our list at 0.8%, followed by Sweden (1.5%), South Africa (2.7%), New Zealand (2.9%) and Hungary (3.6%).

Not all 5G networks are created equal

Ookla Speedtest Intelligence data shows a growing disparity in the performance of 5G networks worldwide, even among the pioneer markets who were among the first to launch the new technology. We see leading markets such as South Korea, Norway, the UAE and China pulling well ahead of key European markets, the U.S. and Japan on 5G download speeds, creating what increasingly looks like two tiers of 5G markets.

ookla_5g-download_performance_1221-01

Part of the reason for this divergence is access to key 5G spectrum bands, with Verizon and AT&T in the U.S. for example, soon to deploy their C-band spectrum holdings for 5G use. However, what really seems to separate these markets is the level of 5G network densification. The number of people per 5G base station ranges from 319 in South Korea and 1,531 in China, to 4,224 in the EU and 6,590 in the US, according to the European 5G Observatory’s International Scoreboard during October 2021.

Despite the noise around 6G, 5G still has a long way to run

Median 5G mobile download speeds across these markets are respectable relative to the International Telecommunication Union’s (ITU) IMT-2020 target of 100 Mbps for user experienced download data rates. However, 5G Speedtest® results in each market demonstrate significant variability, with the bottom 10th percentile only recording speeds in excess of the IMT-2020 target in South Korea and Norway, and falling significantly short in many other markets, with Spain, Italy and the U.S. below 20 Mbps.

The story gets worse for upload speeds, where no market’s median speed broke the IMT-2020 recommended 50 Mbps, and where the bottom 10th percentile lay in single digits across the board. Operators are clearly prioritizing download speeds over upload, which makes sense given the asymmetric nature of demand, with most consumer applications requiring higher download speeds. However, as operators increasingly look to target the enterprise market with 5G connectivity and consumer demand for services such as video calling and mobile gaming continues to rise, operators will need to boost upload speeds.

ookla_5g-upload_performance_1221-01-1

Demand for mobile internet bandwidth continues to grow, up 43% year-on-year in Q3 2021 according to Ericsson’s latest mobility report. Looking ahead to 2022, operators will need to increase the capacity of their 5G networks to tackle this growing demand while driving network speeds to new heights. We’ve seen the impact the deployment of new spectrum can have on congested networks during 2021, with Reliance Jio witnessing a bump in 4G LTE performance and consumer sentiment following its acquisition of additional spectrum in India.

Where 5G still fails to reach

Speedtest Intelligence showed 70 countries in the world where more than 20% of samples were from 2G and 3G connections (combined) during Q3 2021 and met our statistical threshold to be included. These are mostly countries where 5G is still aspirational for a majority of the population. As excited as we are about the expansion of 5G, we do not want to see these countries left behind. Not only are 2G and 3G decades old, they are only sufficient for basic voice and texting, social media and navigation apps. To deliver rich media experiences or video calling, users need access to 4G or higher. Having so many consumers on 2G and 3G also prevents mobile operators from refarming that spectrum to make 4G and 5G networks more efficient.

Countries That Still Rely Heavily on 2G and 3G Connections
Speedtest IntelligenceⓇ | Q3 2021
Country 2G & 3G Samples
Central African Republic 89.9%
Palestine 84.7%
Yemen 72.4%
Turkmenistan 71.8%
Micronesia 56.3%
Madagascar 55.0%
Belarus 53.2%
Rwanda 51.7%
Kiribati 48.4%
Equatorial Guinea 47.6%
Afghanistan 44.4%
South Sudan 43.4%
Guyana 42.3%
Guinea 37.0%
Angola 36.8%
Cape Verde 35.9%
Tajikistan 35.6%
Zimbabwe 34.7%
Benin 34.4%
Togo 33.8%
Ghana 33.0%
Sierra Leone 31.7%
Antigua and Barbuda 30.2%
Vanuatu 30.1%
Lesotho 30.0%
Syria 29.6%
Moldova 29.4%
Saint Kitts and Nevis 28.9%
Mozambique 28.8%
Sudan 28.4%
Palau 28.3%
Grenada 28.1%
Tanzania 27.6%
Uganda 27.5%
Niger 27.5%
Gabon 27.5%
Haiti 27.4%
Suriname 27.4%
Tonga 27.3%
Liberia 27.0%
Namibia 26.7%
Swaziland 26.5%
The Gambia 26.3%
Saint Vincent and the Grenadines 26.3%
Dominica 26.3%
Somalia 26.1%
Cook Islands 26.0%
Zambia 25.9%
Barbados 25.7%
Armenia 25.5%
Algeria 25.4%
Papua New Guinea 25.2%
Jamaica 24.5%
Venezuela 24.2%
Ethiopia 24.1%
Uzbekistan 24.0%
El Salvador 23.5%
Honduras 23.1%
Nigeria 23.0%
Solomon Islands 22.8%
Caribbean Netherlands 22.7%
Botswana 22.3%
Anguilla 21.7%
Mauritania 20.6%
Saint Lucia 20.5%
Bosnia and Herzegovina 20.3%
Burundi 20.3%
Ecuador 20.2%
Ukraine 20.1%
Trinidad and Tobago 20.0%

We were pleased to see the following countries come off the list from last year, having dropped below the 20% threshold: Azerbaijan, Bangladesh, Belize, Burkina Faso, Cameroon, Costa Rica, Côte d’Ivoire, DR Congo, Iraq, Kenya, Laos, Libya, Maldives, Mali, Mauritius, Mongolia, Nicaragua, Paraguay and Tunisia. While countries like Palestine, Suriname, Ethiopia, Haiti and Antigua and Barbuda are still on this list, they have improved the percentage of their samples on these outmoded technologies when compared to last year (dropping 10-15 points, respectively), 2G and 3G samples in Belarus increased 6.7 points when comparing Q3 2021 to Q3 2020.

We’re excited to see how performance levels will normalize as 5G expands to more and more countries and access improves. Keep track of how well your country is performing on Ookla’s Speedtest Global Index.

Ookla retains ownership of this article including all of the intellectual property rights, data, content graphs and analysis. This article may not be quoted, reproduced, distributed or published for any commercial purpose without prior consent. Members of the press and others using the findings in this article for non-commercial purposes are welcome to publicly share and link to report information with attribution to Ookla.

| December 18, 2022

Stable and Expanding: The State of Worldwide 5G in 2022


5G is no longer a new technology, however, consumers in many countries are still waiting to see the full benefits of 5G (or even to connect to 5G at all). We examined Speedtest Intelligence® data from Q3 2022 Speedtest® results to see how 5G performance has changed since last year, where download speeds are the fastest at the country level, and how satellite technologies are offering additional options to connect. We also looked at countries that don’t yet have 5G to understand where consumers are seeing improvements in 4G LTE access.

5G speeds were stable at the global level

Graphic of 5G median speed performance worldwide.

In 2021, we discussed how an expansion of 5G access led to a decline in overall speed at the global level. This year showed a stabilization in overall speed, even as 5G access broadened, with a median global 5G download speed of 168.27 Mbps in Q3 2022 as compared to 166.13 Mbps in Q3 2021. Median upload speed over 5G slowed slightly to 18.71 Mbps (from 21.08 Mbps) during the same period. According to the Ookla® 5G Map™, there were 127,509 5G deployments in 128 countries as of November 30, 2022, compared to 85,602 in 112 countries the year prior.

South Korea and the United Arab Emirates led countries for 5G speeds

Chart of fastest countries for median 5G download speed

South Korea and the U.A.E. had the fastest median download speed over 5G at 516.15 Mbps and 511.70 Mbps, respectively, during Q3 2022, leading a top 10 list that included Bulgaria, Qatar, Saudi Arabia, Singapore, Kuwait, New Zealand, Bahrain, and Brazil. Bulgaria, Singapore, Bahrain, and Brazil were new to the top 10 in 2022, while Norway, Sweden, China, and Taiwan fell out of the top 10.

Satellite became more accessible but performance slowed

2022 saw a proliferation of fast, low-earth orbit (LEO) satellite internet from Starlink across the world. Q1 2022 saw Starlink speeds increase year over year in Canada and the U.S., with Starlink in Mexico having the fastest satellite internet in North America, Starlink in Lithuania the fastest in Europe, Starlink in Chile the fastest in South America, and Starlink in Australia the fastest in Oceania.

Q2 2022 saw Starlink speeds decrease in Canada, France, Germany, New Zealand, the U.K., and the U.S. from Q1 2022 as Starlink crossed the 400,000 user threshold across the world. Starlink in Puerto Rico debuted as the fastest satellite provider in North America. Starlink outperformed fixed broadband averages in 16 European countries. Starlink in Brazil had the fastest satellite speeds in South America. And Starlink in New Zealand was the fastest satellite provider in Oceania.

During Q3 2022, Starlink performance dipped once again from Q2 2022 in Canada and the U.S., while remaining about the same in Chile. Starlink in Puerto Rico and the U.S. Virgin Islands had the fastest satellite speeds in North America, while Starlink in Brazil again was the fastest satellite provider in South America.

With Viasat, HughesNet, and Project Kuiper set to launch huge LEO constellations in 2023, consumers around the world are poised to have more fast satellite internet options, particularly as the European Commission makes its own play for a constellation and Eutelsat and OneWeb potentially merging.

5G Availability points to on-going challenges

5G Availability measures the proportion of Speedtest users with 5G-capable handsets, who spend a majority of time connected to 5G networks. It’s therefore a function of 5G coverage and adoption. We see wide disparity in 5G Availability among markets worldwide, with for example the U.S. recording 54.3% in Q3 2022, well ahead of markets such as Sweden and the U.A.E., with 8.6% and 8.3% respectively.

Chart of 5G availability in select markets, based on users with 5G-capable handsets

Critical levers for mobile operators to increase 5G Availability include:

  • Increasing 5G coverage by deploying additional base stations
  • Obtaining access to, or refarming, sub-GHz spectrum, to help broaden 5G coverage, as sub-GHz spectrum has superior propagation properties than that of higher frequency spectrum bands.
  • Encouraging 5G adoption among users with 5G-capable handsets.

Speedtest Intelligence points to 5G adoption challenges in some markets, with 5G Availability dropping in Bulgaria, South Korea, the Netherlands, and the U.A.E. As more users acquire 5G-capable devices, operators need to balance their pricing models to ensure users have sufficient incentives to purchase a 5G tariff.

Chart of percentage change in 5G availability in select markets, based on users with 5G-capable handsets

Where 5G continues to fail to reach

Speedtest Intelligence showed 29 countries in the world where more than 20% of samples were from 2G and 3G connections (combined) during Q3 2022 and met our statistical threshold to be included (down from 70 in Q3 2021). These are mostly countries where 5G is still aspirational for a majority of the population, which is being left behind technologically, having to rely on decades-old technologies that are only sufficient for basic voice and texting, social media, and navigation apps. We’re glad to see so many countries fall off this list, but having so many consumers on 2G and 3G also prevents mobile operators from making 4G and 5G networks more efficient. If operators and regulators are able to work to upgrade their users to 4G and higher, everyone will benefit.

Countries That Still Rely Heavily on 2G and 3G Connections
Speedtest IntelligenceⓇ | Q3 2021
Country 2G & 3G Samples
Central African Republic 76.2%
Turkmenistan 58.5%
Kiribati 51.6%
Micronesia 47.4%
Rwanda 41.1%
Belarus 39.7%
Equatorial Guinea 37.7%
Afghanistan 36.7%
Palestine 33.5%
Madagascar 27.5%
Sudan 27.4%
Lesotho 26.5%
South Sudan 26.3%
Benin 26.0%
Guinea 25.5%
Cape Verde 24.3%
Tonga 24.3%
Syria 23.4%
The Gambia 23.4%
Ghana 23.3%
Palau 22.9%
Niger 22.8%
Tajikistan 22.7%
Mozambique 22.4%
Guyana 21.8%
Togo 21.8%
Congo 21.1%
Moldova 20.8%
Saint Kitts and Nevis 20.0%

We were pleased to see the following countries come off the list from last year, having dropped below the 20% threshold: Algeria, Angola, Anguilla, Antigua and Barbuda, Armenia, Barbados, Bosnia and Herzegovina, Botswana, Burundi, Caribbean Netherlands, Cook Islands, Dominica, Ecuador, El Salvador, Ethiopia, Gabon, Grenada, Haiti, Honduras, Jamaica, Liberia, Mauritania, Namibia, Nigeria, Papua New Guinea, Saint Lucia, Saint Vincent and the Grenadines, Sierra Leone, Solomon Islands, Somalia, Suriname, Swaziland, Tanzania, Trinidad and Tobago, Uganda, Ukraine, Uzbekistan, Vanuatu, Venezuela, Yemen, Zambia, and Zimbabwe. While countries like Belarus, Cape Verde, Central African Republic, Guinea, Guyana, Madagascar, Palestine, Rwanda, South Sudan, Tajikistan, Togo, and Turkmenistan are still on this list, they have improved the percentage of their samples on these outmoded technologies when compared to last year by at least 10 points. Palestine improved by more than 50 points. 2G and 3G samples in Kiribati increased 3.2 points when comparing Q3 2022 to Q3 2021.

We’re glad to see performance levels normalize as 5G expands to more and more countries and access improves and we are optimistic that 2023 will bring further improvements. Keep track of how well your country is performing on Ookla’s Speedtest Global Index™ or track performance in thousands of cities worldwide with the Speedtest Performance Directory™.

Ookla retains ownership of this article including all of the intellectual property rights, data, content graphs and analysis. This article may not be quoted, reproduced, distributed or published for any commercial purpose without prior consent. Members of the press and others using the findings in this article for non-commercial purposes are welcome to publicly share and link to report information with attribution to Ookla.

| July 24, 2023

5G in Asia Pacific: Deployment Momentum Continues

The Asia Pacific region has successfully implemented 5G technology despite the challenges posed by the pandemic, global economy, and geopolitical climate. South Korea, China, and Japan have led the way in 5G network deployment. With the continued rollout of 5G networks in other regional markets, Asia Pacific is on track to become the largest 5G market globally.

Key messages

  • Advanced Asia Pacific markets have taken the lead in the 5G rollout. Countries such as South Korea, Australia, and China, were among the first in the world to launch commercial 5G networks as more markets joined the ranks.
  • 5G performance outranks Europe. Early adopters in the Asia Pacific region have outperformed major European markets in terms of 5G performance. This is mainly due to factors like early spectrum availability and supportive government policies. 
  • 5G Availability varies. The region experiences varying levels of 5G Availability and adoption due to factors like population density, device affordability, and tariffs.
  • Seoul and Kuala Lumpur are the top cities for 5G performance, boasting median download speeds of 533.95 Mbps and 523.44 Mbps, respectively.
  • 5G helps to narrow the digital divide. 5G FWA is a viable alternative to traditional fixed broadband to narrow down the digital divide in the region

South Korea sets the pace as 5G networks expand across the region

Many of the more advanced markets in the Asia Pacific have been the frontrunners in terms of 5G rollout. South Korea was the first market in the world to deploy a nationwide 5G network in April 2019, followed by Australia, the Philippines, China, and New Zealand later that year. As predicted by GSMA Intelligence, the recent second wave of 5G rollouts in the region in countries such as Indonesia, India, and Malaysia will see Asia Pacific becoming one of the largest 5G markets in the world by 2025.

5G Launch Timeline in Selected Asia Pacific and European Markets

Allocation of spectrum resources is crucial

In our recent spectrum analysis, we discussed how important spectrum is for the performance and coverage of 5G. In general, regulators in the Asia Pacific region have been quick to allocate spectrum for 5G applications, and in many cases, operators have been able to secure substantial bandwidth in the key C-band.

List of the 5G Pioneer Band Spectrum Awards Across Select Asia Pacific Countries

The mid-band spectrum is the most frequently awarded spectrum band in the Asia Pacific region. It is the top choice for commercial 5G deployment because it balances 5G coverage and capacity. In some markets, 5G deployment uses low-band (sub 1 GHz) frequencies, allowing for wider outdoor 5G coverage and better penetration inside buildings in urban and suburban areas. However, this may come at the expense of the median download speed, which typically peaks at around 100 Mbps.

For some markets, 5G spectrum awards are subject to strict milestones and requirements. Operators in South Korea were required to have 22,500 base stations by the end of 2021, 45,000 by the end of 2023, and 150,000 base stations upon completion of their 3.5 GHz spectrum rollout. Additionally, within three years, there were required to install 15,000 base stations utilizing 28 GHz. However, a review by South Korea’s Ministry of Science and ICT (MSIT) found that all mobile operators met the minimum requirements for the 3.5GHz spectrum but not the 28GHz spectrum. Consequently, the ministry has withdrawn all operators’ spectrum licenses in the 28GHz band. In our recent mmWave analysis, we thoroughly covered the performance and progress inherent in that spectrum band.

Asia Pacific outpaced major European markets in terms of 5G performance

While Europe and the Asia Pacific markets share similarities such as large cultural diversity, customers with varying demographics, and mixed regulations and policies, our recent analysis of European 5G performance revealed that early 5G adopters in the Asia Pacific region performed better than some major European markets. 

Chart of Median 5G Download Speed in Asia Pacific Markets Compared to European Benchmarks

According to Speedtest Intelligence® H1 2023 data, several markets in the Asia Pacific region had faster median download performance compared to the top five European economies. Malaysia and South Korea led the pack with speeds of over 500 Mbps, with Malaysia reporting a median download performance of 512.10 Mbps, and South Korea at 503.99 Mbps  – an impressive accomplishment for Malaysia, which launched 5G 3.5 years after South Korea and has caught up to them in performance. Both countries have notable differences in terms of their telecommunications landscapes. The Malaysian government went with a nationwide single wholesale network (SWN) approach as its 5G deployment plan. Digital Nasional Berhad (DNB) was established in 2021 to construct and operate the 5G network infrastructure and provide 5G services to mobile network operators at wholesale prices. South Korea has long been at the forefront of mobile technology and boasts one of the highest internet penetration rates globally. As a result of its early commitment to 5G development, South Korea became the first market in the world to launch a commercial 5G network.

During the same period, Singapore, India, New Zealand, China, and Australia achieved a median 5G download speed exceeding 200 Mbps. In comparison, only France recorded speeds above 200 Mbps among the European countries mentioned, while Italy, Germany, United Kingdom, and Spain, recorded median download speeds below 150 Mbps.

5G Availability and adoption vary across the region

Chart of 5G Availability in Selected Markets in Asia Pacific and Europe

5G Availability (the percentage of users on 5G-capable devices that spend most of the time with access to 5G networks) varied widely across the Asia Pacific region during H1 2023. Factors such as access to low-band spectrum and affordability and availability of 5G devices influence each market’s reported 5G Availability. Analysis based on data from Speedtest Intelligence shows that Hong Kong stands out as the only country analyzed to have surpassed 40% 5G Availability, reaching 42.3% in H1 2023. Part of the reason is the city’s high population density, 5G coverage that reaches over 90% of the population, and a high 5G smartphone penetration rate, which Counterpoint Research reported as 78% in Q1 of 2023.

Despite Australia being 78 times larger than South Korea, and being one of the least densely populated countries, both countries reported similar 5G Availability rates, at around 36.6%. Counterpoint Research reported a 5G smartphone penetration rate of more than 80% for both countries, with South Korea at 88% and Australia at 82%. Across the European markets, France, Spain, Germany, and the U.K. ranged between 20%-30%. Similarly, Thailand also falls within this range at 26.8%. 

Chart of 5G Connections as Proportion of All Connections in Select Markets in Asia Pacific and Europe

Based on Q2 2023 data from GSMA Intelligence, South Korea, China, and Japan led in 5G adoption, measured as the percentage of 5G connections compared to total connections, higher than the selected European markets looked at in this report. South Korea had a total of 31.3 million 5G connections, which accounted for more than 48% of all mobile connections in the country, while China boasts over 700 million 5G connections, equivalent to 41% of connections. Other early adopters of 5G in the region, such as Japan, Hong Kong, and Australia, have all seen a considerable rise in their total 5G connections from the previous year. Japan experienced a 76% increase of 5G connections between Q2 2022 to Q2 2023, to 60.8 million connections. Hong Kong increased by 65% to 4.8 million, and Australia had 8.8 million connections, up by almost 40% during the same period of time.

Seoul and Kuala Lumpur are the top cities in the Asia Pacific region for 5G speeds.

Map of 5G Performance and 5G Availability Across Selected Cities in Asia Pacific

Given that both Malaysia and South Korea are ahead in 5G performance among their peers, it is unsurprising that their capital cities came first as well in the ranking of selected cities. In H1 2023, Seoul had a median download speed of 533.95 Mbps, while Malaysia’s capital, Kuala Lumpur, reported a median download speed of 523.44 Mbps. Digital Nasional Berhad (DNB), Malaysia’s designated 5G wholesale provider, reported 90% 5G coverage of populated areas (COPA) throughout Kuala Lumpur at the end of 2022. 

Despite being one of the latest markets to launch 5G, the Indian cities of Delhi and Mumbai performed well in the cities’ speeds ranking. Both cities reported median download speeds of over 300 Mbps in H1 2023, with Delhi at 357.43 Mbps and Mumbai at 319.45 Mbps. While Kuala Lumpur, Mumbai, and Delhi have shown 5G performance comparable to or even exceeding those of well-established 5G markets in the region, their 5G networks are still relatively new. As a result, these cities have lower 5G Availability than others as anticipated.

Metro Manila, with one-third of the population of the Philippines, had the lowest median download speed among all the cities in this report for H1 2023, with a speed of 135.51 Mbps. During the same period, Metro Manila reported a 5G availability rate of 35.7%, slightly lower than Seoul (35.9%) and Sydney (39.2%).

Breaking the digital divide with 5G FWA

The benefits of 5G go beyond the faster speeds compared to 4G. It also plays a role in bringing connectivity to underserved areas. Although developed markets in the Asia Pacific are leading in ultra-fast, fixed fiber broadband, there is still a portion of the region where internet connectivity is expensive, unavailable, or insufficient. Many people in these underserved regions rely on mobile devices to access the internet. According to GSMA Intelligence, mobile broadband networks are accessible to more than 96% of the population, making it the primary option for internet access in many households. 

In some markets, mobile operators see 5G, particularly 5G fixed-wireless access (FWA) services, as a viable alternative to traditional fixed broadband. While FWA is not a new concept, the use of 5G technology is expected to accelerate its growth, especially in areas where it is not economically feasible to deploy high-speed fixed broadband networks. According to GSMA Intelligence, nearly three in five users who either have upgraded or plan to upgrade to 5G find the idea of using 5G for home broadband appealing. FWA is becoming one of the operators’ primary 5G use cases, providing an opportunity to increase revenue and monetize network investments and wireless spectrum.

The Asia-Pacific region is seeing a rise in the adoption of 5G FWA, with Southeast Asia leading the way. In 2019, Globe Telecom in the Philippines, became the first country in the region to launch FWA. Other regional operators, such as Telkomsel in Indonesia and AIS in Thailand, have also begun offering FWA services. In New Zealand, operators plan to provide FWA coverage to 90% of the population by the end of 2023.

While 5G FWA shows promising growth potential, operators need to ensure that as 5G adoption in the network increases, they have the capacity to support their FWA services and the spectrum to guarantee quality. When the demand for 5G FWA service grows, operators may have to look at utilizing the mmWave spectrum to maintain the quality of their FWA services while keeping network capacity intact.

We will keep a close eye on the progress and effectiveness of 5G implementation throughout the Asia Pacific region. If you are interested in benchmarking your performance or if you’d like to learn more about internet speeds and performance in other markets around the world, visit the Speedtest Global Index.

Ookla retains ownership of this article including all of the intellectual property rights, data, content graphs and analysis. This article may not be quoted, reproduced, distributed or published for any commercial purpose without prior consent. Members of the press and others using the findings in this article for non-commercial purposes are welcome to publicly share and link to report information with attribution to Ookla.

| February 22, 2023

Starlink Resurgence? Speeds Increase in Europe and Oceania

Ookla® is back with exciting, fresh data from Q3 and Q4 2022 for SpaceX’s Starlink and Sky Logic in Europe and Oceania, as well as new Starlink markets we haven’t yet featured in our ongoing series on satellite internet. With the FCC greenlighting Amazon’s Project Kuiper and many other exciting satellite developments launching this year, we’re certain all eyes will be on the sky in 2023 as new orbital connectivity options become available for consumers.

This analysis includes Starlink results from six new countries, and data for Starlink and Sky Logic in Europe and Starlink in Oceania. We also examine how Starlink’s internet performance has changed over the past year in Australia, Austria, Belgium, Croatia, France, Germany, Ireland, Italy, the Netherlands, New Zealand, Poland, Portugal, and the United Kingdom.

Starlink is mostly speeding up again from Q3 to Q4 2022, but is still slower than a year ago

As Starlink rides the wave of becoming an increasingly popular connectivity option for consumers, we’ve seen the service speed up and then slow down year-over-year in most markets. However, Q4 2022 data shows many countries are experiencing a modest rise in median download speeds when compared to Q3 2022. That’s encouraging for consumers, especially as Starlink hit over 1 million users in Q4 2022, and could be a sign that Starlink seems to be maturing its constellation’s capacity. That’s particularly intriguing as Starlink launches more next-gen satellites, which were first deployed at the tail end of Q4 2022 and will most likely show up in Q1 2023 results.

In Europe, all the countries we evaluated for year-over-year median download speeds were slower for Q4 2022 than Q4 2021 when there were fewer users on each network. Most countries showed between 10-20% slower speeds in Q4 2022 than what users experienced in Q4 2021, including Ireland (at least 11% slower), Austria (at least 13%), Portugal (at least 14%), Italy (at least 15%), Germany (at least 16%), and the U.K. (at least 19%). Users in France saw very similar speeds year over year, with just a 4% decrease from Q4 2021 to Q4 2022, while users in Poland saw a large decrease (at least 56% slower), and users in the Netherlands (at least 21%) and Belgium (at least 28%) saw substantial decrease during the same period.

In Oceania, Starlink year-over-year results were mixed, with Starlink’s download speed in Australia 24% slower in Q4 2022 than during Q4 2021, while in New Zealand it was 4% faster in Q4 2022 than Q4 2021.

Starlink in Denmark and Switzerland had the fastest satellite internet in Europe during Q4 2022

Speedtest Intelligence® reveals there was no fastest satellite provider in Europe during Q4 2022, though Starlink in Denmark (147.52 Mbps) and Switzerland (136.03 Mbps) led the pack for fastest median download speed. In all, Starlink download speeds were faster than 100 Mbps in 10 out of 15 European countries during Q4 2022 — a rise from just five out 15 in Q3 2022. 

Starlink outperformed fixed broadband providers over download speed in eight countries, including: Austria (105.67 Mbps), Belgium (104.84 Mbps), Croatia (102.99 Mbps), Czechia (64.67 Mbps), Germany (94.37 Mbps), Ireland (103.39 Mbps), Italy (101.06 Mbps), and the U.K. (96.79 Mbps). Fixed broadband providers were faster than satellite providers analyzed in Denmark, France, Netherlands, and Poland. Results were too close to call in Sweden with fixed providers at 106.73 Mbps and Starlink at 101.83 Mbps, as well as Portugal with Starlink at 108.02 Mbps and fixed broadband at 117.97 Mbps. Skylogic was too close to call between the median fixed broadband speed in Italy at 55.50 Mbps to 59.40 Mbps, and had download speeds faster than 40 Mbps in France (44.46 Mbps) and Sweden (48.09 Mbps).

For upload speeds, every country’s combined fixed broadband providers had faster median upload speeds than every satellite provider, though Starlink in Portugal had the fastest upload speed among satellite providers at 20.86 Mbps. All Starlink upload speeds ranged between 10-20 Mbps except Poland (9.79 Mbps) and Denmark (8.04 Mbps). 

Multi-server latency for all satellite providers was higher than fixed broadband providers in every European country in Q4 2022, which ranged from 12.34 ms in Sweden to 23.46 ms in Italy. However, Starlink had a median multiserver latencies of less than 60 ms in the U.K. (53.24 ms), Portugal (56.81 ms), and the Netherlands (58.85 ms). Most latencies were between 60-75 ms, with Poland having the highest latency at 86.46 ms — still low enough to have a good quality of experience and be able to video chat.

Starlink in New Zealand was the fastest satellite provider in Oceania

During Q4 2022, Starlink in New Zealand had the fastest median download speed among satellite providers in Oceania at 124.72 Mbps, followed by Starlink in Australia (106.43 Mbps), and Starlink in Tonga (35.15 Mbps). However, New Zealand fixed broadband outperformed Starlink, while Starlink in Australia outperformed fixed broadband providers. In Tonga, speeds were too close to call. 

Speedtest Intelligence shows Starlink falling behind fixed broadband providers for median upload speeds in New Zealand (16.89 Mbps) and Australia (11.38 Mbps), while Tonga was again too close to call.

Multi-server latency was higher over Starlink than fixed broadband in all three countries we surveyed in Oceania during Q4 2022. However, Starlink’s median latency was under 50 ms in New Zealand (48.11 ms), which is a very exciting development for consumers, especially with latency becoming an increasingly important metric. Starlink latency in Australia was higher at 65.52 ms, while Tonga followed at 88.81 ms.

New Q4 2022 Starlink countries show very promising results

Speedtest Intelligence shows the six new countries where we found new Starlink data are off to a roaring start in Q4 2022, which include Bulgaria, Finland, Jamaica, Japan, Latvia, and Malta. Starlink had faster median download speeds than the country’s respective fixed broadband providers combined in two countries: Bulgaria (110.76 Mbps versus 65.69 Mbps), and Jamaica (87.43 Mbps vs. 48.34 Mbps), while results were too close to call in the remaining four markets. However, Starlink showed promising 100+ Mbps speeds in Japan (156.94 Mbps), Finland (102.70 Mbps), and Malta (101.36 Mbps). 

Median upload speeds for Starlink lagged behind fixed broadband providers in all markets, though Malta was too close to call (20.40 Mbps for Starlink and 20.25 Mbps for fixed broadband). Starlink upload speeds ranged from about 14 Mbps to 20 Mbps in every market.

Consumers and enterprises stand to benefit from satellite developments in 2023

Starlink dominated headlines in 2022 — and for good reason. They’ve gained over 1 million users worldwide, will be available in connected vehicles, planes, RVs, and ships, partnered with T-Mobile to bring Starlink to mobile devices, and launched their second-gen satellites at the end of 2022. But that could very seriously change in 2023 with multiple competitors deploying major offensives in the satellite market. We’ll say it again: there is a new space race for connectivity being waged, and we’re just at the tip of what’s to come.

Here are some major updates about what’s next for various different satellite competitors:

Amazon’s Project Kuiper approved by the FCC

The biggest news concerning satellite connectivity is the FCC approving Amazon’s Project Kuiper constellation, which will include 3,236 satellites in an LEO array. On two fronts, this poses two potential challenges for Starlink: on one hand, Amazon has the global reach, scale, and consumer base that being one of the largest companies in the world provides. On the other, Blue Origin is a direct competitor of SpaceX, and won’t have to rely on the service or other vendors to launch their array into space. Amazon is in a good position to compete and Project Kuiper could become a major player if their prototypes, which will be launched in early 2023, reach speeds anywhere close to competing with broadband internet. 

Viasat set to launch Viasat-3 arrays around April 8, 2023

Long-term incumbent satellite internet provider, Viasat, has a big year ahead after years of planning and providing connectivity to remote locations around the world. Viasat is finally set to launch its Viasat-3 array, which aims to provide 1 Terabit per second (Tbps) of network capacity on each satellite, allowing its users to experience 100+ Mbps connections; that’s a huge improvement for the mainly GEO provider. While consumers likely won’t see these results until Q4 2023, we’re very excited to see how Viasat improves its network.

Eutelsat’s merger with OneWeb approved by Eutelsat board, second-gen array being planned

One of the biggest mergers in recent years among satellite providers has jumped a major hurdle and was approved by the Eutelsat board. While the combined entities still have to be approved by shareholders and regulators, this merger could expand both companies’ market share, particularly in India, which has fast become an important satellite market. Furthermore, OneWeb is already planning a second-gen satellite, which they’re aiming to launch in 2025.

European Commission forges ahead on Constellation Iris

The European Union has been working to create its own satellite constellation since 2020, and during November 2022, agreed to a plan to commit €2.4 billion for a third satellite array named Iris, in addition to Galileo and Copernicus. The project, which includes GEO, MEO, and LEO arrays, will help support EU connectivity priorities including the economy, environment, security, and defense, and is hoping to launch in 2024, and be fully operational by 2027.

HughesNet aiming to launch Jupiter 3 array in H1 2023

Incumbent satellite internet provider HughesNet is planning to launch its new Jupiter 3 array in the first half of 2023, which will help expand its network capacity, “doubling the size of the Hughes JUPITER fleet over North and South America.” While the Jupiter 3 array will still be a GEO constellation, the added network capacity will alleviate congested networks and give consumers more bandwidth to use the internet.

Ookla will continue monitoring new satellite internet developments

As 2023 continues to shape up as a pivotal year for satellite internet providers, we’ll be watching the sky to make sure providers are providing the connectivity consumers need. We’ll continue our series next quarter with Q4 2022 and Q1 2023 data from North and South America and any new countries where Starlink launches, and be back with Europe and Oceania data in Q3 2023. In the meantime, be sure to download the Speedtest® app for Windows and Mac computers or for iOS or Android for devices and see how your satellite internet stacks up to our findings.

Ookla retains ownership of this article including all of the intellectual property rights, data, content graphs and analysis. This article may not be quoted, reproduced, distributed or published for any commercial purpose without prior consent. Members of the press and others using the findings in this article for non-commercial purposes are welcome to publicly share and link to report information with attribution to Ookla.

| July 29, 2024

Faster Speeds and the Promise of New Use Cases is Driving 5G SA Adoption

The deployment of 5G networks is progressing as demand for faster and more reliable connectivity continues to grow. The standalone (SA) deployment model marks a significant milestone in the evolution of 5G, aiming to offer lower latency, increased bandwidth, and improved reliability compared to earlier network configurations. In this article, we use Ookla Speedtest Intelligence® data to track 5G SA deployments since Q2 2023, 5G SA service adoption, and examine its impact on network performance. We also highlight key regions and countries that made notable advancements in 5G SA infrastructure.

Key Takeaways:

  • India, the U.S., and Southeast Asia are at the forefront of 5G SA adoption. T-Mobile and SK Telekom were among the first to launch 5G SA in 2020, while Chinese operators and Jio in India lead in terms of active 5G SA users. Europe somewhat lags, with operators still hesitant due to the relatively low ROI on existing 5G investments and unclear business cases for 5G SA. However, Europe has the highest number of operators planning to launch it.
  • The U.A.E. and South Korea lead the world in 5G SA performance. 5G SA download speeds reached 879.89 Mbps and 729.89 Mbps, respectively. Their 5G SA upload speeds were also impressive, at 70.93 Mbps and 77.65 Mbps, respectively. This performance is a result of significant advancements made by local operators in deploying 5G SA and testing advanced features such as network slicing and mobile edge computing (MEC).
  • The change in speed of 5G SA varied widely between countries over a year. Speedtest Intelligence data shows that 5G SA performance declined in many countries between Q2 2023 and Q2 2024, primarily driven by increased user base and network traffic. Conversely, markets such as Canada and the U.S. improved their performance thanks to access to additional spectrum.

5G SA deployments are expected to increase this year as adoption gains momentum and ecosystem matures

Most existing 5G deployments use the non-standalone (NSA) model which uses the 4G core network. This model is faster to roll out, requires less investment, and maximizes existing network assets. Unlike 5G NSA, 5G SA uses a dedicated 5G core network, unlocking the full capabilities of 5G with better speed, latency, support for large numbers of devices, and more agile service creation. It also enables new features such as network slicing where an operator can dedicate a network segment to specific customers or use cases. Furthermore, the core network functions provided by a cloud-native architecture enable more scalability and automation than physical or virtualized architectures. However, this comes with higher infrastructure complexity, investment as well as staff training costs.  Many operators use NSA as a stepping stone towards SA, with a few exceptions, such as DISH in the U.S. and Jio in India, which adopted SA from the outset. Other scenarios for deploying 5G SA include an overlay for a public 5G NSA network or as a private network for enterprise use cases. 

The Global Mobile Suppliers Association (GSA) identified 130 operators that had invested in public 5G SA networks as of the end of June 2024. 5G SA represented more than 37% of the 614 operators known to have invested in 5G either through trials or deployments. The GSA reported 1,535 commercially available devices, including handsets and fixed wireless access (FWA) customer premises equipment (CPEs), that support 5G SA, demonstrating the growing maturity of the device ecosystem. 

However, only 11 new 5G SA deployments in nine countries were recorded (out of 46 new 5G networks launched in 32 countries) in 2023, according to Analysys Mason, showing a slowdown in deployments. We expect the pace of 5G SA launches to accelerate in 2024 and beyond supported by the growing device ecosystem and commercial appetite for new 5G use cases. 

To identify where 5G SA access has been activated and the network expanded between Q2 2023 and Q2 2024, we used Speedtest Intelligence® data to identify devices that connect to 5G SA. The maps below confirm that the number of 5G SA samples increased year-on-year and that coverage has expanded beyond urban centers. However, mobile subscribers in most of Africa, Europe, Central Asia, and Latin America have yet to experience 5G SA.

In the following sections, we examine the year-on-year changes in 5G SA performance across different regions and identify which countries are leading in the Developed Asia Pacific, the Americas, Emerging Asia Pacific, and Europe.

The developed Asia-Pacific (DVAP) region is at the forefront of 5G SA launches

Operators in this region boast 5G SA networks, with launches happening as early as 2020. Strong government support, operators’ technology leadership, and a high consumer appetite for high-speed internet services drove this rapid adoption.

South Korea is considered a pioneer in the adoption and deployment of 5G technology, with SK Telecom deploying one of the first 5G SA services in H1 2020, and supporting advanced features such as network slicing and mobile edge computing (MEC). Speedtest Intelligence data shows that the country led the region in download and upload speeds in Q2 2024. South Korea has one of the highest median speeds among the countries analyzed at 729.89 Mbps (download) and 77.65 Mbps (upload). The other top-performing country is the U.A.E with a median download speed of 879.89 Mbps and a median upload speed of 70.93 Mbps. 

All three service providers in Singapore commercialized 5G SA services, covering more than 95% of the country. Users experienced excellent download speed with a median value of 481.96 Mbps. However, Singapore lagged in upload speed with a median value of 32.09 Mbps.

Macau and Japan are second and third in the region with median download speeds of 404.22 Mbps and 272.73 Mbps, respectively. Mainland China followed with a median speed of 236.95 Mbps. Policies and initiatives such as network-sharing agreements and government subsidies supported 5G growth.

In Australia, TPG Telecom launched its 5G SA network in November 2021, following Telstra’s announcement in May 2020. However, the country lagged behind its regional peers with median download speeds and upload speeds of 146.68 Mbps and 17.69 Mbps, respectively.

The performance of most reviewed DVAP countries remained largely stable or slightly declined between Q2 2023 and Q2 2024. The only two exceptions are South Korea and Australia where performance improved by 12% and 18%, respectively. The most substantial declines were observed in upload speeds, while South Korea stood out with a 17% boost in performance.

5G Standalone Network Performance, Select Countries in Developed Asia Pacific
Source: Speedtest Intelligence® | Q2 2023 – Q2 2024
5G Standalone Network Performance, Select Countries in Developed Asia Pacific

T-Mobile and DISH Push 5G SA Coverage in the U.S.

In the U.S., T-Mobile launched its 5G Standalone (SA) network over 600 MHz spectrum in August 2020, becoming one of the first operators in the world to do so. This was followed by a faster service over 2.5 GHz mid-band spectrum in November 2022 which helped the operator to maintain its national lead in 5G performance. On the other hand, Verizon extensively tested 5G SA in 2023 but so far has been slow to deploy a nationwide SA network. DISH, another notable 5G SA operator, pioneered a cloud-native Open RAN-based 5G SA network in June 2023 and expanded coverage to 73% of the population by the end of that year. In Canada, Rogers Wireless launched the first 5G SA at the beginning of 2021, a year after introducing 5G NSA. 

In Brazil, the median download and upload speeds reached 474.65 Mbps and 32.36 Mbps in Q2 2024, respectively, exceeding those in Canada and the U.S. The main operators in Brazil, Claro, Telefonica (Vivo), and TIM have launched 5G SA over the 3.5 GHz band, making the service available to a large proportion of the population.

While download and upload speed improved in Canada and the U.S. between Q2 2023 and Q2 2024, according to Speedtest Intelligence, it declined in Brazil. The deployment of C-band has likely helped to increase download speed in both Canada and the U.S.

5G Standalone Network Performance, Select Countries in the Americas
Source: Speedtest Intelligence® | Q2 2023 – Q2 2024
5G Standalone Network Performance, Select Countries in the Americas

India leads in the Emerging Asian Pacific (EMAP) region with fast expansion to 5G SA network

India is at the forefront of the Emerging Asian Pacific region’s rapid 5G Standalone (SA) network expansion. However, according to Ookla’s Speedtest data for Q2 2024, the Philippines surpasses both India and Thailand with a median 5G SA download speed of 375.40 Mbps. Globe, the first mobile operator to introduce 5G Non-Standalone (NSA) in the Philippines, expanded its 5G outdoor coverage to 97.44% of the capital by the end of H1 2023. The company also launched 5G SA private networks in 2023, along with network slicing.

India follows closely behind the Philippines, with a median download speed of just under 300 Mbps. Jio has been a leader in enhancing 5G SA coverage since its launch in October 2022, while Bharti Airtel initially opted for NSA, with plans to transition to full 5G SA. 

Jio’s rapid coverage expansion and high throughput are supported by its access to mid-band (3.5 GHz) and low-band (700 MHz) frequencies. Additionally, all new 5G handsets released in India are SA-compatible, boosting the adoption of 5G SA services, and more than 90% of them support carrier aggregation and Voice over New Radio (VoNR). 

Thailand lags behind in median download speed for Q2 2024 but outperforms India and the Philippines in upload speed. It was among the first countries in the region to introduce 5G services, with operators quickly expanding coverage to reach over 80% of the population. AIS, the leading operator in Thailand, launched 5G NSA services in February 2020 using 700 MHz, 2.6 GHz, and 26 GHz bandwidths, followed by 5G SA in July 2020. The operator enabled VoNR in 2021. 

Unlike the DVAP region, countries in EMAP have experienced a more substantial decline in 5G SA network performance compared to Q2 2023. The rapid coverage expansion and adoption have likely increased the load on 5G SA infrastructure, putting pressure on the operators to scale up network capacity in the future to at least maintain a similar performance level.

5G Standalone Network Performance, Select Countries in Emerging Asia Pacific
Source: Speedtest Intelligence® | Q2 2023 – Q2 2024
5G Standalone Network Performance, Select Countries in Emerging Asia Pacific

Europe is home to the highest number of operators looking to deploy 5G SA

A growing number of European operators are offering or planning to offer 5G SA, driven by a maturing device ecosystem. However, many remain hesitant due to cost and the need to demonstrate clear business cases for 5G SA. GSMA Intelligence reports that Europe has the highest number of planned 5G SA launches, with 45 operators planning to deploy it as of Q1 2024.

Elisa in Finland was one of the first operators in the region to launch 5G SA in November 2021. Other notable examples of SA implementations include Vodafone in Germany (April 2021) and the UK (June 2023), Bouygues Telecom (2022) in France, Three in Austria, Wind Tre in Italy (both in 2022), Orange and Telefónica in Spain, and TDC Denmark in 2023. 

The recent 5G SA launch in Spain may explain why that country saw such high speeds, with Speedtest Intelligence reporting download and upload speeds of 614.91 Mbps and 56.93 Mbps, respectively, in Q2 2023. However, Spain experienced a significant drop in performance in 2024, with speeds falling to 427.64 Mbps (download) and 30.55 Mbps (upload). Despite this decline, Spain continued to outperform the UK and Germany.

5G Standalone Network Performance, Select Countries in Europe
Source: Speedtest Intelligence® | Q2 2023 – Q2 2024
5G Standalone Network Performance, Select Countries in Europe

While 5G SA deployments appear to have slowed in 2023 compared to previous years, we expect momentum to increase from 2024 due to rising enterprise demand for private networks and interest in network slicing, as well as consumer demand for immersive gaming and VR applications.  The ecosystem’s maturity and the availability of more network equipment and devices supporting 5G SA will also stimulate the market. According to the GSA, 21% of operators worldwide investing in 5G have included 5G SA in their plans.

Interestingly, the growing popularity and adoption of 5G SA have impacted its performance, with many markets seeing some degradation compared to 2023, according to Speedtest Intelligence.  Nonetheless, 5G SA still offers a markedly faster download speed than 5G NSA. Beyond speed, 5G SA promises new capabilities, such as network slicing, that have started to emerge in the most advanced markets but will take time to become a reality for most consumers and enterprises worldwide.

We will continue to track the deployments of 5G SA and monitor their impact on network global performance. For more information about Speedtest Intelligence data and insights, please contact us.

Ookla retains ownership of this article including all of the intellectual property rights, data, content graphs and analysis. This article may not be quoted, reproduced, distributed or published for any commercial purpose without prior consent. Members of the press and others using the findings in this article for non-commercial purposes are welcome to publicly share and link to report information with attribution to Ookla.

| March 16, 2022

Starlink Hits 100+ Mbps Download Speed in 15 Countries During Q4 2021

Fast satellite internet has become increasingly available to more and more people across the globe. It’s already a huge boon to rural communities that might otherwise be too remote for fixed broadband service. Starlink, Viasat, HughesNet, and other satellite providers are all placing big bets on low-earth orbital (LEO) satellite constellations, and Starlink is even introducing a new premium service with speeds expected to be around 150-500 Mbps. It’s a gamble, as Starlink recently learned after losing about 40 satellites to a geomagnetic storm, but it’s a gamble worth making. The European Commission is even planning a multibillion Euro investment to connect the continent to satellite internet. 

We’ve analyzed fresh satellite internet performance data from Q4 2021 including results from seven additional countries to update our ongoing series.

United States: Starlink was the fastest satellite provider during Q4 2021 and speeds increased over Q3 2021

Satellite Internet Performance vs Fixed in USA

U.S. consumers saw mixed satellite performance when comparing Q3 2021 to Q4 2021, while the United States government has been trying to increase satellite internet competition. Starlink’s median download speed increased from 87.25 Mbps during Q3 2021 to 104.97 Mbps in Q4 2021 — an important benchmark that inches Starlink closer to reaching the Rural Digital Opportunity Fund’s (RDOF) baseline of download speeds greater than 100 Mbps. Viasat overtook HughesNet to follow Starlink distantly at 21.81 Mbps (comparable to the 18.75 Mbps we saw in Q3 2021) and HughesNet followed at 20.92 Mbps (19.30 Mbps in Q3 2021). SES, new to our list this quarter, trailed far behind at 2.19 Mbps. For comparison, the median download speed for all fixed broadband providers rose moderately in the U.S. during Q4 2021 from 119.84 Mbps in Q3 2021 to 131.30 Mbps in Q4 2021.

Starlink saw a slight decrease in median upload speed from 13.54 Mbps during Q3 2021 to 12.04 Mbps in Q4 2021, still short of the median upload speed for all fixed broadband, which rose to 19.49 Mbps in Q4 2021 from 18.03 Mbps in Q3 2021. Viasat followed at 2.88 Mbps (2.96 Mbps in Q3 2021), then HughesNet at 2.54 Mbps (2.13 Mbps in Q3 2021), and SES at 1.19 Mbps.

As we’ve seen over the past year, Starlink, which uses only low earth orbit (LEO) satellites, was once again the only satellite internet provider with a median latency anywhere close to fixed broadband in Q4 2021 (40 ms and 14 ms, respectively). SES, Viasat, and HughesNet, which all utilize higher geosynchronous earth orbit (GEO) satellites for now, had much higher median latencies at 613 ms, 627 ms, and 725 ms, respectively.

Starlink performance continues to vary widely at the county level

Median Download Speed for Starlink in Selected US Counties

During Q4 2021, we saw about a 130 Mbps range in performance between the U.S. county with the fastest median download speed over Starlink (Miami Dade County in Florida at 191.08 Mbps) and the county with the slowest median download speed (Columbia County in Oregon at 64.95 Mbps). Even the lower-end speeds were well above the FCC’s baseline performance tier for broadband internet of at least a 25 Mbps download speed.

Satellite internet performance elsewhere in the world

We examined satellite internet performance in countries with an established market share to see how well their speeds compare to local fixed broadband. We’re excited to add analyses on satellite performance in Austria, Ireland, Italy, Mexico, Netherlands, Poland, and Portugal this quarter. We’ve also added Starlink to the list of providers in Chile. With Starlink continuing to launch in additional countries, we’re looking forward to seeing how Starlink performs during Q1 2021.

Australia: Starlink nearly triples fixed broadband download average

Starlink performed well in Australia during Q4 2021 with a median download speed of 141.55 Mbps. The median download speed for all fixed broadband providers was 51.35 Mbps. Starlink’s 14.84 Mbps median upload speed fell behind fixed broadband providers’ 18.01 Mbps. Starlink is a clear alternative to traditional fixed broadband for speeds, however Starlink can’t yet compete for latency, with Starlink showing a median latency of 43 ms vs. 10 ms for all fixed broadband combined.

Austria: Starlink download speed outpaces fixed broadband by more than double

New to our list this quarter, Austrian consumers had fast speeds over Starlink during Q4 2021, achieving faster median download speeds than that of all fixed broadband providers combined at 131.84 Mbps vs. 50.33 Mbps on fixed broadband. Starlink also had a faster median upload speed at 19.91 Mbps vs. 14.34 Mbps on fixed broadband. Starlink trailed fixed broadband on median latency during Q4 2021, 52 ms vs. 13 ms.

Satellite Internet Performance vs Fixed Broadband in Austria

Belgium: Starlink much faster than fixed broadband

Starlink’s median download speed of 155.15 Mbps during Q4 2021 was much faster than the country’s median download for all fixed broadband of 76.94 Mbps. That’s also a large increase from Starlink’s median download speed of 127.46 Mbps in Q3 2021. For median upload speed, Starlink was only slightly slower at 15.15 Mbps than the median fixed broadband upload speed of 18.05 Mbps. However, Starlink’s 45 ms latency was higher than the country’s median latency of 13 ms. Starlink was the only satellite internet provider with adequate samples to analyze in Belgium during Q4 2021. For rural Belgians, Starlink is a strong option.

Satellite Internet Performance vs Fixed Broadband in Belgium

Brazil: Viasat fell further behind as national fixed broadband sped up

Viasat’s median download speed in Brazil dipped slightly from 66.32 Mbps during Q3 2021 to 62.80 Mbps during Q4 2021. This fell further away from the national median for fixed broadband, which sped up to 83.03 Mbps during Q4 2021 (71.50 Mbps in Q3 2021). Viasat’s median upload speed (1.07 Mbps) was much slower than that on fixed broadband (40.76 Mbps), and Viasat’s latency was much higher (610 ms vs 6 ms). With Starlink slated to enter the Brazilian market soon, we’ll be watching these numbers closely to see if additional competition spurs the market.

Satellite Internet Performance vs Fixed Broadband in Brazil

Canada: Starlink performance reaches milestone during Q4 2021

In our last article, Starlink’s median download speed decreased to slower than fixed broadband in Canada during Q3 2021 (84.55 Mbps vs. 90.67 Mbps). But in Q4 2021, Starlink’s median download speed leapt ahead, achieving 106.64 Mbps while median download speed for fixed broadband increased to 96.39 Mbps. Starlink’s median upload speed was slower than fixed broadband (12.82 Mbps vs. 21.66 Mbps) and latency on Starlink was still much higher (55 ms vs. 11 ms). Starlink should be considered a viable option compared to fixed broadband in Canada, especially for rural consumers or those without access to fast fixed broadband options like fiber.

Satellite Internet Performance vs Fixed Broadband in Canada

Starlink faster than overall fixed broadband in nearly every province

Median Download Speed for Starlink in Canadian Provinces

Starlink showed enough samples to analyze performance in all 10 provinces in Canada during Q4 2021 — all of which showed substantial increases in Starlink’s download speed during Q4 2021 compared to Q3 2021. Starlink’s median download speed was faster than the median download for all fixed broadband in seven provinces during Q4 2021: Manitoba (101.66 Mbps vs. 83.06 Mbps), Newfoundland and Labrador (195.30 Mbps vs. 131.58 Mbps), Nova Scotia (143.52 Mbps vs. 121.57 Mbps), Ontario (106.24 Mbps vs. 95.06 Mbps), Prince Edward Island (139.11 Mbps vs. 75.95 Mbps), Quebec (123.50 Mbps vs. 84.50 Mbps), and Saskatchewan (116.24 Mbps vs. 68.43 Mbps).

Download speeds were comparable between Starlink and overall fixed broadband in New Brunswick (130.67 Mbps vs. 132.65 Mbps), and overall fixed broadband was faster than Starlink in Alberta (107.32 Mbps vs. 96.56 Mbps) and British Columbia (130.97 Mbps vs. 94.74 Mbps) — with the latter two provinces having better access to fiber-to-the-home (FTTH).

Chile: Starlink debuts fast speeds, but still much slower than scorching fast fixed broadband

Chilean fixed broadband providers have continued to achieve some of the fastest speeds in the world, recording the fastest speed on the Speedtest Global Index during February 2022, and we were interested to see how Starlink would compete. Starlink reached 118.95 Mbps in Chile during Q4 2021, which was faster than HughesNet (15.30 Mbps) but much slower than Chile’s median download speed for all fixed broadband providers (168.92 Mbps). 

Median upload speeds also showed a wide gap in Chile between satellite and fixed broadband during Q4 2021 (23.46 Mbps for Starlink and 3.42 Mbps for HughesNet vs. 89.76 Mbps on fixed broadband). Fixed broadband was also much faster for latency: 7 ms for fixed broadband vs. 38 ms for Starlink and 615 ms for HughesNet.

Satellite Internet Performance vs Fixed Broadband in Chile

Colombia: HughesNet decreased over download and upload speeds

HughesNet’s median download speed decreased in Q4 2021 to 11.75 Mbps from 12.12 Mbps during Q3 2021, while Colombia’s fixed broadband increased to 54.60 Mbps (46.08 Mbps in Q3 2021). Median upload speed was also slower for HughesNet than fixed broadband (2.88 Mbps vs. 11.86 Mbps), and latency was much higher on HughesNet (717 ms vs. 14 ms).

Satellite Internet Performance vs Fixed Broadband in Colombia

France: Starlink download speed increased, still faster than fixed broadband

Starlink users in France saw a median download speed of 121.21 Mbps in Q4 2021 (up from 102.15 Mbps in Q3 2021). Starlink’s download speed easily beat the country-wide median for fixed broadband of 90.88 Mbps (up from 75.47 Mbps in Q3 2021). Starlink’s upload speed during Q4 2021 was slower than the fixed broadband median (17.20 Mbps vs. 69.49 Mbps), and Starlink’s latency was higher (51 ms vs. 12 ms). Satellite provider SES, on this list for the first time, trailed behind both Starlink and fixed broadband with a 14.88 Mbps download speed, 1.83 Mbps upload speed, and 649 ms latency. Starlink remains an good option for rural French consumers.

Satellite Internet Performance vs Fixed Broadband in France

Germany: Starlink blazes ahead of fixed broadband download speed

Starlink’s median download speed in Germany of 115.58 Mbps was much faster than the fixed broadband median of 65.86 Mbps during Q4 2021 (and Starlink’s Q3 2021 download speed of 95.40 Mbps). Starlink was slightly slower for upload speed than overall fixed broadband (15.17 Mbps vs. 22.40 Mbps) and Starlink showed a higher latency (47 ms) than fixed broadband (14 ms).

Satellite Internet Performance vs Fixed Broadband in Germany

Ireland: Starlink download debuts nearly double that of fixed broadband

Starlink’s debut on our list is noteworthy in Ireland, where it achieved a download speed almost double that of Ireland’s combined fixed broadband average during Q4 2021 (123.51 Mbps vs. 65.89 Mbps). Median upload speeds were almost level, with Starlink recording a median upload speed at 24.35 Mbps vs. 22.63 Mbps for fixed broadband. Starlink lagged for latency at 45 ms vs. 11 ms for fixed broadband. Starlink is a great option for those who are looking for fast speeds in Ireland and can’t get access to fixed broadband.

Satellite Internet Performance vs Fixed Broadband in Ireland

Italy: Starlink dominates against fixed broadband

Starlink enters our list in Italy with a decisive statement during Q4 2021: It achieved a median download speed of 124.39 Mbps, a huge leap ahead of Italy’s fixed broadband average of 49.56 Mbps. Upload speeds were comparable between the two, with Starlink recording a median of 18.90 Mbps to 18.29 on fixed broadband. Starlink had a higher latency at 52 ms vs. 14 ms on fixed broadband. Starlink is an attractive option for fast internet in Italy.

Satellite Internet Performance vs Fixed Broadband in Italy

Mexico: Starlink impresses during Q4 2021 debut

Starlink, which only became commercially available in Mexico during November 2021, made a significant splash during its brief Q4 2021 debut, achieving a median download speed of 141.94 Mbps. That was significantly faster than Viasat (16.34 Mbps), HughesNet (10.63 Mbps), and all fixed broadband providers combined (36.56 Mbps). 

Starlink also outpaced fixed broadband for fastest upload speed (22.32 Mbps vs. 9.53 Mbps). HughesNet and Viasat followed at 3.10 Mbps and 2.06 Mbps, respectively. Starlink was the only satellite provider that came close to fixed broadband median latency, 64 ms to 11 ms. Viasat and HughesNet were distantly behind at 676 ms and 763 ms, respectively. With Starlink making such an impressive entrance into Mexico, we’ll be interested to see if the performance holds up in the coming months.

Satellite Internet Performance vs Fixed Broadband in Mexico

Netherlands: Starlink faster for median download, lagging on upload and latency

The Netherlands, which is new to this list, has some of the fastest median mobile and fixed broadband speeds in the world according to the Speedtest Global Index. We were eager to see how Starlink would perform against this competition. During Q4 2021, Starlink achieved a median download speed of 138.40 Mbps compared to 95.55 Mbps over fixed broadband. Starlink lagged noticeably behind for upload speed at 15.60 Mbps vs. 30.87 Mbps on fixed broadband. Starlink also had a higher latency at 45 ms vs. 11 ms on fixed broadband.

Satellite Internet Performance vs Fixed Broadband in Netherlands

New Zealand: Starlink slowed slightly, still faster than fixed broadband download

Starlink’s Q4 2021 median download speed (116.44 Mbps, down slightly from 120.10 Mbps Mbps in Q3 2021, likely due to increased adoption) was faster than New Zealand’s median fixed broadband download speed (98.61 in Q4 2021, up from 84.98 Mbps in Q3 2021). Starlink was much slower than New Zealand’s median fixed broadband upload speed for Q4 2021 (13.79 Mbps vs. 59.26 Mbps, which was a huge increase from 23.62 Mbps on fixed broadband during Q3 2021). Starlink’s median latency during Q4 2021 was comparable to Q3 2021 (79 ms vs. 81 ms) which was still much slower than New Zealand’s median for all fixed broadband of 6 ms during Q4 2021.

Satellite Internet Performance vs Fixed Broadband in New Zealand

Poland: Starlink a fast option for Poles

Starlink launched in Poland during September 2021 and is already recording fast speeds. The median download speed for Starlink was much faster than fixed broadband at 129.29 Mbps to 83.88 Mbps during Q4 2021. Upload speed was roughly comparable, with Starlink recording a slightly slower median upload speed of 24.17 Mbps and fixed broadband ahead at 28.60 Mbps. Starlink’s latency was higher at 58 ms to 10 ms on fixed broadband. That’s still acceptable for online gaming, but higher than what’s considered optimal.

Satellite Internet Performance vs Fixed Broadband in Poland

Portugal: Starlink far ahead on download speed in debut, fixed broadband much faster on upload

Another newcomer to this list this quarter, Portugal was a place where Starlink dominated with a much faster median download speed than fixed broadband at 140.35 Mbps to 94.62 Mbps, respectively, during Q4 2021. Upload speed was a different story, with fixed broadband notching a median upload speed of 65.52 Mbps to Starlink’s 30.16 Mbps. Starlink also had a much higher latency than fixed broadband at 44 ms to 7 ms. Starlink remains a good option if you don’t have access to good fixed broadband in Portugal. 

Satellite Internet Performance vs Fixed Broadband in Portugal

United Kingdom: Starlink still nearly twice as fast as fixed broadband median

Starlink showed a faster median download speed in the U.K. (121.94 Mbps in Q4 2021, up from 111.66 Mbps in Q3 2021) than the country’s median for fixed broadband (57.66 Mbps in Q4 2021, up from 53.16 Mbps in Q3 2021). Starlink’s median upload speed (13.96 Mbps) was comparable to the median upload for all fixed broadband in the U.K. (16.84 Mbps), and the latency was relatively fast given the distance traveled (36 ms for Starlink vs. 15 ms for all fixed broadband) — enough to be able to reliably play online multiplayer games. Satellite provider SES trailed far behind during Q4 2021 with a 3.79 Mbps median download speed, 3.74 Mbps median upload, and 636 ms median latency.

Satellite Internet Performance vs Fixed Broadband in United Kingdom

Competition among satellite providers is rapidly increasing and we’ll continue watching closely

We look forward to updating this data again next quarter with new locations as satellite internet continues to become a more viable option for many. If you’re using satellite internet, take a Speedtest® to help us provide an accurate picture of real-world performance.

Editor’s note: The section on Australia was amended on March 24 to remove performance details for Viasat which was determined not to be a consumer offering at this time.

Ookla retains ownership of this article including all of the intellectual property rights, data, content graphs and analysis. This article may not be quoted, reproduced, distributed or published for any commercial purpose without prior consent. Members of the press and others using the findings in this article for non-commercial purposes are welcome to publicly share and link to report information with attribution to Ookla.

| September 18, 2023

New Speedtest Data Shows Starlink Performance is Mixed — But That’s a Good Thing

Satellite providers are playing no small part in the rapid expansion of global connectivity. Some experts predict there will be 58,000 satellites orbiting the earth by 2030 — a nearly 725% increase from 2023. Ookla® is back with our ongoing satellite internet series with compelling, fresh data for satellite providers in Africa, Europe, and Oceania during Q2 2023, including SpaceX’s Starlink, Viasat, and Skylogic.

This analysis includes Starlink Net Promoter Score (NPS) data for France, Germany, Italy, New Zealand, and the United Kingdom, year-over-year data for satellite providers in Europe and Oceania from Q2 2022 to Q2 2023, and new Q2 2023 data from Starlink in Africa.

Starlink users across different continents continue to love the service

Using Speedtest Intelligence®, we examined NPS ratings data for Starlink users against an aggregate of all fixed broadband providers combined. 

NPS is based on Speedtest® user responses after being asked how likely they are to recommend their provider to friends or family on a 0 to 10 scale. NPS ratings are categorized into Detractors (score 0-6), Passives (score 7-8), and Promoters (score 9-10), and is calculated as (% Promoters – % Detractors) x 100. Any NPS score above 0 indicates that a provider’s audience is more loyal than not.

Chart of NPS Performance in Select Countries

As you can see from the above image, Starlink users in France, Germany, Italy, New Zealand, and the U.K. had an NPS score much higher than the aggregate score for all fixed broadband providers combined during Q2 2023. France had the highest NPS among the aggregate of fixed broadband providers for the countries we surveyed at -15.98 and fixed broadband providers had a much faster median download speed at 165.37 Mbps to Starlink’s 107.56 Mbps. In New Zealand there was a similar story with the aggregate of fixed broadband providers having a -20.40 NPS to Starlink’s 48.83, while having a faster median download speed 147.86 Mbps to 113.78 Mbps during Q2 2023.

Germany, which had the lowest NPS rating of aggregate of fixed broadband providers in Europe at -30.10, also had the smallest difference in NPS with Starlink scoring 38.19. Interestingly, the aggregate of fixed broadband providers and Starlink both had similar median download speeds at 83.16 Mbps and 82.56 Mbps, respectively, during Q2 2023.

Of note, Starlink had much higher NPS ratings and median download speeds than the aggregate of all fixed providers combined in Italy and the U.K., respectively, during Q2 2023. Starlink’s NPS was 50.20 to -25.61 for the aggregate of all fixed broadband providers in Italy during Q2 2023, while the median download speeds were 100.68 Mbps to 63.99 Mbps. In the U.K., Starlink’s NPS was 47.18 to -26.88 for the aggregate of all fixed broadband providers combined, with the median download speeds a little closer, 100.11 Mbps to 77.38 Mbps, respectively. 

In our last report, we found a wide NPS gap between U.S. rural Starlink users — who often have fewer options for fixed broadband access — and the corresponding aggregate of fixed broadband providers. Given that all five of these countries have rural or remote regions that are underserved or not served by traditional broadband offerings, it may be no surprise that Starlink users who reside in those areas may feel positive about having access to fast broadband internet. 

Starlink speeds over 100 Mbps in 14 European countries during Q2 2023, speeds stabilizing across Europe

Key takeaways:

  • Starlink results were the fastest among satellite providers we surveyed.
  • Starlink quarter-to-quarter speeds improved or remained about the same (between 5% and -5%) in 23 countries, while decreasing in 4 countries.
  • Among the 27 European countries we surveyed, Starlink had median download speeds greater than 100 Mbps in 14 countries, greater than 90 Mbps in 20 countries, and greater than 80 in 24 countries, with only three countries failing to reach 70 Mbps.
  • Skylogic, while delivering speeds slower than Starlink, showed stabilized broadband speeds over the past year for those seeking a Starlink alternative.

Over the past year, we’ve seen huge developments in the global satellite market, Europe notwithstanding, with Amazon’s Project Kuiper moving forward, the EU creating its own satellite constellation, and OneWeb and Eutelsat merging. While Starlink continues to lead for performance among satellite providers we surveyed, Starlink has experienced some major hurdles over the past year as users flock to the service and speeds have subsequently dipped — but of note those concerns seem to have started allaying in most of Europe during Q2 2023.

At first glance, year-over-year median download speeds for Starlink are about the same (-5% to 5%) or better (greater than 5%) from Q2 2022 to Q2 2023 in 15 countries and slower (decreasing more than 5%) in 8 countries. But among the 27 countries we surveyed during Q2 2023, Starlink had speeds faster than the aggregate of all fixed broadband providers combined in 11 countries (Austria, Belgium, Bulgaria, Croatia, Czechia, Estonia, Greece, Ireland, Italy, Latvia, and the U.K.) Those speeds were most notably faster in Croatia and Greece for Starlink at 94.41 Mbps to 45.24 Mbps and 108.97 to 44.09 Mbps, respectively, during Q2 2023. Speeds were about the same in four countries (Finland, Slovenia, Germany, and Lithuania), and speeds were slower than the aggregate of fixed broadband providers in 12 countries, most notably in Poland, Spain, Romania, Denmark, and France which saw between 50% and 105% faster aggregate fixed broadband speeds than Starlink.

Quarterly download speeds stabilizing or improving

Looking at results from Q1 2023 to Q2 2023, median download speeds for Starlink remained about the same (between 5% and -5%) in 23 countries, while decreasing in four countries. That’s a big deal, especially given Starlink had median download speeds greater than 100 Mbps in 14 countries, and greater than 90 Mbps in 20 countries, and greater than 80 in 24 countries — with only three countries failing to reach 70 Mbps.

While trailing Starlink speeds, Skylogic recorded median download speeds in Italy at 29.21 Mbps during Q2 2023, a roughly 27% statistical increase year-over-year from 22.28 Mbps during Q2 2022. Notably, Skylogic recorded a median download speed of 68.44 Mbps in Italy during Q1 2023. Among the various countries we recorded Skylogic data for during the past year, the range of median download speeds varied between 19.53 Mbps and 68.44 Mbps, with most speeds between 28 and 50 Mbps, all fast enough to stream 4K video online. Viasat, had relatively similar download speeds in Germany and Italy at 17.22 Mbps and 17.45 Mbps, respectively, during Q2 2023. 

Top 10 fastest Starlink download speeds in European countries

Chart of Top 10 Fastest Starlink Median Download Speeds in Europe

Starlink in Switzerland had one of the fastest median download speed among countries with Starlink during Q2 2023 at 122.47 Mbps, followed by Denmark (117.38 Mbps), Austria (111.91 Mbps), Belgium (111.20 Mbps), Hungary (108.97 Mbps), France (107.56 Mbps), Ireland (104.42 Mbps), Estonia (102.38 Mbps), Portugal (101.75 Mbps), and Latvia (100.94 Mbps). Sweden, Italy, Bulgaria, and the U.K. all followed but had speeds greater than 100 Mbps.

Upload speeds for Starlink are down year over year, but quarterly speeds almost all improved or were about the same

Upload speeds for Starlink mostly decreased notably year over year, with only the U.K. showing an improved median upload speed in Q2 2023 out of 27 countries surveyed. However, looking quarter to quarter, Q2 2023 upload speeds for Starlink stayed about the same or improved in 25 out of 27 countries, with only Greece and Ireland showing declines. For upload speeds, Starlink all 27 countries we surveyed had upload speeds between 10 Mbps and 15 Mbps except Portugal (17.70 Mbps), Hungary (16.91 Mbps), Croatia (16.12 Mbps), Bulgaria (15.93 Mbps), Romania (15.82 Mbps), Spain (15.79 Mbps), and Poland (9.11 Mbps). Starlink in Greece was the only instance of a satellite provider in Europe having an upload speed greater than the aggregate of all fixed providers combined, 12.97 Mbps for Starlink to 7.85 Mbps for the aggregate of fixed broadband providers combined. Skylogic showed upload speeds lower than 4 Mbps in both Austria and Italy during Q2 2023. Viasat had upload speeds of 3.51 Mbps in Germany and 4.69 Mbps in Italy during Q2 2023. 

Multi-server latency is stabilizing for Starlink users across Europe

As an low-earth orbiting (LEO) satellite internet provider, Starlink has a leg up on some satellite competitors who rely on further away geosynchronous-earth orbit (GEO) and medium-earth orbit (MEO) satellite constellations. However, once again, all the aggregates of all fixed broadband providers in Europe had much lower multi-server latencies than Starlink, Viasat (which had latencies over 600 ms) and Skylogic (which had latencies over 700 ms). That being said, Starlink still saw multi-server latencies under 60 ms in the U.K. (51.26 ms), Spain (53.37 ms), Portugal (55.84 ms), and Belgium (59.34 ms). Starlink saw most countries’ multi-server latencies between 60 and 90 ms.

Starlink speeds stabilize in Oceania

Oceania, the second least densely populated continent in the world to Antarctica, has rural and remote populations that benefit from (and even rely on) satellite internet connections. Luckily for rural and remote Starlink users, they’ve probably seen a good amount of stability over the past year with Q2 2023 median download speeds in New Zealand at 113.78 Mbps (105.99 Mbps in Q2 2022) and Australia at 104.92 Mbps (102.76 Mbps in Q2 2022). Tonga, which is very remote, saw download speeds drop from 45.25 Mbps in Q2 2022 to 37.95 Mbps in Q2 2023. 

Upload speeds also showed some stability with Australia going from 10.45 Mbps in Q2 2022 to 11.33 Mbps during Q2 2023 and New Zealand going from 12.31 Mbps to 14.62 during the same time period. Tonga saw a notable drop in speeds year over year from 19.26 Mbps in Q2 2022 to 6.66 Mbps Q2 2023. 

Multi-server latency, which usually will be higher for satellite internet options, showed promising results for Starlink in Oceania during Q2 2023. Multi-server latency dropped noticeably in New Zealand year over year, going from 89.38 ms in Q2 2022 to 46.42 ms in Q2 2023. Australia saw a more modest drop with multi-server latency going from 63.04 ms to 59.78 ms from Q2 2022 to Q2 2023. Tonga saw an increase in multi-server latency from 125.24 ms to 137.16 ms during the same time period.

Starlink in Africa is off to a promising start

Chart of Satellite Performance in Africa, Q2 2023

Starlink, which first launched on the African continent in Nigeria this past January, is showing intriguing early results. Speedtest Intelligence showed that Starlink in Nigeria had a faster median download speeds than all aggregate fixed broadband providers combined at 63.69 Mbps to 15.60 Mbps during Q2 2023. Upload speeds were more similar during the same time period with Starlink at 13.72 Mbps and the aggregate of all fixed broadband providers combined at 10.60 Mbps. Starlink did have a marginally higher multi-server latency at 55.88 ms to 50.26 ms during Q2 2023.

In Rwanda, median download speeds were a little closer with Starlink recording a median download speed at 63.10 Mbps in Q2 2023 compared to the aggregate of all fixed broadband providers combined at 34.55 Mbps. Starlink trailed behind for median upload speed at 6.88 Mbps to 10.05 Mbps for fixed broadband providers during Q2 2023. Multi-server latency for Starlink was much higher at 320.45 ms to 29.04 ms for fixed broadband providers during the same time period.

The 2023 space revolution is off to a huge start

Here are some major updates about what’s next for various different satellite competitors:

After delays, Amazon’s Project Kuiper aim to launch prototype satellites this fall

Facing a series of rocket-related delays, Amazon recently announced it could send its first two Project Kuiper prototypes into orbit in late September. That news follows a recently announced $120 million 100,000-square-foot satellite processing facility at NASA’s Kennedy Space Center in Florida. Planning on offering internet service in 2025, Amazon is slated to have half of its 3,236 LEO satellite constellation in space by 2026.

China’s grand ambitions to provide internet connectivity to over 362 million people

According to the Wall Street Journal, over 362 million people in China don’t have access to the internet — which is about 1 in every 4 people in China, a large portion of which live in rural or remote communities. In order to overcome that connectivity gap, China is looking to the sky to create its own satellite constellation with potentially over 12,000 satellites. China’s biggest gap seems to be with recreating the success of SpaceX’s reusable rockets — however, initial tests are far underway and a host of reusable rockets are slated for test launches in 2024. 

SpaceX’s Starlink service offerings are about to rapidly expand

While Starlink continues to lead among satellite providers in most areas of the world, their expansion is only starting. Looking at the Starlink availability map, Starlink has an incredibly busy rest of 2023 and 2024 in Africa, Asia, and South America — and they’re marking their intent to expand into most of the world. That comes as Starlink marked launching over 5,000 satellites into space at the end of August. With some wiley entrepreneurs already renting out their Starlink “Dishy McFlatfaces” to vacationers and campers for $25-30 dollars a day, satellite connectivity is truly becoming a full-time gig.

Viasat’s bad luck might affect entire industry

Viasat launched the first of its three long-awaited Viasat-3 arrays — but then their first satellite suffered an antenna anomaly, which prevented a large reflector to deploy that affects whether or not the satellite can operate as intended. While Viasat is rushing to solve the issue, this could ultimately trigger a $420 million insure claim for the loss of the $700 million satellite. With such a high-value loss, this could send ripples through the satellite industry, causing insurance premiums to skyrocket for companies looking to mitigate potential losses through insurance. All of this comes on the heels of acquiring Inmarsat in May for $7.3 billion to expand its satellite arrays and spectrum holdings. We’ll be watching to see whether or not Viasat can find a solution. 

Eutelsat and OneWeb merger imminent, big moves abound

The Eutelsat and OneWeb merger should make competitors take notice — combining satellite networks, expanding enterprise offerings, and competing in emerging markets has big revenue potential — with OneWeb having an already established LEO network of 630 satellites and Eutelsat offering 36 GEO satellites. Of note, OneWeb recently inked a deal with Telstra in Australia to provide satellite backhaul for locations “where satellite backhaul is a preferred or only viable option.” OneWeb is also partnering with the European Space Agency to develop a next-gen 5G beam-hopping satellite, which could quickly increase connectivity for people traveling or for disaster areas that need emergency connectivity. Shareholders are set to vote on approving the merger on Sept. 28.

European Union greenlights multi-orbit constellation

With grand ambitions to launch a multi-orbit, €6 billion constellation in 2024, the European Union is partnering with a consortium of industry players including Airbus, SES, Eutelsat, Hispasat, and Thales to develop the EU’s IRIS² project. The EU still expects to have the first of its satellites go live by the end of 2024 and have a fully operational constellation by 2027.

HughesNet aiming to launch Jupiter 3 array in Q2 2023

HughesNet successfully launched its Jupiter 3 array on July 29, which aims to provide U.S. and Latin America consumers with higher broadband download speeds. While the actual satellite will take some time to reach its geosynchronous orbit and deploy, this satellite adds 500 Gbps of Ka-band capacity for HughesNet, which could see consumers reaching download speeds between 50 Mbps and 100 Mbps. We’ll be eagerly awaiting Speedtest® results from HughesNet’s Jupiter 3 array.

Ookla will continue monitoring new satellite internet developments

2023 continues to be an important year for satellite internet providers. Satellite connectivity is something we’ll be watching closely and we’ll continue our series next quarter with Q3 2023 data from select continents including North America. In the meantime, be sure to download the Speedtest app for Windows and Mac computers or for iOS or Android for devices and see how your satellite internet stacks up to our results.

Ookla retains ownership of this article including all of the intellectual property rights, data, content graphs and analysis. This article may not be quoted, reproduced, distributed or published for any commercial purpose without prior consent. Members of the press and others using the findings in this article for non-commercial purposes are welcome to publicly share and link to report information with attribution to Ookla.

| March 16, 2025

Checking In with Speed: Wi-Fi Performance in Luxury Hotels Across APAC’s Top Business Hubs

For business travelers, fast and reliable Wi-Fi is no longer a luxury—it’s a necessity. In today’s digital-first business environment, seamless connectivity enables real-time communication, access to cloud-based applications, and virtual meetings, all of which are critical for productivity and efficiency. A hotel’s Wi-Fi quality plays a major role in a business traveler’s accommodation choice, making high-speed internet a key differentiator for luxury hotels in APAC’s top business cities.

Key Takeaways

  • Only five out of the selected 20 hotels provided Wi-Fi with a median download speed of at least 100 Mbps. The majority of selected hotels fall into either the good performers category (50–100 Mbps) or the laggards category (below 50 Mbps). Leading hotels such as The Peninsula Tokyo and Rosewood Hong Kong demonstrate the benefits of investing in high-quality Wi-Fi infrastructure. 
  • Having a strong national broadband infrastructure does not guarantee fast hotel Wi-Fi. Even in cities with strong broadband infrastructure like Singapore, inconsistent hotel speeds highlight the need for better in-house network optimization. Raffles Singapore and InterContinental Singapore, for example, recorded some of the lowest speeds at 21.35 Mbps and 20.03 Mbps, respectively, underscoring the importance of proper Wi-Fi setup for a better guest experience.
  • Wi-Fi performance in APAC luxury hotels strongly correlates with the adoption of modern technology and effective frequency band usage. Top-performing hotels lead with 47.1% of tests conducted on Wi-Fi 6 and a high reliance on the 5 GHz band (88.4%), delivering faster speeds and more stable connections. In contrast, hotels with download speeds less than 50 Mbps relied heavily on outdated standards, with 75.2% of tests conducted on Wi-Fi 4 and Wi-Fi 5 and only 69.8% of their tests using the faster 5 GHz band. 

Connectivity is a key factor for business travelers in APAC

The Asia-Pacific (APAC) region remains a major hub for global business travel, driven by strong economic growth and dynamic markets. In 2023, business travel spending in APAC surged by 41%, reaching US$567 billion, with projections to exceed US$800 billion by 2027. The top five business meeting destinations in APAC; Singapore, Tokyo, Bangkok, Hong Kong, and Sydney, serve as major business hubs, attracting professionals from around the world.

This report analyzes Wi-Fi performance in selected 5-star hotels across the five cities: Singapore, Tokyo, Bangkok, Hong Kong, and Sydney, with the addition of hotels in Bali, a key location for international conventions and events such as the G20 Bali Summit, the APEC Summit, and the World Bank Annual Meeting.

Map: List of selected hotels and location (cities)

Map of locations of select 5-star hotels in APAC

APAC luxury business hotels show mixed Wi-Fi performance

Using Speedtest Intelligence® data, we analyzed median download speeds inside and around selected hotel properties throughout 2024. This year-long period allows us to assess Wi-Fi performance and stability under varying hotel occupancy levels and guest profiles. To ensure data reliability, we excluded hotels with insufficient measurement samples and focused only on the most commonly used Wi-Fi network at each hotel—typically the one freely accessible to guests.

Chart of Wi-Fi Performance for Select Hotels in Asia Pacific

The Wi-Fi download speeds of selected hotels across major APAC business destinations show significant variation, with some properties delivering top-tier connectivity while others fall short. In a similar report that analyzed Wi-Fi download speeds of luxury hotels in the MENA region, we categorized the results to three groups of hotels based on Wi-Fi download speed:

  1. Top performers are hotels that offer exceptionally fast Wi-Fi, with median download speeds exceeding 100 Mbps. Such speeds provide seamless connectivity for business travelers, enabling ultra-high-definition video conferencing, large file transfers, and lag-free virtual collaboration. These results suggest that these hotels have made significant investments in high-performance Wi-Fi infrastructure, ensuring a premium experience for their guests.
  2. Good performers offer solid Wi-Fi performance, ranging between 50 Mbps and 100 Mbps. These speeds are sufficient for most business activities, including video conferencing, cloud-based work, and high-speed browsing. While they don’t reach the top-tier speeds of the leading hotels, they still provide a strong and stable connection for business travelers.
  3. Performance laggards include hotels with a median download speed below 50 Mbps, which may impact business travelers relying on high-speed internet for seamless virtual meetings, large data transfers, or streaming-intensive work applications. 

Top performers represent 23.8% of the properties reviewed in this report. The Peninsula Tokyo is a leader, offering nearly double the speed (188.57 Mbps) of the next best hotel, Rosewood Hong Kong (113.21 Mbps). The InterContinental Grand Stanford Hong Kong also secured a position among the top performers, with a reported download speed of 109.74 Mbps, reinforcing Hong Kong’s strong presence in high-quality hotel Wi-Fi infrastructure.

The good performers category included properties such as Island Shangri-La Hong Kong (99.33 Mbps), Four Seasons Hotel Sydney and Tokyo (99.05 Mbps and 80.68 Mbps respectively), Mandarin Oriental Bangkok (88.58 Mbps), The Ritz-Carlton Tokyo (73.46 Mbps), and Marina Bay Sands Singapore (70.51 Mbps). These speeds are sufficient for most business activities, including video conferencing, online collaboration, and cloud-based applications. Notably, hotels in Bali, such as W Seminyak Bali and The St. Regis Bali Resort performed well, recording download speeds of 56.63 Mbps and 50.25 Mbps respectively, suggesting that luxury resorts catering to international business events are prioritizing strong internet connectivity. The presence of multiple Four Seasons properties in this range also indicates that while this chain generally provides good connectivity, they do not always reach the highest tier of performance.

Almost all of the cities have hotels in the laggards’ category. Despite Singapore’s strong fixed broadband infrastructure, and consistently topping Speedtest Global Index fixed broadband ranking, hotel Wi-Fi performance varied significantly. This suggests that the issue is most likely with the Wi-Fi network configuration rather than national broadband capacity. Raffles Singapore and InterContinental Singapore recorded some of the lowest speeds in the list, at 21.35 Mbps, and 20.03 Mbps respectively.

Modern Wi-Fi technology boost hotel connectivity performance 

Many factors influence Wi-Fi performance, including network design and the number of users connected to each access point (AP). Wi-Fi technology has also evolved significantly, with each generation introducing key improvements in speed, efficiency, and capacity. Rolling out modern, well-configured Wi-Fi equipment enhances reliability while maximizing the performance benefits of newer Wi-Fi technology.

Speedtest Intelligence data reveals a clear correlation between Wi-Fi standards and network performance across the three categories. Top performers reported more test samples on Wi-Fi 6 (47.1%), with a smaller share using Wi-Fi 5 (32.9%) and Wi-Fi 4 (20.0%). In contrast, good-performing hotels reported 61.9% of samples were on Wi-Fi 5, with only 21% utilizing Wi-Fi 6. Performance laggards rely more on older Wi-Fi 4 and Wi-Fi 5 setups, with a combined total of 77.7% of test samples reported on these two Wi-Fi standards.

Test Distribution by Wi-Fi Standard for Different Hotels’ Performance Levels
Source: Speedtest Intelligence | Jan 2024 – Dec 2024

The distribution of Wi-Fi frequency bands further demonstrates the impact of network optimization on hotel performance. Hotels in the Top Performers category conducted 88.4% of their tests on the 5 GHz frequency band, followed by 80.8% for Good Performers hotels. Performance Laggards reported the lowest distribution at 64.6%.

Test Distribution by Frequency Band for Different Hotels’ Performance Levels
Source: Speedtest Intelligence | Jan 2024 – Dec 2024

Meeting the needs of modern business travelers

Reliable, high-speed Wi-Fi is essential for business travelers in luxury hotels. Poor connectivity disrupts productivity, affects virtual meetings, and leads to guest dissatisfaction. To remain competitive, hotels must invest in strategic Wi-Fi planning and infrastructure upgrades to meet the increasing connectivity demands of business travelers.

Effective Wi-Fi planning requires upgrading to modern standards such as Wi-Fi 6E or 7, thereby unlocking wider channels in the  6 GHz band to help alleviate congestion, and optimizing network capacity for high-density environments. Hotels must assess access point placement, bandwidth allocation, interference management, and simultaneous device connections to ensure a seamless experience for guests.

To address these connectivity gaps, professional Wi-Fi design solutions like Ekahau help hotels optimize network configurations from the outset. These tools enable precise access point placement, configuration, and performance monitoring, ensuring reliable coverage and high-speed connectivity across all areas of the hotel. Proper planning and investment in advanced Wi-Fi infrastructure are critical for delivering a seamless and high-quality digital experience for business travelers.

Ookla can assist hospitality property managers in designing Wi-Fi networks, monitoring their performance, and optimizing them. Please contact us to learn more about Speedtest Intelligence and Ekahau.

Ookla retains ownership of this article including all of the intellectual property rights, data, content graphs and analysis. This article may not be quoted, reproduced, distributed or published for any commercial purpose without prior consent. Members of the press and others using the findings in this article for non-commercial purposes are welcome to publicly share and link to report information with attribution to Ookla.