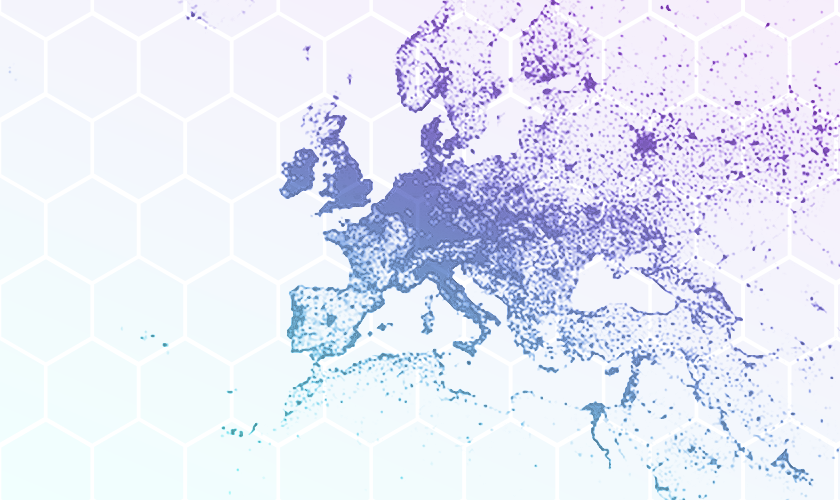
Ookla® maintains a data sharing partnership with the Organisation for Economic Co-operation and Development (OECD) as part of our Ookla for Good™ initiative. The OECD leverages data from the Ookla for Good open data initiative in their evaluation of broadband speeds across provinces within countries, including for rural and remote regions where data is often more difficult to find through administrative resources. The collaboration and analysis supports efforts to close the rural-urban connectivity divide on a global scale. For this purpose, the OECD recently published a report and summary blog post both studying access to fixed broadband in rural areas: “Bridging Digital Divides in G20 Countries” using data from Speedtest by Ookla Global Fixed Network Performance Map Tiles global fixed network performance maps corresponding to Q4 2020.
The report explores policies to reduce the disparity of connectivity between regions including targeted funding to support massive broadband and infrastructure investment projects after detailing the scope of network inequality among rural digital deserts that lack access to high-speed internet. The COVID-19 pandemic has highlighted that reliable internet access is a necessity as more people than ever before transition more of their lives online to attend work, school, and other virtual events. Despite the increasing reliance on the internet to participate in society, many rural communities have been left behind when it comes to fast and reliable internet. While internet traffic has increased over 1,000x throughout the past two decades, digital deserts are missing the necessary infrastructure to support network traffic in 2022 and beyond.
Key findings
- Broadband download speeds vary greatly. The OECD report found that poor data collection and self-reporting issues can result in inaccurate data on network access and reliability. Using Ookla for Good open data, the OECD uncovered the depth of internet access inequality in digital deserts. This data demonstrated that rural areas are massively behind, averaging 31% slower than the mean national download speed and 52% slower than cities during Q4 2020.
- Funding broadband improvements generates meaningful change. The OECD report discusses how many countries now view internet connectivity as a basic right, and many nations have put plans into place to improve access to broadband. The OECD also found that increasing competition and reducing network deployment costs alone is not enough for rural regions, even if they have proven to be investments that can help G20 countries expand their network coverage affordably. Furthermore, several studies by U.S. economists estimate that having access to broadband access saves households between $1,500 and $2,200 annually, which could have massive global economic impacts.
- The importance of private and public sector partnerships remains integral to increasing access and promoting competition. The OECD looks to both national and sub-national governments to generate attention for broadband issues. In addition to policies specifically for rural areas, OECD points to policies that increase competition, working in concurrence with public investment to subsidize private investment in broadband for areas that may not otherwise receive coverage. For example, increased competition in Mexican broadband led to 84% decline in price in mobile broadband costs, while adding 72 million users from 2012 through 2020. The OECD report also provides information on the Quebec regional government’s 50-50 funding initiative to service 150,000 new rural homes through private network operators.
- Bridging the “connectivity divide”means improving digital literacy. The connectivity divide is a term used to describe areas with disadvantaged groups and low population density. Not only do these areas lack access to broadband, but many individuals lack basic digital skills. Addressing the issues of both connectivity and digital literacy is paramount to strengthening the economic and social revitalization of these areas. Several of the OECD countries have taken measures to improve digital literacy: France has offered individual training accounts for upskilling, Australia has offered rural skills training initiatives to provide skills customized to regional needs, and Canada has provided digital literacy funds and youth programs.
We’re proud to partner with organizations like the OECD and empower them with data that ultimately creates a better, faster and more accessible internet across the world. Read the full report or click here to learn more about Ookla for Good.
Ookla retains ownership of this article including all of the intellectual property rights, data, content graphs and analysis. This article may not be quoted, reproduced, distributed or published for any commercial purpose without prior consent. Members of the press and others using the findings in this article for non-commercial purposes are welcome to publicly share and link to report information with attribution to Ookla.