| March 21, 2025

Bridging the Digital Divide: How Regulators Use Crowdsourced Data to Improve Rural Connectivity

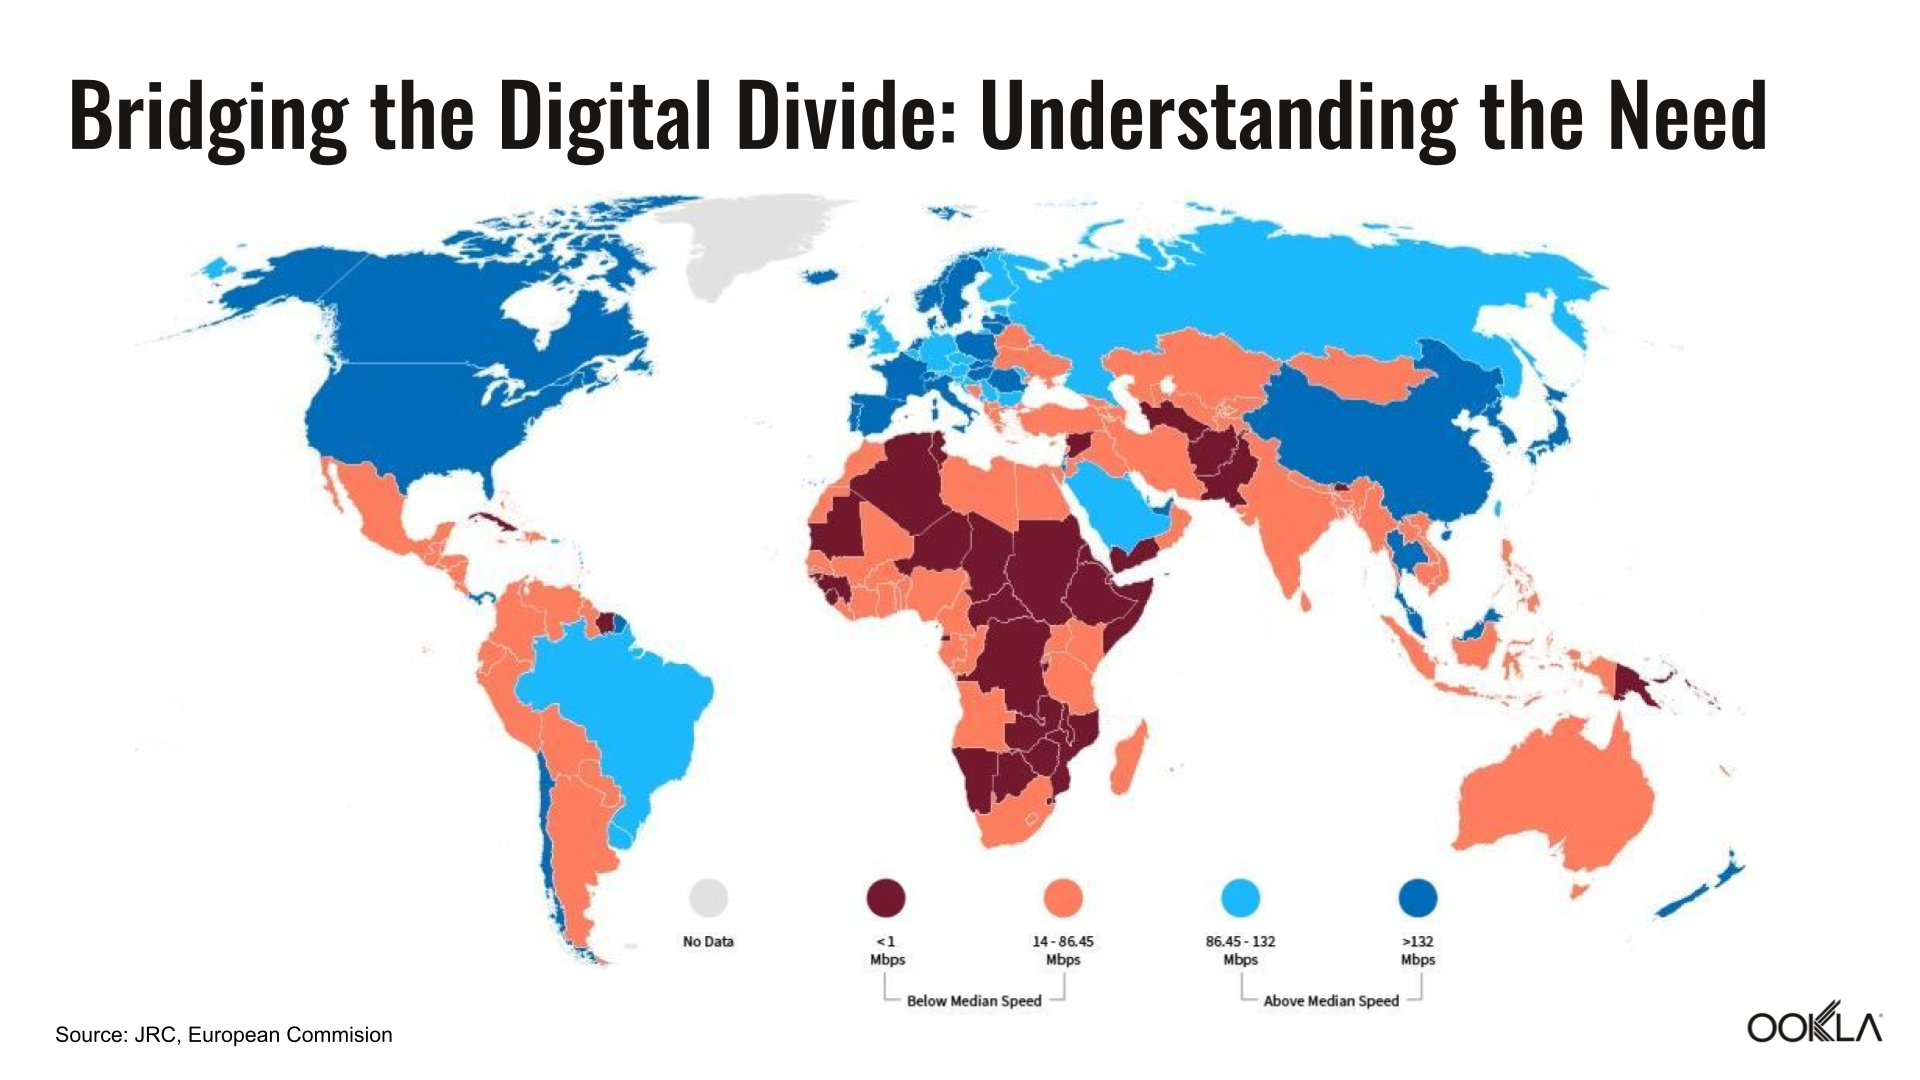
Digital connectivity has become essential for modern life, with access to high-speed internet now allowing people to work remotely, access education, receive healthcare services, and participate in online commerce and banking. Yet a stark digital divide persists: while 40% of urban centers globally enjoy download speeds exceeding 100 Mbps (sufficient for most demanding online activities including HD video streaming and remote work), rural communities across the world — including in Africa, Central and Southern Asia often struggle with slow connectivity or none at all. These disparities can create profound differences in opportunity, limiting the potential for many communities worldwide.

To effectively address connectivity gaps, regulators and policymakers need granular, accurate data on real-world network performance, and that’s where data from Ookla® can help. Crowdsourced data from Ookla’s Speedtest® provides crucial insights into actual user experiences, helps identify underserved areas, tracks improvements, and holds service providers accountable for deployment promises.

In this article, we’ll examine the current state of global connectivity disparities, explore how the digital divide affects education, healthcare, and economic opportunities in underserved areas, and show how Egypt’s Decent Life Initiative is using data-driven approaches to transform rural connectivity. 

For a deeper look into these topics, including case studies and methodological insights from Ookla and the National Telecom Regulatory Authority (NTRA) of Egypt, watch our full webinar.

The State of Global Digital Connectivity

Effective solutions start with an accurate diagnosis. Before meaningful progress can be made in bridging the digital divide, stakeholders need precise data showing where connectivity gaps are widest and which communities are most affected. Without detailed mapping of these disparities, stakeholders risk directing investments to the wrong areas and missing chances to help those most in need. 

A study by the European Commission’s Joint Research Center, conducted in partnership with Ookla, revealed several key findings about global connectivity disparities:

  • Many countries in Africa lag significantly behind, with some regions experiencing median download speeds below 3 Mbps.
  • Broadband speeds vary dramatically between and within regions, with 40% of urban centers enjoying speeds over 100 Mbps while others struggle with basic connectivity.
  • A strong correlation exists between connectivity and economic development, with high-income countries enjoying significantly better broadband speeds.
  • In many countries in Africa and other developing regions, mobile networks are more widespread and better performing than fixed broadband networks.

These findings highlight the complex nature of the digital divide and the need for targeted approaches to address connectivity challenges in different regions. By mapping end-user speeds and coverage differences with precision, stakeholders can develop more effective interventions tailored to specific geographic and socioeconomic situations.

Map of Bridging the Digital Divide: Understanding the need

The Real Impact of the Digital Divide

Connectivity gaps aren’t just data points on a map – they represent real barriers that affect people’s everyday lives. When communities lack reliable internet access, they face serious disadvantages across multiple areas of life, as seen in Sub-Saharan Africa, where GSMA reports two-thirds of the population (710 million people) do not currently use mobile internet despite living within the footprint of a mobile broadband network. These impacts include:

  • Limited access to information directly affects civic participation, with disconnected communities unable to access government services, agricultural guidance, and essential public health information.
  • Educational inequality deepens when rural students cannot access digital learning resources and research materials or utilize remote learning options available to their urban counterparts.
  • Healthcare outcomes suffer as communities without reliable connectivity cannot benefit from telemedicine, remote diagnostics, or timely access to medical specialists.
  • Economic opportunities vanish when rural residents cannot participate in e-commerce, access online job markets, or utilize digital financial services

Addressing connectivity problems requires understanding not just where internet access is lacking, but how that absence affects real people in these communities. With this understanding, stakeholders can develop more effective strategies that prioritize the most impactful investments. 

Leveraging Crowdsourced Data for Better Connectivity

When making connectivity decisions, actual user experiences matter more than theoretical coverage maps. Regulators need to know where people are truly experiencing poor or great service, not just where internet providers claim to provide coverage. Ookla’s crowdsourced data reveals these real-world experiences, helping stakeholders make better decisions through several practical applications:

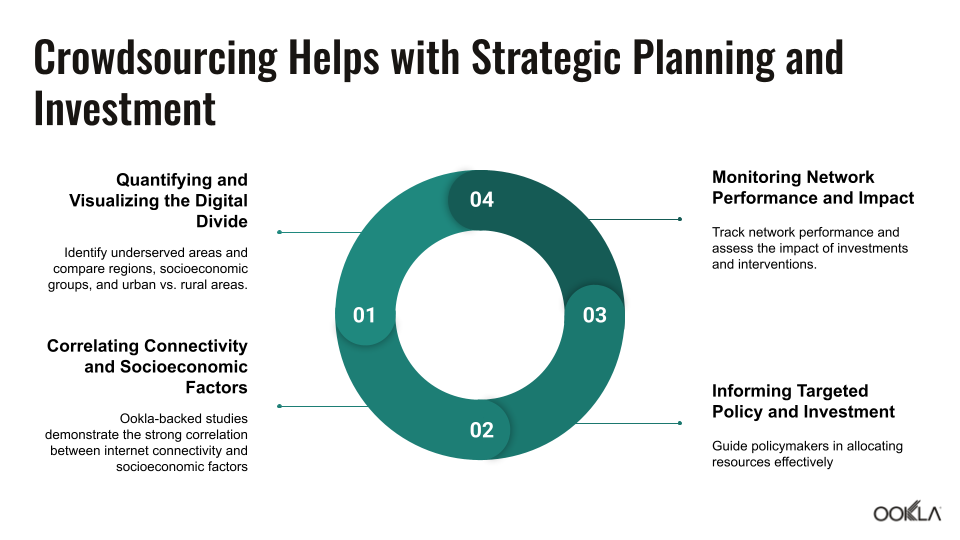
  • Creating precision maps of connectivity disparities by visualizing actual speeds geographically rather than relying on operator-reported coverage claims.
  • Identifying socioeconomic impacts through targeted research, such as the World Bank’s use of Ookla data to discover that 30% of areas near Brazilian educational facilities had inadequate speeds for effective e-learning.
  • Guiding evidence-based policy decisions, as demonstrated in the OECD’s analysis, revealed that rural fixed broadband speeds averaged 31% below national averages even in developed countries.
  • Establishing accountability frameworks, exemplified by South Carolina’s use of Ookla data to track rural-urban connectivity gaps and verify that providers delivered promised service improvements.

The examples from Brazil, OECD countries, and South Carolina demonstrate how empirical, user-generated data provides crucial insights that theoretical coverage models simply cannot offer. With such a granular understanding of actual network performance, regulators can target investments more precisely, measure progress accurately, and hold providers accountable for delivering on any promised improvements.

Graph of Crowdsourcing Helps with Strategic Planning

Case Study: Egypt’s Decent Life Initiative

Egypt’s ambitious Decent Life Project is a comprehensive national development program launched to improve the quality of life in rural areas, with telecommunications infrastructure as a key component. Launched in 2019, it demonstrates how data-driven planning, strategic investment, and public-private collaboration can transform rural connectivity at scale. This nationwide program tackles both coverage and quality issues in some of the country’s most underserved communities:

  • A comprehensive approach targeting 4,500 villages and directly impacting over 58 million Egyptians through improved infrastructure and services
  • Collaborative implementation involving more than 20 ministries, 23 civil society organizations, and numerous volunteers to address connectivity alongside other development needs
  • Strategic two-pillar telecommunications strategy focusing on mobile network expansion (establishing 1,096 new stations) and fiber optic deployment (targeting 2.8 million buildings)
  • Measurable improvements in download speeds across targeted governorates, documented via before-and-after performance testing using Ookla data
  • Innovative funding model combining government funding resources with private operator investments to share costs and accelerate deployment

With 80% of the first phase complete and plans to reach 99% mobile coverage by 2025, Egypt’s Decent Life Project demonstrates how targeted interventions can dramatically reduce rural-urban connectivity disparities. Egypt’s approach also underscores the power of coordinated action across government agencies, private sector partners, and civil society organizations. 

Best Practices for Addressing the Digital Divide

Successful digital divide initiatives like Egypt’s Decent Life Project and many others revealed a crucial insight: technical solutions alone cannot solve connectivity challenges when underlying economic, regulatory, and social barriers remain unaddressed.

Indeed, meaningful change occurs when comprehensive strategies align policy, funding, and technology toward clearly defined connectivity goals. Across initiatives aimed at narrowing the digital divide, several approaches consistently deliver positive results:

  • Data-centric planning that uses granular performance metrics to identify specific underserved areas rather than relying on broad regional generalizations
  • Technology diversity that combines mobile, fixed, and alternative technologies based on local geography, population density, and economic conditions
  • Collaborative funding frameworks that blend public resources with private investment to distribute costs and create appropriate incentives
  • Focus on outcomes rather than specific technologies, allowing solutions to adapt to local contexts and evolving capabilities
  • Parallel investment in digital literacy and relevant content to ensure infrastructure investments translate into actual adoption and usage
  • Continuous performance monitoring to maintain accountability, document improvements, and adjust strategies based on measured results

Practical experience from successful initiatives around the world shows that these elements form not just a theoretical framework but a proven roadmap for accelerating connectivity improvements. By combining data-driven planning, appropriate technology choices, innovative funding, and continuous performance monitoring, countries can make rapid progress even in challenging environments. 

Conclusion

Bridging the digital divide requires a comprehensive understanding of both coverage and usage gaps, strategic investment in infrastructure, and ongoing assessment of performance improvements. As demonstrated by Egypt’s Decent Life Project, crowdsourced data plays a critical role in guiding these efforts and measuring their impact.

When regulators leverage accurate, real-time performance data, they can more effectively address connectivity challenges and ensure digital resources are accessible to all communities. The result is not just improved network statistics but meaningful improvements in education, healthcare, economic opportunity, and quality of life.

For a more detailed examination of how regulators are using crowdsourced data to improve rural connectivity, including additional case studies and methodological insights, check out our recent webinar, “How Regulators Use Crowdsourced Data to Improve Connectivity in Underserved Rural Communities.”  


Ookla retains ownership of this article including all of the intellectual property rights, data, content graphs and analysis. This article may not be quoted, reproduced, distributed or published for any commercial purpose without prior consent. Members of the press and others using the findings in this article for non-commercial purposes are welcome to publicly share and link to report information with attribution to Ookla.

| September 17, 2024

Mapping Internet Connectivity Inequality in Cities around the World

In today’s urbanized and digitized world, broadband connectivity is as crucial as basic utilities. However, significant disparities in broadband quality still remain, and this chasm is contributing to the creation of a new generation of digital inequalities. As a result, understanding the geographic distribution of broadband availability and quality is essential for crafting policies that ensure equitable digital access.

The Joint Research Centre of the European Commission recently published a research utilizing mobile and fixed broadband performance data from the Ookla for Good™ program. Their study focused on the issue of digital inequality by exploring the quality of broadband connectivity across urban centers globally. Key research questions in their study focused on the following:

  • Do urban centers in higher-income countries enjoy better mobile and fixed broadband quality compared to lower-income countries?
  • Are more populous urban centers better connected?
  • What is the relationship between population dynamics and broadband speed in urban centers?

To address these questions, the European Commission’s Joint Research Centre leveraged a combination of traditional and emerging data sources, including Ookla’s Speedtest® data:

  • Remote sensing data and official population statistics (Global Human Settlement Layer or GHSL).
  • Country borders and income data (Global Administrative layer, GADM, and World Bank).
  • Global broadband speed data (Speedtest® by Ookla®, using data from 2021).

Key findings

The research revealed stark geographic and income disparities in internet download speeds, underscoring the urgent need for targeted policies to bridge the digital divide — especially considering that urban centers are already the places where most people live.

Cities in 125 countries fall below the global median download speed of 86.45 Mbps as of 2021 (which has since increased to 93.93 Mbps in June 2024). In fact, entire regions — such as Africa — lag significantly, with median speeds in countries like the Central African Republic and Eritrea below 3 Mbps.

Regional and income group variations

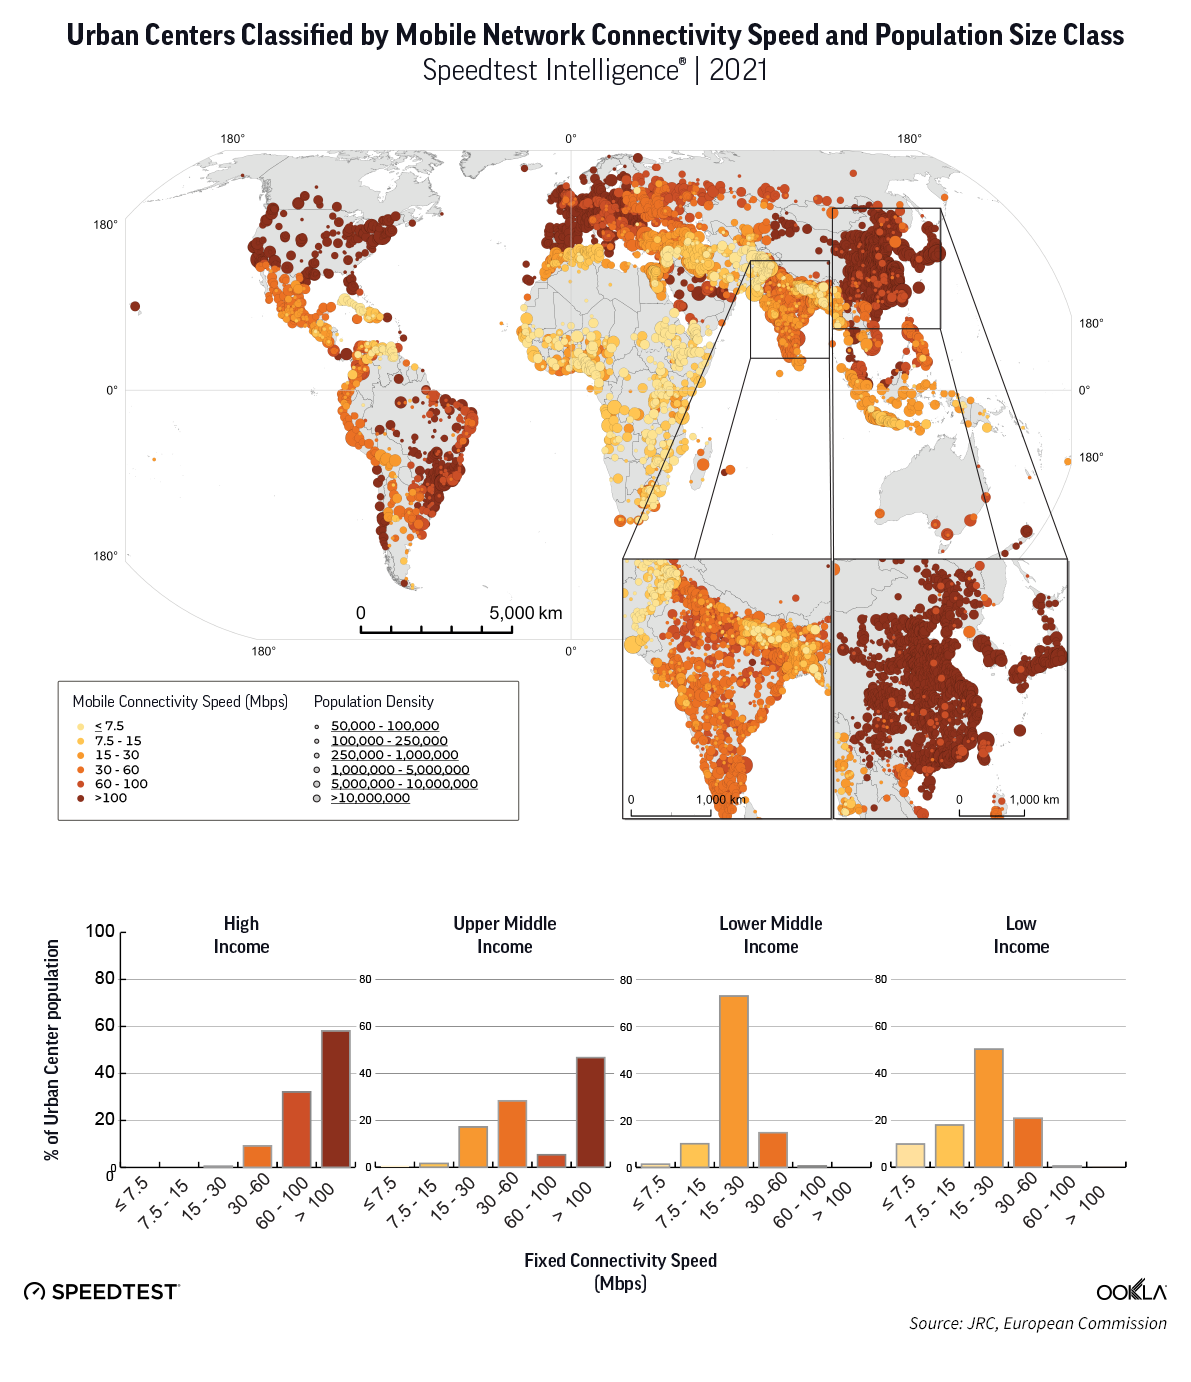
Broadband speeds vary significantly by region and income group. About 40% of urban centers have connectivity exceeding 100 Mbps, while 60% are split between 0–30 Mbps and 30–100 Mbps. Over 70% of urban centers with speeds below 30 Mbps are in Africa, Central, and Southern Asia. To address these disparities, policies should focus on both expanding access to connectivity and improving speeds in underserved areas.

Connectivity and affluence

A strong correlation exists between connectivity and affluence. High-income countries enjoy significantly better broadband speeds. In contrast, lower-middle-income countries struggle, with 51% of urban centers in the 0–30 Mbps download speed range. Investment in digital infrastructure in these countries is crucial to support economic development and competitiveness.

Map: Countries showing the lowest and hightest distance from median Download Speeds

Figure 1. Map of world countries shaded in blue represent areas with fixed broadband download speeds above the global median fixed download speed of 86.45 Mbps in 2021, while areas shaded in red are below the global median. Dark colors highlight countries showing the lowest and highest distance from median value. Source: Authors’ elaboration on Ookla Speedtest Intelligence data from 2021.

Mobile vs. fixed broadband

High-speed mobile networks are more widespread than fixed broadband, with Ookla® data showing that mobile connectivity was more widely available than fixed broadband solutions in urban centers. While the global median download speed for fixed broadband networks (86.45 Mbps) surpasses that of mobile connections (33.5 Mbps), in many Global South countries, mobile broadband is more affordable and performs better than fixed broadband networks. Policymakers should therefore consider promoting mobile broadband as a cost-effective solution to bridge the digital gap.

Income and urbanization as drivers of connectivity

Income and urbanization drive access to better and faster connections. Larger urban centers, even in lower-income countries, tend to have faster broadband. This suggests that policies aimed at urban development should include comprehensive digital infrastructure plans to ensure all urban residents benefit from high-speed connectivity.

Three key observations of internet speeds across the world

The research identified three primary connectivity scenarios that were observed in countries across the world:

  1. Symmetrical speeds: Some countries, like Sweden, have symmetrical high-speed connections, while others, like Burundi, have symmetrical speeds but slower connections.
  2. Faster fixed network speeds: Countries like India and Brazil benefit from existing infrastructure that supports higher fixed network speeds.
  3. Faster mobile network speeds: Regions in West and South Africa and Southeast Asia often have faster mobile network speeds due to rapid urban growth favoring mobile infrastructure deployment.

Map: Urban Centers Classified by Mobile Network Connectivity Speed and Population Size Class

Figure 2. Map of urban centers classified by mobile network connectivity speed and population size class. Source: Authors’ elaboration on Ookla data from 2021.

Looking ahead

The European Commission’s Joint Research Centre’s research highlights significant disparities in broadband quality across urban centers, driven by geographic, economic, and infrastructural factors. Policymakers must prioritize investments in digital infrastructure, particularly in underserved regions, to ensure equitable access to high-quality broadband connectivity.

After all, bridging the digital divide is not just about technology; it’s also about fostering inclusive economic growth and ensuring that all urban residents can participate in the digital economy. To learn more about this important work, read the complete article from the Joint Research Centre of the European Commission. 

The role of Ookla for Good™

At Ookla, we are proud to support research like this through our Ookla for Good initiative. The mission of Ookla for Good is to bring fast and reliable internet access to every person, regardless of location or socioeconomic status. 

That’s why we make this data available on a complimentary basis to policymakers, humanitarian organizations, academic research institutions, journalists, and consumers. The work we do with our partners is more significant than just improving internet speeds; we aim to leave a lasting impact on the communities we support worldwide.

We are grateful to Patrizia Sulis and colleagues (Michele Melchiorri, Paola Proietti, Marcello Schiavina, Alice Siragusa) for their work with our data within the European Commission’s paper and guidance in composing this article. For more information, please contact Patrizia Sulis – Spatial Data Scientist – Joint Research Centre, European Commission. And to read the full study, be sure to check out their article:

  • (2024) Integration of Remote and Social Sensing Data Reveals Uneven Quality of Broadband Connectivity Across World Cities. In Urban Inequalities from Space: Earth Observation Applications in the Majority World (pp. 13-31). Cham: Springer International Publishing.

To learn more about Ookla for Good and inquire about partnership opportunities, visit the Ookla for Good page on our website.

Ookla retains ownership of this article including all of the intellectual property rights, data, content graphs and analysis. This article may not be quoted, reproduced, distributed or published for any commercial purpose without prior consent. Members of the press and others using the findings in this article for non-commercial purposes are welcome to publicly share and link to report information with attribution to Ookla.

| June 18, 2024

Ookla for Good Data Reveals a Persistent Digital Divide in Brazil

In Brazil, the digital divide is not merely a matter of technology access but a stark reflection of the nation’s economic disparities. The internet, serving as a vital portal to education, employment prospects, and critical services, remains inequitably accessible across the country. 

Research across Brazil shows that affluent individuals often benefit from consistently strong connectivity, while those in lower-income brackets frequently grapple with limited or nonexistent internet access. 

A recent World Bank study in Brazil, utilizing mobile and fixed broadband performance data from the Ookla for Good™ program, has illuminated stark differences in internet access across six major Brazilian cities, emphasizing the need for focused policies to address digital and socioeconomic gaps. 

Ookla for Good is an initiative to provide data, analysis, and content to organizations that are seeking to improve people’s lives through internet accessibility.

The research

Researchers in Brazil conducted a study titled “Bridging the Digital Divide: Mapping Internet Connectivity Evolution, Inequalities, and Resilience in six Brazilian Cities.” They used Ookla® Speedtest Intelligence® test results to examine internet speeds in Belo Horizonte, Brasilia, Fortaleza, Manaus, Rio de Janeiro, and São Paulo between 2017 and 2023. Their findings showed:

  • Wealthier neighborhoods consistently enjoyed superior internet speeds, especially on fixed networks.
  • Mobile internet speeds also correlated with wealth, but that trend has been decreasing over time.
  • Around 13% of areas near educational facilities had speeds below the 80 Mbps threshold recommended for effective e-learning, affecting approximately 8% of the school-age population.

“Our analysis underscores the persistent internet access inequalities in Brazil, a country with a very diverse digital landscape,” said Niccolò Comini, one of the lead researchers and Digital Development Specialist within the Infrastructure Vice-Presidency at the World Bank.

The impact of COVID-19

The study also highlighted how the COVID-19 pandemic exacerbated the digital divide in Brazil. After the declaration of a national emergency, all cities across Brazil saw a significant decrease in internet speed, with poorer areas experiencing bigger dips in speed, demonstrating a clear gap between those who have reliable connectivity and those who do not. 

More is needed for an equitable digital future

To address these disparities, policymakers and the private sector must collaborate on targeted local policies, such as:

  • Improving connectivity in underserved areas
  • Promoting Fiber to the Home (FTTH) technology
  • Making high-speed internet packages and devices more affordable
  • Fostering digital literacy through training and awareness programs

The World Bank is already supporting initiatives like connecting public buildings via fiber optics in the State of Sergipe in Brazil, driving private sector investments to bring internet access to unconnected households. 

Ookla joined the Development Data Partnership in 2020 to collaborate with partner’s like the World Bank in their efforts to reduce poverty, increase shared prosperity, and promote sustainable development by narrowing the digital divide and bringing connectivity to all.

The role of Ookla for Good™

At Ookla, we are proud to support research like this through our Ookla for Good initiative. The mission of Ookla for Good is to bring fast and reliable internet access to every person, regardless of location or socioeconomic status. 

That’s why we make this data available on a complimentary basis to policymakers, humanitarian organizations, academic research institutions, journalists, and consumers. By providing access to our vast dataset on a complimentary basis, we aim to empower researchers, policymakers, and organizations in their efforts to address the digital divide and promote equitable access to the internet across the globe.

We are grateful to Niccolò Comini, Nicolò Gozzi, and Nicola Perra for their dedication to this critical issue and for using Ookla’s data to drive positive change. For the full analysis, be sure to check out their research paper.

To learn more about Ookla for Good and inquire about partnership opportunities, visit the Ookla for Good page on our website.

Ookla retains ownership of this article including all of the intellectual property rights, data, content graphs and analysis. This article may not be quoted, reproduced, distributed or published for any commercial purpose without prior consent. Members of the press and others using the findings in this article for non-commercial purposes are welcome to publicly share and link to report information with attribution to Ookla.

| December 19, 2023

The State of Worldwide Connectivity in 2023

To gain insight into the current performance of networks, we analyzed Speedtest® data in Q3 2023. Our analysis compares changes in 5G performance to the previous year, identifies the top 10 countries with the best performance, and discusses customer satisfaction with 5G. We also ranked countries based on the performance of their fixed networks and investigated the connectivity gap across the world.

5G | Fixed | Connectivity for All

Key takeaways 

  • Global 5G download speed improved. The median global 5G download speed experienced a substantial 20% increase in Q3 2023, reaching 203.04 Mbps, compared to 168.27 Mbps in Q3 2022. This improvement aligns with a significant rise in global 5G subscriptions, indicating positive progress in user adoption of 5G and the performance of 5G networks. 
  • Top 5G performers have shifted. The top 10 countries for 5G performance witnessed notable changes, with the United Arab Emirates claiming the top spot, surpassing South Korea. Malaysia, India, and the Dominican Republic also made significant strides, showcasing a dynamic shift in the global 5G landscape.
  • Speedtest user ratings indicate room for 5G improvement. Despite advancements in 5G technology, there has been a decline in the Net Promoter Score (NPS) among 5G users. Factors contributing to this dissatisfaction could include unmet expectations and discrepancies between actual 5G speeds and advertised speeds.
  • Fixed Networks Advancements. On a global scale, fixed networks demonstrated significant performance improvement, with a 19% increase in median download speed (83.95 Mbps) and a 28% increase in upload speed (38.32 Mbps) in Q3 2023 compared to the previous year. This highlights the ongoing transition to more advanced broadband technologies, particularly Fiber-to-the-Home (FTTH).
  • The imperative of closing the connectivity gaps. Despite improvements in global connectivity, there are still areas that fall outside of network coverage. Speedtest® data highlights disparities in internet performance between fixed and mobile networks across different regions, emphasizing the importance of addressing connectivity challenges worldwide.

5G Networks

Global 5G download speed improvements
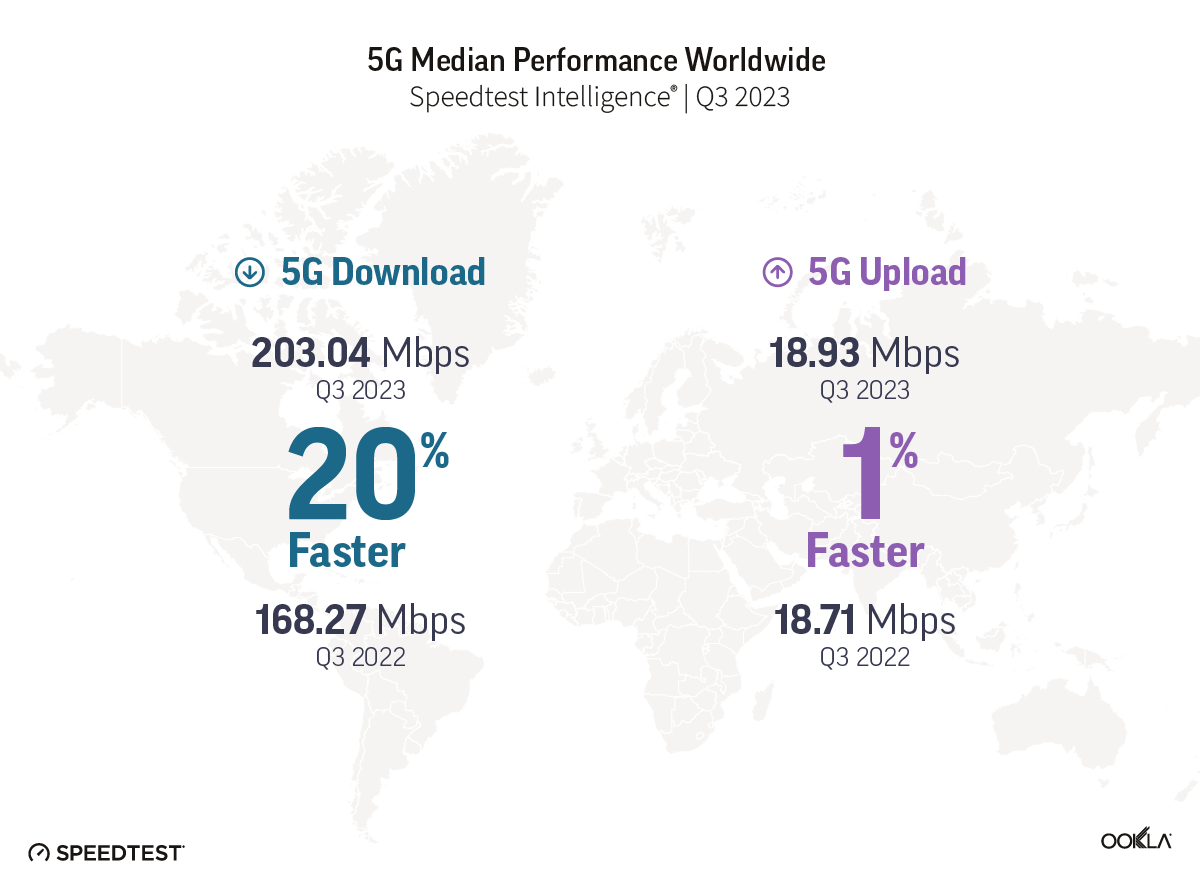
Illustration of 5G Median Performance Worldwide

The median global 5G download speed has experienced a noteworthy surge, registering a 20% increase and reaching 203.04 Mbps in Q3 2023, compared to 168.27 Mbps in Q3 2022, according to Speedtest Intelligence® data. This improvement coincides with a substantial rise in global 5G connections, reaching 1.4 billion according to GSMA Intelligence, representing a 65% year-on-year increase from 872 million a year ago. 

In terms of upload speed and latency, only a very modest improvement of 1% occurred. Median 5G upload speeds reached 18.93 Mbps in Q3 2023, compared to 18.71 Mbps in the same period last year; multi-server latency, a critical metric for network responsiveness, improved from 45 ms in Q3 2022 to 44 ms in Q3 2023. 

Speedtest users experiencing the top 10% of 5G download speeds globally have seen a 9% increase, rising from 525.54 Mbps in Q3 2022 to 573.12 Mbps in Q3 2023. However, speeds have not yet reached Gigabit levels, primarly because of network economics. 5G was originally designed to deliver peak data rates of up to 20 Gbps based on IMT-2020 requirements, but we are still a ways off before gigabit speeds become the new normal. For instance, symmetrical download, upload speeds, and ultra-low latency haven’t been realized, partially because the vast majority of 5G networks are not ‘true 5G’ as they have been deployed in Non-Standalone (NSA) mode, meaning they rely on a 4G LTE network core. According to GSA, over 40 operators have launched 5G standalone (SA) in public networks, but the rollout is not yet complete. Nevertheless, the industry is actively exploring the prospect of 5G Advanced, which promises symmetrical upload and download speeds and ultra-low latency, signaling a proactive stance ahead of the eventual transition to 6G.

Malaysia joined South Korea and the U.A.E at 5G speeds podium
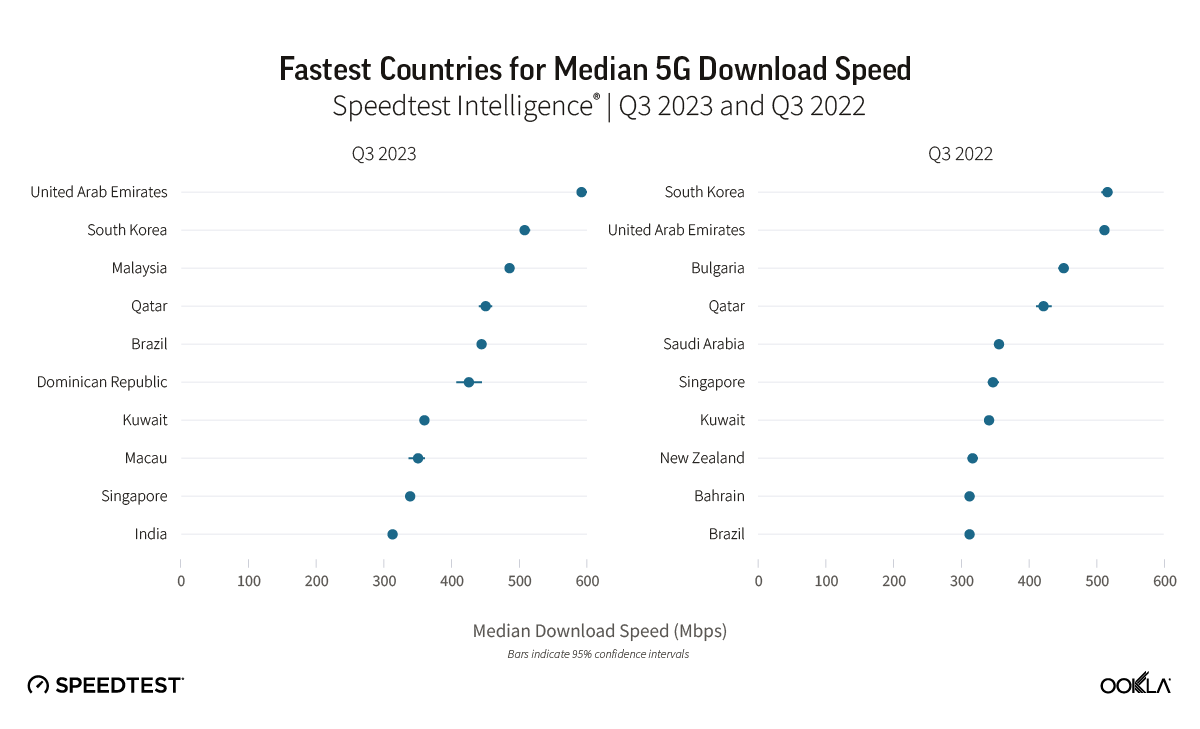
Chart of Fastest Countries for Median 5G Download Speed

During Q3 2023, the United Arab Emirates and South Korea stood out as leaders in 5G performance, boasting the fastest median 5G download speeds globally at 592.01 Mbps and 507.59 Mbps, respectively. Our top 10 list also includes Malaysia, Qatar, Brazil, the Dominican Republic, Kuwait, Macau, Singapore, and India. The shift in the top 10 rankings reveals dynamic changes, with Malaysia, the Dominican Republic, and India making significant strides, while Bulgaria, Saudi Arabia, New Zealand, and Bahrain dropped out of the rankings.

The U.A.E showcased a 14% increase in its median 5G download speed, reaching 592.01 Mbps in Q3 2023, up from 511.68 Mbps in Q3 2022, allowing the U.A.E to take the top spot from South Korea. Key factors contributing to the U.A.E.’s 5G leadership include fierce market competition driven by Etisalat and du, resulting in extensive 5G coverage and widespread access to 5G services. Additionally, the allocation of a 100 MHz of contiguous spectrum, as discussed in our 5G spectrum article, has played a pivotal role in achieving faster speeds, lower latency, and improved spectral efficiency.

The regional shift in 5G performance leadership is noteworthy. In 2022, half of the top 10 countries were from the Middle East, while in 2023, the same proportion hailed from the Asia Pacific region. Our analysis suggests that early adopters in the Asia Pacific region have outperformed major European markets in 5G performance, due to factors such as early spectrum availability and supportive government policies.

Malaysia’s remarkable achievement in reaching the third spot globally for 5G download speed, with a reported speed of 485.24 Mbps in Q3 2023, is particularly noteworthy. Despite launching its nationwide 5G network less than two years ago, Malaysia’s unconventional deployment strategy has proven effective. India has also made a significant leap, with its median 5G download speed of 312.26 Mbps allowing India to reach the top 10 worldwide. The country’s climb of 72 places on the Speedtest Global Index™ between September 2022 and August 2023 is primarily credited to the launch of 5G. Following a 5G spectrum auction in India, operators have successfully addressed network congestion issues by offloading 4G traffic onto 5G networks.

In Brazil, 5G download speed increased 1.4 times, jumping from 312.09 Mbps in Q3 2022 to 443.93 Mbps in Q3 2023. Before Brazil’s 5G spectrum auction, operators had offered 5G using DSS since July 2020. While DSS can provide broad 5G coverage, its speeds are often similar to those on 4G LTE networks. In November of 2021, however, Brazil’s multi-band 5G spectrum auction closed, which not only generated BRL47.2 billion ($8.5 billion) in total commitments, but it also allowed operators to deliver much faster speeds on dedicated 5G spectrum compared to DSS. National operators – Telefonica Brasil (Vivo), Claro Brazil, and TIM Brazil – ended up with 40 MHz or 50 MHz in the 2.3 GHz spectrum band and 100 MHz each in the 3.5 GHz band. The subsequent simultaneous activation of 5G networks in July 2022 marked a transformative moment with the continuous expansion of 5G services to 623 municipalities by December 2023. An upcoming spectrum auction expects to improve Brazil’s 5G standing even further.

The Dominican Republic’s entry into the top 10 fastest 5G countries was marked by its official launch of 5G services in December 2021, making it the first Caribbean nation and the third in Latin America to adopt a 5G network.

Disparity Between 5G Performance and Consumer Perception

The Net Promoter Score (NPS) is a tool that gauges customer loyalty and satisfaction. At the end of Speetest, users may be asked to answer “How likely is it that you would recommend [provider] to a friend or colleague?” on a scale from 0-10. Net Promoter Scores are applied to both users and providers. Users are categorized into Detractors (score 0-6), Passives (score 7-8), and Promoters (score 9-10). NPS is the percent of Promoters minus the percent of Detractors and is displayed in the range from -100 to 100. Providers are ranked in descending order of NPS. NPS categorizes users into Detractors (those that score 0-6), Passives (scores between 7 and 8), and Promoters (scores of 9-10). NPS represents the percentage of Promoters minus the percent of Detractors displayed in the range from -100 to 100. 

In our article discussing whether 5G was meeting customer expectations, we found that 5G users typically rate their network operator with NPS scores universally higher than those for 4G LTE users. In Q3 2023, that trend continued, as 5G  users that were on 5G network when answering the NPS question still scored higher than those on 4G across all markets analyzed. It isn’t surprising given that at a global level, 5G had a 637% better median download speed than 4G and a 130% better median upload speed. 
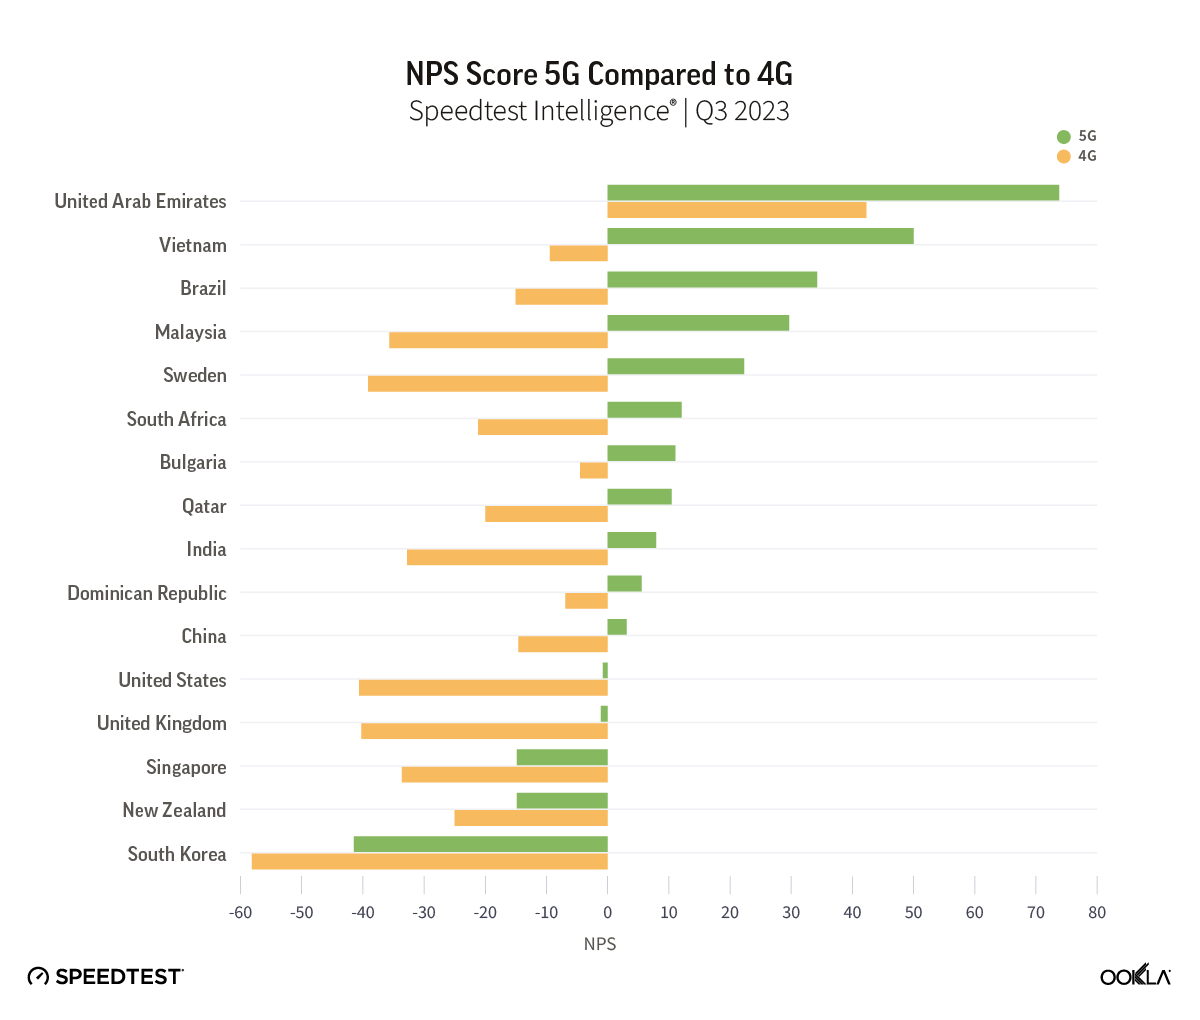
Chart of NPS Score, 5G Compared to 4G

While 5G NPS still outpaces scores on 4G, our data shows that 5G NPS has been decreasing annually. This could point to the fact that excitement about 5G as a new technology is waning as users become used to faster speeds, or as customers await new use cases that can take advantage of the faster speeds that 5G can provide. After all, we are still waiting for that killer app for 5G, the way the video and streaming were for 4G. 

While it is difficult to fully explain the reasons behind the 5G NPS decrease without further research, we can clearly see that network performance isn’t the only factor at play influencing NPS declines. Others can include customer care, pricing, and other services. For example, in South Korea, one of the first countries to launch 5G with one of the world’s fastest speeds, consumers scored 5G networks -41.47 in Q3 2023 compared to -20.51 in Q3 2022. 

In March 2021, South Korean consumers launched a class action suit against operators because they felt they were being misled by the promises of 5G in the country. Recently, South Korea’s antitrust regulator fined three 5G operators a total of 33.6 billion won ($25.06 million) for making exaggerated claims about the level of performance their networks could achieve. South Korean operators claimed consumers could experience theoretical 5G speeds, which are not practically achievable in a “real world” environment, as factors such as spectrum usage, network densification, user location, and device capability significantly affect actual performance. Our data shows that the top 10% of 5G users in South Korea experienced speeds of 1.004 Gbps in Q3 2023, which, although impressive, are far lower than the advertised 20 Gbps speeds. 
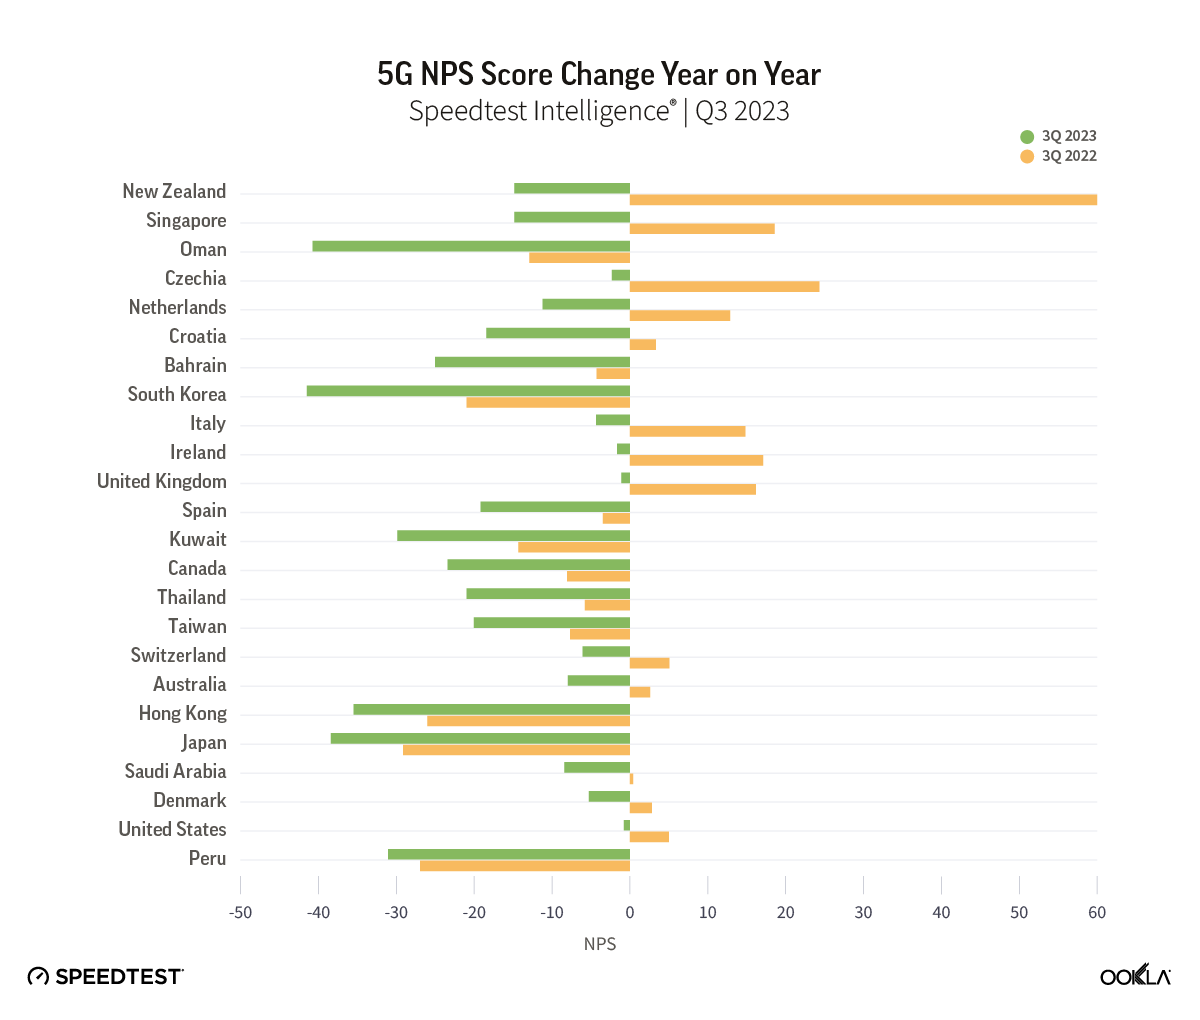
Chart of 5G NPS Score Change Year on Year

Fixed Networks

Fiber driving fixed performance gains 
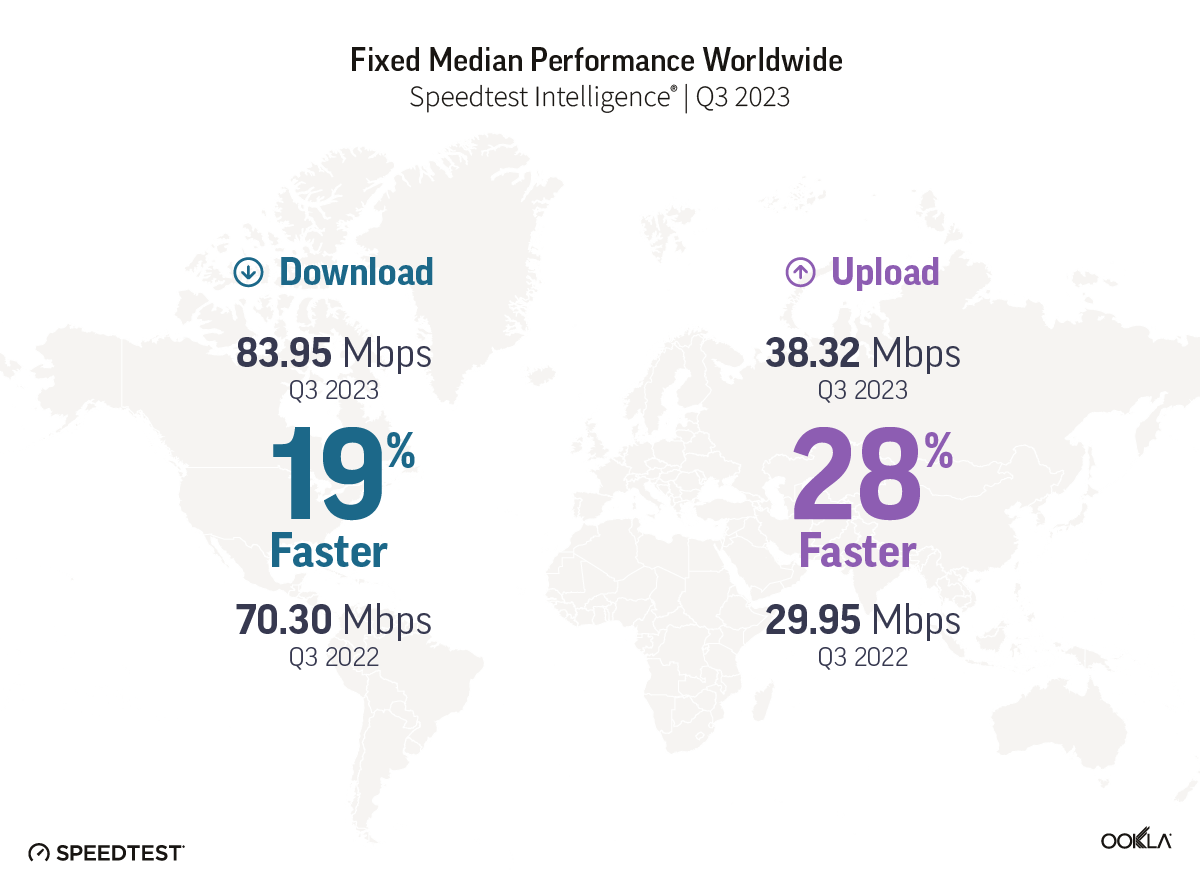
Illustration of Fixed Median Performance Worldwide

On a global scale, fixed networks have demonstrated significant advancements, achieving a median download speed of 83.95 Mbps and an upload speed of 38.32 Mbps in Q3 2023, per Speedtest Intelligence data. This signifies a substantial 19% improvement in download speed and an impressive 28% enhancement in upload speed compared to those in 2022. This also indicates that more fixed connections have migrated to fiber networks.

According to the World Broadband Association (WBBA) report titled “Next Generation Broadband Roadmap 2023 to 2030” Fiber-to-the-Home (FTTH) is identified as the natural progression from copper-based xDSL broadband networks. The shift towards FTTH varies across different countries and regions, but the industry is committed to embracing more advanced and efficient broadband technologies. 

Oftentimes, despite improvement in underlying broadband technology, Wi-Fi is the bottleneck that reduces customer experience. Our research has shown that Wi-Fi performance can lag behind ethernet in markets where advanced cable and fiber connections are replacing legacy broadband technology (such as DSL or coax cable). Wi-Fi speeds typically range from 30-40% of ethernet, indicating a need to accelerate the adoption of more advanced Wi-Fi technologies and optimize the home network environment.

The UAE, Singapore, and Hong Kong are in the lead for fixed
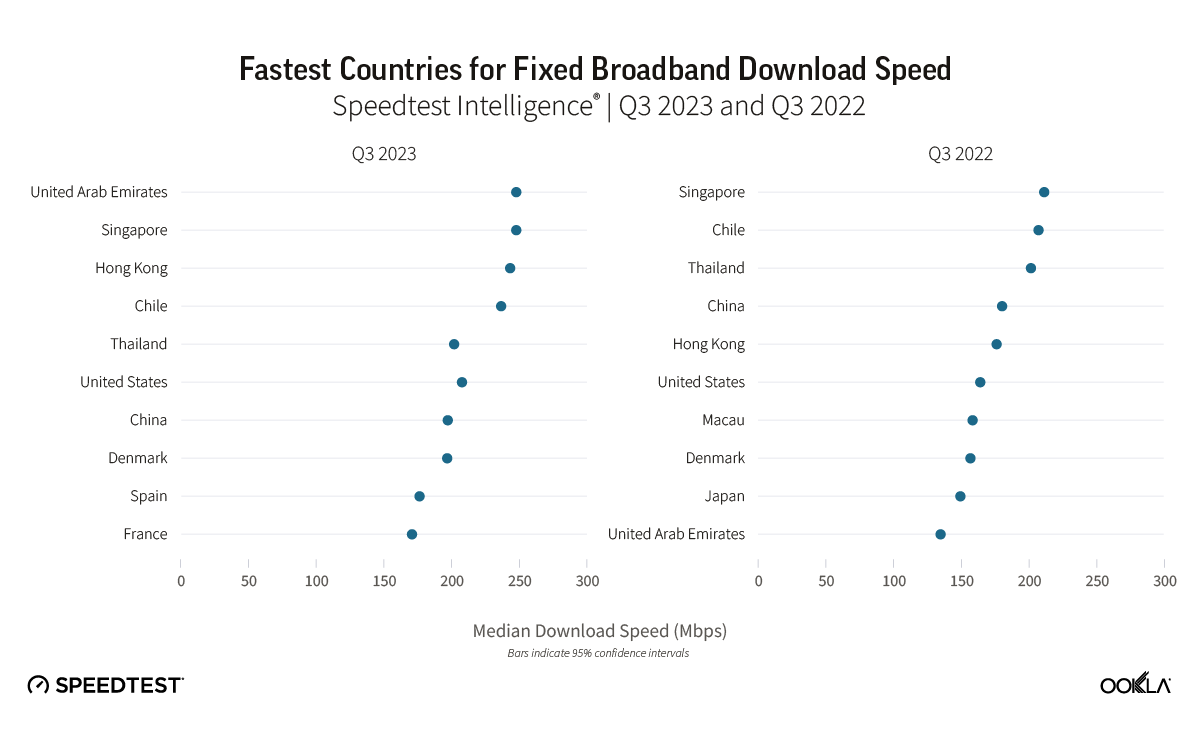
Chart of Fastest Countries for Fixed Broadband Download Speed

The United Arab Emirates (UAE) and Singapore led the way in fixed network performance.

The UAE achieved a median download speed of 247.63 Mbps in Q3 2023, representing a notable 1.83 times increase compared to the previous year. Most customers in the UAE have access to fiber networks, and additional measures have been implemented by operators in the region to enhance internet speeds, such as increasing the minimum download speed from 250 Mbps to 500 Mbps and offering price discounts to incentivize users to upgrade to higher-tier plans. 

Singapore also leads on the 2023 Fiber Development Index (FDI), with maximum scores in seven of the nine metrics. Singapore, along with Qatar and South Korea, has achieved 100% FTHH coverage. One of the reasons for this success, besides having a smaller area, is that Singapore’s regulator mandates building owners and real estate developers to provide adequate space, facilities, and accessibility for network operators to pre-install fiber networks.

Hong Kong also demonstrated significant progress, with a 37% increase in median download speed and a 40% increase in upload speed. To track broadband adoption, the Office of the Communications Authority (OFCA) in Hong Kong monitors broadband adoption by advertised speed and technology mix; as of August 2023, 66% of residential clients already subscribed to the Internet with a download speed equal to or greater than 1 Gbps.

Chile has seen a 14% improvement in median download speed and a 29% improvement in upload speed on the back of a greater fiber adoption. Chile has been the top-performing fixed broadband market across Latin America, consistently outperforming other regional markets but over the last three years, it has also closed the performance gap with other leading markets globally. Chile’s strong fixed broadband performance — an anomaly in the region — is primarily due to strong competition among Chilean ISPs. Chile has seven ISPs with over 5% market share, all heavily focused on migrating customers to fiber. 

Thailand is a newcomer to the ranking as FTTH continues to grow strongly. FTTH constitutes an impressive 95% of fixed broadband users in Thailand, equivalent to around 58.96% of household penetration. Operators have been actively rolling out fiber in adherence to the Digital Thailand National Policy.

In the United States, there has been a 26% improvement in median download speed and a 7% improvement in upload speed. In this very competitive market, with a range of access technologies vying for customers, a combination of migration to fiber, 5G fixed-wireless access (FWA), and faster cable connections is helping drive higher performance levels. In line with the demand for faster network performance in the market, the FCC recently announced that it is seeking input on a planned increase to its definition of broadband/high-speed internet to 100 Mbps download and 20 Mbps upload, up from the current 25 Mbps download and 3 Mbps upload standard.

As discussed in our recent article, several European countries are making substantial progress in offering high-speed broadband. Across Europe, Denmark had the fastest median download speed for fixed broadband (196.43 Mbps), followed by Spain (176.08 Mbps) and France (170.51 Mbps). Denmark experienced a 25% improvement in median download speed and a 16% improvement in upload speed. Spain also showed significant improvement, with a 32% increase in median download speed and a 29% increase in upload speed. France exhibited even stronger progress, with a 53% increase in median download speed and a 41% increase in upload speed. The speed gains we’ve seen in Spain and France are correlated with an increase in fiber adoption; for example, Spain boasts nearly 90% fiber optic coverage, thanks to private initiatives and government support, while France expects a full-fiber rollout by 2025.

Connectivity for All

The imperative of closing the connectivity gap

Massive investments are being made to bridge the connectivity gap as recognition of connectivity as a fundamental human right is growing. According to a WBBA Whitepaper, a high level of broadband penetration is critical to the country’s socioeconomic development. However, it’s not only about being connected to the network per se; the quality of that broadband connection is equally crucial. Unlike other utility services like gas and electricity, where quality is generally stable, with broadband, the quality of the network experience is crucial to ensure users can benefit fully from multiple applications.

To assess the digital divide, we mapped mobile and fixed internet performance using data from the Open Data Initiative, which Ookla provides as part of Ookla for Good

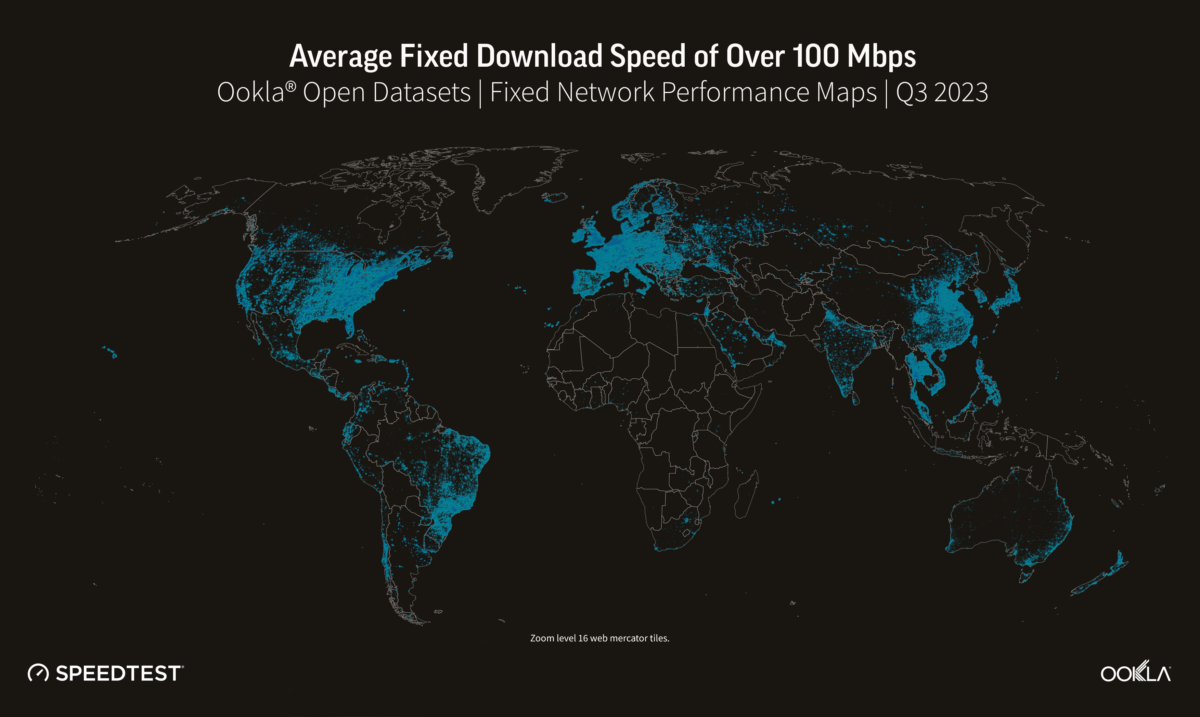
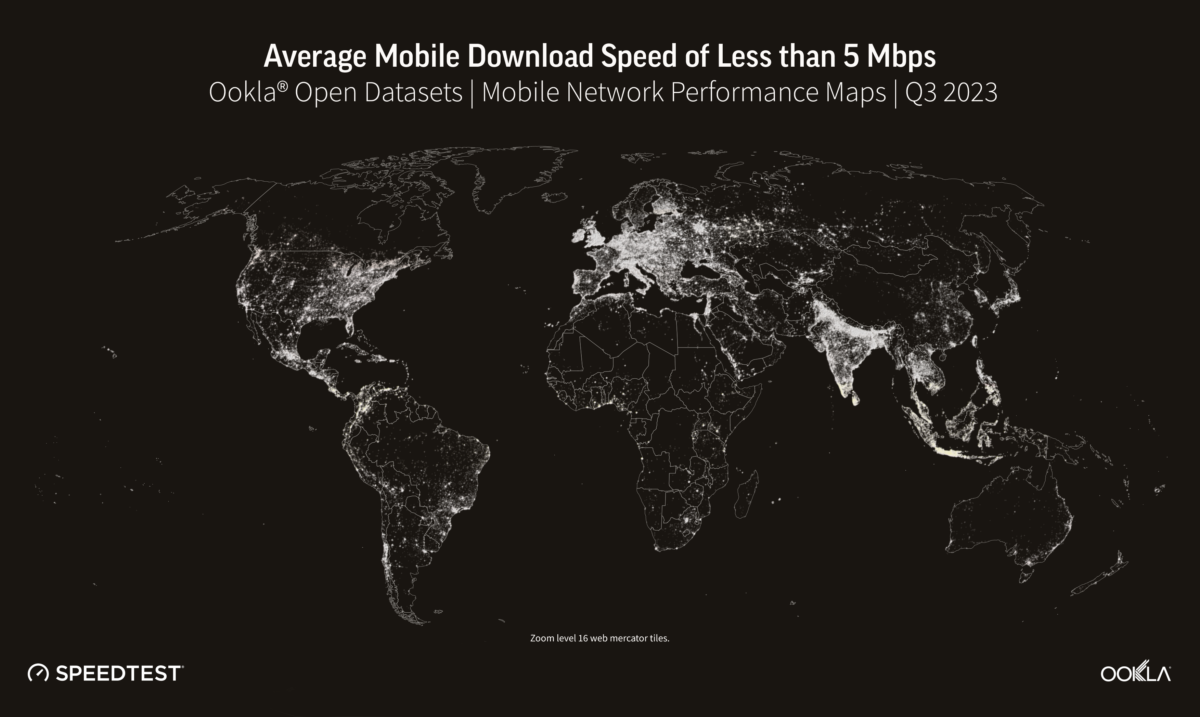
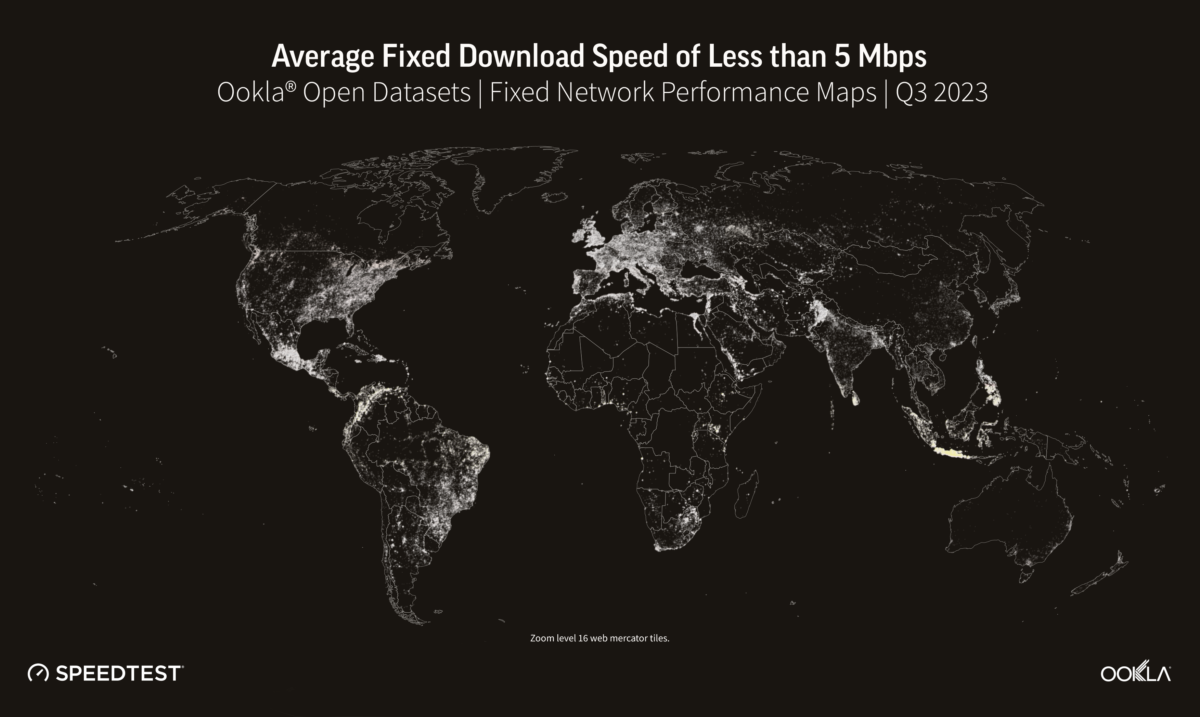
Determining where a digital divide exists is a complex issue that involves identifying where network infrastructure is located, where people need connectivity, and how affordable it is. Although it can be challenging to dig into a specific location, it is evident that there are varying levels of Internet performance worldwide. A quick glance at our data shows that fixed broadband customers are more likely to experience faster networks (measured as an average download speed of 100 Mbps and above) than mobile across the Americas and Europe. The opposite is true for mobile networks across Africa and APAC, where mobile networks are often the primary means of connectivity. Compared to urban areas, rural communities are often ill-equipped for broadband access. Due to a lack of bandwidth (and therefore slower speeds), people in these areas need help doing many things on the internet, such as streaming videos. The US regulator FCC defines broadband in the United States as access to  25 Mbps download and 3 Mbps upload speeds. Areas without those speeds are classified as broadband “digital deserts,” even if those areas have internet access. Although broadband definitions can vary considerably from country to country, we can see in the next section that many areas fall outside any standards of connectivity globally.

Despite the world becoming increasingly connected, many rural and remote areas still struggle to access the internet. For example, large swathes of South America and Africa fall outside terrestrial network coverage. As discussed in our recent article, cellular networks are critical to connecting individuals and businesses as internet access in Africa is predominantly mobile. Before we can start discussing 5G, connecting communities with the internet in general is a priority. Affordable 4G smartphones and targeted financing for under-served demographics are key for bridging the digital divide and reducing poverty, as a World Bank study found that 4G coverage can help cut poverty by up to 4.3%. 

5G technology can potentially replace fixed internet access in situations where the cost of fiber deployments is high and rolling out traditional fixed broadband networks isn’t commercially viable. However, in countries like Indonesia, satellite technology may be a more effective solution for connecting remote areas. While 5G Fixed Wireless Access (FWA) and satellite technology can complement each other, the adoption of satellite technology is currently limited by factors such as coverage, device affordability, and service cost. As revealed in our recent article, Starlink outperforms GEO satellites and is a suitable replacement for fixed networks in rural areas. While it may not match the leading cable or fiber providers in terms of median speeds or multi-server latency, satellite internet provides a viable alternative in places where cable and fiber access networks are unavailable. This is mainly due to a more consistent distribution of download performance across Speedtest samples, unlike FWA and DSL-based services, where performance is impacted by the distance from the cell site or exchange/DSLAM.

Fixed and mobile network operators across the globe widely use Speedtest data to enhance Internet quality, improve accessibility, and inform network expansion. The United States Federal Communications Commission and the Malaysian Communications and Multimedia Commission rely on Speedtest data to ensure accountability of telecommunications entities and allocate funds for rural and urban connectivity development. Ookla also licenses data to NGOs and educational institutions to help bridge the digital divide between areas with and without modern Internet access. Our mapping data is used to track results and determine whether broadband infrastructure can handle growth as more people connect devices and technologies demand more bandwidth. We are also actively involved in discussing best practices for ensuring digital transformation and connectivity for all in the APAC region, Central Asia, and Europe. If you are interested in working with us, please reach out. 

Keep track of how well your country is performing on Ookla’s Speedtest Global Index and get advice on how to plan and optimize your network.
Ookla retains ownership of this article including all of the intellectual property rights, data, content graphs and analysis. This article may not be quoted, reproduced, distributed or published for any commercial purpose without prior consent. Members of the press and others using the findings in this article for non-commercial purposes are welcome to publicly share and link to report information with attribution to Ookla.

| May 17, 2021

World Telecom Day Is a Reminder that a Better, Faster and More Accessible Internet Is Possible


For the past year and counting, the COVID-19 pandemic has ravaged communities across the world and exposed how important access to reliable, fast internet has become. As people quarantined and started working and educating children from home, internet service providers across the globe rushed to meet unprecedented demands and have (mostly) risen to the challenge.

I’m honored that Ookla® has been able to collaborate with providers, regulators and researchers to help create a better, faster and more accessible internet for everyone. These partnerships are a significant part of what makes my job so exciting. That’s why for World Telecom Day 2021 I want to take a moment to highlight a few of these collaborations and how they are doing their part to accelerate digital transformation during these trying times.

Global internet providers rose to meet the global demand for internet at the start of the COVID-19 pandemic

Last year, Ookla joined the World Bank’s Development Data Partnership platform as part of our Ookla for Good initiative. This partnership has been illuminating — in a study of internet performance across 18 African countries, the World Bank found that internet usage increased during times of “stay at home orders,” public and private sectors collaborated to increase access to the internet, and internet speed decreased modestly at the start of COVID-19 shutdowns, but recovered over time.

Similarly, Ookla partnered with Fundació to analyze internet performance in Catalonia, the Balearic Islands and the Autonomous Community of Valencia during the COVID-19 pandemic. Fundació found (much like the World Bank) internet speeds slowed during the first few weeks of the COVID-19 lockdowns but gradually began to increase in the months after.

Organizations are working to increase access to internet, which is still out of reach for many Americans

As more people stay at home to work, go to school, connect with loved ones and live their lives, internet access is more important than ever. But this past year has shown the painful cracks of the current state of the internet in America. Equitable access has become a universal issue, from America’s biggest cities to its rural areas where the digital divide has been proven to be wider than ever before.

Ookla’s partnerships with the Center for Data and Computing (CDAC) at the University of Chicago and Kids First Chicago have been especially important in the effort to more accurately measure broadband performance and access within urban communities. CDAC postdoctoral researcher Jamie Saxon has already utilized our Ookla Open Datasets to create interactive maps to show the urban internet divide across several major U.S. cities.

Internet access is also a huge issue in most of America’s rural communities, and Ookla has been honored to team up with House Majority Whip James E. Clyburn to map the best broadband in South Carolina, as well as which rural areas need better internet access. We’re excited to see our data being used to help shape public policy and we look forward to teaming up on further collaborations with local, state, tribal and federal governments in the future.

ITU Study Group 12 is setting international standards for telecommunications network performance

Ookla isn’t just helping improve today’s internet, we’re making sure the future of the internet is fast and accessible. James Carroll, Director of Strategic Initiatives, is representing Ookla in International Telecommunications Union’s (ITU) Study Group 12 to create international standards for performance, quality of service and quality of experience for the internet. Among many other ITU achievements, we recently worked with leading network providers, fellow vendors and regulators to craft standards for how crowdsourced network performance data can best be used for innovative policymaking to ultimately improve consumer experiences with fixed and mobile networks.

Internet speeds will keep getting faster and Ookla will continue providing world class testing and resources

It’s almost unbelievable that when we started Ookla over 15 years ago the typical fixed broadband connection in the U.S. averaged a median download speed of only 4 Mbps — 45.7 times slower than today (182.69 Mbps). I’m extremely proud of how Ookla has helped to make a better, faster and more accessible internet for all. Just imagine what we can do together over the next 15 years. It’s going to take a lot of hard work and transformational thinking, but we’re ready for the challenge. I’m excited by the partnerships and opportunities to come – and look forward to creating even more positive change through better connectivity for people around the world.

Ookla retains ownership of this article including all of the intellectual property rights, data, content graphs and analysis. This article may not be quoted, reproduced, distributed or published for any commercial purpose without prior consent. Members of the press and others using the findings in this article for non-commercial purposes are welcome to publicly share and link to report information with attribution to Ookla.

| January 17, 2024

Enhancing Disaster Recovery and Network Resilience: Insights and Best Practices

Ookla® recently hosted a webinar titled “Disaster Recovery: Restoring Connectivity and Ensuring Network Resiliency, a discussion on network preparedness in the face of disasters.” The discussion focused on how networks can prepare for disasters. A panel of industry experts from the GSMA, OECD, and The World Bank shared examples of real-world disaster recovery efforts. Below, we have summarized the key takeaways from the discussion.

Impact of Disasters on Networks

Pooja Rana from Ookla provided an example of how networks were affected during a disaster and how operators can facilitate a faster recovery. Specifically, she shared insight into the Maui wildfire that began in the city of Lahaina, located in Maui County, Hawaii, on August 8th, 2023. More information can be found here.

Graphic of threat scenarios that are abundant and increasing - Natural Disaster, Technological & Industrial Disasters, Human Made Disasters, Humanitarian Crises, Health Emergencies, Climate Change

Natural disasters can strike anywhere and are just one example of the potential threats affecting society. Other threats include technological and industrial disasters, human-made ones, humanitarian crises, health emergencies, and climate change. In areas like Maui, where the impact of climate change is particularly felt, additional natural disasters can significantly affect critical mobile networks, making disaster relief planning and management especially challenging. Crowdsourced data, such as that provided by Ookla, can be invaluable in disaster management, helping communities to move towards proactive prevention and preparedness rather than reactive responses. This data can also aid in disaster risk management and increase the effectiveness of relief efforts. 

Network Resilience Prioritization

Inmaculada Cava-Ferreruela from the OECD (Organisation for Economic Co-operation and Development) discussed the topic of network resilience from the perspective of policymaking. Network resilience is high on the agenda of OECD countries. This is because communications networks underpin our digital economies and societies. Therefore, when these networks become unstable or fail, the consequences for businesses, citizens, and governments can be severe, depending on the extent of the disruption. While implementing these measures is the responsibility of network operators, the critical nature of communications services in our economies and societies leads governments to intervene to ensure that networks are resilient enough. In this context, the OECD is preparing a new report to help policymakers assess network resilience and develop policies and practices that promote its improvement. Following the OECD’s evidence-based policy-making approach, the report will bring together information on the definition of network resilience and its metrics, its implementation, including technical and organizational measures, and insights into policy initiatives to improve it.

Role of mobile in humanitarian response

Bryce Hartley from the GSMA discussed the role of the Humanitarian Connectivity Charter (HCC) in engaging the mobile industry for humanitarian responses, particularly in rapid-onset disasters. The three key principles of the HCC are coordination, scale, and partnerships. 

  • Coordination: The focus is on coordinating efforts across all phases of disaster management—preparedness, response, and recovery. The aim is to create awareness among stakeholders, including multilateral, governments, and private sector players, about available resources and needs to avoid duplication of efforts and leveraging resources collaboratively. Bryce provided an example of coordinating efforts in response to earthquakes in Turkey and Syria, where critical supplies were efficiently provided to restore mobile networks.
  • Scale: The emphasis is on deploying mobile technology to scale disaster resilience efforts. Standardizing response processes ensures a more predictable and effective response for responders and affected populations. The idea is to streamline efforts and create a more robust and scalable system. 
  • Partnerships: The goal is to foster collaboration to achieve programmatic initiatives. Working together is seen as essential for successful outcomes. An example is the collaboration with the Digicel Group and the Civil Protection Agency of Haiti to develop a mobile-enabled early warning system.

Critical role of Internet connectivity

Sahiti Sarva from the Data Lab at the World Bank emphasized the role of internet connectivity and data associated with it in measuring the impact of and recovery from disasters. Internet infrastructure is critical in enabling citizens to access economic opportunities and relief during disasters. The loss of the internet has significant cascading impacts on access to aid and inhibits economic activity that uses the Internet (such as activity on social media). Therefore, international development organizations such as the World Bank have started using it in their analysis to observe economic recovery from disasters. For the Türkiye earthquake impact analysis, the Data Lab team used Meta Business Activity Trends and Ookla Speedtest connectivity data to observe economic recovery trends. In this case, the availability of the internet informs the Business Activity of Facebook, making the two indicators valuable when insights are combined. 

The Data Lab created a “Data Good,” comprising reproducible methods, code documentation, and insights to inform analyses like economic recovery from disasters. Unlike traditional reports or data analyses that provide single-use visualizations, data goods are designed for reuse in future projects. If new data sets become available, they can easily be added to the analysis to generate updated insights. This is particularly useful in disaster projects where new data comes in daily, and the situation on the ground changes fast. For instance, in the case of Turkey and Syria, the Data Lab was able to update their insights every week, thanks to weekly data made available from their partners like Ookla.

Data visualization for effective disaster response 

The Disaster Connectivity Maps (DCM) initiative involves collaboration between the GSMA, UN agencies (ITU and WFP), and Ookla. DCM is a tool used to identify communication gaps during disasters, aiding first responders in preparing and adapting their communication strategies. Insights from time series data help organizations learn from past crises, adapt for future preparedness, and incorporate lessons for more effective response efforts.

We asked the panel audience about the role of mobile in disaster resilience, and the word cloud answer highlighted the key roles of coordination, communication, emergency services, and backup plans.

During the discussion, the participants stressed that collaboration, preparedness, and data utilization are crucial to enhance disaster relief efforts and ensure network resilience. Policymakers, industry experts, and international organizations play vital roles in developing evidence-based policies to address the complexities of disasters. Ookla is committed to working with the broader mobile ecosystem to ensure that these objectives are achieved.

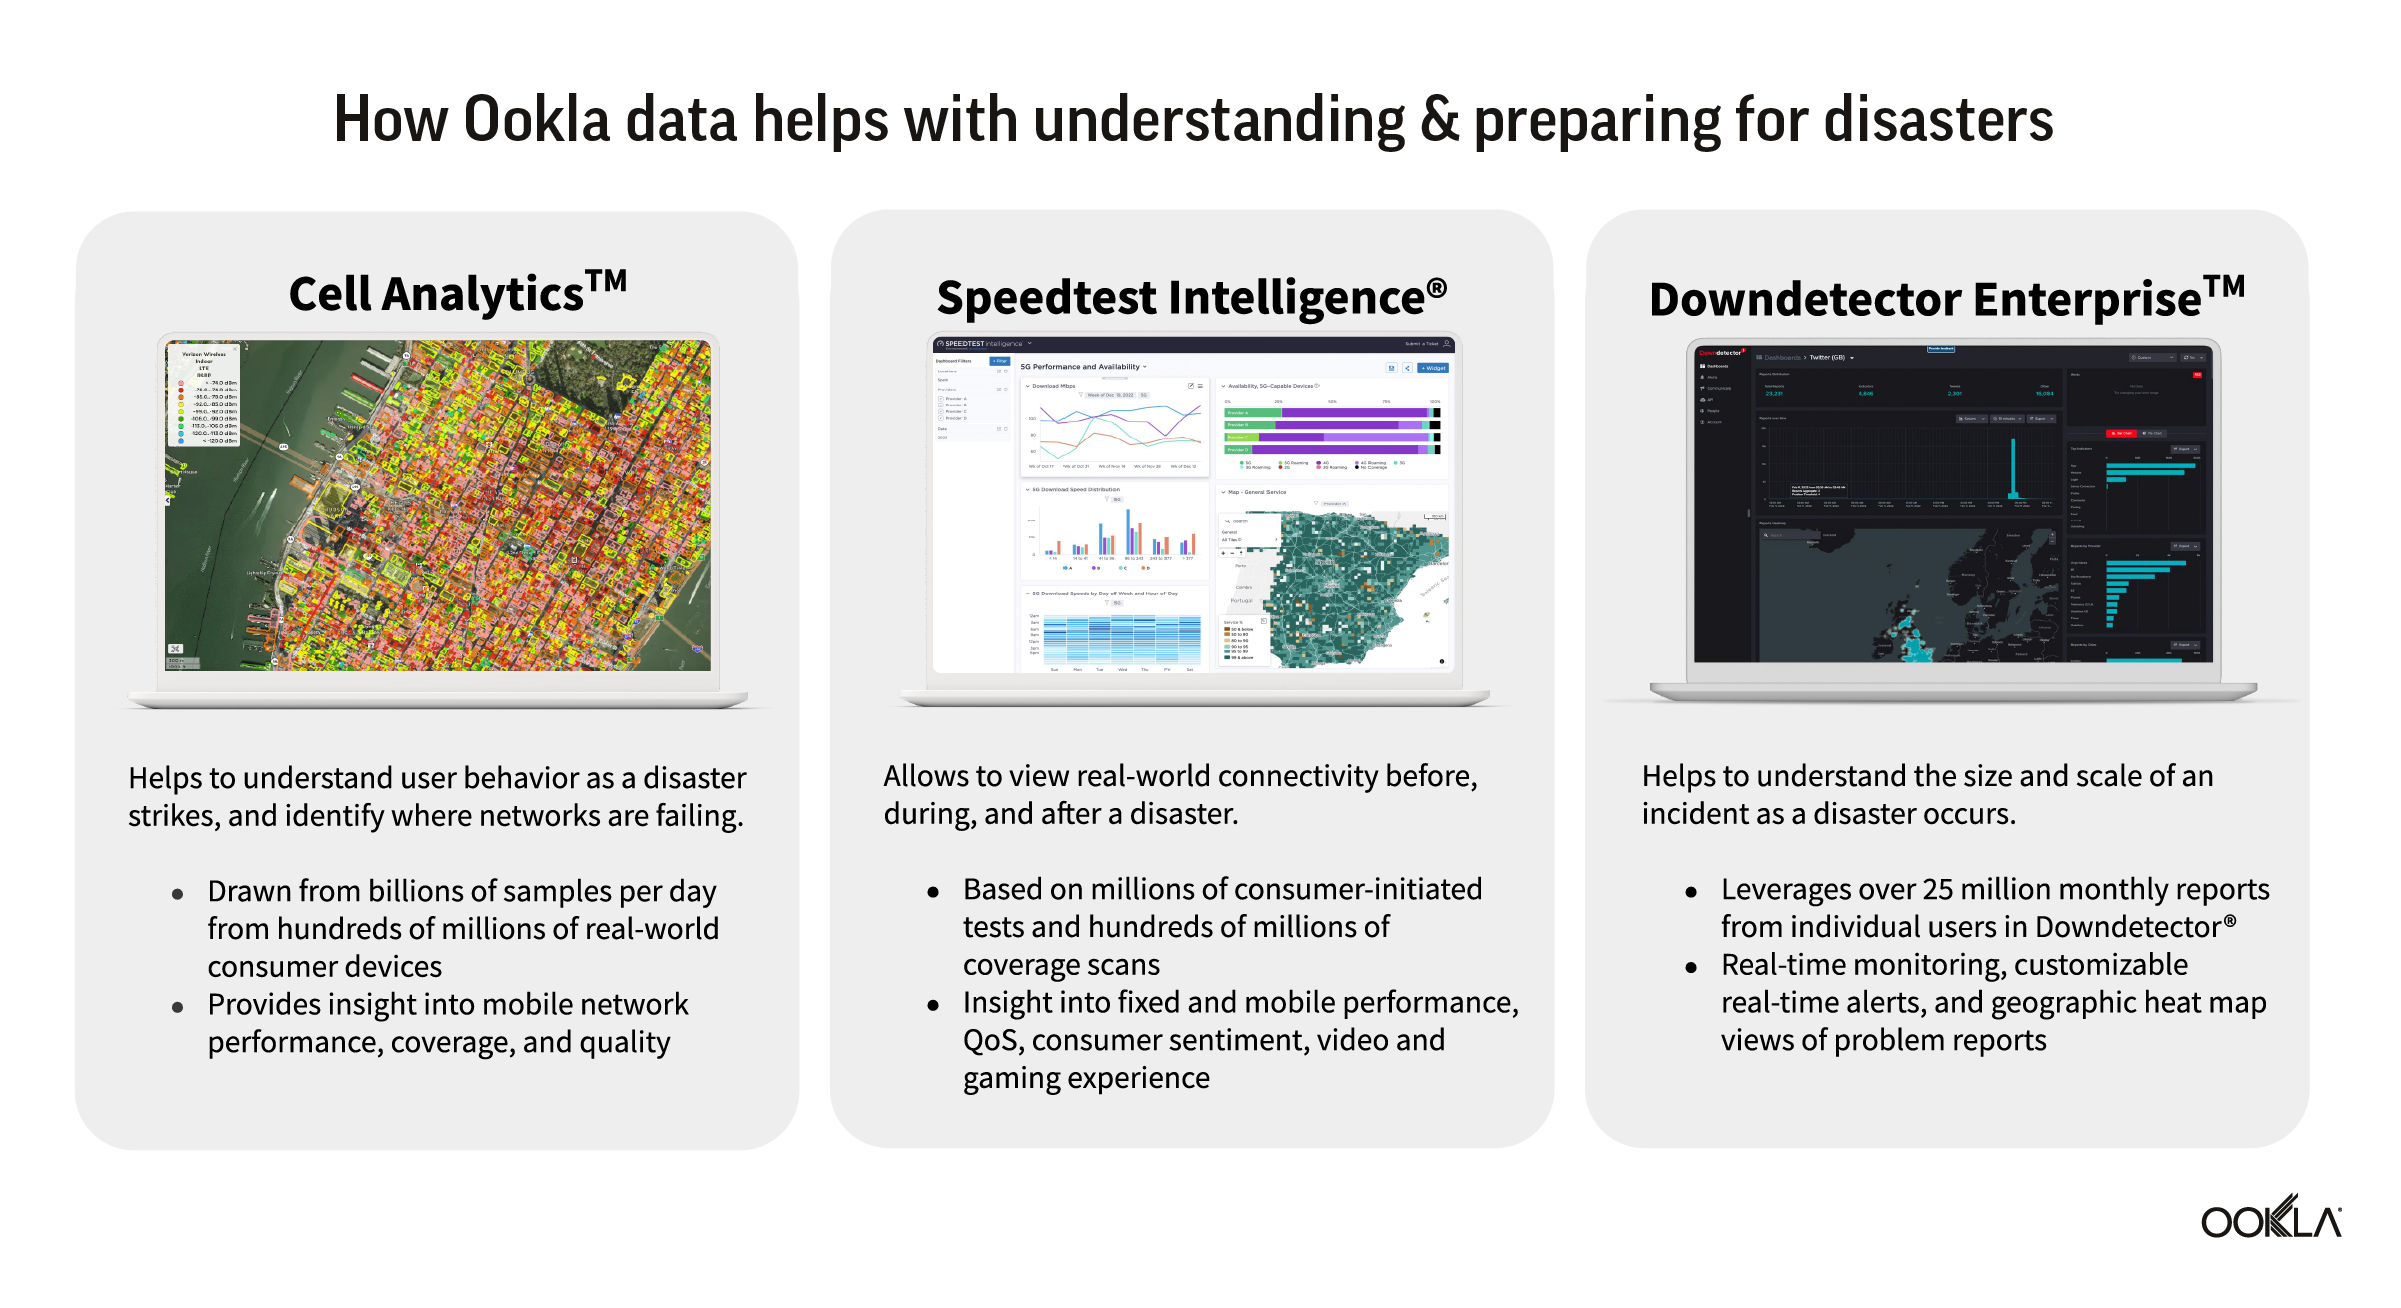
List of how Ookla data helps with understanding and preparing for disasters using Cell Analytics, Speedtest Intelligence, and Downdetector Enterprise.

Additional resources:

See the full webinar recording here.

Ookla retains ownership of this article including all of the intellectual property rights, data, content graphs and analysis. This article may not be quoted, reproduced, distributed or published for any commercial purpose without prior consent. Members of the press and others using the findings in this article for non-commercial purposes are welcome to publicly share and link to report information with attribution to Ookla.

| May 13, 2020

Indoor Coverage is a Public Safety Priority

Connecting people with emergency services reached a pinnacle of simplicity when 911 was rolled out as an emergency number across the United States. With one number, people in distress could get the help they needed dispatched as soon as possible. As increasing numbers of households have cut the cord on their traditional landline telephones, 80% of 911 calls are now placed via cell phone. Emergency calls need to connect 100% of the time, which makes mobile coverage, first and foremost, a public safety issue.

Understanding which buildings fall short of providing adequate service can assist local governments in working with building owners and mobile operators to make needed improvements. This falls into two broad categories: First Responder Push to Talk systems, and Commercial Mobile Services used by both Public Safety Agencies and the general public.

Poor indoor coverage impacts public safety

If someone is in distress and unable to place an outgoing call, first responders will not be aware there is an emergency that requires their response. For this reason, the Safer Buildings Coalition defines three pillars of in-building safety communications:

  • Mobile 911 Calls Must Get Out with Location Accuracy
  • Mobile Mass Notifications Must Get In
  • First Responder Communications Must Work

If a building cannot deliver these basic characteristics, the environment puts the occupants and the property itself at risk.

Determining a precise location can be a significant challenge if the device does not have an unobstructed view of the sky. As more GPS satellites can “see” the device, the more accurate the location the system can provide. Work is underway by industry leaders and public safety agencies to improve indoor location, but since it is a complex issue unto itself, this article will focus solely on indoor wireless network coverage.

Why indoor coverage is challenging

Anyone who’s ever tried to place a call from an elevator is not surprised that indoor coverage can be much worse than outdoor coverage. And the deeper into a building you go, the worse the signal typically gets. Penetrating walls is difficult for a cellular signal, though some of the spectrum blocks that mobile companies have licenced are better for this task than others. Low band (longer wavelengths) spectrum tends to be much better at penetrating concrete and brick than high band (shorter wavelength) spectrum.

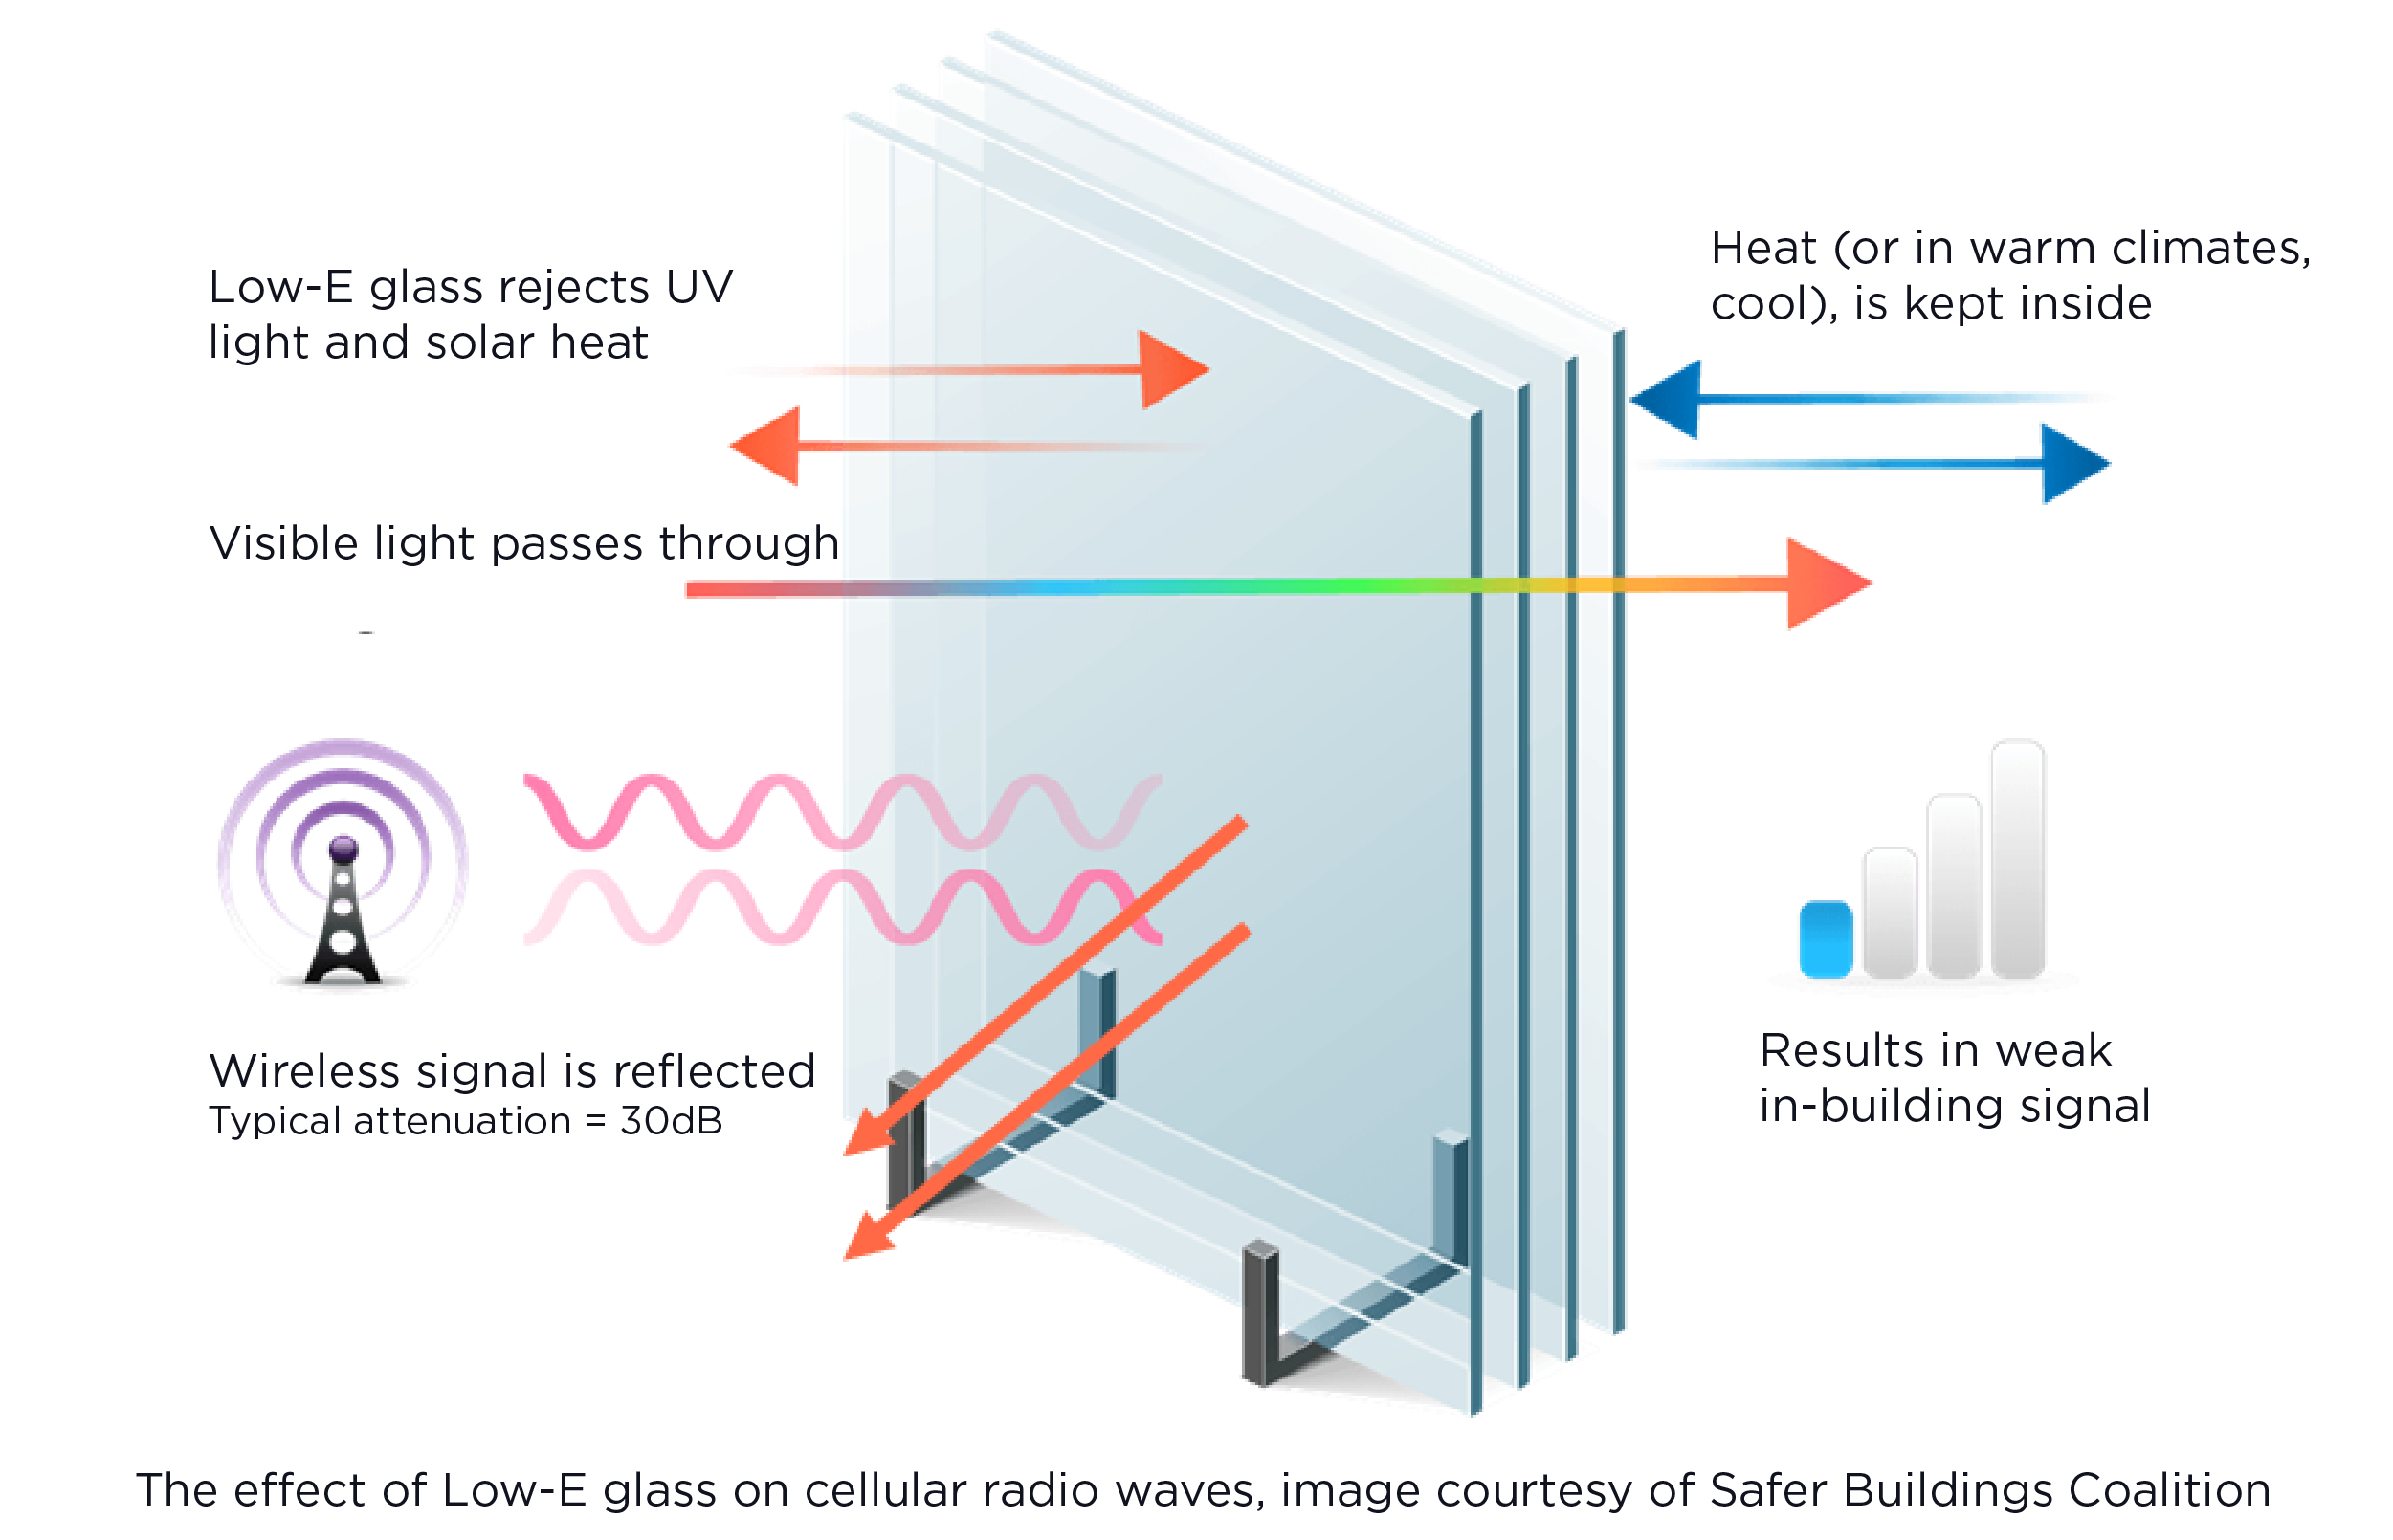
Low-e glass can inhibit signals

Another factor in poor indoor signal strength is often windows. The introduction of low-e glass has provided huge energy savings for building owners and is positive for the environment. However, the unintended effect is a negative impact on wireless communications.
SBC-Low-E-Glass_Illustration-1

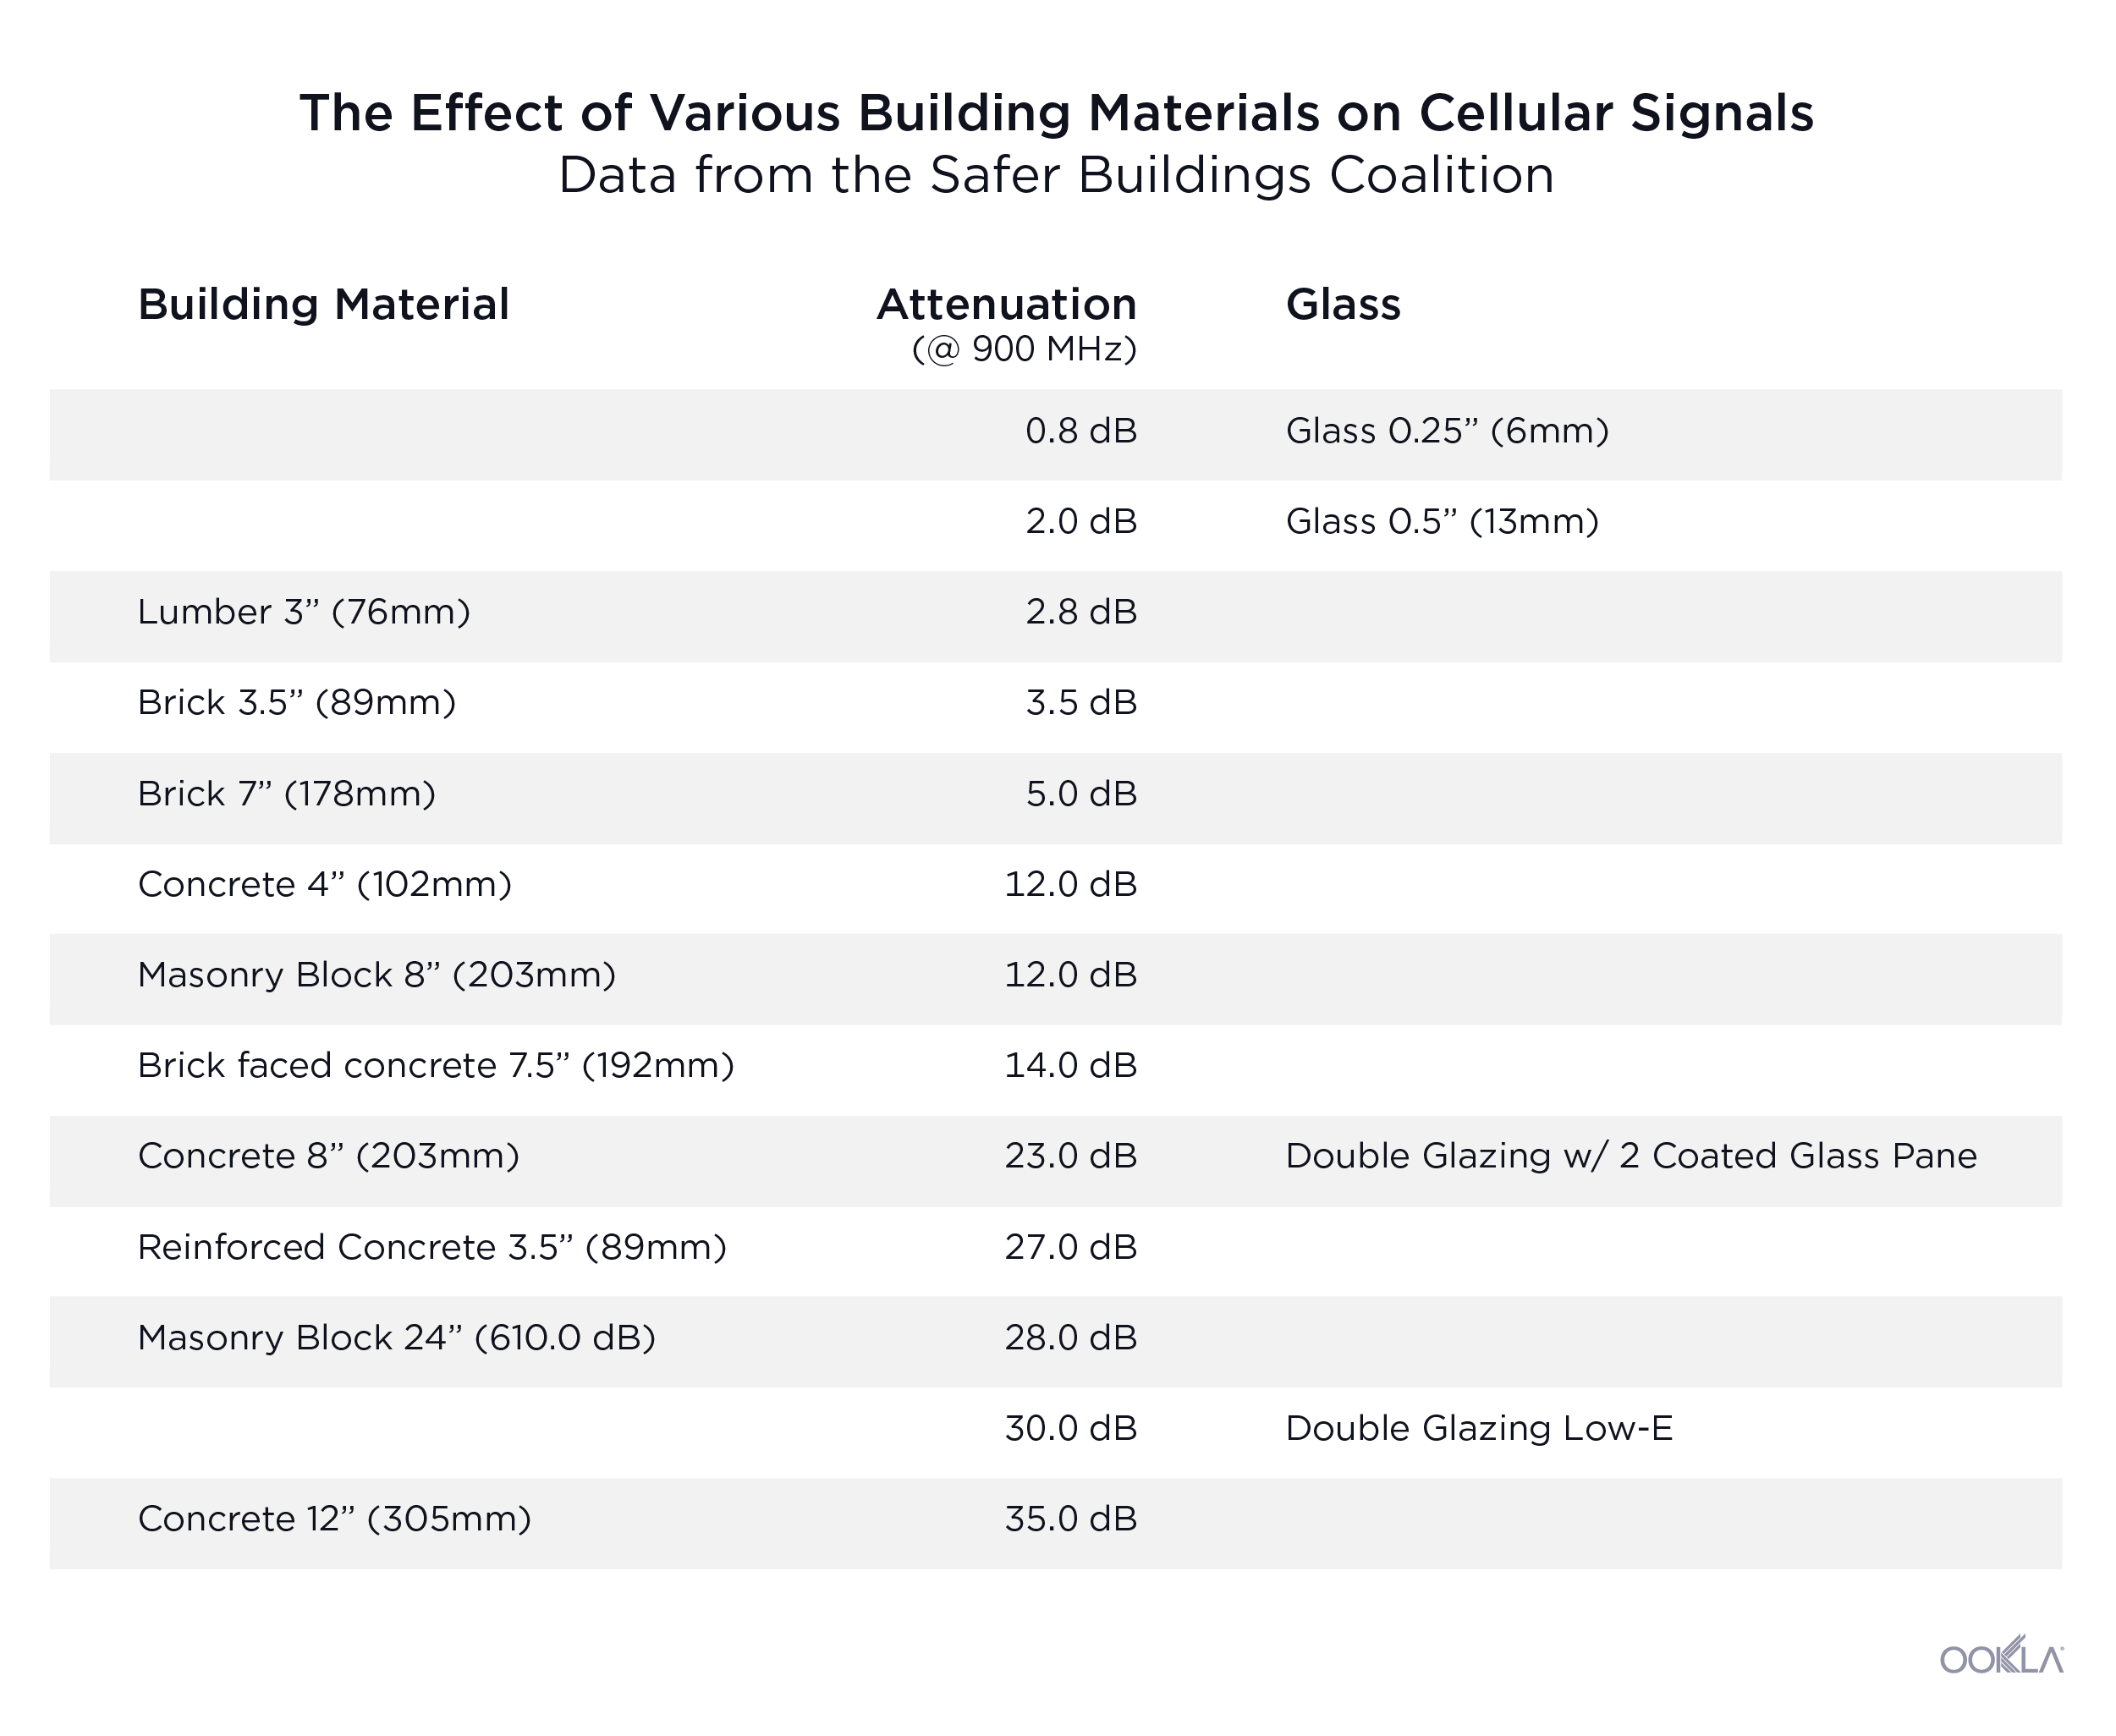
How glass compares to other building materials in shielding the interior from wireless signals depends upon the type of glass. The chart below offers some surprising comparisons. The attenuation column represents the reduction in the amplitude of the signal. For this example we use 900 MHz, a common low-band spectrum used throughout most of the world and considered to be better at building penetration than higher band frequencies.
building_material_effect_cellular_signals_0520

The more energy efficient the glass, the more the signal level is reduced. Consider that for each 3 dB attenuation (loss), the signal strength is reduced by half. A 6 dB attenuation means a 75% loss in signal; at 9 dB, an 87.5% loss. As this reduction is exponential, the double glazing low-e glass, near the bottom of the chart, represents a signal reduction of 99.9%.

It’s not uncommon to see someone who is struggling to maintain a call walk toward the window in an attempt to improve their reception. If a building has installed energy efficient glass, most of the available signal may well be coming through the walls. If this person is trying to connect to emergency services, the results could be tragic.

How first responders get coverage

After an initial investment by the federal government, billions of dollars are currently being spent by AT&T to build the new FirstNet network, bringing prioritized broadband telecommunications to the nation’s first responders. State and local governments are also investing to upgrade equipment. This new network is using a dedicated spectrum band (Band 14, also known as the Upper 700 MHz D-block) and also provides prioritized access to the AT&T commercial bands as needed during an emergency.

With fewer users compared to a commercial network, the FirstNet network will experience less congestion and, therefore, a higher signal quality than those serving hundreds of millions of users and devices.

With the addition of High-Power User Equipment (HPUE) Power Class 1, the FirstNet devices can transmit on Band 14 at up 31 dBm. This is a significant increase from the standard 23 dBm (Power Class 3). This can improve FirstNet coverage in fringe areas by up to 80%. Specifically, the ability for the cell site to better “hear” the user equipment can be the difference between a dropped or completed VoLTE call, delivered text message, or the transfer of mission critical data.

While FirstNet is being built into the robust system that has been promised, first responders still use their proprietary Land Mobile Radio (LMR) networks as their primary means of voice communication. Portable cell sites are also available in some circumstances to supplement wireless coverage where needed.

What’s being done to help the public

A significant federal effort has been underway during the past decade to improve wireless coverage in rural areas, but poor wireless coverage can be experienced in big cities as well. The wireless networks were originally designed to work well in a “mobile” environment – namely outdoors while in moving vehicles or walking. As indoor usage has grown, the networks have densified and greater efforts have been made to provide a signal strong enough to penetrate buildings.

Most single-family residential structures will typically be made from materials such as lumber and brick which the chart above shows as contributing to a minimal loss of signal. Buildings with a greater population density, such as multi-family residential and high-rise commercial structures, will typically employ thicker construction material in order to achieve the strength required to bear the weight of multiple floors.

Even where signal strength is strong, high demand on the network can impact user experience. These larger buildings mean more network users per square meter and that, in turn, creates added strain on signal quality. Wrap that building in eco-friendly low-e glass and poor wireless service shouldn’t be a surprise.
outside_signal_strength_philadelphia
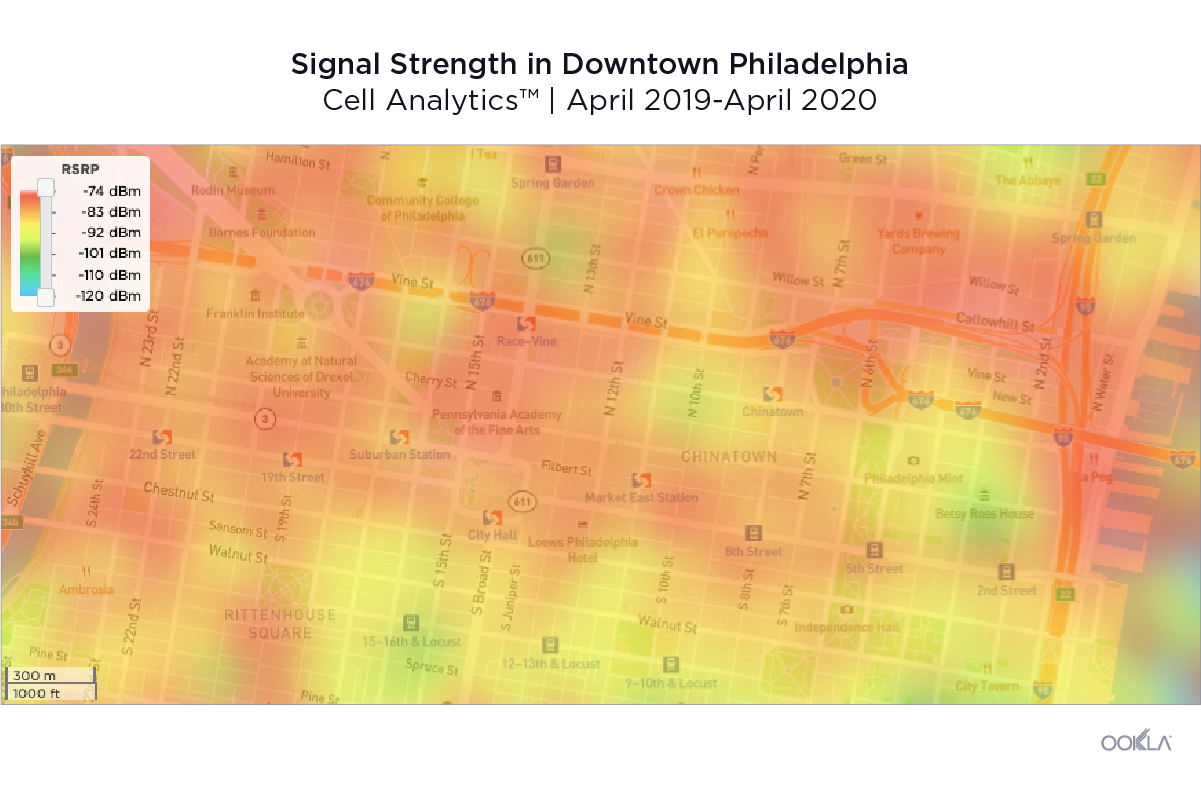
The above image from Ookla’s Cell AnalyticsTM portal depicts a gradient heatmap of the outdoor signal strength provided by the Verizon Wireless network in downtown Philadelphia. The crowdsourced readings are averaged over the past twelve months. Red and orange represent a very high signal strength, whereas green to blue represent a lower signal strength. It is clear that Verizon has made significant investments in their Philadelphia network.
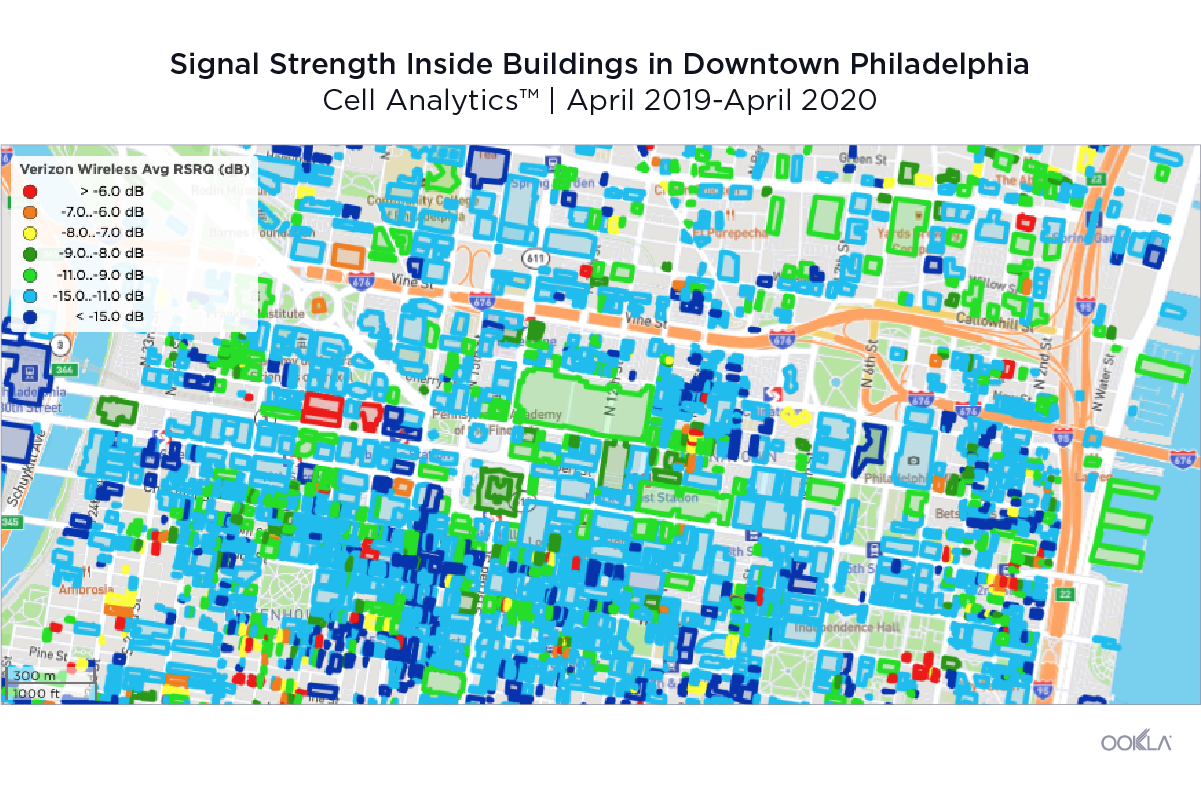
Providing high quality indoor coverage is much more difficult. Over the same twelve-month period, using Cell Analytics Pro building layers, we can view the same area in downtown Philadelphia with each building outlined in a color representing the average signal quality from readings captured inside each structure. It is clear that many buildings show an average signal quality rated as poor. Every mobile operator experiences these difficulties.
inside_signal_strength_philadelphia

How we can solve this public safety dilemma

Understanding which buildings fall short of providing adequate service can assist local governments in working with building owners and mobile operators to make needed improvements. This falls into two broad categories: First Responder Push to Talk systems and Commercial Mobile Services used by both Public Safety Agencies and the general public.

The solutions used today for First Responder Push to Talk systems are Distributed Antenna Systems (DAS) and signal boosters. For commercial mobile services, DAS, Booster Systems and Small Cells can be deployed based on individual use case. CBRS is a future Private LTE offering that is currently being developed and deployed in the United States.

Distributed Antenna Systems (DAS)

There have been solutions on the market for many years now, but the economic viability varies depending upon the use case. A DAS effectively deploys a miniature cellular network throughout a structure. DAS are very effective and have been deployed in large buildings, arenas and stadiums, but they are not appropriate for smaller buildings.

Signal boosters

Many companies make boosters that can capture outdoor signals from a nearby tower site then route them to repeaters inside of a building. This can solve a problem with signal strength and is more common for Public Safety LMR than cellular. This solution tends to be less expensive than installing a DAS network. However, if there is a need for higher capacity, a signal booster can actually exacerbate an issue by routing additional traffic to a cell site that may already be overloaded.
Small cells

Small cells are much in the news. Those being mounted to streetlights and other municipal structures are meant primarily to increase outdoor coverage at the ground level. This is particularly true with the new millimeter wave spectrum (extremely high frequencies) being used for some 5G deployments. These deployments will greatly improve coverage and quality on sidewalks and in vehicles, but mmWave is not designed to penetrate buildings.

Small cells can also be installed indoors, greatly improving floor by floor coverage in taller buildings. Using high-band (mmWave) spectrum also means that the high efficiency windows can block signals from escaping, lessening the chance that a small cell within one building would leak signal that could interfere with a different system in a neighboring building.

CBRS

The recently approved CBRS (Citizens Broadband Radio Service) technology promises to bring private LTE service to commercial buildings. Instead of depending upon the national wireless operators to provide a strong indoor coverage, an enterprise can deploy a solution to meet their specific needs, much like they have done with Wi-Fi.

So, what do most of the solutions above have in common? They are often deployed by the building owners, managers or commercial tenants. Although we will certainly see the mobile operators deploy solutions where the ROI justifies the cost, it will be up to the organizations that use wireless services every day in their businesses to underwrite the expense. The game-changer with CBRS is that a significant portion of the spectrum is unlicensed, therefore, coordination with a wireless operator is not required.

The game-changer with CBRS is that building owners have an opportunity to own and control the spectrum inside their own buildings, giving them more control over the quality delivered to their tenants and visitors. They will also have more visibility into call patterns and other data usually available only to the wireless carriers.

Building codes need to change

If the goal is to improve safety by ensuring the callers can reach 911 in an emergency and that first responders can maintain adequate coverage when being called to an emergency, then building codes must reflect this need. Sprinkler systems were initially installed to protect property from damage. The first fire code for sprinkler systems was written in 1896. As statistics began to show the death rate in buildings with these systems were dramatically lower, they became required in new construction. The requirement to retrofit existing buildings with sprinkler systems varied greatly from city to city and state to state.

As the cost to deploy indoor coverage technology declines, public safety officials within each local government should be considering how to implement code changes that will improve access to emergency communications. This process will take many years, so it is important to have empirical data to help prioritize which structures are most at risk. This may be a national issue, but it will be solved at the local level, one building at a time.
My thanks to John Foley at Safer Buildings Coalition for his assistance on this article.

Ookla retains ownership of this article including all of the intellectual property rights, data, content graphs and analysis. This article may not be quoted, reproduced, distributed or published for any commercial purpose without prior consent. Members of the press and others using the findings in this article for non-commercial purposes are welcome to publicly share and link to report information with attribution to Ookla.

| June 6, 2022

How the University of Chicago Data Science Institute is Using Speedtest® Data

The recent Inaugural Data Science Institute Summit at the University of Chicago brought experts together to discuss topics in data science research, education, and outreach, including digital inequities across the United States. Ookla® was honored to attend and see how Speedtest® data is being used by the Data Science Institute (DSI) at the University of Chicago through our Ookla For Good™ initiative to help identify digital inequities.

Ookla data is helping to identify internet inequities

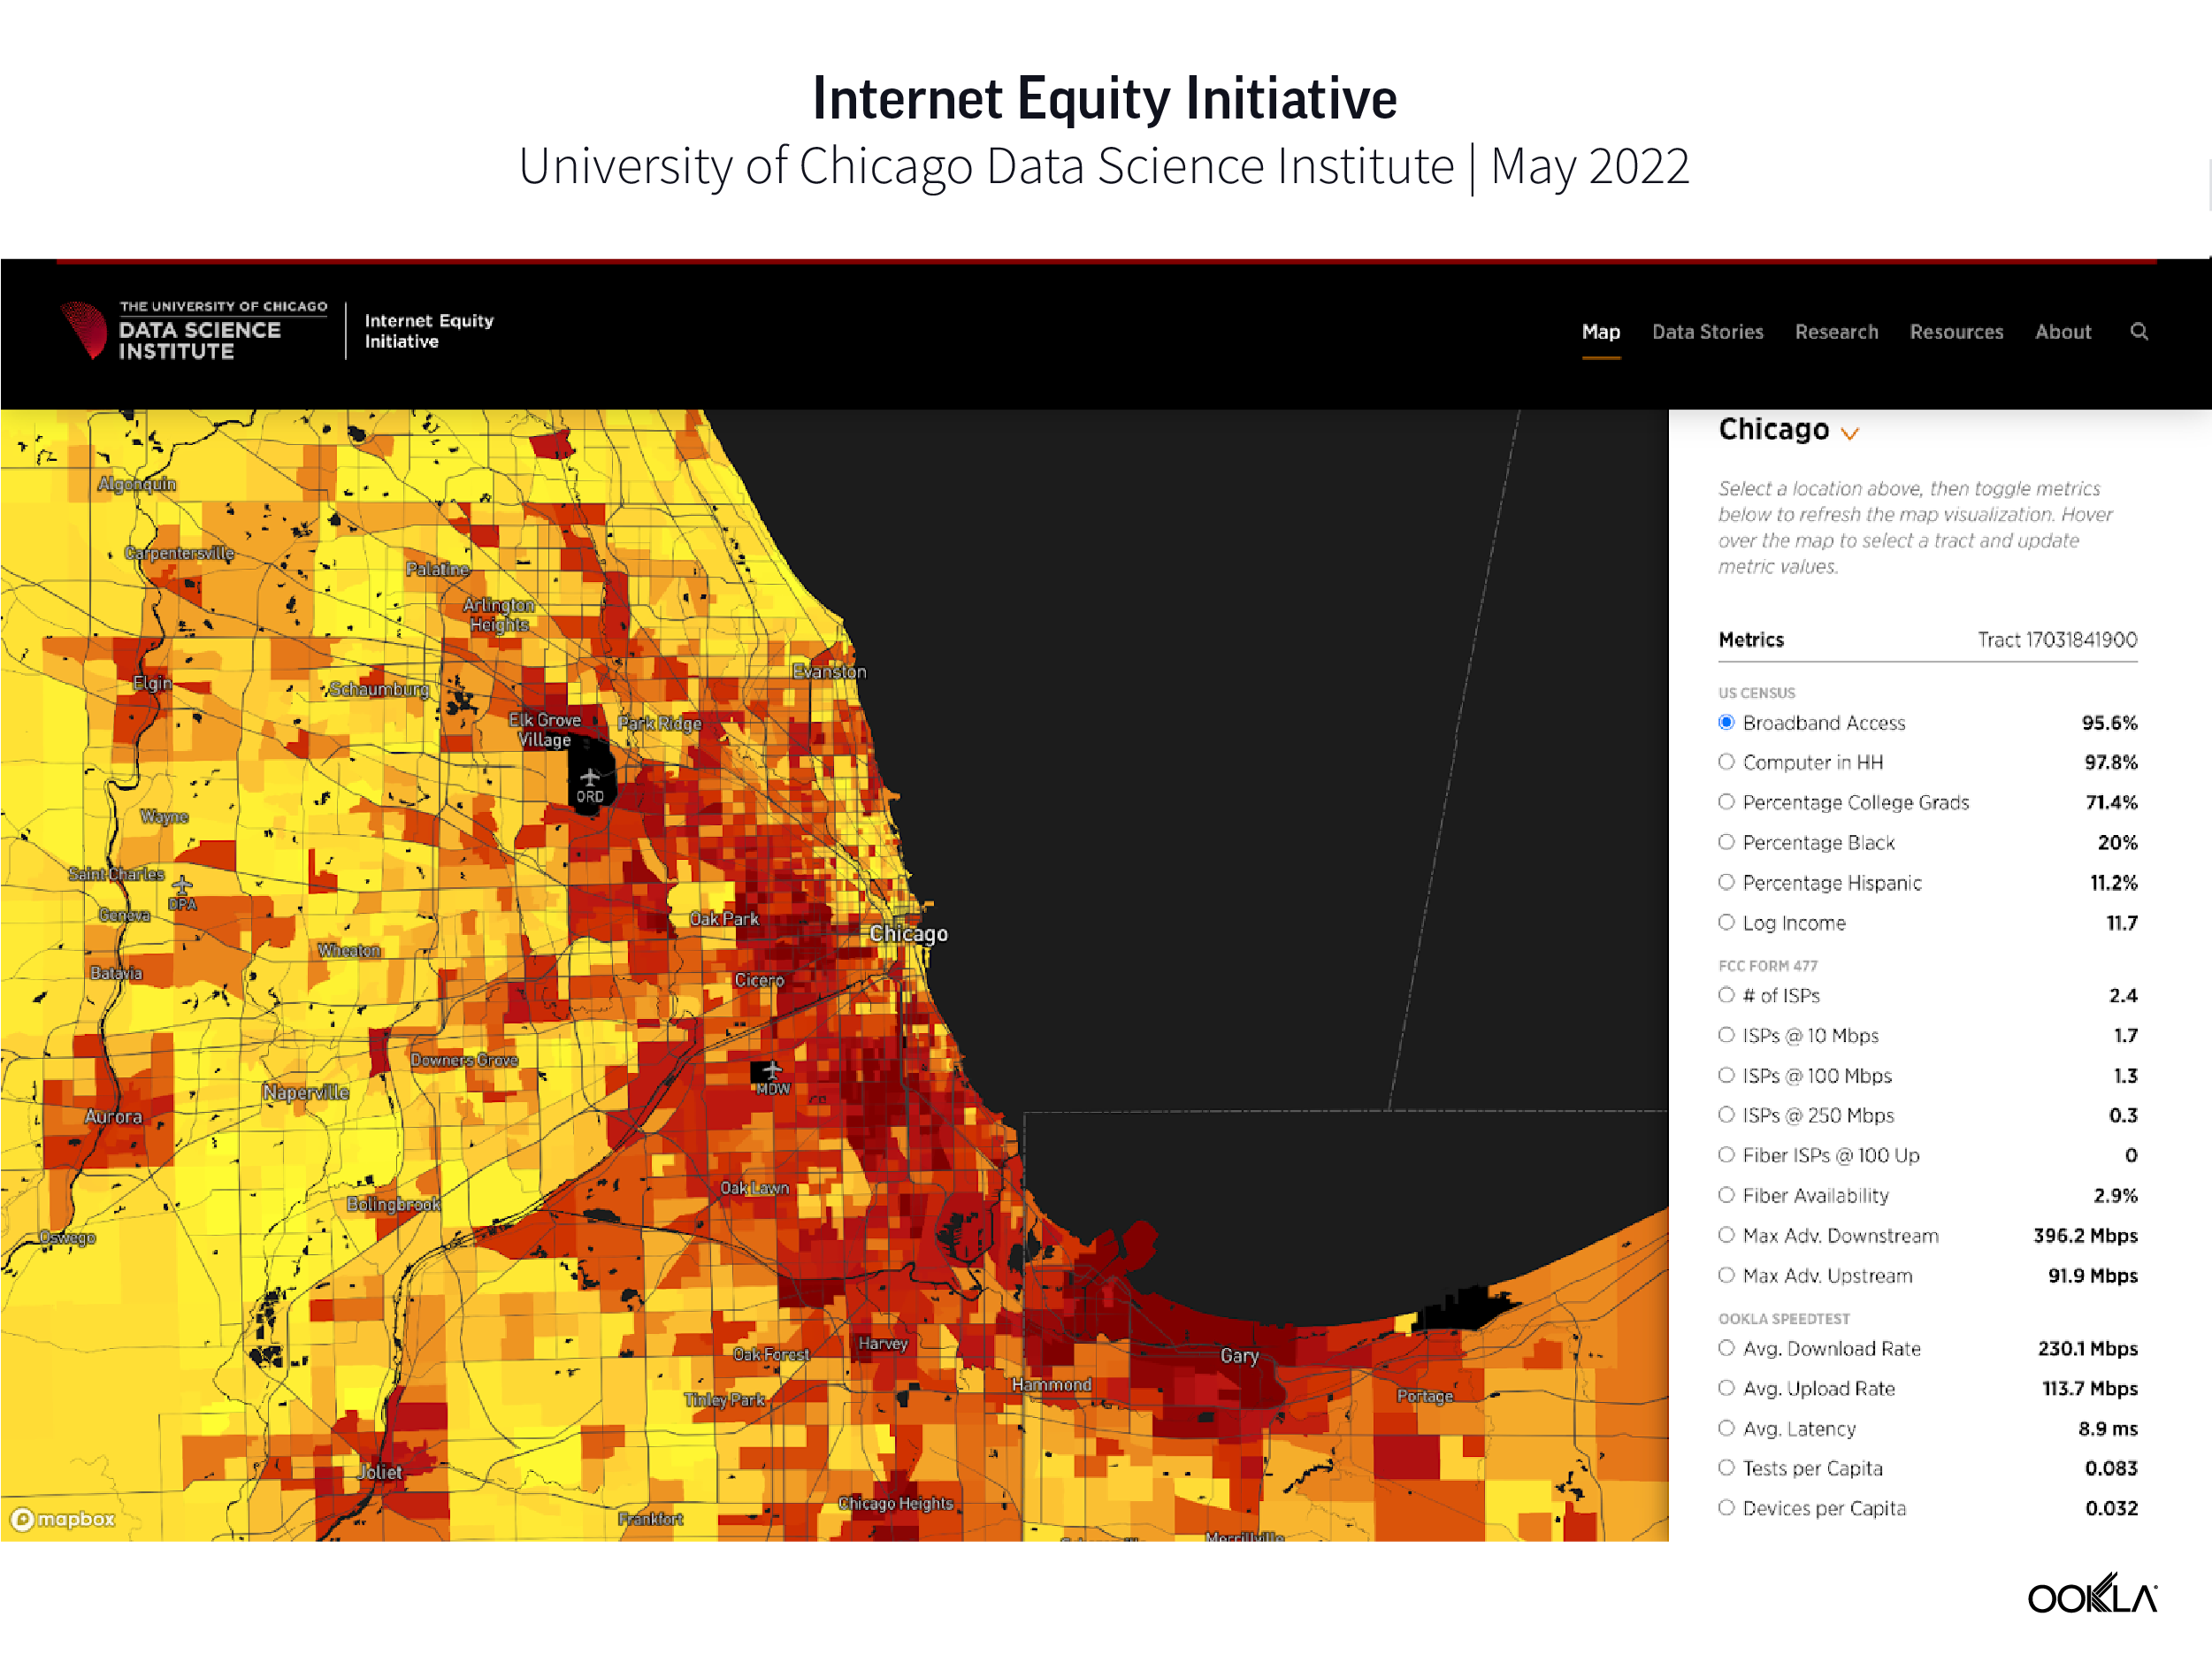
During the summit, DSI Director of Research Nick Feamster announced the launch of the new Internet Equity Initiative data portal, which uses Speedtest data along with other data sets to map out internet inequities across U.S. Census tracts. This important work shows the disparity of internet access and performance, as well as a variety of different demographic measures, including race, wealth, and education by Census tract. 

You can explore that map here and see how internet connectivity ranks in your community, as well as discovering average internet performance and latency using Speedtest open data.

The initiative has also deployed Internet measurement devices in over 100 households across Chicago, with a particular focus on measuring disparities in Internet performance and reliability between low-income and high-income neighborhoods. The initiative’s measurement devices collect a variety of performance and reliability measurements and use Speedtest to measure a connection’s download and upload speeds continuously over time. You can read more about the data they collect and download their data for free here.

More ways DSI is using Speedtest data

In addition to the Internet Equity Initiative map, researchers at DSI are using Ookla data to create data stories and research studies to understand the digital inequities many people face in the U.S. Here are a few recent publications:

  • A Tale of Two Gigs explores internet performance in two households in two different neighborhoods in close proximity to show that even among the same ISPs, internet speeds and access can vary by a wide margin. 

We’re excited about what our partnership with DSI holds for the future, because we know it exposes great work toward creating a better, faster, and more accessible internet for all. Want to learn more about Ookla For Good? Please reach out here.

Ookla retains ownership of this article including all of the intellectual property rights, data, content graphs and analysis. This article may not be quoted, reproduced, distributed or published for any commercial purpose without prior consent. Members of the press and others using the findings in this article for non-commercial purposes are welcome to publicly share and link to report information with attribution to Ookla.

| June 24, 2020

Ookla Partners with House Majority Whip Clyburn on Broadband Maps for South Carolina

Yesterday, United States House Majority Whip James E. Clyburn showcased South Carolina’s innovative and entrepreneurial approach to broadband mapping. This new approach utilizes advanced data science to analyze FCC Form 477 and Ookla® Speedtest® data together to produce exceptionally accurate maps that show the best available broadband technology in a given area, as well as which areas are in need of better service. Once rendered, these maps – representing all 46 counties in South Carolina – are made available for free to all who are interested via the nation’s first broadband map store.

Congressman Clyburn was joined by Jim Stritzinger, President, CEO & Founder, Revolution D, Inc.; Doug Suttles, CEO, GM and Co-Founder, Ookla; Molly Spearman, South Carolina Superintendent of Education; Kathy Schwarting, CEO, Palmetto Care Connections and Jason Dandridge, CEO, Palmetto Rural Cooperative on the announcement via conference call. They discussed challenges in education, healthcare and economic development due to the digital divide in South Carolina, while also providing an introduction to broadband maps and methodologies used by telephone companies, ISPs and localities to better compete for broadband infrastructure funding. Watch the video.

Ookla is passionate about improving internet access and performance

Ookla is aware of the challenges and disparities many face in accessing fast and reliable internet. We’ve been listening and learning as we work to find ways to use our data to spotlight disparities and opportunities for improvement.

We’ve learned that countries need funding and legislation at the federal level to improve data collection and broadband mapping efforts. This information helps governments more accurately understand where people are falling on the wrong side of the digital divide. It’s also important to work with and learn from leaders and providers within local and regional communities who understand the specific challenges and opportunities in a given area.

How this project came about

We were thrilled to be invited by Congressman Clyburn’s team to join an early 2019 brainstorming session on how to close South Carolina’s broadband divide. As the brainstorming session began, Congressman Clyburn and his team challenged us to develop a new approach to mapping that would use real-world network performance data, rather than relying solely on self-reported network speeds advertised by internet service providers. Further, he asked us to get it done in 18 months. We were more than happy to oblige.

During that initial call, we were introduced to Jim Stritzinger, the person leading broadband efforts in South Carolina. As the Founder and CEO of Revolution D, Stritzinger proposed a new approach to broadband mapping based on his background as an electrical engineer with extensive experience in software development, artificial intelligence (AI) and geographic information systems (GIS). This novel approach determined the best deployed technology in each census block (fiber, cable, DSL etc.) and then built a model which could calculate, with a high degree of confidence, the likely available download and upload speeds. Ookla’s role was to help ensure the integrity of the model by comparing calculated values with actual consumers’ network performance results as seen in Ookla’s Speedtest Intelligence®.

This working hypothesis got everyone excited, especially Congressman Clyburn. He clearly understood the national significance of overcoming the potential discrepancies between what providers report in the FCC Form 477 and was elated that we could develop a national prototype to validate network information in his home state.

Congressman Clyburn’s team, Revolution D and Ookla kicked off the project in the summer of 2019. With funding from the S.C. Hospital Association, the S.C. Office of Rural Health and Palmetto Care Connections, Revolution D spent several months developing the model together with a preliminary set of GIS maps. Separately, the Ookla data science team packaged up nearly 7 million data records for the first iteration. Ookla delivered this first dataset in mid-August and the broader team delivered the first comprehensive set of S.C. broadband maps – all 46 counties – on August 31, 2019.

This project has been a huge success, and Congressman Clyburn frequently proclaims “South Carolina has the best broadband maps in the United States!”

Announcing Ookla for Good™

Our work within South Carolina quickly became part of an existing internal initiative to further explore how we could help Ookla achieve its mission: “To help make the internet better, faster and more accessible for everyone.” Through conversations with city leaders, educators, healthcare providers and more, we quickly came to a realization. Our wealth of data, insights and expertise would also be of value to NGOs, research institutions, humanitarian nonprofits and local governments looking to improve lives through better and more reliable internet access.

This realization and the desire to help more led to the development of our new initiative, Ookla for Good, to formalize a program around this and other similar initiatives we’ve been working on.

At its core, Ookla for Good is about the people at Ookla wanting to help others by making the internet better, faster and more accessible to all — at a more personal, grassroots and community engagement level. Why? Because in today’s connected world, reliable internet access is vital for many aspects of life: education, healthcare, economics, safety, just to name a few. The combination of our vast trove of data from Speedtest Intelligence and the industry-leading knowledge of our team gives us the tools to help providers improve internet speeds and connectivity all over the world. It’s also important to us to listen and learn from those on the ground in state capitals, nonprofits and at universities working hard to close the digital divide. These conversations allow us to better understand how we can help, and then follow up that understanding with actionable support, whether that be through the sharing of data, industry knowledge, skills, mentoring the next generation or something else we have yet to discover.

So far, we’ve learned that by partnering up with those who passionately want to make a difference at a grassroots level, we can help them do great things.

Other in-flight initiatives

Over the past year, we’ve licensed certain datasets to assist academic institutions, NGOs and local governments that are focused on understanding where better internet quality provides a higher quality of life. These organizations include:

  • World Bank
  • Fundacio puntCAT
  • Onja
  • Brookings Institution
  • Dorset Council
  • State of South Carolina
  • And a number of universities both in the U.S. and abroad:
    • Massachusetts Institute of Technology
    • Nara Institute of Science and Technology (NAIST)
    • National Institute of Design Bengaluru
    • New York University
    • Polytechnic University of Madrid (UPM)
    • University of Illinois Chicago
    • University of North Carolina Wilmington
    • University of Tennessee Chattanooga
    • University of Texas Austin

We’ve also become actively involved within industry groups, working together to help educate, share insights and help define policies and global telecommunications standards. These include partnering with GSMA Intelligence as its exclusive network performance data provider and membership in the ITU-T.

Are you an academic exploring how internet speeds may affect economic opportunities within a state? Or a non-profit organization needing to know where high-quality internet exists to set up classrooms for your online learning? Or a local government needing to prove where internet access does not meet minimum standards in order to apply for grants to improve infrastructure for your citizens? If you are, we’d love to hear from you and explore how we may be able to help.

Ookla retains ownership of this article including all of the intellectual property rights, data, content graphs and analysis. This article may not be quoted, reproduced, distributed or published for any commercial purpose without prior consent. Members of the press and others using the findings in this article for non-commercial purposes are welcome to publicly share and link to report information with attribution to Ookla.

| November 27, 2023

Disaster Recovery: Restoring Connectivity and Ensuring Network Resiliency [Webinar]

The world has recently witnessed a surge in natural disasters, with events like the devastating wildfires in Maui serving as a reminder of the urgent need for comprehensive disaster preparedness and network resiliency. Connectivity is paramount for coordinating emergency response efforts, disseminating timely information, and facilitating the evacuation of affected areas. This article will share a recent example of how the state of Hawaii was able to quickly understand the impact that wildfires had on connectivity in Maui. 

To learn more about network recovery and resiliency, please register for our December 7 webinar, where a panel of industry experts from the GSMA, OECD, and the World Bank will come together to share examples of real-world disaster recovery efforts. 

A look at how Maui wildfires impacted connectivity on the island

The wildfires in Lahaina, Maui started on August 8, 2023. Looking at background scans across all mobile network operators for the island of Maui before the wildfires started, we can see that there are users distributed all around the island and coverage along all of the roads.

Once the wildfires started in the Lahaina area on the west side of the island, you can see most users fled Lahaina (upper left) towards central Maui (center). Increased network traffic in central Maui led to congestion that degraded the signal strength in that area.

Mobile network operators were able to focus on network resiliency and determine if they had enough capacity for all of the users fleeing to central Maui, while governments were able to evaluate where relief management was needed for users. Register for the webinar to hear more details about how Hawaii restored connectivity after the wildfires. 

When a disaster strikes, communication is essential

Connectivity acts as a lifeline during a crisis, enabling individuals to stay informed, connect with loved ones, and access crucial resources. The provision of reliable and resilient communication infrastructure is a critical component of disaster response to the unpredictable forces of nature. Government bodies, NGOs, and other humanitarian organizations are all faced with the challenge of developing disaster recovery plans — and network operators must build networks that can be repaired quickly so that people can communicate and stay connected in an emergency.

To learn more about restoring connectivity and ensuring network resiliency, join the webinar at 8 a.m. PST / 11 a.m. EST / 4 p.m. GMT on Thursday, December 7. A recording will be provided for registrants who can’t join the live presentation. Register now

Ookla retains ownership of this article including all of the intellectual property rights, data, content graphs and analysis. This article may not be quoted, reproduced, distributed or published for any commercial purpose without prior consent. Members of the press and others using the findings in this article for non-commercial purposes are welcome to publicly share and link to report information with attribution to Ookla.