You asked and we listened. Speedtest® fans who use Apple devices have long been requesting access to our Maps feature, and we are happy to report that this feature is now available for Android and iOS. So if you’ve been looking for a map of coverage that highlights which mobile providers have what level of service in the areas that matter most to you, open your Speedtest app today and check out the tab marked “Maps.”
How Speedtest Maps help you
Speedtest Maps give you access to information about where you will and will likely not have access to different levels of service in a particular area. For example:
If you’re looking to use your brand new 5G phone on an upcoming vacation, you can check the map to see if your operator had 5G service in that location.
If you consistently find yourself dropping calls in the same spot on your daily walk, you can check our map to see if others who use the same provider are experiencing the same thing in the same area. Then you can take that information to your operator to ask them to improve service in that area.
If you’re looking to change operators, you can check to see who has the kind of service you need in the locations you visit most often.
Find and use your Speedtest Map today
If you already have Speedtest on your mobile device, you now have access to Speedtest Maps for both Android and iOS for free within our existing app. If you don’t see the Maps tab in the bottom right of your screen with the map open, simply update the app. And if you don’t have the Speedtest app, download it today for Android or iOS.
Explore maps for a variety of providers
Slide the bar up to select which provider you want to see detailed information for using the slider within the Map. You can use this to compare the service you’re subscribed to with that of other operators.
Access details on the best tech type available and the most common
Use the bar at the top of the slider to choose whether you want to see the best available technology in an area or the most common. For example, there may be some 5G available in a certain area (Best) but LTE might be the “most common” tech type you’ll find there. The most common technology type layer in Speedtest Maps shows the technology type we saw at that location most frequently across all device types. This includes devices that are incapable of connecting to a 5G network (devices that support only 2G, 3G, and 4G LTE). If you are measuring whether 5G is available, use the “Best” layer.
Speedtest Maps are built using data from consumers who have opted in to location sharing in the Speedtest app. If you’d like to add valuable data to the maps and help to improve the feature, turn on location sharing in the settings of your device.
Our mission at Ookla is to empower consumers across the globe to understand and optimize their internet experience. Access to Speedtest Maps helps you find detailed information on coverage in the locations that matter most to you. Open the Speedtest app on your mobile device to check your map today or download Speedtest for Android or iOS.
Editor’s note: This article was updated on May 20 to clarify the uses of the “Best” and “Most Common” layers.
Ookla retains ownership of this article including all of the intellectual property rights, data, content graphs and analysis. This article may not be quoted, reproduced, distributed or published for any commercial purpose without prior consent. Members of the press and others using the findings in this article for non-commercial purposes are welcome to publicly share and link to report information with attribution to Ookla.
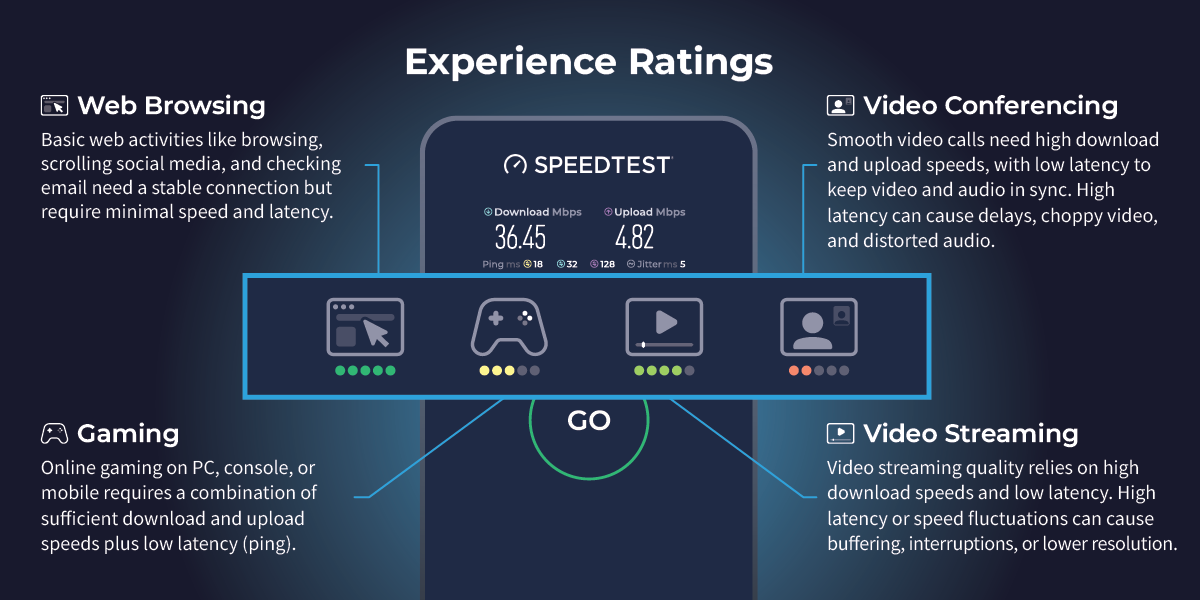
We are excited to introduce Speedtest Experience Ratings, a new beta feature in the Speedtest app and website designed to help you better understand how your Speedtest results translate into real-world performance. These ratings provide insights on four key online activities: Web Browsing, Online Gaming, Video Streaming, and Video Conferencing. Each metric is given a score on a 1 to 5 scale (1 = Poor, 5 = Excellent) to indicate expected performance.
Metrics Impacting Your Ratings
While Speedtest primarily displays download speed, upload speed, and ping, our Experience Ratings account for additional factors like jitter, loaded latency, and packet loss. All of these metrics can impact real-world performance, even if your speed results look strong.
Download Speed: How quickly you can pull data from a server on the internet to your device
Upload Speed: How quickly you can send data from your device to the internet
Latency (or Ping): The reaction time of your connection — how quickly your device gets a response after you’ve sent out a request
Jitter: Also called Packet Delay Variation (PDV), jitter is a measure of the variability in ping over time
Loaded Latency Increase: Calculates the excess latency by finding the higher value between download and upload latency and subtracting a baseline latency
Packet Loss: Packet loss occurs when a packet of data being sent over the internet is not received or is incomplete
Understanding Experience Ratings
Web Browsing
Web browsing includes activities like visiting websites, scrolling social media, and checking emails. This is one of the least demanding activities in terms of speed and latency, but stability is key.
Latency Considerations: Latency is not typically an issue for basic browsing
Estimated Data Usage:
General browsing & social media: ~60 MB per hour
Email (without large attachments): ~1 MB per email
Email (with attachments): Varies based on file size
Online Gaming
A smooth gaming experience requires a combination of sufficient download and upload speeds as well as low latency. High latency can cause lag, delays in player actions, and an overall poor experience.
Relevant Metrics: Ping, Packet Loss, and Loaded Latency Increase
Recommended Speeds:
Download: 3-10 Mbps per player (higher for modern, high-resolution games)
Upload: 1-3 Mbps
Latency Considerations:
Ideal Ping: Below 50ms
Moderate Ping: 50-100ms (may experience minor lag)
High Ping: Over 100ms (noticeable lag and delay in gameplay)
Estimated Data Usage:
Casual gaming: ~40 MB per hour
Competitive online gaming: ~100 MB per hour
Game downloads/updates: Varies significantly (e.g., AAA games can be 50-150 GB)
Video Streaming
The quality of your video streaming experience depends primarily on high download speeds and low latency. If latency is too high or speeds fluctuate, you may experience buffering, interruptions, or a reduction in video resolution.
Relevant Metrics: Download, Ping, Packet Loss, and Loaded Latency Increase
Recommended Speed:
Standard Definition (SD, 480p): 3-4 Mbps
High Definition (HD, 720p-1080p): 5-10 Mbps
4K Ultra HD: 25 Mbps or higher
Latency Considerations:
Low latency helps ensure smooth playback without buffering.
Estimated Data Usage:
SD (480p): ~700 MB per hour
HD (1080p): ~1.5-3 GB per hour
4K UHD: ~7-10 GB per hour
Video Conferencing
For smooth video calls, both high download and upload speeds are important. Low latency is crucial for keeping video and audio in sync, whereas excessive latency can lead to delays, choppy video, and distorted or out-of-sync audio.
Relevant Metrics: Ping, Packet Loss, Jitter, and Loaded Latency Increase
Recommended Speeds:
Standard Definition (480p): 1 Mbps download / 1 Mbps upload
High Definition (720p-1080p): 3-6 Mbps download / 2-3 Mbps upload
4K Video Conferencing: 10-15 Mbps download / 5-10 Mbps upload
Latency Considerations:
Low latency helps ensure smooth playback without buffering.
Estimated Data Usage:
SD (480p): ~700 MB per hour
HD (1080p): ~1.5-3 GB per hour
4K UHD: ~7-10 GB per hour
Speedtest Experience Ratings in Action
Here’s a look at Experience Ratings during a Speedtest:
Want to know your Experience Ratings? Take a Speedtest!
Ookla retains ownership of this article including all of the intellectual property rights, data, content graphs and analysis. This article may not be quoted, reproduced, distributed or published for any commercial purpose without prior consent. Members of the press and others using the findings in this article for non-commercial purposes are welcome to publicly share and link to report information with attribution to Ookla.
Downdetector is starting 2025 strong with major enhancements aimed at expanding our global reach and improving usability for our Downdetector users and Downdetector Explorer customers. Here’s a look at some of the latest updates that make it easier than ever to monitor and track service disruptions worldwide.
Expanding Downdetector’s Global Coverage
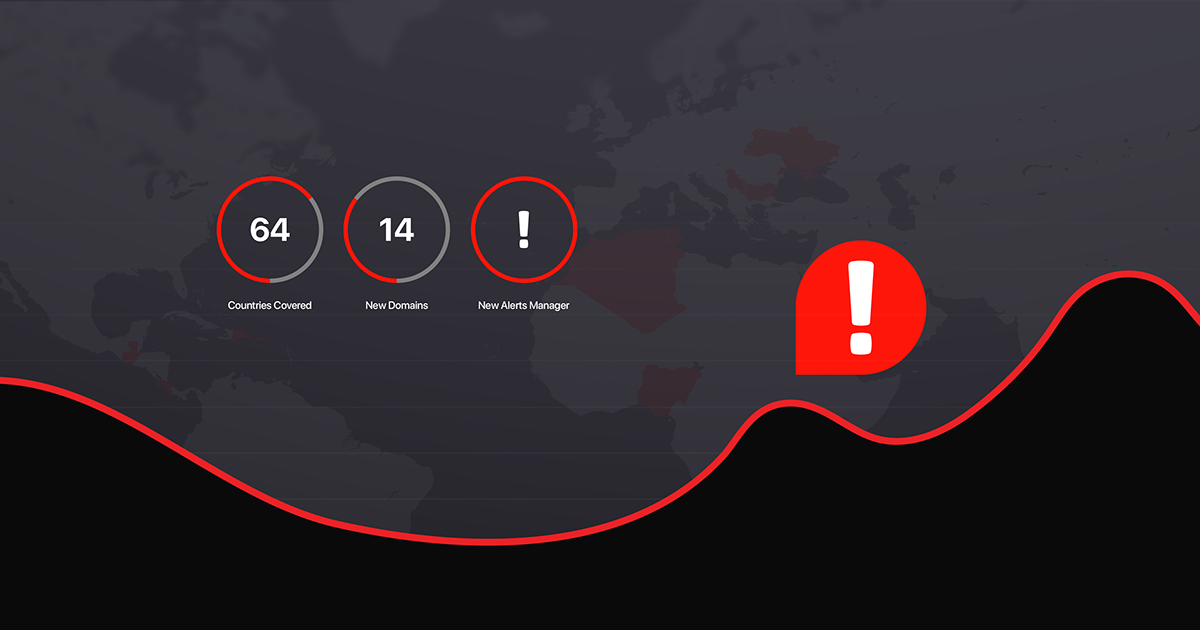
As part of our commitment to providing real-time service insights across the globe, we’ve launched 14 new Downdetector domains in key markets. These new domains allow users to track and report issues with local services—including telecommunications, banking, and other essential industries.
With these additions, Downdetector now operates in 64 countries, empowering users all around the world to stay informed about outages that matter to them.
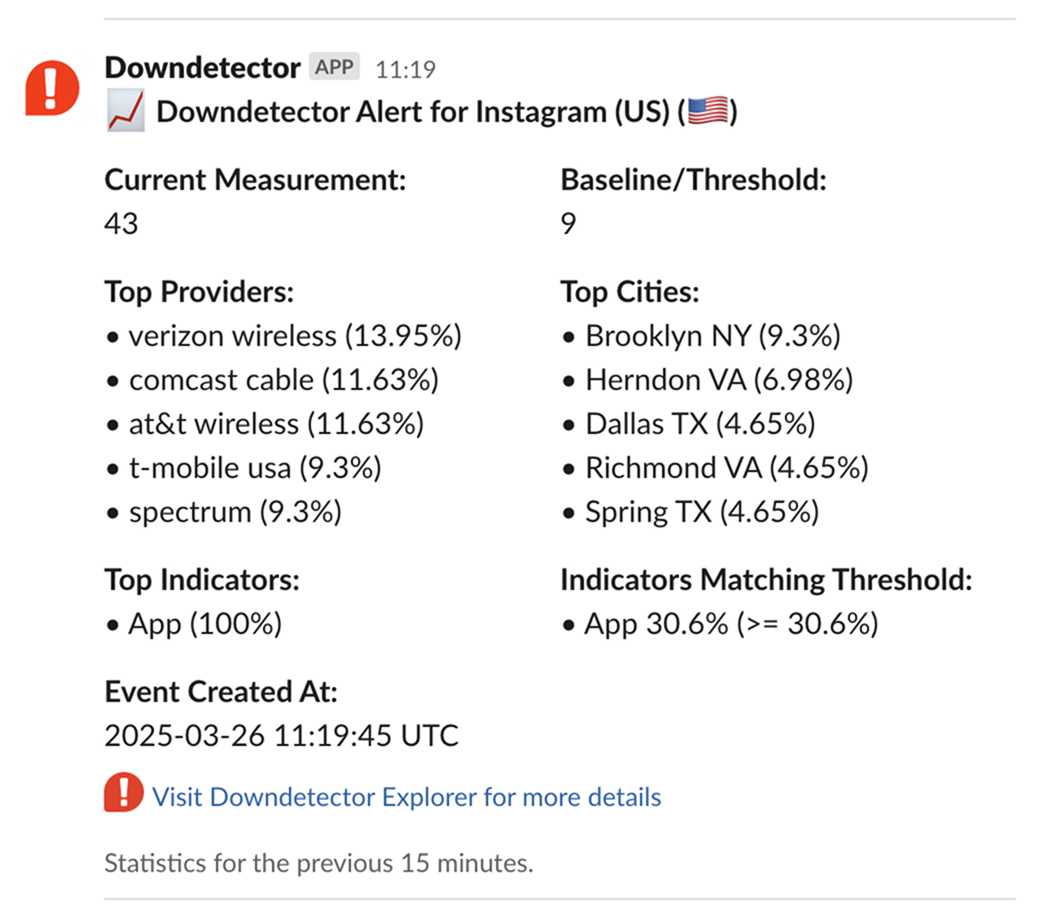
To improve the monitoring experience for Downdetector Explorer customers, we’ve launched a revamped Alerts Manager. This feature allows users to seamlessly integrate Downdetector with observability tools like Datadog, Slack, and OpsGenie, delivering real-time outage alerts directly into existing workflows.
By connecting Downdetector data to the tools teams already use, organizations can automate alerting, streamline communication, and accelerate incident response.
Here’s a look at what a Downdetector alert looks like in Slack:
With the New Alerts Manager, Explorer users can:
Customize alert settings with precise service and region filters, ensuring you receive only the most relevant notifications
Improve team collaboration with real-time notifications sent to the right groups via Slack, OpsGenie, or email
Enhance incident response times by integrating directly with observability tools for faster, data-driven insights
Multi-Service Alerts
As part of the expansion to the alerts management system, we’ve also introduced Multi-Service Alerts! This powerful new capability enables teams to detect outages across multiple services.
Multi-Service Alerts allow users to trigger notifications when two or more monitored services enter a critical state at the same time. This is especially useful for:
Identifying shared infrastructure issues (e.g., when multiple ISPs or cloud providers go down)
Monitoring your competitive landscape (e.g., when your service and a competitor are both impacted)
Detecting ecosystem-wide disruptions faster and with more context
Interested in accessing data from our new domains or seeing the new alerts manager in action? Contact us today to learn more!
Ookla retains ownership of this article including all of the intellectual property rights, data, content graphs and analysis. This article may not be quoted, reproduced, distributed or published for any commercial purpose without prior consent. Members of the press and others using the findings in this article for non-commercial purposes are welcome to publicly share and link to report information with attribution to Ookla.
You know Ookla® Speedtest as a powerful tool to diagnose and troubleshoot your internet connection, and we know sometimes you simply need a quick look at whether or not you’re connected. We’ve improved the Speedtest app to give you just that. With our new Network Status feature, you can open the Speedtest app and quickly see whether your device is online or not. This immediately tells you if you need to focus your troubleshooting on getting connected – or if you can dig deeper to fine-tune your network connection.
How Network Status works
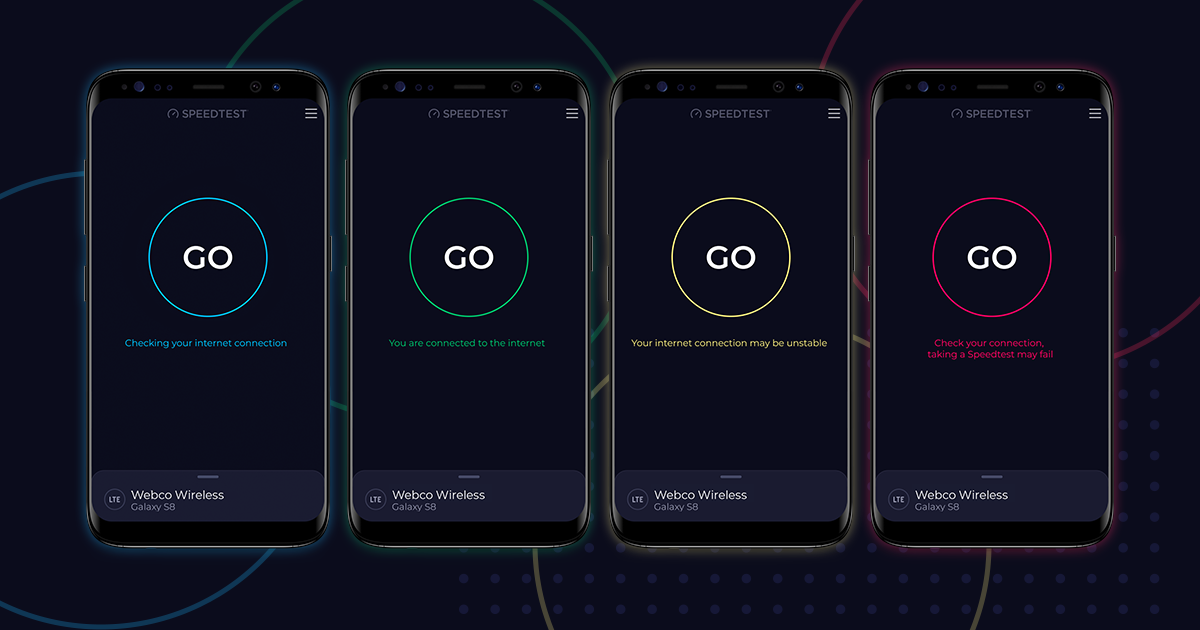
First, a blue circle
You’ll see a blue circle around the Go button when you open the Speedtest app, along with a “Checking your internet connection” message. During this time we are sending multiple requests to multiple services to check your online status. The Speedtest app determines your device connectivity strength based on the success rate of these requests. You’ll see the circle change to green, yellow, or red, depending on the state of your connection.
A green circle confirms you’re connected
If the initial check is successful, the circle around the Go button will change to green and you’ll see a “You are connected to the internet” message. Hooray! This means you’re ready to run a Speedtest to get the full picture of your internet performance or a video test to see if your connection is streaming ready. You can also check out the Downdetector tab to see if the services and sites you want to connect to are experiencing difficulties or click on the map tab for a look at coverage in your area.
A yellow circle means something isn’t quite right
You’ll see a yellow circle and a “Your internet connection may be unstable” message if the response rate to the initial check is lower than expected. You can still proceed with using the Speedtest app or the internet at large, but you may not get the performance you are hoping for.
A red circle indicates you’re probably disconnected
The circle around the Go button will turn red if there is a really poor response rate (or no response) to the initial check. You’ll also get a “Check your connection, taking a Speedtest may fail” message. This is a good time to see if your device is in airplane mode or if you might need a restart. It could also indicate that you have no coverage if you’re on a mobile network or that your Wi-Fi is experiencing difficulties if you’re trying to use Wi-Fi.
Network Status offers a quick check for users who need it
We know you don’t always need the full performance evaluation Speedtest provides, and we know that data is sometimes limited and usage can be expensive in some parts of the world. Network Status gives you a lightweight peek at what’s happening with your network just by opening the Speedtest app. You’ll have real-time information about whether you’re connected to a network and then you can take a Speedtest to get the full view of your network’s performance if you need it.
Network Status is already available in the Speedtest app for Android and iOS. Open the Speedtest app on your device to try it today or download the app using Google Play or the Apple App Store. If you don’t see the new Network Status feature, update your app to the latest version.
Ookla retains ownership of this article including all of the intellectual property rights, data, content graphs and analysis. This article may not be quoted, reproduced, distributed or published for any commercial purpose without prior consent. Members of the press and others using the findings in this article for non-commercial purposes are welcome to publicly share and link to report information with attribution to Ookla.
Reliable connectivity is a cornerstone of daily life, powering communication, work, education, commerce, and critical emergency services (to name just a few). Yet many communities in both rural and congested areas lack reliable access to internet services.
Government officials, tasked with securing and allocating resources to improve broadband performance for unserved and underserved communities, need a clear picture of the state of connectivity in their jurisdiction to determine where digital divides exist. However, the federal, state, and local data that is currently used does not provide the scale and accuracy of measurements to ensure that all communities are properly represented in efforts to expand broadband access.
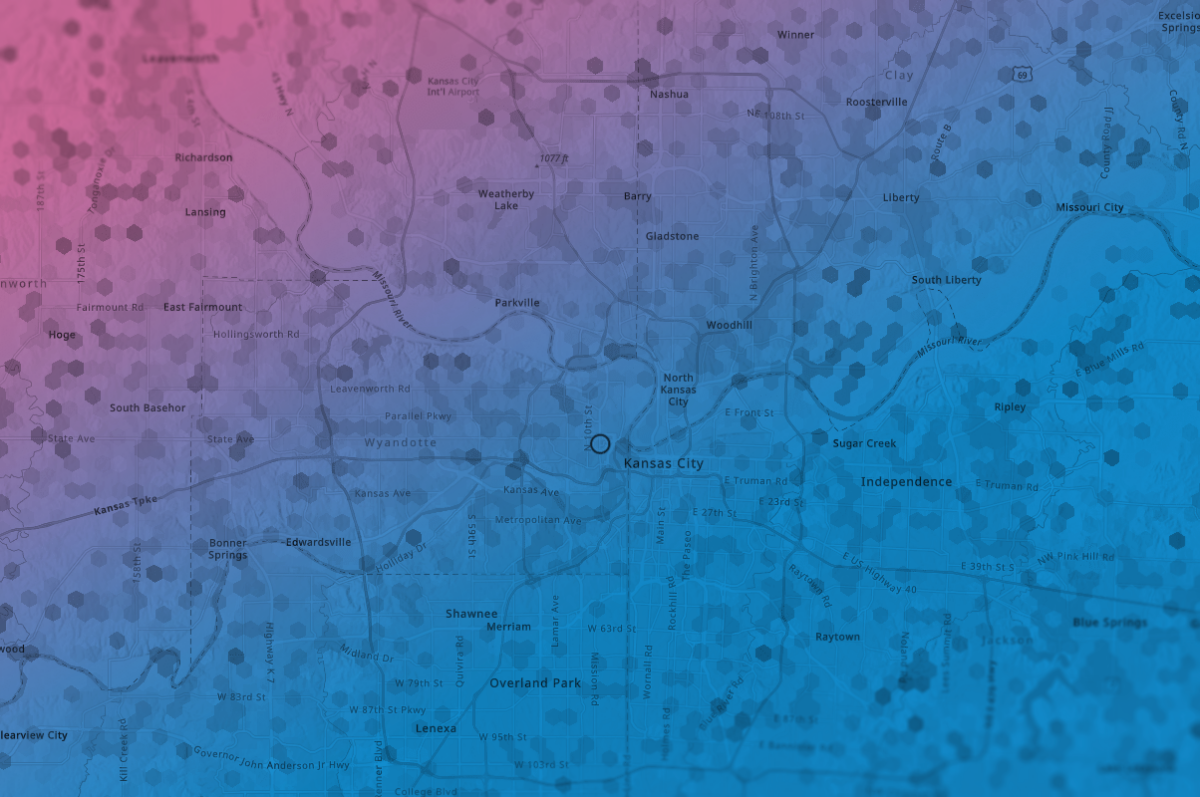
Based on millions of consumer-initiated tests taken every day, Speedtest® data provides regulators and government officials with an unparalleled, objective view into their constituents’ experiences when trying to access internet services. We are excited to announce that these insights are now easier than ever to access with the launch of Speedtest Hosted Layers for ArcGIS.
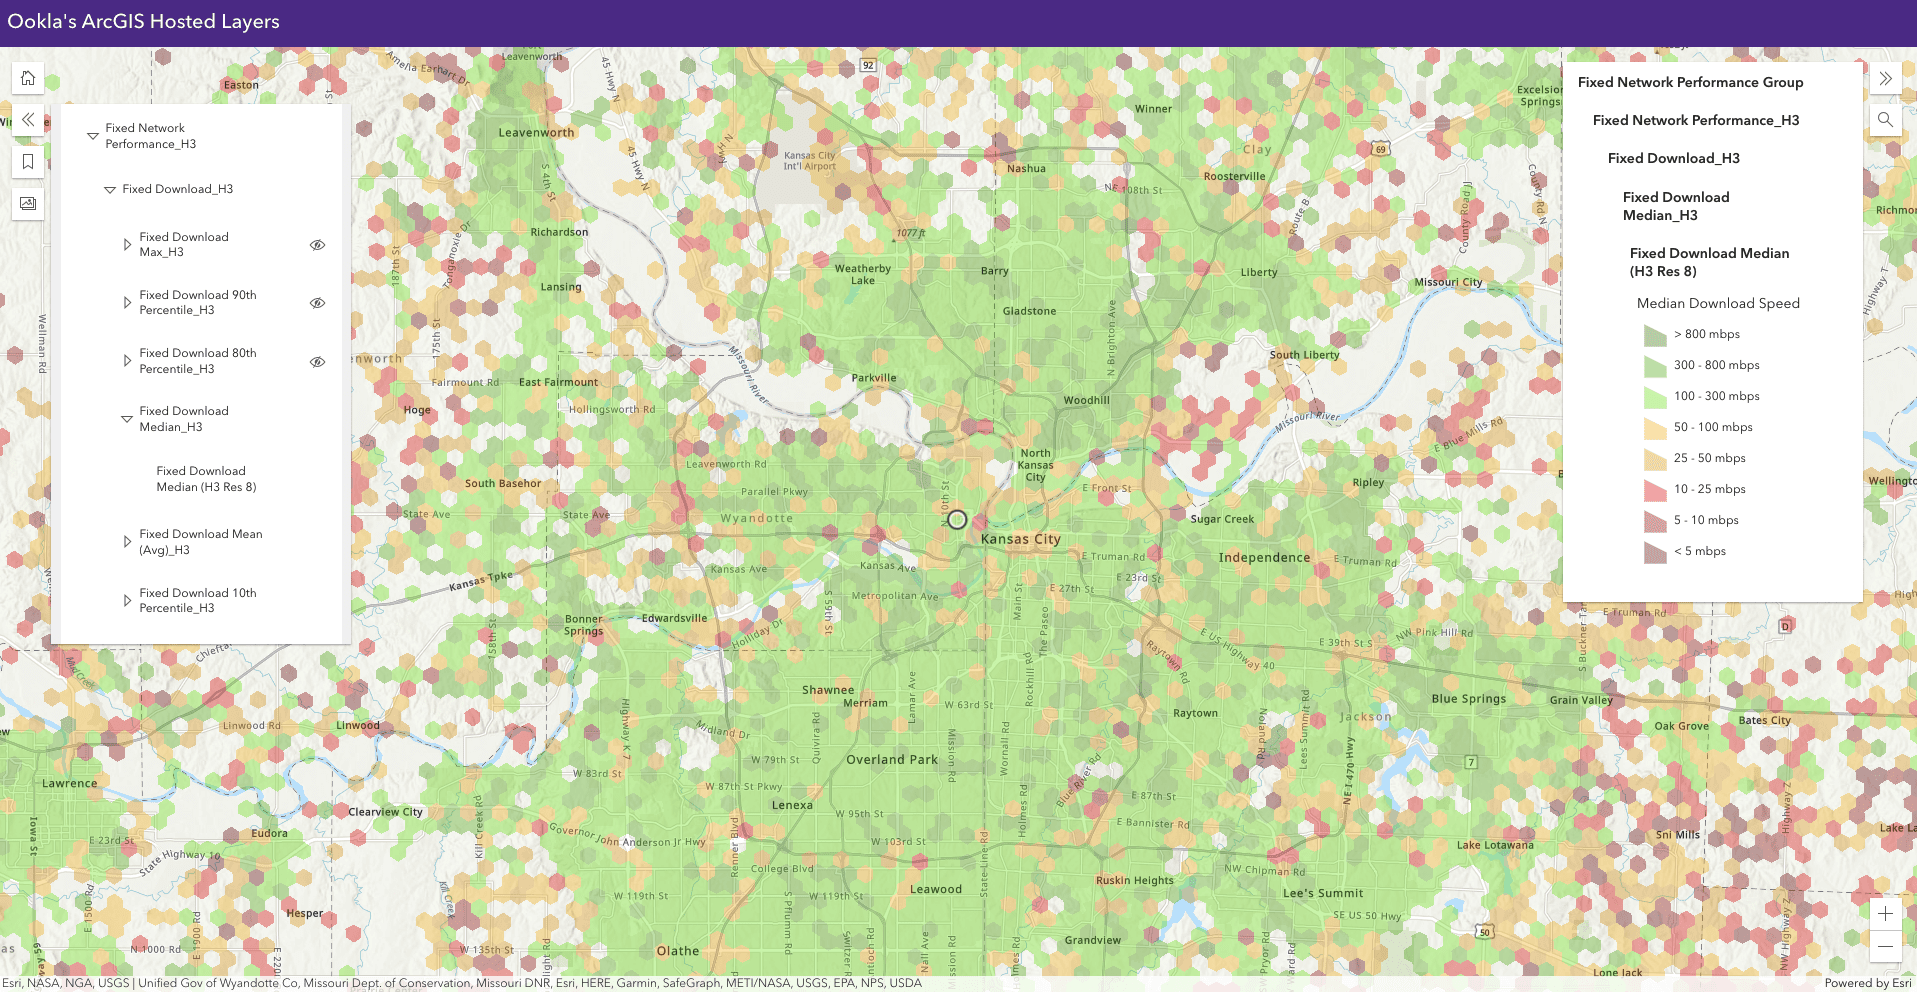
Visualize the state of connectivity using ArcGIS® Online
Many regulators and U.S. government officials utilize the GIS mapping platform, ArcGIS Online, to visualize datasets including national broadband published maps, demographic information, and the locations of important community anchor institutions. Government officials can now immediately add Speedtest Fixed and Mobile datasets to their analysis by leveraging Speedtest Hosted Layers for ArcGIS. This significantly reduces the integration effort and allows government officials to visualize pre-aggregated Speedtest data with existing layers at the national, state, county, census, and H3 Resolution-8 level.
The Speedtest hosted layers include real-world insights on the availability of networks and how these networks are performing. This is surfaced through key metrics including download speed, upload speed, latency, and jitter for all network providers in the area.
U.S. government officials can leverage the Speedtest Hosted Layers in ArcGIS to:
Immediately access fixed and mobile network insights in ArcGIS Online
Significantly reduce time-to-value by eliminating data ingestion and integration processes
Identify unserved and underserved areas and their applicable Broadband Serviceable Locations (BSLs) to support grant proposals and ensure proper funding
Monitor the progress of broadband deployments and performance of specific ISPs
Showcase the improvements in connectivity for external stakeholders
By painting a detailed picture of the current connectivity landscape based on the millions of daily consumer-initiatives tests taken with Speedtest, this crowdsourced data helps ensure unserved and underserved locations receive the funding needed to improve connectivity for all.
Ookla retains ownership of this article including all of the intellectual property rights, data, content graphs and analysis. This article may not be quoted, reproduced, distributed or published for any commercial purpose without prior consent. Members of the press and others using the findings in this article for non-commercial purposes are welcome to publicly share and link to report information with attribution to Ookla.
Ookla® illuminated dozens of major developments in internet connectivity on Ookla Research ™ during the course of 2022. We documented the spread of 5G across the world into many new markets, we analyzed the increasingly heated space race for rural and satellite connectivity, and we invested deeply in ways to better measure, understand, and help improve connected experiences. Read on for some of our top stories from 2022.
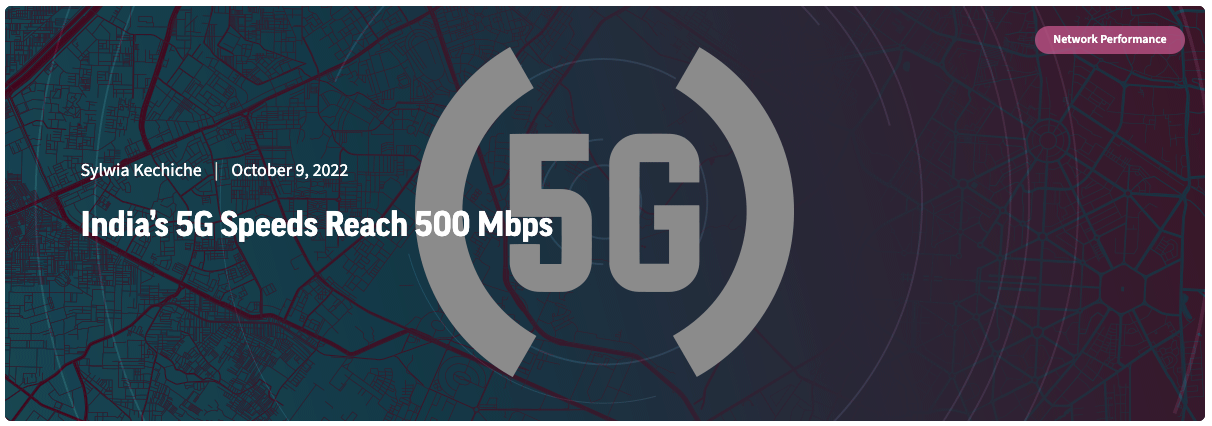
2022 was a huge year for 5G expansion across the world, with India launching commercial 5G in one of the largest mobile markets in the world. In mid-2022 ahead of the Indian 5G auction, Ookla surveyed Indian consumers and found that 89% of Indian smartphone users were ready to upgrade to 5G. And so far, they’ve had a lot to look forward to, with 5G download speeds reaching 500 Mbps over test networks. We’re excited to see what future data holds in this important market.
Noteworthy evolutions in internet connectivity during 2022
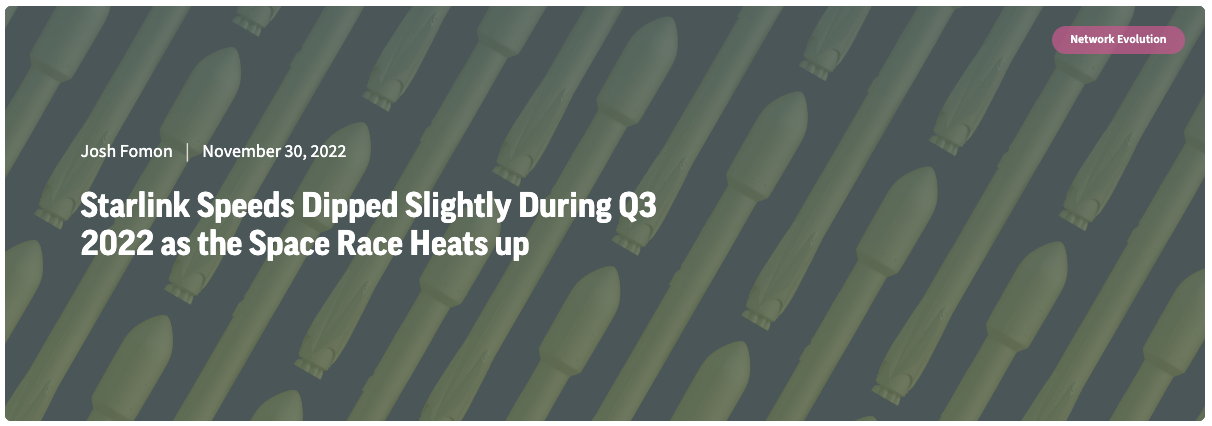
Starlink expanded rapidly, but speeds dipped
The past year had mixed results for Starlink as it raced ahead in Q4 2021 and reached download speeds of over 100 Mbps, leveled out in Q1 2022, started to slow in Q2 2022 while reaching over 400,000 worldwide subscribers, and then speeds dipped again in Q3 2022 in North and South America while showing huge expansion in U.S. counties. With major developments slated for multiple satellite providers in 2023, we are eagerly anticipating how the competition will stack up in the new year.
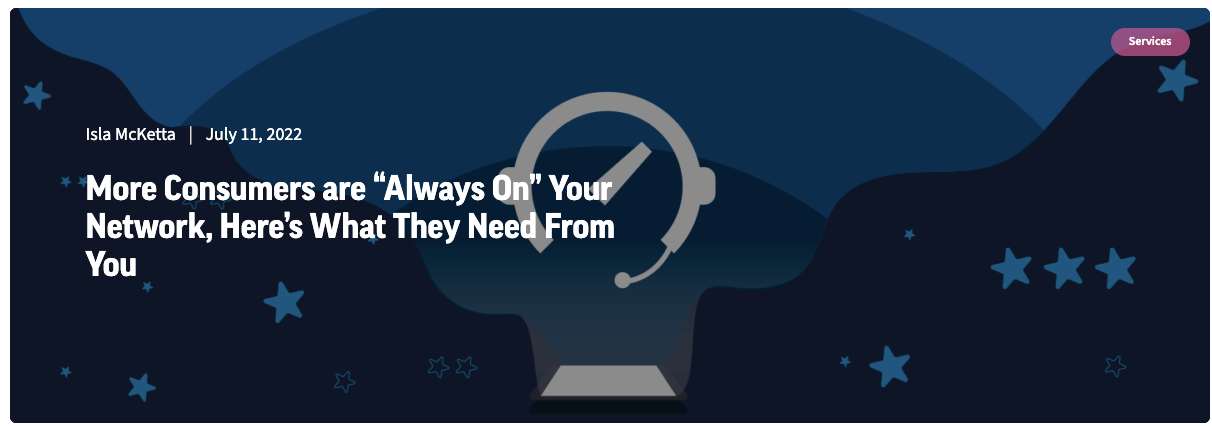
Ookla found consumers in the Switzerland, the U.K., and the U.S. are “always on” their networks
In a groundbreaking study commissioned by Ookla, we found the percentage of consumers who describe themselves as always online grew from 30% to 69%. The study also found that consumers are generally dissatisfied with the customer service network operators provide, and are much more willing to churn to a new provider.
Travelers began to see fast airport speeds in more locations
Ookla examined fiber to the home (FTTH) connections in Canada to show how fast the upgrade to fiber is for current broadband consumers. We found fiber was 12x faster at the provincial level in Canada, and upload speeds were nearly 11x faster. If you’ve been mulling over an upgrade, definitely check out this article.
Ookla resources strengthened consumer choices in 2022
Ookla added cities to the Speedtest Global Index™ and launched the Ookla Performance Directory™
The Speedtest Global Index changed how the world benchmarks global speeds, which is why we were thrilled to introduce cities to the Speedtest Global Index, which benchmarks the internet performance of some of the most populous cities in the world. Increasing connectivity is at the core of Ookla’s mission, which is why we were also excited to give you access to information about internet performance in your area with the Ookla Performance Directory.
Ookla is taking connected experiences to the next level
Not only did Ookla expand its consumer data resources that you can readily access, we launched advanced connected experience measurement tools that will greatly benefit your internet experience. This year we launched Speedtest Maps™ for iOS, which allows you to see different levels of service in a particular area, as well as what you can expect from different operators in case you’re looking to switch providers. Shortly thereafter, we debuted loaded latency, which gives you a more nuanced picture of responsiveness and what the bottlenecks in your connection really are. Finally, in Summer 2022, Ookla acquired Cell Rebel, which will bring enhanced consumer network experience insights to the global telecommunications marketplace.
Ookla will continue to deliver groundbreaking articles in 2023, so if you want to keep up to date with the latest news in internet connectivity, be sure to subscribe to Ookla Research today.
Ookla retains ownership of this article including all of the intellectual property rights, data, content graphs and analysis. This article may not be quoted, reproduced, distributed or published for any commercial purpose without prior consent. Members of the press and others using the findings in this article for non-commercial purposes are welcome to publicly share and link to report information with attribution to Ookla.
Every day, over 10 million consumers press the “Go” button on Speedtest® to measure the performance and quality of their internet connection. Powering every one of these tests is a global network of high-performance servers, ready to test the maximum sustained throughput of the user’s connection (download and upload speeds) and to report back on key network health metrics, such as latency, jitter, packet loss and traceroute (the transit delays and path of packets across a network). These are the critical metrics that provide consumers with an accurate, reliable measure of their internet speed and the quality of their connectivity.
Today, the Speedtest Server Network™ includes more than 10,000 servers worldwide, representing over 7,000 unique host networks. This article explores how this distributed server network — along with the Ookla® Speedtest methodology — ensures the most accurate testing for consumers while delivering valuable insights on performance and quality back to network providers in order to build a faster internet for everyone.
The Speedtest Server Network
The accuracy and consistency of Speedtest is made possible through the global network of servers that host our server daemon, OoklaServer. This robust network and the proprietary protocol that we have implemented ensures that our users can fully evaluate the quality of service of their connection — wherever they are on the planet, and on all types of networks. Over the last 14 years, the Speedtest Server Network has grown to span over 190 countries and most major population centers around the globe.
The server hardware and connectivity are supplied by network providers who want insight into the performance and quality of their networks — including fixed broadband ISPs, mobile network operators, application and content service providers, hosting and colocation providers, and academic and other industry groups. To complement this extensive network of hosted servers, additional high capacity dedicated server infrastructure is provided at the hardware layer to Ookla by sponsor organizations such as OneProvider, a global provider of dedicated hosting, cloud hosting, and colocation services around the world.
With over 7,000 global host networks incorporating testing servers, Ookla ensures the objectivity of Speedtest measurements through OoklaServer, the core server software that communicates with our Speedtest client software. Read on to learn more about our methodology for accurately measuring a consumer’s quality of service down to the last mile, how OoklaServer works and how we dynamically monitor this distributed server network.
The foundation of a Speedtest server
As high-throughput fiber connectivity and 5G wireless technology bring gigabit speeds to end users around the globe, it’s critical that network testing solutions can keep up. In the past, individual consumers were unable to purchase internet connections speeds of 1 Gbps. Today, it is common to see users with 1 Gbps and even 10 Gbps connections to the home. Meanwhile, 5G mobile technology is bringing high-throughput connectivity to the pockets and dashboards of consumers in many markets. At Ookla, we’ve been working hard to stay ahead of the bandwidth curve by ensuring that Speedtest is capable of testing 10 Gbps and beyond.
To test speeds on the client-side, Speedtest fully saturates an internet connection by connecting to the Speedtest Server Network to measure the maximum throughput capacity of the connection. To ensure complete saturation, we have stringent criteria to ensure that the Speedtest Server Network is comprised of high-performance servers with high quality network transit and peering. In addition to a standard set of performance criteria for all servers, Ookla rigorously evaluates the network performance and uplink capacity of all servers in the Speedtest Server Network. Automated processes continuously monitor server performance to ensure the overall network is operating at peak performance.
In smaller markets where high-speed network infrastructure is not pervasive, Speedtest servers have a minimum requirement of 1 Gbps upstream and downstream network capacity. In developed markets such as major metro areas, servers must have a minimum upstream and downstream capacity of 10 Gbps. Many large network operators provide multiple servers with capacity of 40 Gbps or 100 Gbps.
Ookla’s constant innovation ensures measurement consistency and objectivity across networks
Because we manage the end-to-end testing ecosystem, Ookla maintains consistent testing standards and vendor-neutral objectivity when delivering results to consumers and network operators alike. More than just measuring the time to transfer data, our software delivers a holistic evaluation of network health, focusing on quality of service (QoS) metrics. Furthermore, because OoklaServer is co-located on networks close to the consumer, all over the world, Speedtest minimizes upstream bottlenecks in the testing process that can add latency variation and skew performance metrics.
OoklaServer serves up our own proprietary TCP-based protocol that partners with Speedtest clients across a wide range of consumer platforms. Key features of the Speedtest protocol:
Dynamic connection scaling that adapts the number of concurrent connections to any connection type.
Stable stop early test termination to avoid unnecessary bandwidth usage once an accurate measurement has been obtained.
Server-side upload measurement to measure upload performance and quality from the receiving end of a data transfer. This notably improves accuracy of measurement on connection types suffering from high connection latency, or those impacted by client-side buffering.
Because this software is maintained and regularly updated by Ookla, it’s also fully extendable to support new features and optimizations as the connectivity landscape evolves. For example, we’ll be moving beyond a one-to-one client-to-server relationship later this year by introducing a standard feature to Speedtest that measures data streams from multiple servers simultaneously to ensure accuracy even in the most extreme cases of high-bandwidth testing.
Ookla provides a holistic measure of network health
At Ookla, our mission is to help build a better, faster and more available internet. There is an old saying that you can’t improve what you don’t measure, and we achieve this mission by providing accurate, objective measurements to consumers and network operators. With our globally distributed server network, users on all types of networks can fully evaluate the performance and quality of their connection. With a wide variety of networks represented, users can test both on-net to a server on the network they’re subscribed to or off-net to a server on a network outside of their operator’s network.
When you press the “GO” button on a Speedtest application, we automatically select a nearby server to focus on this aspect of connectivity. Depending on the server responses, users will test to the best possible server, regardless if it is on-net or off-net. These are the results that make up the data that drives our enterprise data, including provider rankings and Speedtest Awards.
Testing to an on-net server is the best representation of the “last mile” of a user’s network connection. The most common use case we see involves an end user evaluating their “last mile” connection — that is, the service provided to them by their ISP or mobile carrier. By testing to an on-net server, Speedtest isolates the last mile connection and rules out any bottlenecks upstream of the ISP.
Testing to an off-net server represents performance of services outside an operator’s network (such as applications like video conferencing, gaming platforms and streaming services). While Speedtest focuses on last mile QoS for consumer connectivity, many users find it important to evaluate end-to-end performance to the services they care about. By comparing multiple Speedtest results both on- and off-network, consumers gain context about the internal health of an ISP’s network along with their external peering and transit performance.
Join the Speedtest Server Network
The robust Speedtest Server Network forms the foundation that allows Speedtest to provide the most accurate and reliable measurement of internet performance, trusted by users around the globe. Providing a host server(s) on the Speedtest network ensures that your services are accurately measured by the millions of consumers who use Speedtest every day. This builds trust with your users and provides valuable data driven insights into the performance your users are seeing.
Learn more about partnering with Ookla to host a server as part of this essential service.
Ookla retains ownership of this article including all of the intellectual property rights, data, content graphs and analysis. This article may not be quoted, reproduced, distributed or published for any commercial purpose without prior consent. Members of the press and others using the findings in this article for non-commercial purposes are welcome to publicly share and link to report information with attribution to Ookla.
Speedtest® has always been about the people. Built by a few to help the many, Speedtest.net has grown from a side project to a global brand with a full set of apps, from a tool used by select gamers to test their ping to a resource used by millions of people (and one superhero) to diagnose and measure internet connectivity around the world. And anonymized data from Speedtest now fuels internet service providers, mobile operators, governments, and NGOs with the information they need to improve internet connectivity for everyone. That’s because of you. Collectively you have helped us achieve over 50 billion Speedtest results. Thank you!
How Speedtest has grown
The internet has changed a lot since that first touch of the “Go” button. Speeds have improved dramatically, new technologies like 5G have taken hold, and more and more people have gained internet access across the world.
In 2006 when we reached our first billion tests, we didn’t yet have mobile apps and the median download speed of fixed broadband for the world was 1.48 Mbps. By 2015 we had 10 billion results, the median mobile download speed was 7.87 Mbps and the median download for fixed broadband was 10.08 Mbps. Fast forward to today when we have over 50 billion Speedtest results and the world averages for mobile and fixed broadband download speed are 47.81 Mbps and 85.06 Mbps, respectively.
Thank you again for helping make Speedtest the global brand it is today. If you want to help us in our mission to improve connectivity for all, take a Speedtest or download the apps for Android or iOS to be part of a movement.
Ookla retains ownership of this article including all of the intellectual property rights, data, content graphs and analysis. This article may not be quoted, reproduced, distributed or published for any commercial purpose without prior consent. Members of the press and others using the findings in this article for non-commercial purposes are welcome to publicly share and link to report information with attribution to Ookla.
At Ookla, the company behind Speedtest, we use consumer-initiated testing to determine the speed and performance of global networks. People often ask us why we take this approach. The short answer is that we believe consumer-initiated testing is the most accurate way to measure real world internet speeds, because it reflects when and where people actually use the internet. The long(er) answer is right here in this video that we hope you’ll enjoy…
Why Speedtest uses consumer-initiated testing
As you saw, it’s important that consumer-initiated testing meets three basic criteria:
Data must come from various devices and contexts
The testing server must be nearby
The number of tests being analyzed must be statistically significant
That’s why we’re grateful to the millions of people all over the globe who use Speedtest every day to determine the speed of their internet connection. You help us report the most accurate and reliable picture of internet speeds across the world.
What about other testing methods?
The limits of drive testing
Drive testing is one common way that mobile operators measure networks. They like it because they can get a repeatable sample of tests taken on the same device in the same place. But drive testing is limited to where cars can actually drive, and most areas that they do test are only measured infrequently. If you want to learn more about the limits of drive testing and why they matter, we have a video for that, too…
To learn even more about different internet measurement methods and their strengths and weaknesses, read our full description here.
Ookla retains ownership of this article including all of the intellectual property rights, data, content graphs and analysis. This article may not be quoted, reproduced, distributed or published for any commercial purpose without prior consent. Members of the press and others using the findings in this article for non-commercial purposes are welcome to publicly share and link to report information with attribution to Ookla.
Online privacy is key to today’s web users who want to browse where and how they please with the security of knowing that no one is snooping on their online activity. A Virtual Private Network (VPN) is a crucial part of every consumer’s internet toolbox. And now Ookla® is offering Speedtest VPNTM, a mobile VPN service through the Speedtest® app you already know and trust.
What a VPN is and why you need one
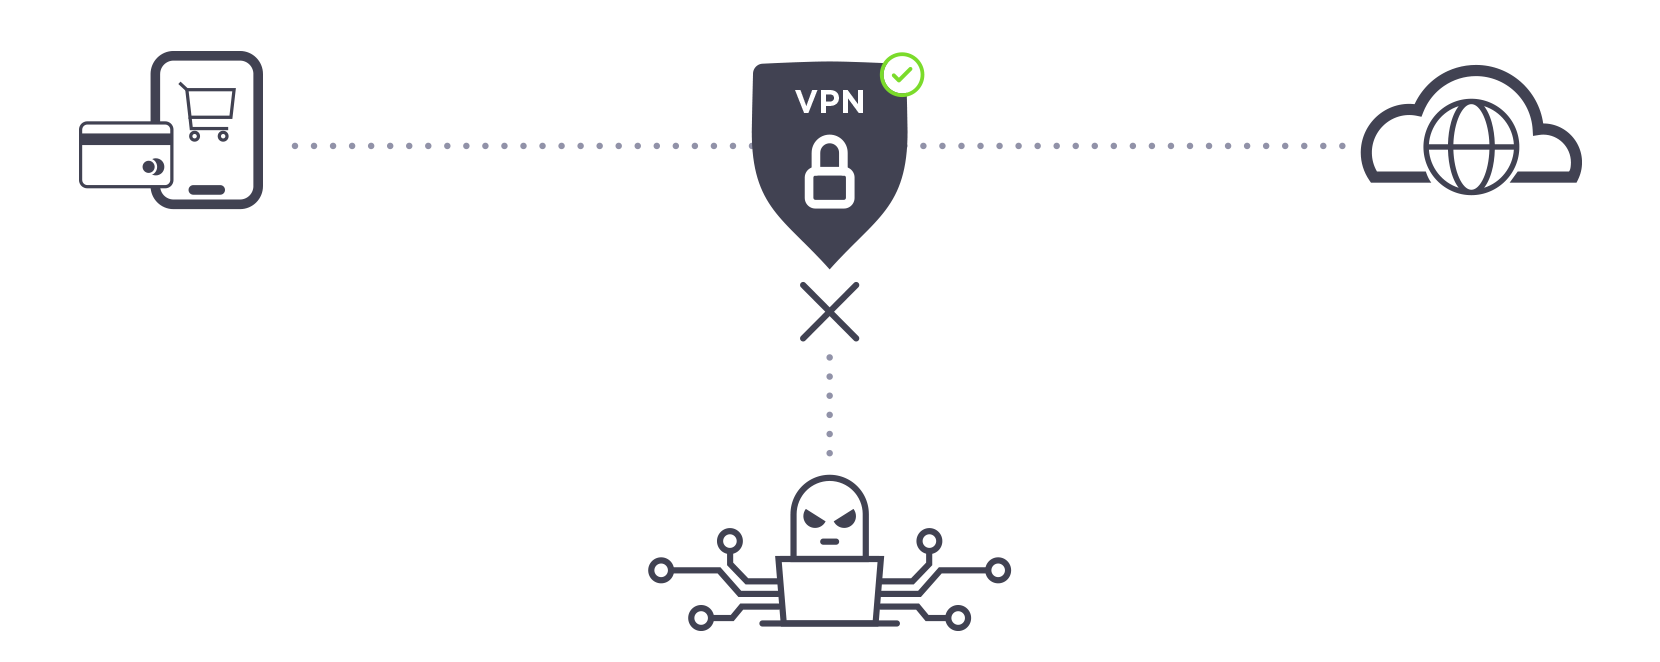
A VPN protects your internet browsing and app usage, keeping it private even if you’re using an otherwise unsecured connection. A VPN anonymizes your IP address and encrypts your internet activity on one end and then decrypts it at the other. This means that no one can see what you’re doing online — not hackers at your local coffee shop, not your neighbor who’s borrowing your Wi-Fi, not even your internet service provider (ISP).
Your online activity is vulnerable if you use public Wi-Fi or other unsecured connections. VPNs create a private session to keep what you’re doing online secure. Speedtest VPN routes your internet connection through a trusted server that secures your identity online.
Why Speedtest VPN?
People have been turning to Speedtest for over 13 years for the most accurate and reliable measures of internet speeds. Now with Speedtest VPN, we can help you ensure your online privacy and security from the convenience of your Speedtest® mobile application. Here are five reasons you should try Speedtest VPN:
It’s convenient. With no additional app to download or account to create, you can easily try out Speedtest VPN on your mobile device using your existing Google Play or App Store account.
It’s everywhere. You can use Speedtest VPN on any mobile network you’re connected to, in any location or context where you use your Android or iOS mobile device.
It’s familiar. Not only is Speedtest VPN available within an app that you’re probably already using, it’s also available in all 17 languages that Speedtest supports.
It’s trustworthy. We do not collect, store or sell information related to your online activities.
It’s free. Your first 2 GB of data over VPN is free every month.
Get started securing your connection today. Download Speedtest on the App Store or get it on Google Play and go to the VPN tab in the app.
Speedtest VPN is already in your Speedtest app on your mobile device. Just open Speedtest and then click on the VPN tab at the bottom of your screen to get started. The app will guide you through a quick series of prompts to turn on Speedtest VPN.
Protect all your browsing with Speedtest VPN Premium
For unlimited data protection, upgrade to Speedtest VPN Premium for $4.99 USD per month. Premium subscribers also receive an ad-free Speedtest experience during their subscription. Unlike other VPN services, Speedtest VPN Premium offers flexible monthly billing through the App Store or Google Play with no expensive annual commitments.
Download Speedtest for Android or iOS to try Speedtest VPN.
Ookla retains ownership of this article including all of the intellectual property rights, data, content graphs and analysis. This article may not be quoted, reproduced, distributed or published for any commercial purpose without prior consent. Members of the press and others using the findings in this article for non-commercial purposes are welcome to publicly share and link to report information with attribution to Ookla.


 First, a blue circle
 A green circle confirms you’re connected
 A yellow circle means something isn’t quite right
 A red circle indicates you’re probably disconnected