Background
The University of Oklahoma’s Engineering Capstone program and Ookla for Good™ have partnered to provide graduating engineering students with a valuable opportunity to work with global internet performance data. Students addressed real-world connectivity challenges while fulfilling a critical requirement for their engineering education.
The Engineering Capstone project represents a culminating educational experience and a requirement for the program’s ABET (Accreditation Board for Engineering and Technology) accreditation. ABET ensures programs meet quality standards necessary to produce graduates prepared for the global workforce.
For engineering students, these capstone projects serve as a bridge between academic learning and industry application. They provide hands-on experience with complex, open-ended problems while developing the teamwork, communication, and project management skills essential for professional success.
The Challenge
While traditional Electrical and Computer Engineering capstone projects at the University of Oklahoma often focus on hardware development such as circuit design, embedded systems, or physical prototypes, faculty recognized the growing importance of data analytics skills in the engineering profession. The Electrical and Computer Engineering Department wanted to expand its capstone offerings into this emerging field to better prepare students for the evolving demands of the technology industry.
Shifting to a focus on data analytics represents an important evolution for the university’s engineering program. The incorporation of data science methodologies into these capstone projects acknowledges that modern engineers increasingly need to understand not just how to build systems, but how to analyze the vast amounts of data these systems generate. For many students, this project offered their first substantial exposure to working with large datasets and applying analytical techniques to real-world problems
Finding industry partners able to provide both relevant projects and meaningful data access presented a challenge. The ideal partner would offer access to comprehensive datasets that would allow students to apply their analytical skills to real-world problems with global significance. Enter Ookla.
A New Direction: The Ookla for Good Partnership
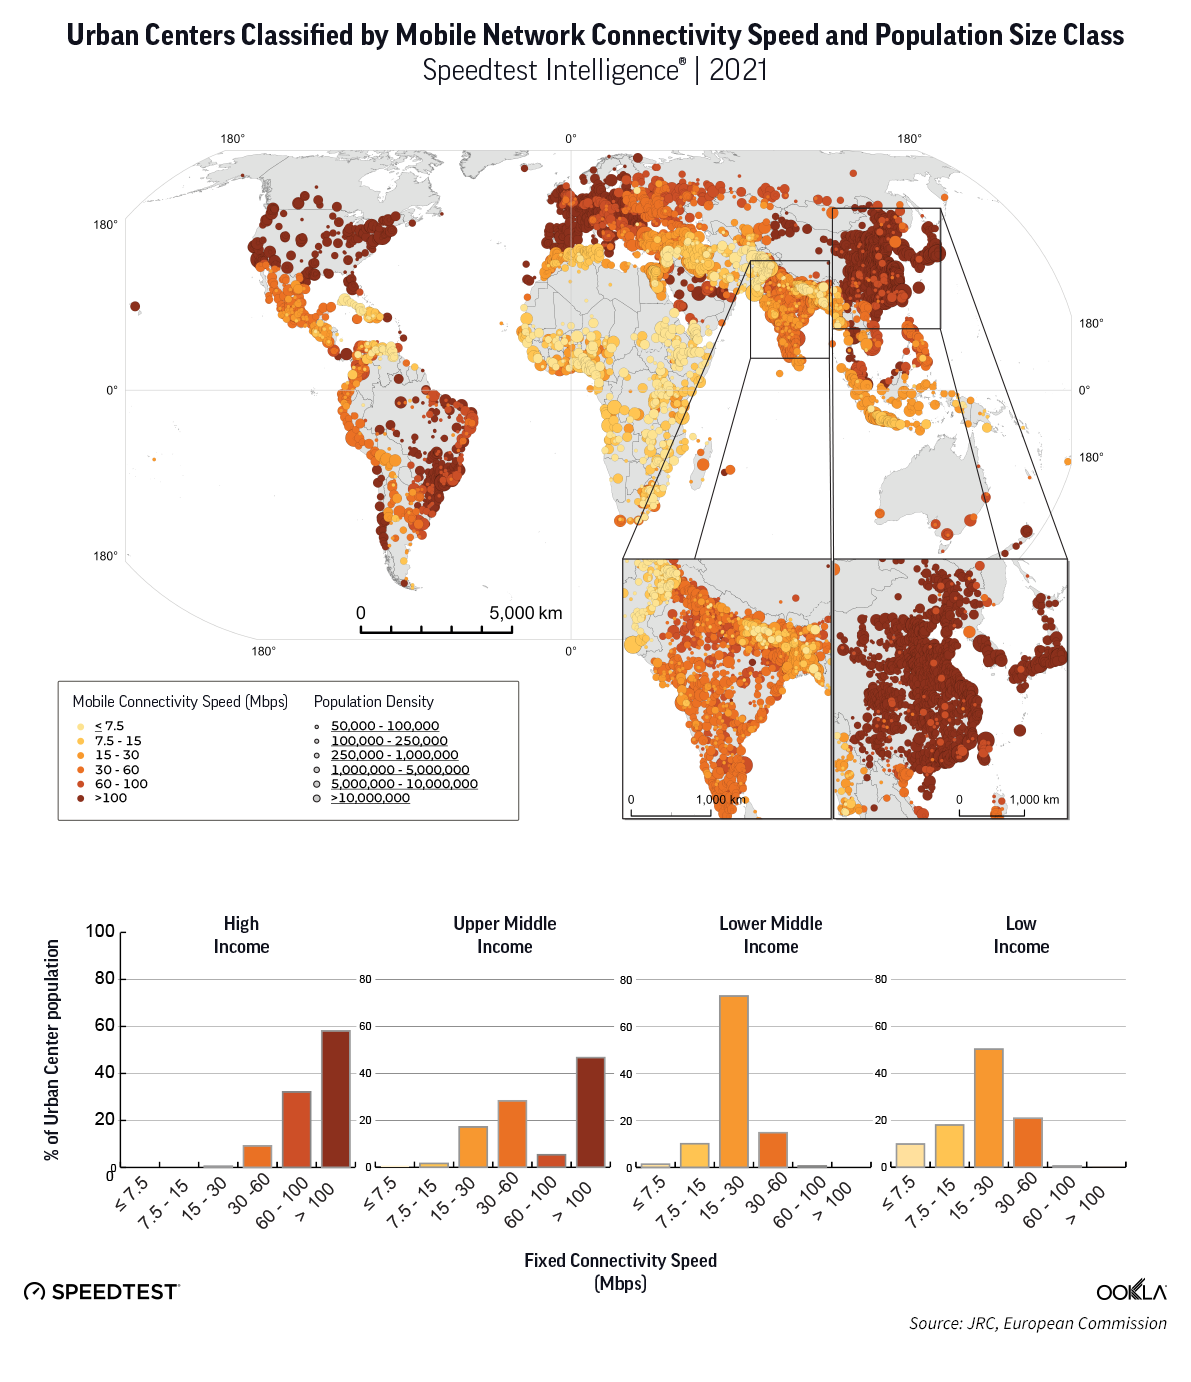
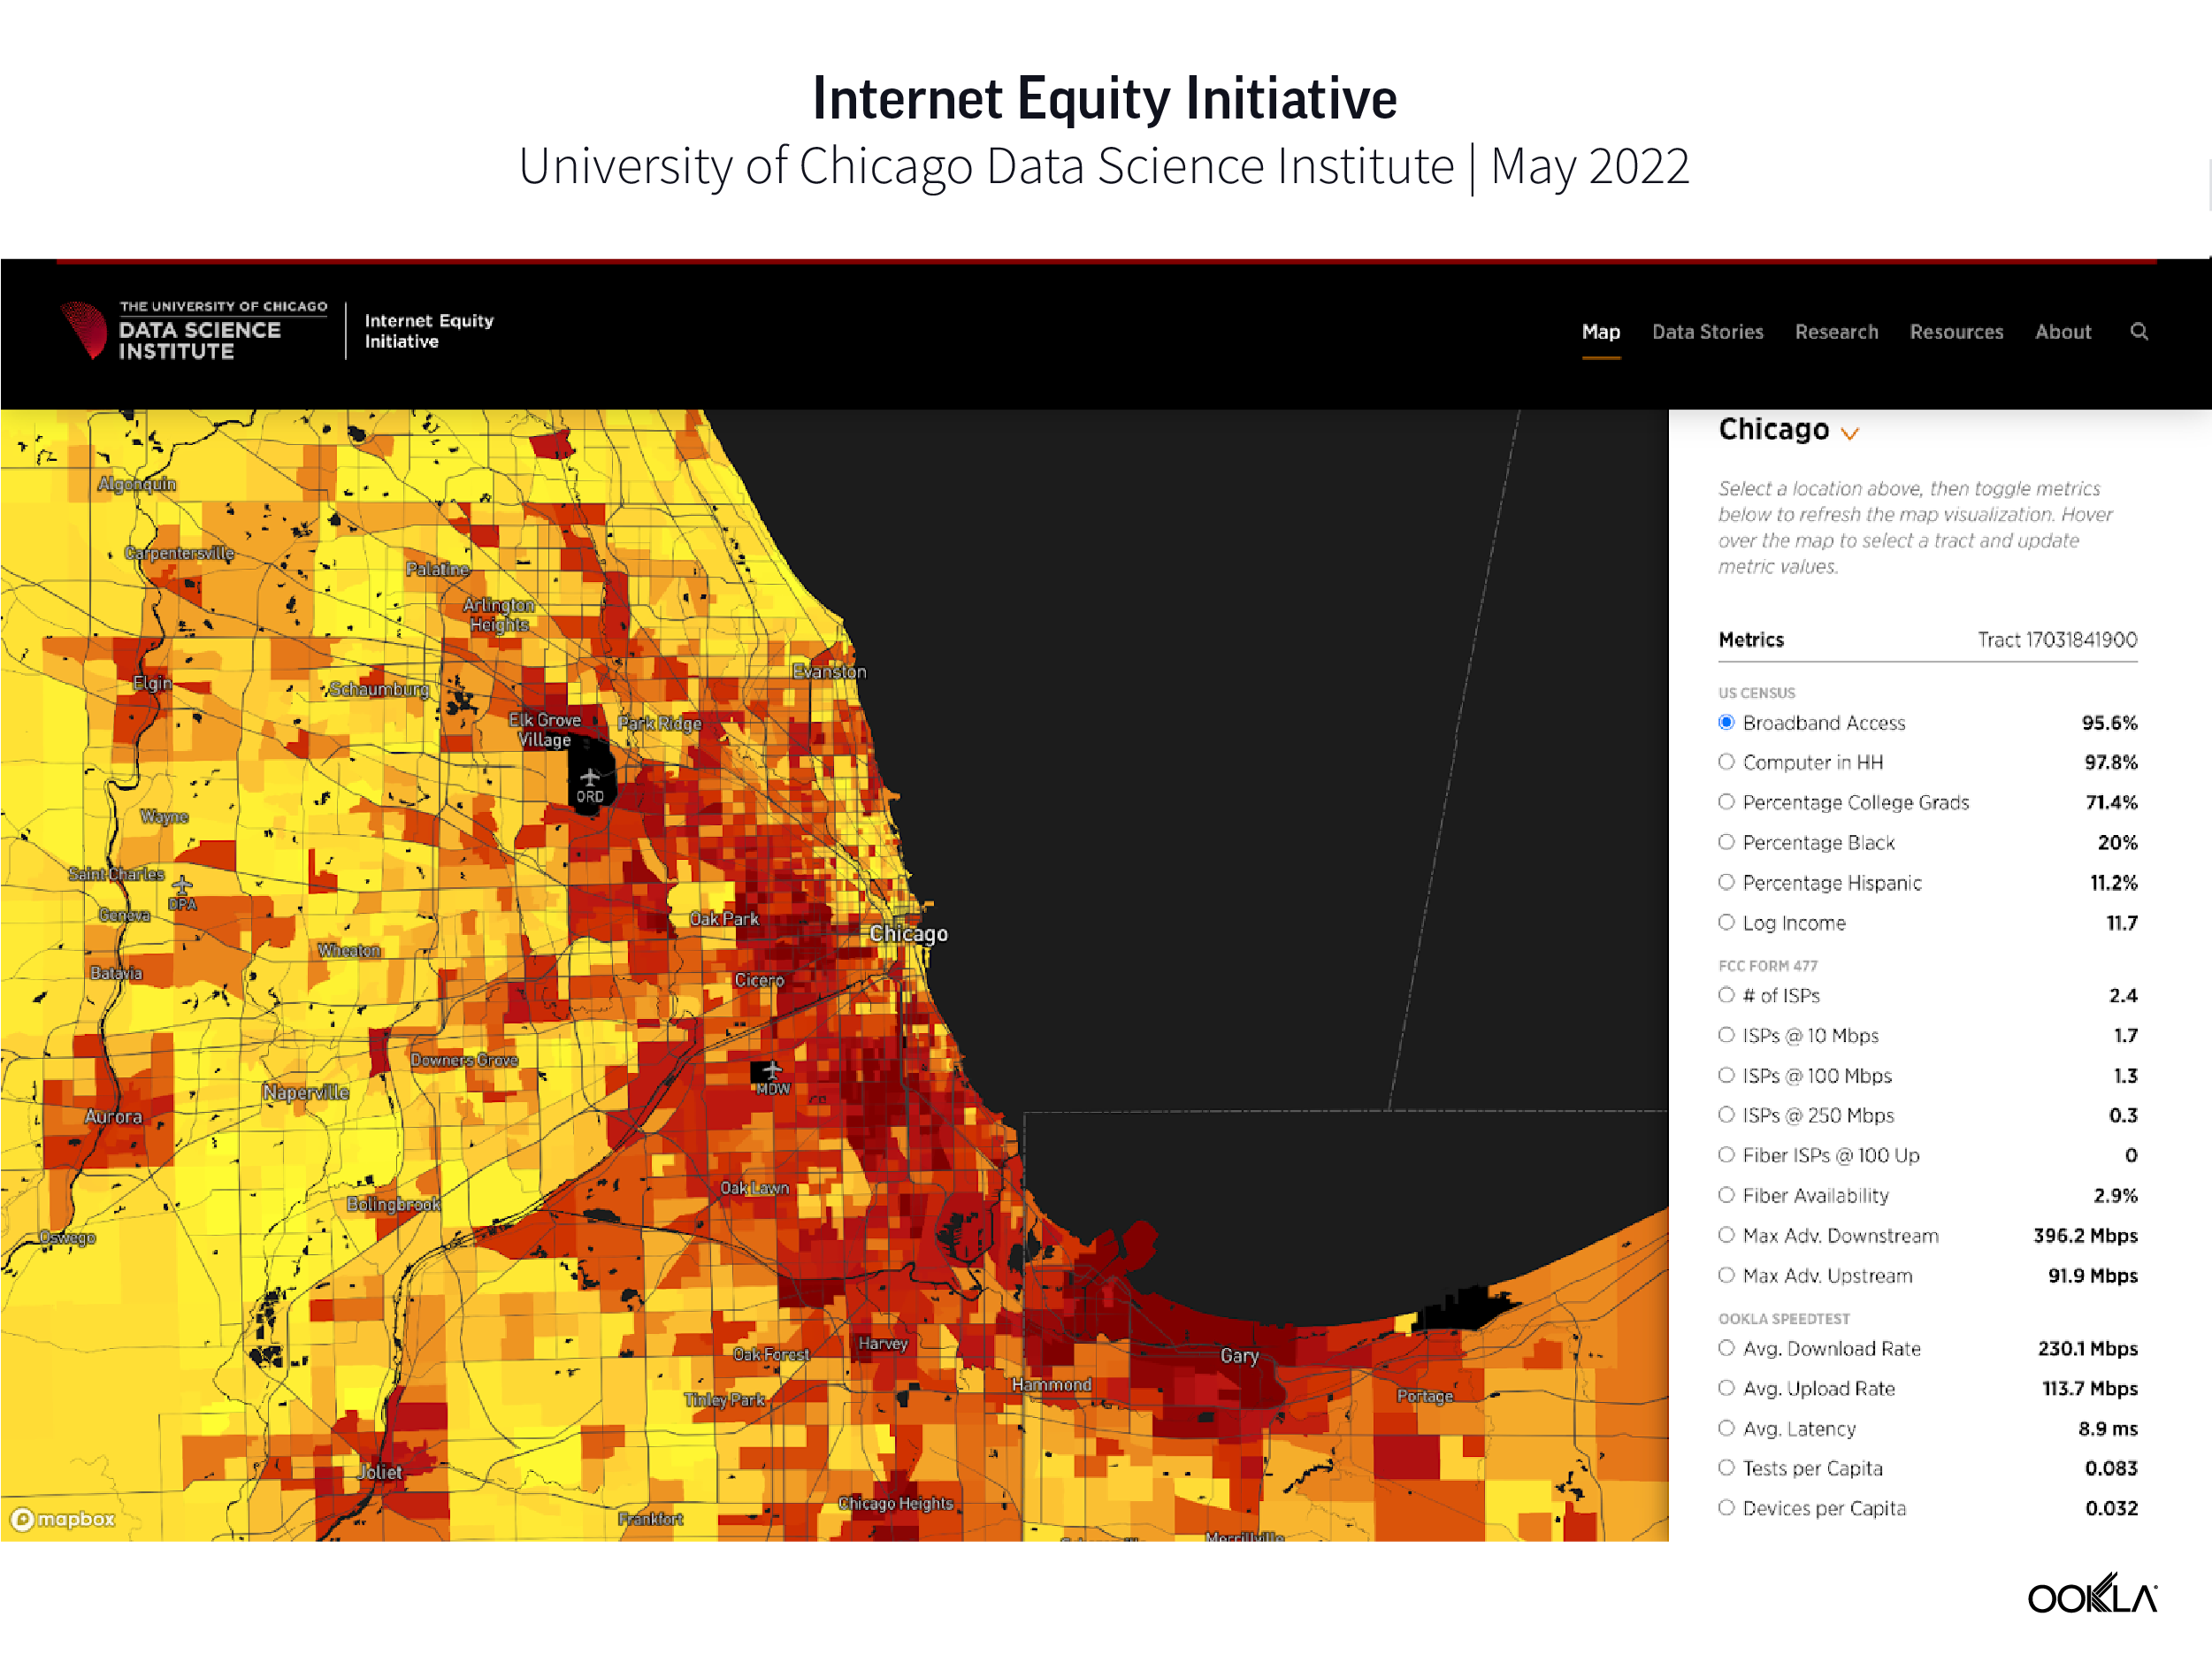
The partnership with Ookla for Good provided exactly what the University of Oklahoma needed. The university established two capstone teams, each focusing on analyzing connectivity challenges in different global regions. As part of the collaboration, students received access to Ookla’s open datasets, including Global Fixed Broadband and Mobile Network Performance Maps. These datasets are derived from Ookla’s vast repository of network intelligence, which collects over 11 million consumer-initiated Speedtest® results daily.
“The Capstone Design course is all about passing the culture of engineering down to a new generation of problem-solvers. Working with the experienced, practicing engineers from Ookla — and using Ookla’s real-world network performance data — has helped these new engineers learn what it’s like to practice engineering in the field. The engineers at Ookla provided high but reasonable expectations and then helped the students to achieve those goals.”
- Dr. Cliff Fitzmorris, Electrical and Computer Engineering Department, University of Oklahoma
This non-traditional project bridged electrical engineering with computer science and data analytics disciplines, offering students experience with emerging industry trends that traditional hardware-focused projects generally lack.
The teams functioned as “connectivity consultants,” using data analysis techniques to develop evidence-based recommendations:
- One team focused on South Africa, identifying connectivity gaps in developing regions and investigating tourism seasonality by isolating popular destinations, public transit hubs, and time of year.
- The second team analyzed high-performance networks in Japan and South Korea, while focusing on the digital divide between rural and urban areas.
Results and Impact
The partnership delivered significant value for the students, the University of Oklahoma, and Ookla for Good. While students typically learn engineering concepts in classroom settings, this project gave many of them their first opportunity to work with real-world data addressing actual connectivity challenges. Students analyzed connectivity issues affecting millions of people, gaining practical experience in applying their skills to problems that they may face in the workforce.
For the University of Oklahoma, the collaboration supported crucial ABET accreditation requirements while expanding capstone offerings into cutting-edge fields that blend engineering with data science — a direction increasingly relevant in today’s technology landscape.
The project also aligned with Ookla for Good’s mission to connect Ookla’s people, skills, and data with organizations working to improve lives through better internet accessibility. Supporting university engineering programs shows how Ookla’s connectivity data can be leveraged for both educational advancement and addressing global connectivity challenges.
About Ookla for Good
Ookla for Good operates as a philanthropic initiative by Ookla, the global leader in mobile and broadband network intelligence and the company behind Speedtest®. The initiative provides complimentary data, analysis, and expertise to organizations working to improve people’s lives through better connectivity.
The work with academic, humanitarian, and community-focused partners extends beyond improving internet speeds; Ookla for Good aims to leave a lasting impact on communities worldwide.
Interested in working with Ookla for Good? Visit our website to learn more and get in touch with our team.
Ookla retains ownership of this article including all of the intellectual property rights, data, content graphs and analysis. This article may not be quoted, reproduced, distributed or published for any commercial purpose without prior consent. Members of the press and others using the findings in this article for non-commercial purposes are welcome to publicly share and link to report information with attribution to Ookla.