| December 20, 2021

Growing and Slowing: The State of 5G Worldwide in 2021


5G continues to offer new and exciting ways of rethinking everything from streaming video to performing remote surgery. However, not everyone shares equally in these possibilities as many countries do not have access to 5G and even those that do, do not experience the same level of performance from their 5G connections. We examined Speedtest Intelligence® data from Q3 2021 Speedtest® results to see how 5G speeds have changed, where download speeds are the fastest at the country and capital level, where 5G deployments have increased and what worldwide 5G Availability looked like in Q3 2021. We also looked at countries that don’t yet have 5G to understand where consumers are seeing improvements in 4G access.

5G slowed down at the global level
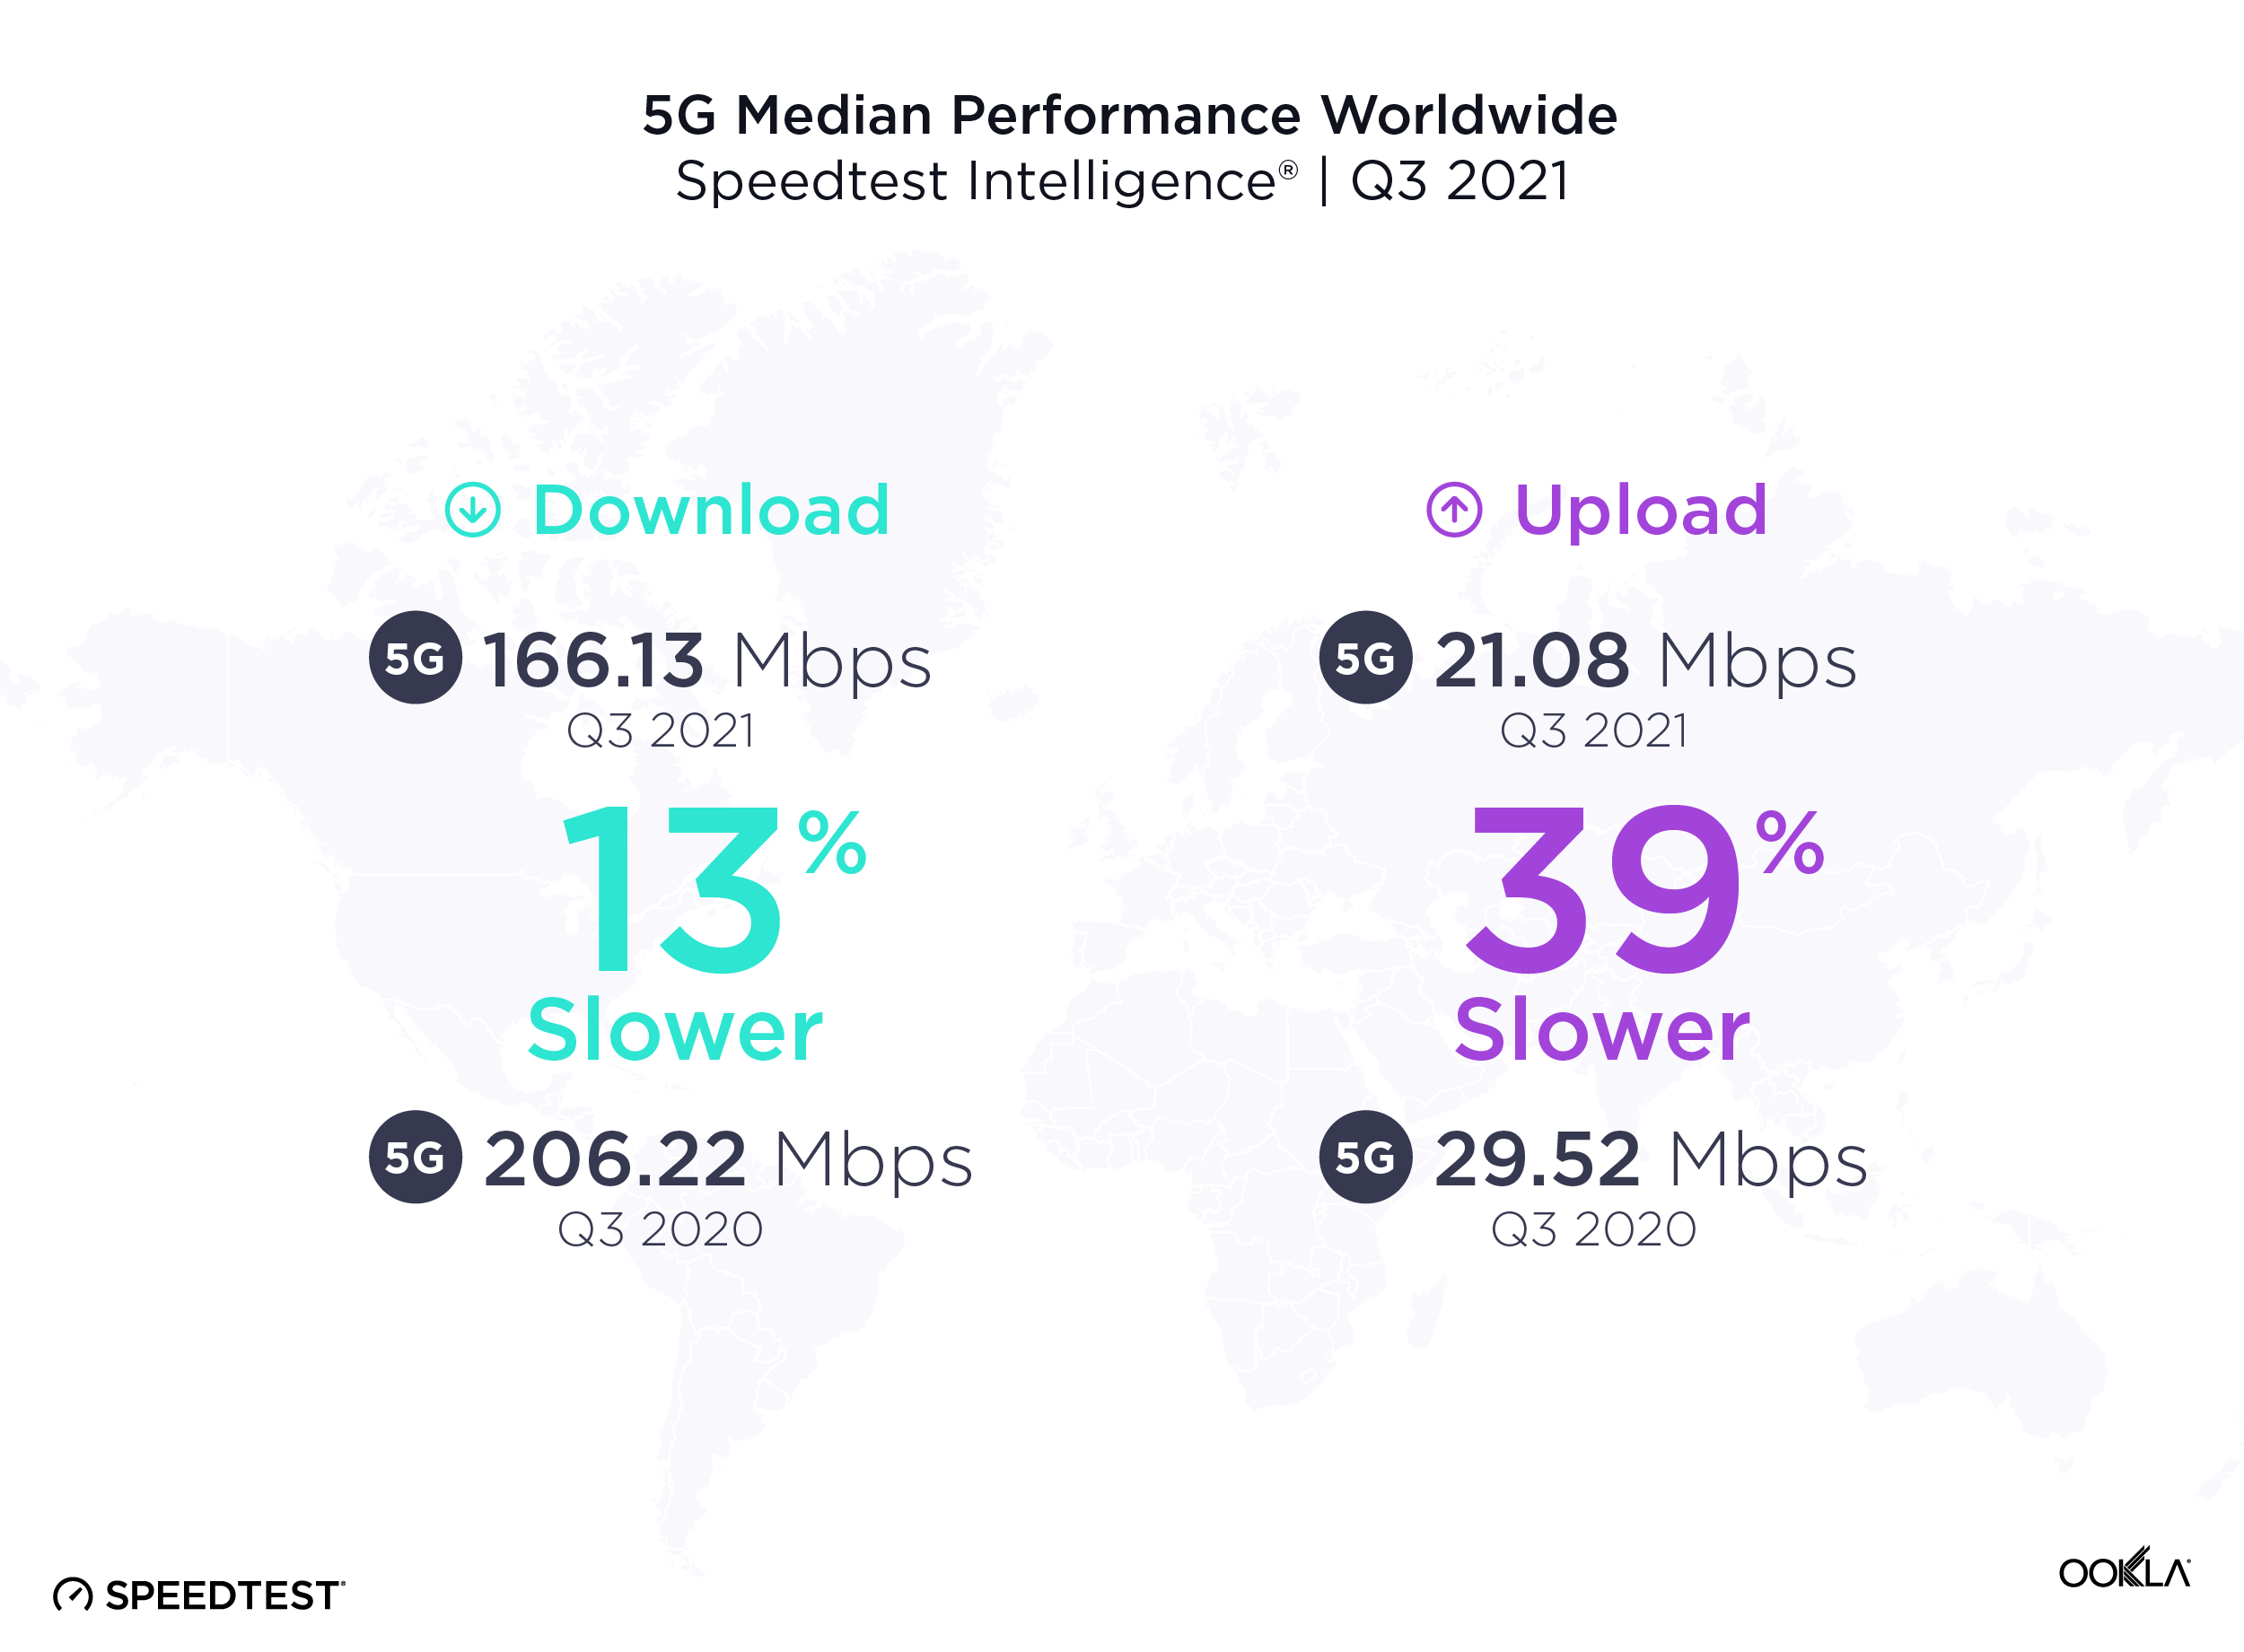
Median-Speeds-Worldwide_1221-01

It’s common to see new mobile access technologies slow down as adoption scales, particularly early on in the tech cycle. Over the past year from Q3 2020 to Q3 2021, the median global 5G download speed fell to 166.13 Mbps, down from 206.22 Mbps in Q3 2020. Median upload speed over 5G also slowed to 21.08 Mbps (from 29.52 Mbps) during the same period.

More users are logging on to existing 5G networks, and we’re also at the stage in the evolution of 5G where countries that have historically had slower speeds are starting to offer 5G. In addition, the widespread use of dynamic spectrum sharing that has been used to boost early 5G coverage weighs on 5G download speeds. While the dip in speeds looks like a letdown, it’s more of a compromise to enable broader access. With additional spectrum and further deployments slated for 2022, we anticipate speeds will begin to pick up again.

South Korea had the fastest 5G in the world

ookla_5g-download_performance_countries_1221-01-1

South Korea had the fastest median download speed over 5G during Q3 2021, leading a top 10 list that included Norway, United Arab Emirates, Saudi Arabia, Qatar, Kuwait, Sweden, China, Taiwan and New Zealand. Sweden, China, Taiwan and New Zealand were new to the top 10 in 2021 while South Africa (whose 5G was brand new last year), Spain and Hungary fell out of the top 10.

5G expanded to 13 additional countries

ookla_5G-map_1221-01

According to the Ookla® 5G Map, there were 5G deployments in 112 countries as of November 30, 2021. That’s up from 99 countries on the same date a year ago. The total number of deployments increased dramatically during the same time period with 85,602 deployments on November 30, 2021 compared to 17,428 on November 30, 2020, highlighting the degree to which 5G networks scaled during the year. Note that there are often multiple deployments in a given city.

Seoul and Oslo lead world capitals for 5G
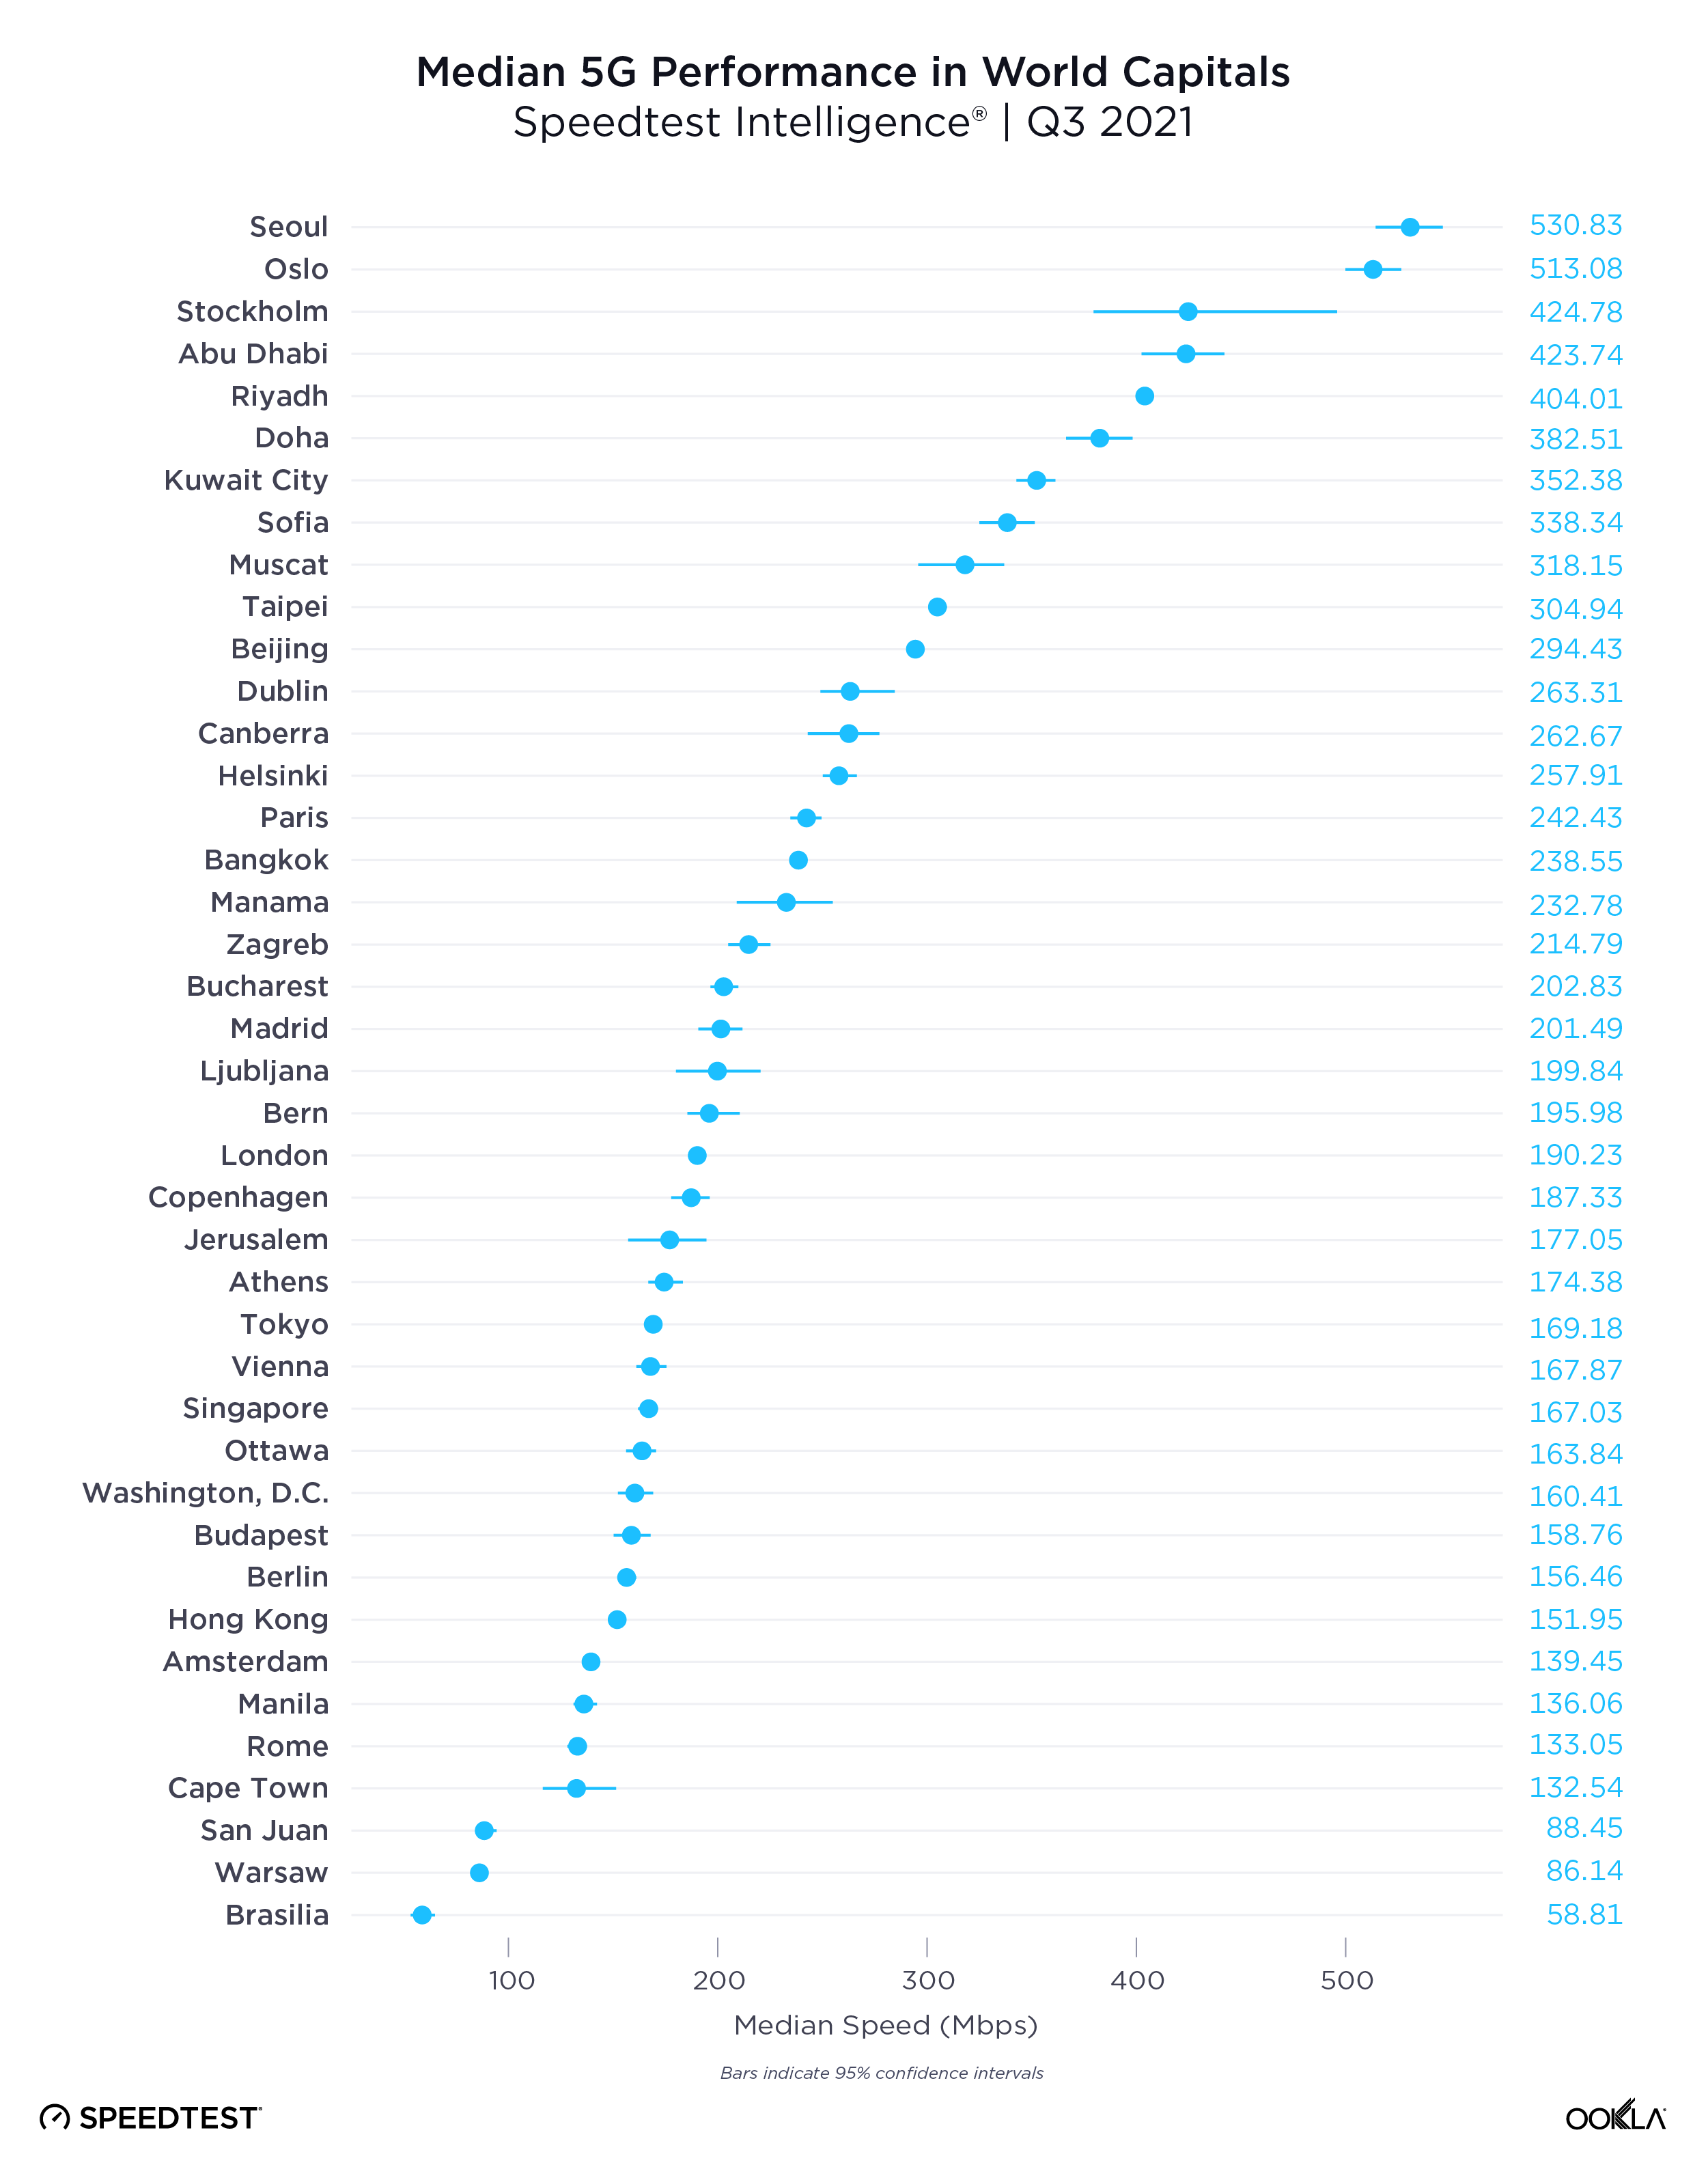
ookla_5g-download_performance_capitals_1221-01

Speedtest Intelligence data from Q3 2021 shows a wide range of median 5G speeds among global capitals. Seoul, South Korea and Oslo, Norway were in the lead with 530.83 Mbps and 513.08 Mbps, respectively; Abu Dhabi, United Arab Emirates; Riyadh, Saudi Arabia and Doha Qatar followed. Brasilia, Brazil had the slowest median download speed over 5G on our list, followed by Warsaw, Poland; Cape Town, South Africa and Rome, Italy. Stockholm, Sweden and Oslo, Norway had some of the the fastest median upload speeds over 5G at 56.26 Mbps and 49.95 Mbps, respectively, while Cape Town had the slowest at 14.53 Mbps.

The U.S. had the highest 5G Availability

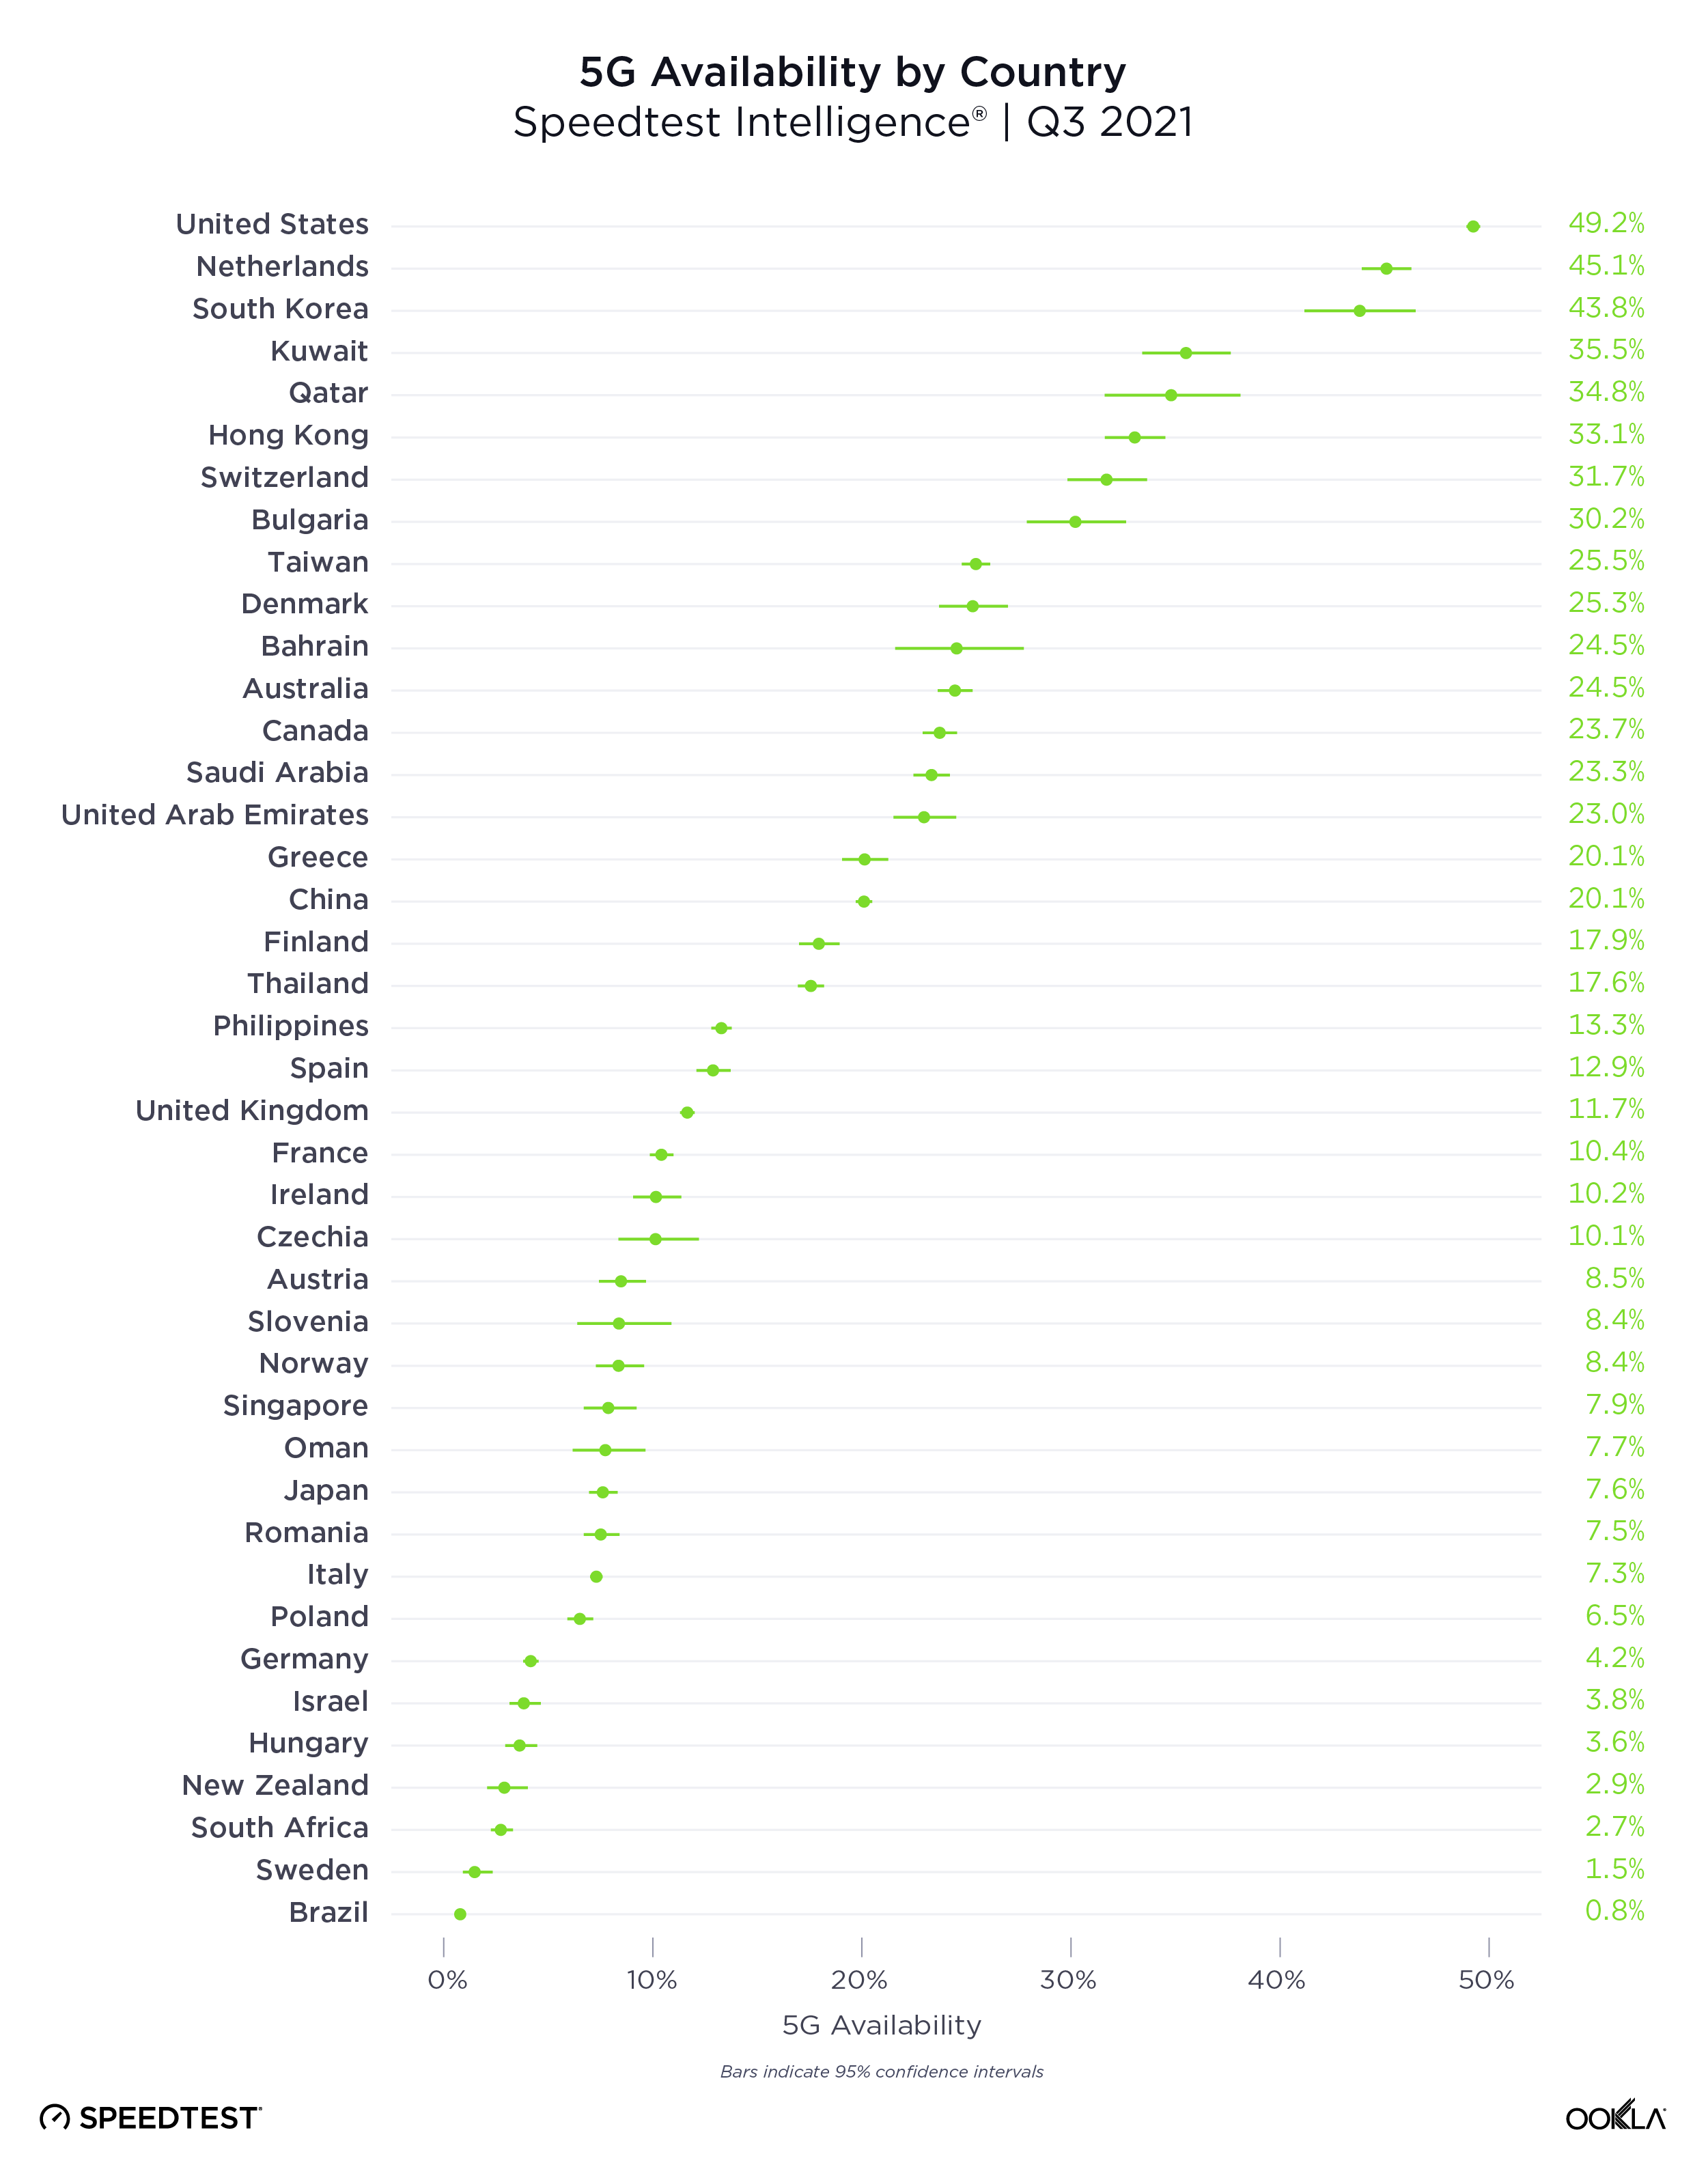
The presence of 5G is only one indicator in a market, because even in markets where 5G has launched, coverage and adoption can be pretty low. We analyzed 5G Availability to see what percent of users on 5G-capable devices spent the majority of their time on 5G, both roaming and on-network during Q3 2021.
ookla_5g-availability_countries_1221-01

The United States had the highest 5G Availability at 49.2%, followed by the Netherlands (45.1%), South Korea (43.8%), Kuwait (35.5%) and Qatar (34.8%). Brazil had the lowest 5G Availability on our list at 0.8%, followed by Sweden (1.5%), South Africa (2.7%), New Zealand (2.9%) and Hungary (3.6%).

Not all 5G networks are created equal

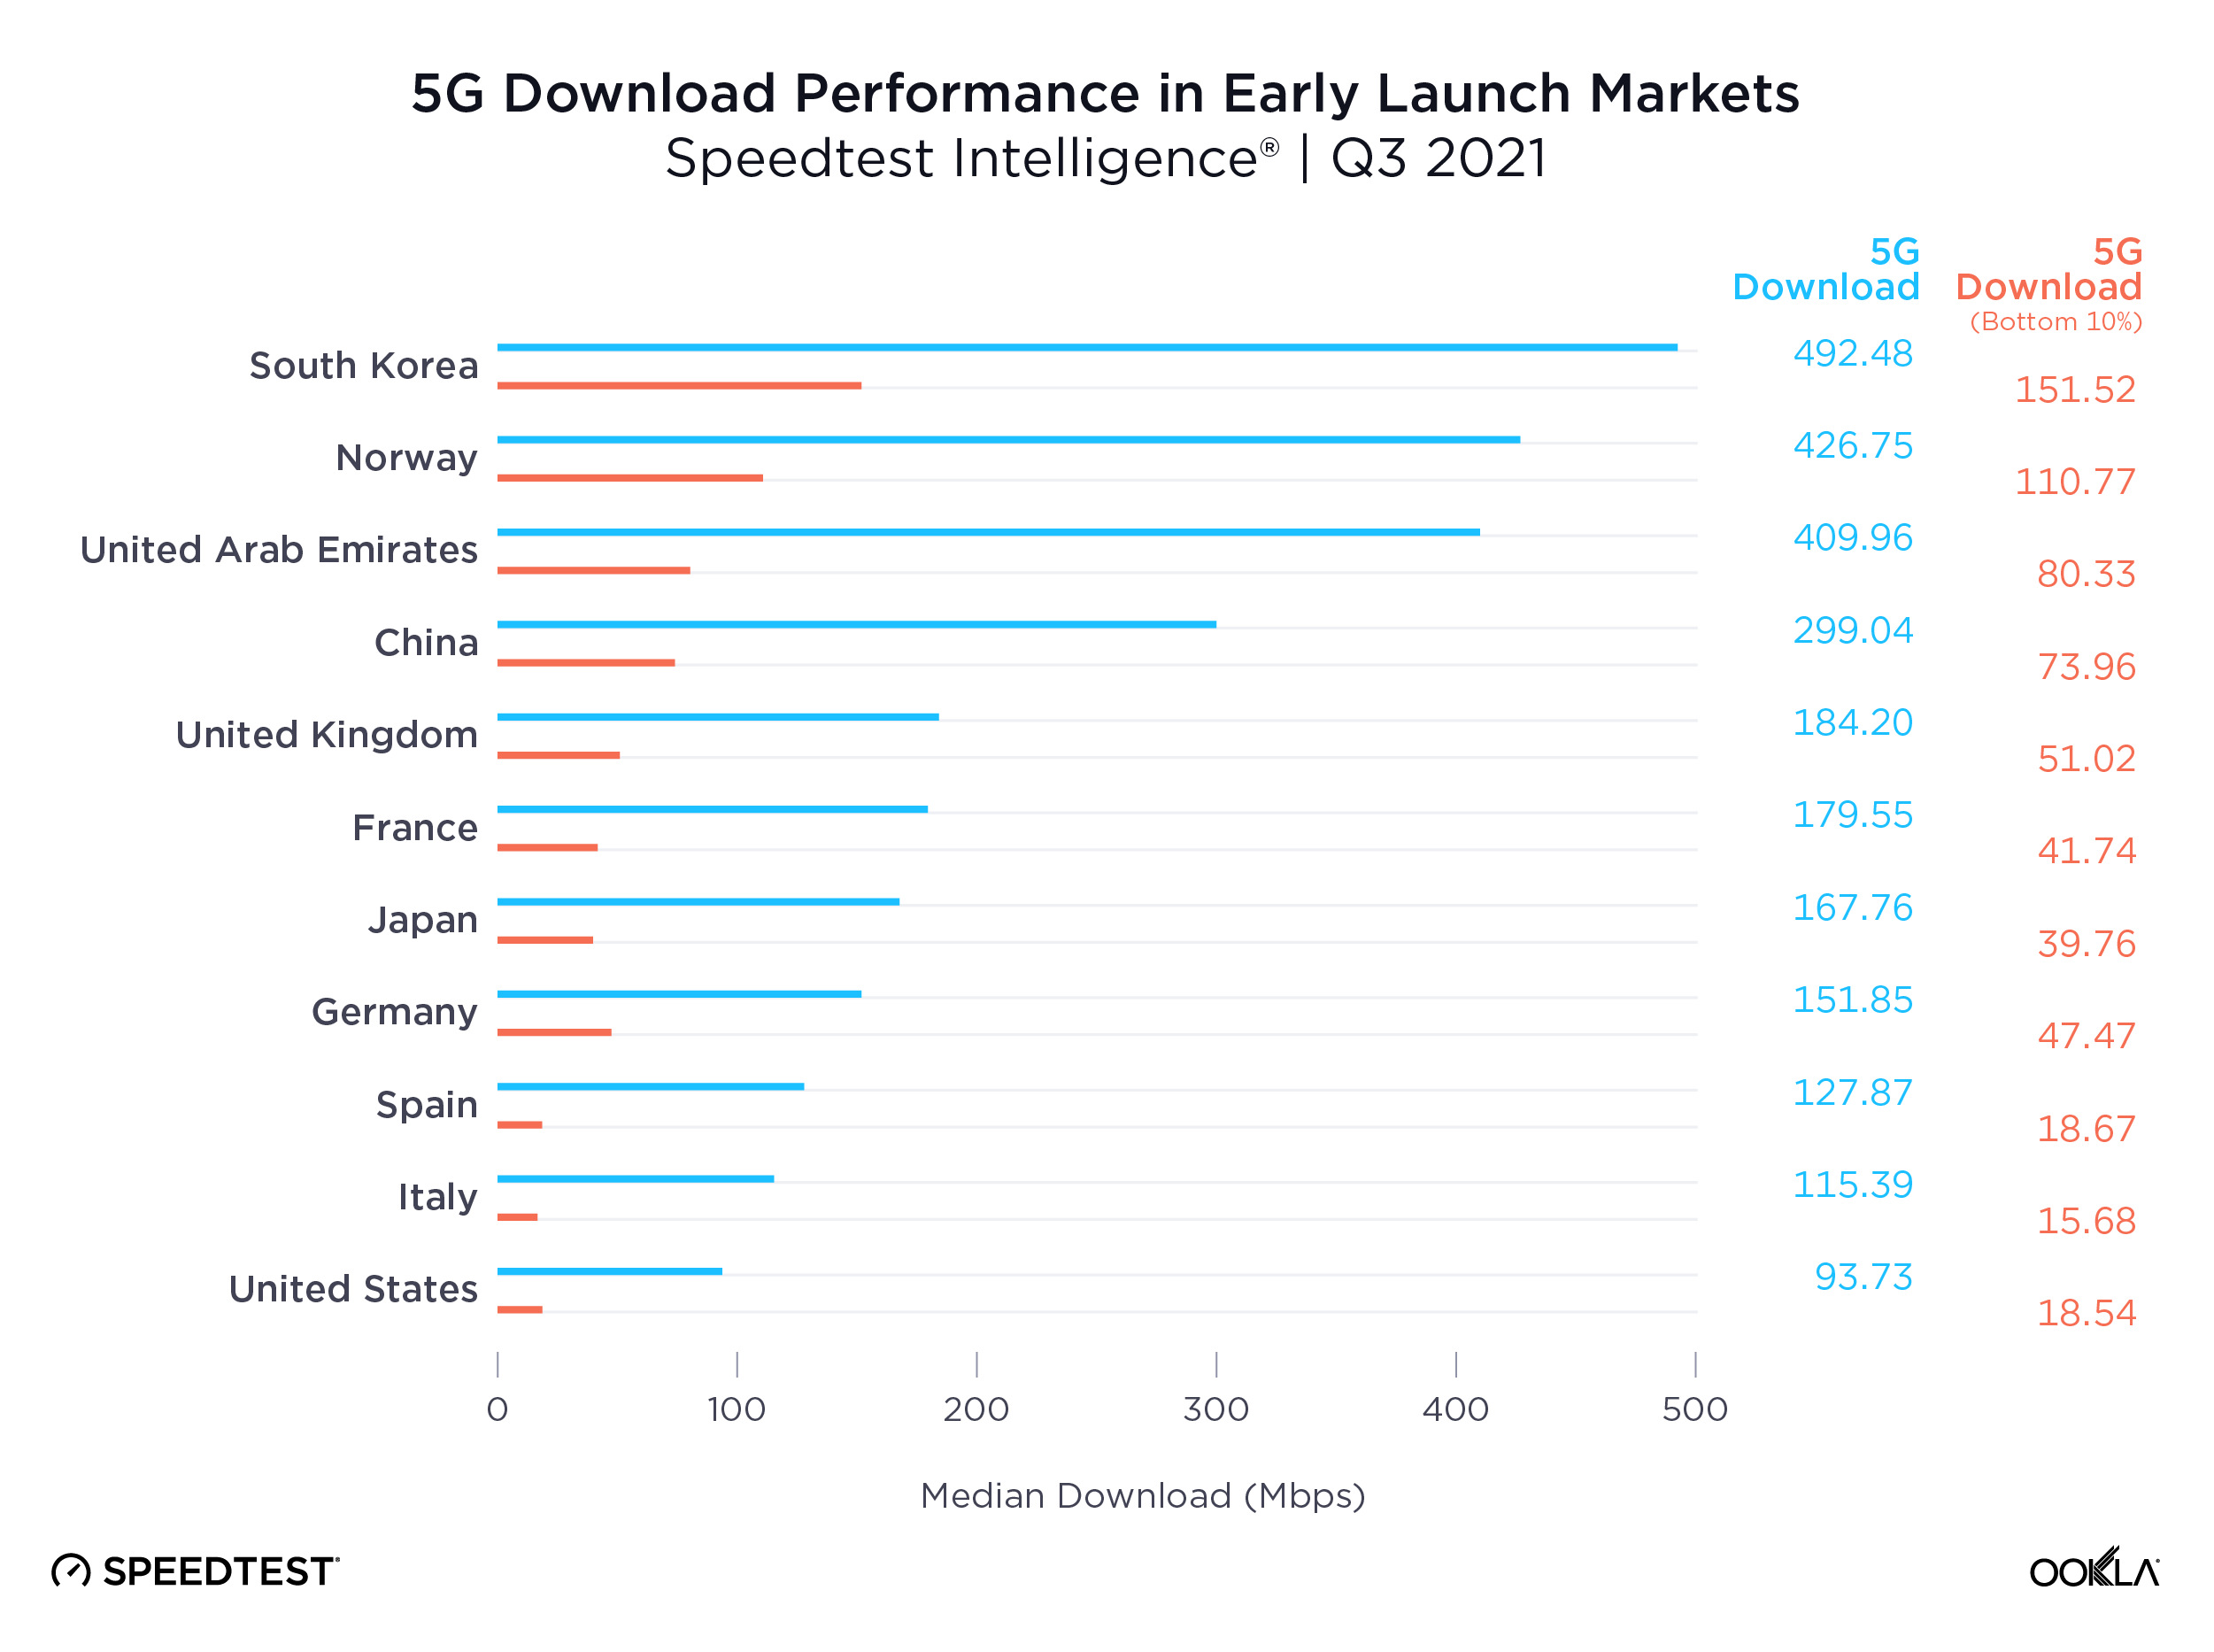
Ookla Speedtest Intelligence data shows a growing disparity in the performance of 5G networks worldwide, even among the pioneer markets who were among the first to launch the new technology. We see leading markets such as South Korea, Norway, the UAE and China pulling well ahead of key European markets, the U.S. and Japan on 5G download speeds, creating what increasingly looks like two tiers of 5G markets.
ookla_5g-download_performance_1221-01

Part of the reason for this divergence is access to key 5G spectrum bands, with Verizon and AT&T in the U.S. for example, soon to deploy their C-band spectrum holdings for 5G use. However, what really seems to separate these markets is the level of 5G network densification. The number of people per 5G base station ranges from 319 in South Korea and 1,531 in China, to 4,224 in the EU and 6,590 in the US, according to the European 5G Observatory’s International Scoreboard during October 2021.

Despite the noise around 6G, 5G still has a long way to run

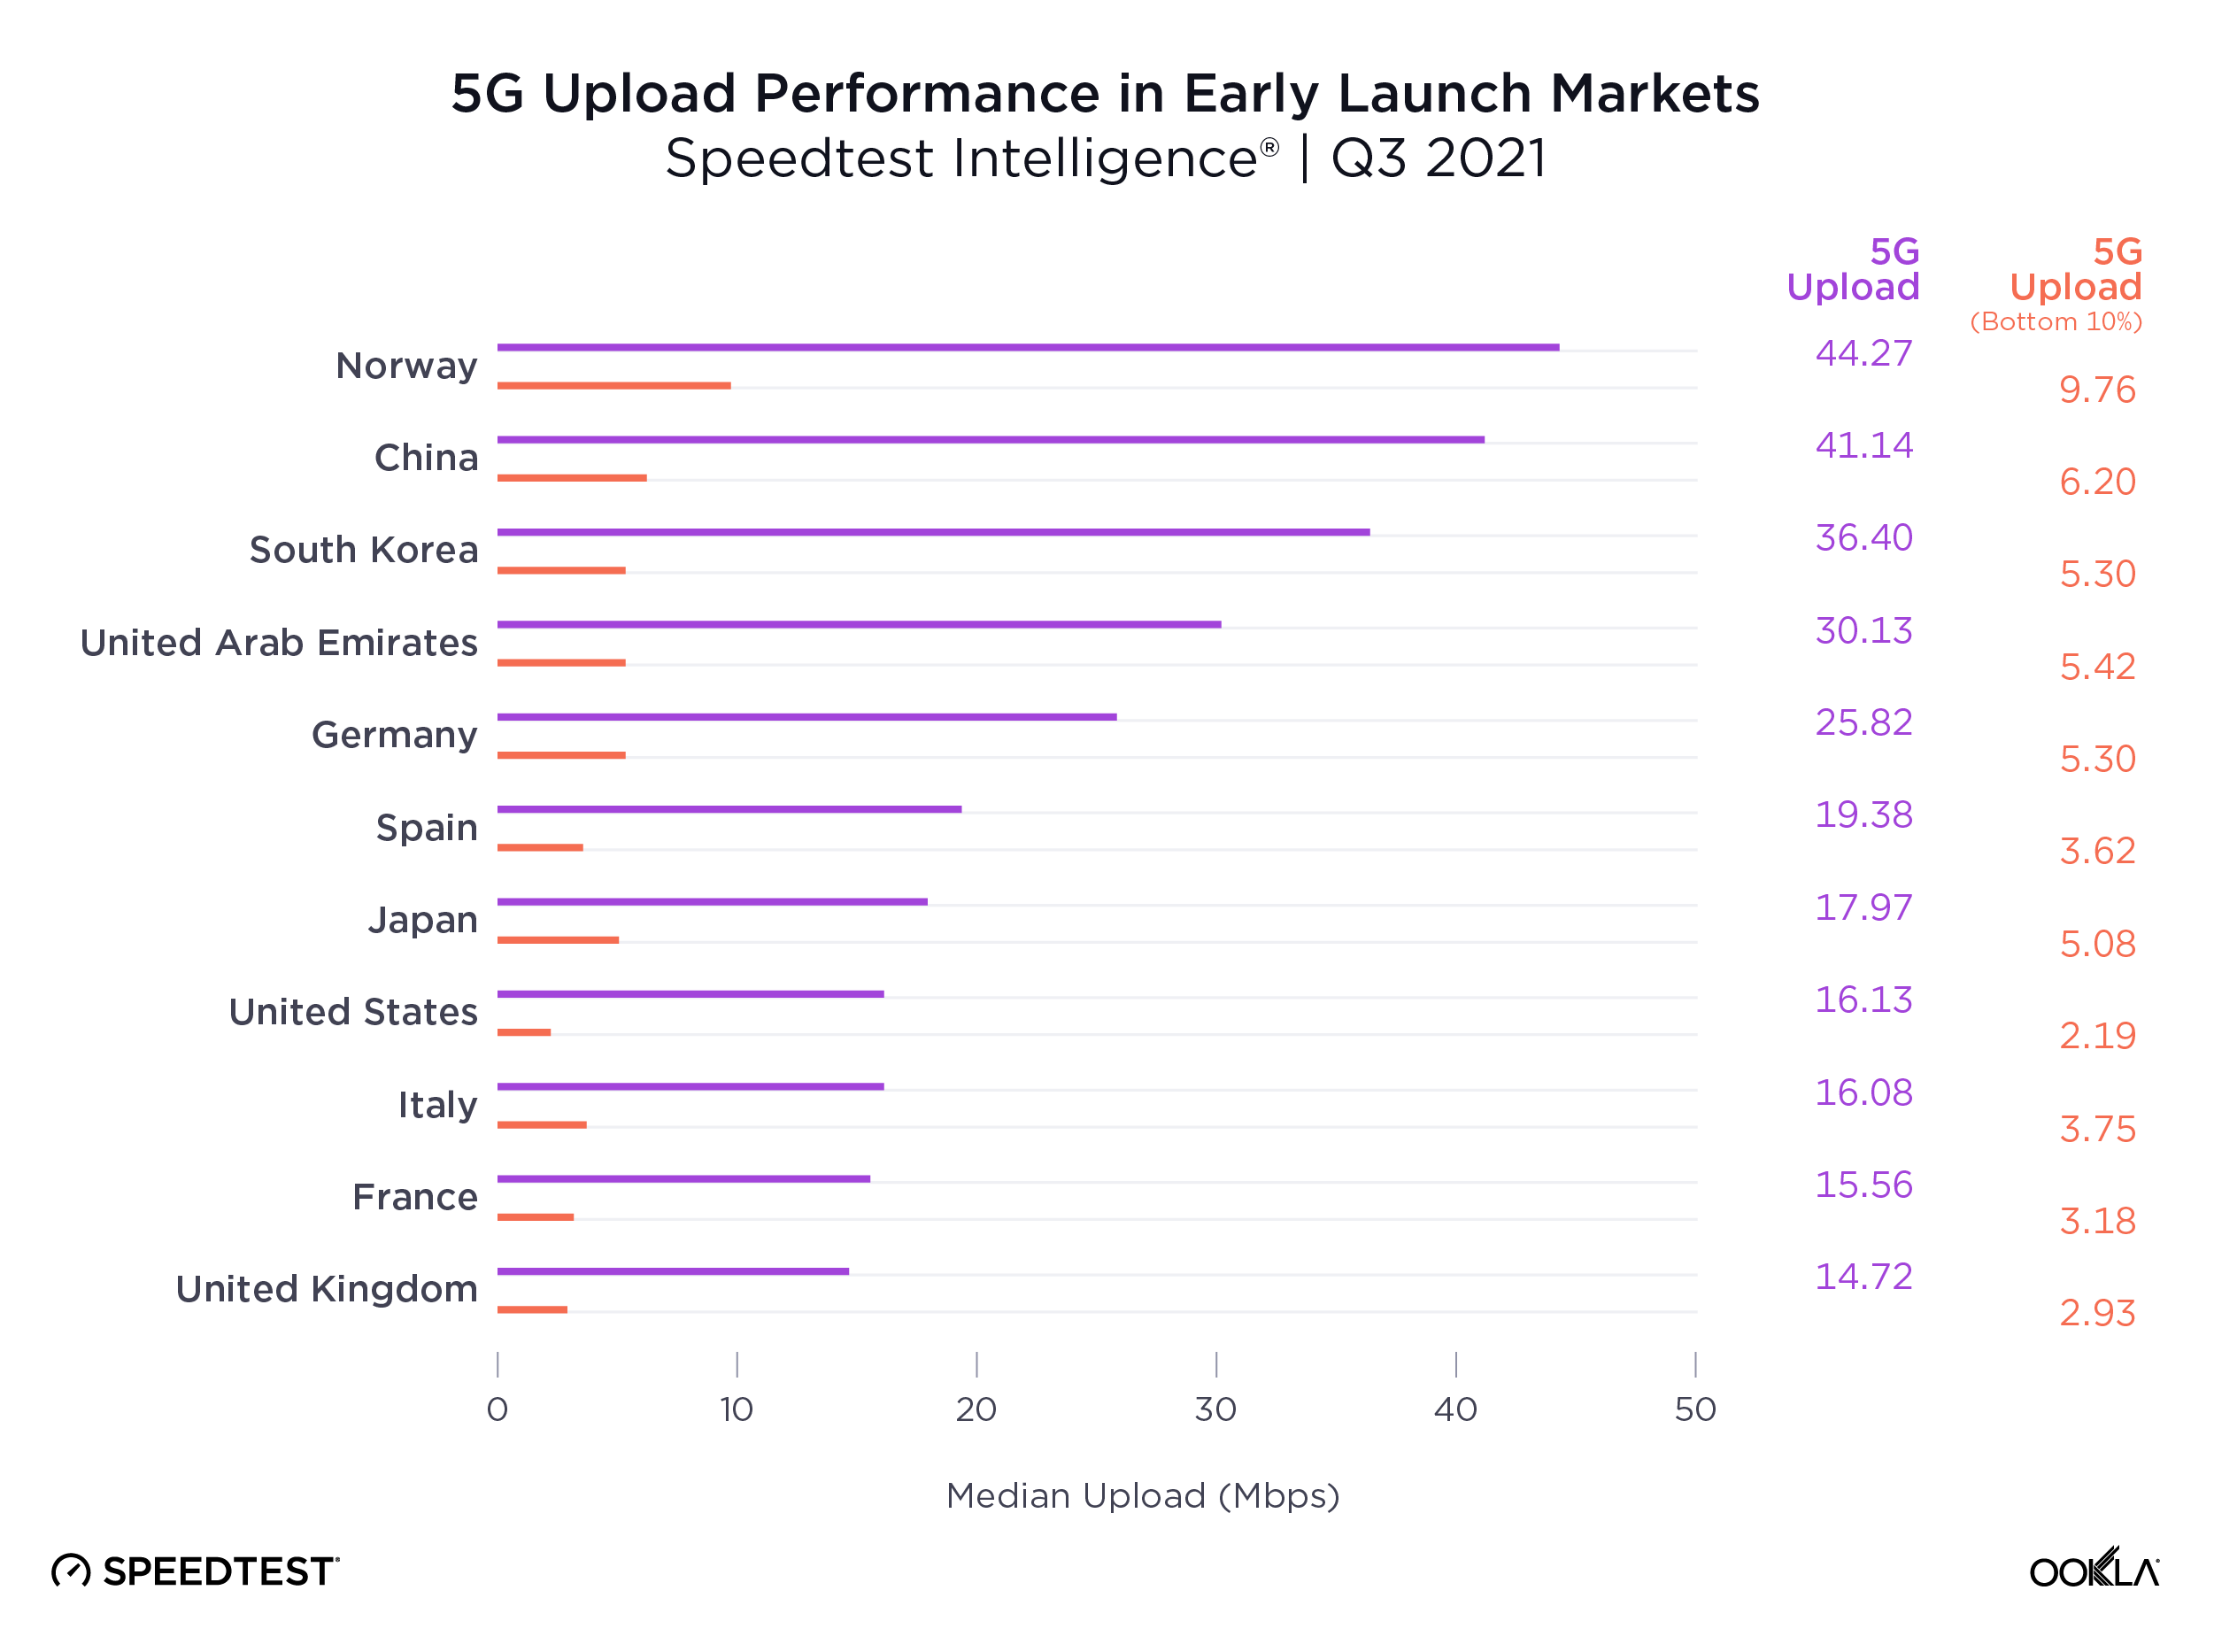
Median 5G mobile download speeds across these markets are respectable relative to the International Telecommunication Union’s (ITU) IMT-2020 target of 100 Mbps for user experienced download data rates. However, 5G Speedtest® results in each market demonstrate significant variability, with the bottom 10th percentile only recording speeds in excess of the IMT-2020 target in South Korea and Norway, and falling significantly short in many other markets, with Spain, Italy and the U.S. below 20 Mbps.

The story gets worse for upload speeds, where no market’s median speed broke the IMT-2020 recommended 50 Mbps, and where the bottom 10th percentile lay in single digits across the board. Operators are clearly prioritizing download speeds over upload, which makes sense given the asymmetric nature of demand, with most consumer applications requiring higher download speeds. However, as operators increasingly look to target the enterprise market with 5G connectivity and consumer demand for services such as video calling and mobile gaming continues to rise, operators will need to boost upload speeds.
ookla_5g-upload_performance_1221-01-1

Demand for mobile internet bandwidth continues to grow, up 43% year-on-year in Q3 2021 according to Ericsson’s latest mobility report. Looking ahead to 2022, operators will need to increase the capacity of their 5G networks to tackle this growing demand while driving network speeds to new heights. We’ve seen the impact the deployment of new spectrum can have on congested networks during 2021, with Reliance Jio witnessing a bump in 4G LTE performance and consumer sentiment following its acquisition of additional spectrum in India.

Where 5G still fails to reach

Speedtest Intelligence showed 70 countries in the world where more than 20% of samples were from 2G and 3G connections (combined) during Q3 2021 and met our statistical threshold to be included. These are mostly countries where 5G is still aspirational for a majority of the population. As excited as we are about the expansion of 5G, we do not want to see these countries left behind. Not only are 2G and 3G decades old, they are only sufficient for basic voice and texting, social media and navigation apps. To deliver rich media experiences or video calling, users need access to 4G or higher. Having so many consumers on 2G and 3G also prevents mobile operators from refarming that spectrum to make 4G and 5G networks more efficient.

Countries That Still Rely Heavily on 2G and 3G Connections
Speedtest IntelligenceⓇ | Q3 2021
Country 2G & 3G Samples
Central African Republic 89.9%
Palestine 84.7%
Yemen 72.4%
Turkmenistan 71.8%
Micronesia 56.3%
Madagascar 55.0%
Belarus 53.2%
Rwanda 51.7%
Kiribati 48.4%
Equatorial Guinea 47.6%
Afghanistan 44.4%
South Sudan 43.4%
Guyana 42.3%
Guinea 37.0%
Angola 36.8%
Cape Verde 35.9%
Tajikistan 35.6%
Zimbabwe 34.7%
Benin 34.4%
Togo 33.8%
Ghana 33.0%
Sierra Leone 31.7%
Antigua and Barbuda 30.2%
Vanuatu 30.1%
Lesotho 30.0%
Syria 29.6%
Moldova 29.4%
Saint Kitts and Nevis 28.9%
Mozambique 28.8%
Sudan 28.4%
Palau 28.3%
Grenada 28.1%
Tanzania 27.6%
Uganda 27.5%
Niger 27.5%
Gabon 27.5%
Haiti 27.4%
Suriname 27.4%
Tonga 27.3%
Liberia 27.0%
Namibia 26.7%
Swaziland 26.5%
The Gambia 26.3%
Saint Vincent and the Grenadines 26.3%
Dominica 26.3%
Somalia 26.1%
Cook Islands 26.0%
Zambia 25.9%
Barbados 25.7%
Armenia 25.5%
Algeria 25.4%
Papua New Guinea 25.2%
Jamaica 24.5%
Venezuela 24.2%
Ethiopia 24.1%
Uzbekistan 24.0%
El Salvador 23.5%
Honduras 23.1%
Nigeria 23.0%
Solomon Islands 22.8%
Caribbean Netherlands 22.7%
Botswana 22.3%
Anguilla 21.7%
Mauritania 20.6%
Saint Lucia 20.5%
Bosnia and Herzegovina 20.3%
Burundi 20.3%
Ecuador 20.2%
Ukraine 20.1%
Trinidad and Tobago 20.0%

We were pleased to see the following countries come off the list from last year, having dropped below the 20% threshold: Azerbaijan, Bangladesh, Belize, Burkina Faso, Cameroon, Costa Rica, Côte d’Ivoire, DR Congo, Iraq, Kenya, Laos, Libya, Maldives, Mali, Mauritius, Mongolia, Nicaragua, Paraguay and Tunisia. While countries like Palestine, Suriname, Ethiopia, Haiti and Antigua and Barbuda are still on this list, they have improved the percentage of their samples on these outmoded technologies when compared to last year (dropping 10-15 points, respectively), 2G and 3G samples in Belarus increased 6.7 points when comparing Q3 2021 to Q3 2020.

We’re excited to see how performance levels will normalize as 5G expands to more and more countries and access improves. Keep track of how well your country is performing on Ookla’s Speedtest Global Index.

Ookla retains ownership of this article including all of the intellectual property rights, data, content graphs and analysis. This article may not be quoted, reproduced, distributed or published for any commercial purpose without prior consent. Members of the press and others using the findings in this article for non-commercial purposes are welcome to publicly share and link to report information with attribution to Ookla.
| December 18, 2022

Stable and Expanding: The State of Worldwide 5G in 2022


5G is no longer a new technology, however, consumers in many countries are still waiting to see the full benefits of 5G (or even to connect to 5G at all). We examined Speedtest Intelligence® data from Q3 2022 Speedtest® results to see how 5G performance has changed since last year, where download speeds are the fastest at the country level, and how satellite technologies are offering additional options to connect. We also looked at countries that don’t yet have 5G to understand where consumers are seeing improvements in 4G LTE access.

5G speeds were stable at the global level

Graphic of 5G median speed performance worldwide.

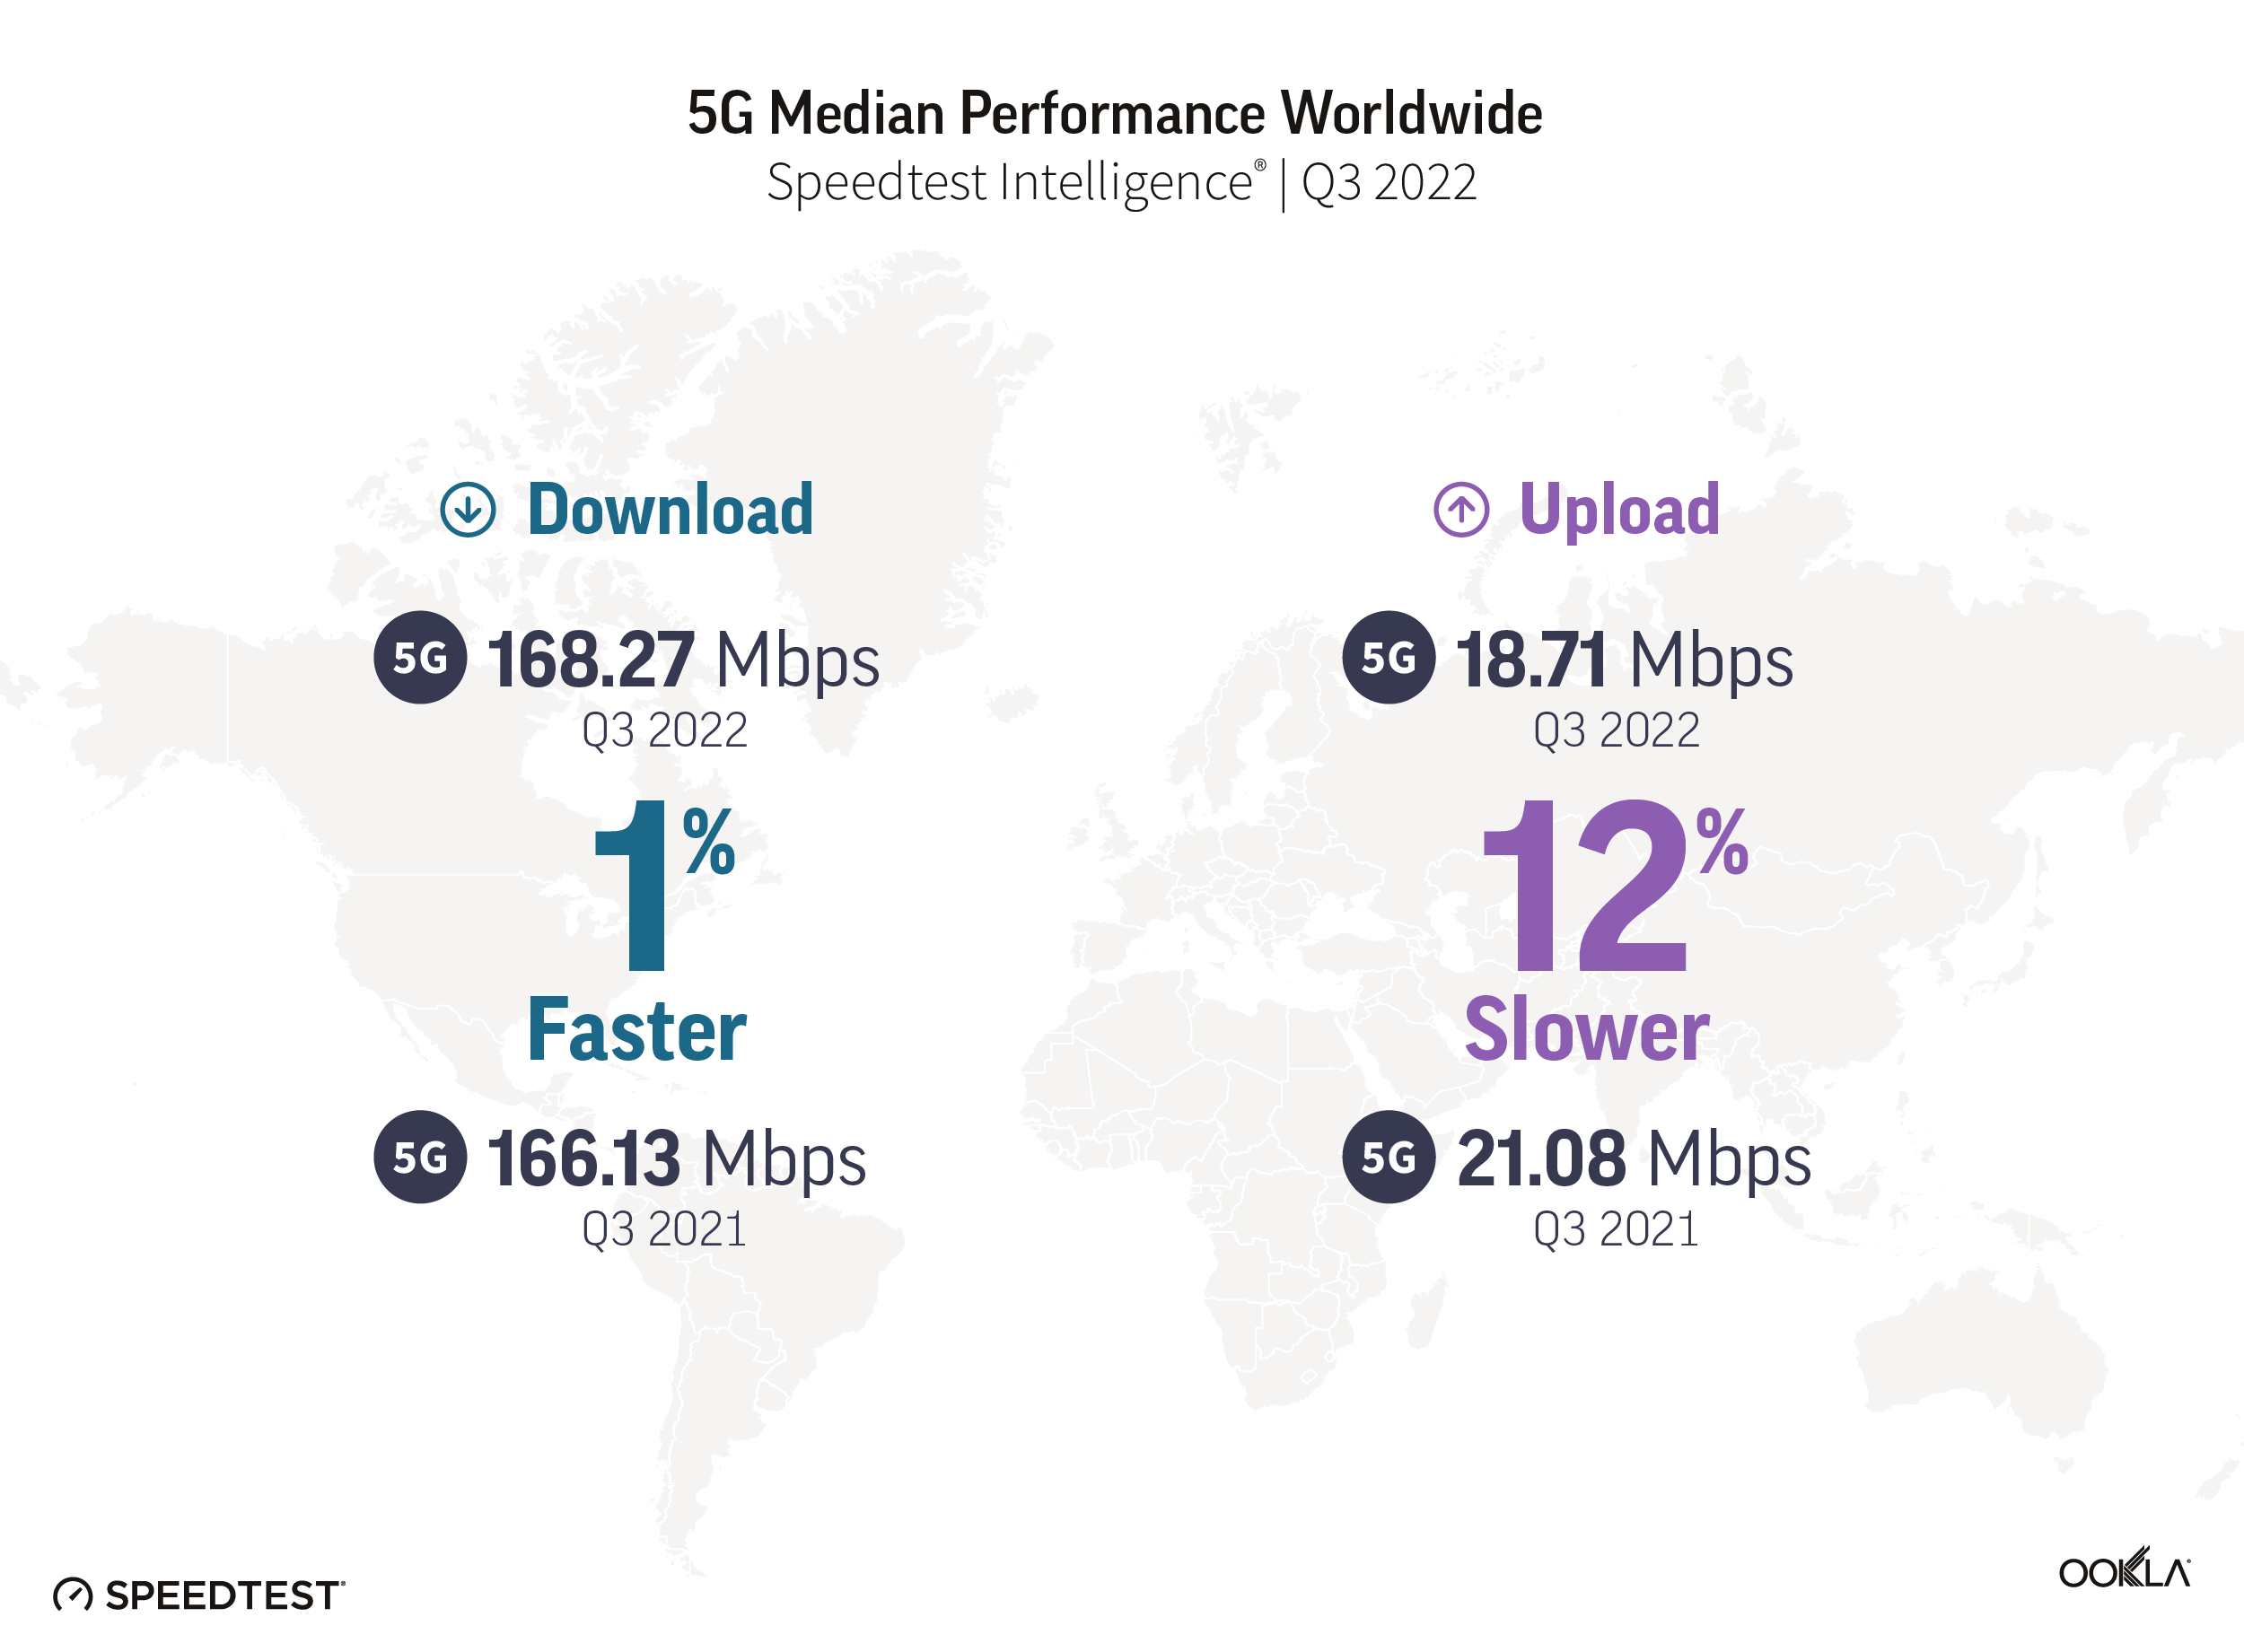
In 2021, we discussed how an expansion of 5G access led to a decline in overall speed at the global level. This year showed a stabilization in overall speed, even as 5G access broadened, with a median global 5G download speed of 168.27 Mbps in Q3 2022 as compared to 166.13 Mbps in Q3 2021. Median upload speed over 5G slowed slightly to 18.71 Mbps (from 21.08 Mbps) during the same period. According to the Ookla® 5G Map™, there were 127,509 5G deployments in 128 countries as of November 30, 2022, compared to 85,602 in 112 countries the year prior.

South Korea and the United Arab Emirates led countries for 5G speeds

Chart of fastest countries for median 5G download speed

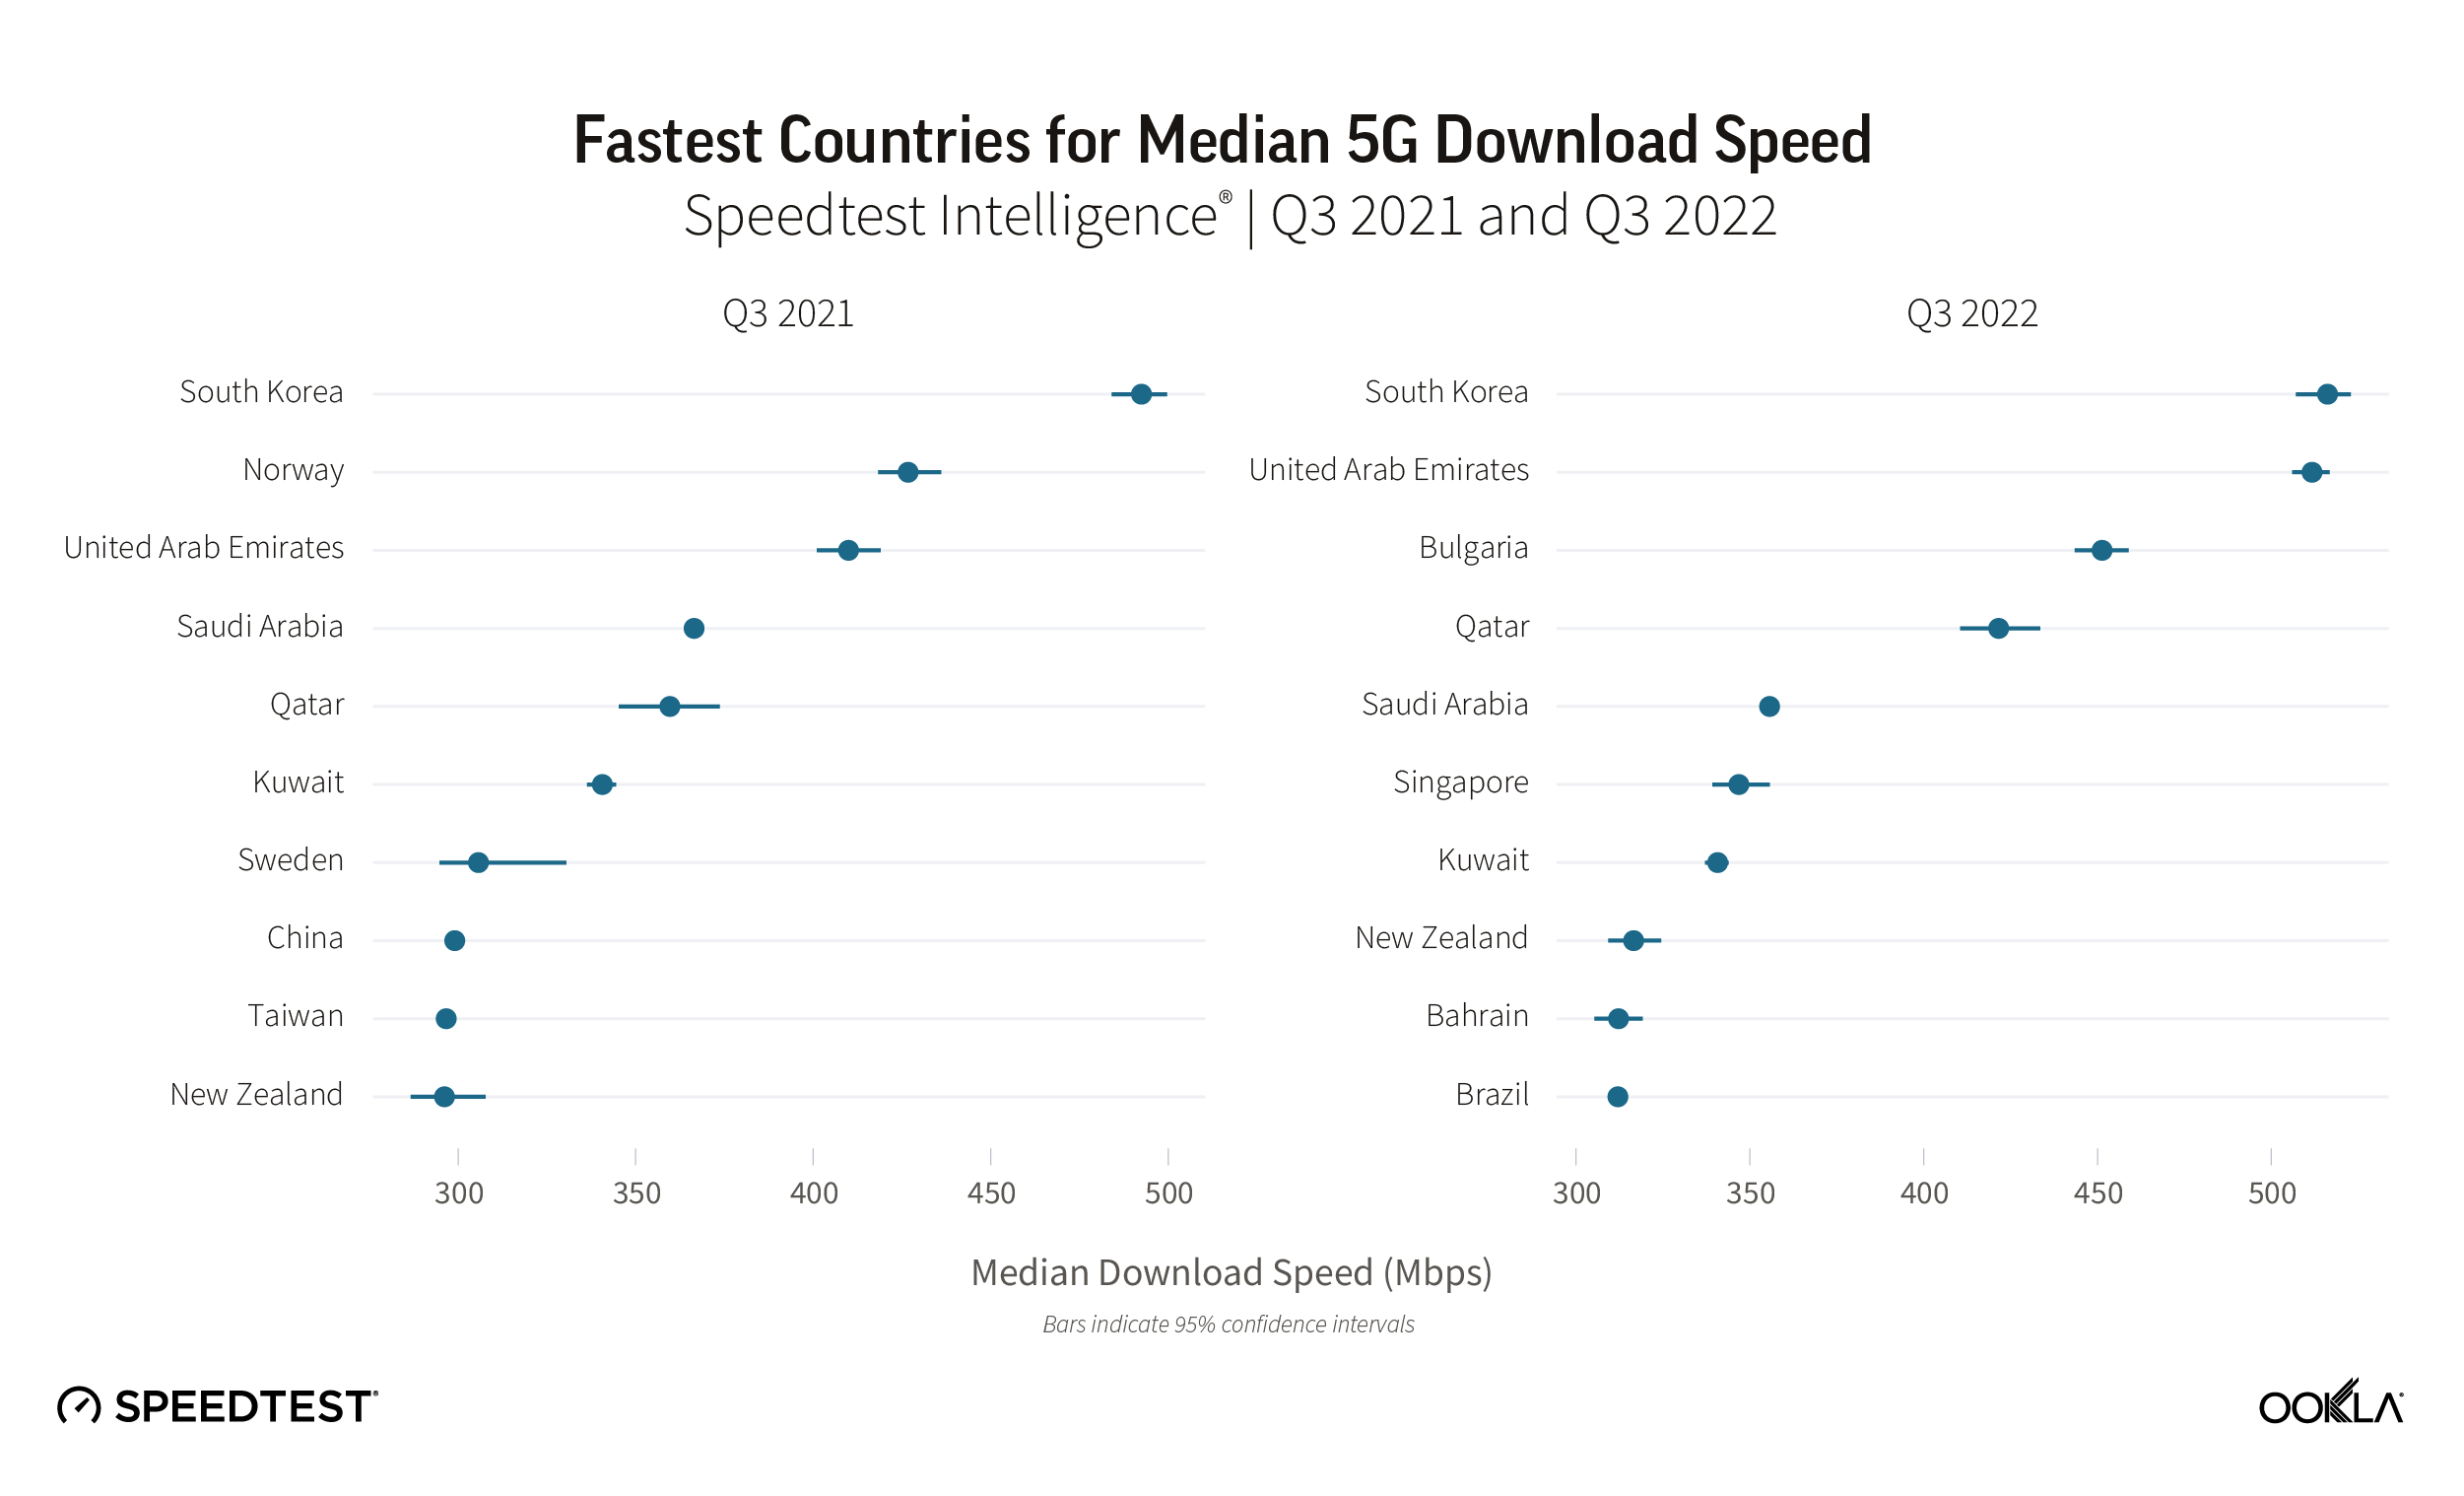
South Korea and the U.A.E. had the fastest median download speed over 5G at 516.15 Mbps and 511.70 Mbps, respectively, during Q3 2022, leading a top 10 list that included Bulgaria, Qatar, Saudi Arabia, Singapore, Kuwait, New Zealand, Bahrain, and Brazil. Bulgaria, Singapore, Bahrain, and Brazil were new to the top 10 in 2022, while Norway, Sweden, China, and Taiwan fell out of the top 10.

Satellite became more accessible but performance slowed

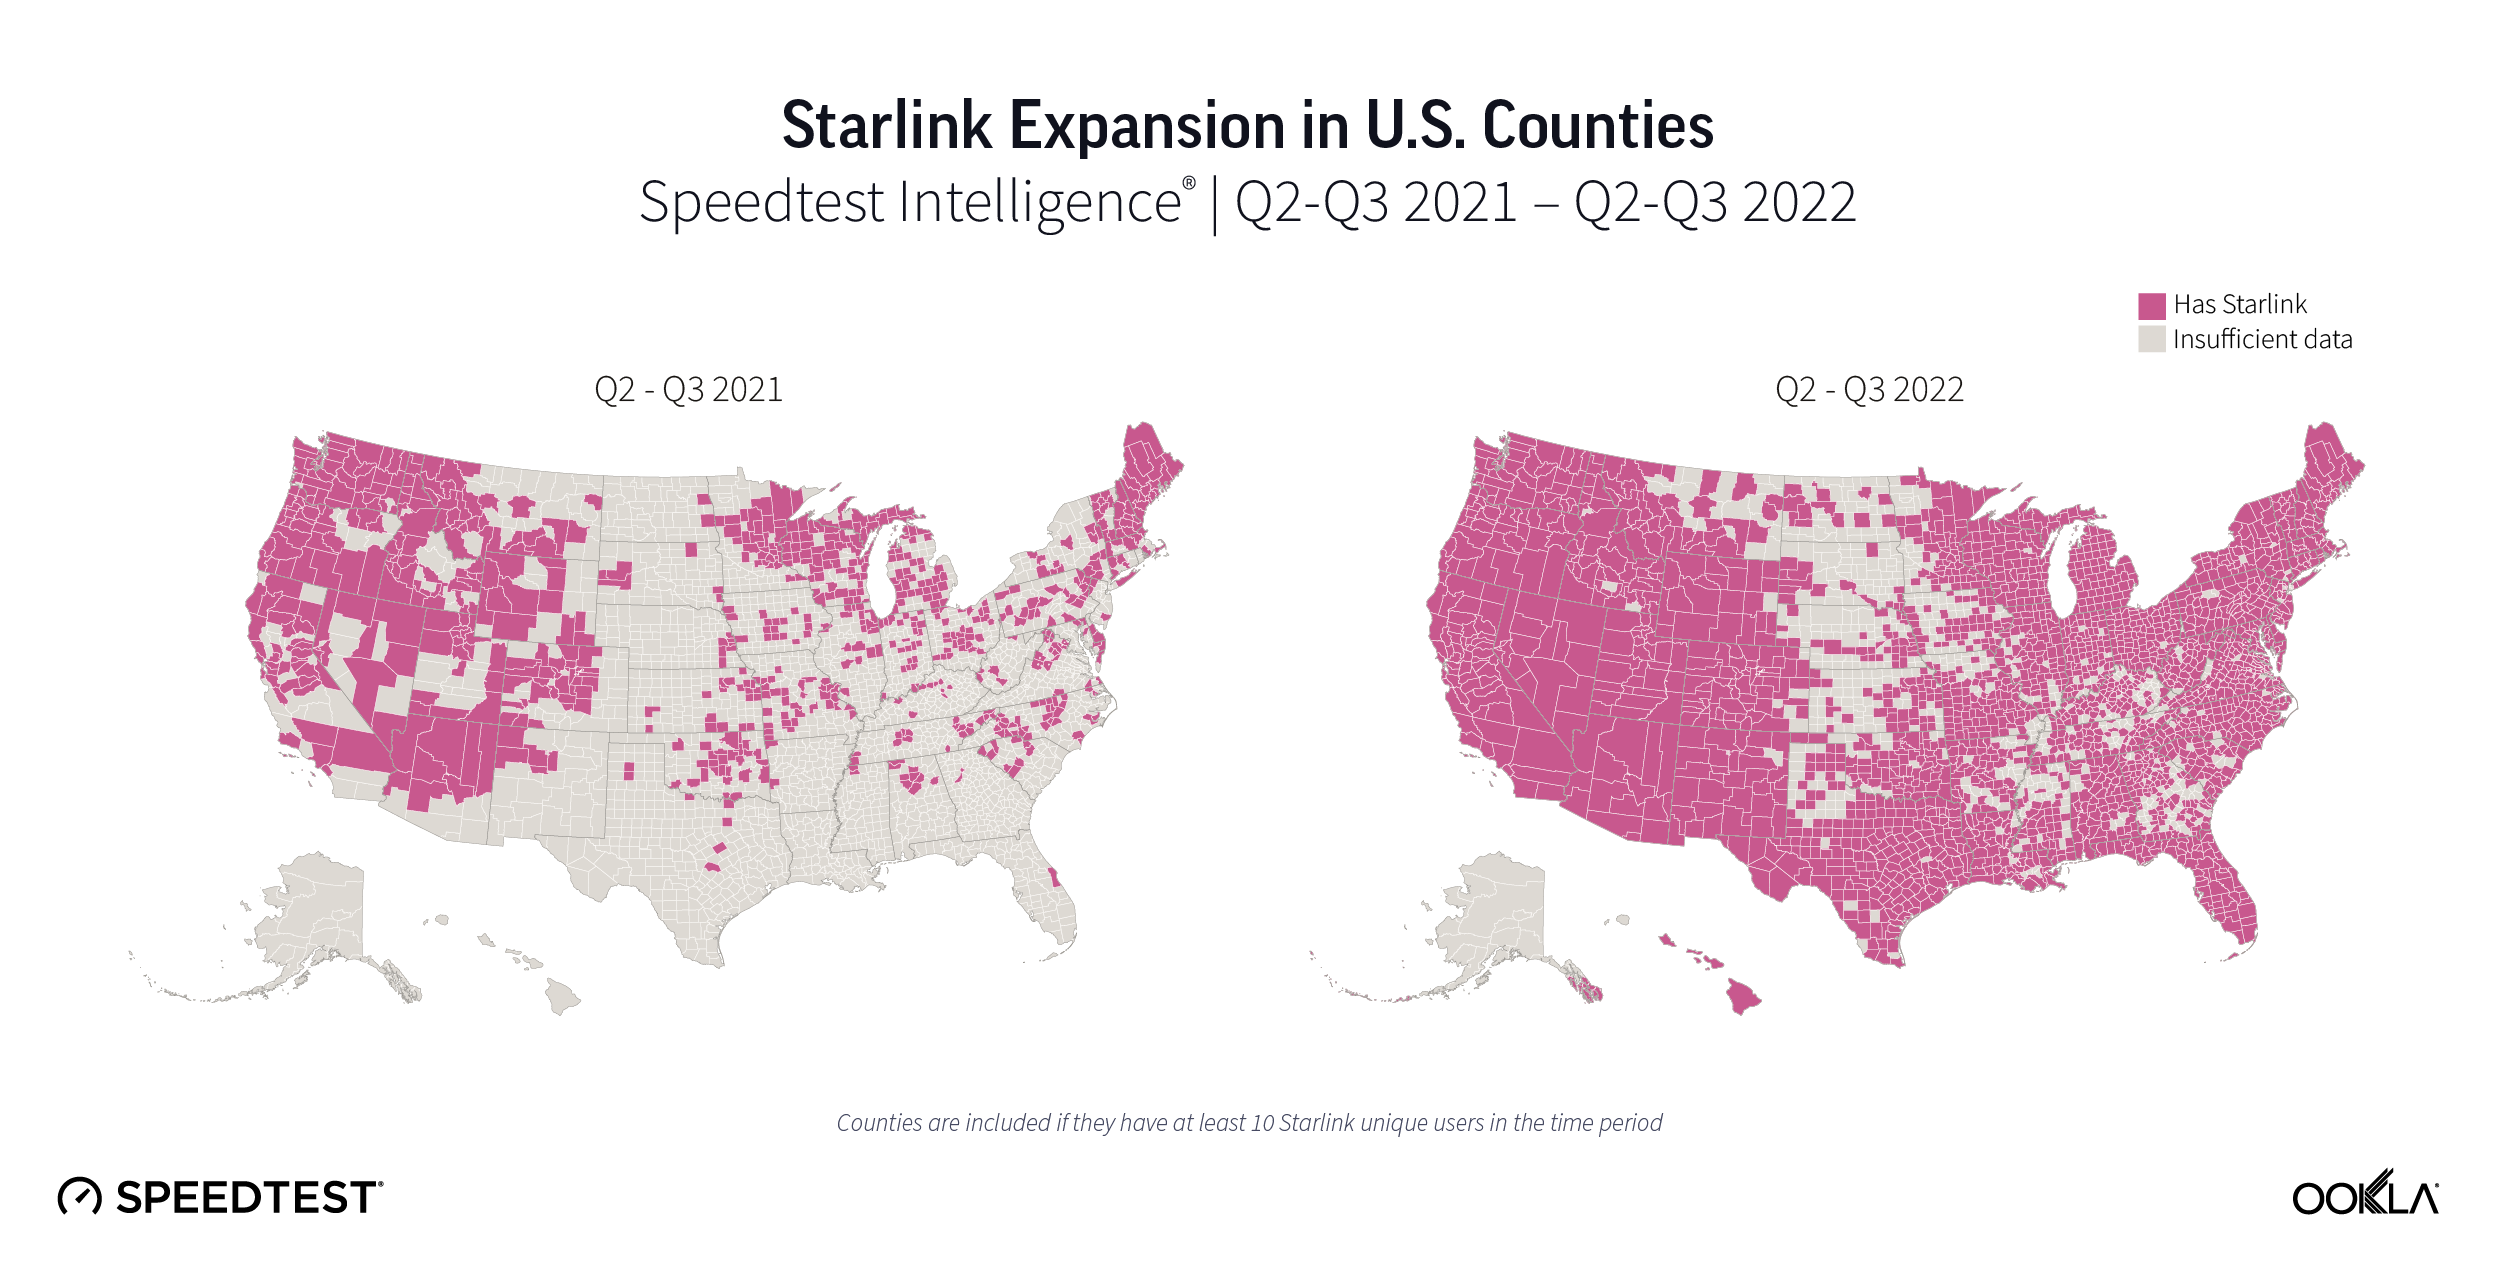
2022 saw a proliferation of fast, low-earth orbit (LEO) satellite internet from Starlink across the world. Q1 2022 saw Starlink speeds increase year over year in Canada and the U.S., with Starlink in Mexico having the fastest satellite internet in North America, Starlink in Lithuania the fastest in Europe, Starlink in Chile the fastest in South America, and Starlink in Australia the fastest in Oceania.

Q2 2022 saw Starlink speeds decrease in Canada, France, Germany, New Zealand, the U.K., and the U.S. from Q1 2022 as Starlink crossed the 400,000 user threshold across the world. Starlink in Puerto Rico debuted as the fastest satellite provider in North America. Starlink outperformed fixed broadband averages in 16 European countries. Starlink in Brazil had the fastest satellite speeds in South America. And Starlink in New Zealand was the fastest satellite provider in Oceania.

During Q3 2022, Starlink performance dipped once again from Q2 2022 in Canada and the U.S., while remaining about the same in Chile. Starlink in Puerto Rico and the U.S. Virgin Islands had the fastest satellite speeds in North America, while Starlink in Brazil again was the fastest satellite provider in South America.

With Viasat, HughesNet, and Project Kuiper set to launch huge LEO constellations in 2023, consumers around the world are poised to have more fast satellite internet options, particularly as the European Commission makes its own play for a constellation and Eutelsat and OneWeb potentially merging.

5G Availability points to on-going challenges

5G Availability measures the proportion of Speedtest users with 5G-capable handsets, who spend a majority of time connected to 5G networks. It’s therefore a function of 5G coverage and adoption. We see wide disparity in 5G Availability among markets worldwide, with for example the U.S. recording 54.3% in Q3 2022, well ahead of markets such as Sweden and the U.A.E., with 8.6% and 8.3% respectively.

Chart of 5G availability in select markets, based on users with 5G-capable handsets

Critical levers for mobile operators to increase 5G Availability include:

  • Increasing 5G coverage by deploying additional base stations
  • Obtaining access to, or refarming, sub-GHz spectrum, to help broaden 5G coverage, as sub-GHz spectrum has superior propagation properties than that of higher frequency spectrum bands.
  • Encouraging 5G adoption among users with 5G-capable handsets.

Speedtest Intelligence points to 5G adoption challenges in some markets, with 5G Availability dropping in Bulgaria, South Korea, the Netherlands, and the U.A.E. As more users acquire 5G-capable devices, operators need to balance their pricing models to ensure users have sufficient incentives to purchase a 5G tariff.

Chart of percentage change in 5G availability in select markets, based on users with 5G-capable handsets

Where 5G continues to fail to reach

Speedtest Intelligence showed 29 countries in the world where more than 20% of samples were from 2G and 3G connections (combined) during Q3 2022 and met our statistical threshold to be included (down from 70 in Q3 2021). These are mostly countries where 5G is still aspirational for a majority of the population, which is being left behind technologically, having to rely on decades-old technologies that are only sufficient for basic voice and texting, social media, and navigation apps. We’re glad to see so many countries fall off this list, but having so many consumers on 2G and 3G also prevents mobile operators from making 4G and 5G networks more efficient. If operators and regulators are able to work to upgrade their users to 4G and higher, everyone will benefit.

Countries That Still Rely Heavily on 2G and 3G Connections
Speedtest IntelligenceⓇ | Q3 2021
Country 2G & 3G Samples
Central African Republic 76.2%
Turkmenistan 58.5%
Kiribati 51.6%
Micronesia 47.4%
Rwanda 41.1%
Belarus 39.7%
Equatorial Guinea 37.7%
Afghanistan 36.7%
Palestine 33.5%
Madagascar 27.5%
Sudan 27.4%
Lesotho 26.5%
South Sudan 26.3%
Benin 26.0%
Guinea 25.5%
Cape Verde 24.3%
Tonga 24.3%
Syria 23.4%
The Gambia 23.4%
Ghana 23.3%
Palau 22.9%
Niger 22.8%
Tajikistan 22.7%
Mozambique 22.4%
Guyana 21.8%
Togo 21.8%
Congo 21.1%
Moldova 20.8%
Saint Kitts and Nevis 20.0%

We were pleased to see the following countries come off the list from last year, having dropped below the 20% threshold: Algeria, Angola, Anguilla, Antigua and Barbuda, Armenia, Barbados, Bosnia and Herzegovina, Botswana, Burundi, Caribbean Netherlands, Cook Islands, Dominica, Ecuador, El Salvador, Ethiopia, Gabon, Grenada, Haiti, Honduras, Jamaica, Liberia, Mauritania, Namibia, Nigeria, Papua New Guinea, Saint Lucia, Saint Vincent and the Grenadines, Sierra Leone, Solomon Islands, Somalia, Suriname, Swaziland, Tanzania, Trinidad and Tobago, Uganda, Ukraine, Uzbekistan, Vanuatu, Venezuela, Yemen, Zambia, and Zimbabwe. While countries like Belarus, Cape Verde, Central African Republic, Guinea, Guyana, Madagascar, Palestine, Rwanda, South Sudan, Tajikistan, Togo, and Turkmenistan are still on this list, they have improved the percentage of their samples on these outmoded technologies when compared to last year by at least 10 points. Palestine improved by more than 50 points. 2G and 3G samples in Kiribati increased 3.2 points when comparing Q3 2022 to Q3 2021.

We’re glad to see performance levels normalize as 5G expands to more and more countries and access improves and we are optimistic that 2023 will bring further improvements. Keep track of how well your country is performing on Ookla’s Speedtest Global Index™ or track performance in thousands of cities worldwide with the Speedtest Performance Directory™.

Ookla retains ownership of this article including all of the intellectual property rights, data, content graphs and analysis. This article may not be quoted, reproduced, distributed or published for any commercial purpose without prior consent. Members of the press and others using the findings in this article for non-commercial purposes are welcome to publicly share and link to report information with attribution to Ookla.

| April 14, 2024

Early 5G Results for the Samsung Galaxy S24 Family: How do New S24 Models Stack up to Previous Generations and iPhone 15’s on 5G? 

Consumers around the world eagerly awaited Samsung’s release of the latest line of its flagship Galaxy S series of smartphones on February 1, 2024. Was the wait worth it? In this article, we analyze how the Samsung Galaxy S24 family measures up against its predecessors in terms of 5G speed and latency during its first several weeks on the market (February 1 – March 24, 2024). 

With new chipsets and technologies alongside plenty of other cool new features in Galaxy S24 devices, we examined early results from Speedtest® users in 15 select countries around the world to see whether the Galaxy S24 lineup — comprising the S24, S24+, and S24 Ultra models — outpaced Samsung’s earlier S22 and S23 families for 5G performance. Additionally, we’ve compared the 5G speeds and latency of Apple’s iPhone 15 family — including the iPhone 15, 15 Pro, and 15 Pro Max — against Samsung’s offerings.

It’s important to note that device performance metrics can vary significantly from one country to another. Factors such as government and mobile operator investments in 5G infrastructure, spectrum allocations, and the extent of 5G network deployment all contribute to these variations.

Key takeaways:

  • The Samsung Galaxy S24 family showed a statistically significant lead for median 5G download speeds in seven out of 15 countries in this study. On the other hand, the Apple iPhone 15 family posted the fastest 5G speeds in only one country. It’s worth noting, however, that speed differences between Galaxy S24 devices and iPhone 15’s were relatively minor in some of the countries analyzed (see the charts below for details). 
  • The S24 family recorded the lowest median 5G multi-server latency in 10 of 15 countries, whereas iPhone 15 devices offered the highest median 5G latency in 10 markets.
  • Samsung Galaxy S22 models unsurprisingly offered the slowest median 5G download speeds in eight countries, while the Galaxy S23 family was slowest in four countries. 
  • Devices in the Galaxy S24 family experienced the fastest median 5G upload speed in 13 of the 15 countries examined for this analysis. However, upload speeds were much slower than 5G download speeds, ranging from 11.83 Mbps to Mbps to 66.52 Mbps, with median 5G upload speeds of 50 Mbps or better found in only three countries (South Korea, Qatar, and the U.A.E.). 

To learn more about what speeds mean in real-world terms, check out our article looking at how much speed users need for a variety of daily mobile activities.

Take me straight to the data!

Asia Pacific | Middle East & Africa | Europe | North America 

New chipsets and modems in the Galaxy S24 family 

Everyone wants to know if the newest technology is worth the upgrade when they’re investing in an expensive new smartphone. Each device within the Galaxy S24 family has various upgrades (including new AI features), but when it comes to features that impact speed and latency performance, here’s a look at the chipsets and modems for each line of smarthpones in our study:

  • Samsung Galaxy S24 Ultra models use Qualcomm’s Snapdragon 8 Gen 3 chipset globally, while the S24 and S24+ use it only in Canada, China, Hong Kong, Taiwan, and the United States. The Samsung Exynos 2400 is used elsewhere for the S24 & S24+.
  • The Galaxy S23 series uses Qualcomm’s Snapdragon 8 Gen 2 worldwide, while Samsung S22 models use an Exynos 2200 chipset in Europe and the Snapdragon 8 Gen 1 elsewhere. 
  • Galaxy S24 devices utilize the Snapdragon X75 5G modem, S23 models have a Qualcomm Snapdragon X70 modem, while S22 models have a Qualcomm Snapdragon X65 modem.
  • Apple iPhone 15 models use Apple’s A16 Bionic chipset, while iPhone 15 Pro and Pro Max models use the A 17 Pro chip. All devices in the Apple iPhone 15 family utilize Qualcomm’s Snapdragon X70 5G modem. 

Do you own one of these devices? See how your speeds compare by taking a quick Speedtest. And to learn more about mobile and fixed broadband performance in cities and regions across the world, visit the Speedtest Performance Directory, where you’ll find ISP recommendations, insights on mobile and fixed broadband performance, and more. 

Digging into the Data: Where does the Samsung Galaxy S24 Family Lead its S22, S23, and iPhone 15 Counterparts Around the Globe? 

Early findings from Speedtest Intelligence® reveal that the latest Galaxy S24 family outperformed its predecessors — especially S22 models — in terms of 5G speed across several of the countries we analyzed. While differences in speed between devices were minimal in some countries, S24 models showed significant speed advantages over previous generation Samsung devices in markets like Qatar, the United Arab Emirates, and others. 

Does that mean users in those locations should upgrade immediately? Not necessarily. The decision to upgrade depends on various factors, from price to features to performance and more. However, if speed is your primary concern, the Galaxy S24 series is a compelling option, especially for consumers currently utilizing devices from the Galaxy S22 lineup, which is now over two years old.

Read on to see our complete analysis of all 15 countries in this study or select a region below to dig into more localized results. 

Asia Pacific | Middle East & Africa | Europe | North America 

Asia Pacific

Consumers in Hong Kong who want new features might want to upgrade

Speedtest Intelligence data revealed strong performance for all device families in Hong Kong, with the new Galaxy S24 family performing particularly well, boasting a median 5G download speed of 165.74 Mbps and the lowest median 5G multi-server latency in the market at 21.74 ms. However, the S24’s median 5G download speed was statistically comparable to that of its older Samsung and iPhone 15 peers, making the choice to upgrade currently more about new features than about performance.

Bottom line: With strong — and similar — 5G download speeds across all device families in Japan, upgrading to a new Galaxy device isn’t a must just yet, unless you want to enjoy the S24 family’s new features.

5G speeds were fast across the board in India, where the Samsung Galaxy 24 family held a slight edge 

In the early days following the release of the Galaxy S24 series in India, the latest Samsung models led for both 5G download speeds and 5G multi-server latency. While 5G speeds impressed across all device families in India — all notched speeds of at least 273.78 Mbps — Galaxy S24 models posted the top median 5G download speed at 302.43 Mbps and the lowest median 5G multi-server latency at 41.56 ms. On the other hand, Galaxy S22 devices showed the slowest — but still impressive — speeds in India at 273.78 Mbps, while the Samsung Galaxy S23 was just a tick behind at 279.93 Mbps. The iPhone 15 family, meanwhile, clocked in with a median 5G download speed of 285.78 Mbps.

Bottom line: Consumers in India currently using S22 devices might want to upgrade to an S24 model, given the nearly 30 Mbps speed advantage the new devices provided in this study. However, with excellent 5G speeds across all device families and similar speeds for devices in the S22, S23, and iPhone 15 families, users might not feel a huge difference in their 5G experience from one device to another. 

Samsung Galaxy enthusiasts in Indonesia needn’t rush to upgrade to an S24 device — yet

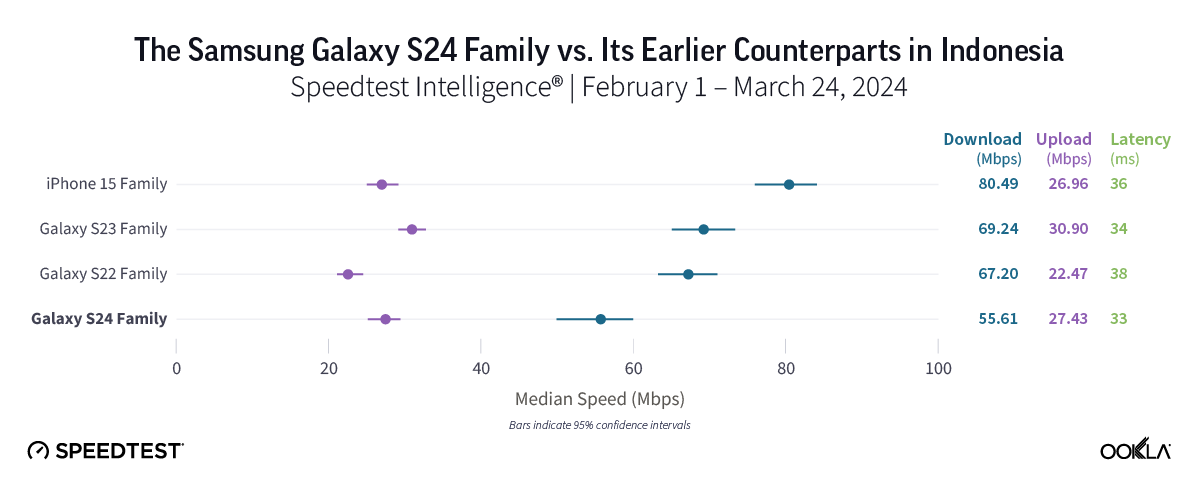
In contrast with what our results showed in most countries, the iPhone 15 family emerged as the leader in Indonesia with a median 5G download speed of 80.49 Mbps. All three Samsung Galaxy families trailed with speeds ranging from 55.61 Mbps for the S24 family to 69.24 Mbps for S23 models. While the iPhone 15 family’s 5G speed was nearly 25 Mbps faster than that of S24 devices, it’s worth noting that the difference among all three Samsung Galaxy models was only about 14 Mbps, and our results revealed no statistical difference in median 5G download speeds between the S22 and S23 families. 

Bottom line: Despite the iPhone 15 providing the top speeds in the market, the Galaxy S24 could hold greater long-term potential for consumers in Indonesia, especially when compared to older Samsung models. Equipped with a newer processor and modem, the S24 could see quicker speeds over time as Indonesia’s 5G networks evolve. In the meantime, users shouldn’t experience notable disparities in speed or latency among all three Samsung device families analyzed. 

No clear advantage to upgrading to a new Galaxy S24 in Japan

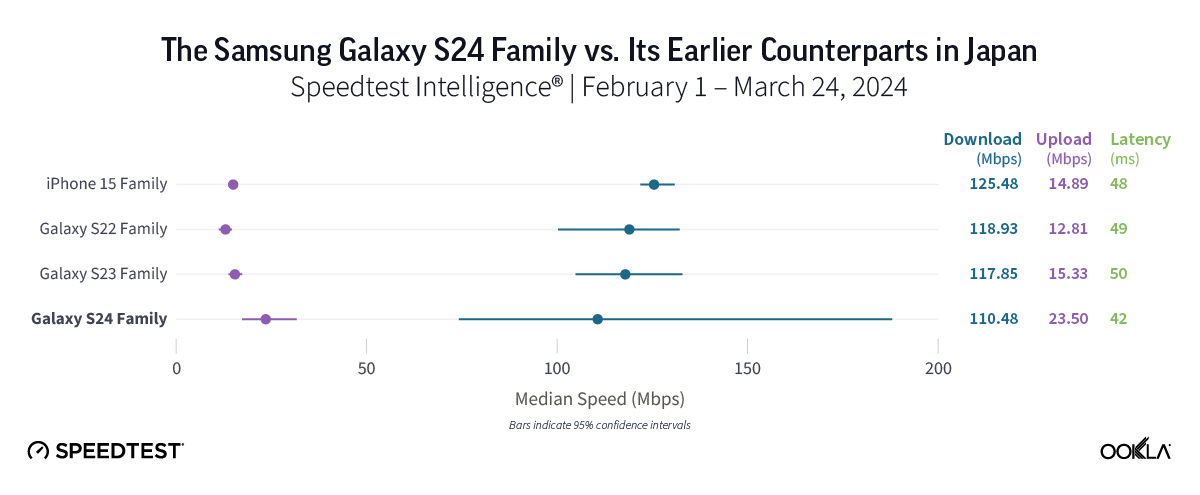
People in Japan who upgraded to a Galaxy S24 device likely haven’t seen a performance boost just yet. While all four device families performed similarly well in Japan, there was no statistical difference in the median 5G download speeds offered by all three Galaxy families, with speeds ranging from 110.48 Mbps to 118.93 Mbps across all three Galaxy devices. The iPhone 15 lineup also had a strong speed at 125.48 Mbps. 

Bottom line: With generally similar median 5G download speeds across all device families in Japan, users who are considering upgrading to a new Galaxy smartphone might want to wait. While we anticipate the S24’s speeds to surpass those of its predecessors over time, 5G speeds in the market were quite close across all three Galaxy device families in the early days of the S24’s release. 

For users in the Philippines who want the fastest 5G, Galaxy S22 users may want to upgrade. 

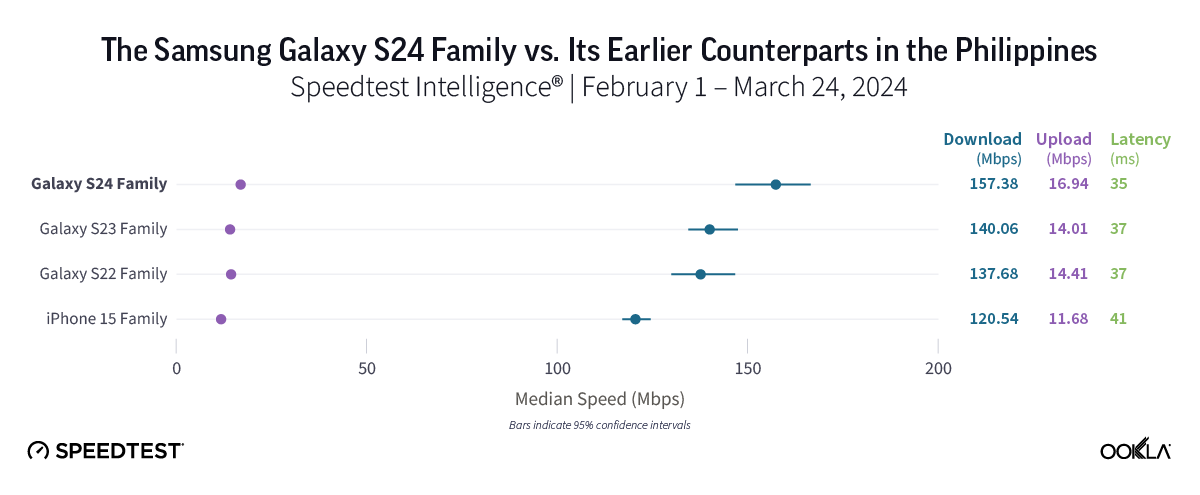
Samsung Galaxy S24 users in the Philippines might have noticed a modest improvement to their 5G speeds compared to those on older S23 and S22 models since they upgraded, as the Galaxy S24 family’s median 5G download speed of 157.38 Mbps was about 20 Mbps faster than that of Galaxy S22’s (137.68 Mbps) and a little over 15 Mbps faster than the Galaxy S23 family (140.06 Mbps). Meanwhile, the iPhone 15 family’s median 5G download speed of 120.04 Mbps trailed all three Samsung Galaxy families in the market.

Bottom line: For users in the Philippines seeking the fastest possible 5G experience, upgrading to an S24 device is worth considering. However, it’s worth noting that the differences in speed between devices wasn’t as stark as that in some other countries, and upgrading likely isn’t for everyone just yet.

Samsung Galaxy S24 and iPhone 15 much faster on 5G in South Korea than S22 devices 

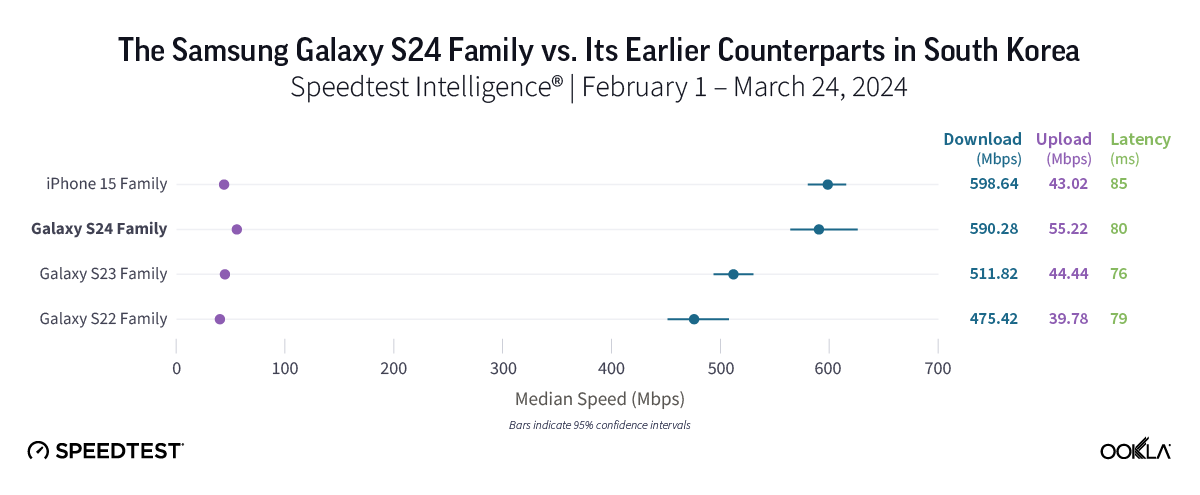
In South Korea, home to the first widespread 5G launch in the world, our results reflected outstanding 5G speeds, with the iPhone 15 and Samsung Galaxy S24 families posting similar median 5G download speeds of 598.64 Mbps and 590.28 Mbps, respectively. The S22 family, meanwhile, offered the “slowest” 5G speeds in South Korea, posting an excellent median 5G download speed of 475.42 Mbps, while Galaxy S23 devices came in at 511.82 Mbps.

Bottom line: 5G users in South Korea can expect remarkable 5G speeds across the board, regardless of their device. However, Samsung Galaxy loyalists who currently use S22 models might want to consider moving to an S24 model, given that the S24 family was over 100 Mbps faster than Galaxy S22’s, while also offering the top median 5G upload speed in the market at 55.22 Mbps. For users who prioritize the fastest 5G experience, Galaxy S24’s and iPhone 15’s are both worth a look.

Samsung Galaxy S24 family provides top 5G download speeds in Thailand 

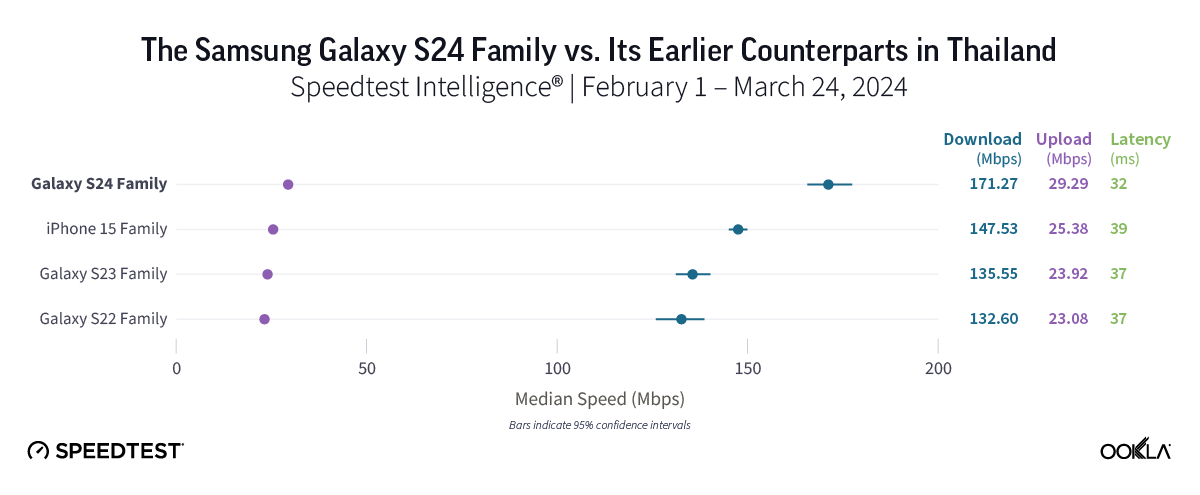
In Thailand, Speedtest Intelligence showed that the Galaxy S24 family delivered the fastest median 5G download speed in the market at 171.27 Mbps. That speed marks a notable improvement of roughly 35 Mbps over the S22’s 132.60 Mbps and the S23’s 135.55 Mbps. The Galaxy S24 family also offered the lowest median 5G multi-server latency in Thailand at 32.46 ms. The iPhone 15 family provided the second-fastest median 5G download speed in the market at 147.53 Mbps.

Bottom line: If you’re thinking of upgrading from an S22 or S23 device, our findings suggest that the Galaxy S24 might be the right choice. With faster 5G speeds compared to previous generations, coupled with low latency, smartphones in the Galaxy S24 family should allow for quick content downloads and smooth connectivity overall.

Middle East and Africa 

Excellent 5G speeds in Nigeria, but too soon to tell if you should upgrade for performance 

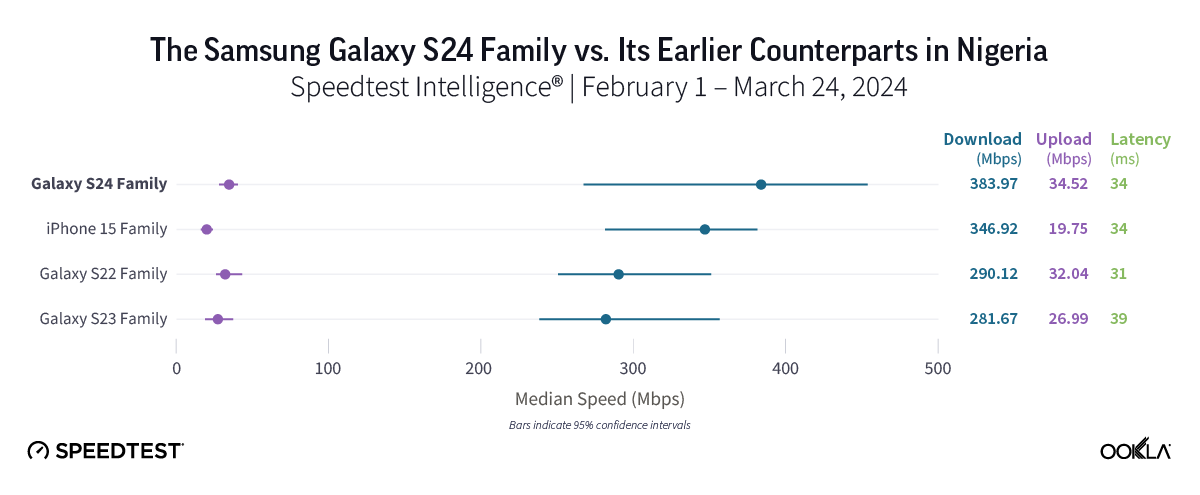
In Nigeria, 5G speeds were impressive overall, from the Galaxy S23 family’s median 5G download speed of 281.67 Mbps to the new Galaxy S24’s speed of 383.97 Mbps. However, in these early days of the S24 lineup’s release, we are still waiting to see how things stabilize in the market before we can make a firm recommendation on whether to upgrade. 

Bottom line: For users who like to have the latest gear and/or want the new features offered by the S24 lineup, upgrading is certainly worth considering. But with fast 5G speeds in general, users on any of the device families we looked at should see a quick download experience in general. 

Samsung Galaxy S24 by far the fastest 5G in Qatar 

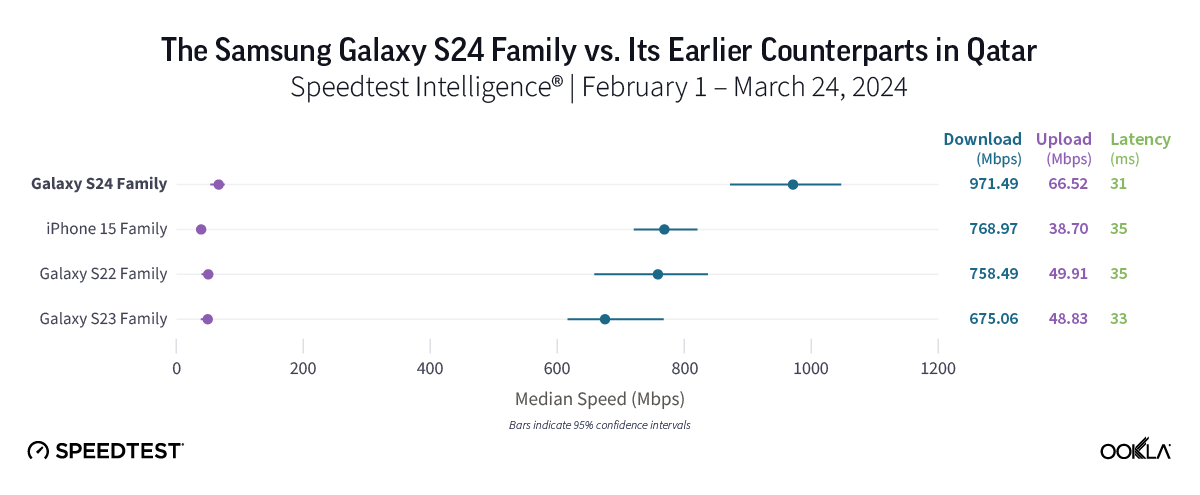
Home to some of the fastest 5G speeds in the world, Qatar showcased impressive median 5G download speeds across all three device families analyzed. The Galaxy S24 family led the pack with a jaw-dropping median 5G download speed of 971.49 Mbps and the top median 5G upload speed in the market at 66.52 Mbps. The Galaxy S22 and S23 families trailed, albeit with great median 5G download speeds of 675.06 Mbps and 758.49 Mbps, respectively. The iPhone 15 family also had a strong showing in Qatar, posting a median 5G download speed of 788.97 Mbps. 

Bottom line: Consumers in Qatar with older Galaxy S22 or S23 devices might want to make the switch, given that the S24 family’s remarkable median 5G download speed of nearly 1 Gbps was much faster than those of either the Galaxy S23 or especially S22 families.

Galaxy S24 a good option for Samsung fans in the U.A.E.

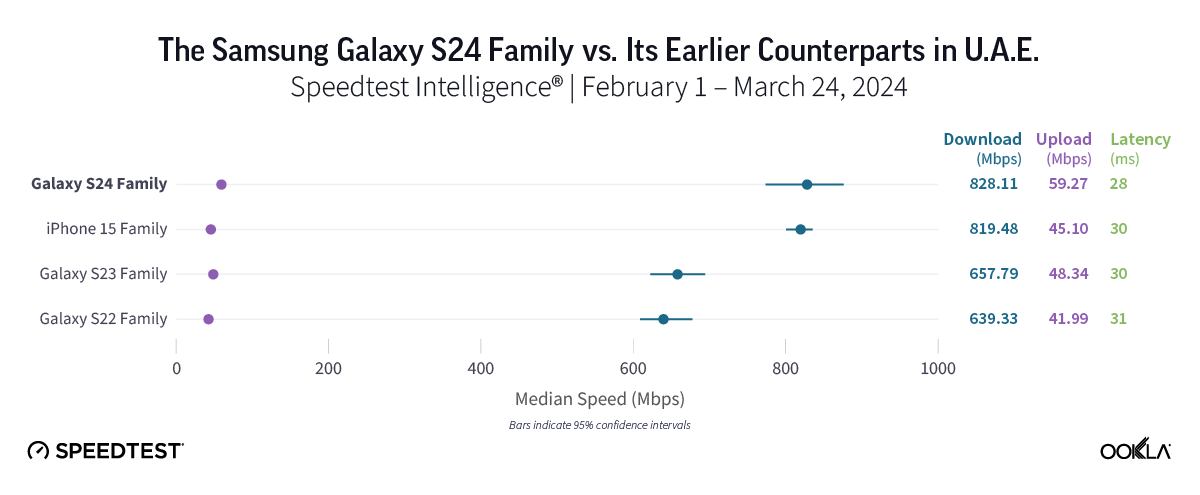
In the U.A.E., which is home to outstanding 5G speeds in general, the Samsung Galaxy S24 and iPhone 15 families delivered the top median 5G download speeds in the market at 828.11 Mbps and 819.48 Mbps, respectively. When compared to its earlier generation Samsung predecessors, the S24 family held a commanding speed advantage, boasting speeds that were at least 170 Mbps higher than those of either the S22 (639.33 Mbps) or S23 (657.79 Mbps) families. 

Bottom line: With median 5G download speeds ranging from 639.33 Mbps to 828.11 Mbps, consumers in the U.A.E. will likely enjoy fantastic speeds regardless of device model. However, for current S22 or S23 users hoping to boost their speeds, the Galaxy S24 family stands out as a good choice.

Europe

Galaxy 24 family clocked 5G speeds over 80 Mbps faster than those on S22 devices in France

In France, the Galaxy S24 family was the frontrunner, delivering the fastest median 5G download speed among all device families in the market at 292.15 Mbps. That marks a significant improvement of over 80 Mbps compared to the S22 family’s speed of 211.32 Mbps, along with a jump of more than 60 Mbps compared to the S23’s speed of 229.78 Mbps. Meanwhile, iPhone 15 users experienced the second-fastest median 5G download speed in the market at 257.15 Mbps, with 5G latency nearly identical to that of the S22 and S23 families.

Bottom line: For consumers currently using an S23 or especially an S22 model, upgrading to an S24 device is worth considering. Our results in France showed that the latest Samsung lineup delivered a superior 5G speed experience over older Galaxy models, especially those in the Galaxy S22 family.

Galaxy S24’s a good choice over S22 models in Spain

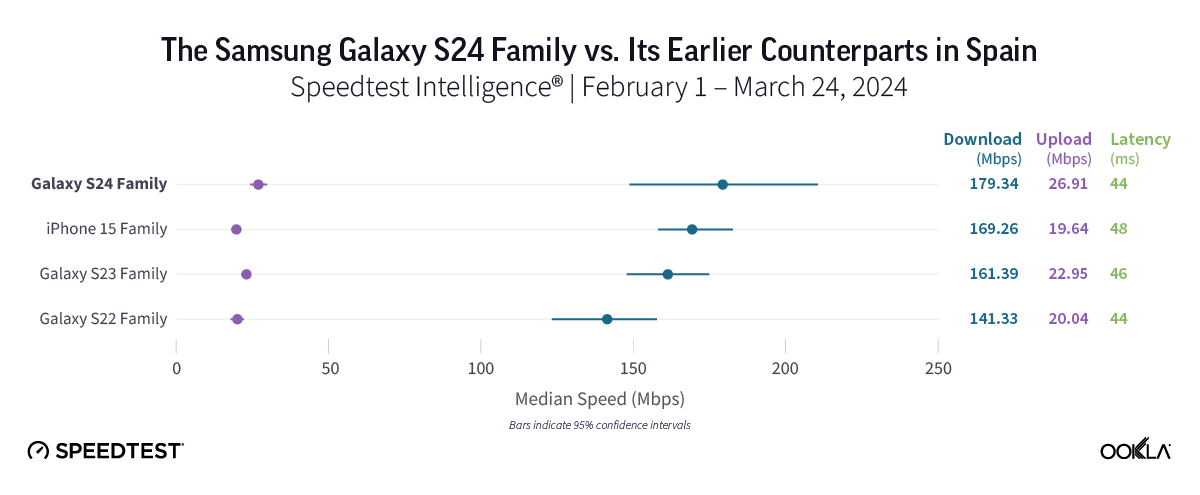
All four device families in Spain provided good 5G speeds, ranging from the S22’s median 5G download speed of 141.33 Mbps to the S24 family’s speed of 179.34 Mbps. While speeds recorded on S24, S23, and iPhone 15 devices were statistically similar, the difference in speed between the S24 and S22 was much starker, with the S24 nearly 40 Mbps faster than the S22. 

Bottom line: The decision to upgrade should be more straightforward for S22 users in Spain compared to those with S23 or iPhone 15 models, as the S24’s median 5G download speed of 179.34 Mbps was almost 40 Mbps faster than that of the S22 family. 

Samsung Galaxy S24 likely worth an upgrade from S22 in the U.K. 

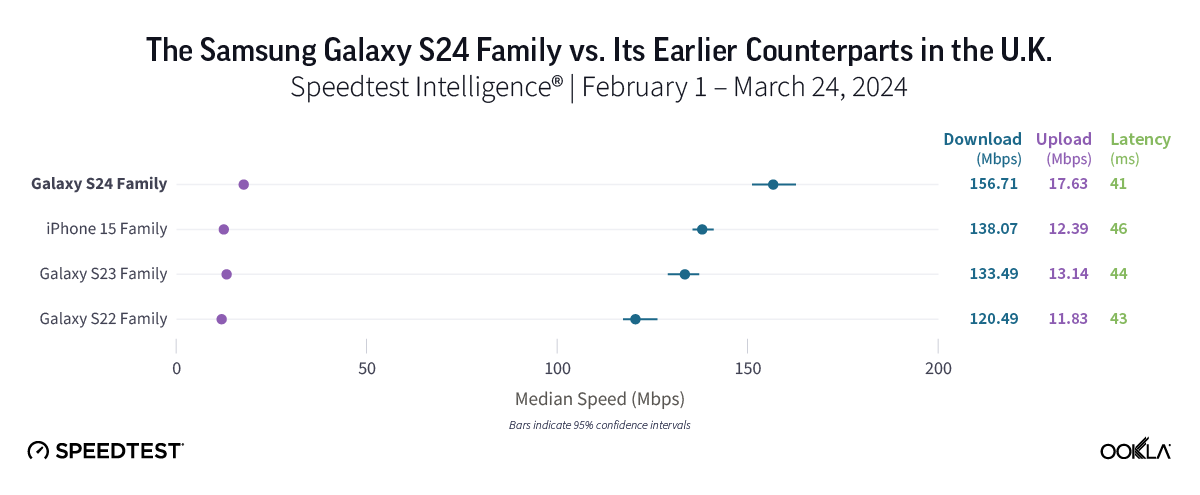
In the U.K., Samsung Galaxy S24 models were the fastest in the market, with the S24’s median 5G download speed of 156.71 Mbps offering a speed gain of nearly 40 Mbps compared to the Galaxy S22 family. Galaxy S24 models also posted faster speeds than both the Galaxy S23 and iPhone 15 families, but the difference was less stark than it was with the S22 family, with Galaxy S22 models clocking in at 120.49 Mbps, Galaxy S23’s at 133.49 Mbps, and iPhone 15’s at 138.07 Mbps. 

Bottom line: U.K. consumers using either S22 or S23 models may want to look into upgrading to the S24 to enjoy faster speeds. That’s especially true for S22 users, given that the S24’s median 5G download speed was nearly 40 Mbps faster than that of S22 devices.

North America

No major 5G speed boost for users in Mexico who upgraded to a Galaxy S24 

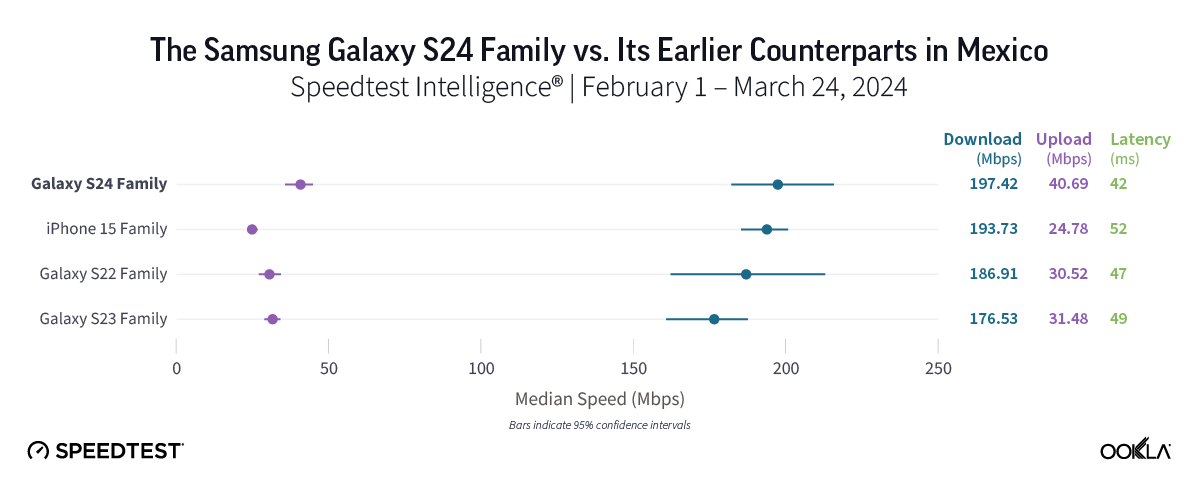
5G speeds in Mexico were impressive, with all device families posting median 5G download speeds of 176.53 Mbps or better. While Speedtest users of the Galaxy S24 family experienced the fastest median 5G download speed in the market at 197.42 Mbps, that speed marked only a modest improvement compared to Galaxy S22 devices (186.51 Mbps) and iPhone 15 models (193.73 Mbps). The Galaxy S23 family showed the slowest 5G speed in the market at 176.53 Mbps, coming in about 20 Mbps slower than Galaxy S24 models

Bottom line: For users eager to embrace the new features offered by Galaxy S24 devices or move on from S23 devices, an upgrade might be worthwhile. However, with fast 5G speeds across all device families in Mexico and only about 20 Mbps separating all four device families in our study, users likely won’t see a major change in their 5G experience by upgrading. 

Galaxy S22 users in the U.S. could get faster 5G with the S24 family. 

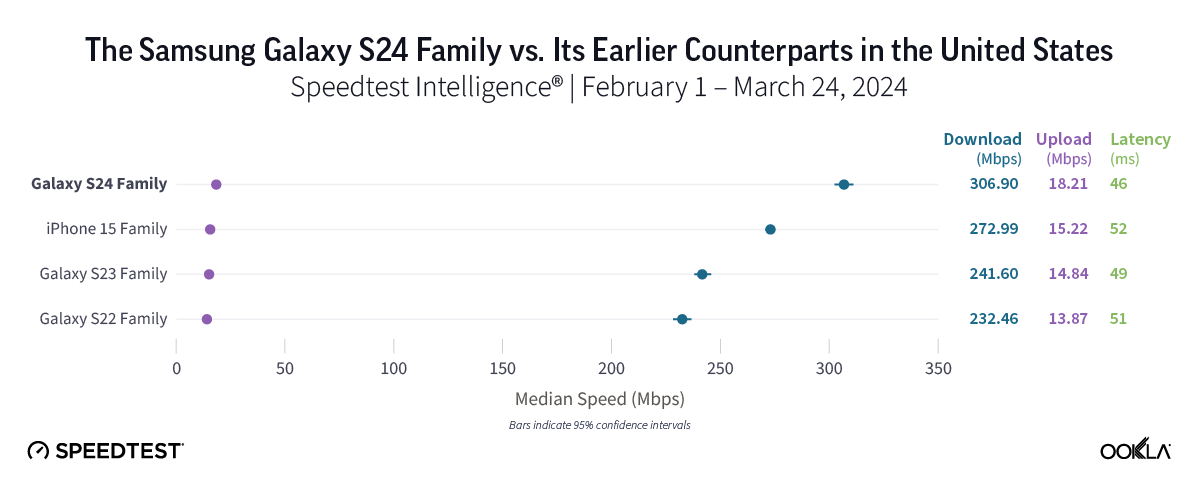
5G speeds in the U.S. had an impressive showing across the board, with median 5G download speeds of at least 232.46 Mbps across all device families. The Samsung Galaxy S24 family led the way with an excellent median 5G download speed of 306.90 Mbps and the lowest median 5G multi-server latency at 45.71 ms. Users of the Galaxy S24 family enjoyed speeds roughly 75 Mbps faster than those on S22 models (232.46 Mbps) and approximately 65 Mbps faster than those on S23 devices (241.60 Mbps). Meanwhile, the iPhone 15 family also offered a strong performance, with a median 5G download speed of 272.99 Mbps. 

Bottom line: Users of older Samsung device models in the United States may want to switch to one of the newer models to capitalize on the faster 5G speeds offered by S24 devices, though speeds were strong for all device families in this study. 

Ookla will continue monitoring how devices are performing 

We’ll continue to check in on device performance as new models enter the market, so stay tuned for further insights into mobile and fixed broadband performance in countries around the world. 

If you’ve recently made the switch to an S24 device, make sure you’re getting the speeds you need by downloading the iOS or Android Speedtest® app.

Ookla retains ownership of this article including all of the intellectual property rights, data, content graphs and analysis. This article may not be quoted, reproduced, distributed or published for any commercial purpose without prior consent. Members of the press and others using the findings in this article for non-commercial purposes are welcome to publicly share and link to report information with attribution to Ookla.
| March 19, 2024

Sunsetting Networks in Africa will be Gradual and More Selective Than in Other Regions

We recently examined operators’ plans for sunsetting 2G and 3G networks in the Middle East and North Africa (MENA) and highlighted the benefits and challenges of phasing out legacy networks. In contrast, Sub-Saharan Africa (SSA) is just beginning this journey, with South Africa leading the way compared to other large markets like Nigeria, as it aims to shut down 2G and 3G by 2027. This article examines the factors contributing to slower progress in SSA and suggests how operators might expedite the transition.

Key Takeaways:

  • Sunsetting is not yet a priority for most African operators. The shift from 2G/3G to more advanced technologies will be slower in Africa due to economic, social, and infrastructural factors as well as the strong dependence on existing legacy ecosystems. A gradual approach is recommended to maintain digital inclusiveness in Africa.
  • South Africa is the only country in SSA with an established plan to sunset 2G and 3G networks. Cell Analytics® data shows a large concentration of 2G and 3G users in suburban and rural areas as well as along transportation routes. South Africa plans to decommission these networks by 2027, but most countries, including Nigeria, have not yet set a date. We expect network sunsetting to be in full swing from 2030 onwards.
  • Operators should strike a balance between driving progress and maintaining the inclusivity of their services. African operators should continue to support and potentially expand their legacy networks to ensure continued access to critical communication services for most of the population while investing in the roll-out of 4G and 5G networks.

Network sunsetting could play a key role in addressing the growing demand for data and spectrum in Africa

More operators are contemplating turning off their 2G and/or 3G networks to refarm their existing spectrum and combine it with other bands to enhance 4G and 5G services, promising faster data speeds, lower latency, and enhanced connectivity. At the same time, operators seek to optimize spectrum utilization as it is a scarce and expensive resource. 

Our previous article delved into how decommissioning 2G or 3G networks can boost efficiency, reduce costs, and improve customer satisfaction. We also emphasized the importance of careful planning to minimize service disruption and potential financial and reputational damage.

2G and 3G network sunsetting across Africa is evolving very slowly, with no country on the continent having completed the transition yet. This delay in transitioning to newer network technologies has significant implications on the ability of the population to access high-speed internet which is vital for socio-economic development. It is important to explore the reasons behind the slow progress and identify potential strategies to overcome the challenges associated with sunsetting old networks.

3G remains the most prevalent network technology in SSA, but 4G will overtake it by 2027. The GSMA predicts that 3G’s share of connections will fall below 50% in 2025, while 2G adoption will decline under 10%. 4G connections will almost double between 2022 and 2030 to represent nearly half of the total, overtaking 3G by the end of 2027. Continued network upgrades and better device affordability will drive this surge. While 5G adoption will initially be slow, it is anticipated to gain momentum during the second half of the decade, reaching 17% by 2030. This shift will lead to a fourfold increase in mobile data traffic per smartphone by 2028, a higher rate than any other region, to 19 GB per month.

Network sunsetting is more important in SSA because of limited spectrum availability and the rapid growth in demand for faster-speed data services. As regulators released only a small quantity of spectrum, operators resorted to refarming existing spectrum bands to deploy 4G and 5G services. The low-frequency bands occupied by earlier network technologies are valuable due to their excellent propagation characteristics, making them ideal for fulfilling coverage obligations with 4G and 5G.

Network sunsetting in Africa is hampered by the prevalence of legacy infrastructure and the high cost of migrating customers

Many parts of the continent still heavily rely on legacy technology and will continue to do so in the short-to-medium term. This reliance makes the transition to newer generation networks more challenging and costly. In 2023, 3G represented 55% of mobile connections in SSA and is expected to represent a third of total connections by 2030. 

This shows that many revenue-generating customers are still on legacy networks. Operators are understandably hesitant to risk service disruptions and incur the significant investment and planning required to upgrade the infrastructure, which will make the transition more challenging and lengthier. Besides, 3G was launched less than a decade ago in several countries. In Burundi, Cameroon, Ethiopia, and Liberia, some operators have only introduced 3G services since 2019 or later, meaning the network costs have not yet been fully amortized. 

In the enterprise sector, Africa hosts millions of machine-to-machine (M2M) devices, some of them in difficult-to-reach geographies or embedded in cars and equipment, making replacement or upgrades challenging. For example, South Africa had 11.5 million M2M connections in Q3 2022, according to the Independent Communications Authority of South Africa (ICASA), while Kenya recorded more than 1.5 million M2M connections in Q3 2023.

Despite the expansion of mobile networks in many African countries, coverage gaps persist, posing a connectivity challenge. If operators decide to rush the decommissioning of older networks, they could leave many people losing mobile access, thus widening the digital divide. 2G is particularly suitable for the region’s large rural population because 2G base stations can provide good coverage across large distances. That is why in many African countries, 2G coverage of the population has reached or exceeded 90% while that of 3G and 4G lag behind.

The prevalence of basic and feature phones across the continent is another barrier. Handset compatibility issues with newer technologies and the higher costs of smartphones and data plans represent significant hurdles for low-income populations, complicating the transition process.

Finally, operators may face regulatory challenges when retiring old technologies. Spectrum freed from legacy networks may not be readily available for new networks after the switch-off if it is tied to a specific technology. Repurposing it for modern networks can also be a bureaucratic and time-consuming process.

African operators can adopt different strategies to address challenges that hinder the sunsetting process

The challenges outlined above contribute to the slower rate of network sunsetting in Africa compared to other regions. However, operators can employ various strategies to facilitate the decommissioning process while mitigating the negative impact on revenue and brand.

The decision to sunset one network before another should be informed by market conditions, including the number of customers that use legacy networks, the cost of maintaining their operations, and the dependency of enterprise services on these networks. In either case, it is important to adopt a phased approach to sunsetting, prioritizing areas with higher 4G coverage first, before moving to rural and remote regions. This approach will help to minimize disruption and allow users more time to prepare for the transition.

Operators could encourage subscribers to upgrade to newer devices that support 4G and 5G networks through incentives such as handset trade-in programs or subsidies for low-income individuals. They should couple it with awareness campaigns to educate subscribers about the benefits of newer networks and the steps they need to take to ensure a smooth migration.

Operators should also communicate early about potential service disruptions and the timeline for the switch-off to make the necessary adjustments to their M2M systems. For example, they could offer incentives or subsidies to upgrade to 4G-grade M2M technologies, such as LTE-M, which offer longer usable life, larger operating range, and higher data rates. Offering assistance to enterprises to address any network compatibility and reliability issues during and after the migration is also essential. The regulator should be involved in the discussions around sunset plans as it may require operators to maintain some capacity and coverage for critical IoT infrastructure.

For spectrum reuse, operators should lobby the regulators for technology-neutral licenses, enabling them to use the old spectrum once released. Reducing regulatory constraints and requirements will help to improve network coverage and reduce capital expenditure. A recent GSMA report highlights that countries in Africa that adopted technology-neutral licensing have seen a 30% rise in mobile internet penetration, and a 74% improvement in 4G coverage, in contrast to 24% and 57%, respectively, for countries without such licensing.

Network sunsetting is not yet a priority in Africa given the prevalence of 2G and 3G connections

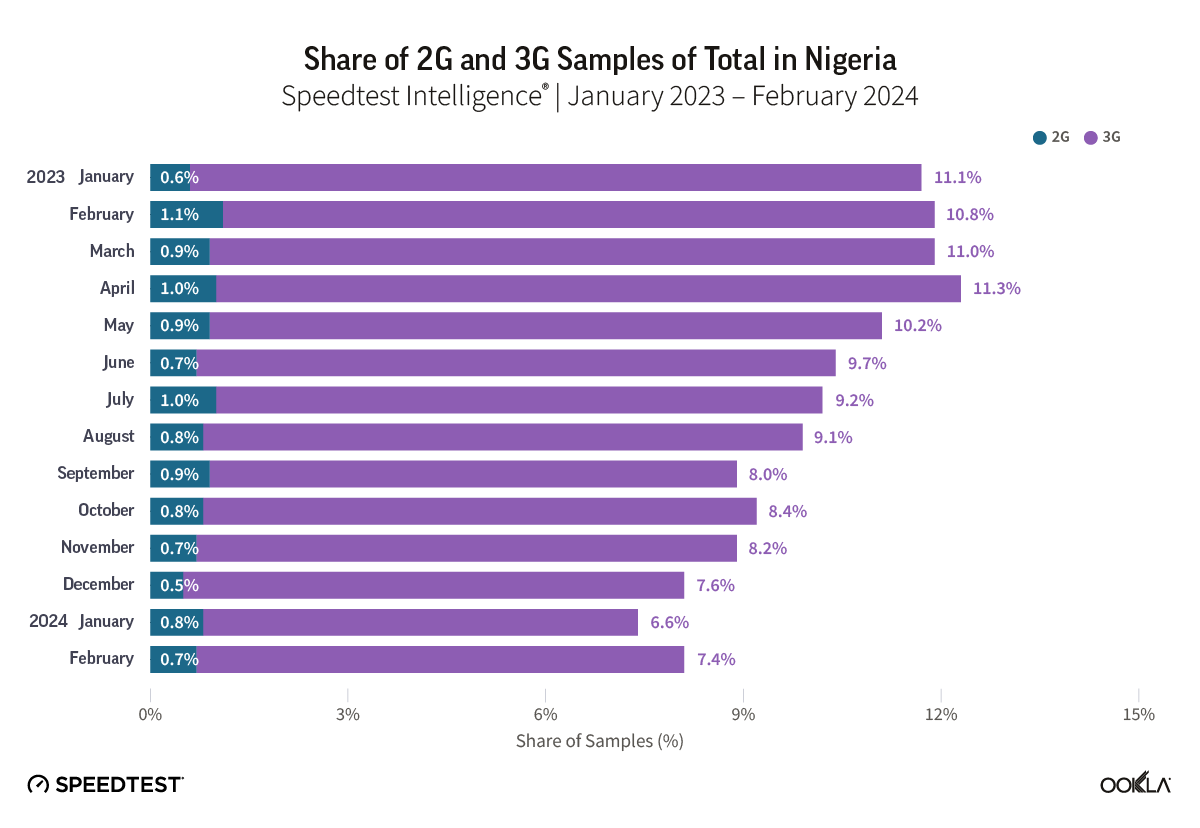
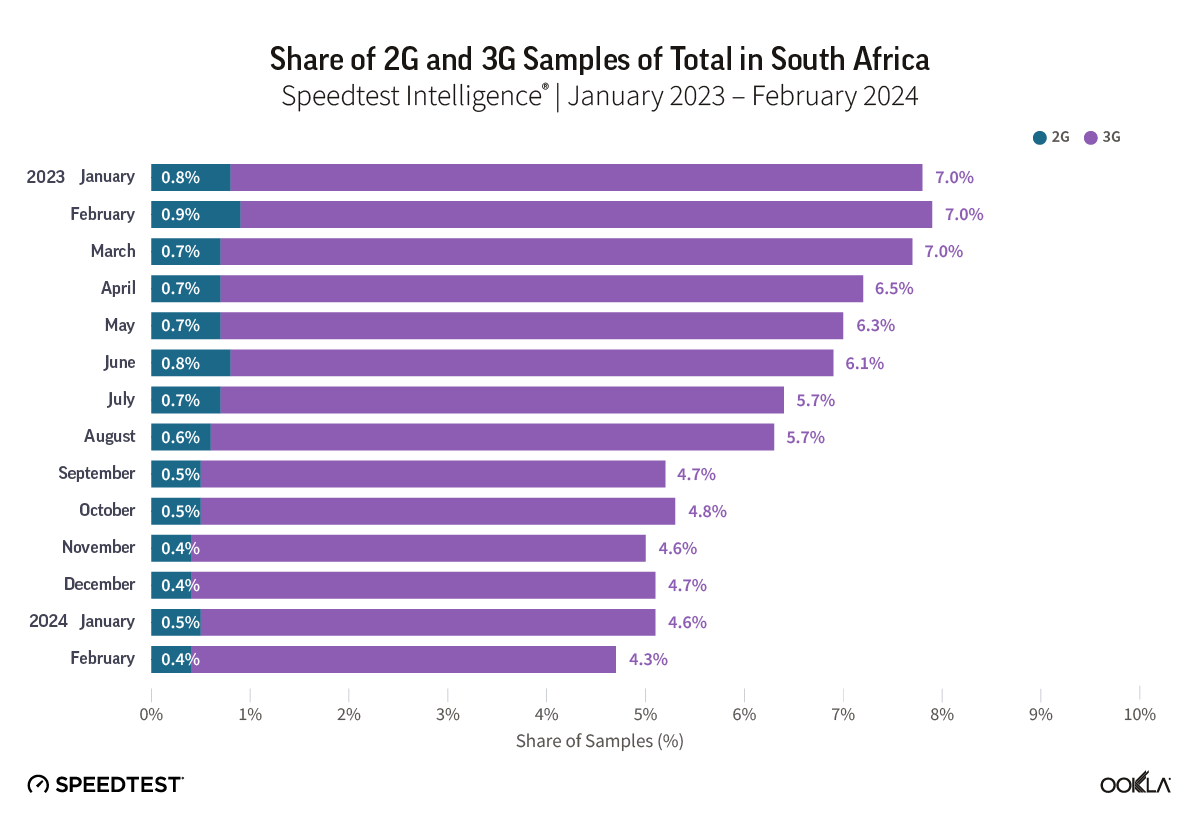
2G will likely remain important during the rollout of 4G and 5G for years to come because it supports essential consumer services in Africa, including voice, basic information, and mobile money transactions. As 4G provides a much better data experience than 3G, operators will likely consider sunsetting 3G before 2G. We used Speedtest Intelligence’s “Availability” data to get the percentage of users with a service-active device who spend the majority of their time connected to 2G and 3G in Nigeria and South Africa, the two largest markets in Sub-Saharan Africa by revenue. This data is a proxy for the relative penetration of 2G and 3G in these markets. Since customer-initiated Speedtest® measurements require a relatively modern phone, samples reported as 2G or 3G indicate the unavailability of 4G and 5G coverage rather than actual 2G and 3G usage. As such, we rely on this data solely to gauge the relative penetration of 2G and 3G in these markets. 

Speedtest Intelligence® data showed that the 2G/3G share of connections has been trending down in Nigeria and South Africa throughout 2023. By February 2024, 3G penetration in Nigeria was at 7.4% and in South Africa at 4.3%, with 2G penetration significantly lower at 0.7% and 0.4%, respectively. This suggests that more subscribers in Nigeria than in South Africa spend the majority of their time on 2G/3G.

According to the Nigerian Communications Commission (NCC), 67.6% of subscribers used 2G or 3G as of December 2023. ICASA in South Africa does not publish detailed mobile connection technology data. However, we can estimate that 2G/3G subscribers accounted for around 35-40% of total connections in South Africa at the end of 2023 based on Speedtest Intelligence and NCC data. Since South Africa is the most developed mobile market in SSA, the penetration of legacy networks is expected to be much higher in less developed markets.

Chart of Share of2G and 3G Samples of Total in Nigeria
Chart of Share of2G and 3G Samples of Total in South Africa

Network sunsetting is not yet on the table for Nigerian operators

Nigeria’s journey with 5G began in December 2022 with the auctions for 5G licenses using the 3500 MHz spectrum band. MTN and ISP Mafab Communications emerged as winners. Airtel acquired its 5G license about a year later. MTN launched 5G in September 2022, initially in seven cities, expanding to 300 cities by the end of 2023. Despite this, 5G adoption has been limited, with 4G capturing a growing market share and 5G representing just 1.0% of mobile subscribers by the end of 2023.

This is mainly due to limited 5G coverage, device affordability, and customer demand. ITU’s report shows that while 94% and 87% of the population had access to 2G and 3G coverage, respectively, only 6% could access 5G at the end of 2022. Furthermore, 58% of the urban population had a smartphone at the end of 2022, compared to only 32% in rural areas, according to the GSMA.

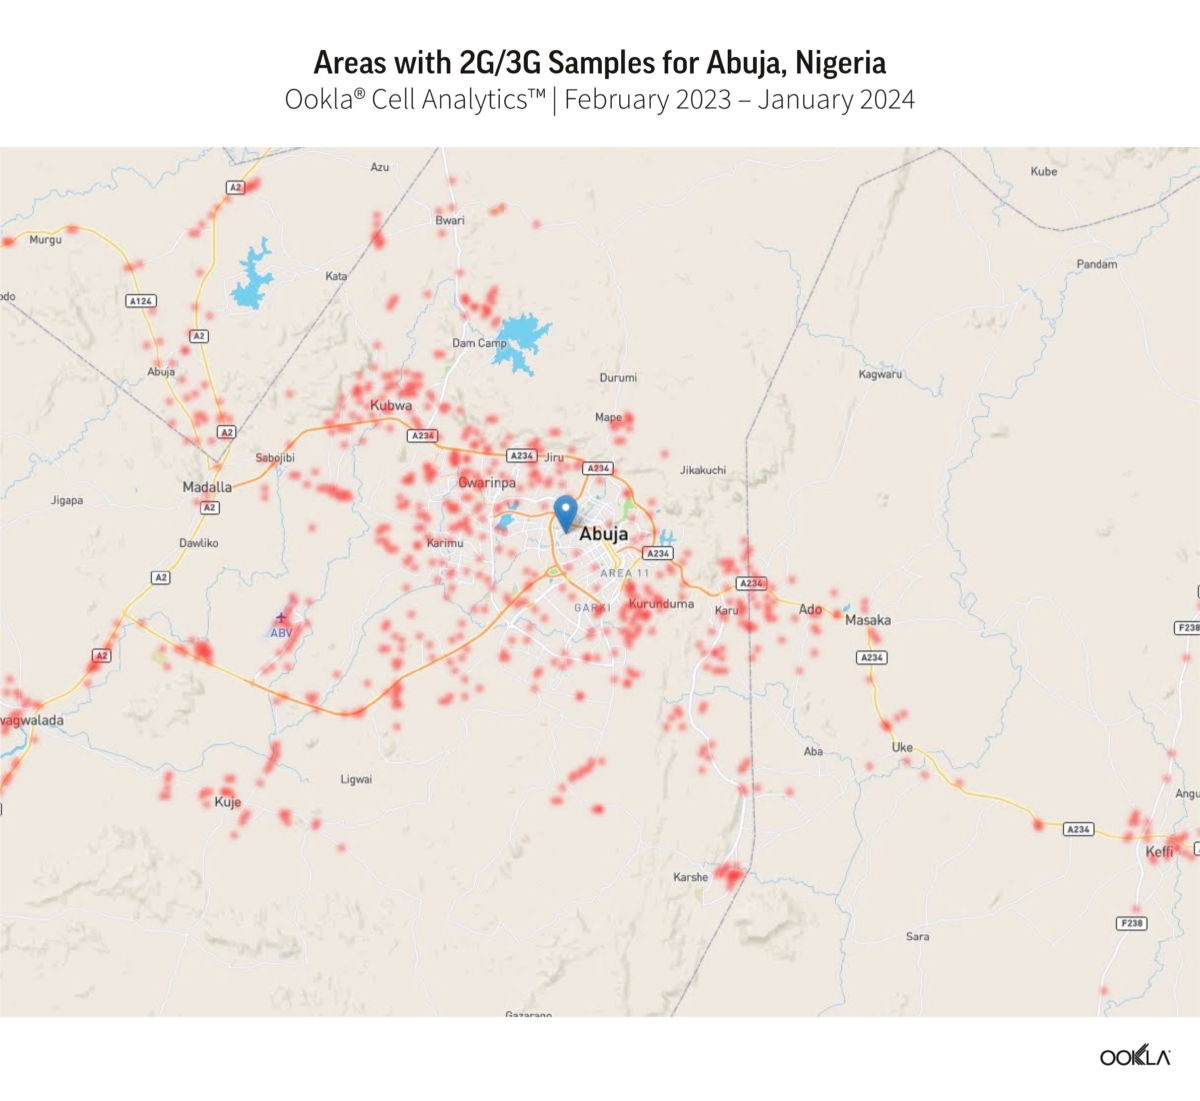
Call Analytics® identified areas with 2G and 3G concentration between February 2023 and January 2024 in high-population centers, Abuja, Ibadan, and Lagos. The red dots on the map pinpoint customers connected to 2G and 3G because they have SIM cards not provisioned for LTE (including roamers), lack 4G coverage, or use devices incompatible with 4G.

Data shows that mobile operators still heavily rely on 2G and 3G networks to provide connectivity across city centers, suburban regions, rural areas, and along transport routes. With the rising cost of living, people are expected to reduce their data usage and continue using 2G and 3G devices due to budget constraints and increasing mobile phone prices. Notably, Nigeria’s annual inflation rate reached a nearly 30-year high of 28.9% in December 2023 due to currency devaluation, reduction of subsidies, and foreign exchange liberalization. 

The combination of high living expenses and Nigeria’s extensive geography suggests the full transition to modern networks will be slow and gradual while 2G and 3G networks remain in operation for the foreseeable future. This is evidenced by MTN and Airtel’s renewal of their 2100MHz spectrum license in 2022, primarily for 3G uses while progressing with 5G deployment. An operator can choose to repurpose that spectrum for 4G and 5G in the future or use dynamic spectrum sharing to share it between different technologies. 

South Africa plans to turn off 2G and 3G by the end of 2027

Local operators have long awaited the release of new spectrum to enhance 4G services and launch 5G. Faced with this delay, Vodacom and MTN introduced 5G services in May and June 2020 using the emergency spectrum granted by ICASA during COVID-19 and refarming some of their existing spectrum assets on 2G and 3G.

The much-anticipated spectrum auction was finally completed in March 2022 with spectrum bands across 700 MHz, 800 MHz, 2.6 GHz, and 3.5 GHz bands awarded to six operators Cell C, Liquid Intelligent Technologies, MTN, Rain, Telkom, and Vodacom. 

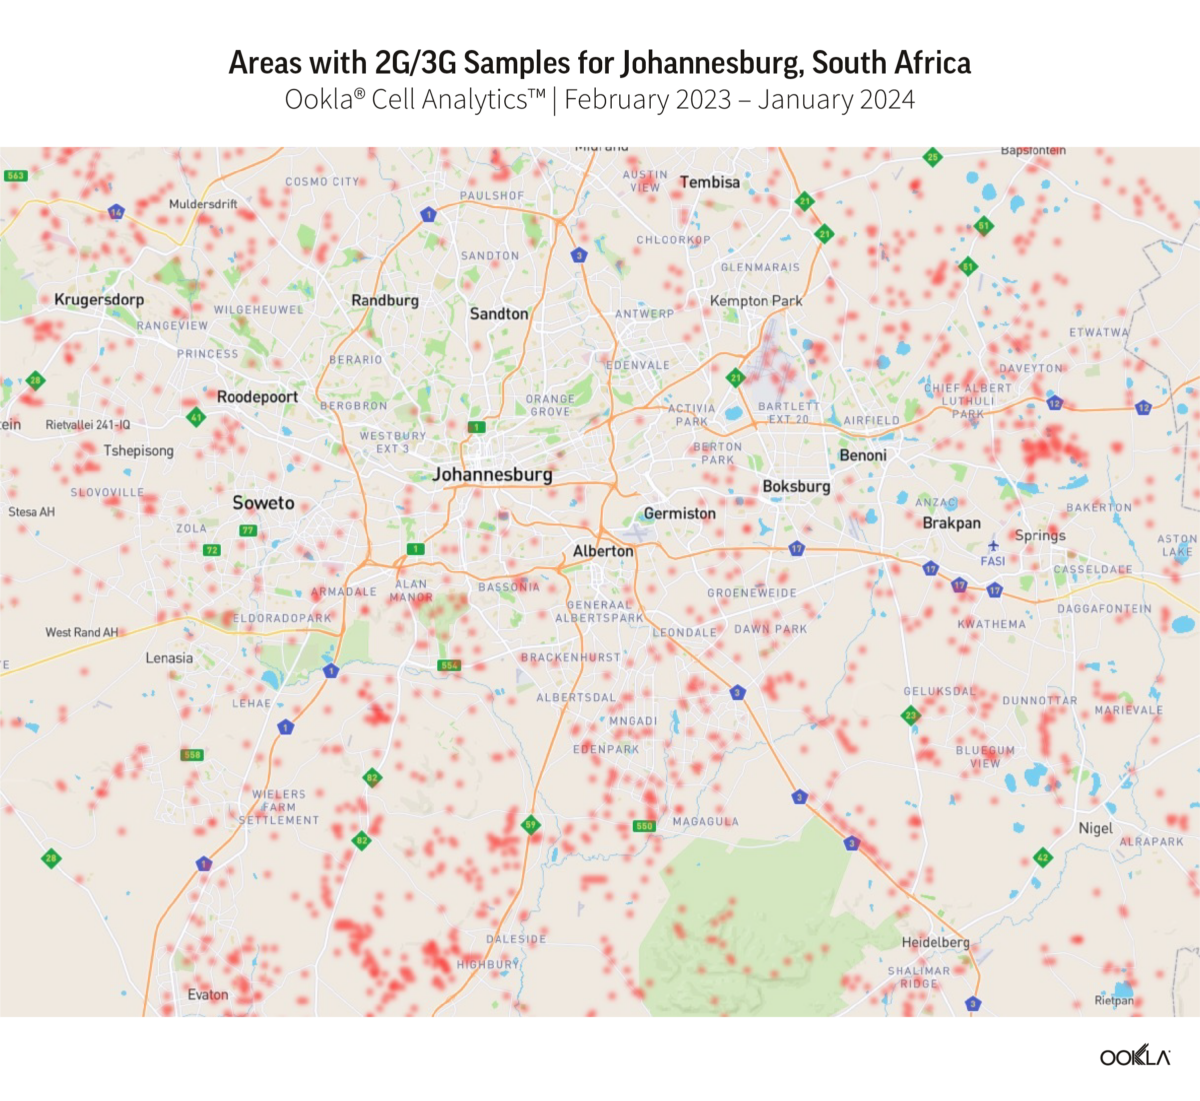
Cell Analytics’ Service Availability maps show that 2G and 3G remain prevalent in suburban and rural areas of major cities like Cape Town, Johannesburg, and Pretoria. While South Africa leads SSA in 4G and 5G penetration, 3G is still widespread and offers a satisfactory experience for basic use cases like checking the news. 2G is less relevant since it supports mainly voice services but occupies a valuable sub-1Ghz spectrum which could be repurposed for more efficient technologies.

In light of this, the Department of Communications and Digital Technologies (DCDT) proposed a plan in 2022 to sunset 2G and 3G networks to free up spectrum for 5G and future technologies. Initially, the plan aimed to shut down 2G and 3G networks by the end of June 2024 and March 2025, respectively. The DCDT subsequently extended the deadlines twice to give more time for the operators to prepare for the transition. The most recent amendment was in February 2024, scheduling the phase-out to begin in June 2025 and conclude by the end of 2027. It will also include new spectrum auctions, likely to take place in 2024

The revised deadline seems to be more practical, but it still needs to be discussed with all the stakeholders to make sure that the end-users and businesses don’t face any challenges during this transition. The DCDT will allow operators to choose which network to switch off first. Based on operators’ current positions on network retirement, 3G will likely be the first to go:

  • Vodacom’s initial plan was to end 3G services before 2G, but their latest stance is less definitive. Their decision will significantly impact Cell C, whose contract customers use Vodacom’s network.
  • Telkom has already shut down most 2G services as they account for less than 1% of its traffic.
  • MTN suggested that 3G should be shut down before 2G, as migrating 2G devices to 4G will take longer than moving from 3G. This presents a challenge as MTN has the highest proportion of 3G samples in South Africa, (according to Speedtest data) at 6.35% in January 2024 compared to 3.4% for Vodacom and 3.3% for Telkom.

A phased approach to retiring networks, with consideration for affordability and coverage, is essential to maintain digital inclusiveness

The sunsetting of 2G and 3G networks is a global trend, led by developed countries. It promises to bring benefits like faster data speeds, improved connectivity, and more efficient spectrum usage. Yet, Sub-Saharan Africa trails in this transition because of the heavy reliance on legacy networks, the cost barrier to the operators and consumers, and the unequal distribution of new network infrastructure, especially in poorer regions. 

2G and 3G networks form the backbone of mobile communications for a large proportion of the population, enabling vital services such as voice and mobile money transactions. Operators thus face the challenge of investing in advanced network rollouts while maintaining and even expanding their legacy networks to ensure everyone has access to communication services. 

Using network analytical tools such as Ookla’s Speedtest Intelligence and Cell Analytics can provide valuable insights to help prepare for network decommissioning. These tools can track the progress of the switch off, and monitor its impact on network and spectrum usage as well as gauge consumer sentiment, ensuring that the transition to 4G and 5G is as smooth and beneficial.

Ookla retains ownership of this article including all of the intellectual property rights, data, content graphs and analysis. This article may not be quoted, reproduced, distributed or published for any commercial purpose without prior consent. Members of the press and others using the findings in this article for non-commercial purposes are welcome to publicly share and link to report information with attribution to Ookla.
| May 8, 2023

New Speedtest Data Shows Starlink Users Love Their Provider

Satellite internet competition is heating up and Ookla® has exciting, fresh data from Q4 2022 and Q1 2023 for HughesNet, SpaceX’s Starlink, and Viasat in North America, South America, and the Caribbean, as well as new Starlink markets we haven’t yet featured in our ongoing satellite internet series

This analysis includes Starlink Net Promoter Score (NPS) for metro and nonmetro internet connections in the United States, year-over-year data for Starlink in Canada, Chile, Mexico, and the U.S., and Starlink results from three new countries (Philippines, Nigeria, and Peru).

Starlink users in metro and nonmetro areas love Starlink, fixed broadband users dislike their internet service providers

Using Speedtest Intelligence®, we examined NPS ratings by Starlink users and all fixed broadband providers combined for “metropolitan” and “nonmetropolitan” counties as defined by the U.S. Office of Management and Budget. NPS based on Speedtest® user responses after being asked how likely they are to recommend their provider to friends or family on a 0 to 10 scale. NPS ratings are categorized into Detractors (score 0-6), Passives (score 7-8), and Promoters (score 9-10), and is calculated as (% Promoters – % Detractors) x 100. Any NPS score above 0 indicates that a provider’s audience is more loyal than not.

Chat of Metropolitan vs. Nonmetropolitan NPS and Performance in the United States

As you see above, the difference in NPS between Starlink and all fixed broadband providers combined is stark: both metro and nonmetro Starlink far outperformed metro and nonmetro ISPs combined for NPS. Metro Starlink had a score of 31.94 compared to -23.62 for all metro fixed broadband providers combined, despite Starlink having a median download speed of 65.29 Mbps compared to 203.93 Mbps for all metro fixed broadband providers combined. Nonmetro Starlink had an even higher NPS at 42.21 compared to nonmetro ISPs at -21.27 — that’s especially notable given that Starlink’s median download speed was much closer to the median nonmetro fixed broadband speed at 72.18 Mbps to 100.41 Mbps. 

Clearly, Starlink provides a much loved option for more rural, nonmetro users who often don’t have many good — if any — internet options. And the message is loud and clear: Starlink users are more than willing to recommend the service and love the internet they are getting.

Starlink speeds increased in Canada and the U.S. over the past two quarters, but are mixed year-over-year

Chart of Starlink Performance in Select Countries in North and South America

As Starlink continues to become an increasingly popular and beloved option for users, especially those in more rural areas, steady increases in speeds in two large markets like Canada and the U.S. bode well for the internet provider. These increases come as major upgrades to Starlink’s satellite array are beginning, with Starlink having just launched 46 nextgen satellites on April 27, so we wouldn’t be surprised if speeds keep climbing across the globe.

In North America, all of the countries we surveyed saw slower median download and upload speeds during Q1 2023 than Q1 2022. However, Canada saw just about a 3 Mbps decrease in download speed from Q1 2022 to Q1 2023, with about a 28 Mbps increase over the past two quarters. The U.S., where Starlink has many more users, saw about a 24 Mbps decrease year-over-year for median download speeds, but at least a 13 Mbps increase during Q4 2022 and Q1 2023. Mexico, which saw 100+ Mbps median download speeds during Q1 2022, saw a roughly 49 Mbps dip year-over-year as more users signed up for the service; however, speeds leveled slightly with only an overall dip of about 8 Mbps during the past two quarters.

In South America, Chilean Starlink speeds slowed about 22 Mbps from Q1 2022 to Q1 2023, however, speeds only slowed about 8 Mbps over the past two quarters. Chile has continually ranked in the top four for fastest fixed broadband speeds on the Speedtest Global Index™ for over a year now. 

Starlink in Canada blazed ahead as the fastest satellite provider in mainland North America

Chart of Satellite vs. Fixed Broadband Internet in North America

Speedtest Intelligence reveals that Starlink in Canada had the fastest download speed among satellite providers in mainland North America at 93.97 Mbps. That was about 40% faster than the runner-up, which was Starlink in the U.S. at 66.59 Mbps. Starlink in Mexico was next at 56.42 Mbps, and was faster than all fixed broadband providers in Mexico combined at 50.46 Mbps. 

Viasat in Canada, Mexico, and the U.S. made noticeable performance leaps over download speed from Q3 2022 when we last measured North American satellite providers. Canada went from 24.36 Mbps in Q3 2022 to 48.24 Mbps in Q1 2023, the U.S. from 28.07 Mbps to 36.47 Mbps, and Mexico from 16.14 Mbps to 24.06 Mbps. Hughesnet trailed over download speed in the U.S. (16.32 Mbps) and in Mexico (12.98 Mbps).

For upload speeds, all satellite providers trailed fixed broadband speeds in their respective countries, with Starlink in Canada achieving the fastest satellite upload speed at 9.60 Mbps, followed by Starlink in Mexico (8.47 Mbps) and the U.S. (7.74 Mbps). Viasat and HughesNet trailed behind.

Multi-server latency showed the stark difference of satellite internet’s real limitations, with the huge distances between satellite and users adding up to longer lag times than fixed broadband. Starlink had the only latencies under 100 ms among satellite providers, with Starlink in the U.S. having the lowest latency at 62 ms, followed by Canada (70 ms) and Mexico (97 ms). Viasat and HughesNet, which have farther geosynchronous orbits (GEO) than Starlink’s low-earth orbit (LEO), had much higher latencies.

Starlink in Chile raced ahead as the fastest satellite provider in South America

Chart of Satellite vs. Fixed Broadband Internet in South America

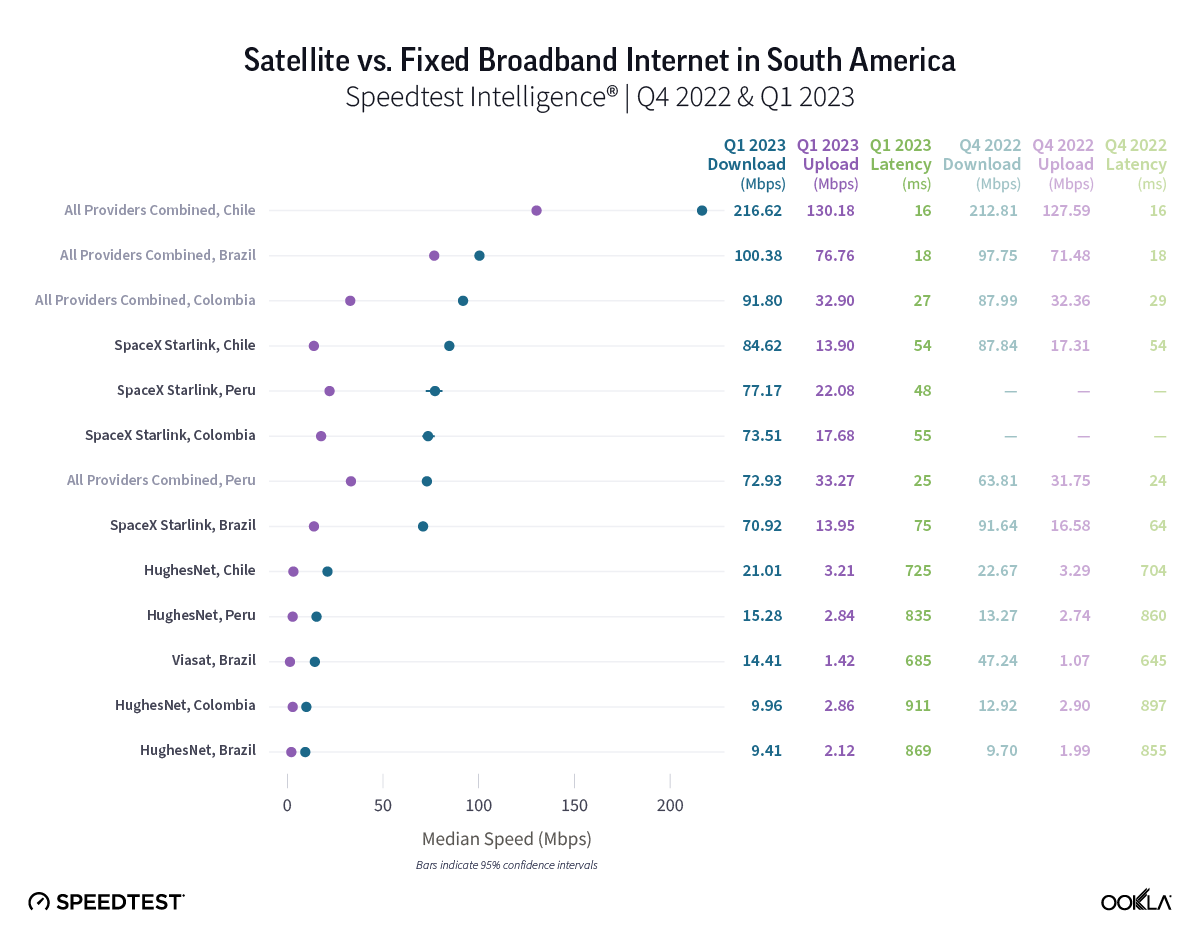
Starlink in Chile was the fastest satellite provider in South America during Q1 2023, edging out Starlink in Peru by about 5% with a median download speed at 84.62 Mbps to 77.17 Mbps. No satellite provider outperformed all fixed broadband providers combined in Q1 2023, but Starlink in Colombia and Brazil both reached median download speeds above 70 Mbps at 73.51 Mbps and 70.92 Mbps, respectively. HughesNet in Chile broke 20 Mbps at 21.01 Mbps, while Viasat in Brazil only reached 14.41 Mbps.

Satellites were outperformed by fixed broadband over upload speed in South America during Q1 2023, but Starlink had median upload speeds that ranged from 13.90 Mbps to 22.08 Mbps, the fastest being in Peru. HughesNet ranged from 2.12 Mbps to 3.21 Mbps, and Viasat in Brazil was at 1.42 Mbps.

Starlink’s multi-server latency dipped below 60 ms in three South American markets during Q1 2023: Peru (48 ms), Chile (54 ms), and Colombia (55 ms). Brazil followed at 75 ms, which was the next lowest. Viasat and HughesNet trailed far behind.

Starlink in Jamaica was the fastest Caribbean satellite provider

Chart of Satellite vs. Fixed Broadband Internet in the Caribbean

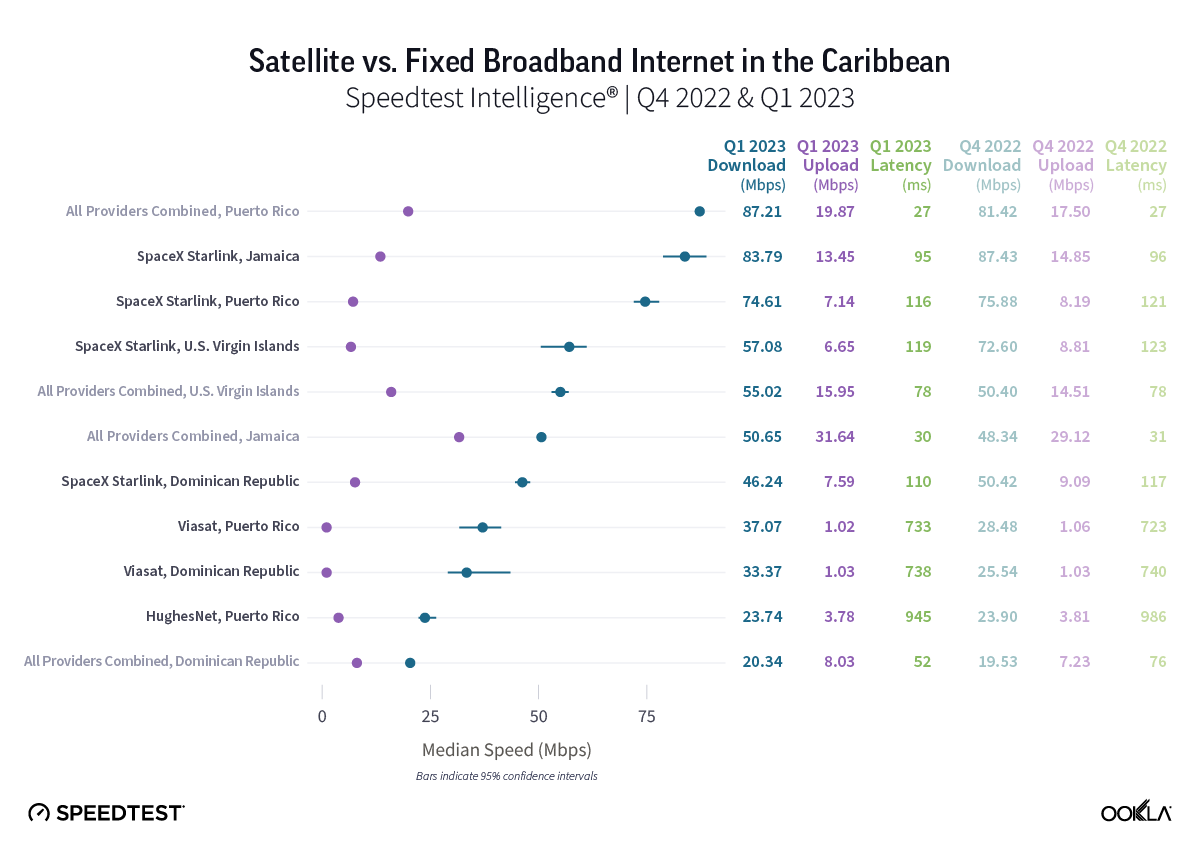
Speedtest Intelligence reveals that Starlink in Jamaica was the fastest satellite provider in the Caribbean at 83.79 Mbps during Q1 2023. Starlink was faster than all fixed broadband providers in Jamaica, and both Starlink and Viasat were faster than all providers combined in the Dominican Republic during Q1 2023. Starlink reached median download speeds of over 50 Mbps during Q1 2023 in Jamaica (83.79 Mbps), Puerto Rico (74.61 Mbps), and the U.S. Virgin Islands (57.08 Mbps), while it fell just short of that benchmark in the Dominican Republic (46.24 Mbps). Viasat had median download speeds of 37.07 Mbps and 33.37 Mbps in Puerto Rico and the Dominican Republic, respectively, during Q1 2023, while HughesNet had a median download speed of 23.74 Mbps in Puerto Rico during Q1 2023.

Upload speeds showed a bit more parity between satellite providers with only Starlink in Jamaica rising above 10 Mbps with a median upload speed of 13.45 Mbps during Q1 2023. Starlink had median upload speeds ranging from 6.65 Mbps to 13.45 Mbps, HughesNet had a median upload speed at 3.78 Mbps in Puerto Rico, and Viasat had upload speeds of 1.02 Mbps and 1.03 Mbps in Puerto Rico and the Dominican Republic, respectively, during Q1 2023. 

For multi-server latency, Caribbean satellite users saw higher multi-server latencies than mainland North and South America with only Starlink in Jamaica breaking under 100 ms. While fast speeds for remote users are always going to be appreciated, multi-server latencies of over 100 ms do make some internet uses much harder to do well like live gaming and video conferencing.

New Q1 2023 Starlink countries show promising initial results

Chart of Satellite vs. Fixed Broadband Internet in Select Countries

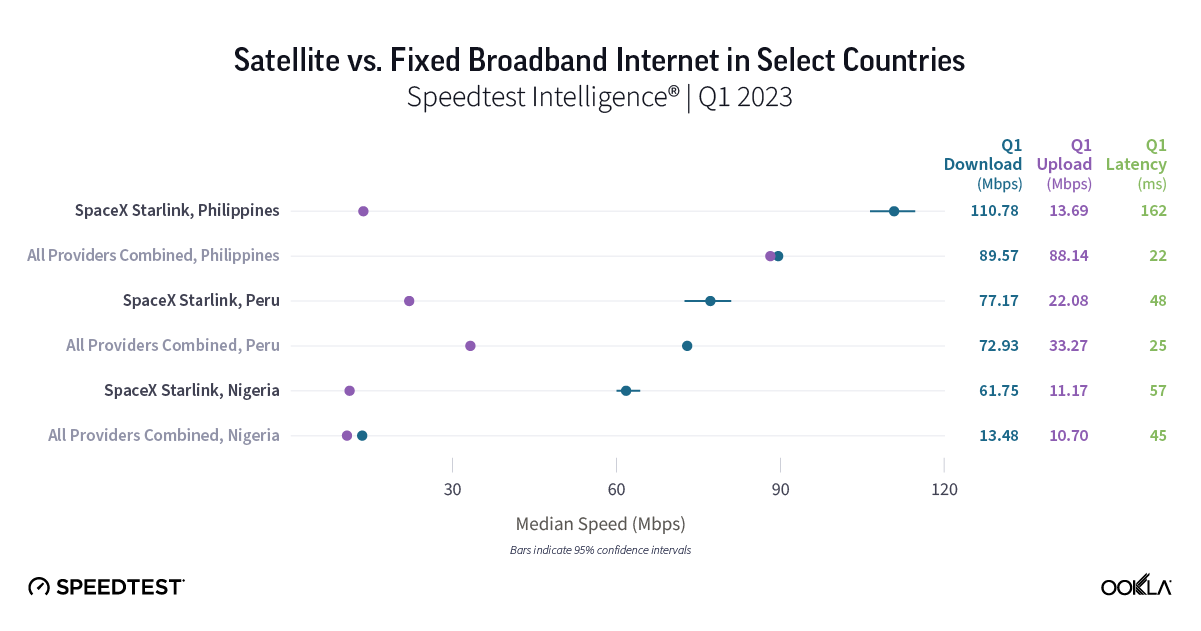
Speedtest Intelligence data shows new Starlink data in three countries during Q1 2023, including Nigeria, Peru, and the Philippines, where Starlink is still a nascent provider with limited market share. Median download speeds for new Starlink countries were: 110.78 Mbps in the Philippines, 77.17 Mbps in Peru, and 61.75 Mbps in Nigeria during Q1 2023. 

Starlink had slower upload speeds than all fixed broadband providers combined in all of the new countries except Nigeria, which was too close to call at 11.17 Mbps to 10.70 Mbps. Starlink had a much higher latency than fixed broadband providers in the Philippines (162 ms) in Q1 2023, though it came very close in Nigeria 57 ms to 46 ms. 

It should be noted that satellite constellations have limited network bandwidth capacity, which may affect the consumer experience as more users sign up for the service. Starlink’s reach within these markets will also be limited by the cost of equipment (CPE) in particular, which ranges from PEN 1,750 ($470) in Peru, to PHP 29,320 ($530) in the Philippines and NGN 268,584 ($590) in Nigeria (prices correct at time of publication).

The 2023 space revolution is off to a huge start

Here are some major updates about what’s next for various different satellite competitors:

Amazon’s Project Kuiper showcases low-cost customer satellite terminals

After Amazon’s Project Kuiper 3,236 satellite LEO constellation was greenlit by the FCC, Amazon swiftly moved to showcase its consumer terminals in March. These new terminals have different tiered models, which are promised to deliver 100 Mbps and 400 Mbps models for consumers and businesses, and 1 Gbps models for “enterprise, government, and telecommunications applications that require even more bandwidth.” Furthermore, Amazon is getting into the chipset business and producing their own 5G modem chip, which will feature in each terminal.

Viasat launched its Viasat-3 arrays

On April 30, 2023, Viasat launched the first of three long-awaited Viasat-3 arrays, which aims to provide 1 Terabit per second (Tbps) of network capacity on each satellite, double that of the entire operating fleet. Add two more satellites and Viasat could raise the throughput up to 500-600% of its current network capacity. That could allow its users to experience 100+ Mbps connections — a huge improvement for many consumers. We’ll be eagerly anticipating results in the coming quarters.

Eutelsat, OneWeb, and Intelsat are making big moves

While the merger of Eutelsat and OneWeb has yet to be fully completed, both satellite operators inked major deals with Intelsat to add more global satellite capacity. Furthermore, OneWeb launched an additional 36 LEO satellites into orbit in late March 2023, providing additional options for many of its resellers. 

European Union greenlights multi-orbit constellation

The European Union has approved its multi-orbit, €6 billion constellation plan, which includes GEO, MEO, and LEO arrays, and will offer connectivity to all EU citizens. The project will support EU connectivity priorities including the economy, environment, security and defense, and is hoping to launch in 2024, and be fully operational by 2027.

HughesNet aiming to launch Jupiter 3 array in Q2 2023

Incumbent satellite internet provider HughesNet has revealed its new Jupiter 3 array, which is designed to offer 500 Gbps over Ka-band and will allow HughesNet to provide consumers offerings of 50 Mbps and 100 Mbps. While the array still doesn’t have an official launch, the Jupiter 3 array is “doubling the size of the Hughes JUPITER fleet over North and South America.”

Ookla will continue monitoring new satellite internet developments

As 2023 continues to shape up as a pivotal year for satellite internet providers, we’ll be watching the sky to make sure providers are providing the connectivity consumers need. We’ll continue our series next quarter with Q1 and Q2 2023 data from Asia, Europe, Oceania, and any new countries where Starlink launches, and be back with Africa, North America, and South America data in Q4 2023. In the meantime, be sure to download the Speedtest® app for Windows and Mac computers or for iOS or Android for devices and see how your satellite internet stacks up to our findings.

Editor’s note: This article was updated on May 10 with clarifying details and an updated chart.

Ookla retains ownership of this article including all of the intellectual property rights, data, content graphs and analysis. This article may not be quoted, reproduced, distributed or published for any commercial purpose without prior consent. Members of the press and others using the findings in this article for non-commercial purposes are welcome to publicly share and link to report information with attribution to Ookla.
| September 18, 2023

New Speedtest Data Shows Starlink Performance is Mixed — But That’s a Good Thing

Satellite providers are playing no small part in the rapid expansion of global connectivity. Some experts predict there will be 58,000 satellites orbiting the earth by 2030 — a nearly 725% increase from 2023. Ookla® is back with our ongoing satellite internet series with compelling, fresh data for satellite providers in Africa, Europe, and Oceania during Q2 2023, including SpaceX’s Starlink, Viasat, and Skylogic.

This analysis includes Starlink Net Promoter Score (NPS) data for France, Germany, Italy, New Zealand, and the United Kingdom, year-over-year data for satellite providers in Europe and Oceania from Q2 2022 to Q2 2023, and new Q2 2023 data from Starlink in Africa.

Starlink users across different continents continue to love the service

Using Speedtest Intelligence®, we examined NPS ratings data for Starlink users against an aggregate of all fixed broadband providers combined. 

NPS is based on Speedtest® user responses after being asked how likely they are to recommend their provider to friends or family on a 0 to 10 scale. NPS ratings are categorized into Detractors (score 0-6), Passives (score 7-8), and Promoters (score 9-10), and is calculated as (% Promoters – % Detractors) x 100. Any NPS score above 0 indicates that a provider’s audience is more loyal than not.

Chart of NPS Performance in Select Countries

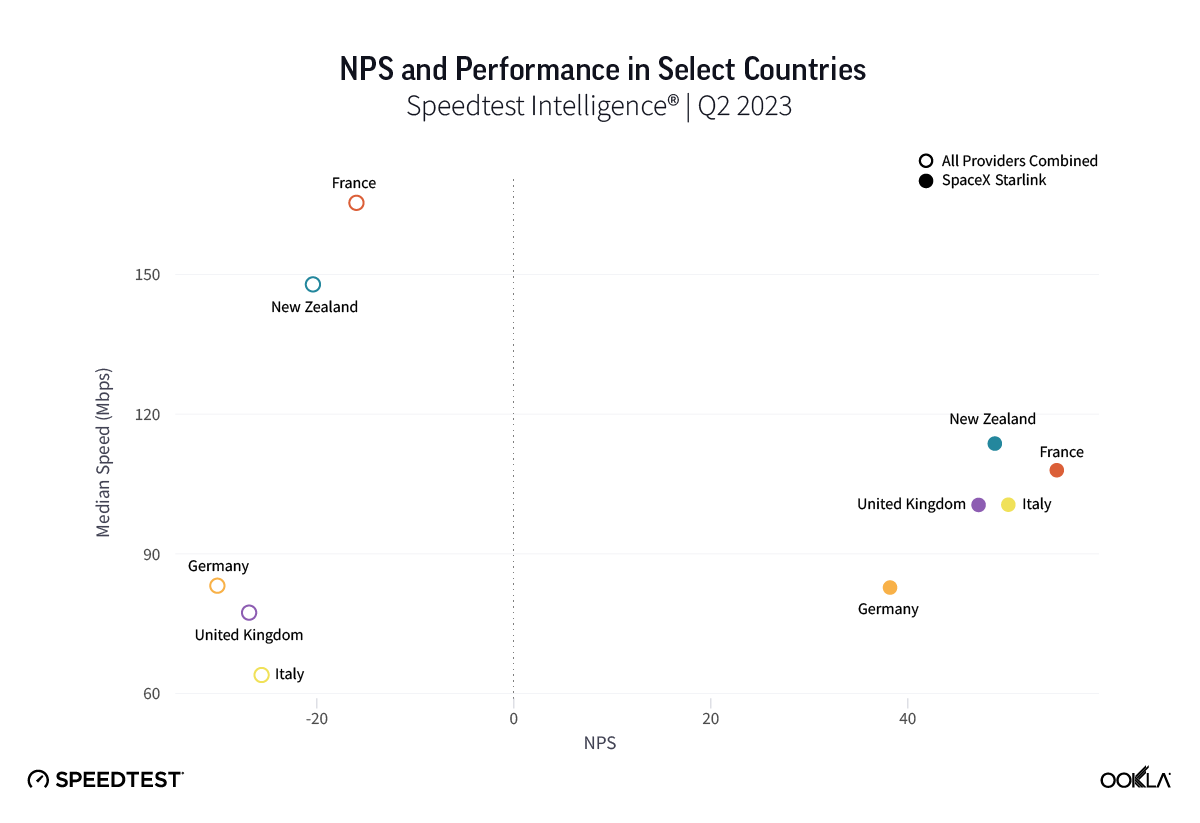
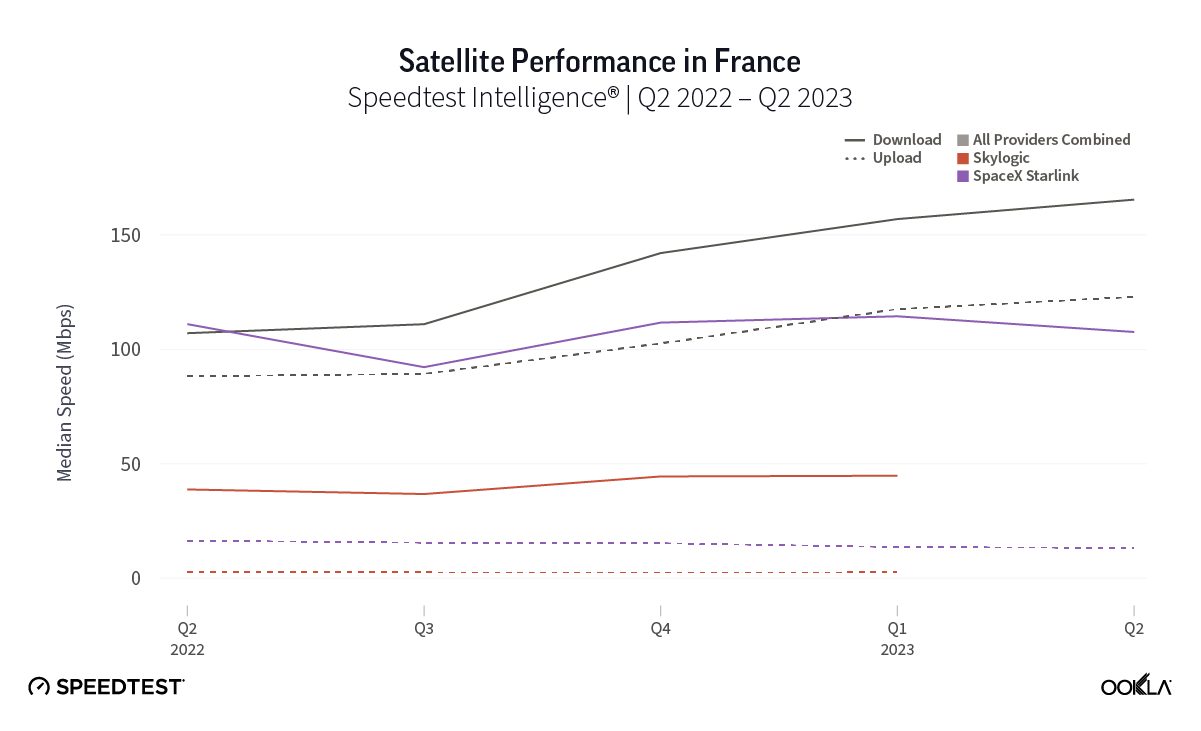
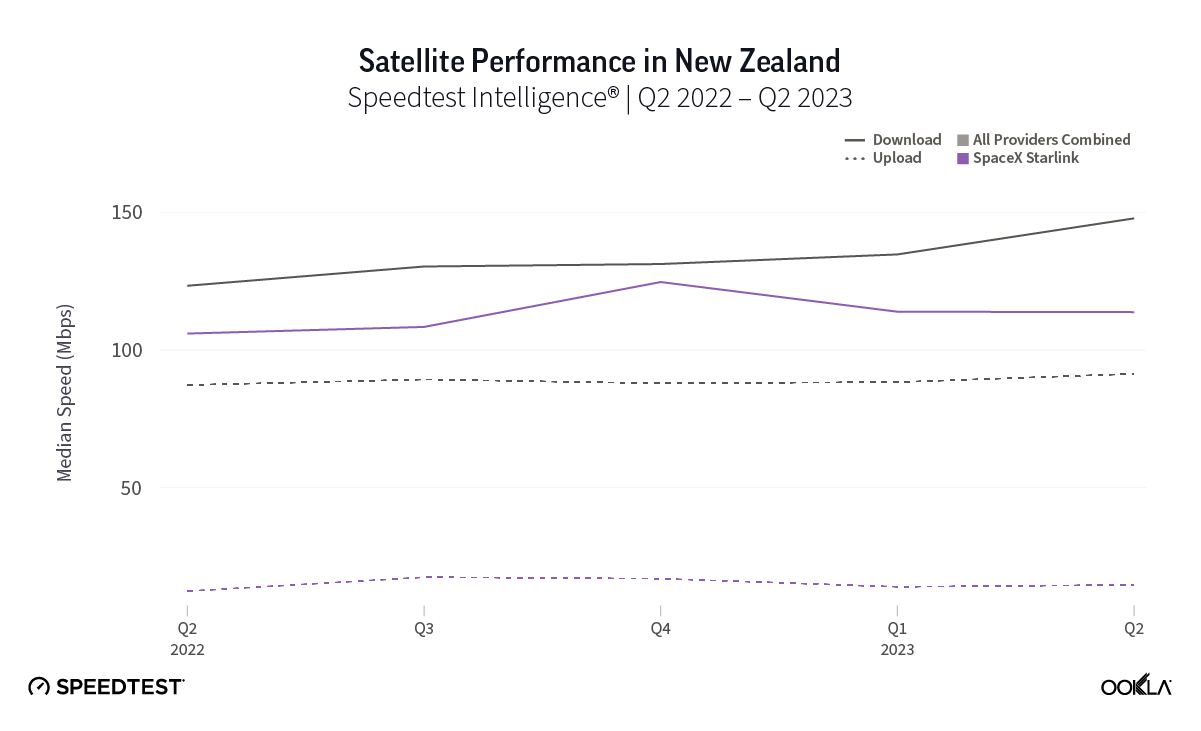
As you can see from the above image, Starlink users in France, Germany, Italy, New Zealand, and the U.K. had an NPS score much higher than the aggregate score for all fixed broadband providers combined during Q2 2023. France had the highest NPS among the aggregate of fixed broadband providers for the countries we surveyed at -15.98 and fixed broadband providers had a much faster median download speed at 165.37 Mbps to Starlink’s 107.56 Mbps. In New Zealand there was a similar story with the aggregate of fixed broadband providers having a -20.40 NPS to Starlink’s 48.83, while having a faster median download speed 147.86 Mbps to 113.78 Mbps during Q2 2023.

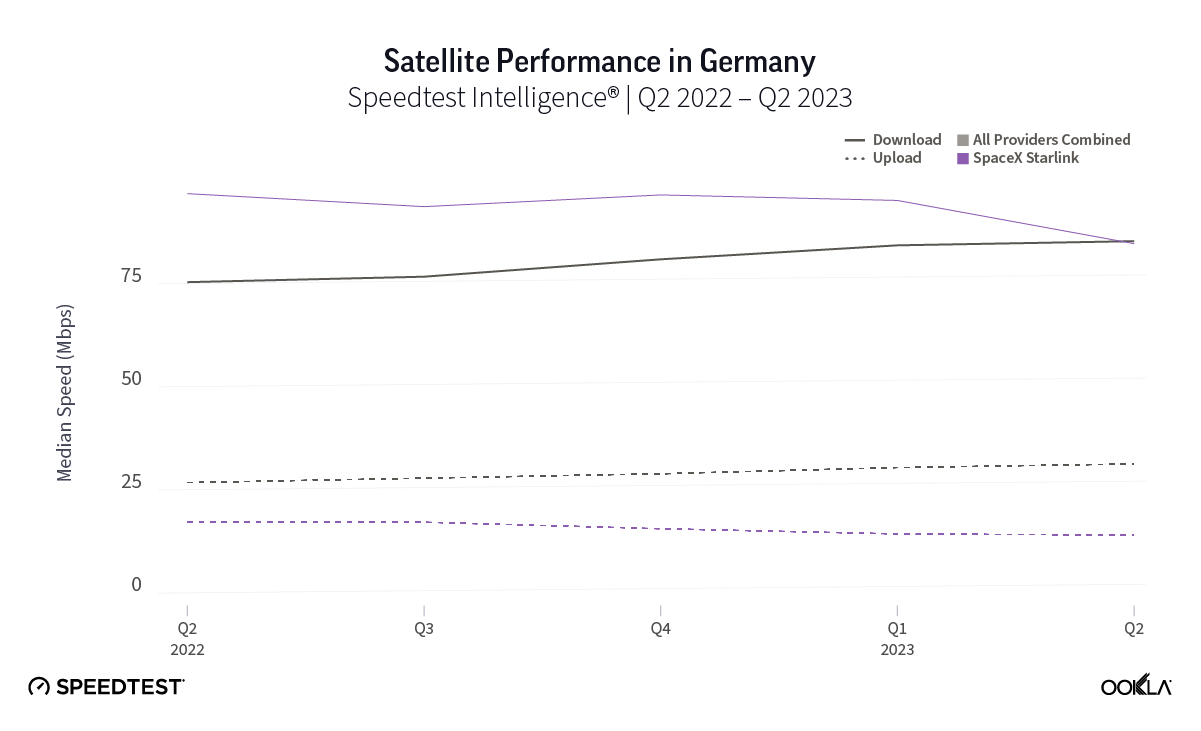
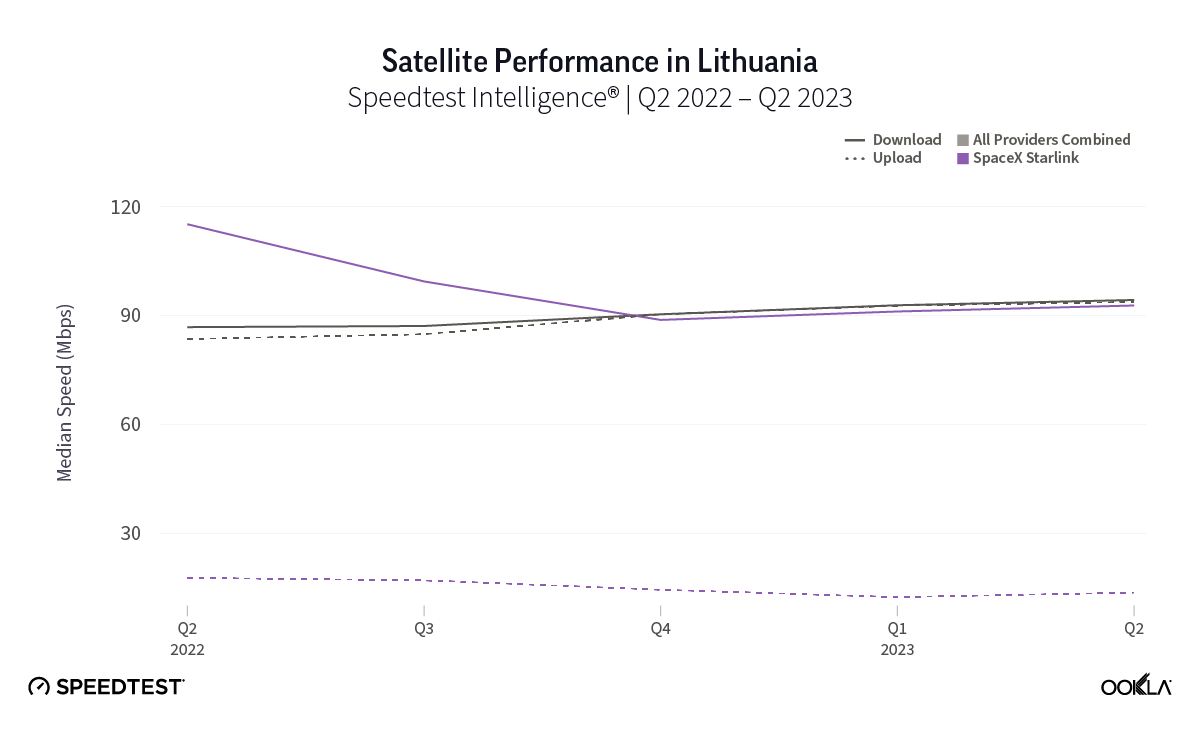
Germany, which had the lowest NPS rating of aggregate of fixed broadband providers in Europe at -30.10, also had the smallest difference in NPS with Starlink scoring 38.19. Interestingly, the aggregate of fixed broadband providers and Starlink both had similar median download speeds at 83.16 Mbps and 82.56 Mbps, respectively, during Q2 2023.

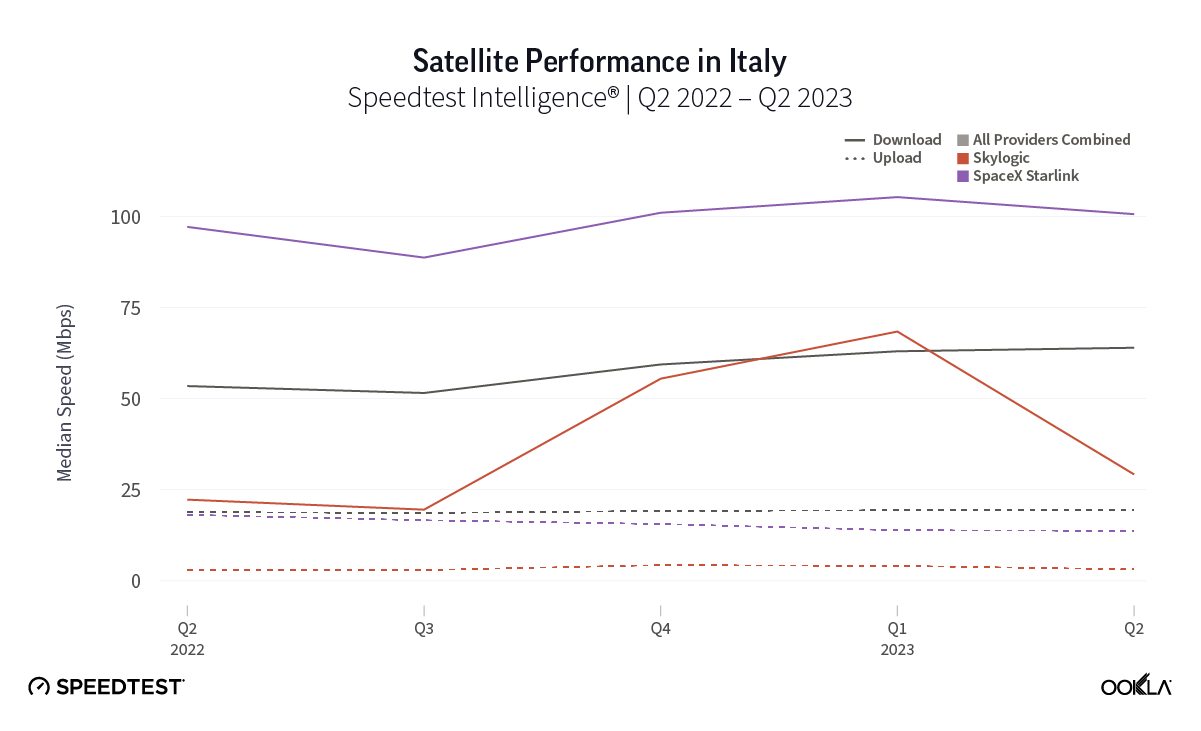
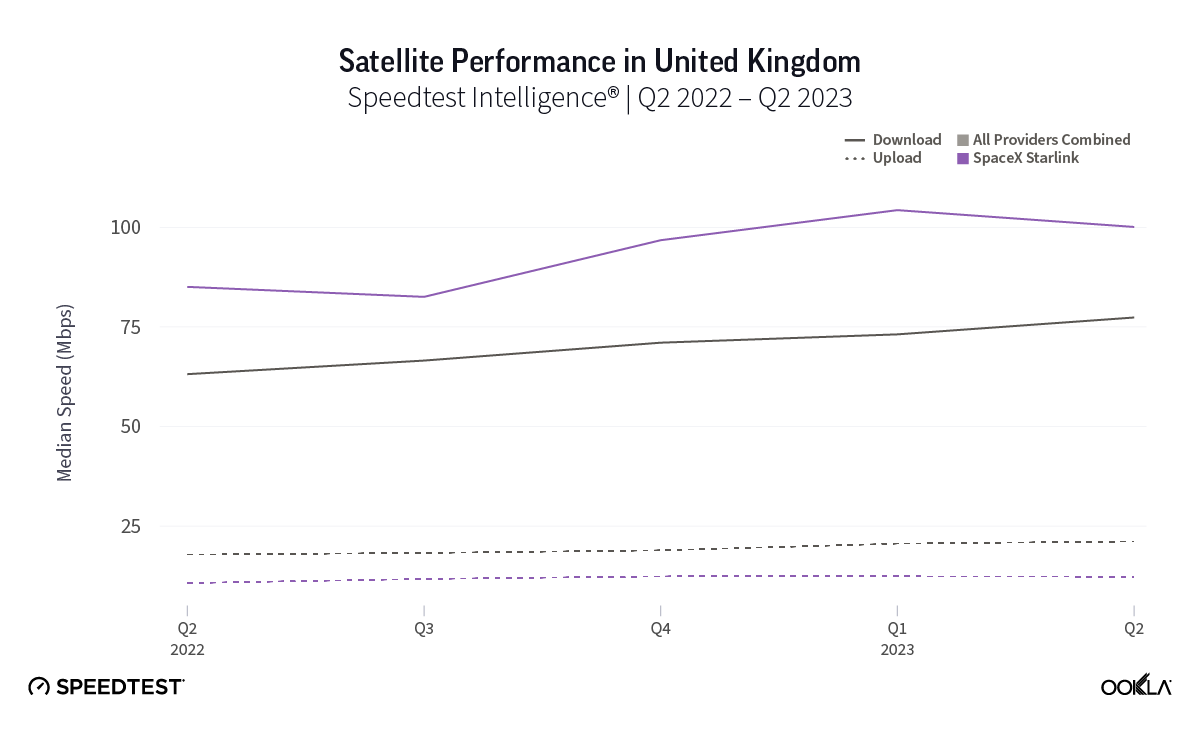
Of note, Starlink had much higher NPS ratings and median download speeds than the aggregate of all fixed providers combined in Italy and the U.K., respectively, during Q2 2023. Starlink’s NPS was 50.20 to -25.61 for the aggregate of all fixed broadband providers in Italy during Q2 2023, while the median download speeds were 100.68 Mbps to 63.99 Mbps. In the U.K., Starlink’s NPS was 47.18 to -26.88 for the aggregate of all fixed broadband providers combined, with the median download speeds a little closer, 100.11 Mbps to 77.38 Mbps, respectively. 

In our last report, we found a wide NPS gap between U.S. rural Starlink users — who often have fewer options for fixed broadband access — and the corresponding aggregate of fixed broadband providers. Given that all five of these countries have rural or remote regions that are underserved or not served by traditional broadband offerings, it may be no surprise that Starlink users who reside in those areas may feel positive about having access to fast broadband internet. 

Starlink speeds over 100 Mbps in 14 European countries during Q2 2023, speeds stabilizing across Europe

Key takeaways:

  • Starlink results were the fastest among satellite providers we surveyed.
  • Starlink quarter-to-quarter speeds improved or remained about the same (between 5% and -5%) in 23 countries, while decreasing in 4 countries.
  • Among the 27 European countries we surveyed, Starlink had median download speeds greater than 100 Mbps in 14 countries, greater than 90 Mbps in 20 countries, and greater than 80 in 24 countries, with only three countries failing to reach 70 Mbps.
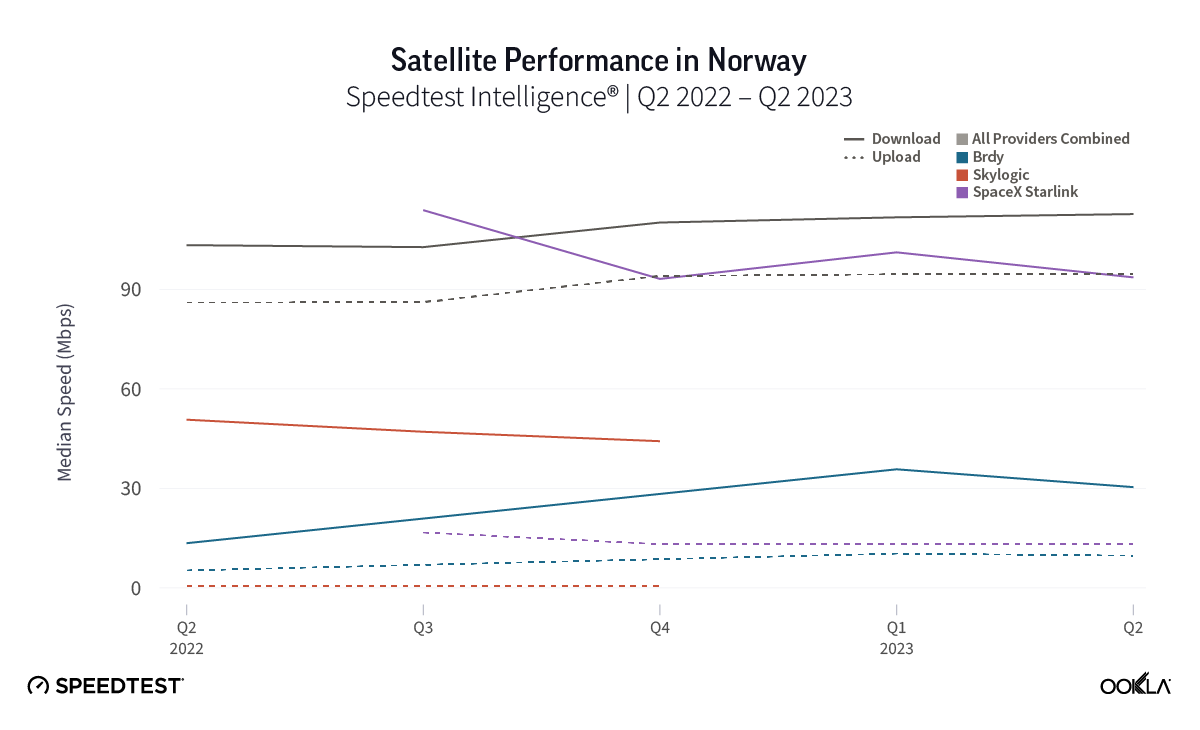
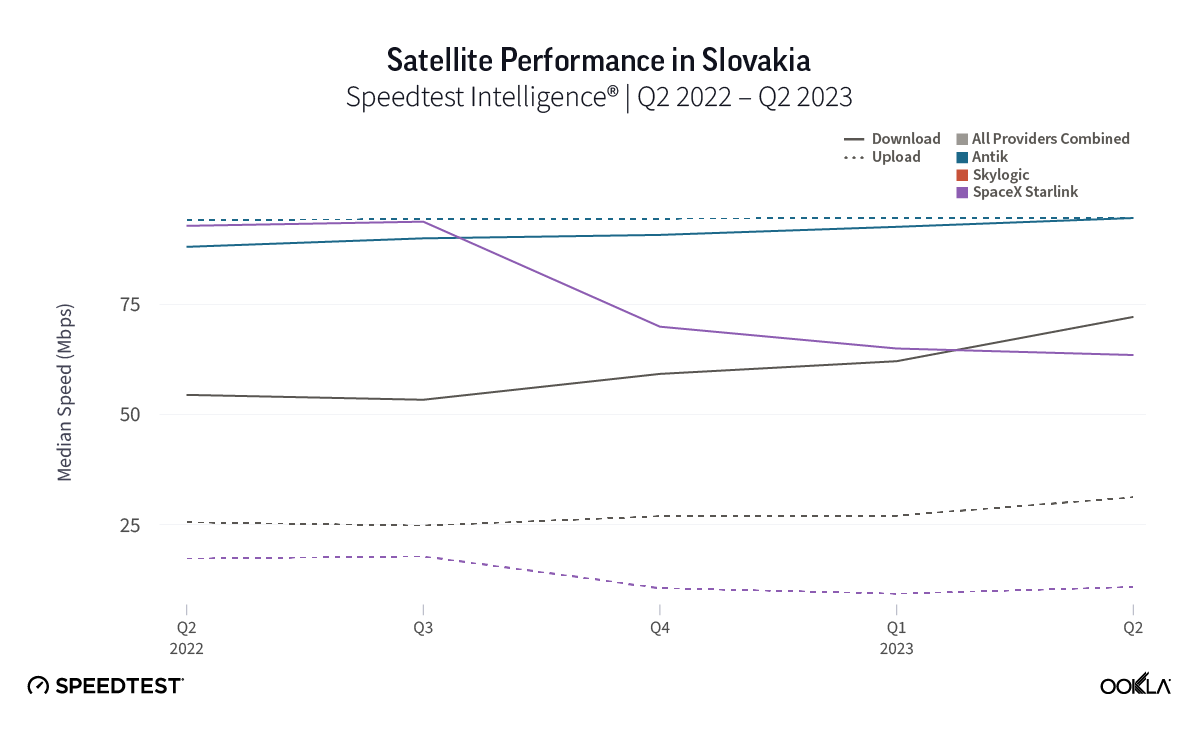
  • Skylogic, while delivering speeds slower than Starlink, showed stabilized broadband speeds over the past year for those seeking a Starlink alternative.

Over the past year, we’ve seen huge developments in the global satellite market, Europe notwithstanding, with Amazon’s Project Kuiper moving forward, the EU creating its own satellite constellation, and OneWeb and Eutelsat merging. While Starlink continues to lead for performance among satellite providers we surveyed, Starlink has experienced some major hurdles over the past year as users flock to the service and speeds have subsequently dipped — but of note those concerns seem to have started allaying in most of Europe during Q2 2023.

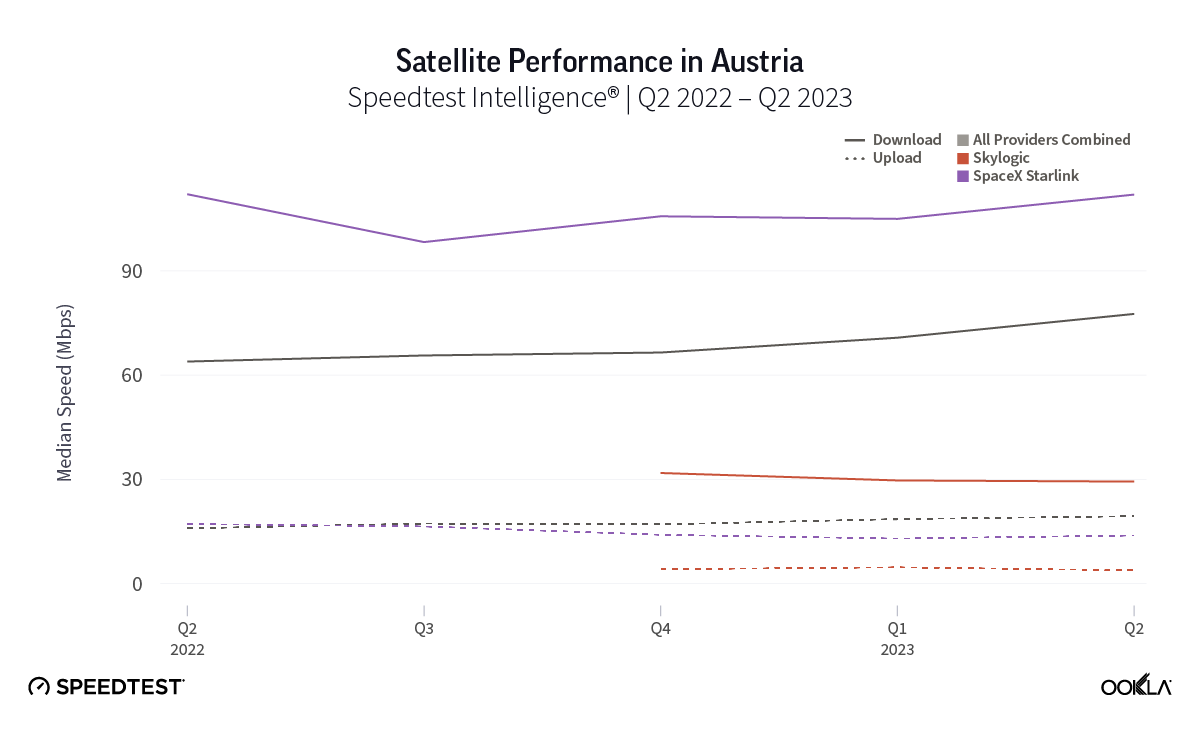
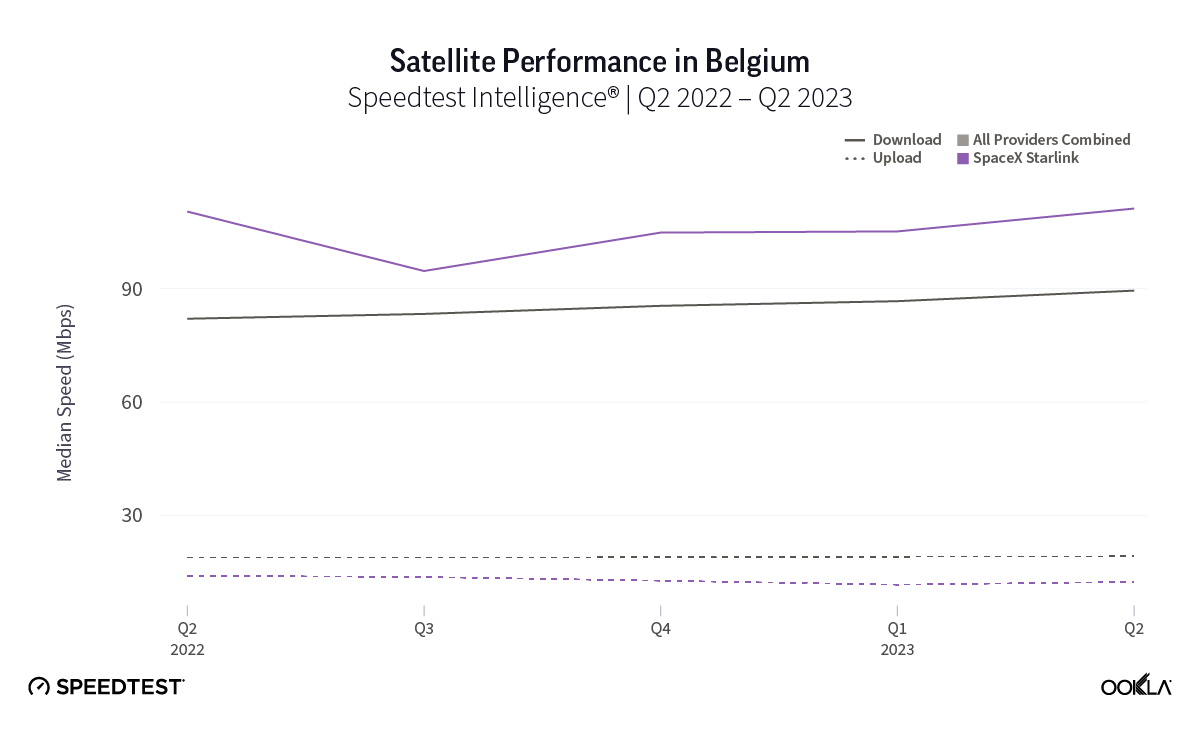
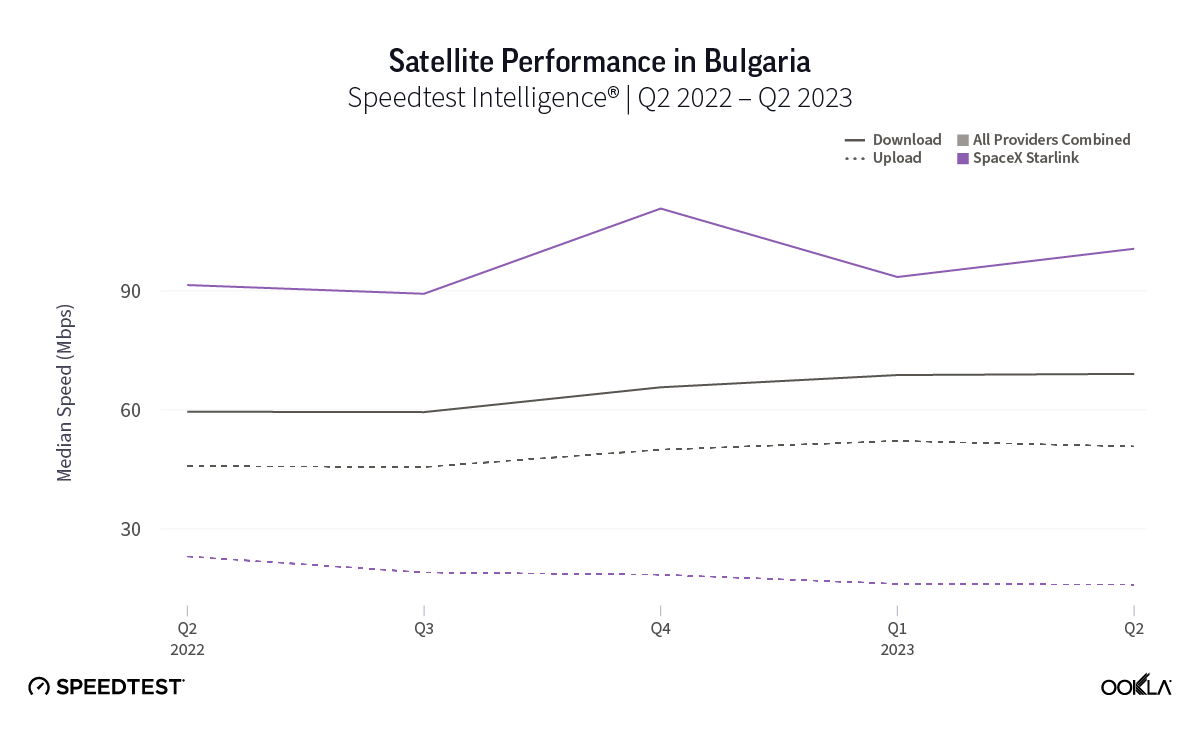
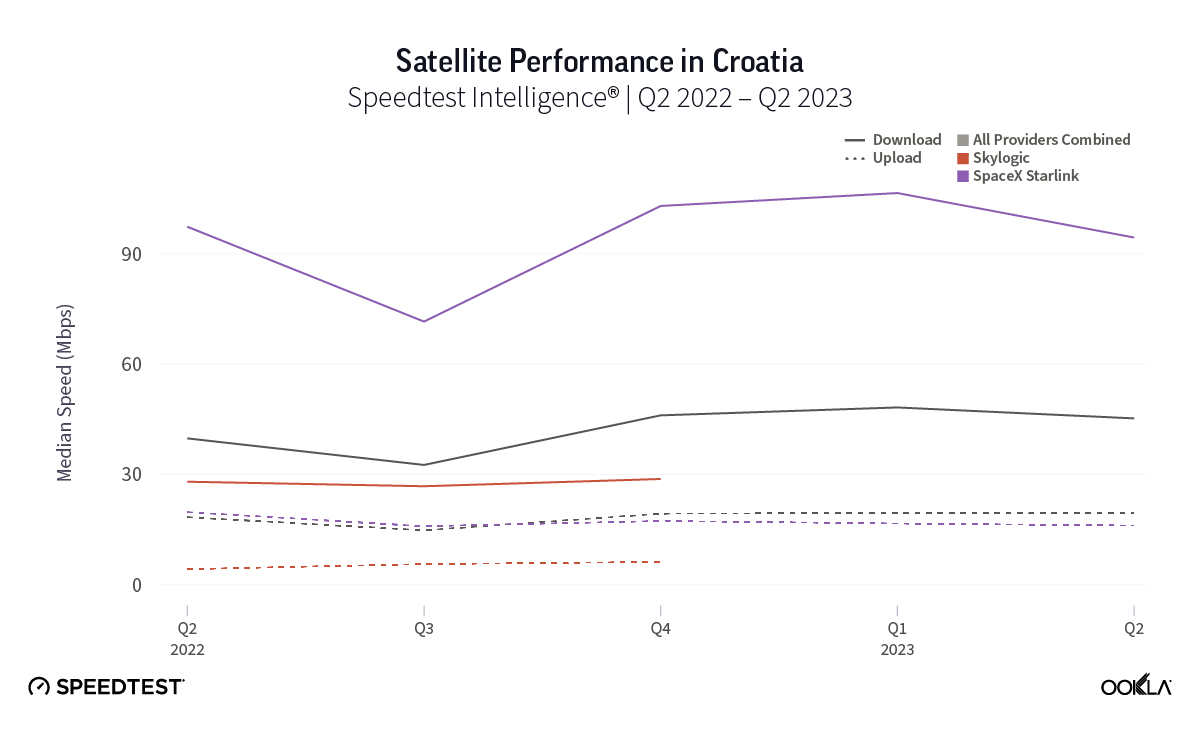
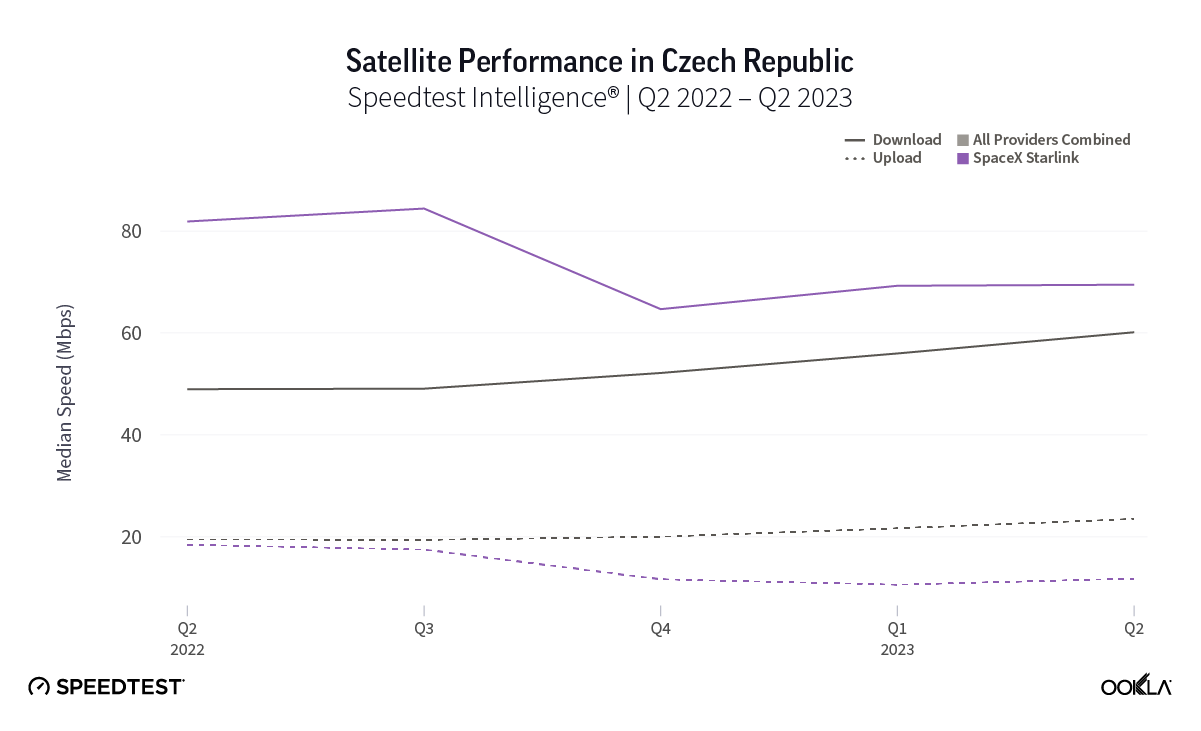
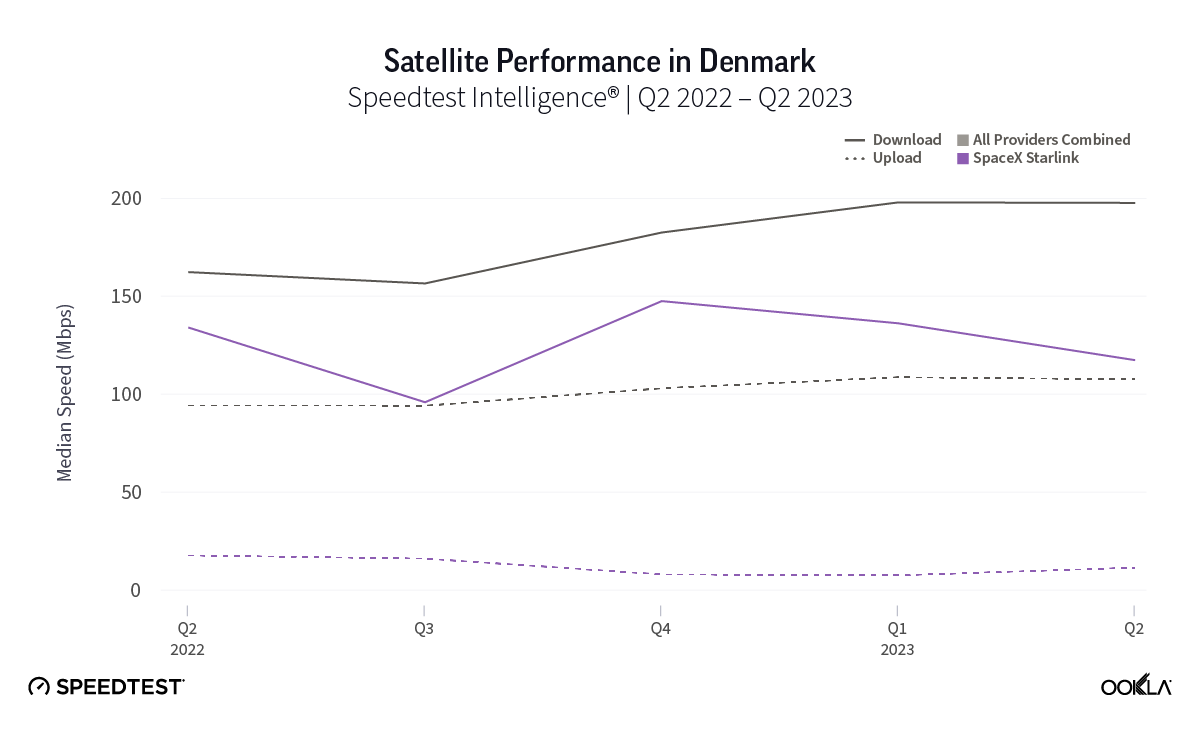
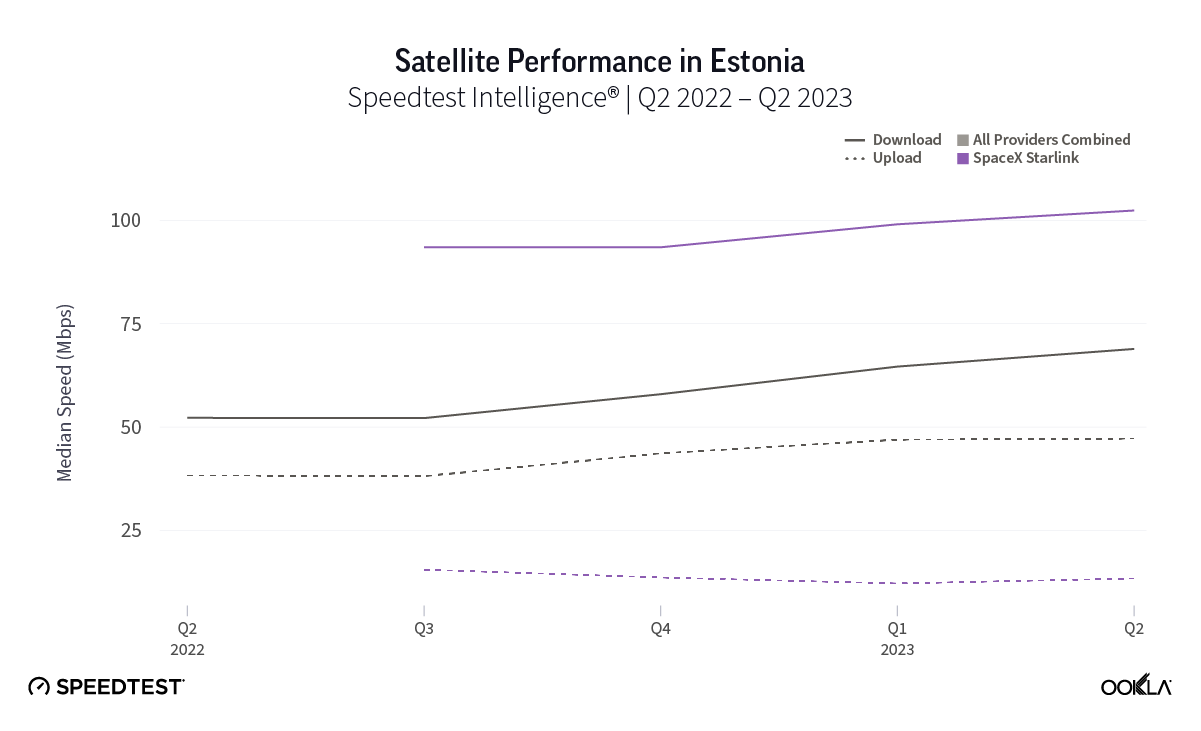
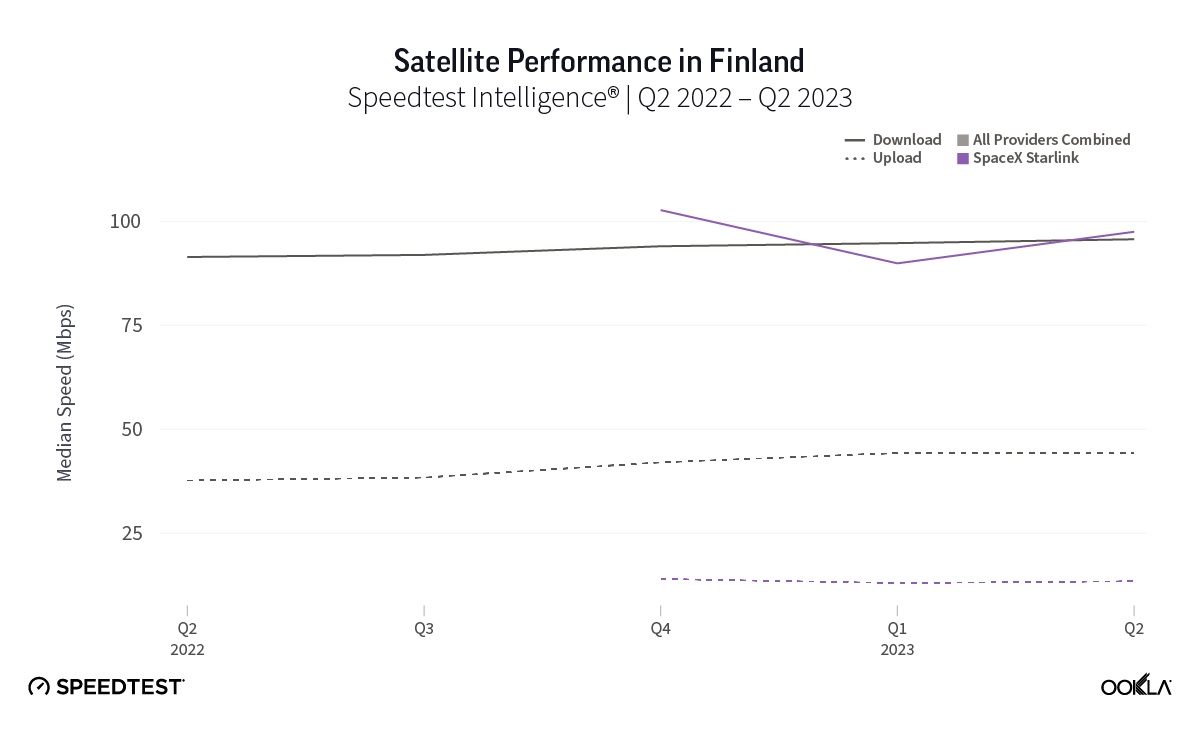
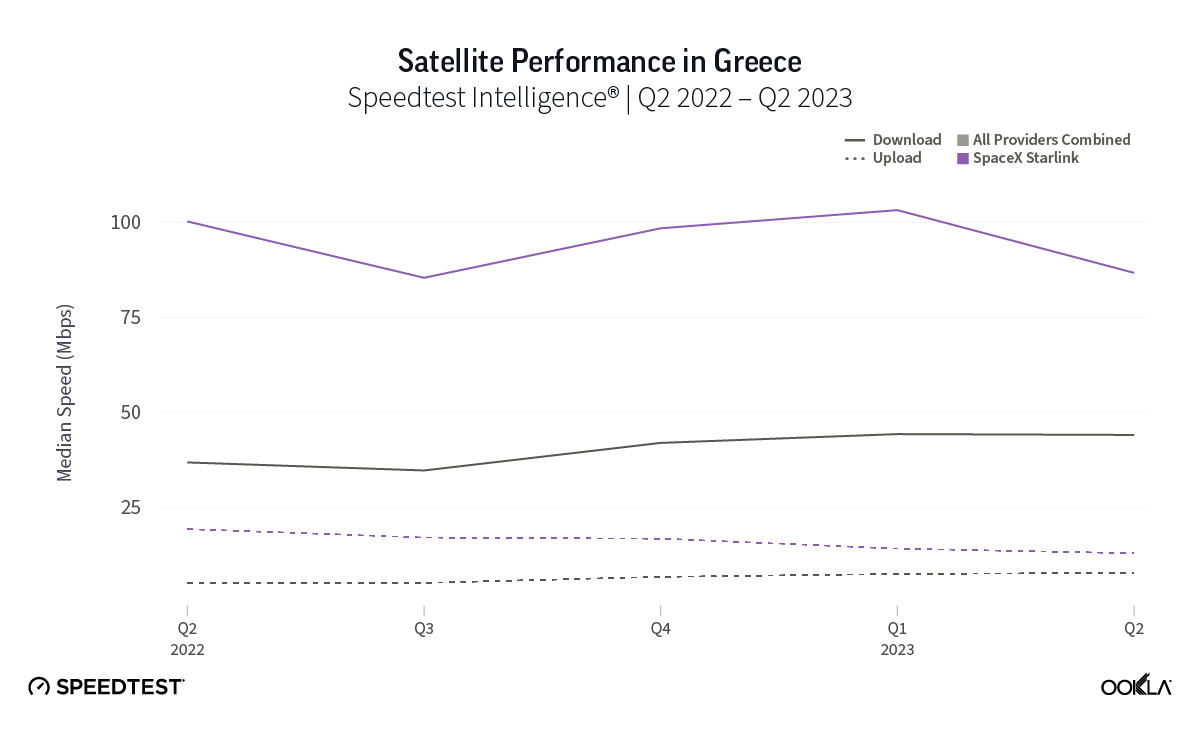
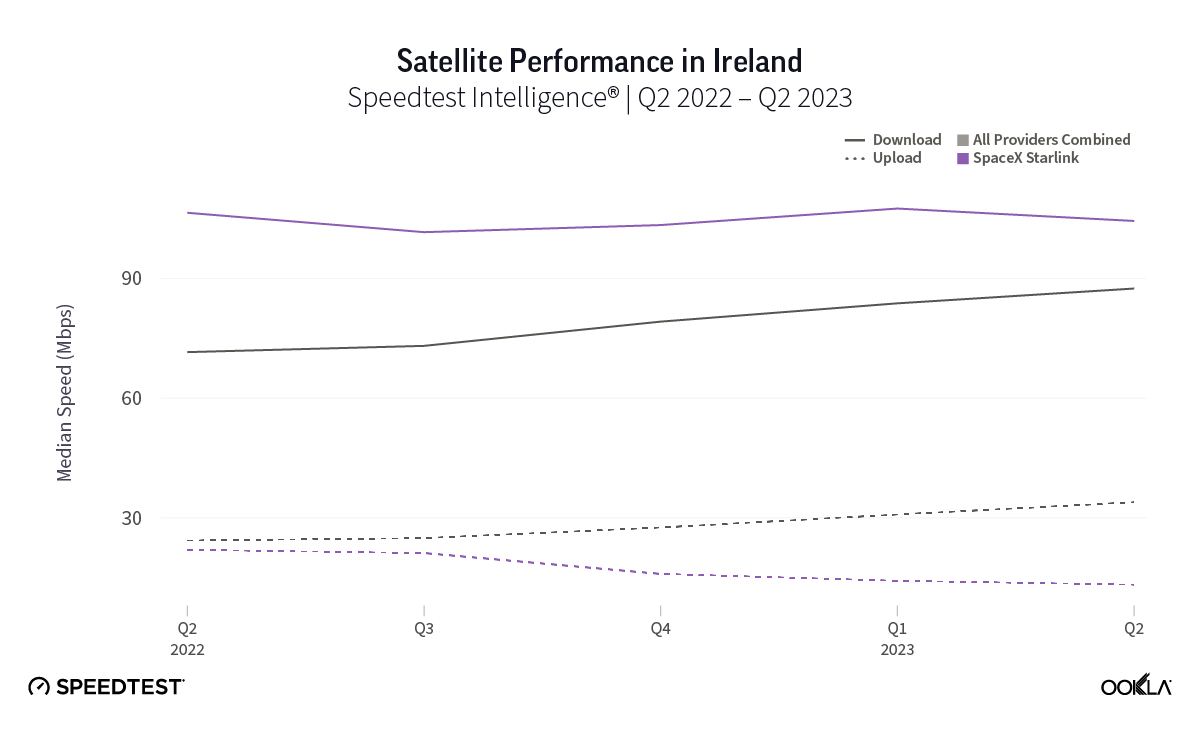
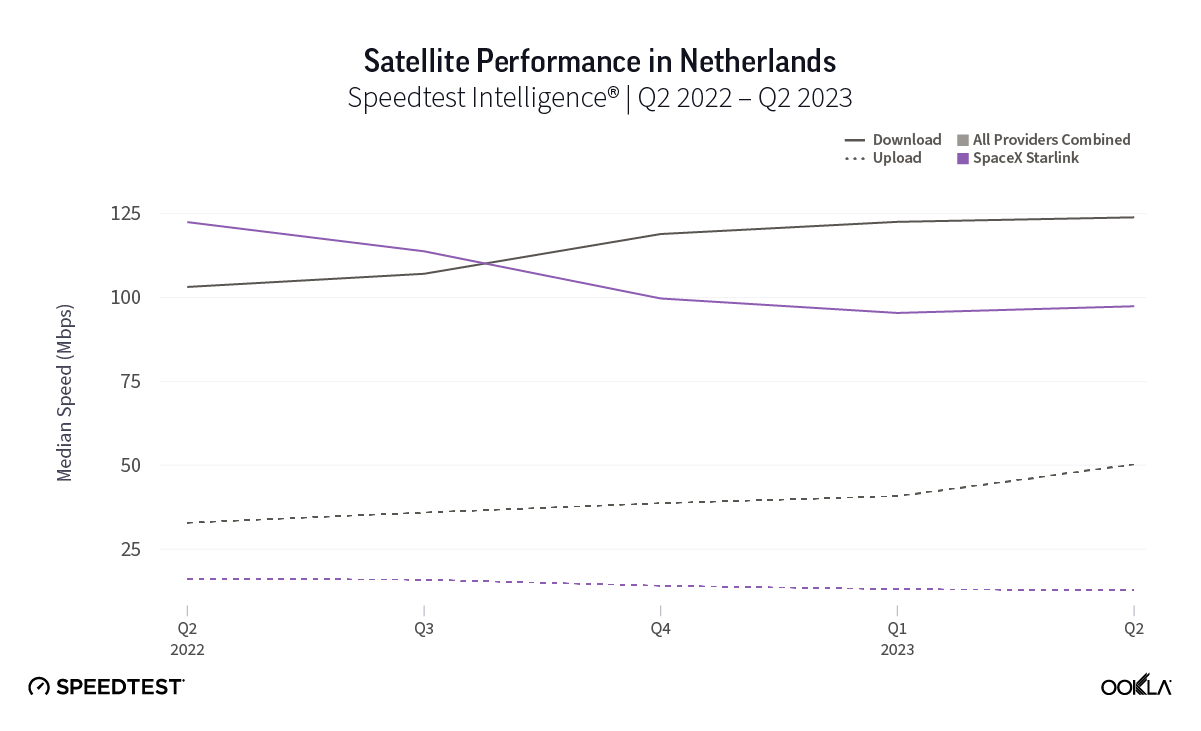
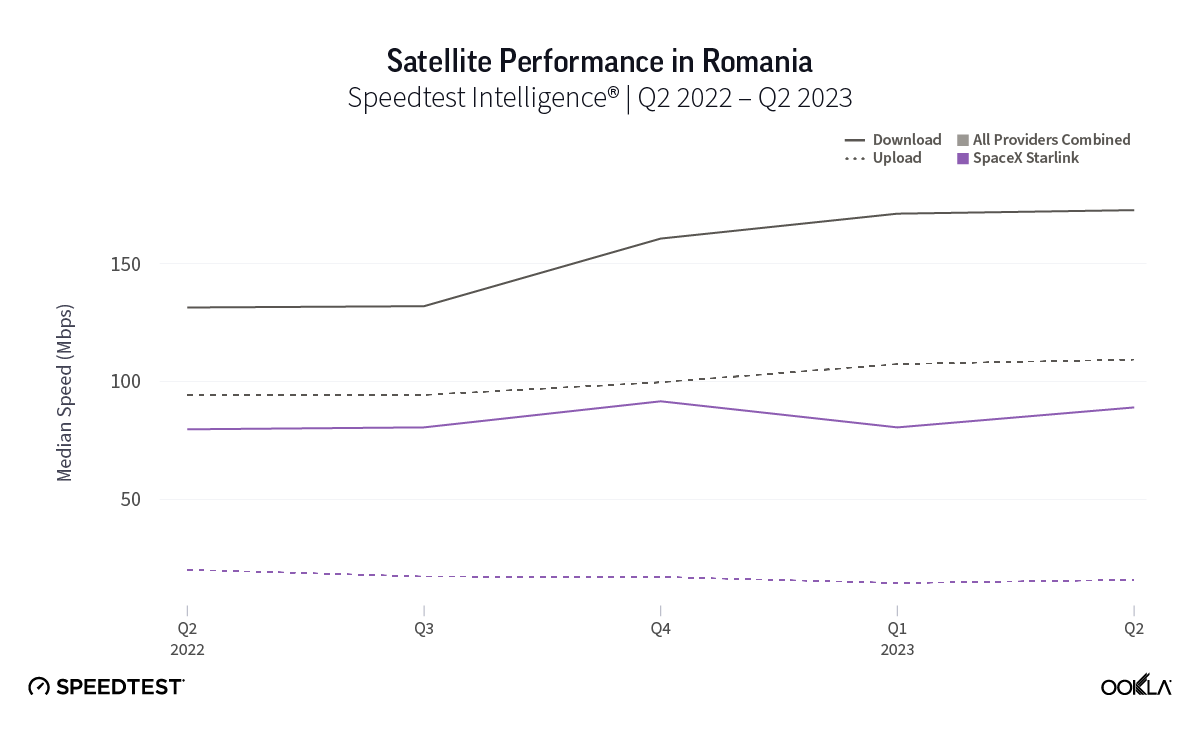
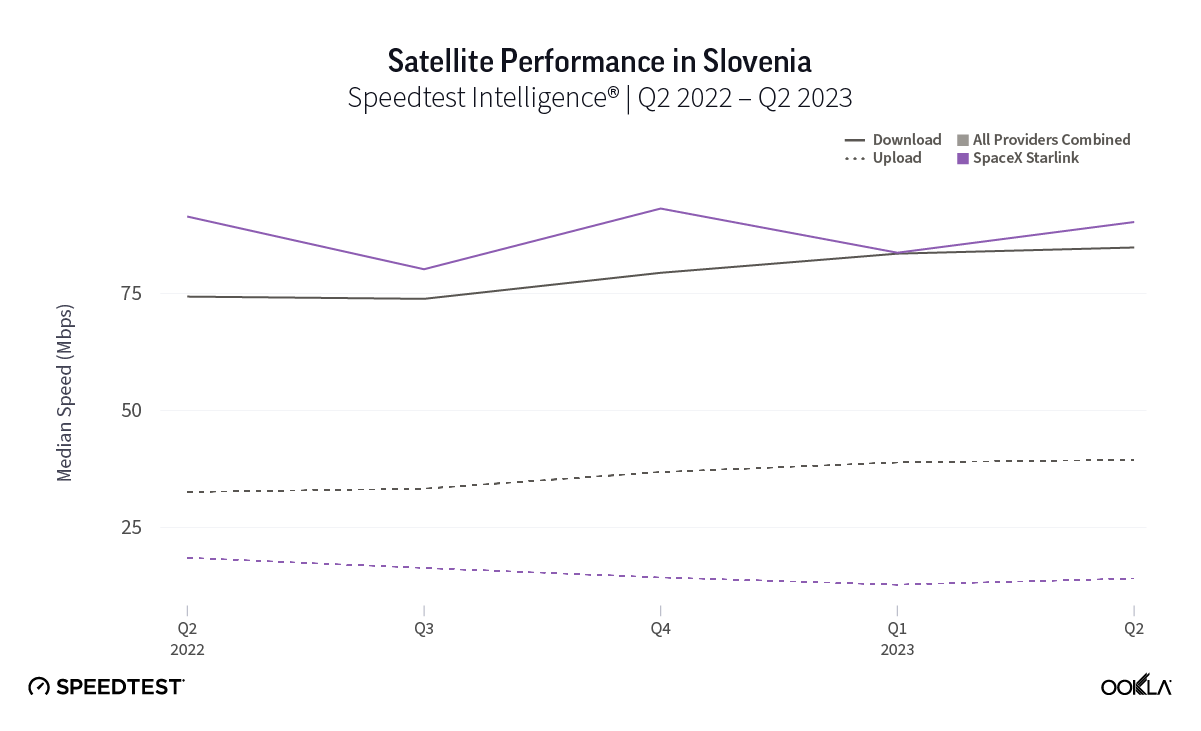
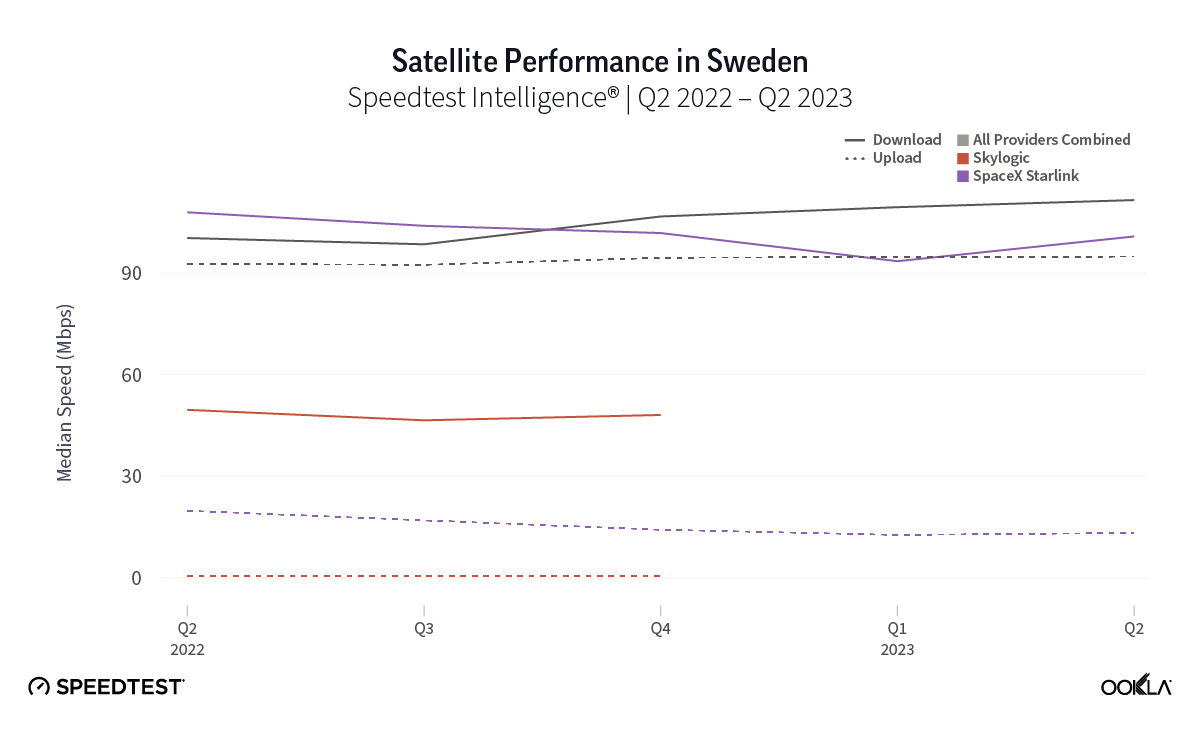
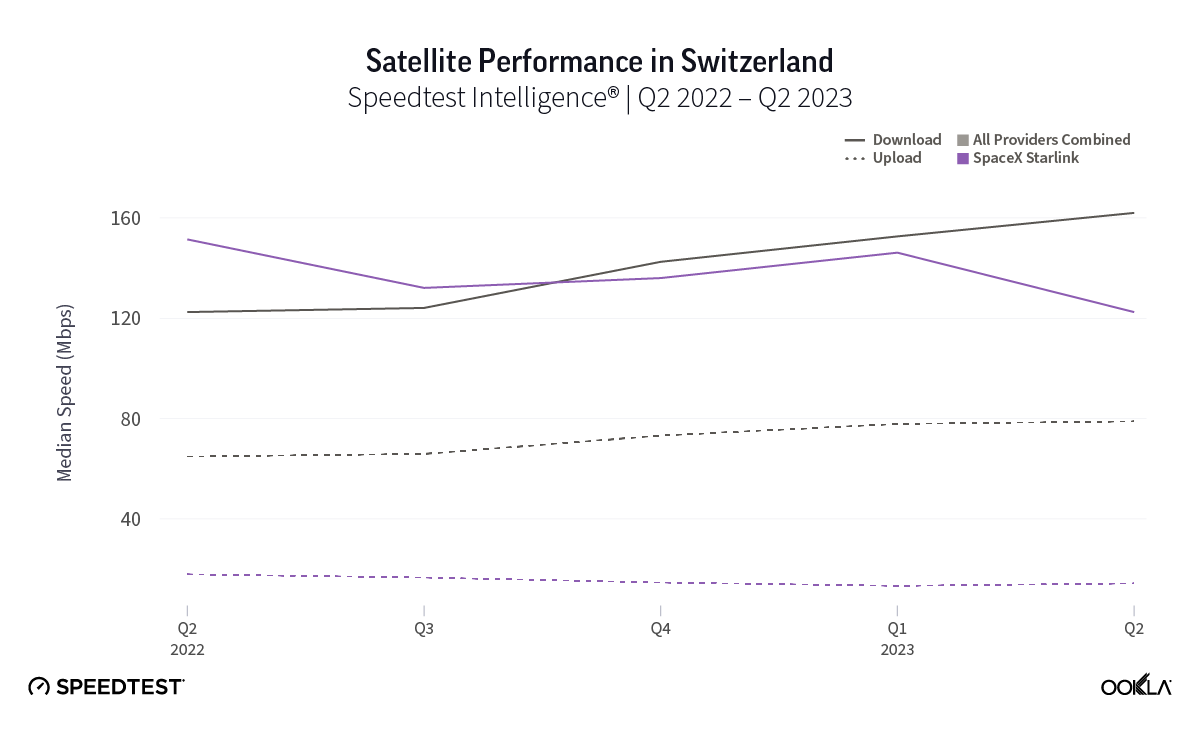
At first glance, year-over-year median download speeds for Starlink are about the same (-5% to 5%) or better (greater than 5%) from Q2 2022 to Q2 2023 in 15 countries and slower (decreasing more than 5%) in 8 countries. But among the 27 countries we surveyed during Q2 2023, Starlink had speeds faster than the aggregate of all fixed broadband providers combined in 11 countries (Austria, Belgium, Bulgaria, Croatia, Czechia, Estonia, Greece, Ireland, Italy, Latvia, and the U.K.) Those speeds were most notably faster in Croatia and Greece for Starlink at 94.41 Mbps to 45.24 Mbps and 108.97 to 44.09 Mbps, respectively, during Q2 2023. Speeds were about the same in four countries (Finland, Slovenia, Germany, and Lithuania), and speeds were slower than the aggregate of fixed broadband providers in 12 countries, most notably in Poland, Spain, Romania, Denmark, and France which saw between 50% and 105% faster aggregate fixed broadband speeds than Starlink.

Quarterly download speeds stabilizing or improving

Looking at results from Q1 2023 to Q2 2023, median download speeds for Starlink remained about the same (between 5% and -5%) in 23 countries, while decreasing in four countries. That’s a big deal, especially given Starlink had median download speeds greater than 100 Mbps in 14 countries, and greater than 90 Mbps in 20 countries, and greater than 80 in 24 countries — with only three countries failing to reach 70 Mbps.

While trailing Starlink speeds, Skylogic recorded median download speeds in Italy at 29.21 Mbps during Q2 2023, a roughly 27% statistical increase year-over-year from 22.28 Mbps during Q2 2022. Notably, Skylogic recorded a median download speed of 68.44 Mbps in Italy during Q1 2023. Among the various countries we recorded Skylogic data for during the past year, the range of median download speeds varied between 19.53 Mbps and 68.44 Mbps, with most speeds between 28 and 50 Mbps, all fast enough to stream 4K video online. Viasat, had relatively similar download speeds in Germany and Italy at 17.22 Mbps and 17.45 Mbps, respectively, during Q2 2023. 

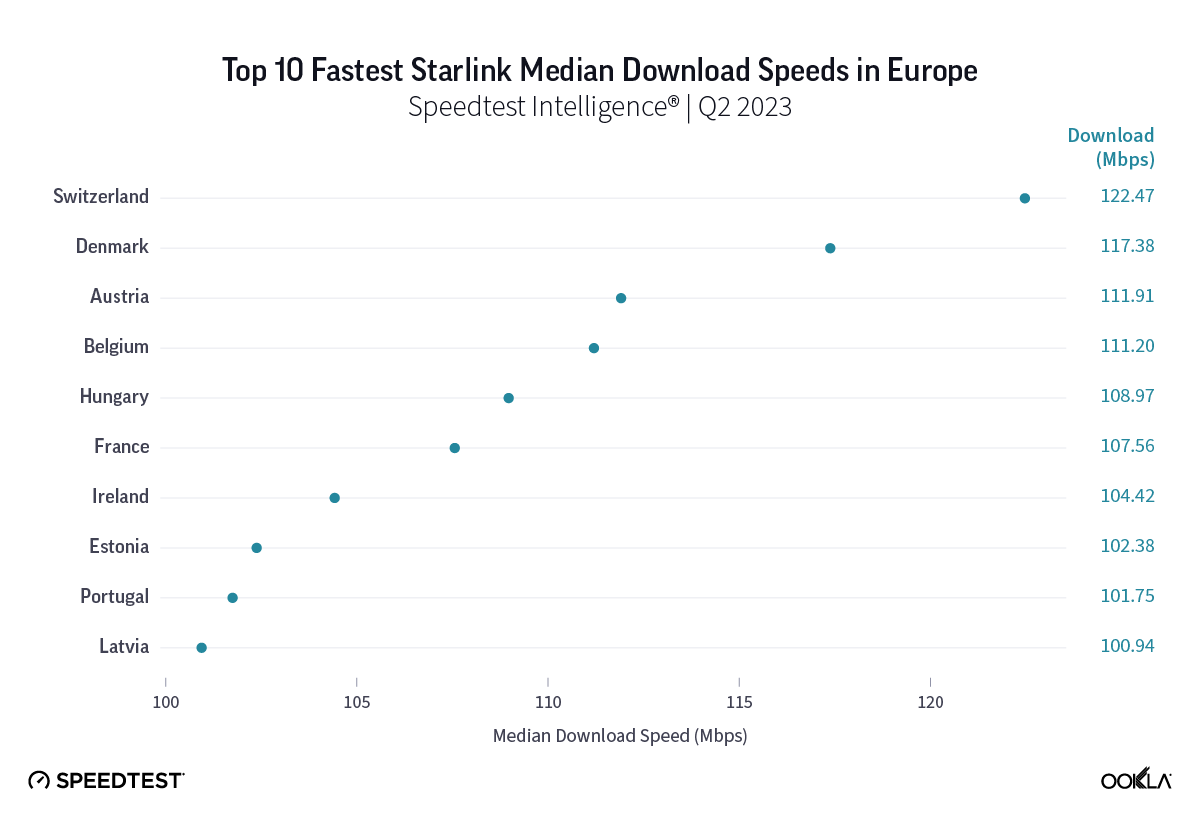
Top 10 fastest Starlink download speeds in European countries

Chart of Top 10 Fastest Starlink Median Download Speeds in Europe

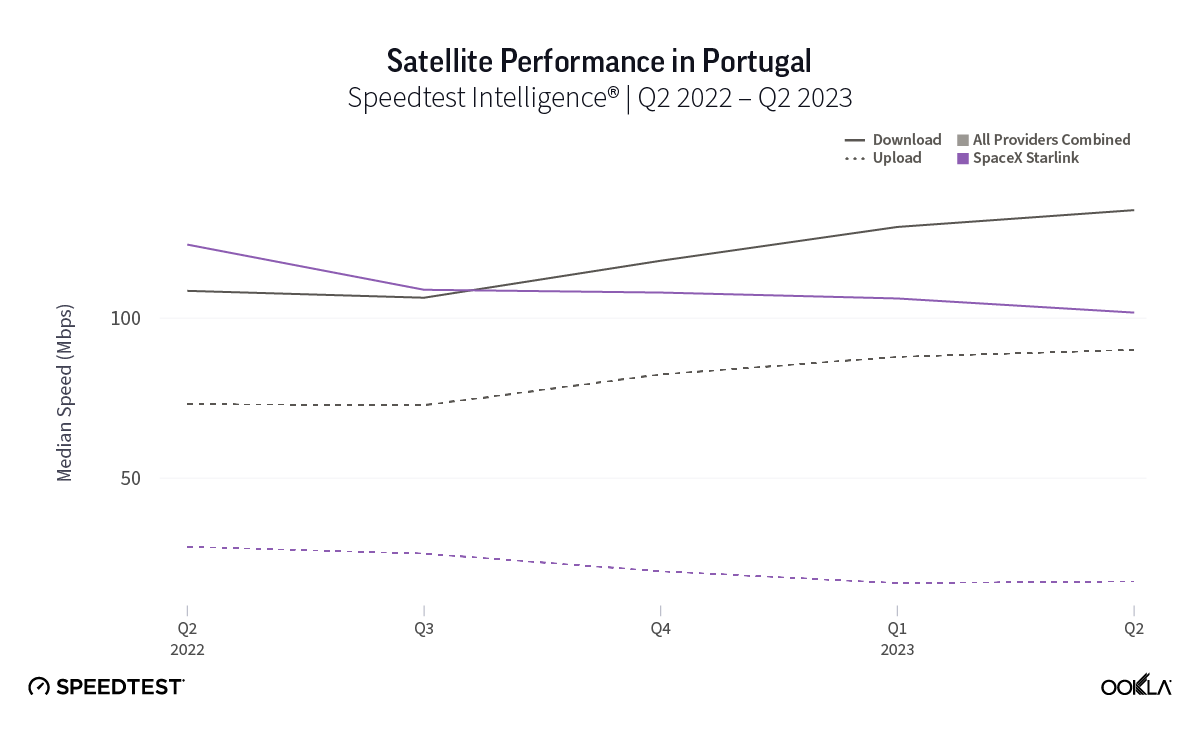
Starlink in Switzerland had one of the fastest median download speed among countries with Starlink during Q2 2023 at 122.47 Mbps, followed by Denmark (117.38 Mbps), Austria (111.91 Mbps), Belgium (111.20 Mbps), Hungary (108.97 Mbps), France (107.56 Mbps), Ireland (104.42 Mbps), Estonia (102.38 Mbps), Portugal (101.75 Mbps), and Latvia (100.94 Mbps). Sweden, Italy, Bulgaria, and the U.K. all followed but had speeds greater than 100 Mbps.

Upload speeds for Starlink are down year over year, but quarterly speeds almost all improved or were about the same

Upload speeds for Starlink mostly decreased notably year over year, with only the U.K. showing an improved median upload speed in Q2 2023 out of 27 countries surveyed. However, looking quarter to quarter, Q2 2023 upload speeds for Starlink stayed about the same or improved in 25 out of 27 countries, with only Greece and Ireland showing declines. For upload speeds, Starlink all 27 countries we surveyed had upload speeds between 10 Mbps and 15 Mbps except Portugal (17.70 Mbps), Hungary (16.91 Mbps), Croatia (16.12 Mbps), Bulgaria (15.93 Mbps), Romania (15.82 Mbps), Spain (15.79 Mbps), and Poland (9.11 Mbps). Starlink in Greece was the only instance of a satellite provider in Europe having an upload speed greater than the aggregate of all fixed providers combined, 12.97 Mbps for Starlink to 7.85 Mbps for the aggregate of fixed broadband providers combined. Skylogic showed upload speeds lower than 4 Mbps in both Austria and Italy during Q2 2023. Viasat had upload speeds of 3.51 Mbps in Germany and 4.69 Mbps in Italy during Q2 2023. 

Multi-server latency is stabilizing for Starlink users across Europe

As an low-earth orbiting (LEO) satellite internet provider, Starlink has a leg up on some satellite competitors who rely on further away geosynchronous-earth orbit (GEO) and medium-earth orbit (MEO) satellite constellations. However, once again, all the aggregates of all fixed broadband providers in Europe had much lower multi-server latencies than Starlink, Viasat (which had latencies over 600 ms) and Skylogic (which had latencies over 700 ms). That being said, Starlink still saw multi-server latencies under 60 ms in the U.K. (51.26 ms), Spain (53.37 ms), Portugal (55.84 ms), and Belgium (59.34 ms). Starlink saw most countries’ multi-server latencies between 60 and 90 ms.

Starlink speeds stabilize in Oceania

Oceania, the second least densely populated continent in the world to Antarctica, has rural and remote populations that benefit from (and even rely on) satellite internet connections. Luckily for rural and remote Starlink users, they’ve probably seen a good amount of stability over the past year with Q2 2023 median download speeds in New Zealand at 113.78 Mbps (105.99 Mbps in Q2 2022) and Australia at 104.92 Mbps (102.76 Mbps in Q2 2022). Tonga, which is very remote, saw download speeds drop from 45.25 Mbps in Q2 2022 to 37.95 Mbps in Q2 2023. 

Upload speeds also showed some stability with Australia going from 10.45 Mbps in Q2 2022 to 11.33 Mbps during Q2 2023 and New Zealand going from 12.31 Mbps to 14.62 during the same time period. Tonga saw a notable drop in speeds year over year from 19.26 Mbps in Q2 2022 to 6.66 Mbps Q2 2023. 

Multi-server latency, which usually will be higher for satellite internet options, showed promising results for Starlink in Oceania during Q2 2023. Multi-server latency dropped noticeably in New Zealand year over year, going from 89.38 ms in Q2 2022 to 46.42 ms in Q2 2023. Australia saw a more modest drop with multi-server latency going from 63.04 ms to 59.78 ms from Q2 2022 to Q2 2023. Tonga saw an increase in multi-server latency from 125.24 ms to 137.16 ms during the same time period.

Starlink in Africa is off to a promising start

Chart of Satellite Performance in Africa, Q2 2023

Starlink, which first launched on the African continent in Nigeria this past January, is showing intriguing early results. Speedtest Intelligence showed that Starlink in Nigeria had a faster median download speeds than all aggregate fixed broadband providers combined at 63.69 Mbps to 15.60 Mbps during Q2 2023. Upload speeds were more similar during the same time period with Starlink at 13.72 Mbps and the aggregate of all fixed broadband providers combined at 10.60 Mbps. Starlink did have a marginally higher multi-server latency at 55.88 ms to 50.26 ms during Q2 2023.

In Rwanda, median download speeds were a little closer with Starlink recording a median download speed at 63.10 Mbps in Q2 2023 compared to the aggregate of all fixed broadband providers combined at 34.55 Mbps. Starlink trailed behind for median upload speed at 6.88 Mbps to 10.05 Mbps for fixed broadband providers during Q2 2023. Multi-server latency for Starlink was much higher at 320.45 ms to 29.04 ms for fixed broadband providers during the same time period.

The 2023 space revolution is off to a huge start

Here are some major updates about what’s next for various different satellite competitors:

After delays, Amazon’s Project Kuiper aim to launch prototype satellites this fall

Facing a series of rocket-related delays, Amazon recently announced it could send its first two Project Kuiper prototypes into orbit in late September. That news follows a recently announced $120 million 100,000-square-foot satellite processing facility at NASA’s Kennedy Space Center in Florida. Planning on offering internet service in 2025, Amazon is slated to have half of its 3,236 LEO satellite constellation in space by 2026.

China’s grand ambitions to provide internet connectivity to over 362 million people

According to the Wall Street Journal, over 362 million people in China don’t have access to the internet — which is about 1 in every 4 people in China, a large portion of which live in rural or remote communities. In order to overcome that connectivity gap, China is looking to the sky to create its own satellite constellation with potentially over 12,000 satellites. China’s biggest gap seems to be with recreating the success of SpaceX’s reusable rockets — however, initial tests are far underway and a host of reusable rockets are slated for test launches in 2024. 

SpaceX’s Starlink service offerings are about to rapidly expand

While Starlink continues to lead among satellite providers in most areas of the world, their expansion is only starting. Looking at the Starlink availability map, Starlink has an incredibly busy rest of 2023 and 2024 in Africa, Asia, and South America — and they’re marking their intent to expand into most of the world. That comes as Starlink marked launching over 5,000 satellites into space at the end of August. With some wiley entrepreneurs already renting out their Starlink “Dishy McFlatfaces” to vacationers and campers for $25-30 dollars a day, satellite connectivity is truly becoming a full-time gig.

Viasat’s bad luck might affect entire industry

Viasat launched the first of its three long-awaited Viasat-3 arrays — but then their first satellite suffered an antenna anomaly, which prevented a large reflector to deploy that affects whether or not the satellite can operate as intended. While Viasat is rushing to solve the issue, this could ultimately trigger a $420 million insure claim for the loss of the $700 million satellite. With such a high-value loss, this could send ripples through the satellite industry, causing insurance premiums to skyrocket for companies looking to mitigate potential losses through insurance. All of this comes on the heels of acquiring Inmarsat in May for $7.3 billion to expand its satellite arrays and spectrum holdings. We’ll be watching to see whether or not Viasat can find a solution. 

Eutelsat and OneWeb merger imminent, big moves abound

The Eutelsat and OneWeb merger should make competitors take notice — combining satellite networks, expanding enterprise offerings, and competing in emerging markets has big revenue potential — with OneWeb having an already established LEO network of 630 satellites and Eutelsat offering 36 GEO satellites. Of note, OneWeb recently inked a deal with Telstra in Australia to provide satellite backhaul for locations “where satellite backhaul is a preferred or only viable option.” OneWeb is also partnering with the European Space Agency to develop a next-gen 5G beam-hopping satellite, which could quickly increase connectivity for people traveling or for disaster areas that need emergency connectivity. Shareholders are set to vote on approving the merger on Sept. 28.

European Union greenlights multi-orbit constellation

With grand ambitions to launch a multi-orbit, €6 billion constellation in 2024, the European Union is partnering with a consortium of industry players including Airbus, SES, Eutelsat, Hispasat, and Thales to develop the EU’s IRIS² project. The EU still expects to have the first of its satellites go live by the end of 2024 and have a fully operational constellation by 2027.

HughesNet aiming to launch Jupiter 3 array in Q2 2023

HughesNet successfully launched its Jupiter 3 array on July 29, which aims to provide U.S. and Latin America consumers with higher broadband download speeds. While the actual satellite will take some time to reach its geosynchronous orbit and deploy, this satellite adds 500 Gbps of Ka-band capacity for HughesNet, which could see consumers reaching download speeds between 50 Mbps and 100 Mbps. We’ll be eagerly awaiting Speedtest® results from HughesNet’s Jupiter 3 array.

Ookla will continue monitoring new satellite internet developments

2023 continues to be an important year for satellite internet providers. Satellite connectivity is something we’ll be watching closely and we’ll continue our series next quarter with Q3 2023 data from select continents including North America. In the meantime, be sure to download the Speedtest app for Windows and Mac computers or for iOS or Android for devices and see how your satellite internet stacks up to our results.

Ookla retains ownership of this article including all of the intellectual property rights, data, content graphs and analysis. This article may not be quoted, reproduced, distributed or published for any commercial purpose without prior consent. Members of the press and others using the findings in this article for non-commercial purposes are welcome to publicly share and link to report information with attribution to Ookla.
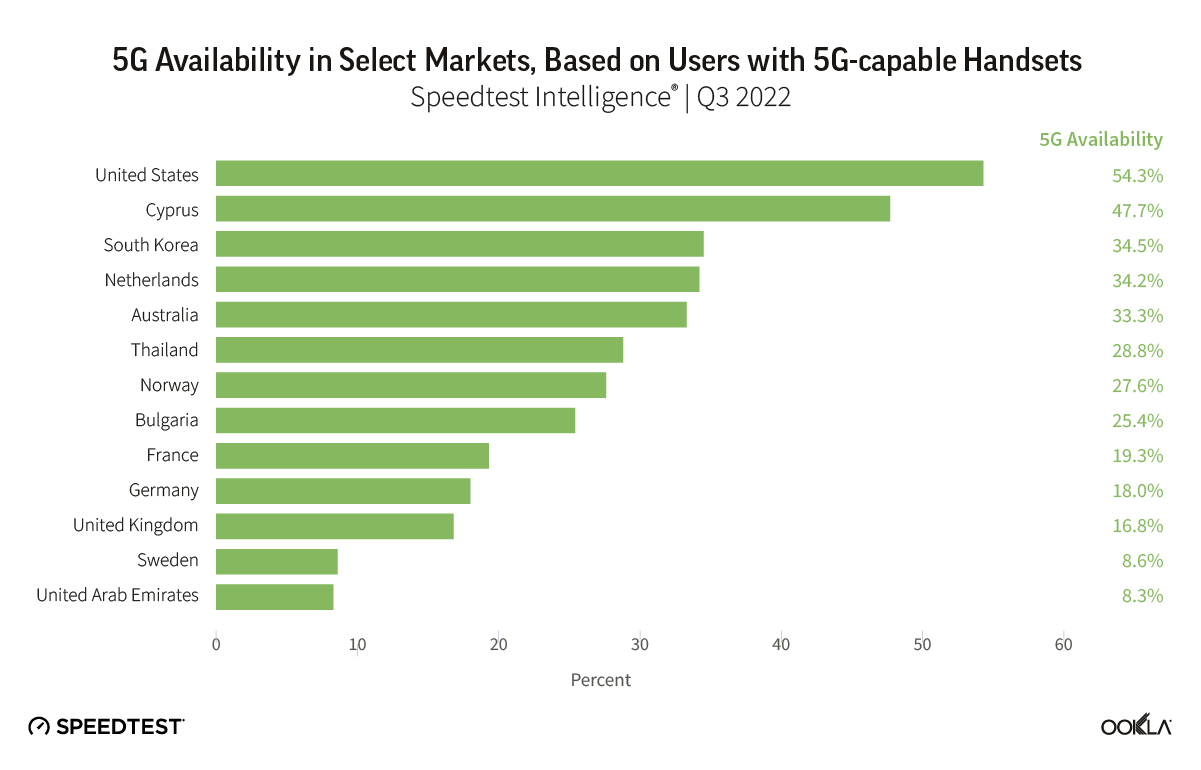
| November 26, 2024

5G is Contributing to Improving MTN's Network Performance in West and Central Africa

This article examines the mobile performance of select MTN subsidiaries and joint-venture (hereafter referred to as “opcos”) across five of its nine markets in West and Central Africa (WCA). We look at how these opcos’ performance compares with each other and how it evolved between Q2 2022 and Q2 2024, analyze the factors that impacted their performance, and discuss their 5G plans.

Key Takeaways:

  • Nigeria leads MTN opcos in West and Central Africa (WCA) in mobile download speed for handsets with modern chipsets, according to Speedtest Intelligence®. In Q2 2024, MTN Nigeria significantly widened its lead over the other opcos in WCA in terms of download speeds, reaching 95.62 Mbps. MTN Nigeria also excelled in median upload speed at 17.01 Mbps, closely followed by MTN Ghana at 16.74 Mbps.
  • Despite challenging macroeconomic and operational conditions, MTN opcos in WCA  improved their network performance. While all reviewed MTN opcos rose in performance since Q2 2022, Nigeria and Ghana stood out by moving up the most in download and upload speed rankings over the last 2 years. The two opcos were also the front runners for median multi-server latency, with Ghana achieving this without launching 5G.
  • 5G service availability in Nigeria has significantly improved over the last 18 months. Speedtest Intelligence shows that 5G Service —a geospatial measure of the percentage of an operator’s known locations with 5G service— in Nigeria increased from 17.2% in Q1 2023 to 35.70% in Q2 2024, surpassing South Africa’s 31.6%.

MTN aims to continue investing in new network technologies and bridging the broadband coverage divide to remain competitive

MTN is the largest operator group in Africa operating in 15 markets, offering voice, data, fintech, digital, enterprise, and wholesale services to nearly 300 million fixed and mobile subscribers. MTN Group’s service revenue grew by 13.5% to ZAR210 billion ($11.1 billion), driven by data revenue of ZAR 84 billion ($4.5 billion) and voice revenue of ZAR 83 billion ($4.4 billion).

African countries in the MTN footprint face economic and political challenges, including slowing growth, high inflation, currency devaluation, and political instability in neighboring countries. These conditions dampen investment appetite and increase the cost of doing business. However, the large, fast-growing, and youthful population combined with low levels of data and digital adoption offer significant growth opportunities for telecom operators like MTN.

Map of MTN Operations' Median Download Speed and Year-on-Year Changes in Select Western and Central African Markets

In 2023, service revenue from West and Central Africa (WCA) accounted for 63.6% of the Group’s revenue. Data revenue surged by 51.3% (excluding Nigeria) and by 38.6% in Nigeria, driven by increased data users and traffic and supported by network investments.

At the beginning of 2021, MTN announced its Ambition 2025 strategy to provide ‘leading digital solutions for Africa’s progress’. This growth strategy’s objective is to double the number of consumer mobile data users to 200 million and home broadband customers to 10 million by 2025, achieve 95% broadband population coverage, and ensure data contributes to half of the Group’s total revenue. This strategy is supported by network expansion, modernization, and improved service affordability.

In the following sections, we analyze MTN opcos’ performance in WCA and review their network deployment plans, including 5G. 

Nigeria delivered the fastest median download speed in Q2 2024 across MTN opcos in WCA

In a previous article, we found that MTN performed best among other operator groups in Sub-Saharan Africa during Q2 2022. For the current analysis, we use Speedtest Intelligence data to compare mobile performance between Q2 2022 and Q2 2024 on modern chipsets across select five (out of nine) MTN opcos in WCA. 

Our results show that Nigeria led MTN’s opcos in WCA in median download speeds, achieving 95.62 Mbps in Q2 2024. Nigeria along with Ghana, more than tripled their median download speeds within two years. Benin, Cameroon, and Nigeria saw greater jumps in download speeds between 2023 and 2024 compared to the previous year.

Generally, all opcos saw more modest improvements in upload speed compared to download speeds. MTN Nigeria led the group with a median upload speed of 17.01 Mbps in Q2 2024, closely followed by MTN Ghana at 16.74 Mbps. Both countries significantly increased their upload speeds between Q2 2022 and Q2 2024. 

Cellular Network Performance, Select MTN Operators in West and Central Africa
Source: Speedtest Intelligence® | Q2 2022 – Q2 2024
Cellular Network Performance, Select MTN Operators in West and Central Africa

MTN Nigeria outperformed the other opcos in the region with a substantial margin in median download speed. Its upload speed also saw a remarkable recovery with an impressive 17.01 Mbps in Q2 2024.

MTN Benin’s download speed significantly increased between Q2 2022 and Q2 2023, plateauing around 56 Mbps. It then slightly declined during H1 2024, maintaining its position as the second-fastest opco in WCA.

MTN Ghana made an impressive turnaround, climbing from the bottom to among the top three operators in download and upload speeds. Its download speed increased more than 3x (similar to Nigeria’s improvement rate), and its upload speed more than doubled over the two years to Q2 2024. This improvement was partly due to MTN’s investments in network infrastructure and high smartphone penetration among its subscribers (63.8%) in 2023.

MTN Côte d’Ivoire, the second-largest mobile operator in the country, saw modest performance improvements until the end of 2023. Then download speeds peaked at 39.49 Mbps in Q1 2024, around the start of the African Football Championship (CAN), but fell to 29.23 Mbps in Q2 2024. Upload speeds also improved, but not as significantly as download speeds. MTN Cameroon showed the smallest network performance improvement over the two years, ending at the bottom of the pack.

MTN Ghana and Nigeria were the front runners for median latency, maintaining a tight range of approximately 42 ms to 54 ms between Q2 2022 and Q2 2024. Opco latency in Benin and Côte d’Ivoire fluctuated between a low of around 38 ms and a high of 143 ms. MTN Cameroon consistently had higher latency, over 230 ms, throughout the period.

MTN Nigeria could further solidify its leadership in Africa by expanding 5G coverage and boosting adoption rates

Nigeria, the continent’s most populous country, boasts the largest mobile market, with 217.5 million subscribers in 2023. Following regulatory impacts from the two SIM campaigns in 2017 and 2021, market growth resumed and is projected to continue into 2024. The country presents significant growth opportunities for data services, with internet penetration reaching 45.4% in 2023

However, Nigeria faces economic challenges, including currency depreciation, high inflation, and a shortage of hard currency. Operational challenges such as fuel shortages, infrastructure vandalism, and regional unrest also impede infrastructure expansion and maintenance. Despite these hurdles, MTN Group announced in 2023 its ambition to invest $3.5 billion in Nigeria over the next five years.

MTN was the first operator to launch 5G in Nigeria, followed by Airtel and ISP Mafab Communications in June and January 2023, respectively. By December 2023, MTN Nigeria’s 5G network covered 11.3% of the population. However, according to the Nigerian Communications Commission (NCC), Nigeria had 2.3 million 5G subscribers by the end of 2023, representing just 1.04% of the total 224.7 million active mobile subscribers.5G coverage has improved over the last 18 months. Speedtest Intelligence shows that 5G Service —a geospatial measure of the percentage of an operator’s known locations with 5G service— in Nigeria increased from 17.2% in Q1 2023 to 35.70% in Q2 2024, surpassing South Africa’s 31.6%. MTN invested $120 million to raise 5G network coverage from 3% to 11%, extending service to key cities in all six regions, but further expansion is needed.

Speedtest Intelligence’s 5G Availability data, which measures the percentage of users with 5G-capable devices who spend most of their time on a 4G or 5G network, indicates an upward trend in Nigeria to reach 13.9% in Q2 2024, reflecting increased service activation and adoption. However, the level remains low compared to South Africa, which reached 31.3% in Q2 2024. Customers may hesitate to activate 5G due to data usage and battery life concerns. MTN can address these concerns by offering affordable data plans and financing options to facilitate the acquisition of newer, more energy-efficient devices.

5G Service and 5G Availability, Nigeria
Source: Speedtest Intelligence® | Q1 2023 – Q2 2024
5G Service and 5G Availability, Nigeria

Apart from Nigeria, MTN’s 5G rollout plans in West and Central Africa are progressing slowly

Côte d’Ivoire is the only other country in the region where MTN launched 5G services. The rollout coincided with the African Football Championship (CAN) in January 2024, covering Abidjan and several major cities. Despite network rollout delays and logistics bottlenecks in 2023, MTN also upgraded its 4G networks in late 2023 in preparation for the football competition. The local telecom regulator, ARTCI (Autorite de Regulation des Telecommunications de Côte d’Ivoire), considered introducing network sharing to expedite 5G deployment, similar to the model adopted in Malaysia, but there have been no updates on this plan so far in 2024.

In the rest of the WCA region, MTN has conducted 5G pilot projects, such as in the Republic of Congo (Congo-Brazzaville) but remains committed to investing in 4G infrastructure to enhance accessibility. In Cameroon, MTN has been expanding its network capabilities and testing 5G since 2021. In 2023, it committed $200 million over three years towards network services. MTN has also pledged to invest $215 million over the next three years in Benin to develop its 5G infrastructure following successful trials. 

In Ghana, MTN initially announced its readiness to roll out 5G in 2022, but the National Communications Authority (NCA) did not grant it the license, considering a shared infrastructure approach. Macroeconomic challenges, including slowed-down economic growth, high inflation (averaging 40.3% in 2023), and currency devaluation (down 34.5% against the US dollar), have also delayed the 5G rollout. In May 2024, the Ghanaian government partnered with seven industry players (excluding MTN) to establish the Next-Gen Infrastructure Company (NGIC) to deploy the infrastructure and launch 5G services within six months. However, concerns have been raised over the lack of transparency around this partnership. NGIC eventually launched 5G on the first of November, 2024. Finally, MTN confirmed its plan to exit Guinea-Bissau and Guinea-Conakry due to high risk and limited growth.

This analysis shows that mobile network performance has improved significantly in some key West and Central African markets. The impact of 5G has so far been limited to Nigeria as it is still in its early stages in most of the region. MTN is keen to expand 5G coverage to the rest of its footprint, following the examples of Nigeria and Côte d’Ivoire, while continuing to invest in its 4G network infrastructure. Despite ongoing political and macroeconomic challenges, MTN and other operators in the region are well-positioned to meet the growing demand for high-speed broadband.

We will continue to monitor mobile networks’ performance across Africa, benchmark countries, and operators, and explore how various factors affect it. For more information about Speedtest Intelligence data and insights, please contact us.

Ookla retains ownership of this article including all of the intellectual property rights, data, content graphs and analysis. This article may not be quoted, reproduced, distributed or published for any commercial purpose without prior consent. Members of the press and others using the findings in this article for non-commercial purposes are welcome to publicly share and link to report information with attribution to Ookla.
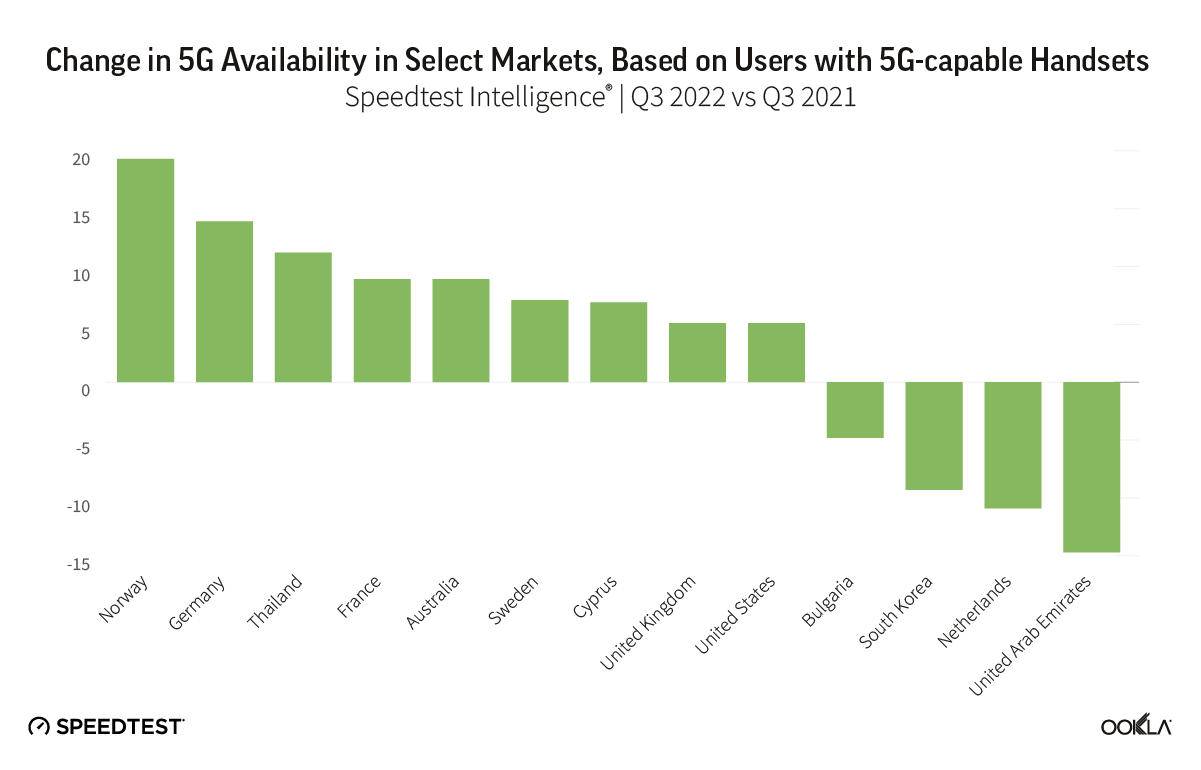
| June 24, 2024

How Much Faster is 5G Anyway? An Analysis of Page Load Speed

There’s nothing quite like picking up your phone for a little “me” time only to open up that first web page… and wait for it to load. Maybe the images aren’t there yet or the content jumps around while the ads load — it’s the worst. 5G is meant to help, so we dug into Speedtest® quality of experience data to see if this newer technology is living up to its promise. Read on for an analysis of page load speed (how many milliseconds it takes for a page to load) on three popular services in nine major countries around the world during Q1 2024.

Click the country below to go directly to that section or read on for the full article:

Brazil | Canada | France | India 

Mexico | Nigeria 

South Africa | Spain | United States

Page speed relies on low latency for the best internet experience

Page load speed is a critical measure of your web browsing experience. It measures how long it takes for a page to load, fully displaying the content on that page. This is directly impacted by latency, which is how quickly your device gets a response after you’ve sent out a request. A typical request on the internet requires two to five round trip communications between various entities over different latency sensitive protocols.

One of the promises of 5G is lower latency, which should lead to a faster (lower) page load speed on any page. The Speedtest Global IndexTM reported the global average for mobile latency as 27 milliseconds (0.027 seconds) with fixed broadband at 9 ms (0.009 s) in May 2024. As seen in the video below, it can take 7x longer to load a full webpage when latency is high, and “40% of users will abandon a site if it takes more than 3 seconds to load,” according to one source. Read more about the importance of latency to quality of experience.

5G lived up to the latency promise, showing a faster page load speed than 4G on all services in all countries we surveyed. However, the improvement was not the same in all places, with Canada topping the list of fastest page load speed over 5G on all the services we surveyed while South Africa had the slowest 5G page load speed on Google and YouTube of countries reviewed here. Read on for details.

5G loads 20-30% faster than 4G in Brazil

Chart of 5G vs. 4G Page Load Speed in Brazil

Speedtest data shows that 5G delivered a much lower page load speed than 4G on all three services in Brazil during Q1 2024. Google loaded 20% faster on 5G than 4G, YouTube was 25% faster, and Facebook was 30% faster on 5G.

Canada’s 5G page load speed among the fastest on all 3 services

Chart of 5G vs. 4G Page Load Speed in Canada

As mentioned, Canada’s 5G page load speed was the fastest or among the fastest for all countries analyzed in this article, with Canada having the fastest page load speed on Facebook, Google, and YouTube. Our analysis demonstrated that 5G delivered a decently faster page load speed than 4G on all three services in Canada during Q1 2024. YouTube loaded 16% faster on 5G than 4G, Google was 18% faster, and Facebook was 23% faster on 5G.

French 5G loads 14-20% faster than 4G

Chart of 5G vs. 4G Page Load Speed in France

Speedtest data shows 5G page load speed on all three services was decently faster than on 4G in France during Q1 2024. YouTube loaded 14% faster on 5G than 4G, Facebook was 19%, and Google was 20% faster on 5G.

5G loads 23-33% faster than 4G in India

Chart of 5G vs. 4G Page Load Speed in India

Analysis of Speedtest data shows the page load speed on all three services was much lower on 5G than 4G in India during Q1 2024. Google loaded 23% faster on 5G than 4G, YouTube was 32% faster, and Facebook was 33% faster on 5G. India and Mexico had the slowest page load speeds for Facebook over 5G of any of the countries we looked at.

Mexican 5G loads 26-28% faster than 4G

Chart of 5G vs. 4G Page Load Speed in Mexico

Speedtest data shows 5G delivered a much lower page load speed than 4G on all three services in Mexico during Q1 2024. Google and Facebook loaded 26% faster on 5G than 4G and YouTube was 28% faster on 5G. Mexico and India had the slowest 5G page load speeds for Facebook among the countries examined.

5G loads up to 47% faster than 4G in Nigeria

Chart of 5G vs. 4G Page Load Speed in Nigeria

Our analysis revealed 5G delivered a much lower page load speed than 4G on all three services in Nigeria during Q1 2024. Google loaded 24% faster on 5G than 4G, YouTube was 27% faster, and Facebook was a whopping 47% faster on 5G.

South Africans see 22-36% faster 5G page load over 4G, but slow Google and YouTube

Chart of 5G vs. 4G Page Load Speed in South Africa

Speedtest data shows 5G delivered a much lower page load speed than 4G on all three services in South Africa during Q1 2024. Google loaded 22% faster on 5G than 4G, YouTube was 27% faster, and Facebook was 36% faster on 5G. South Africa had the slowest 5G page load speed for both Google and YouTube of any of the countries analyzed.

5G loads 11-15% faster than 4G in Spain

Chart of 5G vs. 4G Page Load Speed in Spain

5G page load speed in Spain was somewhat faster than 4G on all three services during Q1 2024. YouTube loaded 11% faster on 5G than 4G, Google was 14% faster than 4G, and Facebook was 15% faster on 5G.

U.S. 5G loads 21-26% faster than 4G

Chart of 5G vs. 4G Page Load Speed in United States

Speedtest data from the U.S. shows 5G delivered a much lower page load speed than 4G on all three services during Q1 2024. Google loaded 21% faster on 5G than 4G, YouTube was 22% faster, and Facebook was 26% faster on 5G.

Your time is valuable. Our data shows that you can get some of that important time back if you have access to 5G and can afford to upgrade. To learn more about your network experience, download the Speedtest app for Android or iOS. Remember, too, that there’s a Downdetector® tab in the Speedtest apps to help you troubleshoot pages that aren’t loading at all.

Ookla retains ownership of this article including all of the intellectual property rights, data, content graphs and analysis. This article may not be quoted, reproduced, distributed or published for any commercial purpose without prior consent. Members of the press and others using the findings in this article for non-commercial purposes are welcome to publicly share and link to report information with attribution to Ookla.
| June 17, 2024

Your Guide to Airport Wi-Fi and Mobile Performance at 50+ Global Airports in 2024

Airports around the world have been packed with travelers this year, which puts extra stress on the Wi-Fi. With summer travel already well in swing in the northern hemisphere, we’re back with fresh data for our series on airport Wi-Fi performance to help you plan for connectivity at all your connections. You’ll find information about Wi-Fi on free networks provided by the individual airports as well as mobile speeds at some of the busiest airports in the world during Q1 2024. Read on for a look at internet performance at over 50 of the world’s busiest airports with data on download speed, upload speed, and latency.

Key takeaways

  • The seven fastest airports for downloads over Wi-Fi were in the United States: San Francisco International Airport, Newark Liberty International Airport, John F. Kennedy International Airport, Phoenix Sky Harbor International Airport, Seattle–Tacoma International Airport, Dallas Fort Worth International Airport, and Harry Reid International Airport.
  • Six U.S. airports had the fastest uploads over Wi-Fi: San Francisco International Airport, Phoenix Sky Harbor International Airport, Newark Liberty International Airport, Seattle–Tacoma International Airport, Dallas Fort Worth International Airport, and John F. Kennedy International Airport.
  • The fastest mobile download speeds on our list were at Hamad International Airport in Doha, Qatar, Shanghai Hongqiao International Airport in China, and Phoenix Sky Harbor International Airport in the U.S.
  • Eight of the 10 airports with the fastest mobile upload speeds were in China.

9 airports have 100+ Mbps Wi-Fi download speeds

Speedtest Intelligence® showed seven of the nine airports with median Wi-Fi download speeds over 100 Mbps were in the U.S.:

  • San Francisco International Airport (173.55 Mbps),
  • Newark Liberty International Airport (166.51 Mbps),
  • John F. Kennedy International Airport (151.59 Mbps),
  • Phoenix Sky Harbor International Airport (151.28 Mbps),
  • Seattle–Tacoma International Airport (137.31 Mbps),
  • Dallas Fort Worth International Airport (119.92 Mbps), and
  • Harry Reid International Airport (107.84 Mbps).

Charles de Gaulle Airport in Paris, France and China’s Hangzhou Xiaoshan International Airport rounded out the list with median download speeds of 107.13 Mbps and 101.01 Mbps, respectively. Hartsfield–Jackson Atlanta International Airport and Sea–Tac had the lowest median multi-server latency on Wi-Fi of any of the airports surveyed during Q1 2024.

Hover on the pins on the map below to see full details for download and upload speeds as well as latency at all the airports analyzed.

Fixed Broadband Internet Speeds Over Free Wi-Fi at Global Airports
Speedtest Intelligence® | Q1 2024
A map showing fixed broadband speeds in selected global airports.

At Ookla®, we’re dedicated to making sure the networks you depend on are always at their best. With Ekahau®, our Wi-Fi solution, we know firsthand just how challenging it can be to optimize Wi-Fi at airports, especially when you have up to 900 people waiting at each boarding gate during the busiest travel times. While the speeds achieved by these top airports are impressive, we saw two smaller U.S. airports with median Wi-Fi download speeds over 200 Mbps during our U.S.-only analysis of airport Wi-Fi in the fall.

Six airports on our list use multiple SSIDs for their Wi-Fi networks for different terminals or to take advantage of the coverage advantages of 2.4 GHz and the speed advantages of 5 GHz frequencies. We have included data for all the SSIDs with sufficient samples in the map and reported in the text on the best result when using multiple SSIDs results in dramatically different speeds.

Eighteen airports on our list had median Wi-Fi download speeds of less than 25 Mbps. Mexico City International Airport in Mexico had the lowest median Wi-Fi download speed at 5.11 Mbps, followed by:

  • Tan Son Nhat International Airport in Vietnam (7.07 Mbps),
  • Beijing Capital International Airport in China (9.45 Mbps),
  • Cairo International Airport in Egypt (10.62 Mbps), and
  • Tokyo Haneda Airport in Japan (11.37 Mbps).

You may struggle with everything from video chatting to streaming at any airport with a download speed below 25 Mbps. Latency is also a factor in performance so if your airport is one of the three with a median Wi-Fi latency over 60 ms, a mobile hotspot may be a better option for a stable connection.

Wi-Fi 6 has arrived

Our analysis shows at least 15 airports on our list were using the new Wi-Fi 6 standard in their Wi-Fi setup. Wi-Fi 6 uses Multi-User Multiple Input, Multiple Output (MU-MIMO) and Orthogonal Frequency Division Multiple Access (OFDMA) to increase performance and throughput, especially when serving multiple devices. This offers a real advantage at a large public location like an airport. In order to get maximum benefit from Wi-Fi 6, consumers would need to be using Wi-Fi 6-compatible devices. Speedtest data shows a fairly even split between airports that saw faster download speeds on Wi-Fi 6 and airports where Wi-Fi 6 results were comparable to those on other earlier Wi-Fi generations.

As you know, international travel can be complicated. Even if the airport offers free Wi-Fi, you may encounter other barriers to access. For example, a local number is required in Cairo to receive the access code to connect to the airport Wi-Fi. And while we’d love to include other large airports like Nigeria’s Murtala Muhammed International Airport in future Wi-Fi analyses, they currently do not offer free Wi-Fi so we have included mobile data below.

11 airports show mobile speeds over 200 Mbps

Speedtest® data shows mobile speeds massively outpaced Wi-Fi, with 14 airports showing faster median downloads over mobile than the fastest airport for Wi-Fi. Hamad International Airport in Qatar had the fastest median download speed over mobile on our list at 442.49 Mbps during Q1 2024, followed by:

  • Shanghai Hongqiao International Airport (341.19 Mbps),
  • Phoenix Sky Harbor International Airport (295.94 Mbps),
  • Shanghai Pudong International Airport (264.71 Mbps),
  • Chongqing Jiangbei International Airport (258.42 Mbps), and
  • Istanbul Airport (255.51 Mbps).

Mobile Network Speeds at Global Airports
Speedtest Intelligence® | Q1 2024

Fastest mobile speeds at airports in Africa and South America

Jomo Kenyatta International Airport in Kenya had the fastest mobile download speeds of the four African airports we analyzed at 88.12 Mbps during Q1 2024. São Paulo/Guarulhos International Airport in Brazil was the faster of the two Latin American airports analyzed with a median download speed of 55.44 Mbps.

Airports with slow mobile speeds

Mobile can’t fix everything, because six airports came in with a median mobile download speed below 25 Mbps. Mexico City International Airport was again at the bottom with 8.75 Mbps, followed by:

  • Josep Tarradellas Barcelona–El Prat Airport (15.21 Mbps),
  • Orlando International Airport (15.84 Mbps),
  • Adolfo Suárez Madrid–Barajas Airport (20.37 Mbps),
  • Chhatrapati Shivaji Maharaj International Airport (20.96 Mbps), and
  • Indira Gandhi International Airport (21.80 Mbps).

Latency on mobile was generally higher than that on Wi-Fi with 46 airports showing a Wi-Fi latency lower than the lowest latency on mobile, 27.51 ms at China’s Shanghai Hongqiao International Airport. As noted above, latency is an important factor in performance, so it might be worth investigating the airport Wi-Fi by running a Speedtest if your mobile performance seems to lag.

Airport Wi-Fi or mobile? Connecting on your next trip

We created a quick guide to help you decide whether to try out the Wi-Fi or simply use the local mobile network if you have access. Use it to compare free airport Wi-Fi performance against mobile performance for the 52 airports we have both Wi-Fi and mobile data for during Q1 2024. Twenty-six airports had faster mobile internet than airport Wi-Fi. Eight airports had faster Wi-Fi than mobile, and seven airports showed only a slight distinction between Wi-Fi and mobile or download speeds over 100 Mbps on both, so we gave both the green check marks. We were able to include more airports in the mobile analysis because there were more mobile samples to analyze at those airports than there were samples over Wi-Fi.

Chart of Comparing Airport Wi-Fi and Mobile Speeds at World Airports

The averages reported here are based on real-world data, so your experience may differ, especially on a busy travel day. Take a Speedtest® at the airport to see how your performance compares. Cheers to safe travels and rapid connections wherever you’re flying.

Ookla retains ownership of this article including all of the intellectual property rights, data, content graphs and analysis. This article may not be quoted, reproduced, distributed or published for any commercial purpose without prior consent. Members of the press and others using the findings in this article for non-commercial purposes are welcome to publicly share and link to report information with attribution to Ookla.
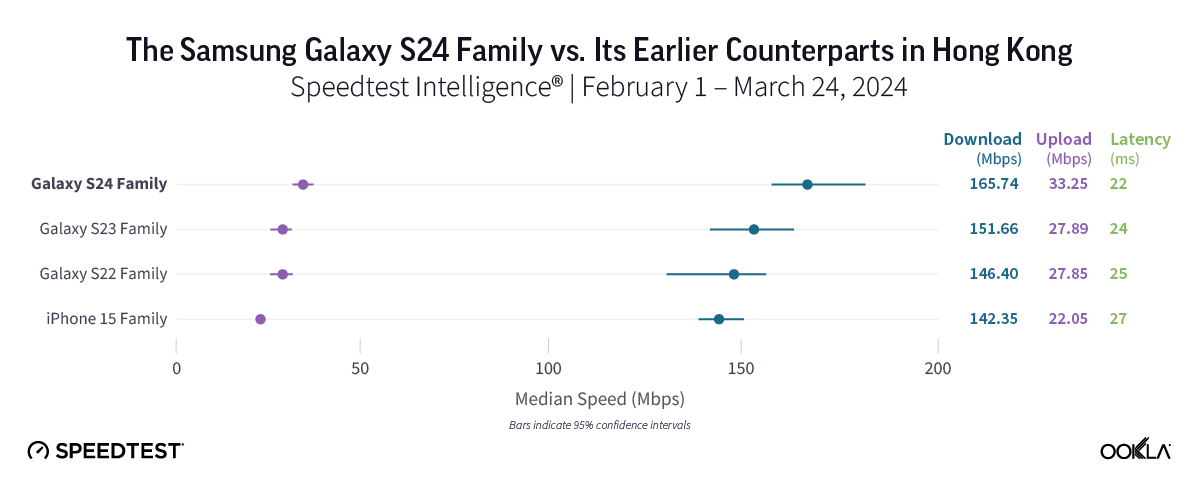
| April 15, 2021

Speedtest Global Index Market Analyses Now Available for 21 Countries

Speedtest Global Index Market Analyses from Ookla® identify key data about internet performance in countries across the world. This quarter we’ve provided updated analyses for 21 markets about top mobile and fixed broadband providers as well as device and chipset manufacturers and some city-level data. Click a country in this list to see highlights or scroll through the article to learn about all 21 markets:

United States | Canada | China

Algeria | Austria | Belgium

Denmark | Finland | Hong Kong (SAR)

Hungary | Kenya | Luxembourg

Malta | Morocco | Nigeria

Portugal | Serbia | Slovakia

South Africa | Taiwan | Vietnam

Algeria

  • Mobile provider Ooredoo attained the best Speed Score and Consistency Score in Algeria during Q1 2021.
  • DJEZZY had the best 4G Availability in Algeria.
  • Devices from Apple provided the fastest mean download speeds in Algeria during Q1 2021 with 20.86 Mbps, 47.1% faster than Samsung.

Austria

  • A1 was the fastest mobile operator in Austria with a Speed Score of 66.21 while yesss! ranked second at 58.60.
  • yesss! edged out A1 for Consistency Score, earning a 93.8% to A1’s 93.5%.
  • Magenta blazed ahead of the competition with the fastest fixed broadband Speed Score of 123.45 and highest Consistency Score with 85.8%.

Belgium

  • Speedtest Intelligence® shows that Telenet had the fastest fixed broadband in Belgium during Q1 2021 with a Speed Score of 97.13, and it had the fastest Speed Score on mobile at 69.74.
  • Telenet also had the best fixed broadband Consistency Score with 87.9%, while BASE had the best mobile Consistency Score with 92.9%.
  • Ghent edged out Antwerp for Belgium’s fastest median download speed over mobile and fixed broadband.

Canada

  • In Q1 2021, Shaw was the fastest fixed broadband provider in Canada with a Speed Score of 164.40, edging out Rogers.
  • The fastest mobile provider was TELUS with a Speed Score of 87.54. Videotron had the highest mobile Consistency Score at 91.3%.
  • TELUS and Bell Canada tied for the lowest median latency for fixed broadband at 6 ms.
  • Newfoundland and Labrador had the fastest median fixed broadband speed among Canada’s provinces at 112.64 Mbps.
  • Calgary had Canada’s fastest median fixed broadband speed of any major city at 115.40 Mbps.

China

  • Speedtest Intelligence shows that China Mobile was the fastest mobile operator in China during Q1 2021 with a Speed Score of 101.62.
  • Competition for fastest median 5G performance was high, but China Telecom outpaced other providers with a 316.02 Mbps median download speed. Speedtest® results show that China Mobile’s 5G performance was second fastest with a median download speed of 308.44 Mbps and China Unicom was third.
  • Huawei’s P40 5G had the fastest median 5G download speed among the most popular devices in China at 291.77 Mbps. This contributed to Huawei’s top position as the device manufacturer with the fastest median download speed with a combined median download speed of 89.11 Mbps. That was 79.4% faster than the next fastest manufacturer, Apple.
  • China Telecom was the fastest fixed broadband provider, achieving a Speed Score of 107.10.
  • Tianjin was the Chinese city with the fastest fixed broadband with tests showing median download speeds of 180.61 Mbps, 29.7% faster than the next fastest city, Chengdu.

Denmark

  • According to Q1 data from Speedtest Intelligence, YouSee was the fastest mobile operator in Denmark with a Speed Score of 86.40.
  • Hiper was the fastest fixed broadband provider in Denmark with a Speed Score of 205.32.
  • The iPhone 12 Pro Max 5G was the fastest popular device in Denmark, with a median download speed of 96.90 Mbps.

Finland

  • Telia was the fastest fixed broadband provider in Finland during Q1 2021 with a Speed Score of 77.05. Telia was also the most consistent, earning a Consistency Score of 80.3%.
  • DNA had the fastest mobile Speed Score (61.73) as well as the highest Consistency Score (93.6%).
  • DNA also had the fastest 5G performance with a median download speed of 337.21 Mbps.

Hong Kong (SAR)

  • During Q1 2021, China Mobile Hong Kong was the fastest mobile provider in Hong Kong, achieving a Speed Score of 65.16.
  • Huawei’s P40 Pro 5G edged out Samsung’s Galaxy S20 Ultra 5G as the fastest popular device in Hong Kong. The P40 Pro 5G achieved a median download speed of 150.67 Mbps, beating the Galaxy 220 Ultra 5G by 1.5 Mbps.
  • Samsung had the best combined performance by a major cell phone manufacturer with its devices reaching mean download speeds of 76.41 Mbps.
  • Devices using Qualcomm’s Snapdragon 888 5G had the fastest mean download speed of any chipset at 137.76 Mbps. Devices with Hisilicon’s Kirin 990 came in second at 136.52 Mbps.

Hungary

  • Magyar Telekom had the fastest mobile Speed Score in Hungary during Q1 2021, as well as the best mobile Consistency Score (90.9%) and highest 4G availability (97.7%).
  • DIGI beat out Vodafone as the fastest fixed broadband provider in Hungary by attaining a Speed Score of 138.74 to Vodafone’s 137.06 and UPC’s 134.08.
  • Apple devices had the fastest median mobile download speeds among popular manufacturers at 36.59 Mbps.

Kenya

  • Safaricom had the fastest Speed Score among mobile providers in Kenya during Q1 2021 at 29.80 as well as the top mobile Consistency Score (86.3%) and highest 4G Availability (88.1%).
  • Mombasa had the fastest mean mobile download speed at 27.79 Mbps while Nairobi was the fastest over fixed broadband with a download speed of 22.65 Mbps.
  • Faiba had the fastest fixed broadband Speed Score at 22.70 and best Consistency Score at 44.0%.

Luxembourg

  • POST was Luxembourg’s fastest mobile operator in Q1 2021 as well as Luxembourg’s most consistent. POST had a Speed Score of 86.31 and a Consistency Score of 95.9%.
  • Orange had the best 4G Availability in Luxembourg at 98.7%.
  • Apple beat out Samsung as the fastest popular device manufacturer by earning a median download speed of 51.13 Mbps to Samsung’s 46.40 Mbps.
  • Tango had the fastest fixed broadband Speed Score at 120.35, while Eltrona had the best fixed broadband Consistency Score with 85.9%.

Malta

  • Mobile providers GO and epic were in close competition for the fastest Speed Score in Q1 2021. GO beat out epic by a fraction by scoring 47.82 to epic’s 47.36.
  • Apple devices had the fastest mean download speed in Malta among popular manufacturers at 51.31 Mbps.
  • Melita had the fastest fixed broadband Speed Score at 118.58 and highest fixed broadband Consistency Score at 84.2%.

Morocco

  • Maroc Telecom was the fastest provider for both fixed broadband and mobile in Morocco during Q1 2021. Maroc Telecom achieved the fastest mobile Speed Score (54.32) and the highest mobile Consistency Score (92.0%).
  • Maroc Telecom also narrowly beat out inwi for the highest 4G Availability with 91.5% to inwi’s 91.3%.
  • Apple devices had the fastest mean download speed in Morocco among popular manufacturers at 50.31 Mbps.
  • Casablanca had the fastest fixed broadband speeds, achieving a mean download speed of 25.93 Mbps while Marrakesh had the fastest mean mobile download speed at 38.33 Mbps.

Nigeria

  • During Q1 2021, tests showed that Airtel had Nigeria’s fastest mobile Speed Score (27.18) and best mobile Consistency Score (84.7%).
  • Port Harcourt had the fastest mean mobile download speed in Nigeria at 23.02 Mbps.
  • ipNX was the fastest fixed broadband provider with a Speed Score of 18.00. ipNX also had the best fixed broadband Consistency Score at 36.2%.

Portugal

  • Vodafone was the fastest fixed broadband provider in Portugal during Q1 2021 with a Speed Score of 113.75, the lowest mean latency (11 ms) and highest Consistency Score (81.9%).
  • MEO was the fastest mobile operator with a Speed Score of 46.92.
  • OnePlus had the fastest mean download speed of any popular device manufacturer at 56.93 Mbps.
  • Among Portugal’s most populous cities, Vila Nova de Gaia had the fastest mean fixed broadband download speed at 155.61 Mbps, while Braga had the fastest mean mobile download speed at 70.95 Mbps.

Serbia

  • During Q1 2021, SBB was Serbia’s fastest fixed broadband provider with a Speed Score of 78.09 and showed the highest Consistency Score of any provider at 81.3%.
  • Speedtest Intelligence revealed that Telenor narrowly edged out VIP for the fastest mobile Speed Score at 50.63 to VIP’s 50.47.
  • Telenor had the highest mobile Consistency Score with 93.4%. Telenor also delivered the highest 4G Availability in Serbia with 90.3%.
  • Devices using Qualcomm’s Snapdragon X55 5G delivered Serbia’s fastest median mobile download speeds at 76.14 Mbps.

Slovakia

  • During Q1 2021, UPC beat out Antik for the fastest fixed broadband operator in Slovakia with a Speed Score of 113.17 to Antik’s 110.46.
  • Antik had the lowest median fixed broadband latency in the country at 3 ms.
  • Orange had the fastest mobile Speed Score in the country with a score of 52.41, followed by Telekom at 49.09.
  • Devices using Samsung’s Exynos 2100 chipset achieved the fastest median download speed (70.13 Mbps).

South Africa

  • Speedtest Intelligence shows that MTN had the fastest mobile download Speed Score in South Africa during Q1 2021 at 54.38.
  • MTN also had the highest 4G Availability in the country with 90.5%.
  • Cool Ideas was the fastest fixed broadband provider in South Africa with a Speed Score of 37.80, followed by Afrihost at 31.32 and Webafrica at 30.87.
  • Johannesburg had the fastest mean fixed broadband download speed at 53.48 Mbps and the fastest download speed over mobile at 54.64 Mbps.

Taiwan

  • According to a Speedtest Intelligence, Chunghwa Telecom was the fastest mobile operator in Taiwan during Q1 2021 with a Speed Score of 71.73.
  • FarEasTone had the fastest median download speed on 5G at 361.48 Mbps.
  • Sony’s Xperia 1 II 5G achieved the fastest mean download speed among popular devices (181.93 Mbps). Apple devices overall attained the fastest mean mobile download speed among popular manufacturers (82.57 Mbps).
  • Taichung had the fastest mean download speed among Taiwan’s most populous cities at 83.35 Mbps. Taipei was second fastest with 80.50 Mbps.

United States

  • Speedtest Intelligence revealed that T-Mobile overtook AT&T in Q1 2021 as the fastest mobile operator in the United States, achieving a Speed Score of 50.21 to AT&T’s 48.38.
  • T-Mobile also had the fastest 5G performance of any operator, achieving a median download speed of 82.35 Mbps while having the highest 5G time spent in the country at 65.4%.
  • OnePlus devices had the fastest mean download speed among popular devices at 50.79 Mbps.
  • Qualcomm had all five of the fastest chipsets in the United States. The Snapdragon X55 5G was fastest with a median download speed of 66.63 Mbps, followed by the Snapdragon 888 5G at 64.63 Mbps and the Snapdragon 865 at 56.50 Mbps.
  • Verizon was the fastest fixed broadband provider with a Speed Score of 160.07, outperforming Cox and XFINITY, which scored 153.57 and 139.33, respectively.
  • Spectrum displayed the most consistent speeds among fixed broadband providers with a Consistency Score of 88.3%.
  • Verizon had the best median fixed broadband latency at 8 ms, while Cox ranked second (12 ms) and XFINITY third (14 ms).

Vietnam

  • Viettel achieved Vietnam’s fastest mobile and fixed broadband during Q1 2021. Viettel showed a Speed Score of 59.76 for fixed broadband and 38.55 for mobile.
  • Vinaphone had the best mobile Consistency Score with 91.1%.
  • Viettel had the highest 4G Availability with 94.4%.
  • Xiaomi’s Mi 10T Pro 5G achieved the fastest mean download speed at 80.17 Mbps and beat out Samsung’s Galaxy Note20 Ultra 5G, which had a median download speed of 59.96 Mbps.

Read the full market analyses and follow monthly ranking updates on the Speedtest Global Index.

The contents of this article are the property of Ookla, LLC and may not be copied, redistributed, published, displayed, performed, modified, exploited or used for commercial purposes, including use in advertisements or other promotional content, without express written permission. This includes, but is not limited to, data, written analysis, images, logos, charts and graphs and other items that may appear on this page. Members of the press, academics, non-profit researchers and others using the findings in this report for non-commercial purposes are welcome to publicly share and link to report information with attribution to Ookla. For more information, please contact press@ookla.com.
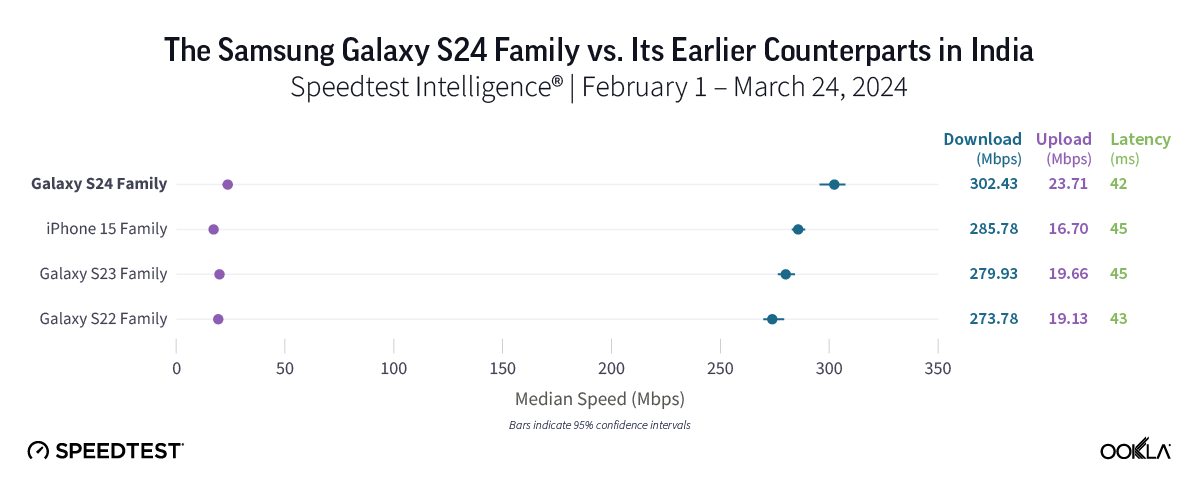
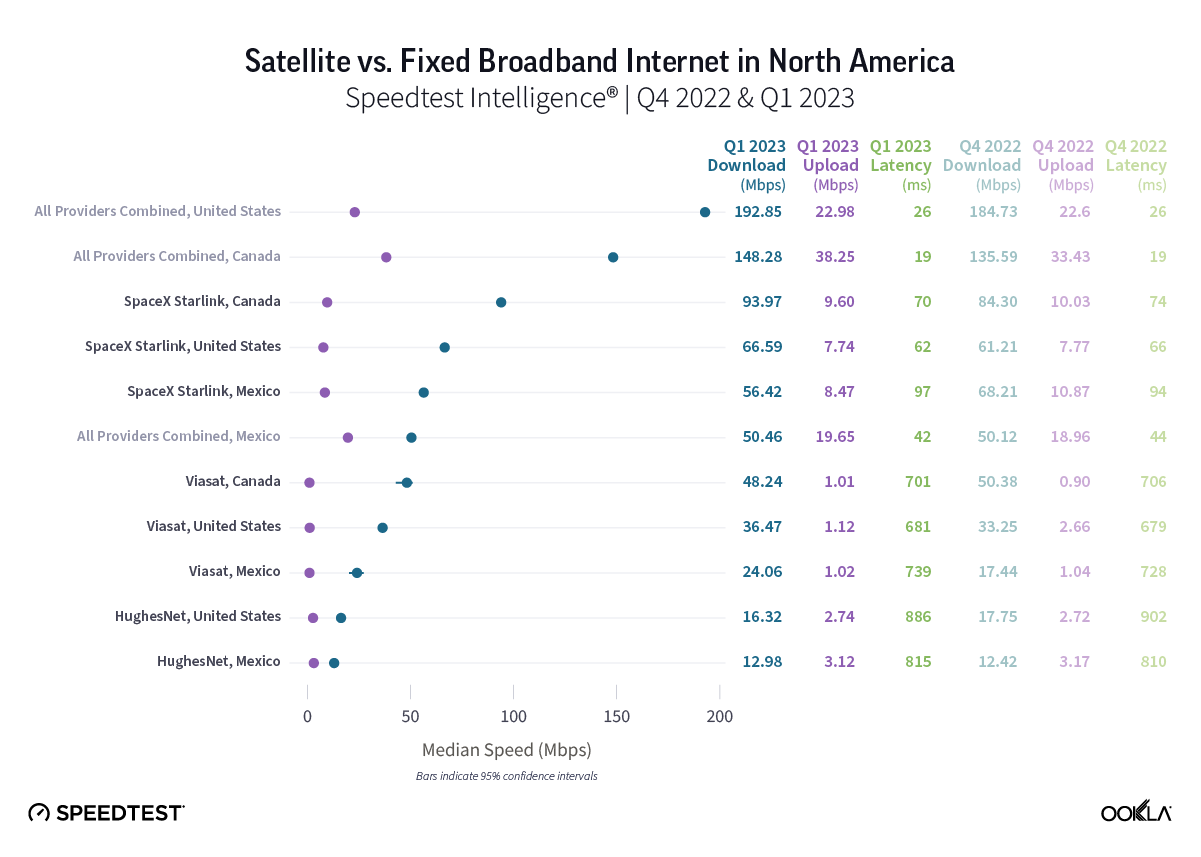
Ookla retains ownership of this article including all of the intellectual property rights, data, content graphs and analysis. This article may not be quoted, reproduced, distributed or published for any commercial purpose without prior consent. Members of the press and others using the findings in this article for non-commercial purposes are welcome to publicly share and link to report information with attribution to Ookla.