| March 13, 2020

Tracking COVID-19’s Impact on Global Internet Performance (Updated July 20)

We are no longer updating this article as internet speeds in most countries have stabilized to pre-pandemic levels. For ongoing information about internet speeds in specific countries, visit the Speedtest Global IndexTM or contact our press team.

Ookla® closely monitored the impact of COVID-19 on the performance and quality of global mobile and broadband internet networks in the early days of the pandemic. We shared regular information based on Ookla data to assist in the understanding of this unprecedented situation. You can still download the July 20, 2020 CSV here which contains all the public data we tracked in this article. If you are looking for information on internet or online service outages, please check Downdetector®.

Ookla retains ownership of this article including all of the intellectual property rights, data, content graphs and analysis. This article may not be quoted, reproduced, distributed or published for any commercial purpose without prior consent. Members of the press and others using the findings in this article for non-commercial purposes are welcome to publicly share and link to report information with attribution to Ookla.

| August 15, 2023

Ookla for Good Adds Centroid Coordinates to Open Data

Faster and Easier Mapping for Fixed and Mobile Network Performance Map Tiles

When we first offered our open performance datasets to the public in 2020, Ookla®’s main priorities were to make sure that our fixed and mobile network performance data would be accessible, relevant, and useful to those researching or trying to improve the state of networks worldwide. As conversations around connectivity continue to evolve, so too has our open dataset. For instance, earlier this year we extended our open performance dataset to include additional responsiveness insights by showing latency under load for both saturated downlink and uplink measurements.

As we continue to advance our datasets to include more new, exciting, and relevant metrics, we remain committed to ensuring that key data views are accessible to as many interested parties as possible: more people accessing network performance and consumer quality of experience insights means more important conversations surrounding connectivity and ultimately better public policy to help improve broadband access globally. This is why we are excited to announce the addition of centroid coordinates to our open data.

What are centroids?

So what exactly are centroid coordinates, and how do they help provide more access to our data? Centroids are the point where the medians of a shape intersect. Or, to put it simply, a centroid is the center point of a shape. For more in-depth information on the math behind how centroids are computed, check out RPubs documentation on the subject.

Why centroids are important

The Ookla for Good open dataset makes use of spatial tiles. While the geometries of tiles provide precision in mapping, working with and plotting spatial data can often be a long and arduous process. This issue is further compounded by the global nature of our datasets, making it difficult for users to subset specific areas to look at. Machines with limited RAM may take multiple hours to do a single spatial join to a small area, and if more metrics are added, the joins take longer and longer to run.

The addition of centroid coordinates means that rather than needing a geospatial toolset, users can filter to an approximation of their area of interest using a numerical bounding box. This will dramatically cut down on the time to join our data to other data sources, improving accessibility for those looking to work with Ookla’s Fixed and Mobile Network Performance Map Tiles.

Mapping open data using centroid coordinates

For this example let’s use the country of Brazil to demonstrate one way of mapping our open data with centroid coordinates in R.

library(geobr)
library(ggrepel)
# remotes::install_github("teamookla/ooklaOpenDataR")
library(ooklaOpenDataR)
library(scales)
library(sf)
library(tidyverse)
library(usethis)

# Set global defaults
theme_set(theme_minimal())
theme_update(text = element_text(color = "#181512")) 
theme_update(plot.subtitle = element_text(hjust = 0.5))

# plot colors
purple <- "#8D5DB2"
light_gray <- "#EDEAE6"
mid_gray <- "#9B9893"

colPal <- colorRampPalette(c("#E4AECF", "#3E0E1C"))

I am using the package geobr to grab the geometries for the country. There are multiple functions within this package that allow you to grab geometries at different administrative levels if you want to follow this tutorial for a smaller portion of the country.

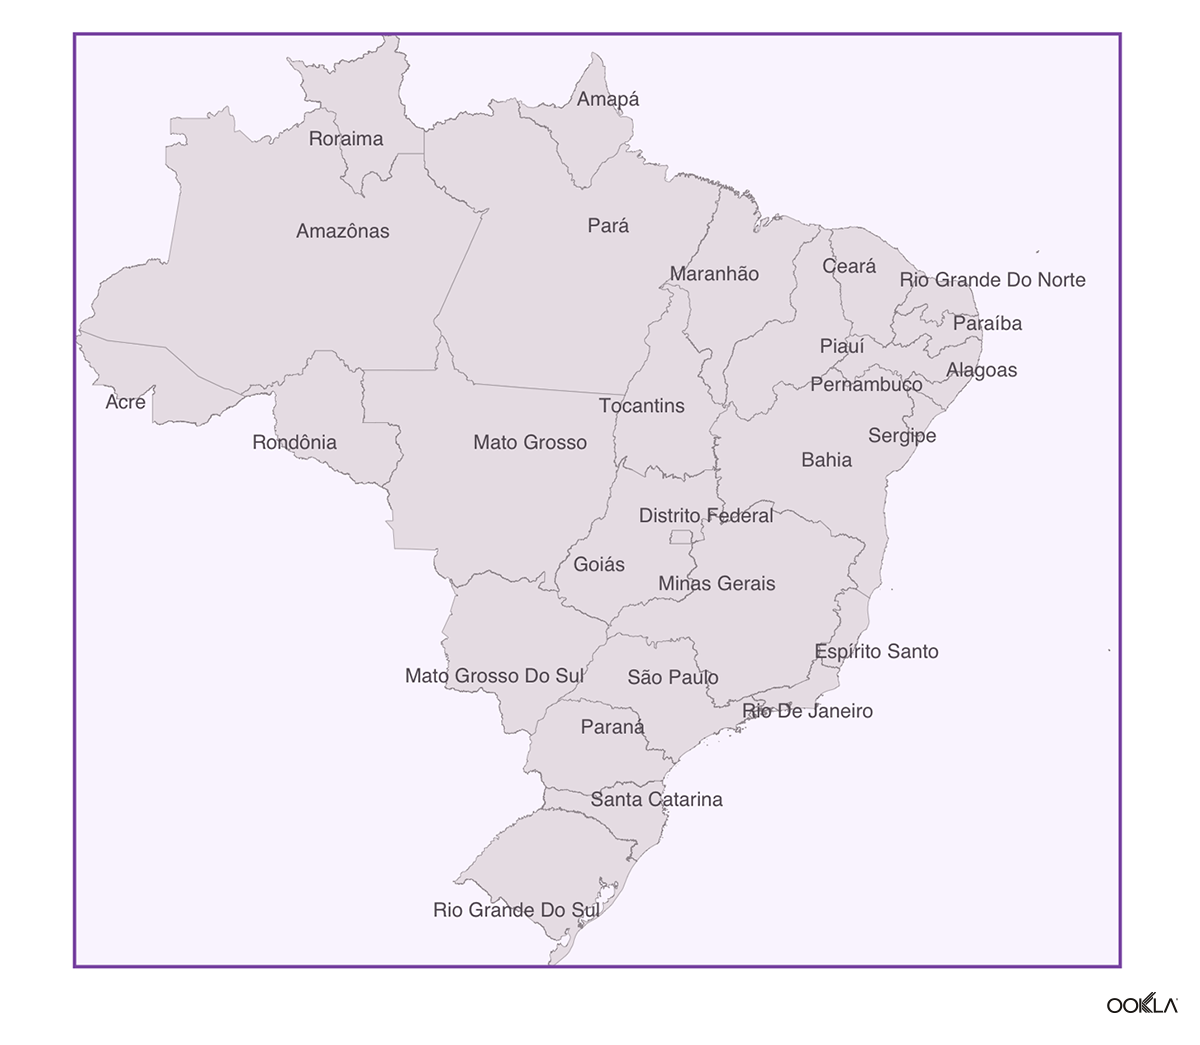
We will be using st_bbox() to create a bounding box to help subset the performance map tiles. An alternative to this is to get min/max coordinates from searching online (for ex: google “Brazil bounding box”). We highlighted the dimensions for Brazil’s bounding box on the following map.

#Set up map
brazil <- read_country(year=2020) %>%
  st_transform(4326)

br_bbox <- brazil %>% # use to subset open data
  st_bbox()

ggplot(brazil) +
  geom_sf(color = mid_gray, fill = light_gray, lwd = 0.08) +
  labs(title = "Brazil") +
  geom_text_repel(aes(label = name_state, geometry = geom),
    family = "sans",
    color = dark_gray,
    size = 2.2,
    stat = "sf_coordinates",
    min.segment.length = 2
  ) +
  theme(
    panel.grid.major = element_blank(),
    panel.grid.minor = element_blank(),
    axis.text = element_blank(),
    axis.title = element_blank()
  ) +
  annotate(geom = "rect", ymax = 5.27, ymin = -33.75, xmax = -28.85, xmin = -73.99, colour = purple, fill = colorspace::lighten("#8D5DB2", 0.5), alpha = 0.1)
Map Base of Brazil

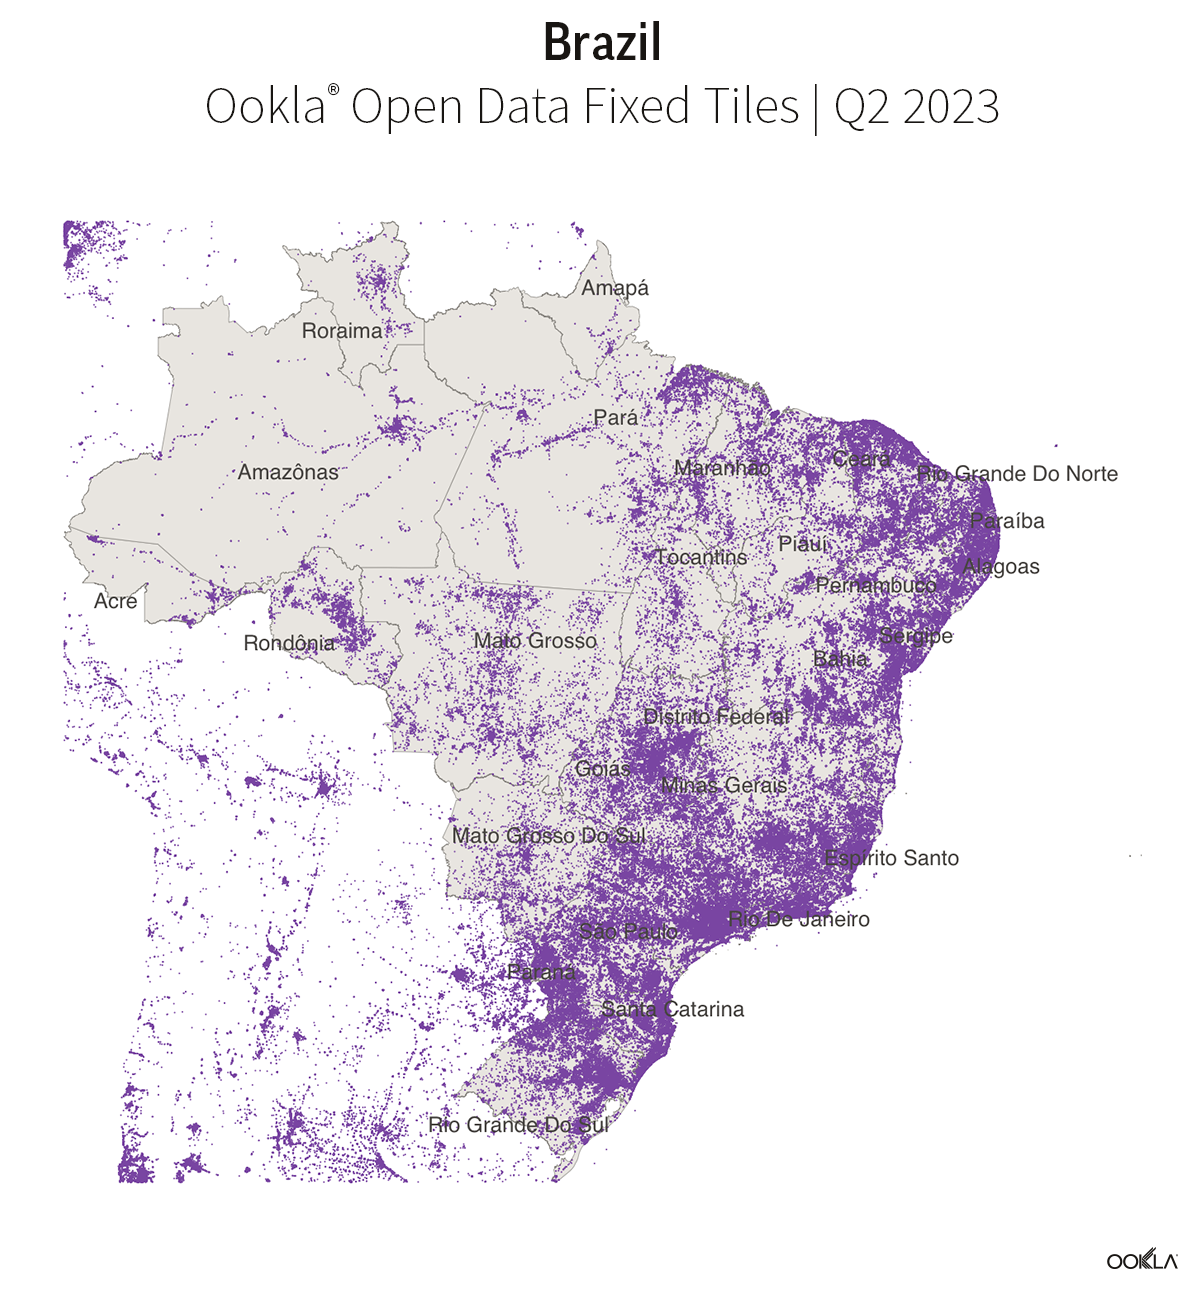
We will then download the performance map tiles using the OoklaOpenDataR package, and then subset the global data to make it more manageable to work with when we do our join.

fixed_br_q2 <- get_performance_tiles(service = "fixed", quarter = 2, year = 2023) %>%
  filter(tile_y <= br_bbox['ymax'], tile_y >= br_bbox['ymin'], tile_x <= br_bbox['xmax'], tile_x >= br_bbox['xmin']) %>%
  st_as_sf(wkt = "tile", crs = 4326)

You can then check to see what the remaining data looks like. There will be points outside of the boundaries, but that is to be expected.

ggplot(brazil) + # Check
  geom_sf(color = mid_gray, fill = light_gray, lwd = 0.08) +
  geom_sf(data = fixed_br_q2, color = purple) +
  labs(
    title = "Brazil",
    subtitle = "Ookla® Open Data Fixed Tiles | Q2 2023"
  ) +
  geom_text_repel(aes(label = name_state, geometry = geom),
    family = "sans",
    color = dark_gray,
    size = 2.2,
    stat = "sf_coordinates",
    min.segment.length = 2
  ) +
  theme(
    panel.grid.major = element_blank(),
    panel.grid.minor = element_blank(),
    axis.text = element_blank(),
    axis.title = element_blank()
  )
Map of Brazil with Ookla® Open Data Fixed Tiles Q2 2023

Voilà! You now have a smaller dataset that can then be used to perform analysis as needed.

Aggregating Loaded Latency

As stated before, we announced the addition of additional loaded latency metrics to our data in January. We can use the previous code to show a simple example of how to aggregate it. For more examples and information on how to perform your own analysis on our open data check out this tutorial.

First, use the following code to perform a spatial join to get a more precise location for our tiles.

#Join 
br_tiles <- brazil %>%
  st_join(fixed_br_q2, left = FALSE)

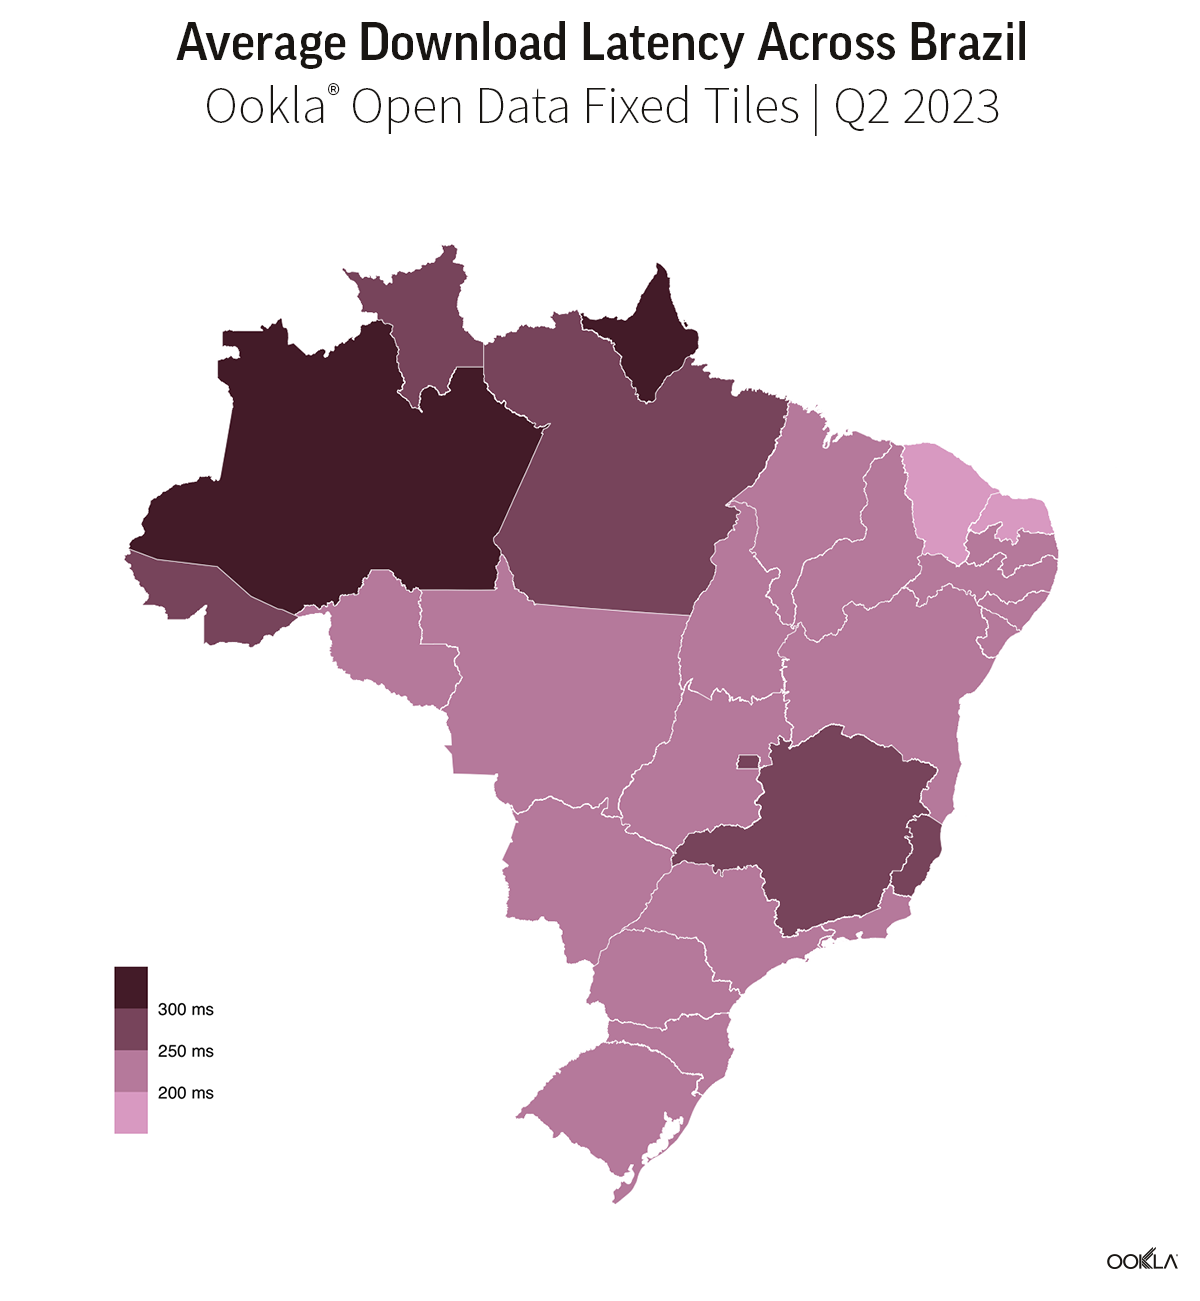
Then aggregate the data up to the desired level of granularity. In this case, we aggregated the data by states in Brazil.

br_aggs <- br_tiles %>%
  st_set_geometry(NULL) %>%
  group_by(name_state) %>%
  reframe(
    tiles = n(),
    avg_lat_download_ms = round(weighted.mean(avg_lat_down_ms, tests, na.rm = TRUE), 2),
    avg_lat_upload_ms = round(weighted.mean(avg_lat_up_ms, tests, na.rm = TRUE), 2),
    total_tests = sum(tests)
  )

Re-join the geometries from Brazil.

br_aggs <- left_join(brazil, br_aggs)

And then map.

ggplot(br_aggs) +
  geom_sf(aes(fill = avg_lat_download_ms), color = "white", lwd = 0.08) +
  scale_fill_stepsn(colors = colPal(5), labels = label_number(suffix = " ms"), n.breaks = 4, guide = guide_colorsteps(title = "")) +
  theme(
    panel.grid.minor = element_blank(),
    panel.grid.major = element_blank(),
    axis.title.x = element_text(hjust = 1),
    legend.text = element_text(color = "black"),
    axis.text = element_blank()
  ) +
  labs(
    title = "Average Download Latency Across Brazil",
    subtitle = "Ookla® Open Data Fixed Tiles | Q2 2023"
  )
Map of Average Download Latency Across Brazil Q2 2023

This example offers one way to filter with the added centroid coordinates, but it is by no means the only approach. If you are interested in exploring more ways to interact with our data, additional tutorials are available on our GitHub page.

Ookla retains ownership of this article including all of the intellectual property rights, data, content graphs and analysis. This article may not be quoted, reproduced, distributed or published for any commercial purpose without prior consent. Members of the press and others using the findings in this article for non-commercial purposes are welcome to publicly share and link to report information with attribution to Ookla.

| June 1, 2023

How a social enterprise in Madagascar found their dream beachside location with Ookla

Onja is a social enterprise that trains underprivileged youth to prepare them to become world-class software developers and places them into European and US-based tech companies. A reliable internet connection is essential for Onja’s mission: it plays a crucial role from the start of the training program right through to employment. By partnering with Ookla for Good, Onja was able to compare connectivity across the country to select the location that would provide the best coverage and performance to support both training and employment opportunities. 

During training, students rely on good internet access to take online courses in addition to their classroom study, work on exciting open-source projects, engage in volunteering and online internships, and interact with experts and mentors from around the world for upskilling activities such as mock interviews and coding challenges.

Once our students land great opportunities as developers, they work remotely from our site in Madagascar. Here too, reliable internet is essential to fulfill every aspect of their role. In addition to their work, which requires high-quality internet, developers have regular stand-ups and meetings with their remote team. These exchanges are important because they create strong bonds between the developers and their team members.

Onja’s developers are not just remote workers and partner companies are not just clients. They are intrinsically linked, contributing greatly to the sustainability of the model and a better future for Madagascar’s young people.

When it came to finding a location for Onja’s base, understanding how internet speed varied was a cornerstone of the decision-making process. By providing Speedtest® performance measurements for each region and almost every city in Madagascar through our Ookla for Good initiative, Onja gained the ability to make an informed decision about an important part of its mission. Thanks to the insights provided by Ookla for Good data, the entire Onja team now operates from Mahanoro, a beach town on the east coast of Madagascar. In addition to being a peaceful learning and working environment, Mahanoro’s internet speed is more than sufficient for the mission.

We are grateful to Onja for their assistance in composing this article. Visit Onja to learn more about its mission and current projects.  

Ookla retains ownership of this article including all of the intellectual property rights, data, content graphs and analysis. This article may not be quoted, reproduced, distributed or published for any commercial purpose without prior consent. Members of the press and others using the findings in this article for non-commercial purposes are welcome to publicly share and link to report information with attribution to Ookla.

| February 27, 2023

How the OECD Uses Ookla Speedtest® Data to Bridge Rural-Urban Connectivity Divides [Case Study]

The Organization for Economic Co-operation and Development (OECD) provides analysis and establishes evidence-based standards to inform international policy that solves social and economic challenges, including connectivity. The OECD leverages network performance data from the Ookla for Good™ open data initiative in their evaluation of broadband speeds across territorial levels within countries — including rural and remote regions where consistent global data is often more difficult to source. This collaboration supports efforts to close the rural-urban connectivity divide as governments and policymakers worldwide rely on recommendations set forth by OECD analysis and reporting.  

Situation

People depend on reliable connectivity; the internet is crucial for accessing information, services, work opportunities, and education. Despite the increasing necessity for connectivity to participate in society, many rural communities have been left behind when it comes to ensuring fast and reliable internet access, as well as proper resources to support digital literacy skills. While internet traffic has increased over 1,000x throughout the past two decades, these digital deserts are missing the necessary broadband infrastructure to support network traffic.

G20, a forum for international economic cooperation comprising 19 countries and the European Union, had set forth agreements emphasizing the need to improve digital infrastructure in order to ensure universal and affordable access to the internet for all by 2025. Recognizing its role in informing actionable policy for governments worldwide, the OECD set out to study fixed and mobile network accessibility in rural areas. The OECD needed a way to measure the extent of digital divides between urban and rural areas within G20 countries. This data would play an important role in understanding user experience and benchmarking performance of the existing fixed and mobile networks.

Read the full case study here.

Ookla retains ownership of this article including all of the intellectual property rights, data, content graphs and analysis. This article may not be quoted, reproduced, distributed or published for any commercial purpose without prior consent. Members of the press and others using the findings in this article for non-commercial purposes are welcome to publicly share and link to report information with attribution to Ookla.

| February 23, 2023

Announcing Loaded Latency in Ookla® Open Data

In 2020, during the height of the COVID-19 pandemic, Ookla® released our open performance datasets to make our rich database of fixed and mobile network performance available to those who are trying to improve the state of networks worldwide. Each quarter, we update this dataset and make it freely accessible to provide an ongoing, public record of the health and evolution of internet connectivity and accessibility. 

Organizations such as the European Commission, the Organization for Economic Co-operation and Development, and the United Nations, as well as other think tanks and universities have published detailed analyses and recommendations based on this data. There is still much work to be done to ensure every individual in every country has access to adequate and affordable internet in order to work, learn, play, and seek medical treatment, whether they reside in the densest city or remote countryside. According to Omdia, 27% of the world’s population is projected to remain unconnected by 2026.

While we must not lose sight of the critical work to be done to connect those that are un- and under-served today, we must also look to the future. The connectivity use cases of tomorrow will be powered by real-time, immersive experiences, and data is needed by those building and researching new connected experiences to understand the level of responsiveness networks can support today. We are pleased to announce that we are extending our open performance dataset to include additional measures of responsiveness: latency under load for both saturated downlink and uplink. Our Q4 2022 datasets now include loaded latency measurements in Apache Parquet format for network researchers, data scientists, GIS professionals, and hobbyists to analyze and understand more completely the global state of network responsiveness. These measures will continue to be a part of the future performance datasets, updated each quarter for fixed and mobile networks.

We are excited to read the research that can be conducted using these additional data points. Network responsiveness under load can range from excellent to abysmal depending on the network technology, equipment, location, and provider. While our open data provides a digestible, global dataset optimized for spatial analysis, we understand different research projects will have different goals, asking questions that may not be well supported by the available formats. We are committed to supporting academic research institutions seeking to understand the global state of network responsiveness and how it affects nascent and emerging communications technologies. Therefore, we will continue to make additional Speedtest Intelligence® data and other enterprise solutions available to qualified individuals and institutions through our Ookla for Good™ program to further this objective.

To those that have included our open data in their published works: thank you. We believe access to a sufficient, reliable internet connection is a fundamental human right. There is no greater reward than seeing our data driving awareness and policy to change inequities in access to connectivity. We can’t wait to see what you’ll do next. If you’re interested in learning more about the Ookla for Good program, please inquire here.

Ookla retains ownership of this article including all of the intellectual property rights, data, content graphs and analysis. This article may not be quoted, reproduced, distributed or published for any commercial purpose without prior consent. Members of the press and others using the findings in this article for non-commercial purposes are welcome to publicly share and link to report information with attribution to Ookla.

| February 16, 2023

European Commission Uses Ookla® Data to Demonstrate Territorial Disparities and the Digital Divide in the EU

The characteristics of places might not define the identity of people living there, but they affect the daily life of every citizen and can prevent them from reaching their full potential and the best life. Persisting territorial disparities, related to phenomena such as depopulation or limited access to services, can become even more visible by observing places rather than individuals. In fact, growing territorial inequality, further exacerbated by the COVID-19 pandemic, limits on people’s lifestyle and life choices, and creates a feeling of being left behind.

The Joint Research Centre of the European Commission recently published a report focused on understanding and identifying territorial disparities and challenges in the EU across a variety of sectors, including access to broadband and the performance of the digital connection, using the Speedtest® by Ookla® Global Fixed and Mobile Network Performance data for Q4 2020. A full comprehension of these challenges and their interlinkages is essential to produce evidence to improve policies, especially for the benefit of those living in vulnerable conditions, in line with the principle of leaving no place and no one behind.

Key findings

High-speed broadband increasingly represents an essential infrastructure to drive the economic and social development of territories. Therefore, the lack of broadband network or poor access to a high-speed connection might cause significant disparities among places and citizens and leave some areas behind in terms of access to services and opportunities, diminishing the quality of life of residents. The connectivity gap, often recognized as an urban-rural digital divide, represents an important challenge to face for some countries and policy makers and may require a joint effort by both public and private initiatives.

Results show that significant differences exist in network speed across the EU-27 countries. Territorial disparities are even more relevant, with most Member States in urban areas enjoying easy access to the highest fixed broadband available (> 100 Mbps), whereas in rural areas a significant percentage of residents have access to an average speed below the minimum standard of 30 Mbps. Only very few countries show access to over 100 Mbps broadband for rural populations (Denmark, Sweden, the Netherlands, Luxembourg).

Regarding mobile broadband, the average speed is generally lower than fixed broadband in all countries, with only a few areas having more than 100 Mbps average speed. Interestingly, the Alpine region across France, Italy and Austria appears to have better connectivity with mobile broadband (over 30 Mbps) than with fixed broadband (under 30 Mbps). The same pattern can be observed in Central Italy and Sardinia, Croatia, and partially in Greece.

To strengthen the evidence of such urban-rural digital divide, the spatial patterns of access to broadband were combined with the population density and the classification of degree of urbanization of municipalities in cities, towns and rural areas (see Figure 01). Results confirm that urban areas present the highest speed in broadband connection, revealing how the areas already most connected in terms of physical networks (i.e., with roads and railways) are also the most connected from the digital point of view. Access to a good broadband connection is most problematic in remote municipalities (with 45 minutes or more from the nearest city by drive), where the average speed is significantly lower than the national averages, especially in countries such as Belgium, Spain, France, and Portugal.

To explore the urban-rural digital divide further, the analysis employed Machine Learning to identify patterns of similarities in terms of vulnerabilities across all areas, regardless of their degree of urbanization, considering the performance of the broadband infrastructure, the population distribution and the remoteness classification of all areas. The areas (belonging to group 0 in Figure 2) are characterized by low speed, high latency, low population density, remoteness, and are identified as the most vulnerable places. However, this analysis also showed that the bad performance of broadband networks is not limited to rural areas. This means that the digital divide is not merely a matter of urban-rural, but mostly a matter of cities versus non-cities: places that would not be considered as disconnected from the physical perspective (not remote areas, but towns close to cities) can still be disconnected from the broadband perspective.

Digitalization can be an opportunity only if its rollout is quick enough to enable rural businesses to remain competitive. However, it is useless without a parallel development of digital literacy and skills for residents in rural areas. Furthermore, digital connectivity is only one player in the game, and it cannot alone overturn the depopulation trends and the other vulnerabilities affecting rural areas.

Without policy support, a lack of or poor access to high-speed broadband might leave some areas behind. Access to broadband and data might help to foster new business and economic activities, especially in vulnerable areas such as rural regions. Exploiting the potential that connectivity and digitalization represent for education and training, cooperation and networking, access to services and markets, can make these areas more attractive to people and businesses.

Cohesion Policy will support the implementation of the EU’s digital agenda. In particular, European Regional and Development Fund investments will focus on digitalization of services for businesses and citizens and rollout of the high-speed broadband. The support will go where it is most needed, i.e. areas where there is a weak take-up of digital technologies or no, or very slow, or very expensive, broadband access or where there is not enough commercial potential to attract private investors.

To read more about this work, the full report is available here.

We are grateful to Patrizia Sulis for her work with our data within the European Commission’s report and guidance in composing this article. For more information, please contact Patrizia Sulis – Scientific Officer – Joint Research Centre, European Commission.

Ookla retains ownership of this article including all of the intellectual property rights, data, content graphs and analysis. This article may not be quoted, reproduced, distributed or published for any commercial purpose without prior consent. Members of the press and others using the findings in this article for non-commercial purposes are welcome to publicly share and link to report information with attribution to Ookla.

| August 17, 2022

The World Bank Uses Ookla Data to Examine Digital Infrastructure in Latin American Countries

Adherence to public health measures like non-pharmaceutical interventions (NPIs) were found to play a crucial role in protecting communities from the spread of COVID-19. A team of World Bank academics analyzed Ookla® Speedtest Intelligence® data alongside other publicly-available data to explore the role of digital infrastructure in NPIs compliance during the pandemic in their new report: “The adoption of non-pharmaceutical interventions and the role of digital infrastructure during the COVID-19 Pandemic in Colombia, Ecuador, and El Salvador.”

Highlights from the report:

  • Adherence to NPIs correlates with socioeconomic factors: It’s been established that disadvantaged communities struggled to implement movement restriction measures during the acute phases of the pandemic. These radically changed many people’s lives, but disadvantaged communities (both in low- and high-income countries) were disproportionately affected, most likely due to limitations in how people in those communities would be able to stay at home for jobs, school, etc.
  • Movement reduction: The research conducted in this report finds that NPIs implemented in Colombia, Ecuador, and El Salvador during 2020 caused a significant drop in movements during 2020. These drops from pre-pandemic baselines were 53% in Colombia and 64% in both Ecuador and El Salvador.
  • Connections between movement reduction and digital infrastructure: Furthermore, the research found that for every 10 Mbps increase in average fixed download speed, movement reduction increases by 13% in Colombia, 4% in Ecuador, and 19% in El Salvador.
  • Digital infrastructure, socioeconomic status, and movement reduction: These findings also may correlate with higher socioeconomic status supported by the fact that mobility reductions were more pronounced in larger, denser, and wealthier municipalities.
  • Further steps: This research shows that there is a significant association between the quality of digital infrastructure and adoption of NPIs, even after controlling for socioeconomic indicators. Due to the disproportionate gap between low-income and wealthier areas, action should be taken for policies and targeted investments aimed at “closing the digital gap, improving network reliability as well as equality across communities.”

We would like to thank Nicolò Gozzi, Niccolò Comini, and Nicola Perra for their work on this project.

Read the World Bank's Announcement Button

Ookla joined the World Bank’s Development Data Partnership platform over two years ago as part of our Ookla for GoodTM initiative. We are thankful to them, alongside the many other organizations we partner with to improve the state of internet performance around the world. Learn more about Ookla for Good.

Ookla retains ownership of this article including all of the intellectual property rights, data, content graphs and analysis. This article may not be quoted, reproduced, distributed or published for any commercial purpose without prior consent. Members of the press and others using the findings in this article for non-commercial purposes are welcome to publicly share and link to report information with attribution to Ookla.

| October 11, 2021

Internet Access on U.S. Tribal Lands is Imperative to Daily and Creative Life


Tribal lands in the United States have often been sidelined or simply excluded from decisions critical to funding infrastructure initiatives and improvements. As COVID-19 revealed the internet to be an essential utility for daily life, the internet served as a lifeline and an opportunity for people living on reservations and other Tribal lands to connect with education, telehealth resources, businesses and the “at large” community. But with 628,000 Tribal households having no access to the internet, access to those critical services is lacking for too many.

In honor of Indigenous People’s Day, Ookla for Good spoke with a Cherokee Nation citizen and advocate about the importance of the internet to Native communities. We’ve also provided analysis on internet performance on federally recognized Tribal lands and off-reservation trust land areas, including an easy download for anyone who would like to do further research on this important topic.

The internet is a vital connector between places and cultures

We sat down with Joseph Cloud, formerly the Community Hope Center Project Manager at the Boys and Girls Club of Chelsea, Oklahoma and a student of the Cherokee Cultural Studies program at Northeastern State University, to discuss the impact that digital access has on Indigenous communities.

The Boys and Girls Club of Chelsea is funded by the Delaware Tribe and Cherokee Nation to help the children of the region reach their full potential. Cloud began working with the Club when they received a grant from the state of Oklahoma through the CARES Act. Cloud recounted that the CEO contacted him to say they had received a large grant and needed to spend it within a month.

The best way to do that was to install high-speed internet at the Club. Before, they had the one router that served the whole space and you couldn’t access the Wi-Fi from the outbuildings. I thought, “How can we make this center a space for kids who don’t have internet at home?” We installed internet and bought lots of equipment so kids could come there and do their homework. We bought specialized laptops with different editing suites so they could grow their skills in things like photography as they grew older. We weren’t designing for a certain kid, we were growing the program for the future.

The internet was important to getting this project done, too. Cloud was living in New Orleans at the time. He contacted a friend who was a tech wizard in Nashville, Tennessee to consult on this project in Oklahoma. Together they settled on a Ubiquiti system that provides high speed internet throughout the facility.

Cloud has unique insight into how the internet benefits kids on the reservation beyond access to Wi-Fi, too. He grew up as part of the Cherokee Nation in Oklahoma but he was separated from the Tribal community when his family moved to Florida. “All I’ve had in the last 21 years to stay connected to my culture is the internet,” he stated, “I needed to follow an instinct to strengthen my connection with my culture and my heritage.” He found the Cherokee studies program at Northeastern through online research and now continues to rely on the internet to attend class and connect with peers. “Schools are doing very little to hold together Native scholars — so we must turn to the internet to stay connected, not just across the country, but also locally” he said.

Last year, Cloud attended the Symposium on the American Indian, which was held virtually for the first time in 2020. Attending from Florida, he learned from leaders within the Indigenous advocacy community about a variety of issues. Digital access has empowered Joseph to reconnect with his Indigenous heritage through virtual events, online school and a cross-cultural online community.

Digital access has also had a large impact on his advocacy work, “The internet allows us to bring people into the conversation. We can combat power dynamics by addressing Indigenous issues with predominantly white institutions. These are very important moments.” For Joseph Cloud and so many other Native people, the internet is essential. It provides them with a platform to connect with other scholars, artists and with the world at large — allowing them to be heard and advocate for themselves and their communities.

Too many Tribal lands fall behind U.S. averages for internet performance

As we’ve seen, the internet is a critical utility for people living on Tribal lands in the U.S. However, that vital connection only works well if the internet performance is strong enough to support modern use cases, like video conferencing and streaming. We analyzed Speedtest Intelligence® data from American Indian/Alaska Native/Native Hawaiian (AIANNH) Areas in the U.S. during Q3 2021 to see how they compare to the U.S. as a whole.

29% of Tribal lands did not meet the FCC’s fixed broadband standards for download speed

Our analysis showed that fixed broadband speeds varied wildly between different AIANNH areas in the U.S. during Q3 2021. The Chickahominy Tribal designated statistical area between Richmond and Williamsburg, Virginia, for example, with one of the fastest median broadband speeds among Tribal lands in the U.S. at 218.86 Mbps, serves as a model of how state funding can radically improve internet infrastructure and performance. Quinault Reservation in northwestern Washington had one of the slowest download speeds at 3.98 Mbps.

Of the 140 AIANNH areas that met our sample count criteria for fixed broadband, 36 did not meet the FCC minimum download speed for broadband of 25 Mbps. Sixteen did not meet the minimum 3 Mbps for upload. For context, the median download speed over fixed broadband in the U.S. was 119.84 Mbps. Only 13 Native areas exceeded that.

ookla_tribal-lands_us_fixed-broadband_1021-1

124 Tribal lands had slower mobile download speeds than U.S. average

There was also a wide array of mobile speeds across AIANNH areas in the U.S. during Q3 2021. Of the 203 Tribal lands that met sample count criteria for mobile performance, 124 showed a slower median download speed than the U.S. average of 44.84 Mbps. Fifty-eight Native areas showed a mobile download speed less than 25 Mbps and 17 had uploads slower than 3 Mbps. Lualualei Hawaiian Home Land, on the west side of Oahu, had one of the fastest median download speeds over mobile during Q3 2021 at 162.09 Mbps. Moapa River Indian Reservation in southern Nevada had one of the slowest median download speeds over mobile during the same period at 3.73 Mbps.

ookla_tribal-lands_us_mobile_1021

4G Availability varies widely between Tribal lands

Of the 217 Tribal lands with sufficient samples, 102 showed a 4G Availability (the percent of users on all devices that spend the majority of their time on 4G and above) lower than the U.S. average of 96.0% during Q3 2021. Nine Tribal lands showed 100% 4G Availability: Auburn Rancheria in California, Big Pine Reservation in California, Reno-Sparks Indian Colony in Nevada, Soboba Off-Reservation Trust Land in California, Sycuan Reservation in California, Viejas Reservation in California, Kapolei Hawaiian Home Land, Waimanalo Hawaiian Home Land and the Kiowa-Comanche-Apache-Fort Sill Apache/Caddo-Wichita-Delaware joint Oklahoma Tribal statistical area. Walker River Reservation in Nevada had one of the lowest 4G Availability calculations at 30.2%.

ookla_tribal-lands_us_4g-availability_1021g-1

The internet is a lifeline and a basic utility. While some Tribal lands do have good connectivity and speeds according to our data, those that do not are being further left behind. As experts in internet performance (but not Tribal policy), we are offering our full Tribal data set for anyone who would like to do further analyses. Download the full data set here.

Ookla retains ownership of this article including all of the intellectual property rights, data, content graphs and analysis. This article may not be quoted, reproduced, distributed or published for any commercial purpose without prior consent. Members of the press and others using the findings in this article for non-commercial purposes are welcome to publicly share and link to report information with attribution to Ookla.

| June 8, 2021

Ookla for Good Adds 2019 Data and a New Collaboration with Mapbox

Access to reliable, high-speed internet has become more critical than ever for everyday life over the past year. Between remote work opportunities, remote learning, basic healthcare and even buying groceries, internet performance had a very personal impact. We’ve seen many new and compelling conversations exploring internet inequity, data affluence and digital divides around the world since the launch of our Ookla Open Datasets under the Ookla for Good program. Today we have two exciting announcements to keep growing those conversations: the release of our 2019 Global Fixed and Mobile Network Performance datasets and our new Ookla for Good partnership with the amazing people at Mapbox.

2019 Global Fixed Broadband and Mobile Network Performance Maps open dataset now available

Although the global pandemic is by no means over, many are ready to take a look back. In 2020 we announced Ookla Open Datasets that shared fixed and mobile performance data from across the globe. Today we are releasing the same open data for Q1-Q4 2019 to establish a baseline on network performance before the pandemic. We hope this data will enable conversations that continue to improve internet access for people around the world.

Ookla for Good partners with Mapbox

We are also excited to announce a new partnership with Mapbox that offers a new way to quickly and easily visualize some of our open data. The Mapbox Community and Ookla for Good teams were thrilled to work closely together to launch our first collaborative interactive open data map.

Choose Data Set

Selected Tile

Click a tile to get more information

Mean Download Speed Mbps

Download this data

This interactive map came about as we were exploring how we could make some aspects of our open datasets more easily accessible to a wider audience. Working with the Mapbox Community team allowed us to provide a quick, easily accessible visualization of the most recent data for those who want to tell a story or get a feel for the data — especially those who don’t have the time (or maybe technical know-how) to do a deep dive into the data in its entirety. This fulfills the Mapbox Community team’s mission — getting the best location tools into the hands of changemakers around the world— and Ookla for Good’s mission of helping make the internet better, faster and more accessible for everyone. Together, we believe we can help decision makers make better decisions and changemakers tell better stories.

Learn more about how we used Mapbox

We mapped our open data using the Mapbox Tiling Service in order to create vector tiles at different zoom levels. This helps us provide a useful image of internet performance across the world. The basemap was built using Mapbox Studio tools and the full map was put together using Mapbox GL JS to provide interactivity and more customized controls.

We look forward to seeing how you use Ookla’s open data in your projects and encourage you to play around with our new Mapbox map to visualize the possibilities. We’d love to see your work! Please share your projects on social media using the hashtag #OoklaForGood.

Ookla retains ownership of this article including all of the intellectual property rights, data, content graphs and analysis. This article may not be quoted, reproduced, distributed or published for any commercial purpose without prior consent. Members of the press and others using the findings in this article for non-commercial purposes are welcome to publicly share and link to report information with attribution to Ookla.

| February 4, 2022

The OECD Uses Speedtest® Data to Improve Broadband Access and Address Digital Deserts

Ookla® maintains a data sharing partnership with the Organisation for Economic Co-operation and Development (OECD) as part of our Ookla for Good™ initiative. The OECD leverages data from the Ookla for Good open data initiative in their evaluation of broadband speeds across provinces within countries, including for rural and remote regions where data is often more difficult to find through administrative resources. The collaboration and analysis supports efforts to close the rural-urban connectivity divide on a global scale. For this purpose, the OECD recently published a report and summary blog post both studying access to fixed broadband in rural areas: “Bridging Digital Divides in G20 Countries” using data from Speedtest by Ookla Global Fixed Network Performance Map Tiles global fixed network performance maps corresponding to Q4 2020.

The report explores policies to reduce the disparity of connectivity between regions including targeted funding to support massive broadband and infrastructure investment projects after detailing the scope of network inequality among rural digital deserts that lack access to high-speed internet. The COVID-19 pandemic has highlighted that reliable internet access is a necessity as more people than ever before transition more of their lives online to attend work, school, and other virtual events. Despite the increasing reliance on the internet to participate in society, many rural communities have been left behind when it comes to fast and reliable internet. While internet traffic has increased over 1,000x throughout the past two decades, digital deserts are missing the necessary infrastructure to support network traffic in 2022 and beyond.

Key findings

  • Broadband download speeds vary greatly. The OECD report found that poor data collection and self-reporting issues can result in inaccurate data on network access and reliability. Using Ookla for Good open data, the OECD uncovered the depth of internet access inequality in digital deserts. This data demonstrated that rural areas are massively behind, averaging 31% slower than the mean national download speed and 52% slower than cities during Q4 2020.
  • Funding broadband improvements generates meaningful change. The OECD report discusses how many countries now view internet connectivity as a basic right, and many nations have put plans into place to improve access to broadband. The OECD also found that increasing competition and reducing network deployment costs alone is not enough for rural regions, even if they have proven to be investments that can help G20 countries expand their network coverage affordably. Furthermore, several studies by U.S. economists estimate that having access to broadband access saves households between $1,500 and $2,200 annually, which could have massive global economic impacts.
  • The importance of private and public sector partnerships remains integral to increasing access and promoting competition. The OECD looks to both national and sub-national governments to generate attention for broadband issues. In addition to policies specifically for rural areas, OECD points to policies that increase competition, working in concurrence with public investment to subsidize private investment in broadband for areas that may not otherwise receive coverage. For example, increased competition in Mexican broadband led to 84% decline in price in mobile broadband costs, while adding 72 million users from 2012 through 2020. The OECD report also provides information on the Quebec regional government’s 50-50 funding initiative to service 150,000 new rural homes through private network operators.
  • Bridging the “connectivity divide”means improving digital literacy. The connectivity divide is a term used to describe areas with disadvantaged groups and low population density. Not only do these areas lack access to broadband, but many individuals lack basic digital skills. Addressing the issues of both connectivity and digital literacy is paramount to strengthening the economic and social revitalization of these areas. Several of the OECD countries have taken measures to improve digital literacy: France has offered individual training accounts for upskilling, Australia has offered rural skills training initiatives to provide skills customized to regional needs, and Canada has provided digital literacy funds and youth programs.

We’re proud to partner with organizations like the OECD and empower them with data that ultimately creates a better, faster and more accessible internet across the world. Read the full report or click here to learn more about Ookla for Good.

Ookla retains ownership of this article including all of the intellectual property rights, data, content graphs and analysis. This article may not be quoted, reproduced, distributed or published for any commercial purpose without prior consent. Members of the press and others using the findings in this article for non-commercial purposes are welcome to publicly share and link to report information with attribution to Ookla.