| February 27, 2023

How the OECD Uses Ookla Speedtest® Data to Bridge Rural-Urban Connectivity Divides [Case Study]

The Organization for Economic Co-operation and Development (OECD) provides analysis and establishes evidence-based standards to inform international policy that solves social and economic challenges, including connectivity. The OECD leverages network performance data from the Ookla for Good™ open data initiative in their evaluation of broadband speeds across territorial levels within countries — including rural and remote regions where consistent global data is often more difficult to source. This collaboration supports efforts to close the rural-urban connectivity divide as governments and policymakers worldwide rely on recommendations set forth by OECD analysis and reporting.  

Situation

People depend on reliable connectivity; the internet is crucial for accessing information, services, work opportunities, and education. Despite the increasing necessity for connectivity to participate in society, many rural communities have been left behind when it comes to ensuring fast and reliable internet access, as well as proper resources to support digital literacy skills. While internet traffic has increased over 1,000x throughout the past two decades, these digital deserts are missing the necessary broadband infrastructure to support network traffic.

G20, a forum for international economic cooperation comprising 19 countries and the European Union, had set forth agreements emphasizing the need to improve digital infrastructure in order to ensure universal and affordable access to the internet for all by 2025. Recognizing its role in informing actionable policy for governments worldwide, the OECD set out to study fixed and mobile network accessibility in rural areas. The OECD needed a way to measure the extent of digital divides between urban and rural areas within G20 countries. This data would play an important role in understanding user experience and benchmarking performance of the existing fixed and mobile networks.

Read the full case study here.

Ookla retains ownership of this article including all of the intellectual property rights, data, content graphs and analysis. This article may not be quoted, reproduced, distributed or published for any commercial purpose without prior consent. Members of the press and others using the findings in this article for non-commercial purposes are welcome to publicly share and link to report information with attribution to Ookla.

| February 23, 2023

Announcing Loaded Latency in Ookla® Open Data

In 2020, during the height of the COVID-19 pandemic, Ookla® released our open performance datasets to make our rich database of fixed and mobile network performance available to those who are trying to improve the state of networks worldwide. Each quarter, we update this dataset and make it freely accessible to provide an ongoing, public record of the health and evolution of internet connectivity and accessibility. 

Organizations such as the European Commission, the Organization for Economic Co-operation and Development, and the United Nations, as well as other think tanks and universities have published detailed analyses and recommendations based on this data. There is still much work to be done to ensure every individual in every country has access to adequate and affordable internet in order to work, learn, play, and seek medical treatment, whether they reside in the densest city or remote countryside. According to Omdia, 27% of the world’s population is projected to remain unconnected by 2026.

While we must not lose sight of the critical work to be done to connect those that are un- and under-served today, we must also look to the future. The connectivity use cases of tomorrow will be powered by real-time, immersive experiences, and data is needed by those building and researching new connected experiences to understand the level of responsiveness networks can support today. We are pleased to announce that we are extending our open performance dataset to include additional measures of responsiveness: latency under load for both saturated downlink and uplink. Our Q4 2022 datasets now include loaded latency measurements in Apache Parquet format for network researchers, data scientists, GIS professionals, and hobbyists to analyze and understand more completely the global state of network responsiveness. These measures will continue to be a part of the future performance datasets, updated each quarter for fixed and mobile networks.

We are excited to read the research that can be conducted using these additional data points. Network responsiveness under load can range from excellent to abysmal depending on the network technology, equipment, location, and provider. While our open data provides a digestible, global dataset optimized for spatial analysis, we understand different research projects will have different goals, asking questions that may not be well supported by the available formats. We are committed to supporting academic research institutions seeking to understand the global state of network responsiveness and how it affects nascent and emerging communications technologies. Therefore, we will continue to make additional Speedtest Intelligence® data and other enterprise solutions available to qualified individuals and institutions through our Ookla for Good™ program to further this objective.

To those that have included our open data in their published works: thank you. We believe access to a sufficient, reliable internet connection is a fundamental human right. There is no greater reward than seeing our data driving awareness and policy to change inequities in access to connectivity. We can’t wait to see what you’ll do next. If you’re interested in learning more about the Ookla for Good program, please inquire here.

Ookla retains ownership of this article including all of the intellectual property rights, data, content graphs and analysis. This article may not be quoted, reproduced, distributed or published for any commercial purpose without prior consent. Members of the press and others using the findings in this article for non-commercial purposes are welcome to publicly share and link to report information with attribution to Ookla.

| February 20, 2023

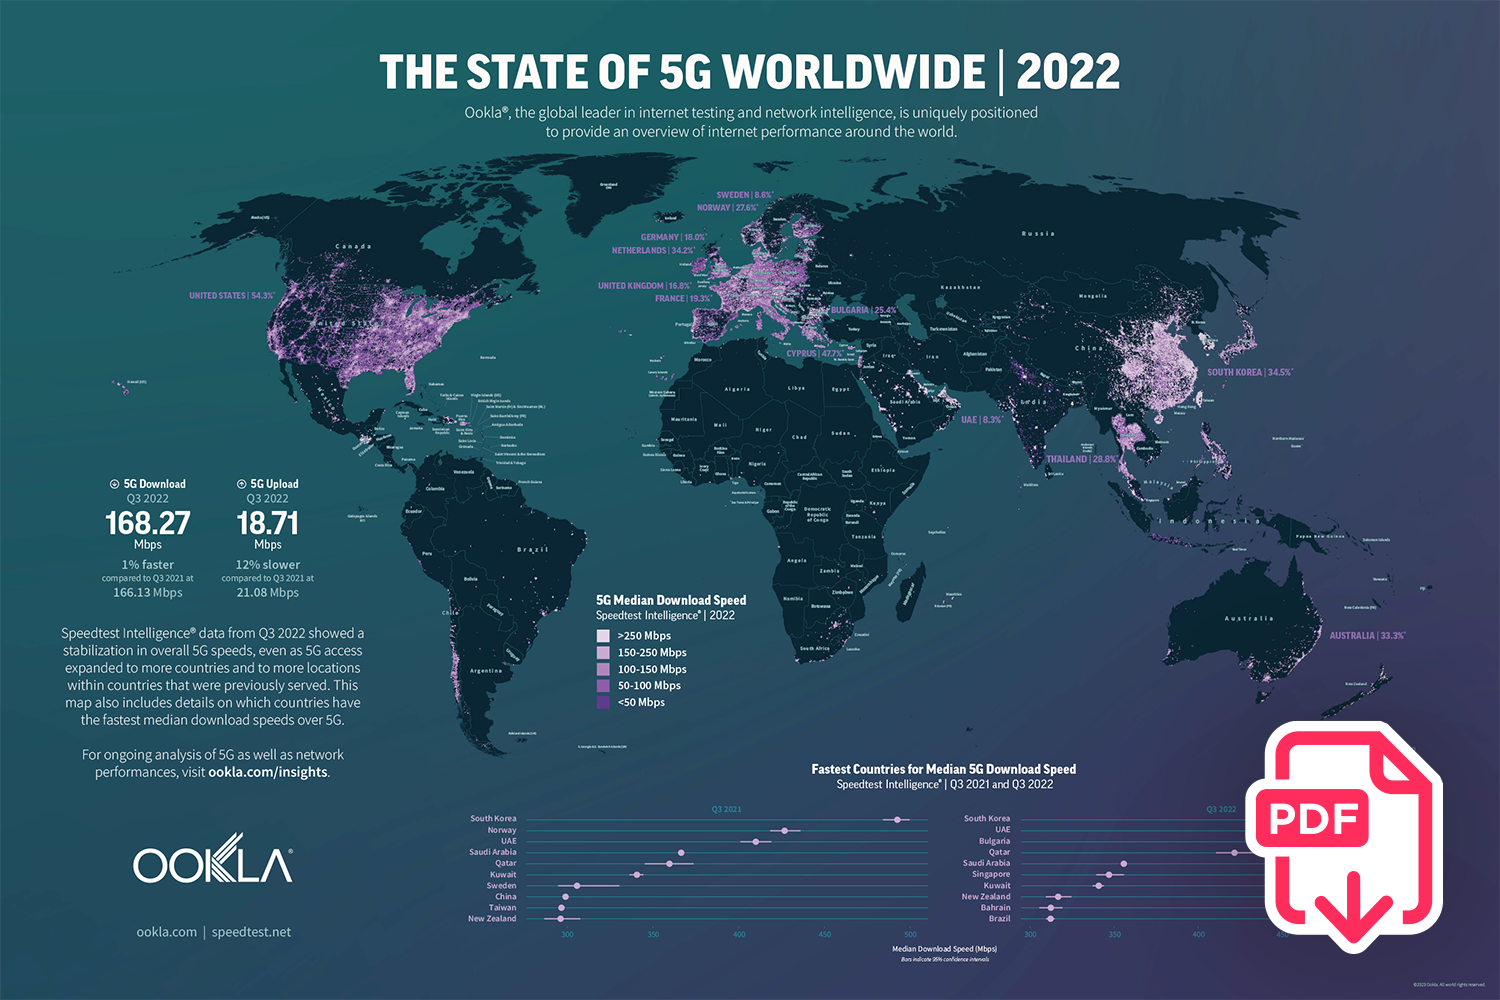
Illustrating the Worldwide State of 5G (Poster Download)

Our recent analysis showed that the global average for 5G speeds is stabilizing even as 5G access increases. To fully appreciate how far 5G has expanded, we’ve created a high-resolution downloadable poster (mobile friendly version available here) that also highlights major 5G achievements around the world.

graphic of Ookla 5G poster download link

This poster maps 5G coverage and highlights the countries with the fastest 5G. Download the Ookla® State of 5G Worldwide poster here to see the global state of 5G. It works as a desktop background or you can hang it on your wall.

If you’re at Mobile World Congress this year, stop by Booth 2i28 in Hall 2, to say hello.

Ookla retains ownership of this article including all of the intellectual property rights, data, content graphs and analysis. This article may not be quoted, reproduced, distributed or published for any commercial purpose without prior consent. Members of the press and others using the findings in this article for non-commercial purposes are welcome to publicly share and link to report information with attribution to Ookla.

| February 8, 2023

Latency is the Next Frontier of Consumer Experience. Are You Ready?

Internet service providers and mobile operators have spent decades optimizing their networks to provide the best speeds possible so consumers can achieve seamless connected experiences. However, the internet and how we use it is changing; bandwidth is no longer all that matters for networks operators to deliver on the possibilities that a connected world can offer. While latency has always affected connectivity, latency and responsiveness metrics have become increasingly critical to network operators focused on delivering a superior connected experience and supporting evolving consumer use cases. Read on to learn why latency matters to quality of experience, why you need to consider latency now, and how Ookla® can help you measure what matters most.

Bandwidth is now an economics problem, latency is the new opportunity horizon.

Why latency matters

A 2009 study detailed that every 100 ms of additional latency on Amazon.com, cost the company 1% of revenue. While speed has always been the focus for optimization, since the end user delay was caused by the delay of downloading data assets, now that bandwidth has increased for many people around the globe, the bottleneck for these folks is the time delay between two systems communicating.

Latency is the bidirectional roundtrip time between two endpoints.

Latency matters for every online experience. While best known for gaming, video conferencing, and streaming video, the underlying internet protocols powering modern experiences rely on bidirectional communication to negotiate encryption keys, determine routing paths, and request resources. As a result, the typical request on the internet requires two to five round trip communications between various entities over different latency sensitive protocols (DNS, TCP, TLS, and QUIC/H3).
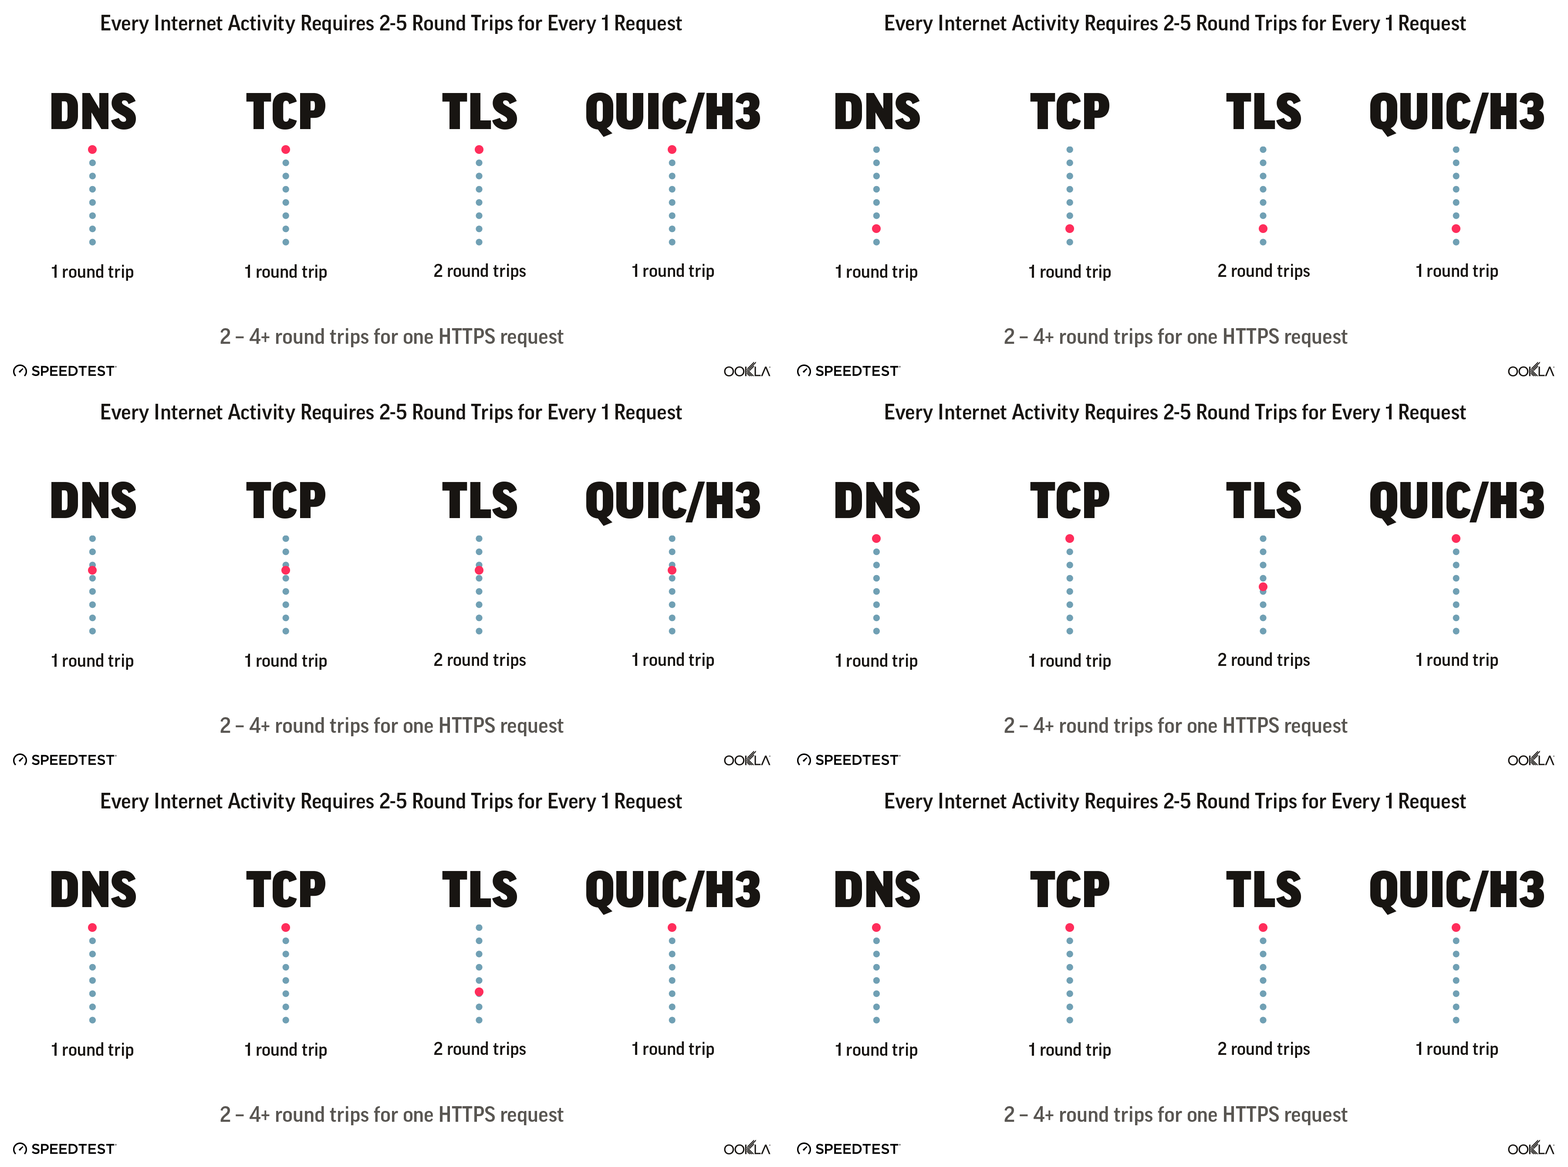
animation showing 1 round trip vs 2 for various internet protocols DNS, TCP, TLS, QUIC/H3

On a gigabit connection, 500 ms of additional latency dramatically affects the page load time. It can take 7x to load a full webpage when latency is high, as seen in the example below.

In addition to web browsing, video and voice calling needs a latency below 300 ms to provide an acceptable experience. This is a physiological threshold — below 300 ms — where the human brain can manage the delay and not speak over other parties. Above the 300 ms barrier, it’s difficult to maintain a coherent conversation.

Think back to the Amazon example above: You may not be directly losing money when your customers see a slow page load due to high latency, but you are providing a poor network experience that will result in increased customer service costs and churn. In fact, one study from the University of Massachusetts Amherst and Akamai concluded “…an increase in the startup delay beyond 2 seconds causes viewers to abandon the video. Using regression, we show that an additional increase of the startup delay by 1 second increases the abandonment rate by 5.8%.” Of course, network operators don’t control the full experience here, and things like CDN location can really affect an end user’s experience, but consumers don’t have visibility into that and the more you can optimize the portions you do control, the less negative feedback you’ll receive.

Latency will matter even more in the very near future

The future of the internet is bidirectional where download and upload communication are necessarily performed simultaneously. Whether AR and VR or self-driving vehicles, this will require dramatic improvements in latency.
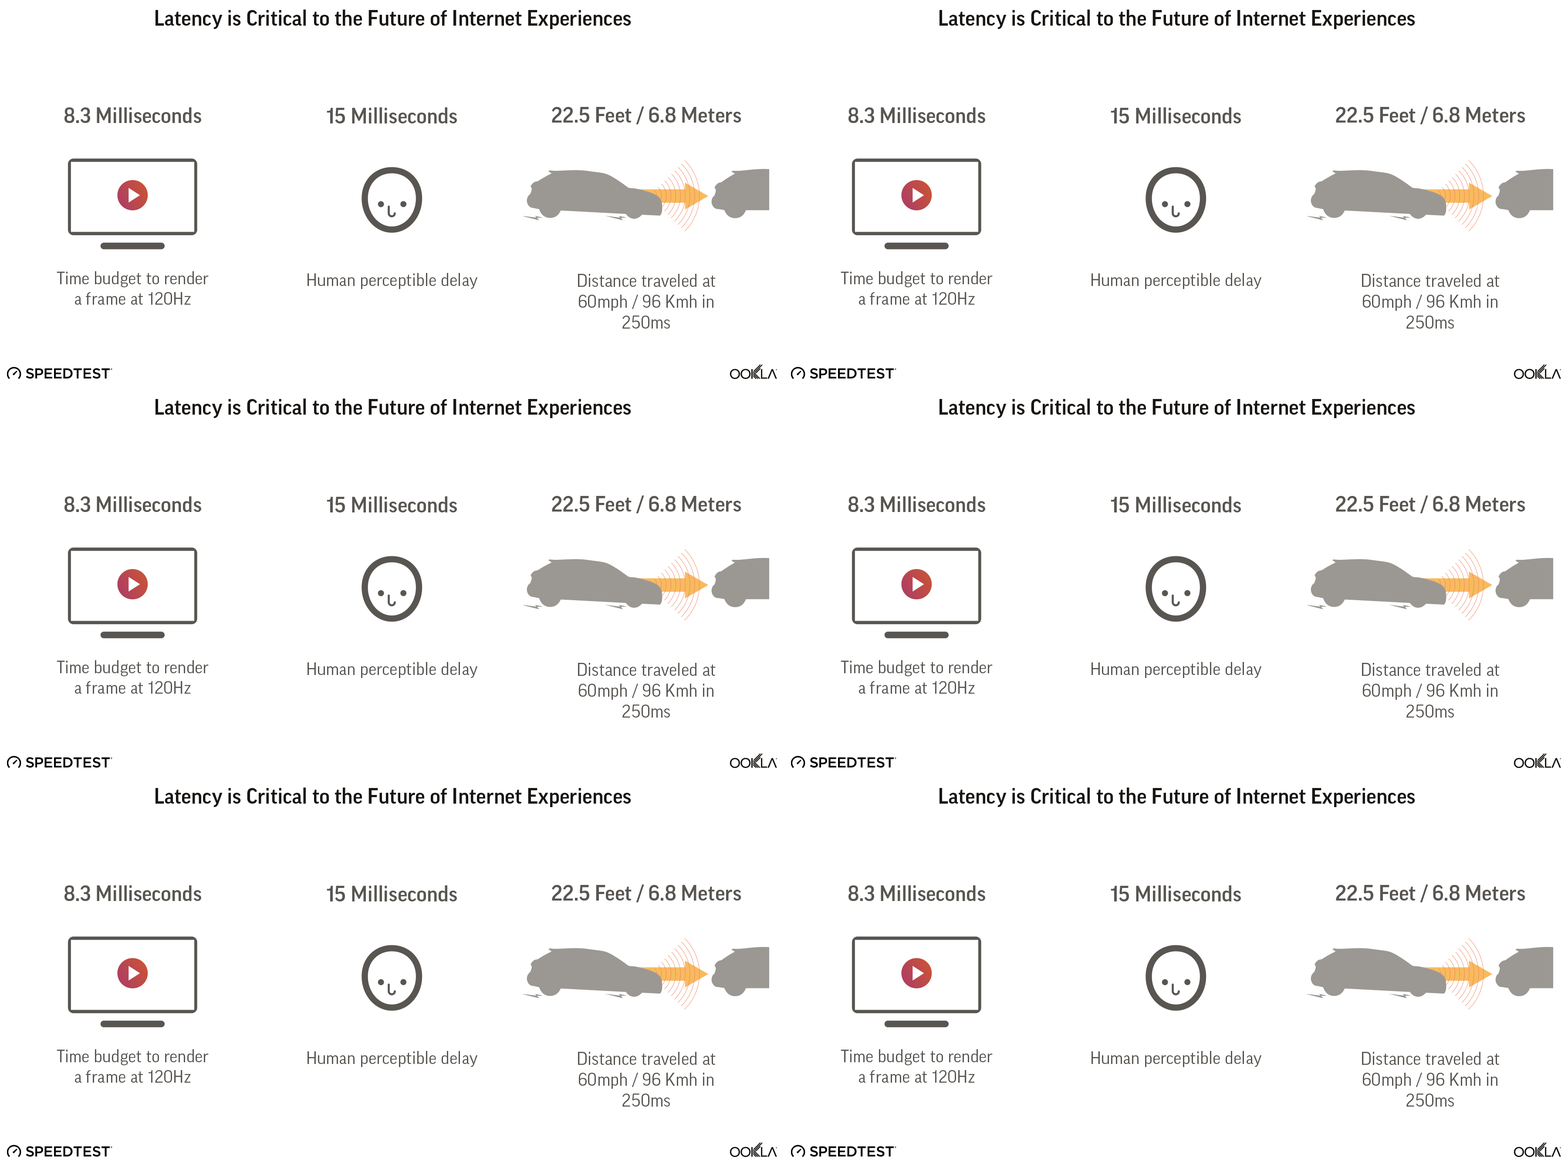
animation diagram showing the effects of latency on various internet experiences

How Ookla measures latency

Ookla uses three main measures of latency, each of which helps you understand a specific set of issues.
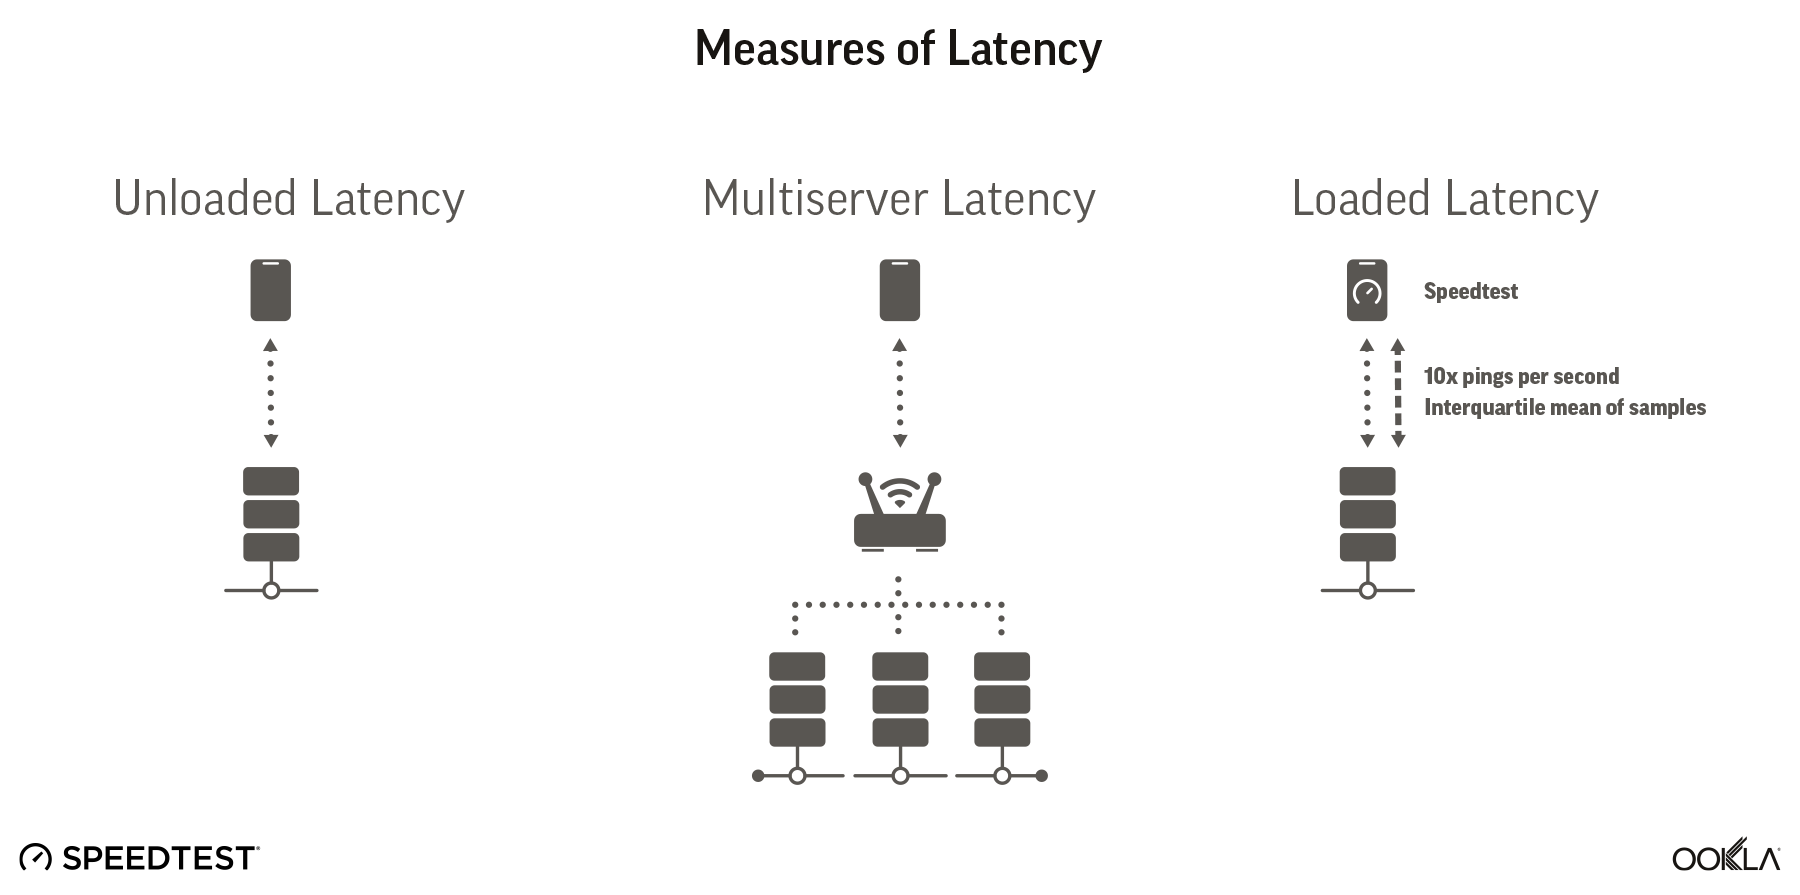
diagram showing three latency measurements, unloaded latency, multiserver latency and loaded latency

Unloaded latency

Unloaded latency is our classic measure of latency, looking at the time it takes for a bidirectional round trip on the last mile of a connection under no load. This is a best case measure of latency.

Multi-server latency

Multi-server latency measures latency to multiple connections and then takes an average. This is a better representation of a customer’s experience as their connection pulls media and other information from a variety of locations around the internet. Poor multi-server latency can show the need for improvement in peering arrangements and transit. This metric tests to on-net and off-net locations.

Loaded latency

Loaded latency measures latency under a large load. We represent both download loaded latency and upload loaded latency and this metric gives an approximation of how a network performs with poor buffer management or if a background app is using a lot of bandwidth.

Global latency today

Given the importance of latency to consumer experience today, it’s clear that there is much room for improvement in latency at a global level. Investments in better latency will make for major improvements in connected experiences overall, including video calling, internet shopping, and other day-to-day internet activities.
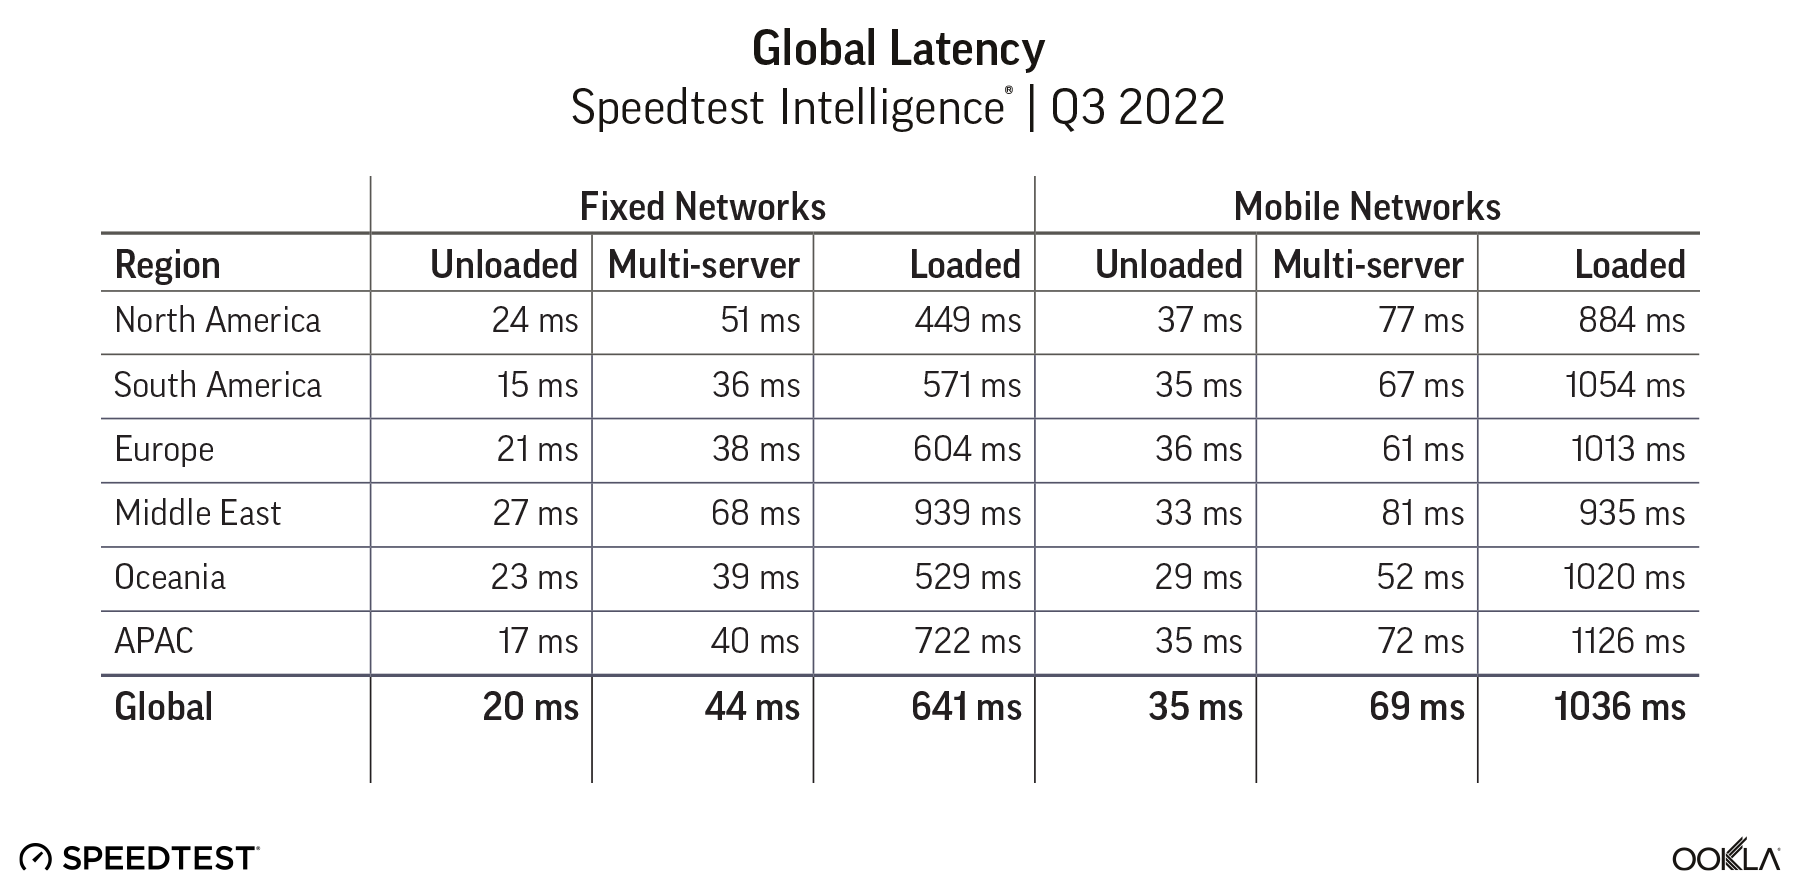
Table showing fixed and mobile latency data for various regions across the world

Latency is key to present user experiences, and will be the defining factor for unlocking future connected opportunities. The first step to improving latency on your network is to have the data to make informed decisions. Look forward to future articles where we dive into how to use this data to identify common areas of latency bottlenecks and optimize your network. If you’d like to discuss how our data can help you improve latency on your network, stop by Booth 2i28 in Hall 2 at MWC.

Ookla retains ownership of this article including all of the intellectual property rights, data, content graphs and analysis. This article may not be quoted, reproduced, distributed or published for any commercial purpose without prior consent. Members of the press and others using the findings in this article for non-commercial purposes are welcome to publicly share and link to report information with attribution to Ookla.

| February 2, 2023

How the State of Vermont Gets an Accurate View of Mobile Network Coverage and Quality with Ookla Solutions [Case Study]

When driving along major federal and state-funded roadways, Vermont state residents consistently experience poor cell service and dropped calls. Drivers are unable to call 911 in an emergency with such poor coverage — and in many instances, no coverage — even along many of the state’s federally funded highways. The lack of reliable mobile network coverage has become not only a common complaint from residents, but a real public safety concern. 

The State of Vermont Department of Public Service (PSD) used Ookla Cell AnalyticsTM to identify areas of poor network coverage with crowdsourced data and Ookla Wind® to perform drive testing in those locations to get detailed coverage and performance metrics along state roadways. 


Situation

The FCC coverage maps are based on operator-provided information, and they show that coverage is sufficient in Vermont. Operatorsʼ claims of sufficient coverage have made it difficult for the state to receive the funding needed to address known mobile service issues. On the FCC maps, you can see that both Verizon and AT&T show that their LTE Voice coverage for making phone calls spans across the entire state.

Since these maps are so influential in funding decision processes, Vermont needed a way to prove that the on-the-ground experience of residents does not match up with FCC coverage maps. For PSD, identifying areas that lack service has been a critical step toward the expansion and improvement of mobile wireless service around the state

Read the full case study here.

Ookla retains ownership of this article including all of the intellectual property rights, data, content graphs and analysis. This article may not be quoted, reproduced, distributed or published for any commercial purpose without prior consent. Members of the press and others using the findings in this article for non-commercial purposes are welcome to publicly share and link to report information with attribution to Ookla.

| December 15, 2022

How Digicel Samoa Attracted 20% More Subscribers with Brand Campaigns Backed by Ookla® [Case Study]

Digicel provides telecommunications services to the island of Samoa, where there are just over 200,000 residents and two leading mobile operators. In a winner-takes-all market, it’s vital to capture the trust and loyalty of your subscribers. When the competing operator started offering less expensive plan options, Digicel needed to retain subscribers by showcasing their superior network performance to both existing and prospective customers. 

As part of their mission to be the very best in delivering digital services, experiences, and connectivity, Digicel has been continuously improving their network performance. As a result of these efforts they were awarded the Speedtest Award™ for Fastest Mobile Network Operator during Q1–Q2 2022. Digicel licensed this Speedtest Award for use in their brand campaigns to help promote their superior network and build consumer trust.

Situation

For an operator to win consumer trust, it’s important to be able to back claims about your network with verified third-party data. Digicel wanted Samoan consumers to know they could expect the best performance on their network — and for their brand and marketing campaigns to be verified by a source that consumers recognize and trust. Digicel leveraged independent, verified third-party data from Ookla® to back their claims and inform customers they have the fastest network in the market — and to attract subscribers from their rival operator.

Read the full case study here.

Ookla retains ownership of this article including all of the intellectual property rights, data, content graphs and analysis. This article may not be quoted, reproduced, distributed or published for any commercial purpose without prior consent. Members of the press and others using the findings in this article for non-commercial purposes are welcome to publicly share and link to report information with attribution to Ookla.

| November 9, 2022

Speedtest + Downdetector = One Stop Troubleshooting for Your Connectivity

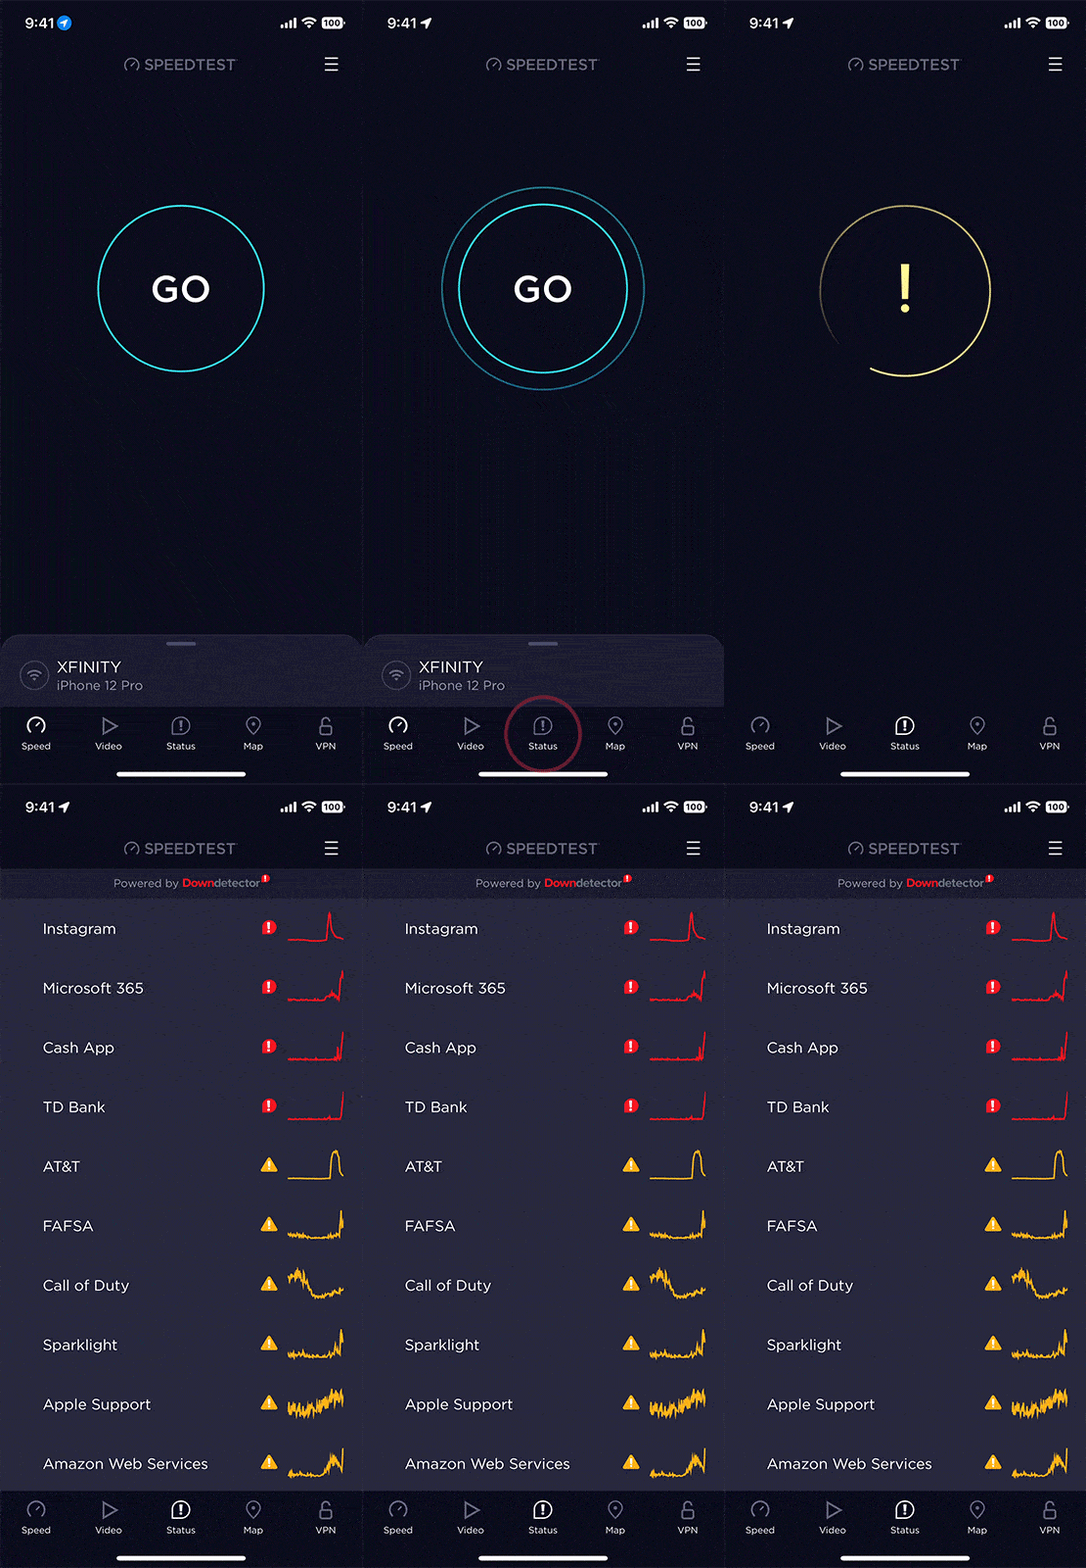
When you want to check your internet performance, you take a Speedtest®. If you can’t connect to a site, you check Downdetector®. Now, we’ve added a new Downdetector tab in the Speedtest app so you can do both in one location. This combines the internet’s most trusted app for testing connectivity with Downdetector’s real-time status information for over 12,000 apps, websites, and services across in 47 countries — with one tap. Using these free utilities, you can now diagnose whether your connection is in trouble or if there’s a larger service issue all in one place.

animated gif showing new feature location in speedtest app

This is the same methodology we use for the Downdetector site you’ve come to trust. It’s simply in a more convenient location.

Check for online outages

Tap the “Status” tab at the bottom center of the Speedtest app to see a snapshot of the current status of the apps, websites, and services Downdetector monitors, tailored to show what’s most relevant in your country. Sites and services that are experiencing problems will appear at the top, giving you a quick view of whether the problem you’re experiencing is more widespread. Read more about how a few critical services can take down chunks of the internet here.

Check for details on a specific incident

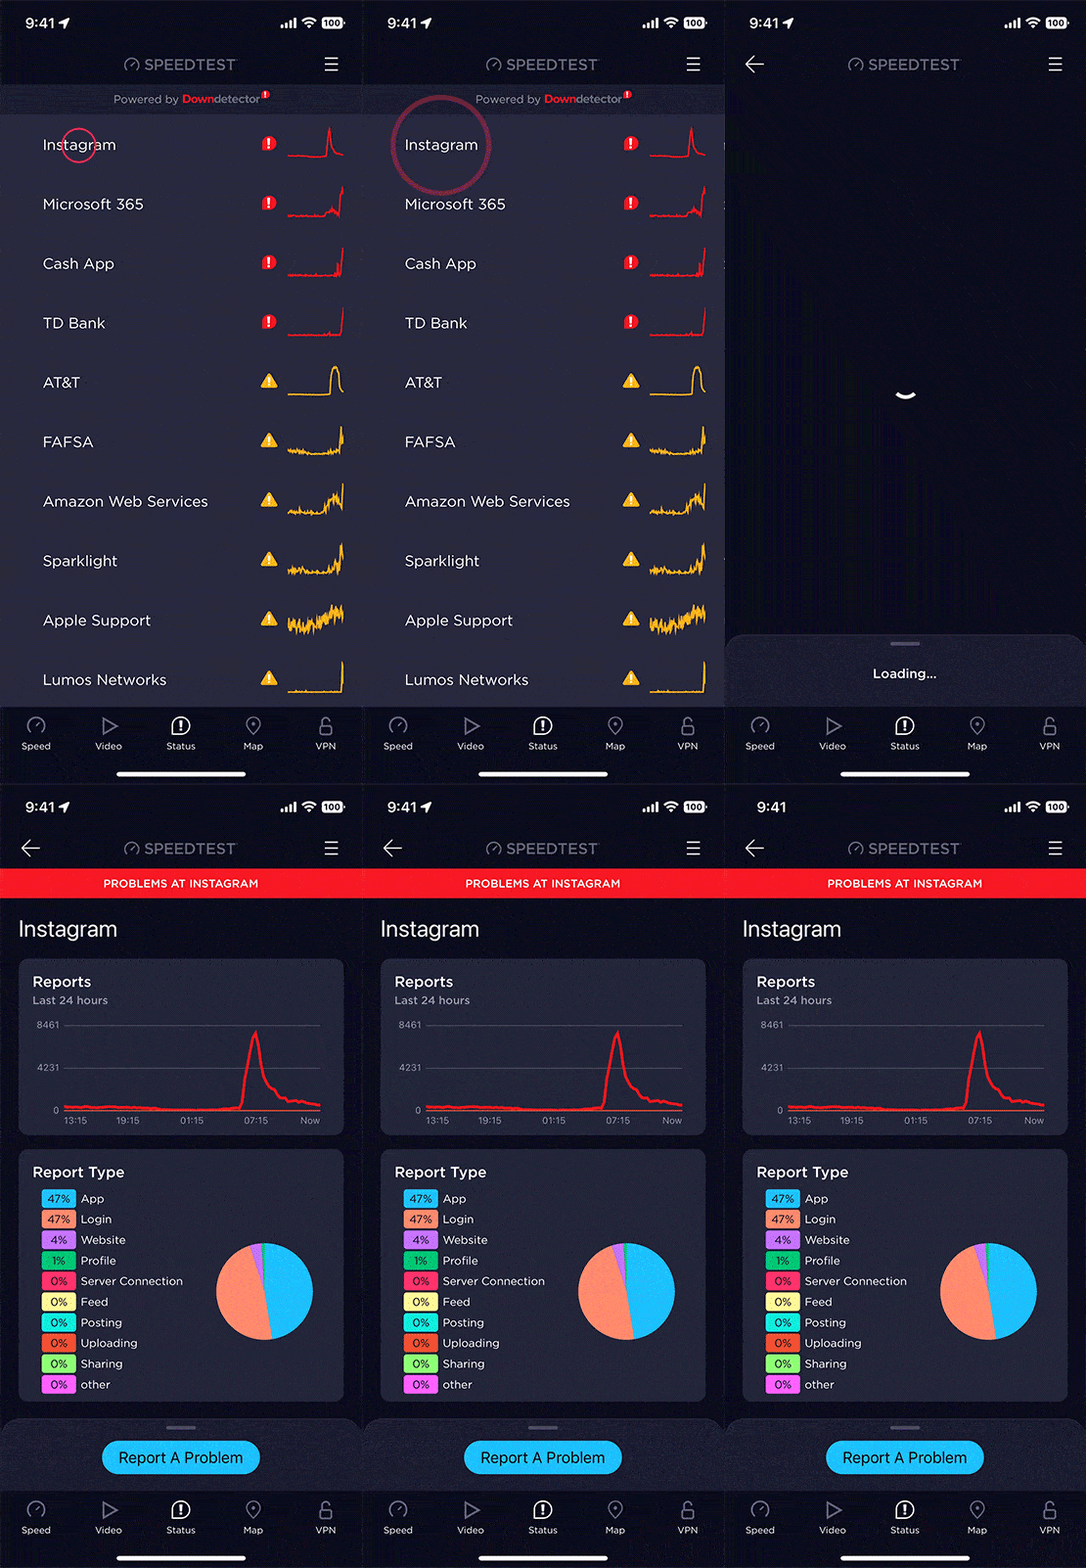
animated gif showing new feature location in speedtest app

Tap any site or service on the status page for a more detailed view of what’s going on. You’ll see a graph of incident reports over the last 24 hours as well as a chart of what types of issues users have reported. You can also tap on the blue button at the bottom of the page to submit your own report to Downdetector including information about your experience. This helps other users understand what they might also be experiencing.

Coming soon

This update is currently rolling out to Android and iOS devices worldwide. Update your Speedtest app if you don’t see the Downdetector tab. Soon we’ll also be adding in the ability to search for a specific site or service. Keep an eye out for this and other improvements as you troubleshoot your internet connectivity in the Speedtest app.

Download the Speedtest app for Android or iOS today to check out this new feature and let us know what you think on Twitter or Facebook.

Ookla retains ownership of this article including all of the intellectual property rights, data, content graphs and analysis. This article may not be quoted, reproduced, distributed or published for any commercial purpose without prior consent. Members of the press and others using the findings in this article for non-commercial purposes are welcome to publicly share and link to report information with attribution to Ookla.

| September 26, 2022

How TRC Jordan Ensures Reliable, Resilient Connectivity with Ookla Data [Case Study]

Jordan’s telecommunications regulatory authority, the Telecommunications Regulatory Commission (TRC), is responsible for monitoring quality of service standards and holding operators accountable for providing services, ensuring sustainable growth in the telecoms sector. When Jordan went into a nationwide lockdown in 2020, daily data traffic increased 31% as distance learning and teleworking took over. To ensure both connectivity and economic growth during this time, it was key to maintain the resilience of Jordan’s networks. 

TRC uses Ookla data to monitor daily mobile network traffic, understand fixed internet availability, assess operator performance, ensure compliance, remotely monitor coverage and quality issues, and plan for the national rollout of 5G in Jordan.

Situation

As an early adopter of crowdsourced network intelligence, TRC Jordan helped inform the ITU-T efforts to standardize crowdsourcing, Recommendations ITU SG12 E.806 and ITU SG12 E.812. The emergence of the pandemic in 2020 only increased the need for crowdsourced data, as work became remote and it was no longer safe to send network testers into the field. In order to maintain network resilience and service continuity, TRC needed to remotely monitor performance and operator compliance with universal service commitments and national roaming migration agreements — as well as remotely handle consumer complaints about network coverage or quality.

Read the full case study here.

If you’re a regulator in the region, come say hi to us at GITEX (booth Z3-B40) October 10 – 14 to learn more about how you can use crowdsourced data to improve connectivity in your nation. Ookla will also be participating in an ITU Workshop in Jordan on “Telecommunication Service Quality” October 17 — 18.

Ookla retains ownership of this article including all of the intellectual property rights, data, content graphs and analysis. This article may not be quoted, reproduced, distributed or published for any commercial purpose without prior consent. Members of the press and others using the findings in this article for non-commercial purposes are welcome to publicly share and link to report information with attribution to Ookla.

| July 27, 2022

Ookla Acquires CellRebel

Ookla® has acquired CellRebel, an independent company focused on helping operators and other telecommunications companies improve mobile networks worldwide. Together, Ookla and CellRebel will bring enhanced consumer network experience insights to the global telecommunications marketplace.

“The complexity of modern networks demands diversified streams of data to fuel holistic insights on performance, quality, and accessibility,” said Doug Suttles, founder and CEO of Ookla. “It is vital that we understand more about consumer experiences with networks, and CellRebel brings billions of daily data points with innovative analytical views to help fulfill this need worldwide.”

Along with robust localized network experience data, CellRebel brings sophisticated data visualization capabilities to support mobile network performance and optimization use cases, and a host of novel real-world consumer experience measurements to Ookla’s portfolio.

“We are beyond thrilled to join Ookla and their mission of improving connectivity for everyone,” said Tibor Rathonyi, CellRebel’s founder and CEO. “Ookla’s brand, technology, and presence in the market, combined with CellRebel’s advanced analytics use cases, mass-scale network quality measurements, and user experience data, will position us with must-have solutions for any telecom company building the networks of both the present and the future.”

Ookla retains ownership of this article including all of the intellectual property rights, data, content graphs and analysis. This article may not be quoted, reproduced, distributed or published for any commercial purpose without prior consent. Members of the press and others using the findings in this article for non-commercial purposes are welcome to publicly share and link to report information with attribution to Ookla.

| June 23, 2022

How the Acadiana Planning Commission Won $30M in Broadband Funding by Using Speedtest® Data to Challenge FCC Maps [Case Study]

The Acadiana region of Louisiana — made up of the Parish governments of Acadia Parish, Evangeline Parish, and St. Landry Parish — has historically lacked equitable access to high-speed internet connectivity. According to the U.S. Census Bureau, about 50% of households in the parishes lack access to the internet. The Acadiana Planning Commission (APC), responsible for the region’s economic and community development, wanted to provide better educational and economic opportunities by improving broadband access.

The APC applied for funding through the NTIA Broadband Infrastructure Program, which has made $288 million in funding available to help close the digital divide in the United States. There were over 230 applicants, and only 13 grants were awarded. 

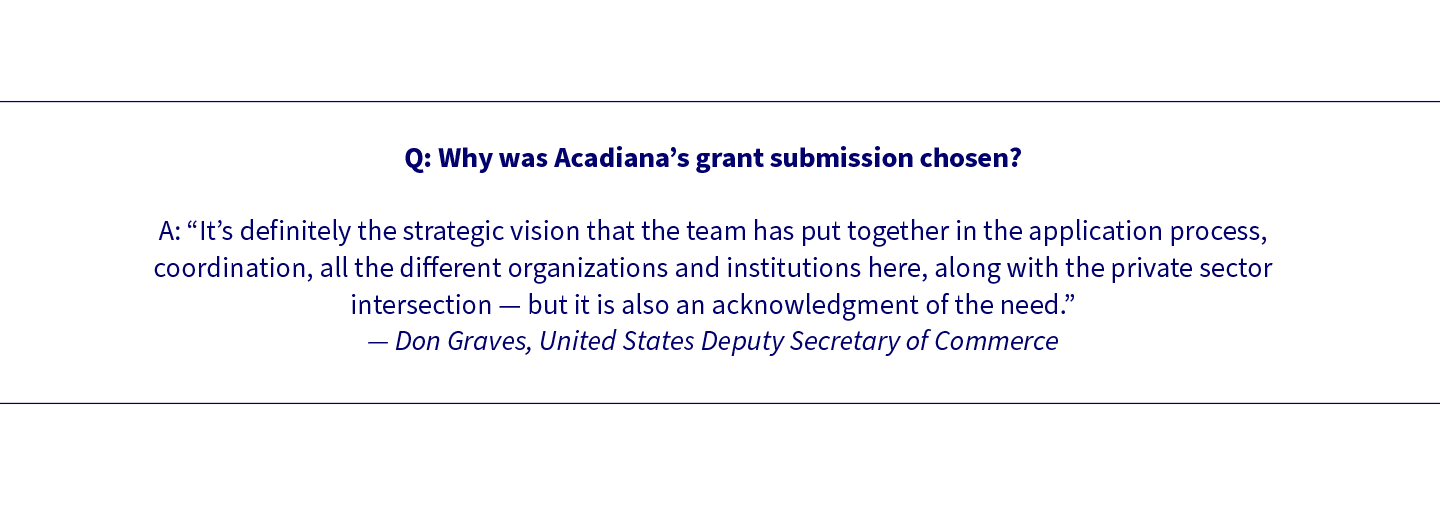
Vice President Kamala Harris and Deputy Secretary of Commerce Don Graves visited Louisiana in March of 2022 to announce that the APC had been awarded a $30 million grant to fund high-speed internet in 11 rural Acadiana communities.

Situation 

With $288 million in federal funding on the table to help close the digital divide, the Acadiana Planning Commission knew that the residents of the region would benefit greatly from funding allocation to help improve broadband access. 

Federal funding allocation decisions are based on FCC Form 477 broadband mapping data. FCC Form 477 requires broadband providers to self-report the census blocks where they offer internet speeds greater than 200 kbps download or upload to at least one location. The problem with this is that even if only one location receives service, the entire census block is considered “served”. This information can be misleading because the provider may not be able to offer those speeds or be able to offer them everywhere in the entire census block. The APC needed a way to determine which census blocks were unserved or underserved, in order to challenge FCC data and submit a winning grant application. 

Solution

The Acadiana Planning Commission overlaid Ookla® Speedtest data with FCC data to find out where the real-world network experience of residents was significantly worse than the broadband availability shown in FCC maps, which rely on data reported by internet service providers (ISPs) about their own network performance.

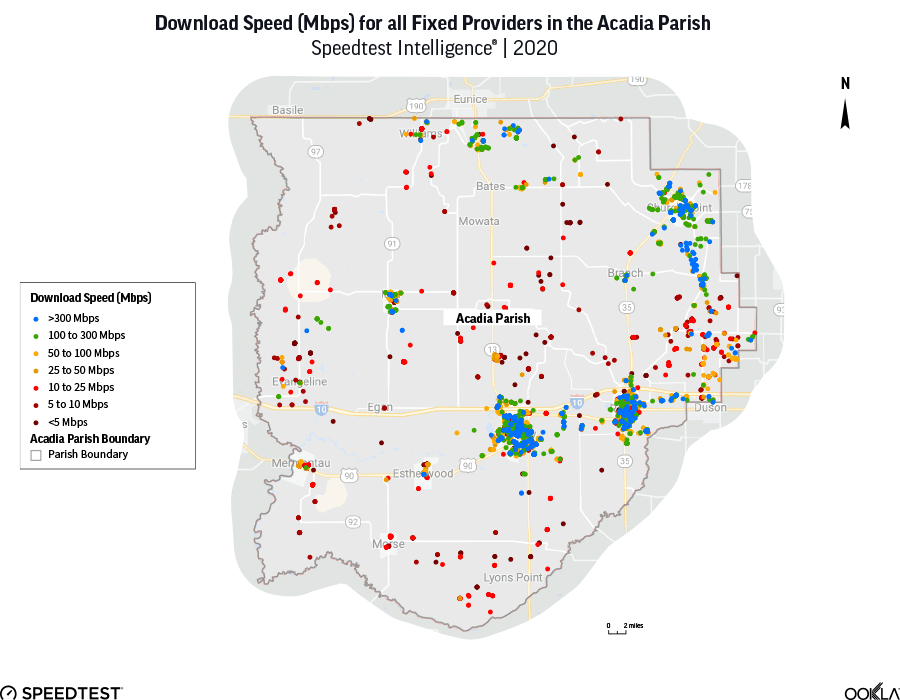
Using only the Acadia parish as an example below, FCC data showed that the entire parish was served with speeds between 25-50 Mbps, however Speedtest data revealed that many locations were actually underserved (represented by the red dots on the map).

Based on these findings, the APC challenged approximately 1000 census blocks across six parishes that comprise the Acadiana region and was successful in 900 of those challenges. Speedtest data helped APC demonstrate that FCC data was inaccurate, and many residents in those 900 blocks did not have access to broadband.

Read the full case study

Ookla retains ownership of this article including all of the intellectual property rights, data, content graphs and analysis. This article may not be quoted, reproduced, distributed or published for any commercial purpose without prior consent. Members of the press and others using the findings in this article for non-commercial purposes are welcome to publicly share and link to report information with attribution to Ookla.