Internet service providers and mobile operators have spent decades optimizing their networks to provide the best speeds possible so consumers can achieve seamless connected experiences. However, the internet and how we use it is changing; bandwidth is no longer all that matters for networks operators to deliver on the possibilities that a connected world can offer. While latency has always affected connectivity, latency and responsiveness metrics have become increasingly critical to network operators focused on delivering a superior connected experience and supporting evolving consumer use cases. Read on to learn why latency matters to quality of experience, why you need to consider latency now, and how Ookla® can help you measure what matters most.
Bandwidth is now an economics problem, latency is the new opportunity horizon.
Why latency matters
A 2009 study detailed that every 100 ms of additional latency on Amazon.com, cost the company 1% of revenue. While speed has always been the focus for optimization, since the end user delay was caused by the delay of downloading data assets, now that bandwidth has increased for many people around the globe, the bottleneck for these folks is the time delay between two systems communicating.
Latency is the bidirectional roundtrip time between two endpoints.
Latency matters for every online experience. While best known for gaming, video conferencing, and streaming video, the underlying internet protocols powering modern experiences rely on bidirectional communication to negotiate encryption keys, determine routing paths, and request resources. As a result, the typical request on the internet requires two to five round trip communications between various entities over different latency sensitive protocols (DNS, TCP, TLS, and QUIC/H3).
On a gigabit connection, 500 ms of additional latency dramatically affects the page load time. It can take 7x to load a full webpage when latency is high, as seen in the example below.
In addition to web browsing, video and voice calling needs a latency below 300 ms to provide an acceptable experience. This is a physiological threshold — below 300 ms — where the human brain can manage the delay and not speak over other parties. Above the 300 ms barrier, it’s difficult to maintain a coherent conversation.
Think back to the Amazon example above: You may not be directly losing money when your customers see a slow page load due to high latency, but you are providing a poor network experience that will result in increased customer service costs and churn. In fact, one study from the University of Massachusetts Amherst and Akamai concluded “…an increase in the startup delay beyond 2 seconds causes viewers to abandon the video. Using regression, we show that an additional increase of the startup delay by 1 second increases the abandonment rate by 5.8%.” Of course, network operators don’t control the full experience here, and things like CDN location can really affect an end user’s experience, but consumers don’t have visibility into that and the more you can optimize the portions you do control, the less negative feedback you’ll receive.
Latency will matter even more in the very near future
The future of the internet is bidirectional where download and upload communication are necessarily performed simultaneously. Whether AR and VR or self-driving vehicles, this will require dramatic improvements in latency.
How Ookla measures latency
Ookla uses three main measures of latency, each of which helps you understand a specific set of issues.
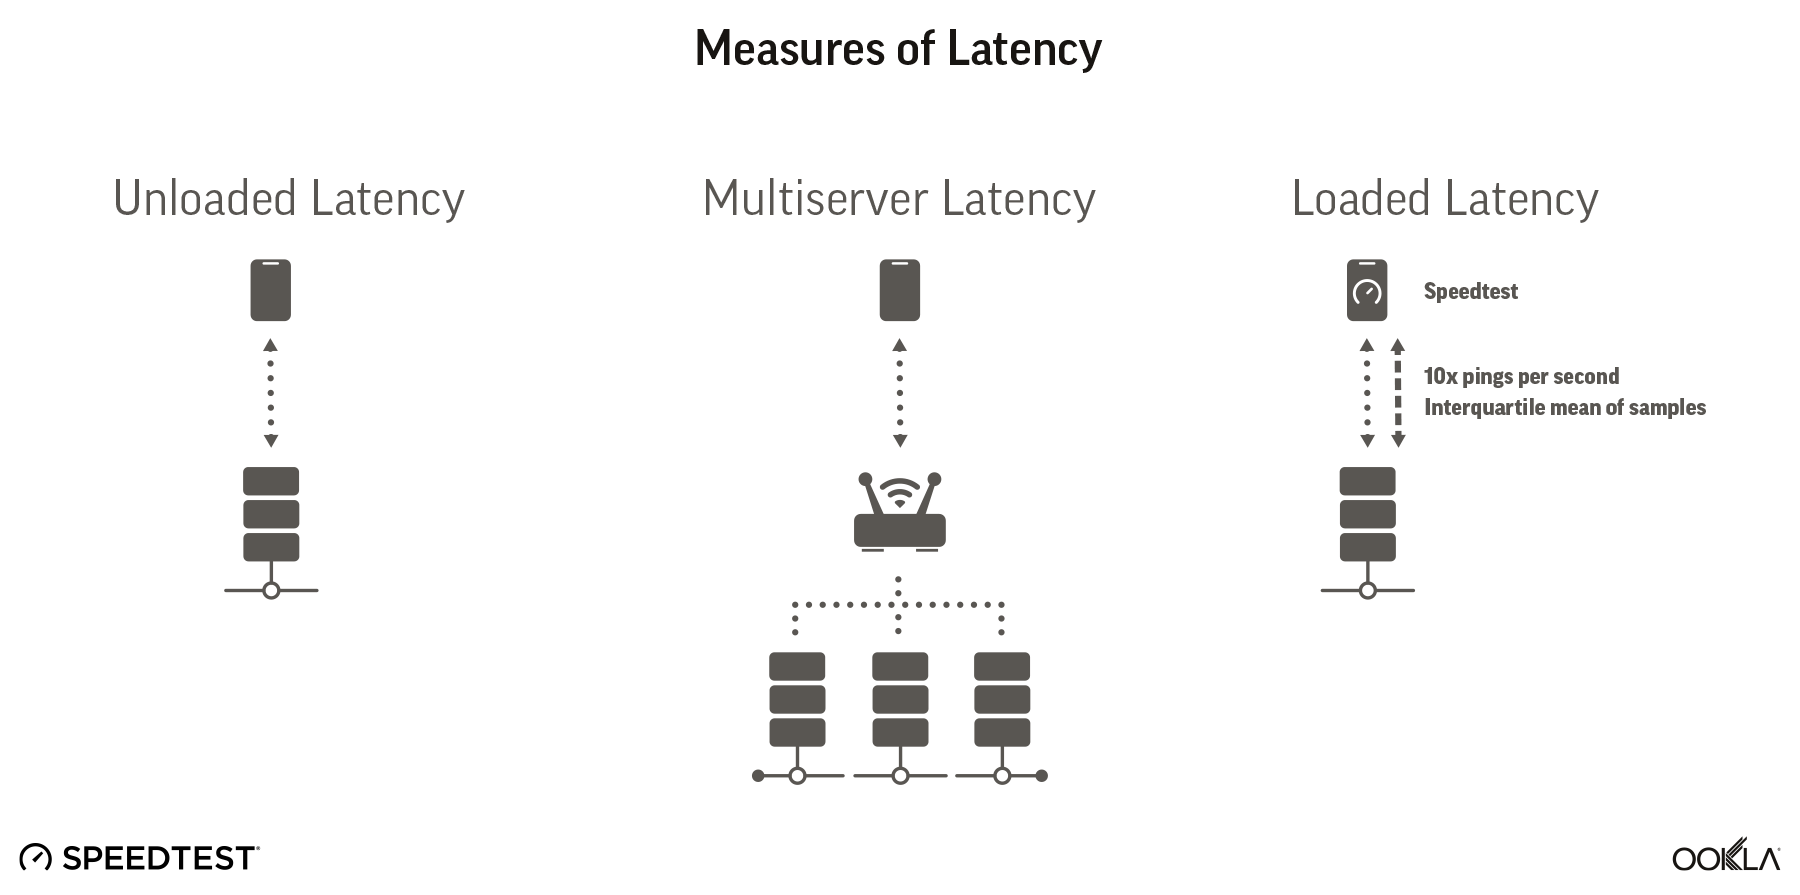
Unloaded latency
Unloaded latency is our classic measure of latency, looking at the time it takes for a bidirectional round trip on the last mile of a connection under no load. This is a best case measure of latency.
Multi-server latency
Multi-server latency measures latency to multiple connections and then takes an average. This is a better representation of a customer’s experience as their connection pulls media and other information from a variety of locations around the internet. Poor multi-server latency can show the need for improvement in peering arrangements and transit. This metric tests to on-net and off-net locations.
Loaded latency
Loaded latency measures latency under a large load. We represent both download loaded latency and upload loaded latency and this metric gives an approximation of how a network performs with poor buffer management or if a background app is using a lot of bandwidth.
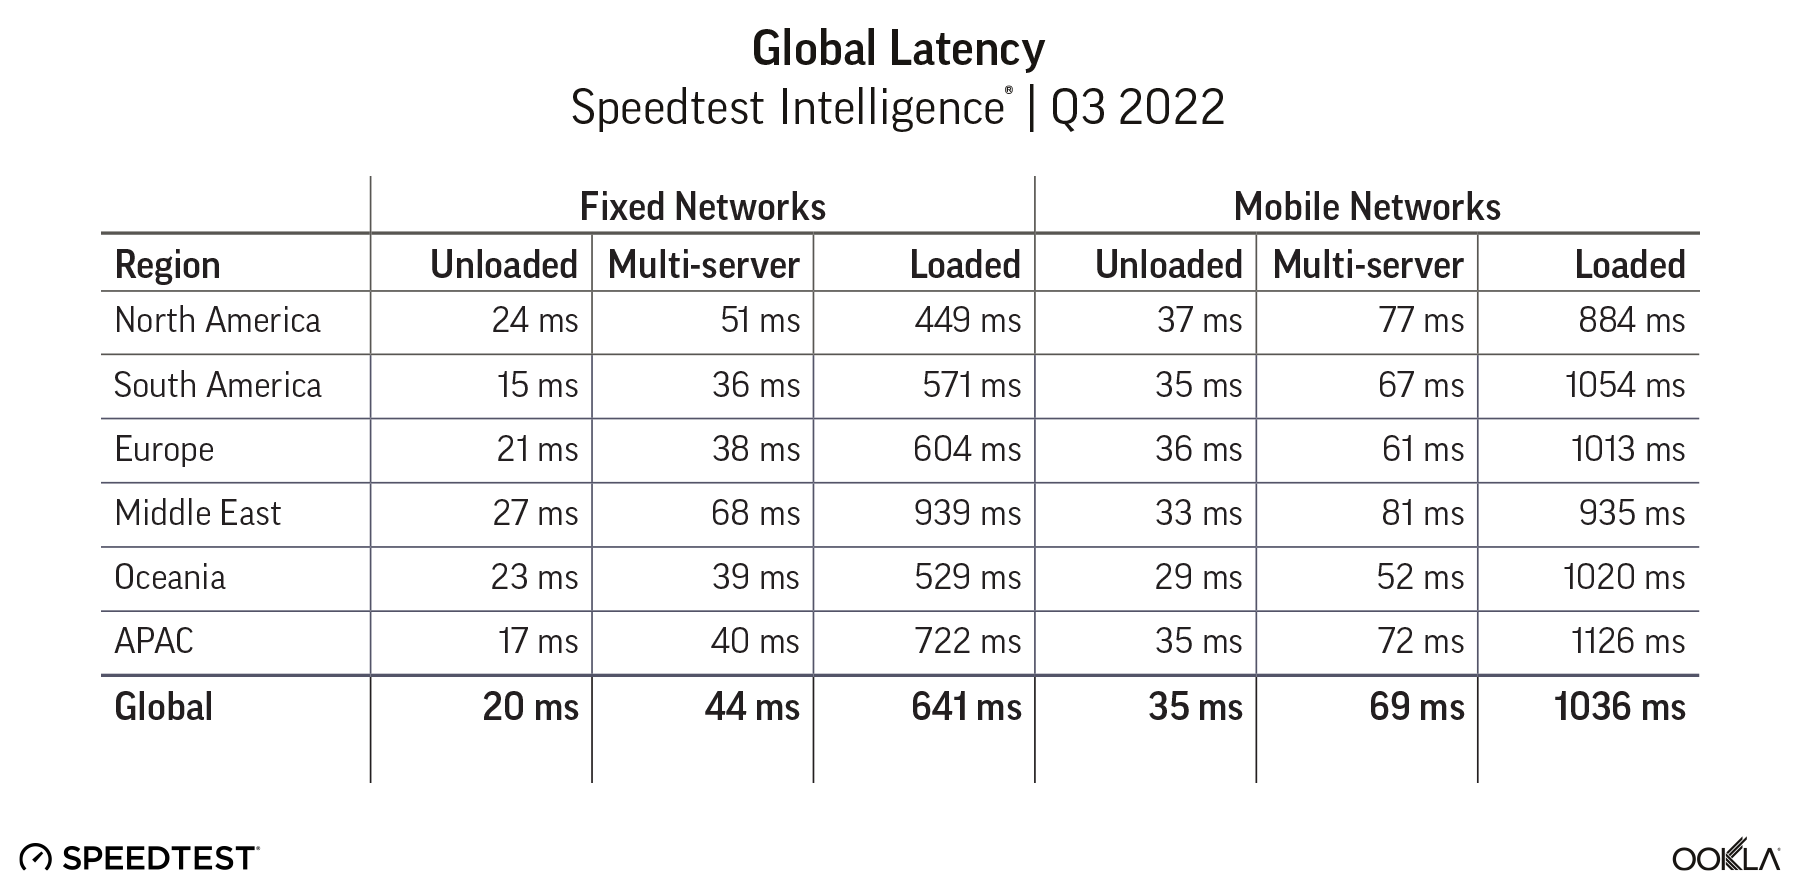
Global latency today
Given the importance of latency to consumer experience today, it’s clear that there is much room for improvement in latency at a global level. Investments in better latency will make for major improvements in connected experiences overall, including video calling, internet shopping, and other day-to-day internet activities.
Latency is key to present user experiences, and will be the defining factor for unlocking future connected opportunities. The first step to improving latency on your network is to have the data to make informed decisions. Look forward to future articles where we dive into how to use this data to identify common areas of latency bottlenecks and optimize your network. If you’d like to discuss how our data can help you improve latency on your network, stop by Booth 2i28 in Hall 2 at MWC.
Ookla retains ownership of this article including all of the intellectual property rights, data, content graphs and analysis. This article may not be quoted, reproduced, distributed or published for any commercial purpose without prior consent. Members of the press and others using the findings in this article for non-commercial purposes are welcome to publicly share and link to report information with attribution to Ookla.
About the author
Ookla® is a global leader in connectivity intelligence that provides consumers, businesses, and other organizations with data-driven insights to improve networks and connected experiences.