| March 21, 2025

Bridging the Digital Divide: How Regulators Use Crowdsourced Data to Improve Rural Connectivity

Digital connectivity has become essential for modern life, with access to high-speed internet now allowing people to work remotely, access education, receive healthcare services, and participate in online commerce and banking. Yet a stark digital divide persists: while 40% of urban centers globally enjoy download speeds exceeding 100 Mbps (sufficient for most demanding online activities including HD video streaming and remote work), rural communities across the world — including in Africa, Central and Southern Asia often struggle with slow connectivity or none at all. These disparities can create profound differences in opportunity, limiting the potential for many communities worldwide.

To effectively address connectivity gaps, regulators and policymakers need granular, accurate data on real-world network performance, and that’s where data from Ookla® can help. Crowdsourced data from Ookla’s Speedtest® provides crucial insights into actual user experiences, helps identify underserved areas, tracks improvements, and holds service providers accountable for deployment promises.

In this article, we’ll examine the current state of global connectivity disparities, explore how the digital divide affects education, healthcare, and economic opportunities in underserved areas, and show how Egypt’s Decent Life Initiative is using data-driven approaches to transform rural connectivity. 

For a deeper look into these topics, including case studies and methodological insights from Ookla and the National Telecom Regulatory Authority (NTRA) of Egypt, watch our full webinar.

The State of Global Digital Connectivity

Effective solutions start with an accurate diagnosis. Before meaningful progress can be made in bridging the digital divide, stakeholders need precise data showing where connectivity gaps are widest and which communities are most affected. Without detailed mapping of these disparities, stakeholders risk directing investments to the wrong areas and missing chances to help those most in need. 

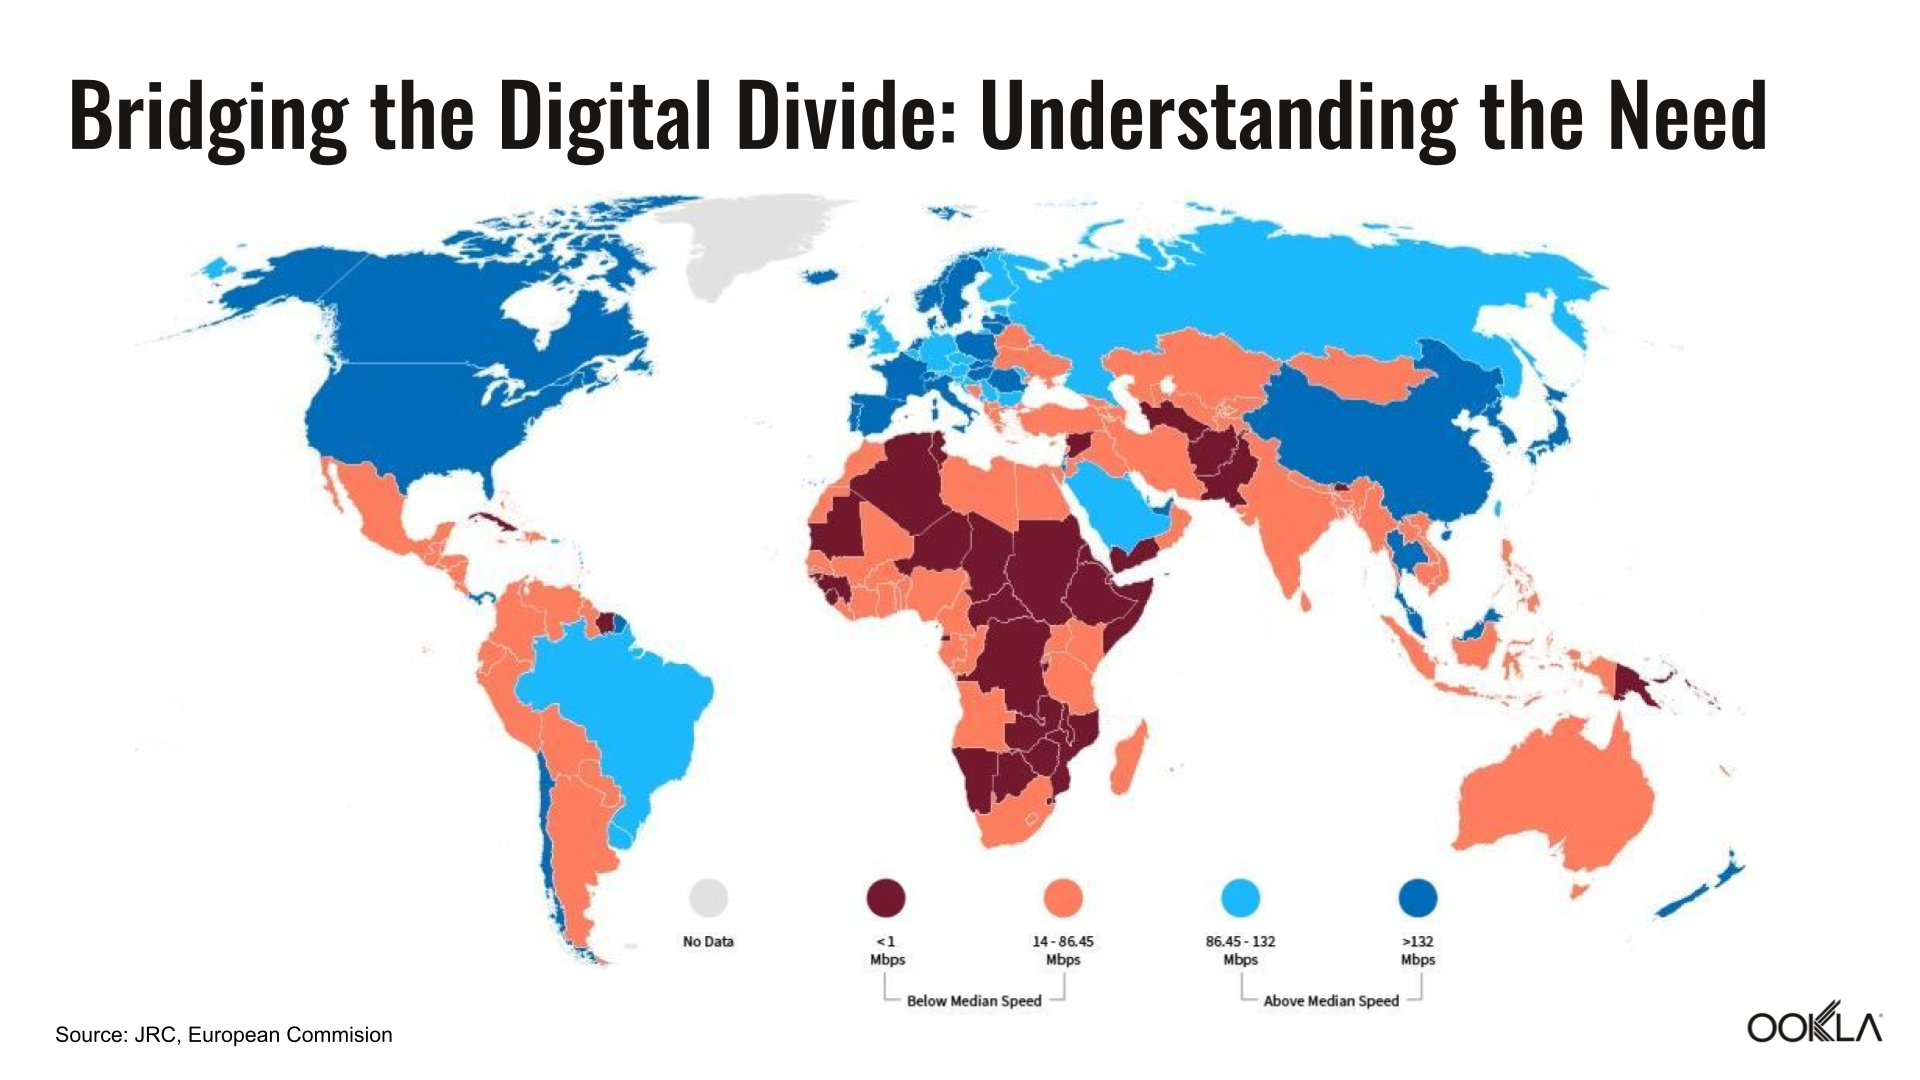
A study by the European Commission’s Joint Research Center, conducted in partnership with Ookla, revealed several key findings about global connectivity disparities:

  • Many countries in Africa lag significantly behind, with some regions experiencing median download speeds below 3 Mbps.
  • Broadband speeds vary dramatically between and within regions, with 40% of urban centers enjoying speeds over 100 Mbps while others struggle with basic connectivity.
  • A strong correlation exists between connectivity and economic development, with high-income countries enjoying significantly better broadband speeds.
  • In many countries in Africa and other developing regions, mobile networks are more widespread and better performing than fixed broadband networks.

These findings highlight the complex nature of the digital divide and the need for targeted approaches to address connectivity challenges in different regions. By mapping end-user speeds and coverage differences with precision, stakeholders can develop more effective interventions tailored to specific geographic and socioeconomic situations.

Map of Bridging the Digital Divide: Understanding the need

The Real Impact of the Digital Divide

Connectivity gaps aren’t just data points on a map – they represent real barriers that affect people’s everyday lives. When communities lack reliable internet access, they face serious disadvantages across multiple areas of life, as seen in Sub-Saharan Africa, where GSMA reports two-thirds of the population (710 million people) do not currently use mobile internet despite living within the footprint of a mobile broadband network. These impacts include:

  • Limited access to information directly affects civic participation, with disconnected communities unable to access government services, agricultural guidance, and essential public health information.
  • Educational inequality deepens when rural students cannot access digital learning resources and research materials or utilize remote learning options available to their urban counterparts.
  • Healthcare outcomes suffer as communities without reliable connectivity cannot benefit from telemedicine, remote diagnostics, or timely access to medical specialists.
  • Economic opportunities vanish when rural residents cannot participate in e-commerce, access online job markets, or utilize digital financial services

Addressing connectivity problems requires understanding not just where internet access is lacking, but how that absence affects real people in these communities. With this understanding, stakeholders can develop more effective strategies that prioritize the most impactful investments. 

Leveraging Crowdsourced Data for Better Connectivity

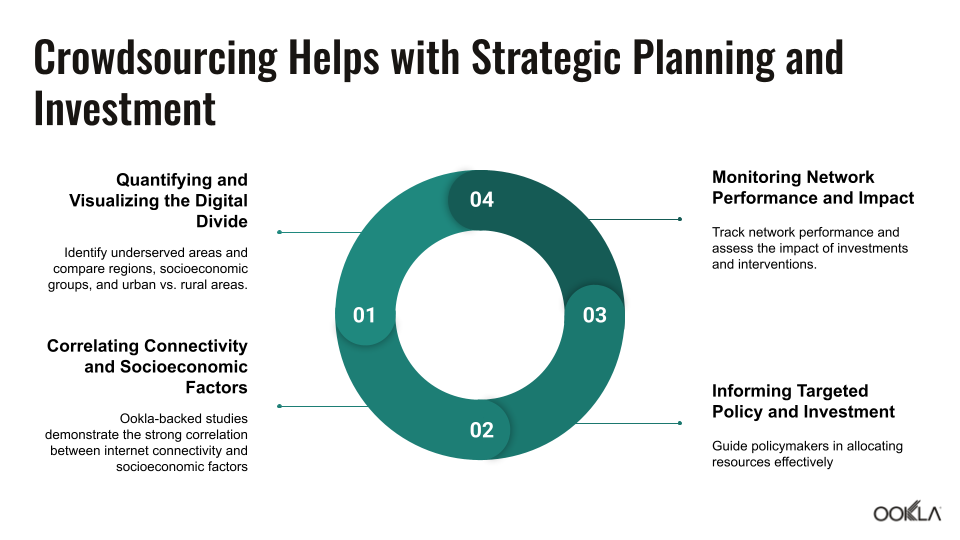
When making connectivity decisions, actual user experiences matter more than theoretical coverage maps. Regulators need to know where people are truly experiencing poor or great service, not just where internet providers claim to provide coverage. Ookla’s crowdsourced data reveals these real-world experiences, helping stakeholders make better decisions through several practical applications:

  • Creating precision maps of connectivity disparities by visualizing actual speeds geographically rather than relying on operator-reported coverage claims.
  • Identifying socioeconomic impacts through targeted research, such as the World Bank’s use of Ookla data to discover that 30% of areas near Brazilian educational facilities had inadequate speeds for effective e-learning.
  • Guiding evidence-based policy decisions, as demonstrated in the OECD’s analysis, revealed that rural fixed broadband speeds averaged 31% below national averages even in developed countries.
  • Establishing accountability frameworks, exemplified by South Carolina’s use of Ookla data to track rural-urban connectivity gaps and verify that providers delivered promised service improvements.

The examples from Brazil, OECD countries, and South Carolina demonstrate how empirical, user-generated data provides crucial insights that theoretical coverage models simply cannot offer. With such a granular understanding of actual network performance, regulators can target investments more precisely, measure progress accurately, and hold providers accountable for delivering on any promised improvements.

Graph of Crowdsourcing Helps with Strategic Planning

Case Study: Egypt’s Decent Life Initiative

Egypt’s ambitious Decent Life Project is a comprehensive national development program launched to improve the quality of life in rural areas, with telecommunications infrastructure as a key component. Launched in 2019, it demonstrates how data-driven planning, strategic investment, and public-private collaboration can transform rural connectivity at scale. This nationwide program tackles both coverage and quality issues in some of the country’s most underserved communities:

  • A comprehensive approach targeting 4,500 villages and directly impacting over 58 million Egyptians through improved infrastructure and services
  • Collaborative implementation involving more than 20 ministries, 23 civil society organizations, and numerous volunteers to address connectivity alongside other development needs
  • Strategic two-pillar telecommunications strategy focusing on mobile network expansion (establishing 1,096 new stations) and fiber optic deployment (targeting 2.8 million buildings)
  • Measurable improvements in download speeds across targeted governorates, documented via before-and-after performance testing using Ookla data
  • Innovative funding model combining government funding resources with private operator investments to share costs and accelerate deployment

With 80% of the first phase complete and plans to reach 99% mobile coverage by 2025, Egypt’s Decent Life Project demonstrates how targeted interventions can dramatically reduce rural-urban connectivity disparities. Egypt’s approach also underscores the power of coordinated action across government agencies, private sector partners, and civil society organizations. 

Best Practices for Addressing the Digital Divide

Successful digital divide initiatives like Egypt’s Decent Life Project and many others revealed a crucial insight: technical solutions alone cannot solve connectivity challenges when underlying economic, regulatory, and social barriers remain unaddressed.

Indeed, meaningful change occurs when comprehensive strategies align policy, funding, and technology toward clearly defined connectivity goals. Across initiatives aimed at narrowing the digital divide, several approaches consistently deliver positive results:

  • Data-centric planning that uses granular performance metrics to identify specific underserved areas rather than relying on broad regional generalizations
  • Technology diversity that combines mobile, fixed, and alternative technologies based on local geography, population density, and economic conditions
  • Collaborative funding frameworks that blend public resources with private investment to distribute costs and create appropriate incentives
  • Focus on outcomes rather than specific technologies, allowing solutions to adapt to local contexts and evolving capabilities
  • Parallel investment in digital literacy and relevant content to ensure infrastructure investments translate into actual adoption and usage
  • Continuous performance monitoring to maintain accountability, document improvements, and adjust strategies based on measured results

Practical experience from successful initiatives around the world shows that these elements form not just a theoretical framework but a proven roadmap for accelerating connectivity improvements. By combining data-driven planning, appropriate technology choices, innovative funding, and continuous performance monitoring, countries can make rapid progress even in challenging environments. 

Conclusion

Bridging the digital divide requires a comprehensive understanding of both coverage and usage gaps, strategic investment in infrastructure, and ongoing assessment of performance improvements. As demonstrated by Egypt’s Decent Life Project, crowdsourced data plays a critical role in guiding these efforts and measuring their impact.

When regulators leverage accurate, real-time performance data, they can more effectively address connectivity challenges and ensure digital resources are accessible to all communities. The result is not just improved network statistics but meaningful improvements in education, healthcare, economic opportunity, and quality of life.

For a more detailed examination of how regulators are using crowdsourced data to improve rural connectivity, including additional case studies and methodological insights, check out our recent webinar, “How Regulators Use Crowdsourced Data to Improve Connectivity in Underserved Rural Communities.”  


Ookla retains ownership of this article including all of the intellectual property rights, data, content graphs and analysis. This article may not be quoted, reproduced, distributed or published for any commercial purpose without prior consent. Members of the press and others using the findings in this article for non-commercial purposes are welcome to publicly share and link to report information with attribution to Ookla.

| March 18, 2025

Fiber Brings Faster Fixed Broadband to North Africa with More Possibilities Ahead

Fiber deployments accelerated in North Africa in 2024, with Egypt still leading in broadband performance. This report reviews the progress made in fiber deployment and adoption since we assessed the status of fixed broadband services (excluding fixed wireless access (FWA)) in North Africa a year ago and their impact on network performance. 

Key Takeaways:

  • Egypt widened its lead in North Africa for fixed broadband performance in 2024. Egypt’s median download speed peaked at 80 Mbps in Q2 2024, driven by VDSL network expansion. Meanwhile, Morocco took second position in Q4 2024 and saw a 32% improvement in median fixed broadband download speed year-on-year to 35.57 Mbps, thanks to a steady increase in fiber-to-the-home (FTTH) customers.
  • Algeria is the largest country and FTTH market in North Africa. At the beginning of 2025, it boasted 1.8 million fiber subscribers, up from 478,000 at the end of 2022, making it one of the largest fiber markets in Africa. In November 2024, it introduced the fastest residential fiber package in the continent at 1.2 Gbps. However, the predominance of DSL lines is hampering its performance improvement.
  • Tunisia’s accelerated VDSL adoption in 2024 contributed to raising its download speed to 11.72 Mbps in Q4 2024. Tunisie Telecom’s plans to upgrade more ADSL lines to VDSL and massively increase fiber capacity will help to narrow its gap with its regional peers. Tunisia is also the first country in North Africa to launch 5G, offering opportunities to offer faster FWA services.

Egypt continues to top North Africa in download and upload speeds for fixed broadband

In the January 2024 report on internet speed in North Africa, Egypt ranked first for fixed broadband, followed by Morocco, Algeria, and Tunisia. According to Speedtest Intelligence®, all countries have seen an improvement in median download and upload speeds since Q3 2023, with Morocco boosting its download speed by more than 60% and Algeria and Egypt by around 38% by Q4 2024.

Egypt extended its lead within North Africa, achieving a median download speed of 77.89 Mbps in Q4 2024, while Morocco overtook Egypt in median upload speed in Q3 2022 to reach 31.86 Mbps. Algeria and Tunisia continue to show substantial improvements in median download and upload speeds.

Network Performance for Fixed Wired Broadband, Algeria, Egypt, Morocco, Tunisia
Source: Speedtest intelligence | Q3 2022–Q4 2024
Network Performance for Fixed Wired Broadband, Algeria, Egypt, Morocco, Tunisia

Fibre deployment and adoption are helping countries in North Africa boost their broadband performance

Countries in North Africa adopted different approaches to modernize their fixed infrastructure. Egypt has primarily upgraded its ADSL to VDSL and focused FTTH/B deployments in greenfield areas. Algeria focused on replacing copper lines with FTTH/B, while Morocco and Tunisia deployed VDSL while progressing with FTTH/B rollout.

Algeria has the highest number of FTTH/B connections in North Africa, with more than 1.5 million connected households at the end of September 2024 and a rapidly increasing share of fixed connections. Morocco follows closely with 990,000 connections and boasts the largest fiber percentage of the wired broadband market at 38.5%. Tunisia is in fourth position with more than 99,000 FTTH/B connections and nearly 415,000 VDSL connections. Egypt has favored the deployment of fiber-to-the-cabinet (FTTC), so it has the region’s highest number of VDSL connections, with most of its nearly 10 million fixed subscribers benefiting from this technology. 

FTTH/B Connections in Algeria, Morocco, and Tunisia
Source: Telecom Regulators, ISPs | 2022–Q3 2024
FTTH/B Connections in Algeria, Morocco, and Tunisia

Algeria is the largest FTTH market in North Africa and introduced the fastest fiber package in Africa at 1.2 Gbps

According to the Autorité de Régulation de la Poste et des Communications Electroniques (ARPCE), Algeria boasted 4 million fixed wired connections as of September 2024. The state-owned Algerie Telecom (AT) is the sole provider of wired broadband services.  

AT prioritized replacing copper lines with fiber in major cities while maintaining its ADSL services. Its ambitious fiber deployment strategy, combined with commercial and marketing initiatives to drive adoption, helped increase the number of fiber subscribers to more than 1.5 million in Q3 2024, making it one of the largest FTTH/B markets in Africa. That number jumped to 1.8 million fiber subscribers at the beginning of 2025, consolidating its position in the continent.

In 2024, it announced numerous discounts and introduced new speed packages ranging from 30 Mbps to 240 Mbps, boosting the speed of entry plans to improve the country’s median download speed. It also introduced the fastest broadband package in Africa at 1.2 Gbps, costing DZD4,200 (US$31) per month. In December 2024, it partnered with mobile operator Djezzy to introduce a media set-top box that supports fiber and 4G SIM cards.

Algeria’s median download speed increased from 12 Mbps in Q4 2023 to 15.65 Mbps in Q4 2024, while its median upload speed nearly quadrupled to 4.63 Mbps during that period. Despite the heavy investment in fiber deployment, the predominance of DSL appears to hamper gains in national speeds. Further efforts to migrate more DSL subscribers to fiber and ensure that subscribers experience the speeds supported by fiber will be needed to unlock the full potential of fiber in the market.

Network Performance for Fixed Wired Broadband, Algeria
Speedtest Intelligence® | Q3 2022 – Q4 2024
Network Performance for Fixed Wired Broadband, Algeria

AT announced its 2024-2028 strategy, centered on expanding its service offerings and supported by ambitious fiber expansion plans, including increasing the number of households covered by fiber and introducing faster plans. In this context, AT partnered with the National Agency for Housing Improvement and Development (AADL) to connect new housing developments with fiber optic internet before their distribution to citizens. AADL aims to construct 2 million housing units across the country in 5 years from 2024 to 2029, providing a large pool of potentially new fiber customers.

Egypt widened its lead in North Africa for median download speed in 2024

With over 12 million subscribers by Q3 2024, Egypt is North Africa’s biggest fixed broadband telecoms market. State-owned Telecom Egypt (TE) dominates the sector, controlling over 80.8% of the market with nearly 10 million fixed broadband subscribers.

The introduction of VDSL services in Egypt in 2018 marked a significant shift in broadband speeds, raising the maximum from 16 Mbps to 100 Mbps. TE took this opportunity to increase the speed of its entry-level plan from 5 Mbps to 30 Mbps. Raising the minimum broadband speed to 30 Mbps led to a substantial increase in the country’s median download speed, which reached 77.89 Mbps in Q4 2024, up from 49.8 Mbps in Q4 2022, according to Ookla Speedtest Intelligence.

Network Performance for Fixed Wired Broadband, Egypt
Speedtest Intelligence® | Q3 2022 – Q4 2024
Network Performance for Fixed Wired Broadband, Egypt

Telecom Egypt (TE) continued its strategic focus on upgrading ADSL to VDSL and expanding fiber to street cabinets. By mid-2024, TE had connected around 96% of households to the next-generation FTTC network (i.e., excluding the last mile). This is equivalent to over 33 million homes. It has also been deploying fiber in the New Administrative Capital (35 km east of Cairo), high-density residential areas, and government offices. Finally, as part of the “Decent Life” initiatives to connect remote areas with fiber and improve living standards in rural areas, it extended fiber coverage to 704 villages as of Q3 2024. In the medium term, TE signed an agreement with Hungarian telecoms company 4iG to invest US$600 million over the next ten years to deploy a fiber network to around six million households.

Morocco leads North Africa in terms of median upload speed and outlines an ambitious fiber deployment program

The fixed wired broadband market has expanded rapidly in Morocco, increasing from just over 1.6 million in 2019 to over 2.5 million connections in September 2024 (out of around 8 million households). According to Speedtest Intelligence, Morocco’s fixed median download speed reached 35.57 Mbps in Q4 2024, up from 26.86 Mbps a year earlier. Morocco leads North Africa in upload speed with 31.86 Mbps in Q4 2024, achieving near parity with the median download speed.

Network Performance for Fixed Wired Broadband, Morocco
Speedtest Intelligence® | Q3 2022 – Q4 2024
Network Performance for Fixed Wired Broadband, Morocco

The incumbent operator, Maroc Telecom (MT), controls the copper infrastructure which spurred other ISPs, inwi and Orange, to develop their own fiber infrastructure and lease capacity from local utility and transport companies. 

The Moroccan government unveiled ambitious plans under the “Maroc Digital 2030” program, which has a budget of US$1 billion. Among the strategy’s key objectives is to connect 4.4 million households with fiber in 2025 and 5.6 million by 2030, potentially making Morocco one of the largest FTTH/B markets in Africa. 

However, fiber deployment should be accompanied by adjustments to the regulations to allow MT to offer an entry fiber package at a lower price to attract DSL customers looking to upgrade. Currently, MT’s starting fiber package is at 100 Mbps, while inwi and Orange offer cheaper fiber plans with speeds of 20 Mbps or 50 Mbps, but their fiber coverage is much more limited. Promoting infrastructure sharing could also stimulate competition between operators and increase the likelihood of the country hitting its 2030 target.

Tunisia made steady improvements in performance and aims to transform its network in the short term

The wired broadband sector has consistently grown, reaching over 1.2 million subscribers by Q3 2024. Growth came from VDSL, which more than doubled to nearly 415,000 compared to Q3 2023, while fiber connections increased by 70% to almost 100,000 during the same period. Most wired connections are still on ADSL, but their share has been decreasing.

According to Ookla Speedtest Intelligence, Tunisia achieved a download speed of 11.72 Mbps in Q4 2024. This network performance could be attributed to the limited coverage of high-speed broadband services and their unaffordability for many households. For example, a 50 Mbps VDSL or fiber line costs around $25/month. 

Network Performance for Fixed Wired Broadband, Tunisia
Speedtest Intelligence® | Q3 2022 – Q4 2024
Network Performance for Fixed Wired Broadband, Tunisia

Tunisie Telecom (TT), a state-owned entity, holds the majority stake in the fixed broadband sector. TT controls the national copper infrastructure, operates the nationwide fiber-optic backbone, and competes directly and indirectly in the retail market via its subsidiary, Topnet. Alternative operators access TT’s infrastructure and use a mix of ADSL, VDSL, FWA, and FTTH/B.

TT aims to upgrade most DSL ports to VDSL and expand its FTTH coverage and capacity from 100,000 connections in 2022 to 500,000 by 2025. These initiatives will contribute to enhancing fiber service accessibility and improve the country’s median download and upload speeds.

In February 2025, Tunisia became the first market in North Africa to launch 5G. This was an opportunity for the local operators to introduce 5G FWA services, offering speeds of up to 100 Mbps. 5G tariffs were priced at the same level as fiber packages, with some operators including additional benefits, such as Wi-Fi 6 routers and subscriptions to video streaming services. This development will help to increase FWA’s share of the fixed market, which already represents one-third of total connections, and provide high-speed broadband to more customers.

Fiber can further unlock the connectivity potential in North Africa

North African ISPs have adopted various strategies to roll out fiber and promote its take-up. They have made considerable strides in enhancing fiber accessibility and fixed broadband speed since 2020. These initiatives continued during 2023 and 2024, helping to lift the countries in the Speedtest Global Index™. Further efforts will be required to make high-speed broadband services more affordable and accessible to support national digital transformation agendas and boost economic growth.Ookla has been working with ISPs and telecoms regulators to support their national broadband plans, track fiber connectivity and coverage improvements, and promote their networks to consumers. If you are interested in Ookla’s solutions and services for network intelligence and management, get in touch.

Ookla retains ownership of this article including all of the intellectual property rights, data, content graphs and analysis. This article may not be quoted, reproduced, distributed or published for any commercial purpose without prior consent. Members of the press and others using the findings in this article for non-commercial purposes are welcome to publicly share and link to report information with attribution to Ookla.

| June 17, 2024

Your Guide to Airport Wi-Fi and Mobile Performance at 50+ Global Airports in 2024

Airports around the world have been packed with travelers this year, which puts extra stress on the Wi-Fi. With summer travel already well in swing in the northern hemisphere, we’re back with fresh data for our series on airport Wi-Fi performance to help you plan for connectivity at all your connections. You’ll find information about Wi-Fi on free networks provided by the individual airports as well as mobile speeds at some of the busiest airports in the world during Q1 2024. Read on for a look at internet performance at over 50 of the world’s busiest airports with data on download speed, upload speed, and latency.

Key takeaways

  • The seven fastest airports for downloads over Wi-Fi were in the United States: San Francisco International Airport, Newark Liberty International Airport, John F. Kennedy International Airport, Phoenix Sky Harbor International Airport, Seattle–Tacoma International Airport, Dallas Fort Worth International Airport, and Harry Reid International Airport.
  • Six U.S. airports had the fastest uploads over Wi-Fi: San Francisco International Airport, Phoenix Sky Harbor International Airport, Newark Liberty International Airport, Seattle–Tacoma International Airport, Dallas Fort Worth International Airport, and John F. Kennedy International Airport.
  • The fastest mobile download speeds on our list were at Hamad International Airport in Doha, Qatar, Shanghai Hongqiao International Airport in China, and Phoenix Sky Harbor International Airport in the U.S.
  • Eight of the 10 airports with the fastest mobile upload speeds were in China.

9 airports have 100+ Mbps Wi-Fi download speeds

Speedtest Intelligence® showed seven of the nine airports with median Wi-Fi download speeds over 100 Mbps were in the U.S.:

  • San Francisco International Airport (173.55 Mbps),
  • Newark Liberty International Airport (166.51 Mbps),
  • John F. Kennedy International Airport (151.59 Mbps),
  • Phoenix Sky Harbor International Airport (151.28 Mbps),
  • Seattle–Tacoma International Airport (137.31 Mbps),
  • Dallas Fort Worth International Airport (119.92 Mbps), and
  • Harry Reid International Airport (107.84 Mbps).

Charles de Gaulle Airport in Paris, France and China’s Hangzhou Xiaoshan International Airport rounded out the list with median download speeds of 107.13 Mbps and 101.01 Mbps, respectively. Hartsfield–Jackson Atlanta International Airport and Sea–Tac had the lowest median multi-server latency on Wi-Fi of any of the airports surveyed during Q1 2024.

Hover on the pins on the map below to see full details for download and upload speeds as well as latency at all the airports analyzed.

Fixed Broadband Internet Speeds Over Free Wi-Fi at Global Airports
Speedtest Intelligence® | Q1 2024
A map showing fixed broadband speeds in selected global airports.

At Ookla®, we’re dedicated to making sure the networks you depend on are always at their best. With Ekahau®, our Wi-Fi solution, we know firsthand just how challenging it can be to optimize Wi-Fi at airports, especially when you have up to 900 people waiting at each boarding gate during the busiest travel times. While the speeds achieved by these top airports are impressive, we saw two smaller U.S. airports with median Wi-Fi download speeds over 200 Mbps during our U.S.-only analysis of airport Wi-Fi in the fall.

Six airports on our list use multiple SSIDs for their Wi-Fi networks for different terminals or to take advantage of the coverage advantages of 2.4 GHz and the speed advantages of 5 GHz frequencies. We have included data for all the SSIDs with sufficient samples in the map and reported in the text on the best result when using multiple SSIDs results in dramatically different speeds.

Eighteen airports on our list had median Wi-Fi download speeds of less than 25 Mbps. Mexico City International Airport in Mexico had the lowest median Wi-Fi download speed at 5.11 Mbps, followed by:

  • Tan Son Nhat International Airport in Vietnam (7.07 Mbps),
  • Beijing Capital International Airport in China (9.45 Mbps),
  • Cairo International Airport in Egypt (10.62 Mbps), and
  • Tokyo Haneda Airport in Japan (11.37 Mbps).

You may struggle with everything from video chatting to streaming at any airport with a download speed below 25 Mbps. Latency is also a factor in performance so if your airport is one of the three with a median Wi-Fi latency over 60 ms, a mobile hotspot may be a better option for a stable connection.

Wi-Fi 6 has arrived

Our analysis shows at least 15 airports on our list were using the new Wi-Fi 6 standard in their Wi-Fi setup. Wi-Fi 6 uses Multi-User Multiple Input, Multiple Output (MU-MIMO) and Orthogonal Frequency Division Multiple Access (OFDMA) to increase performance and throughput, especially when serving multiple devices. This offers a real advantage at a large public location like an airport. In order to get maximum benefit from Wi-Fi 6, consumers would need to be using Wi-Fi 6-compatible devices. Speedtest data shows a fairly even split between airports that saw faster download speeds on Wi-Fi 6 and airports where Wi-Fi 6 results were comparable to those on other earlier Wi-Fi generations.

As you know, international travel can be complicated. Even if the airport offers free Wi-Fi, you may encounter other barriers to access. For example, a local number is required in Cairo to receive the access code to connect to the airport Wi-Fi. And while we’d love to include other large airports like Nigeria’s Murtala Muhammed International Airport in future Wi-Fi analyses, they currently do not offer free Wi-Fi so we have included mobile data below.

11 airports show mobile speeds over 200 Mbps

Speedtest® data shows mobile speeds massively outpaced Wi-Fi, with 14 airports showing faster median downloads over mobile than the fastest airport for Wi-Fi. Hamad International Airport in Qatar had the fastest median download speed over mobile on our list at 442.49 Mbps during Q1 2024, followed by:

  • Shanghai Hongqiao International Airport (341.19 Mbps),
  • Phoenix Sky Harbor International Airport (295.94 Mbps),
  • Shanghai Pudong International Airport (264.71 Mbps),
  • Chongqing Jiangbei International Airport (258.42 Mbps), and
  • Istanbul Airport (255.51 Mbps).

Mobile Network Speeds at Global Airports
Speedtest Intelligence® | Q1 2024

Fastest mobile speeds at airports in Africa and South America

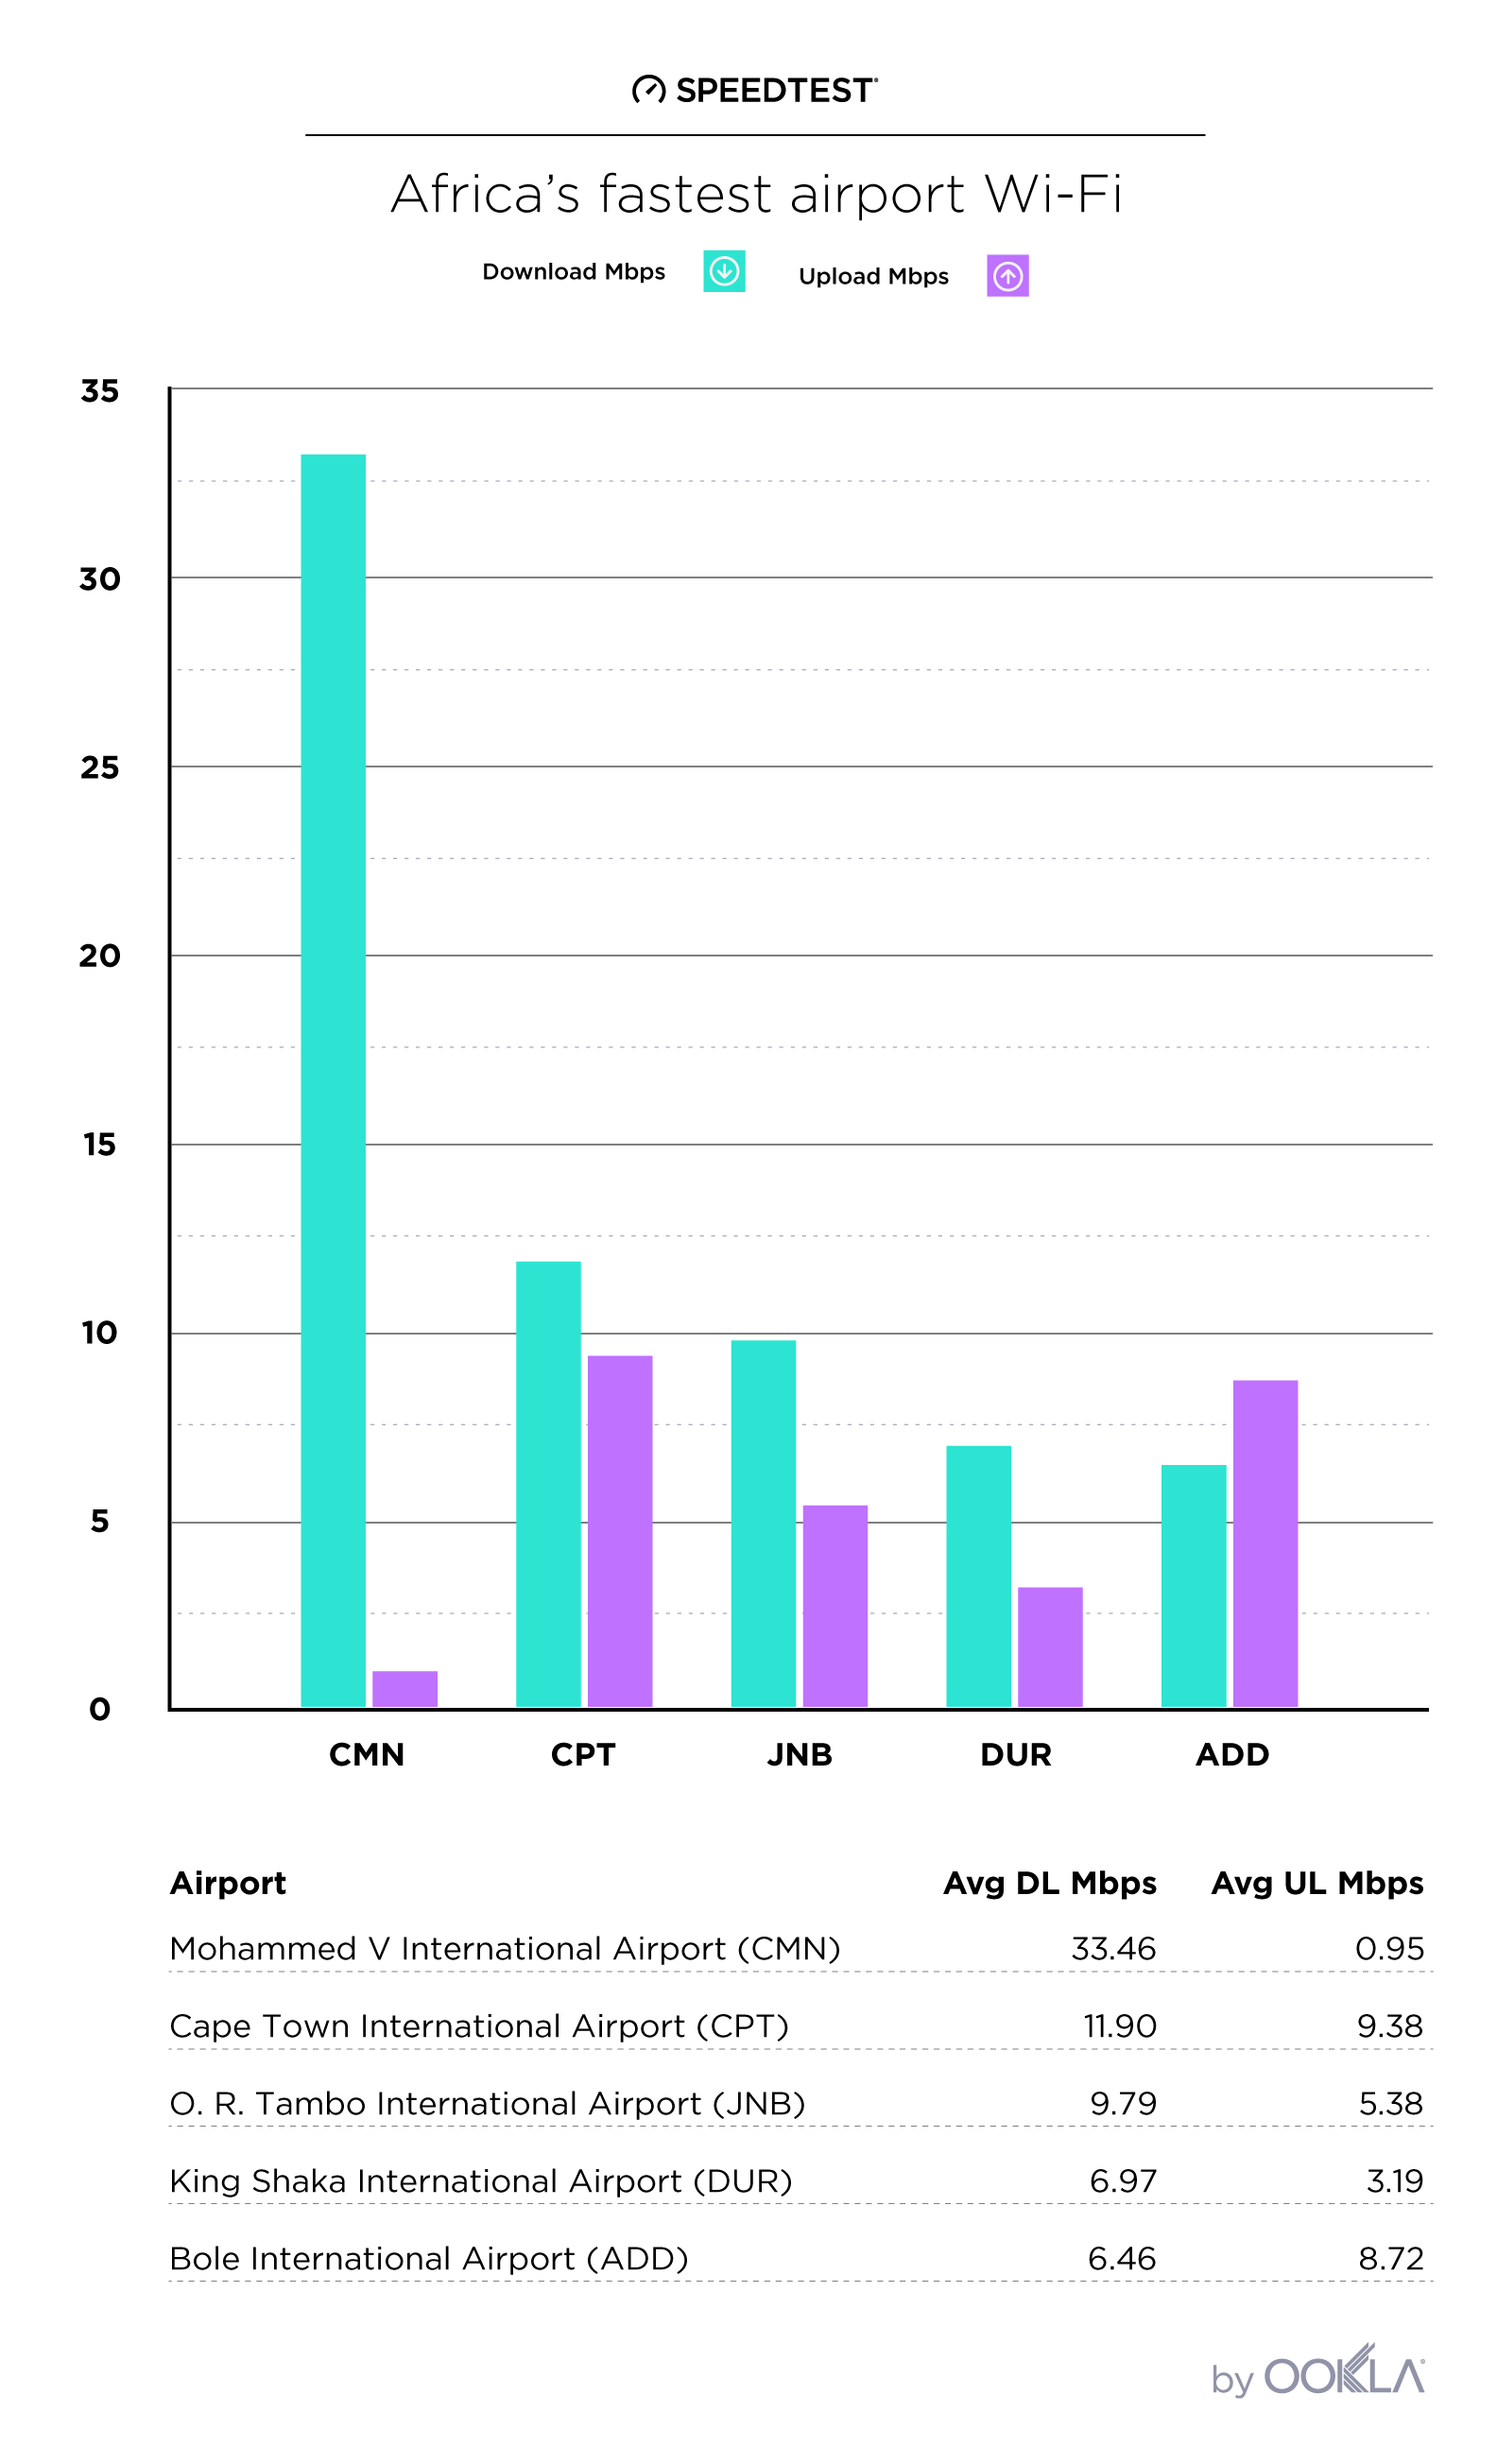
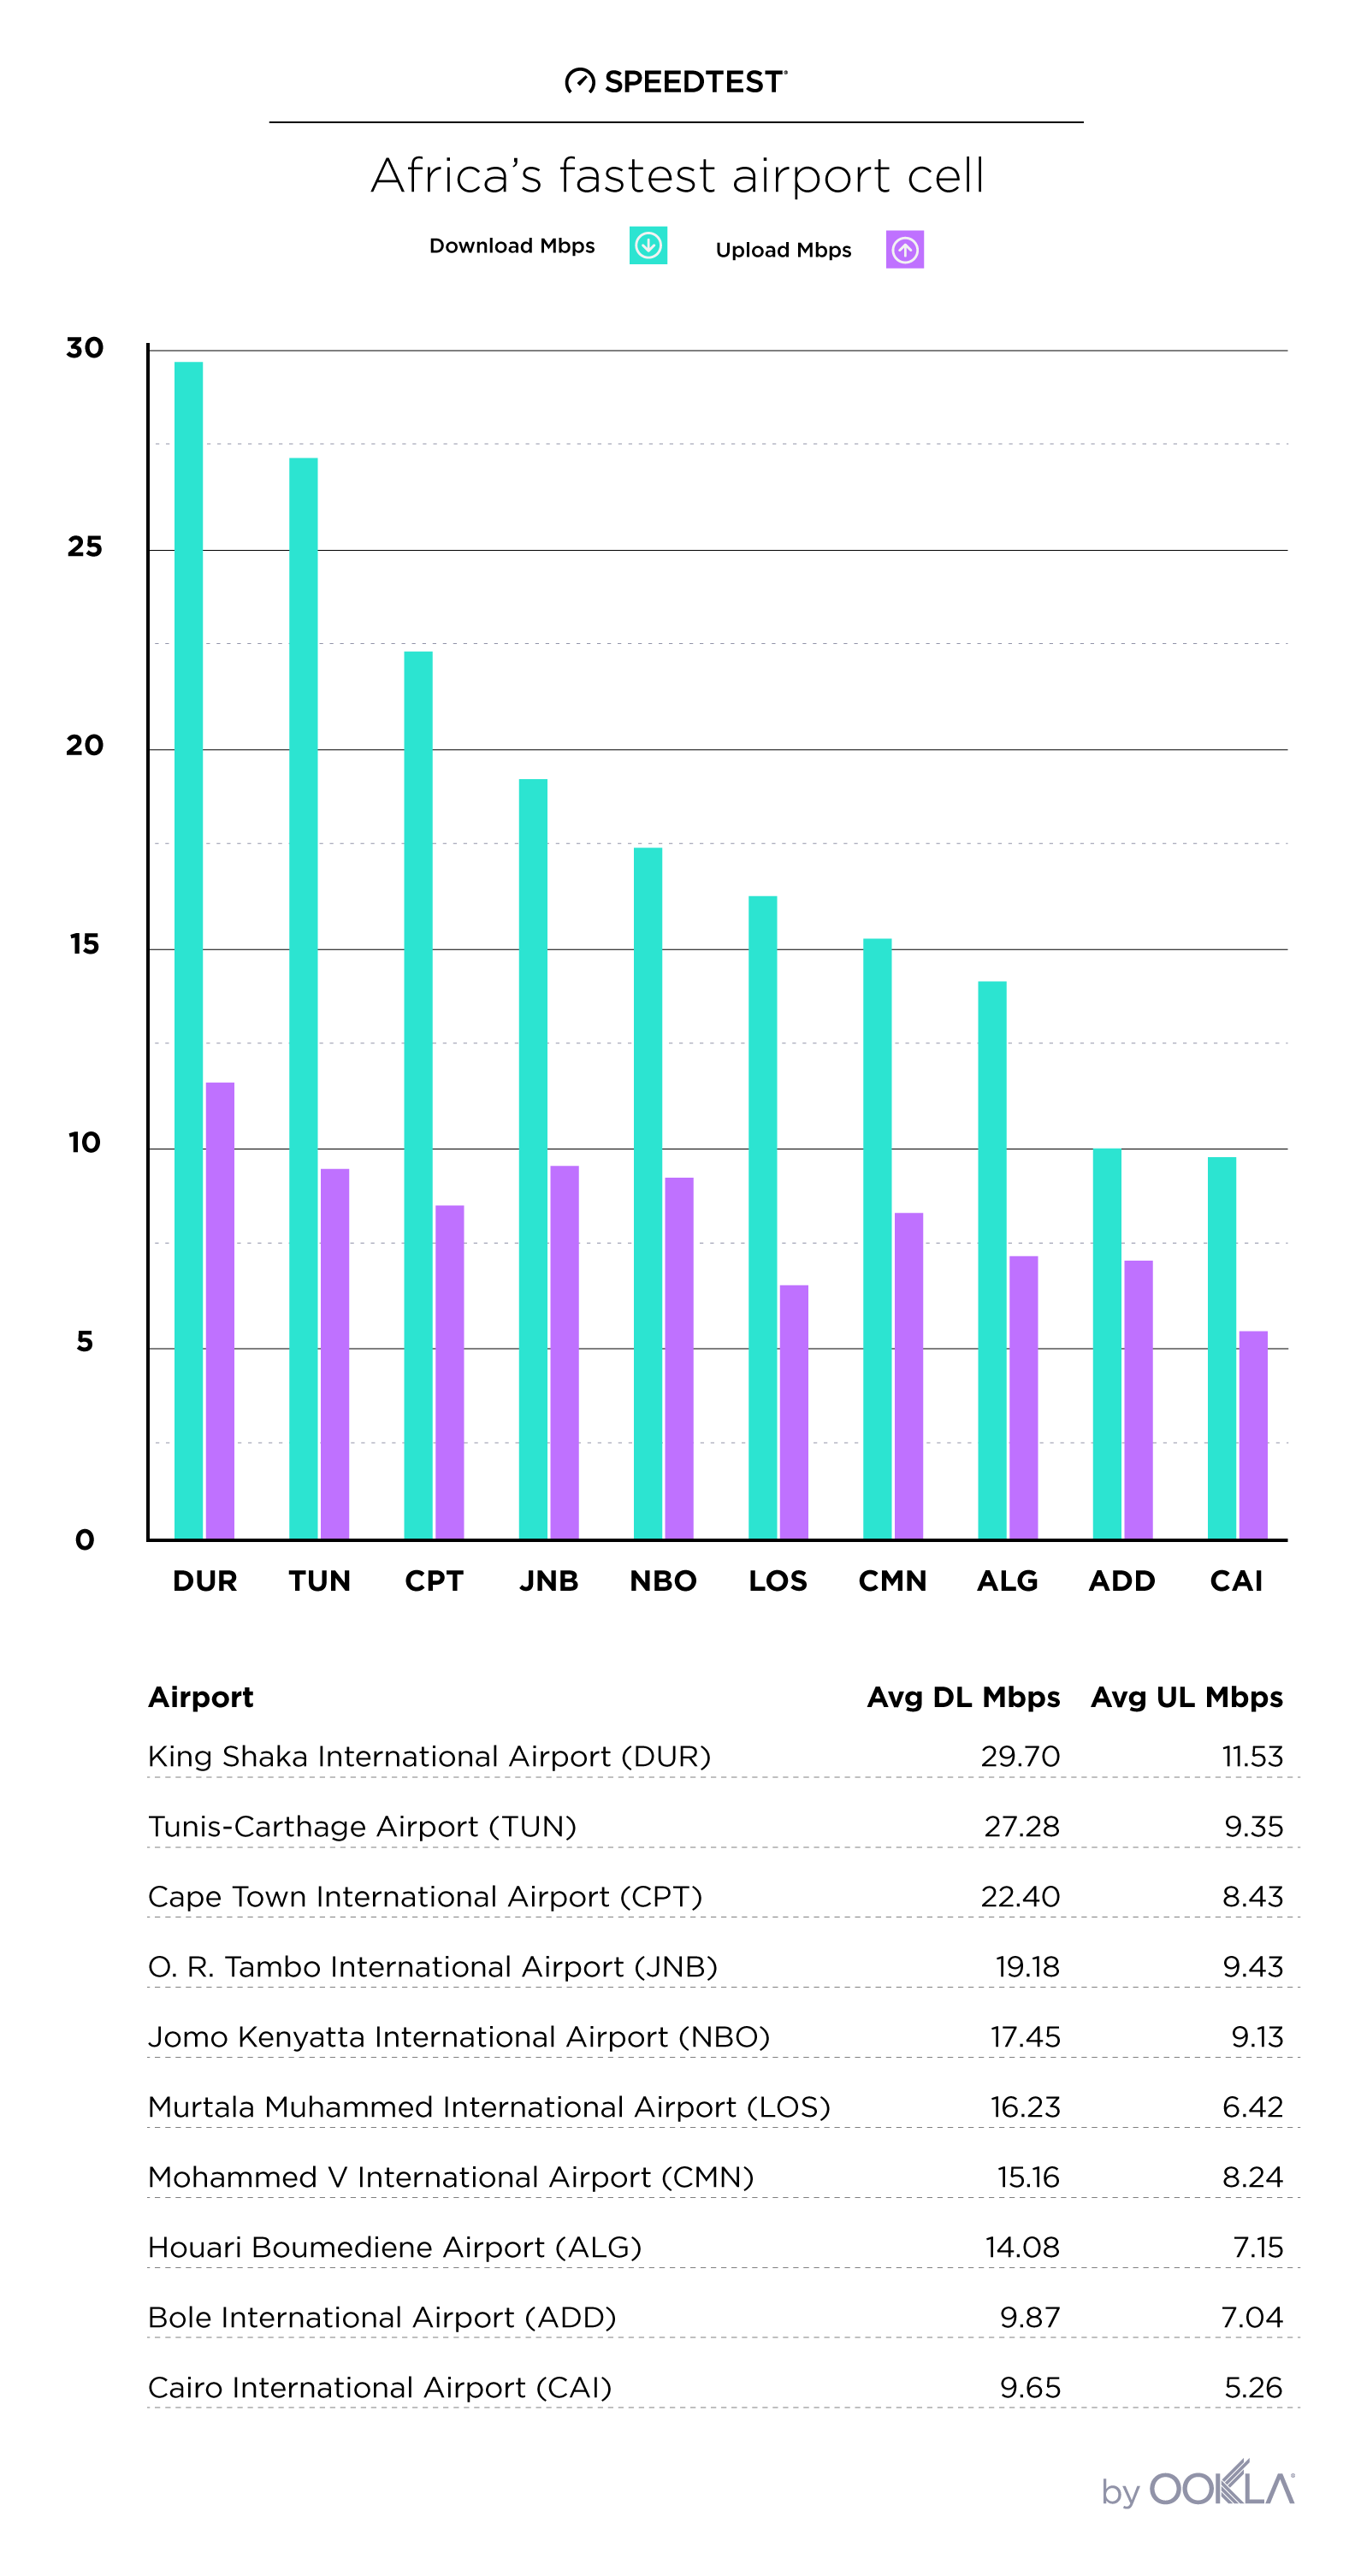
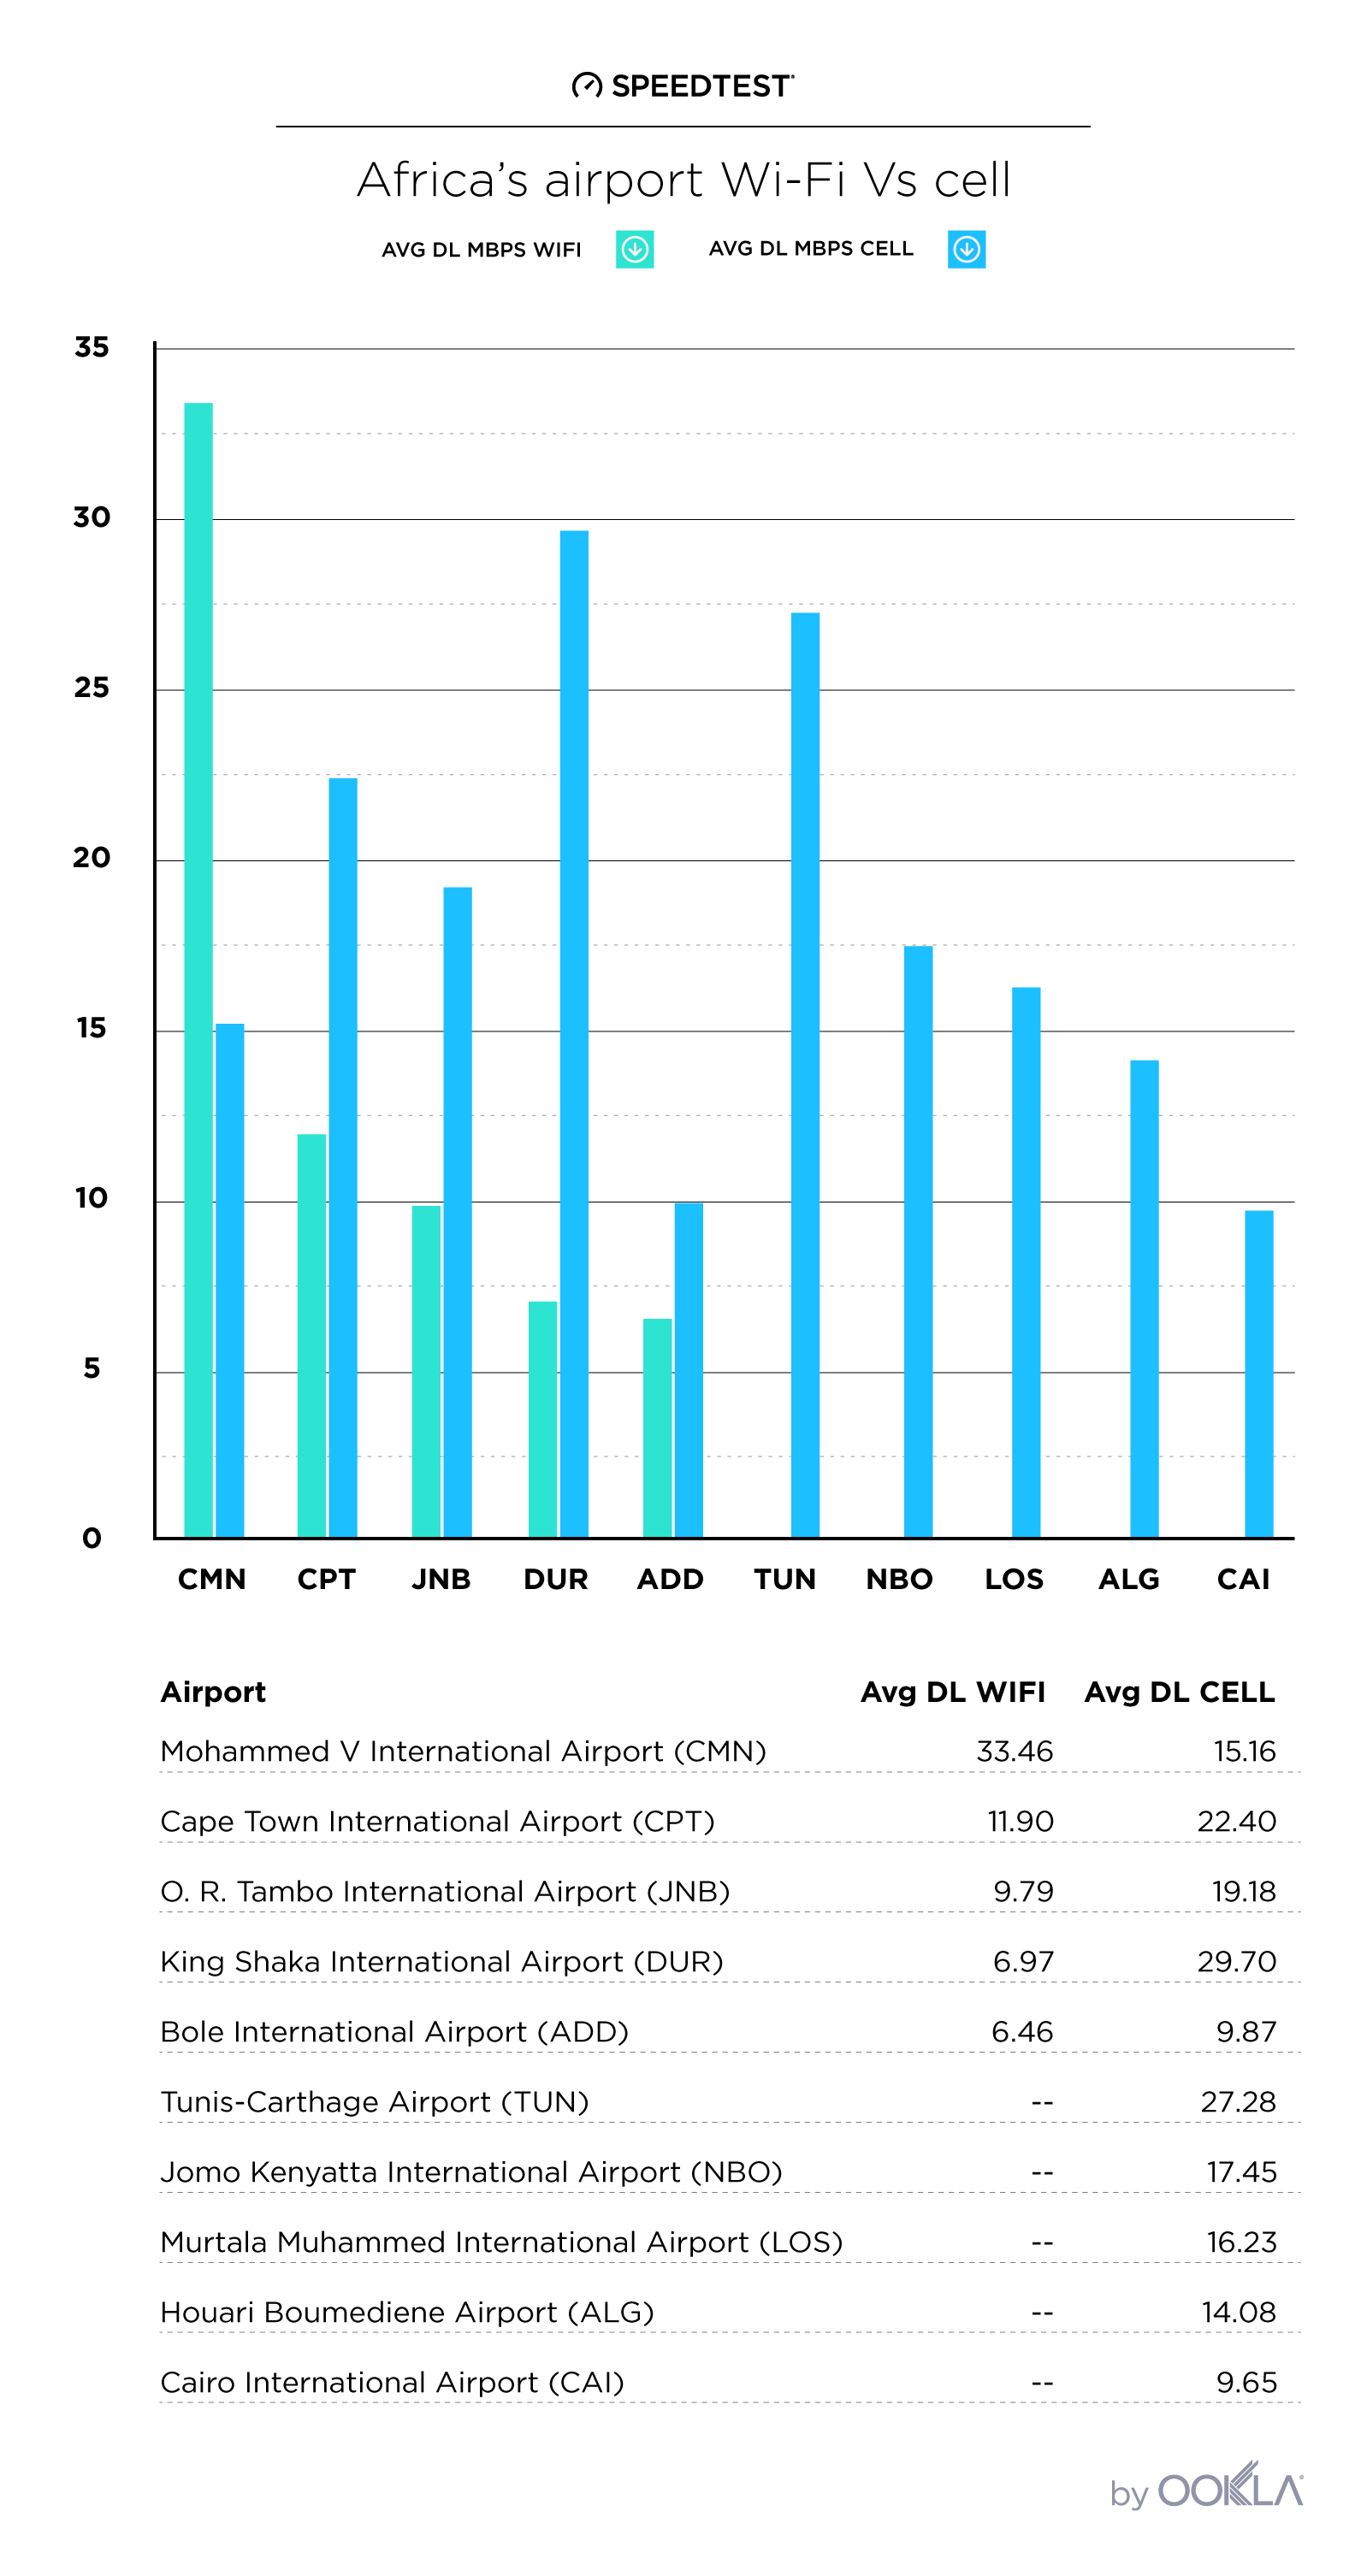
Jomo Kenyatta International Airport in Kenya had the fastest mobile download speeds of the four African airports we analyzed at 88.12 Mbps during Q1 2024. São Paulo/Guarulhos International Airport in Brazil was the faster of the two Latin American airports analyzed with a median download speed of 55.44 Mbps.

Airports with slow mobile speeds

Mobile can’t fix everything, because six airports came in with a median mobile download speed below 25 Mbps. Mexico City International Airport was again at the bottom with 8.75 Mbps, followed by:

  • Josep Tarradellas Barcelona–El Prat Airport (15.21 Mbps),
  • Orlando International Airport (15.84 Mbps),
  • Adolfo Suárez Madrid–Barajas Airport (20.37 Mbps),
  • Chhatrapati Shivaji Maharaj International Airport (20.96 Mbps), and
  • Indira Gandhi International Airport (21.80 Mbps).

Latency on mobile was generally higher than that on Wi-Fi with 46 airports showing a Wi-Fi latency lower than the lowest latency on mobile, 27.51 ms at China’s Shanghai Hongqiao International Airport. As noted above, latency is an important factor in performance, so it might be worth investigating the airport Wi-Fi by running a Speedtest if your mobile performance seems to lag.

Airport Wi-Fi or mobile? Connecting on your next trip

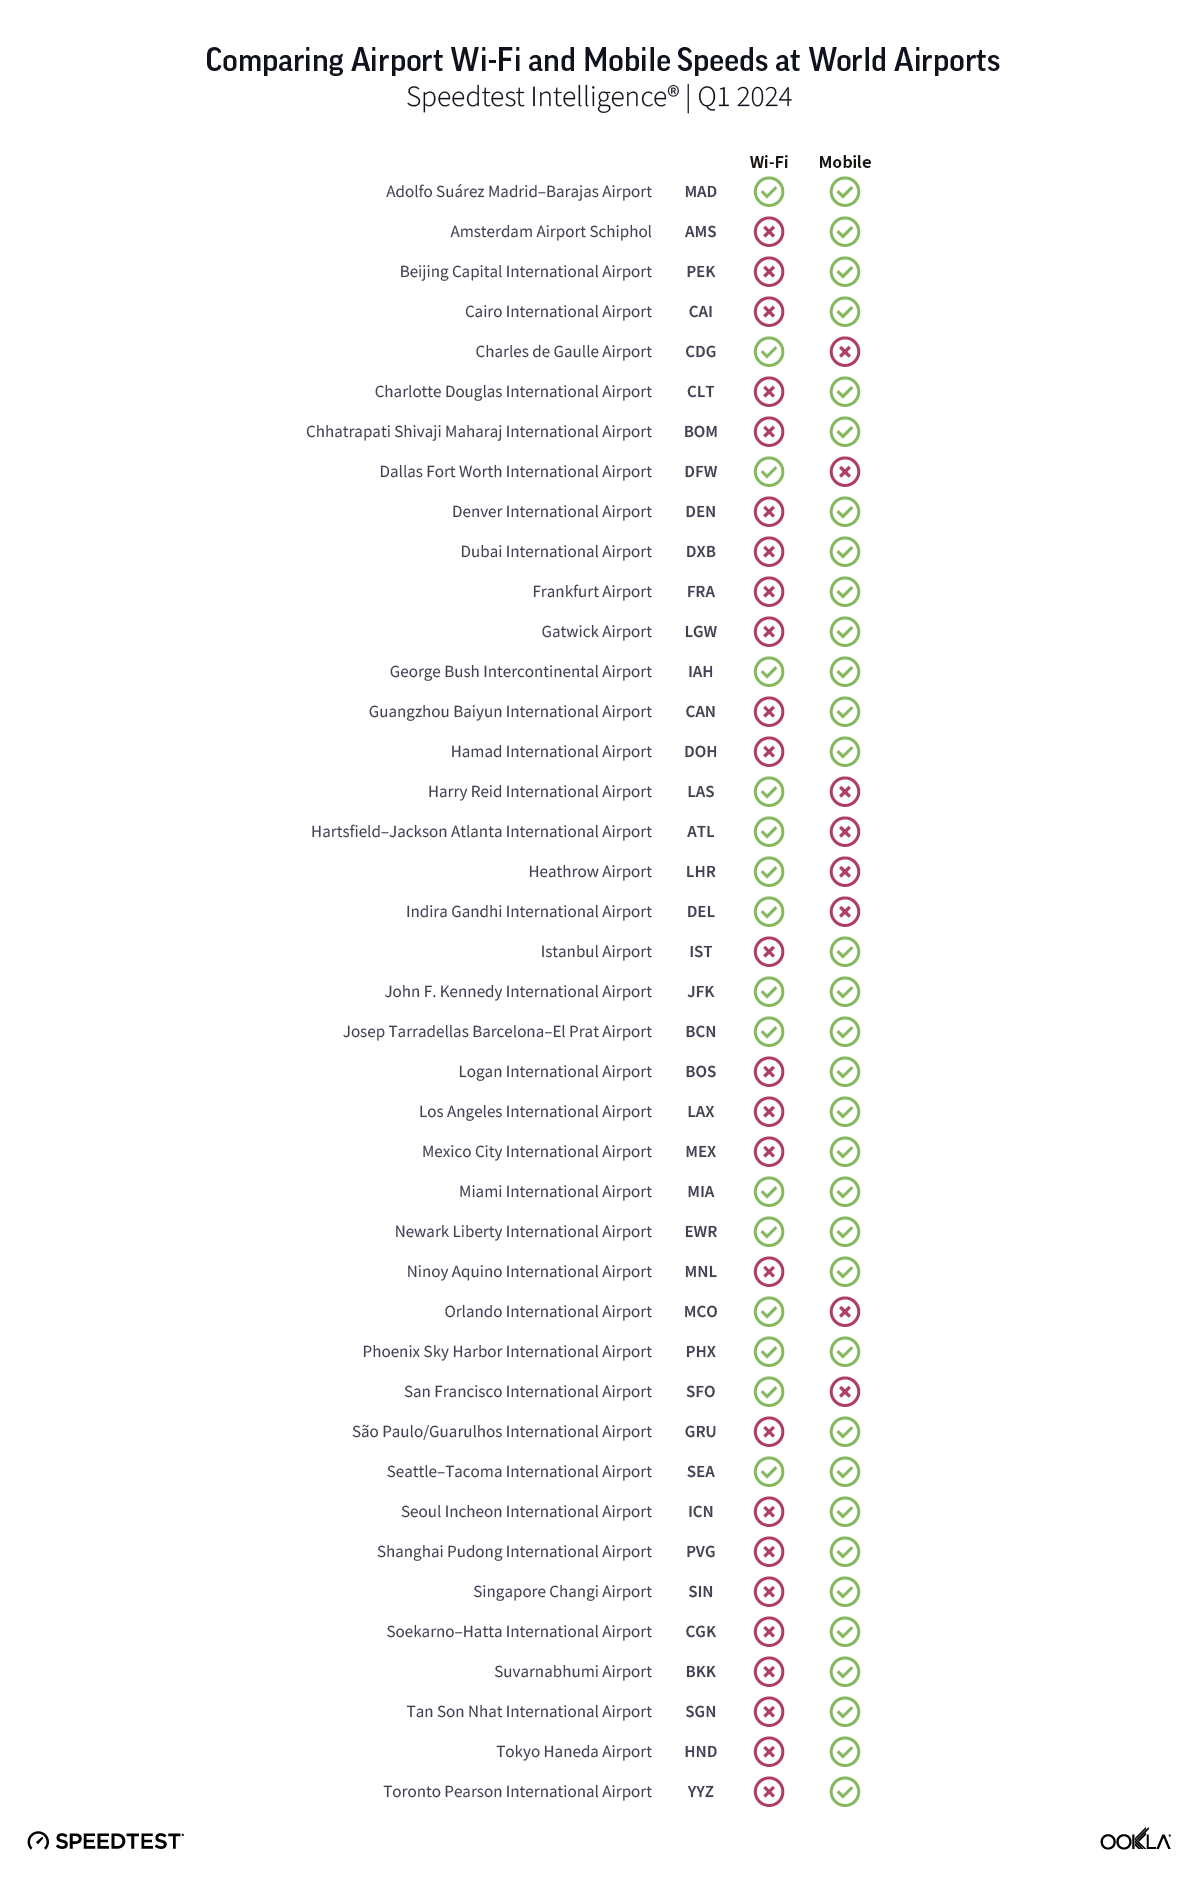
We created a quick guide to help you decide whether to try out the Wi-Fi or simply use the local mobile network if you have access. Use it to compare free airport Wi-Fi performance against mobile performance for the 52 airports we have both Wi-Fi and mobile data for during Q1 2024. Twenty-six airports had faster mobile internet than airport Wi-Fi. Eight airports had faster Wi-Fi than mobile, and seven airports showed only a slight distinction between Wi-Fi and mobile or download speeds over 100 Mbps on both, so we gave both the green check marks. We were able to include more airports in the mobile analysis because there were more mobile samples to analyze at those airports than there were samples over Wi-Fi.

Chart of Comparing Airport Wi-Fi and Mobile Speeds at World Airports

The averages reported here are based on real-world data, so your experience may differ, especially on a busy travel day. Take a Speedtest® at the airport to see how your performance compares. Cheers to safe travels and rapid connections wherever you’re flying.

Ookla retains ownership of this article including all of the intellectual property rights, data, content graphs and analysis. This article may not be quoted, reproduced, distributed or published for any commercial purpose without prior consent. Members of the press and others using the findings in this article for non-commercial purposes are welcome to publicly share and link to report information with attribution to Ookla.

| June 6, 2021

Internet Speeds in North Africa are Rapidly Improving, but Still Lag Behind Much of the World

Français

2020 was a difficult year for almost every nation in the world due to the ongoing COVID-19 pandemic. On the bright side, Speedtest Intelligence® reveals that every North African nation improved their mobile and fixed broadband speeds from Q2 2020 to Q1 2021, despite huge setbacks in the global economy.

This article explores the state of internet performance in the North African countries of Algeria, Egypt, Libya, Morocco and Tunisia from Q2 2020 through Q1 2021. We further examine which mobile and fixed broadband providers in those countries had the best speeds, consistency and 4G Availability during Q1 2021. Finally, we investigate internet performance and coverage in the largest metropolitan areas, and look at cell signal strength using data from Ookla Cell Analytics.

Morocco has the fastest mobile download speeds in North Africa, Egypt is fastest for fixed broadband

Analysis based on data from Speedtest Intelligence shows internet speeds varied widely across North Africa during Q1 2021, with every country except Egypt experiencing faster median mobile download speeds than fixed broadband speeds. Internet speeds over the past year — Q2 2020 to Q1 2021 — increased for both mobile and fixed broadband in every country in North Africa.

North Africa isn’t isolated in this improvement: earlier this year, Ookla® partnered with the World Bank to analyze internet performance in 18 African countries during the COVID-19 pandemic. This study showed that overall internet speeds slowed during lockdowns.

Mobile speeds increased across most of North Africa

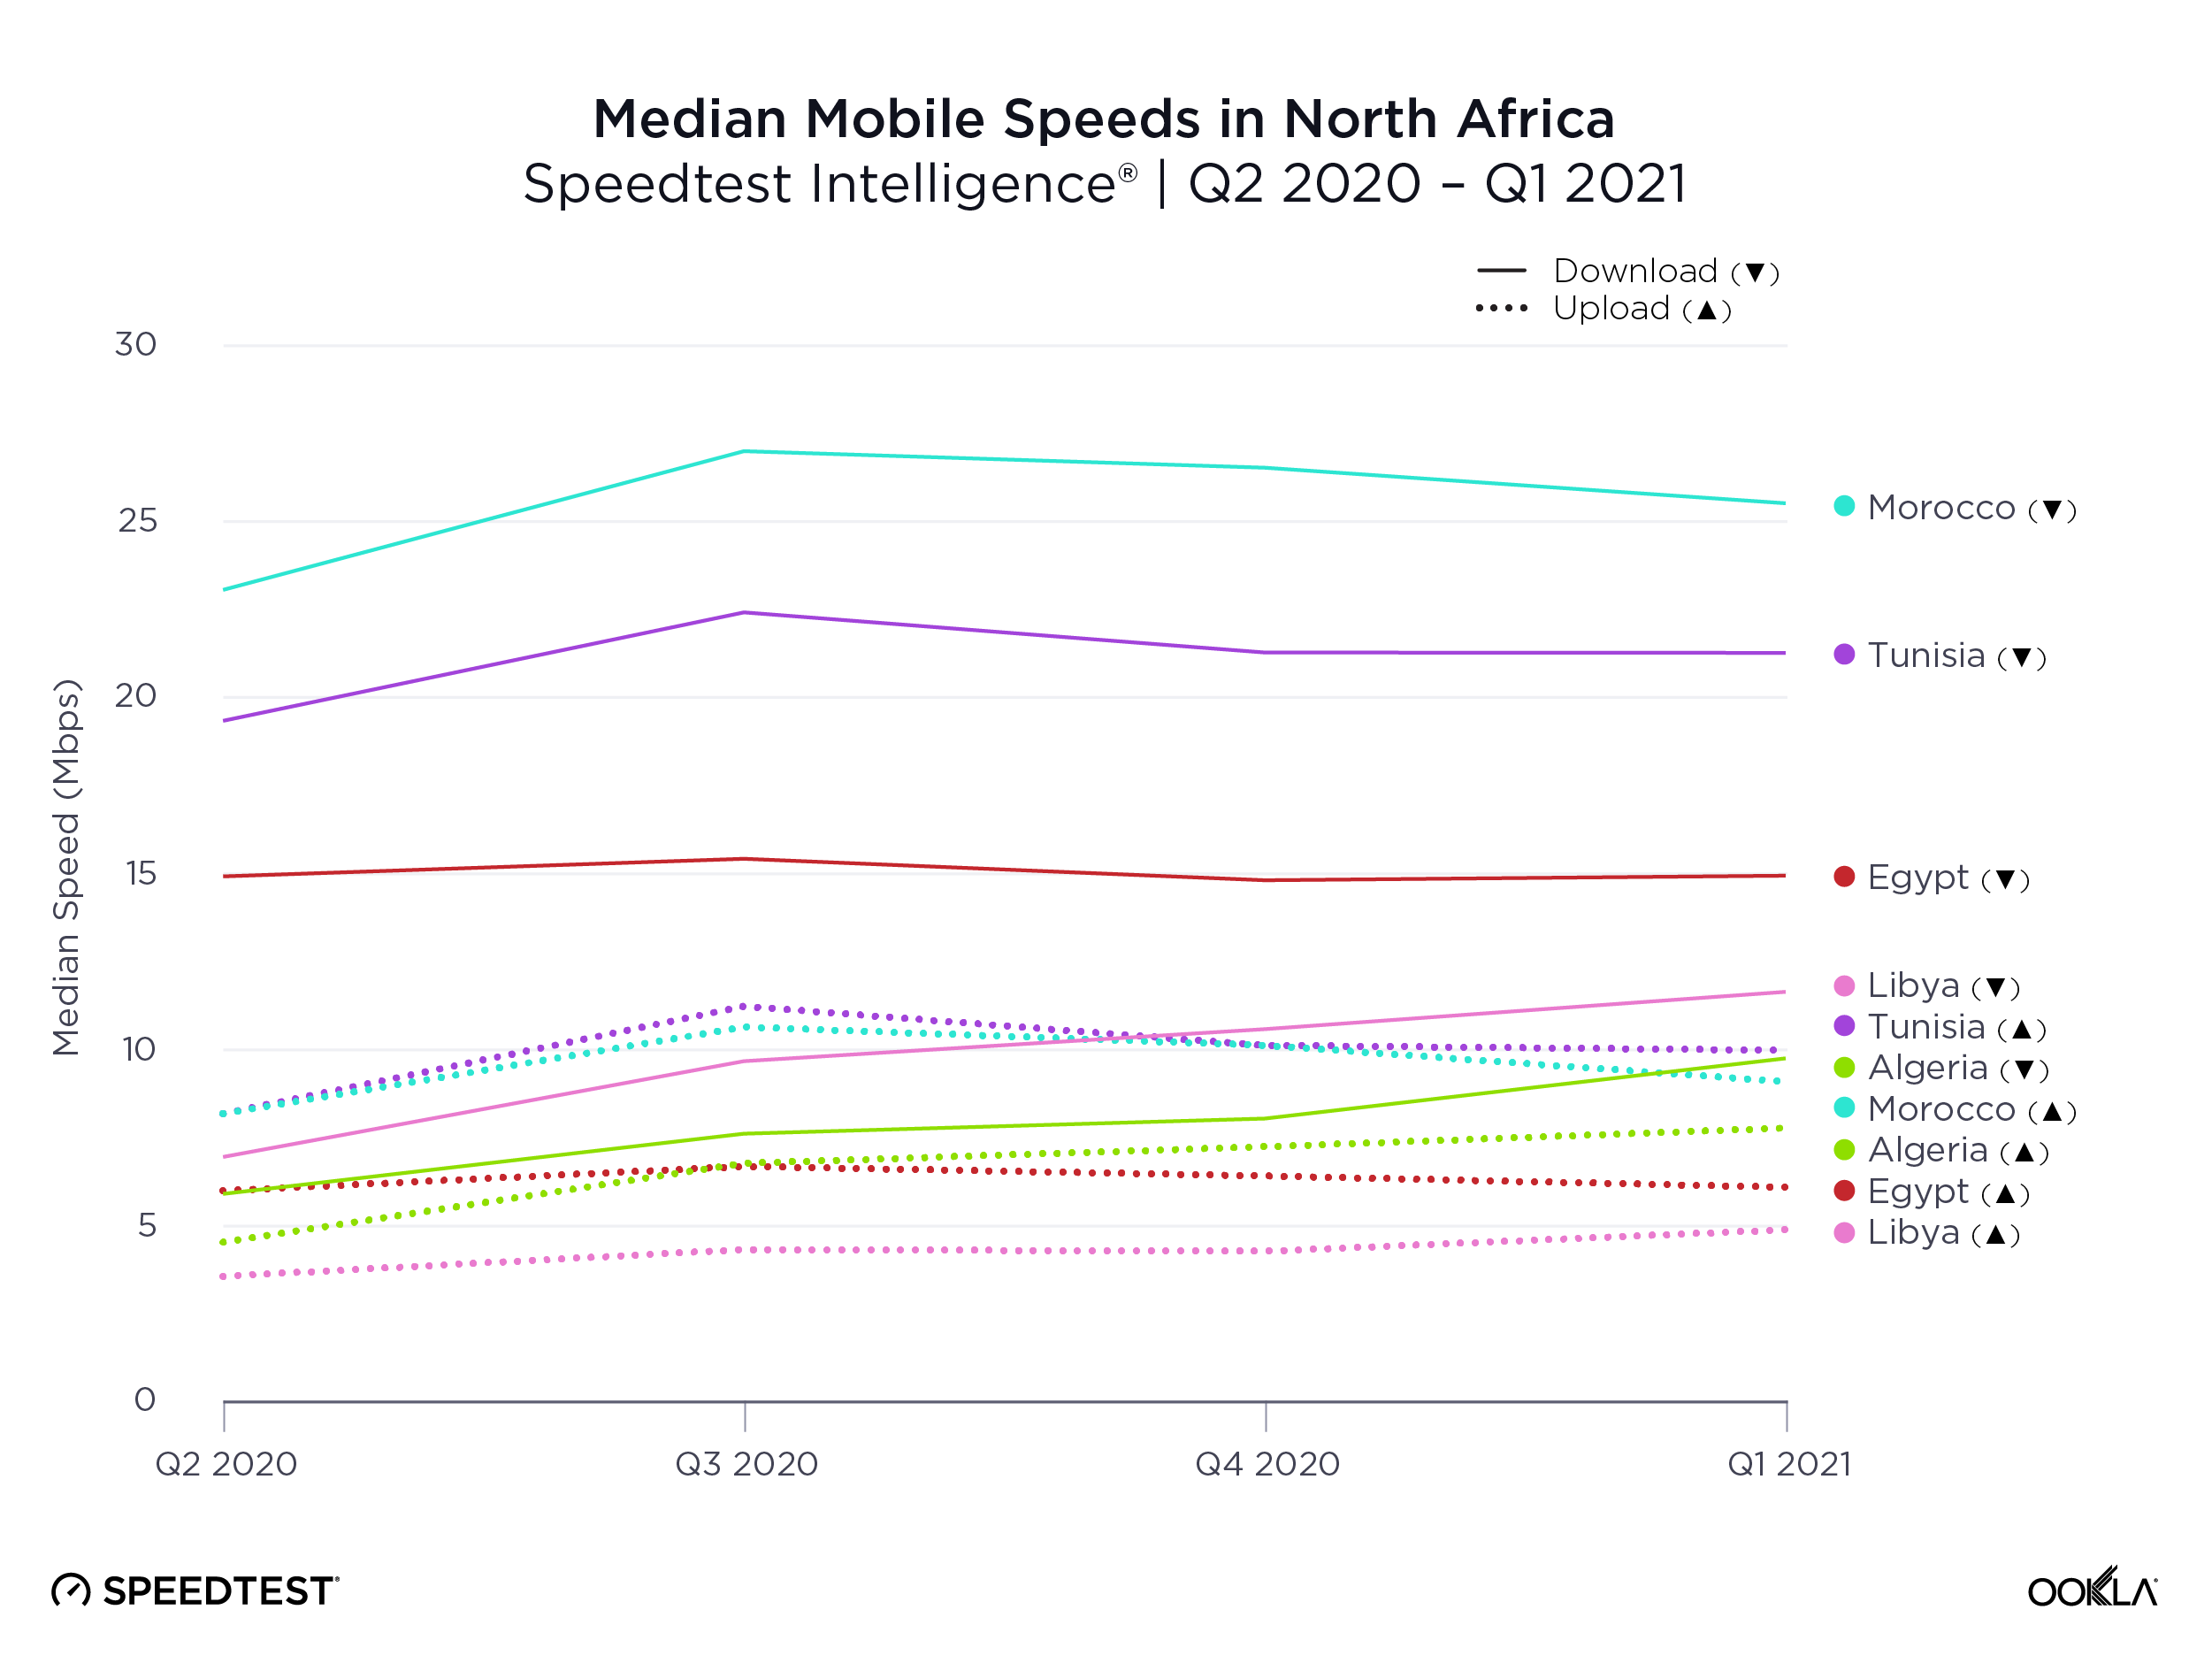
ookla_median-mobile-speeds_north-africa_0521_en

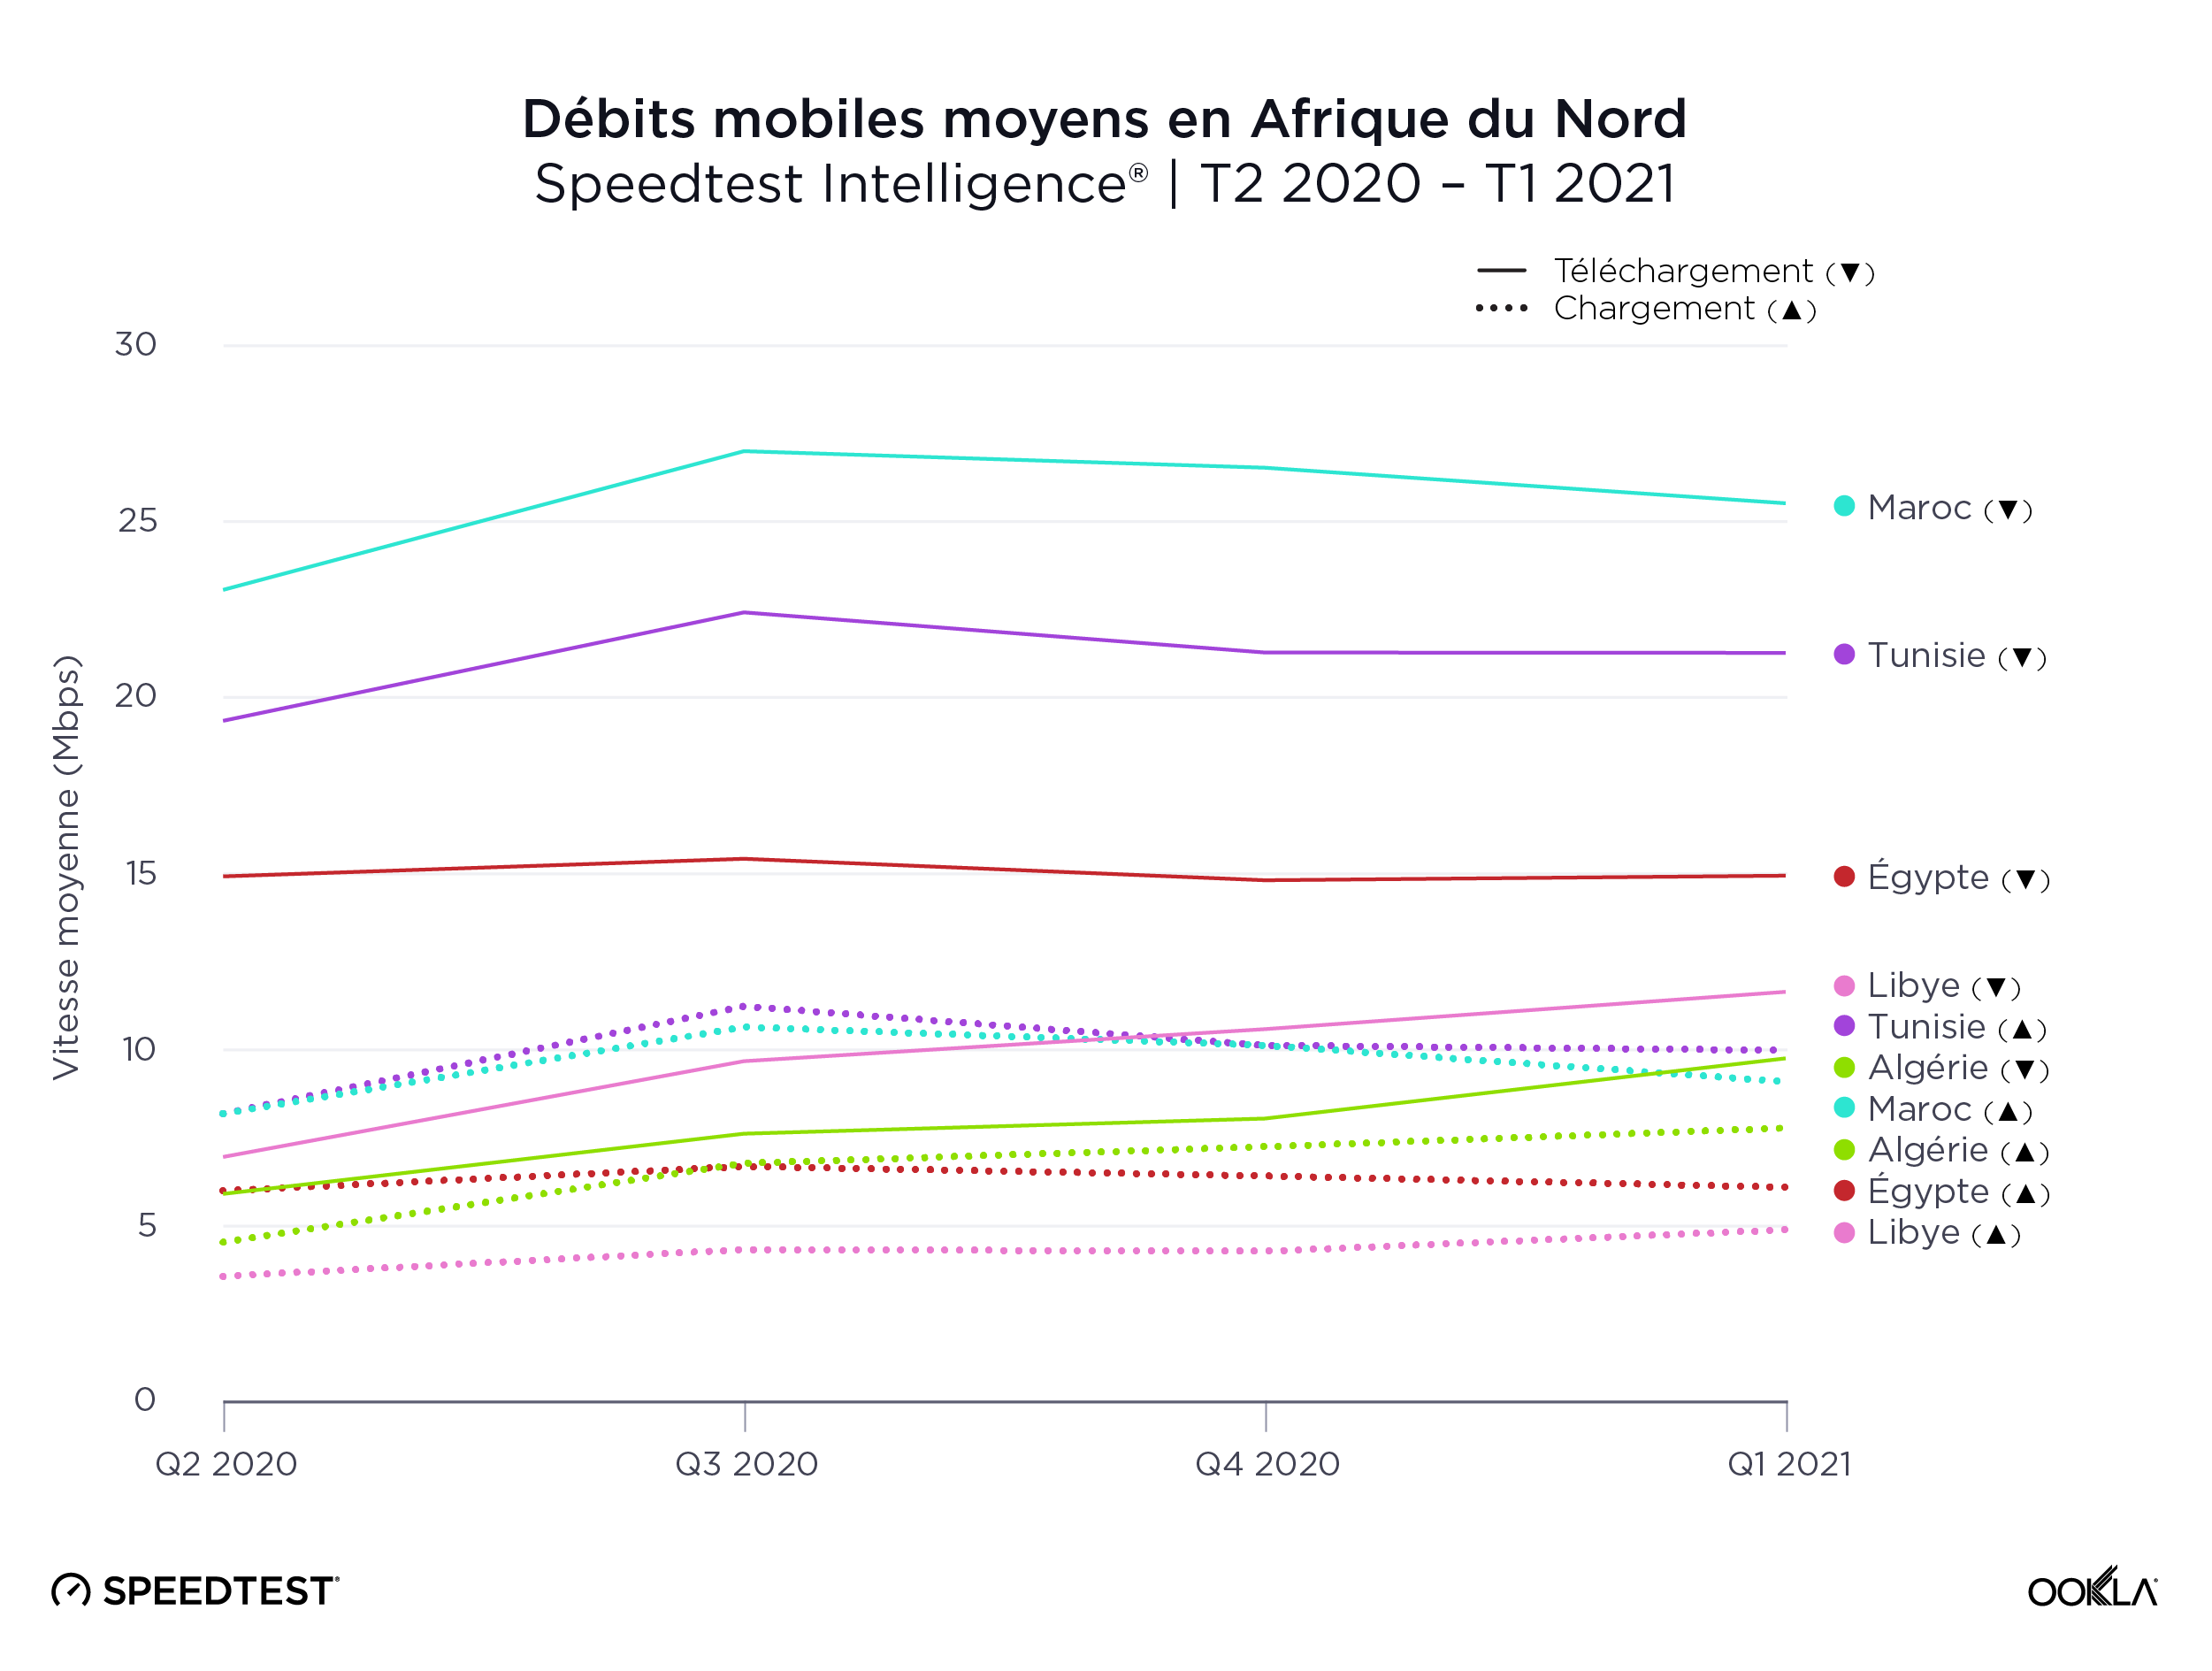
Morocco had the fastest median mobile download speed (25.53 Mbps). Tunisia was second (21.28 Mbps), Egypt third (14.95 Mbps), Libya fourth (11.65 Mbps) and Algeria fifth (9.76 Mbps).

Many North Africans have become mobile-first internet users as 3G and 4G performance and coverage continue to improve. From Q2 2020 to Q1 2021, every North African country (except Egypt) saw large increases in median mobile download speeds, with Libya showing the largest percentage increase (67.4%) followed by Algeria (65.1%), Morocco (10.7%), Tunisia (10.0%) and Egypt (0.1%).

Egypt showed the fastest broadband speeds

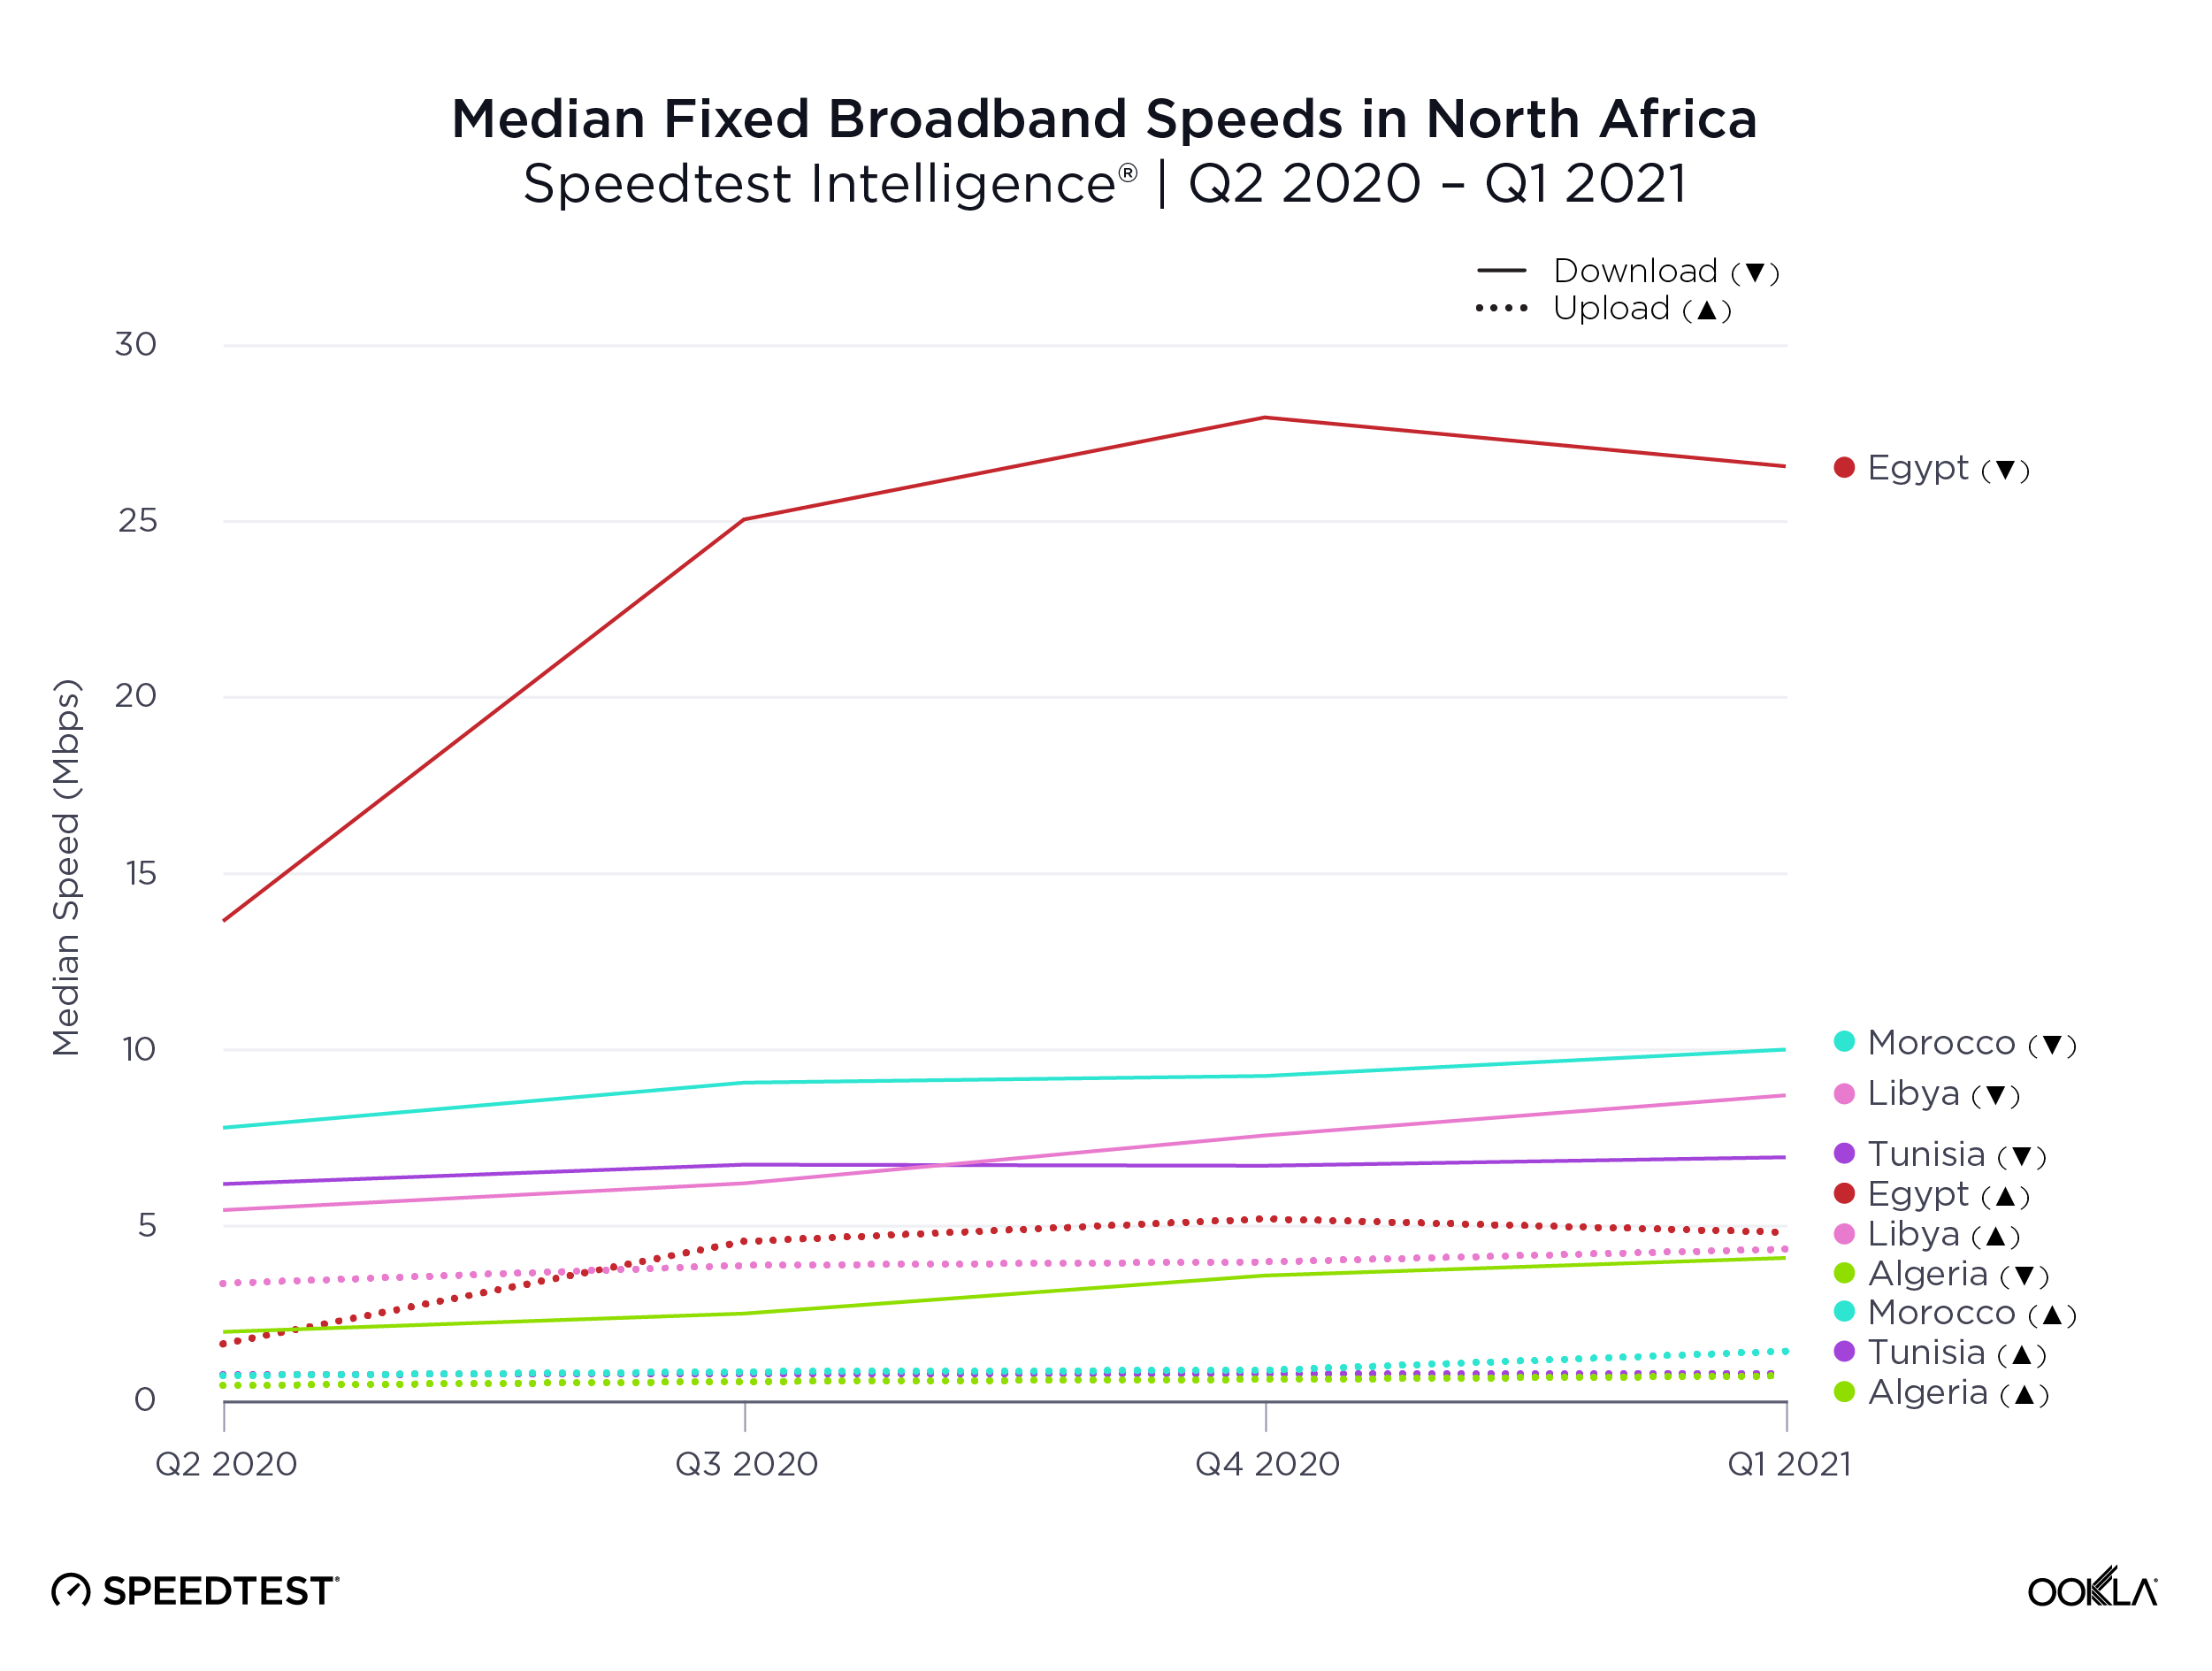
ookla_median-fixed-speeds_north-africa_0521_en

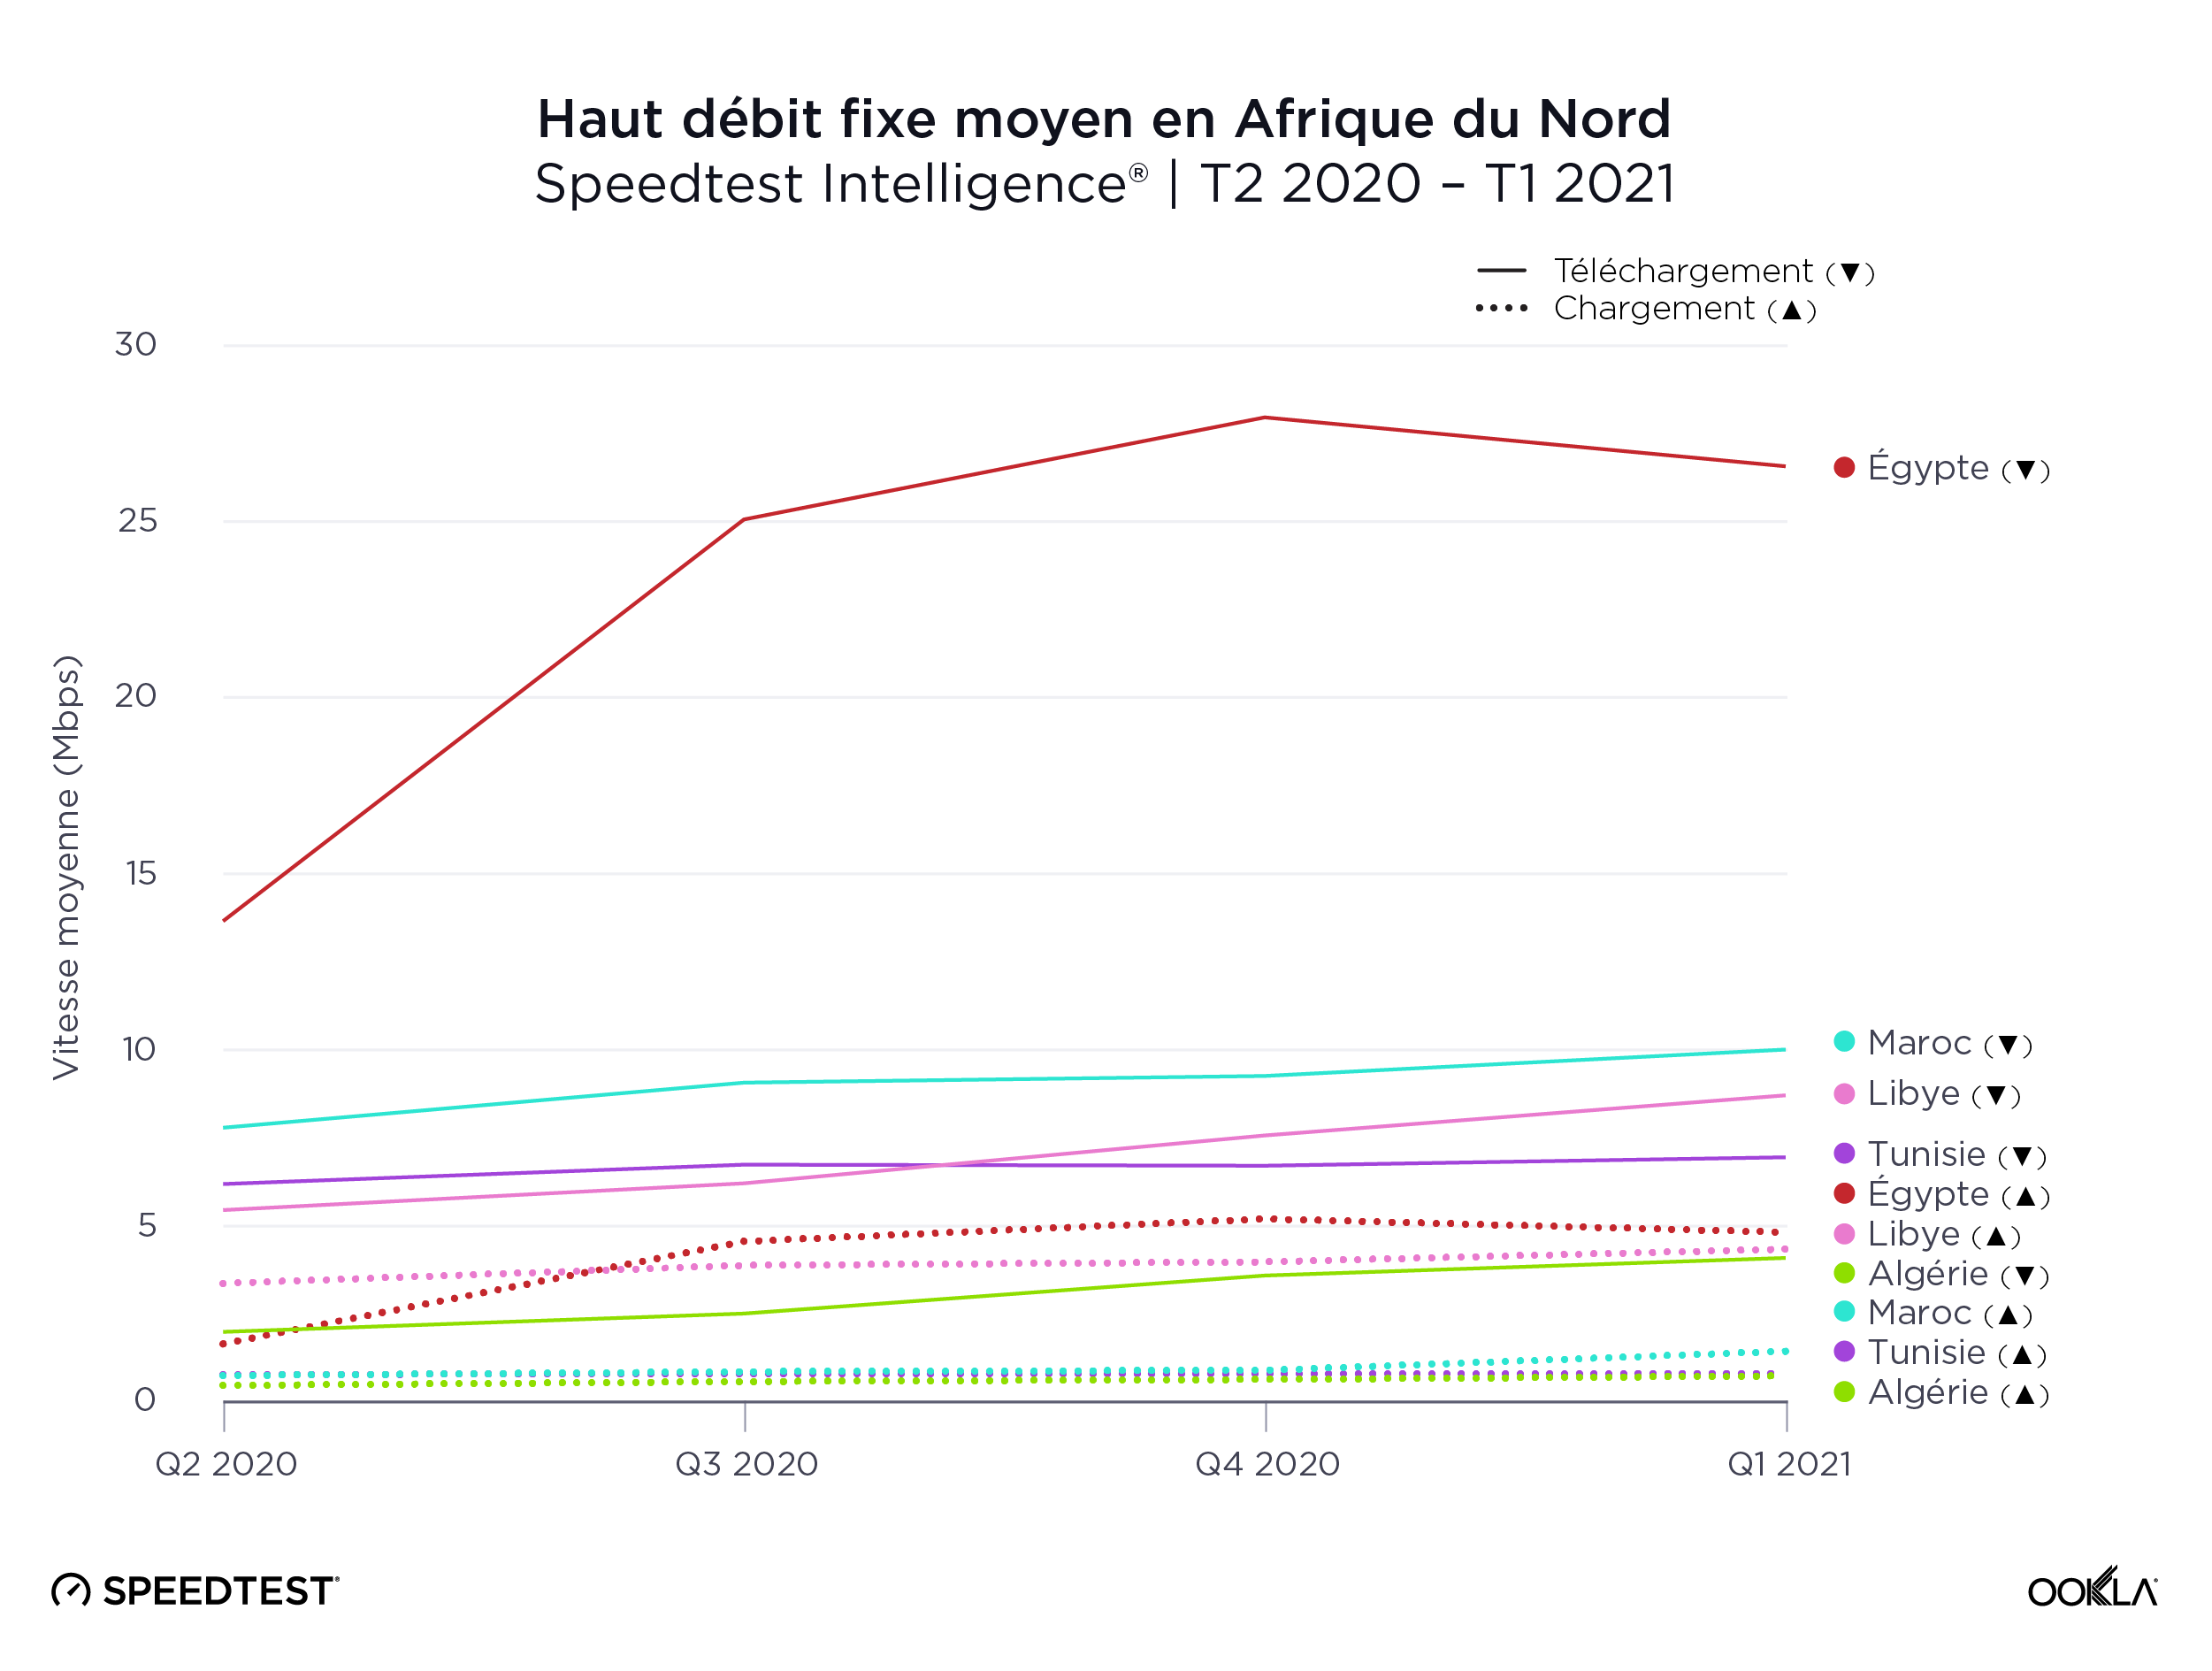
While Egypt trails in mobile internet speeds, it excels for fixed broadband speeds. During Q1 2021, Egypt had the fastest median download speed over fixed broadband in North Africa at 26.58Mbps (4.82 Mbps upload). Morocco was second for download (10.01 Mbps), Libya was third (8.71 Mbps), Tunisia was fourth (6.95 Mbps) and Algeria fifth (4.09 Mbps).

Every country in North Africa, with the exception of Tunisia, saw its median fixed broadband speeds improve more than 25% from Q2 2020 to Q1 2021, with Algeria more than doubling its median fixed broadband download speed at 105.5%. Egypt was second most improved at 94.6%, Libya was third (59.8%), Morocco was fourth (28.5%) and Tunisia was fifth at 12.3%.

Performance by provider varied widely by country

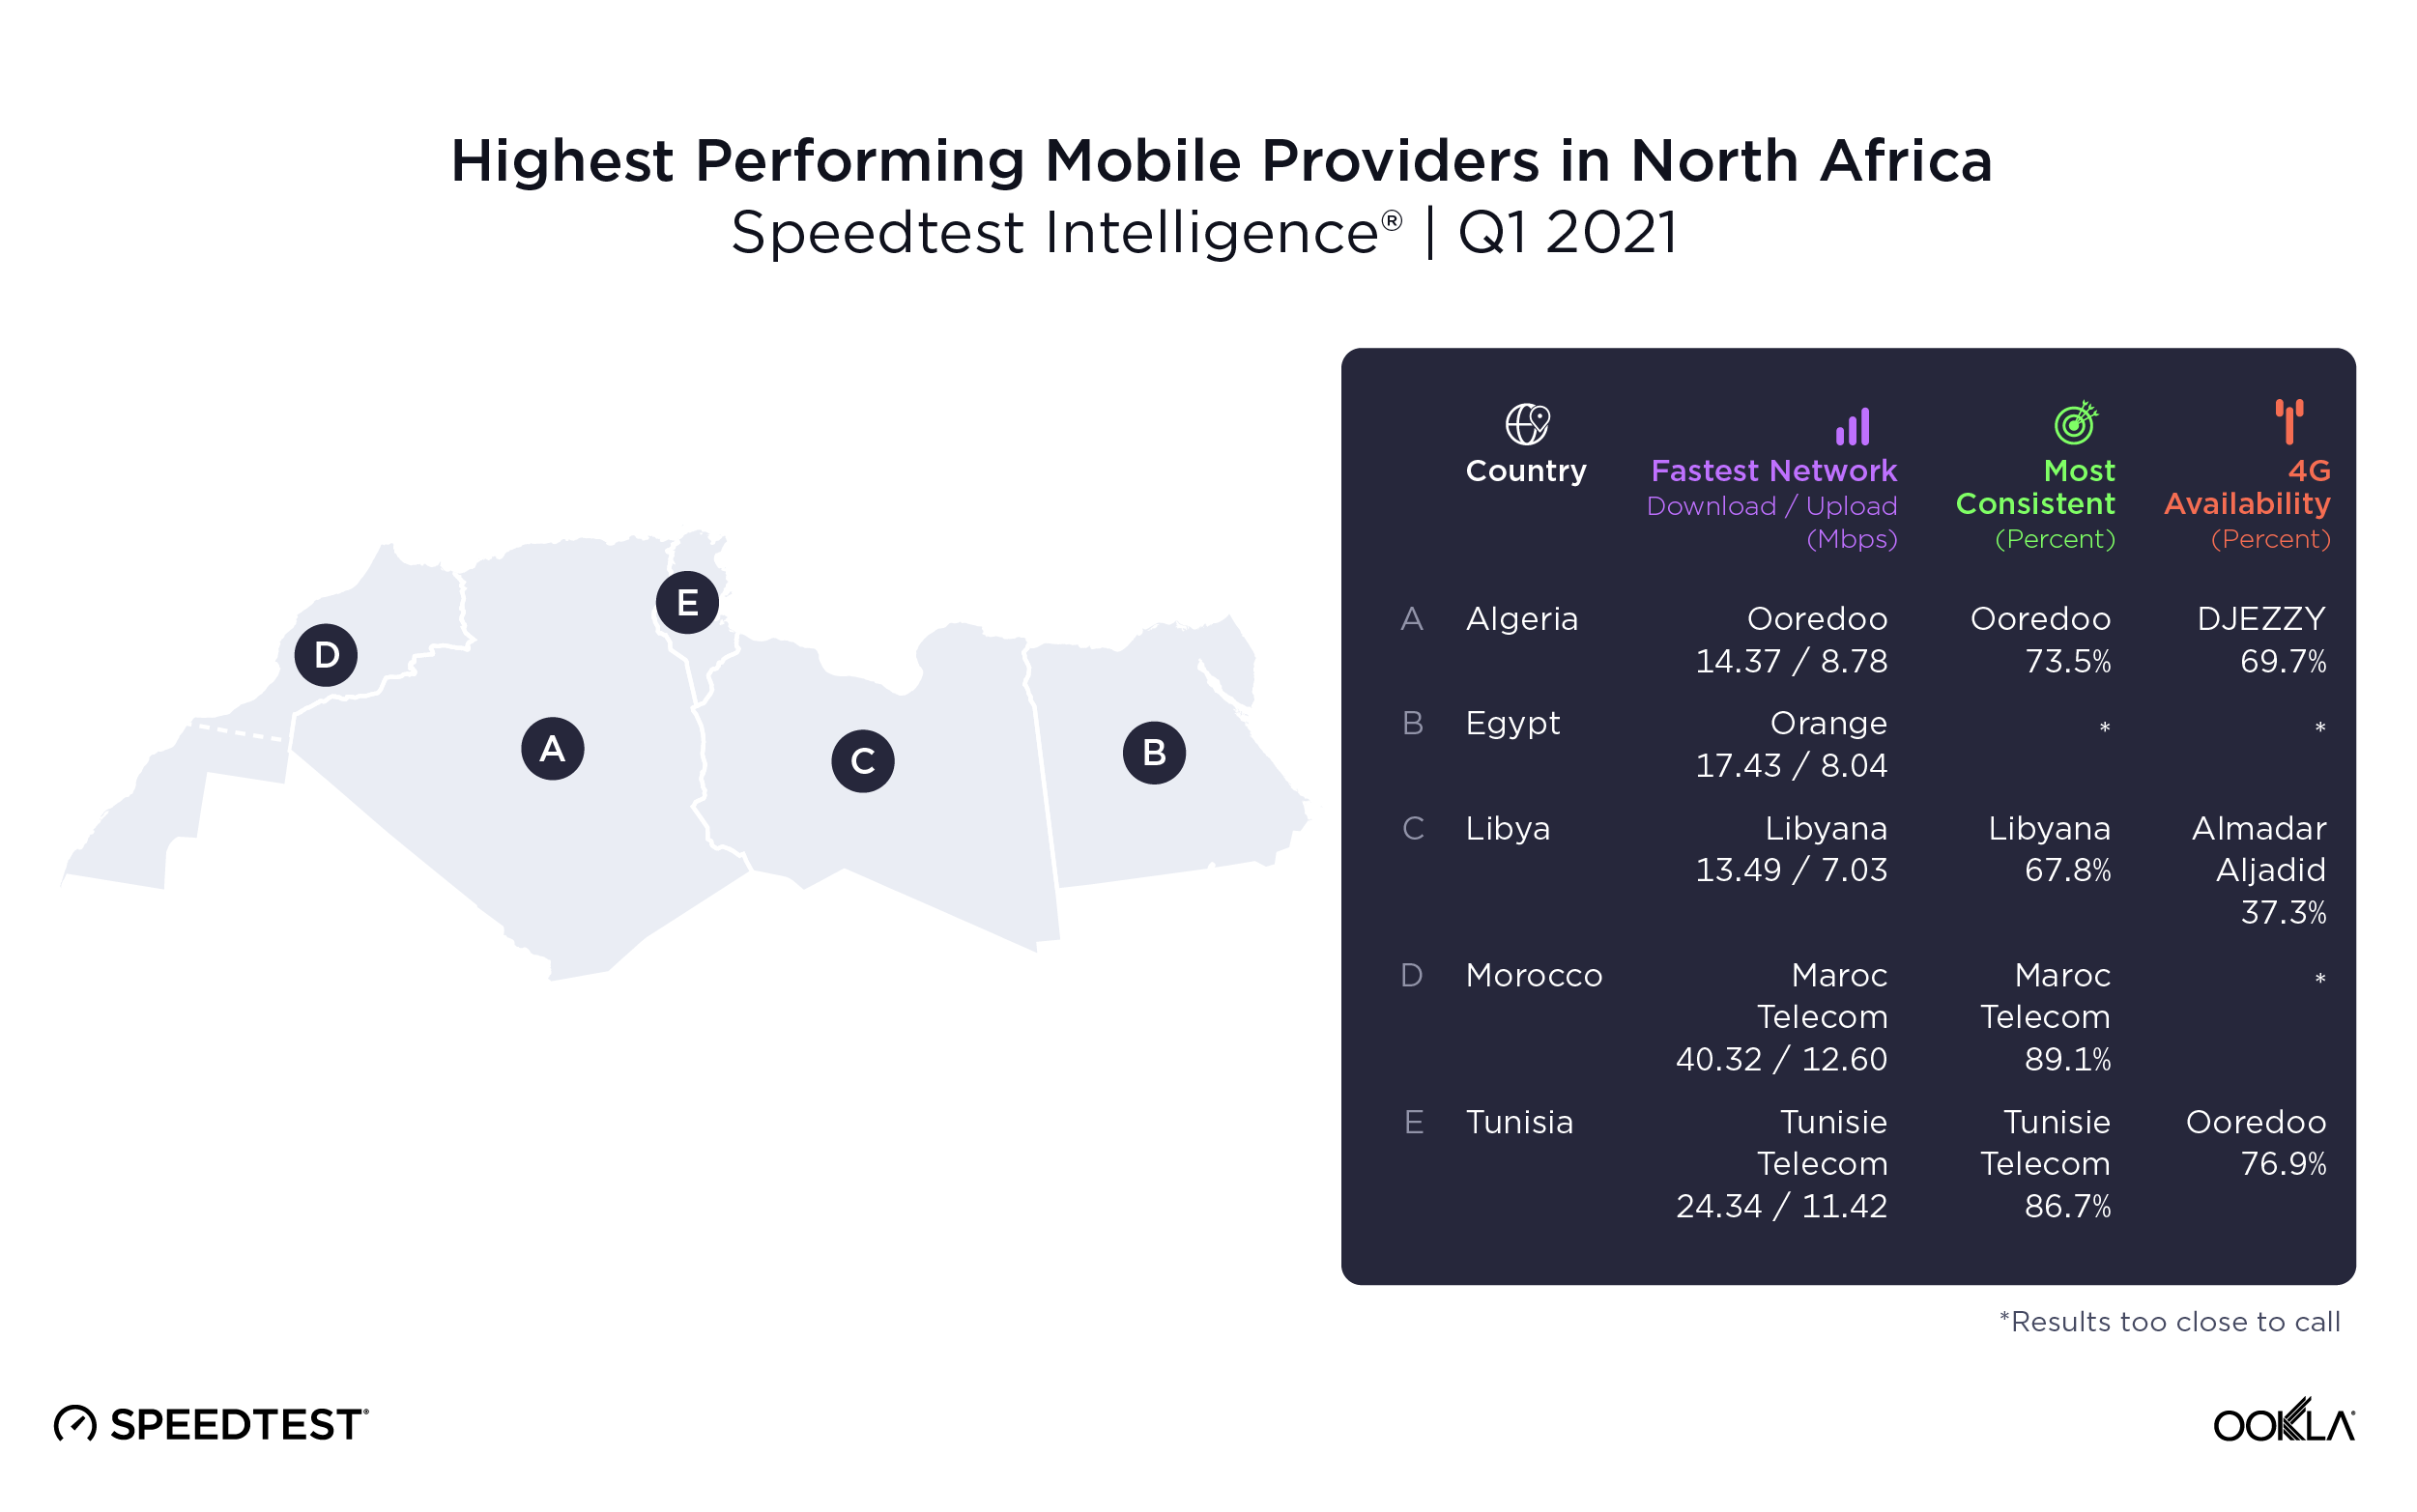
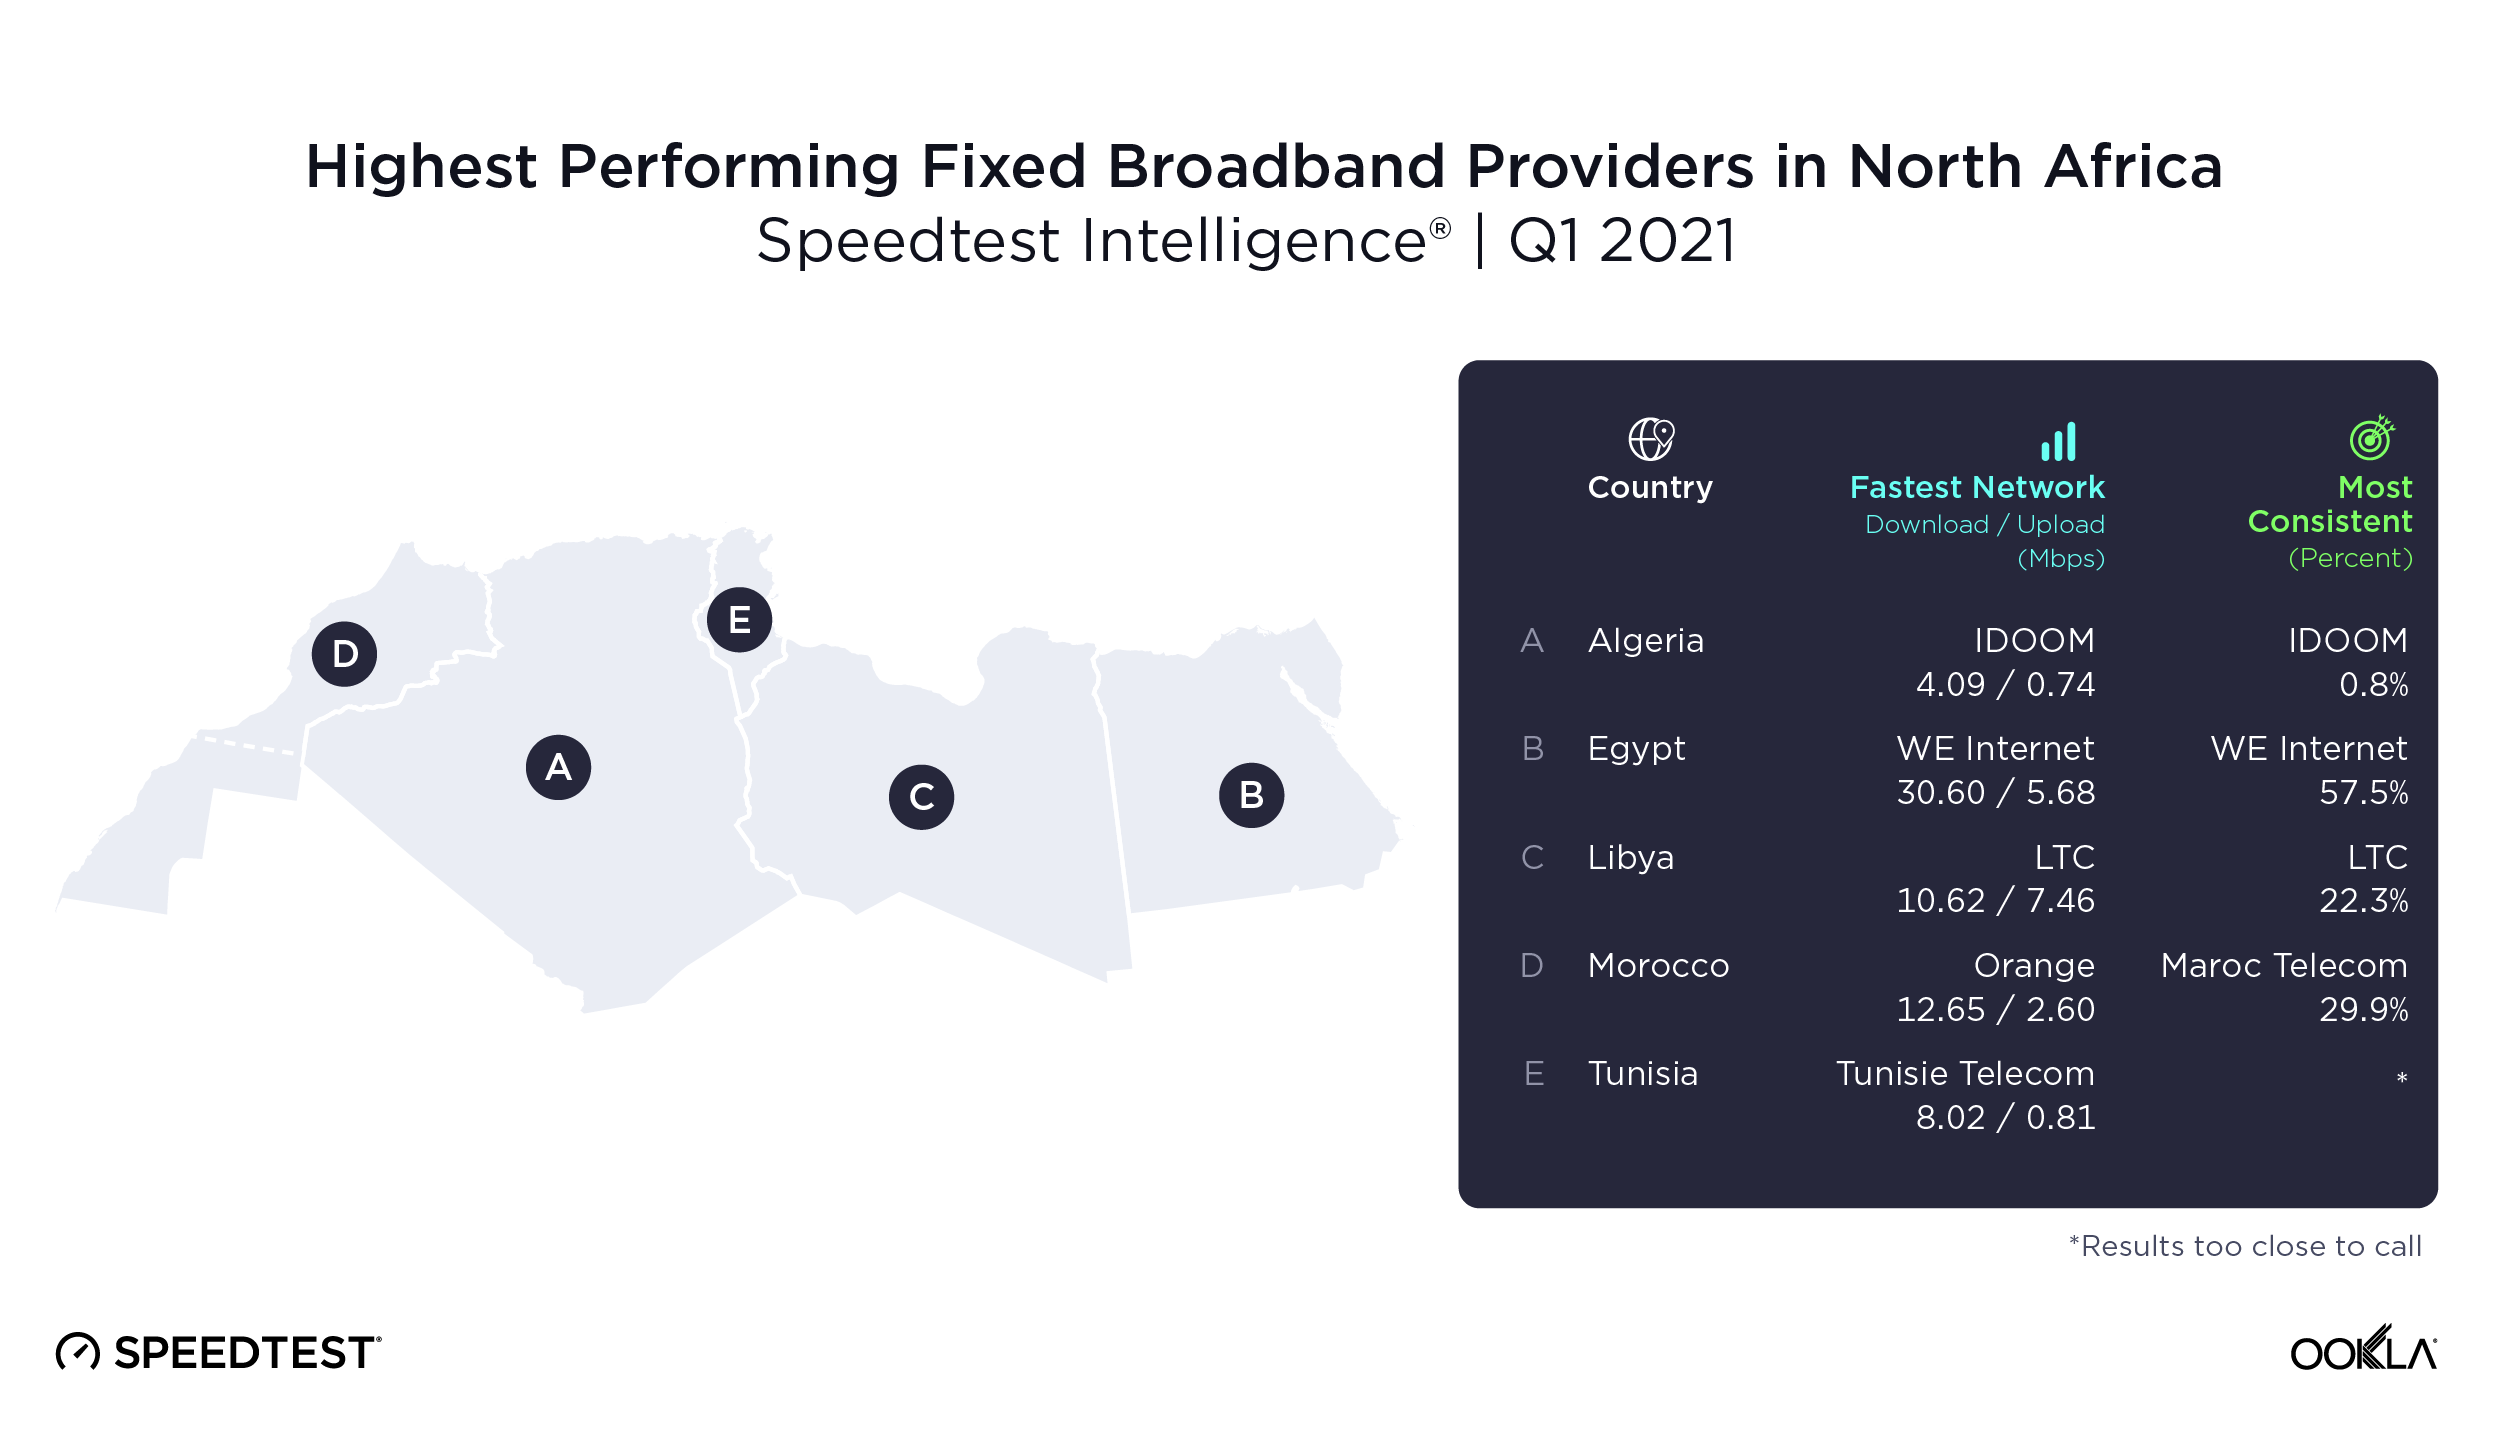
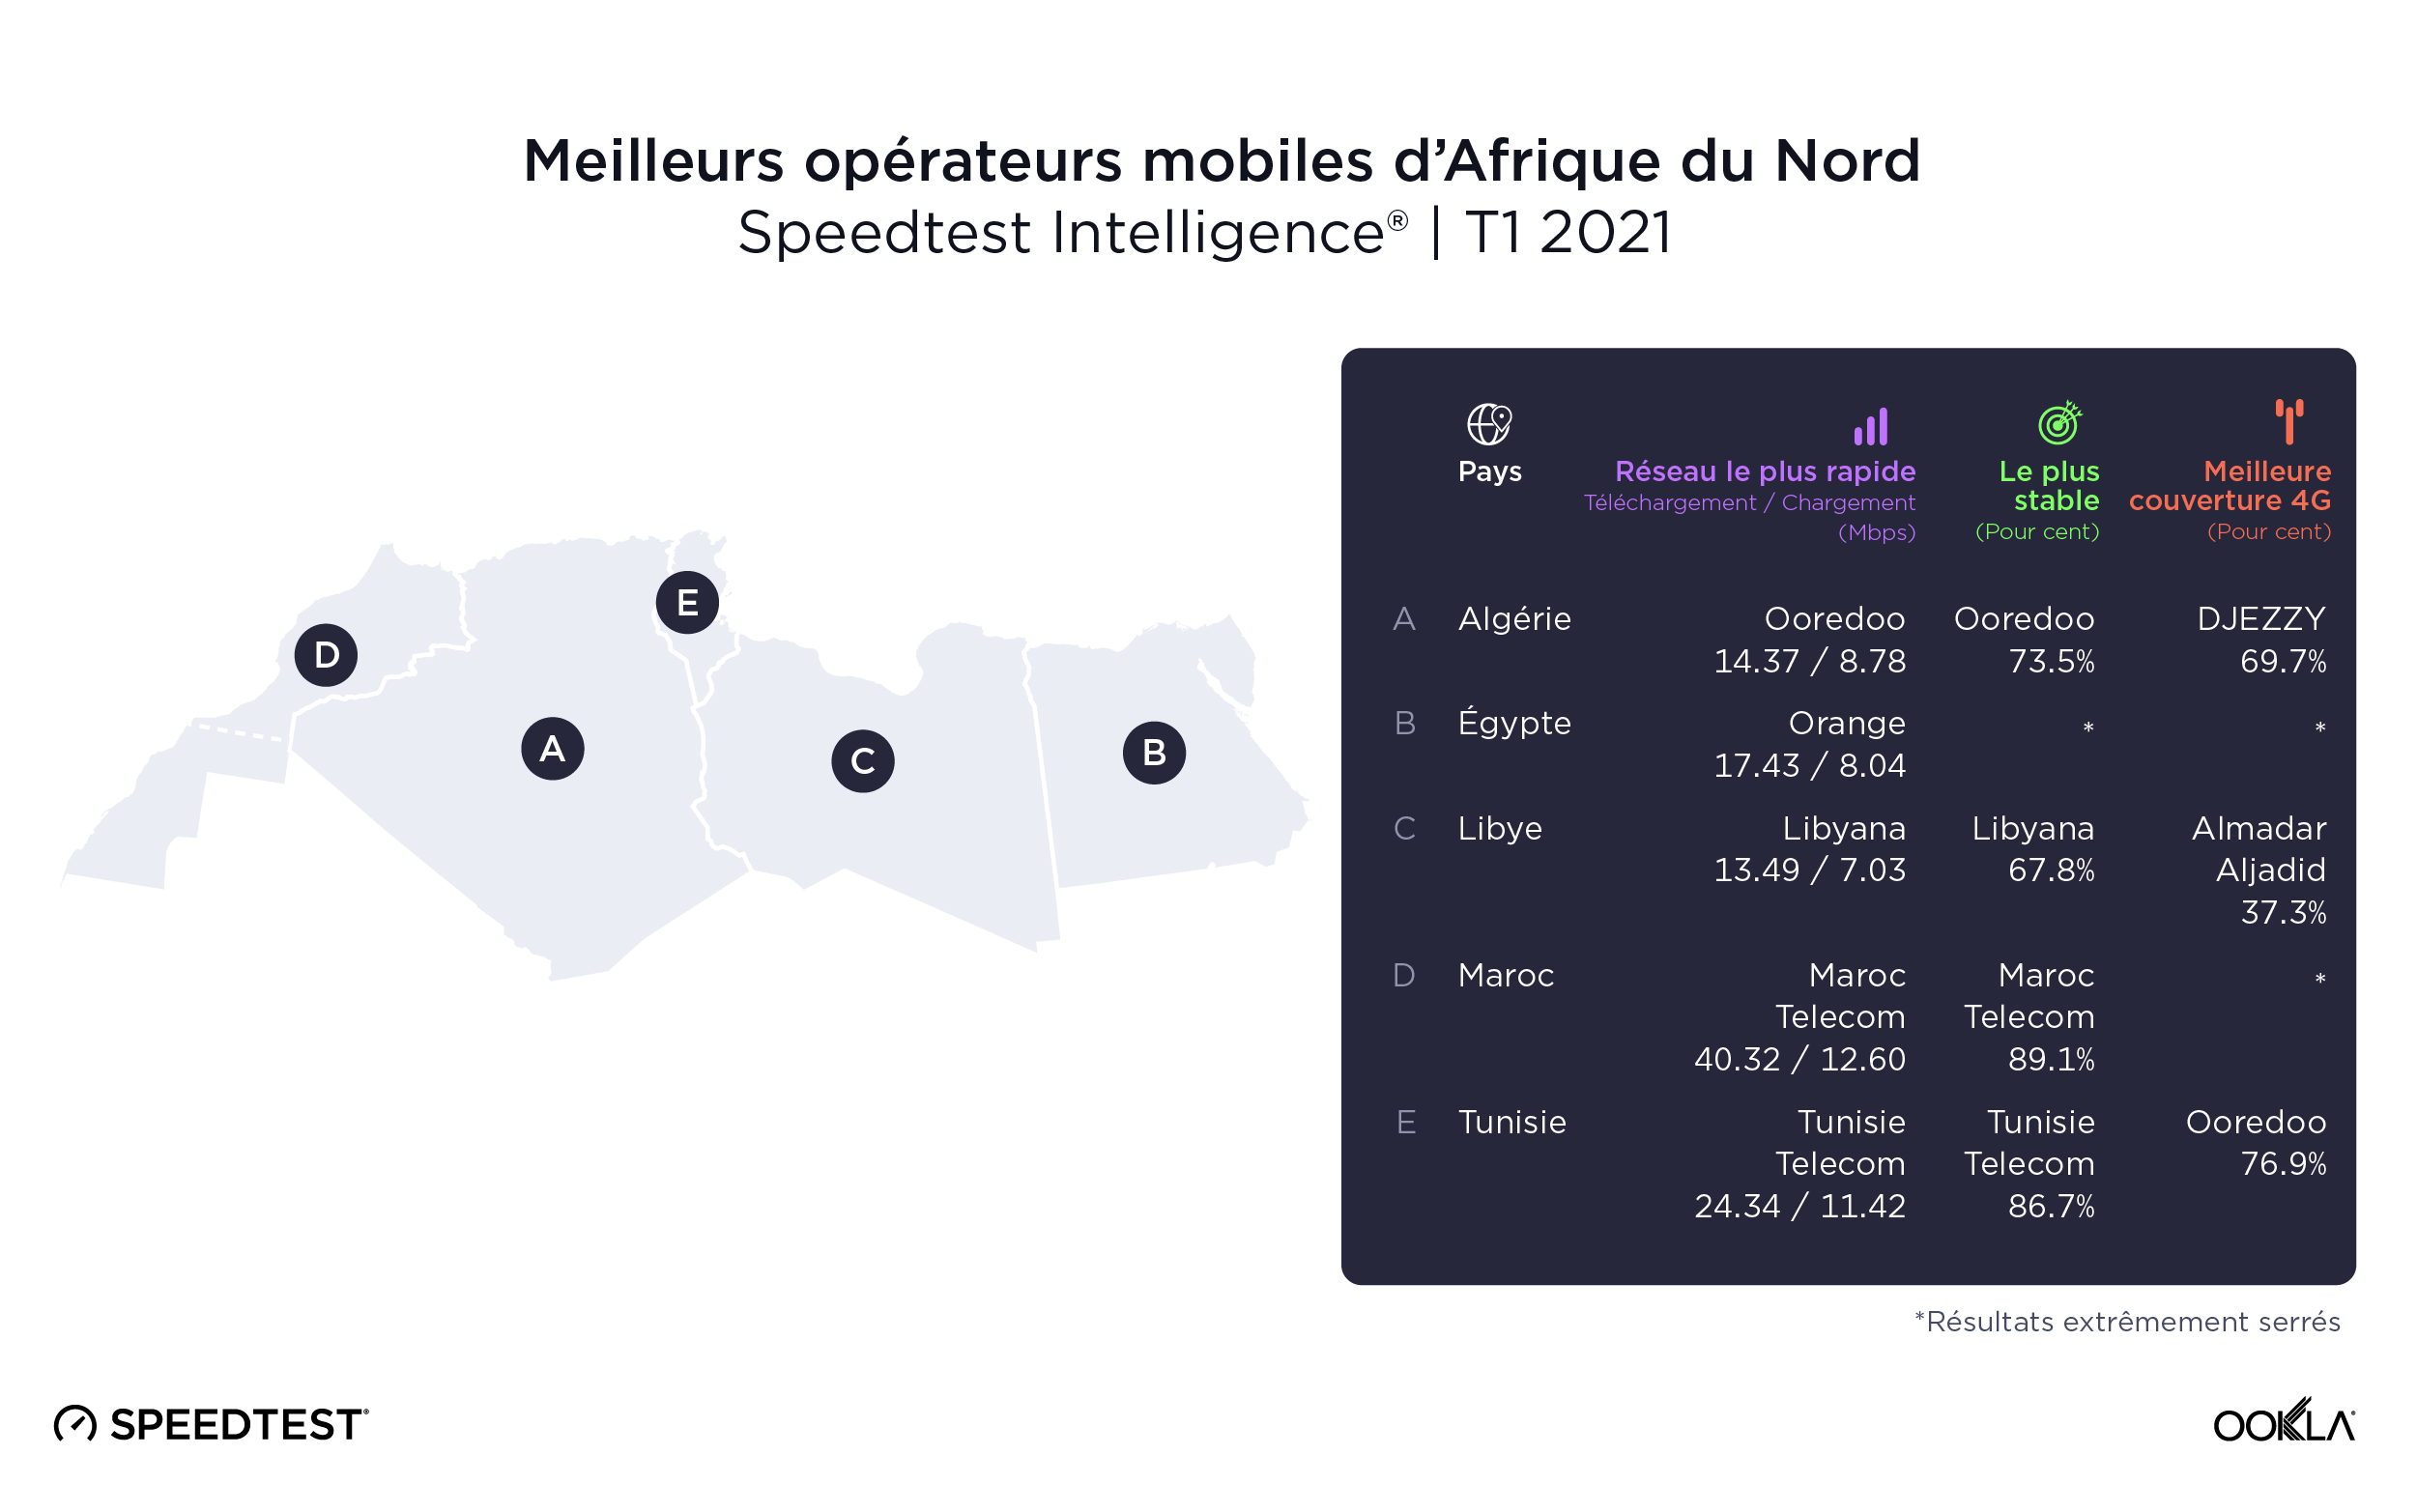
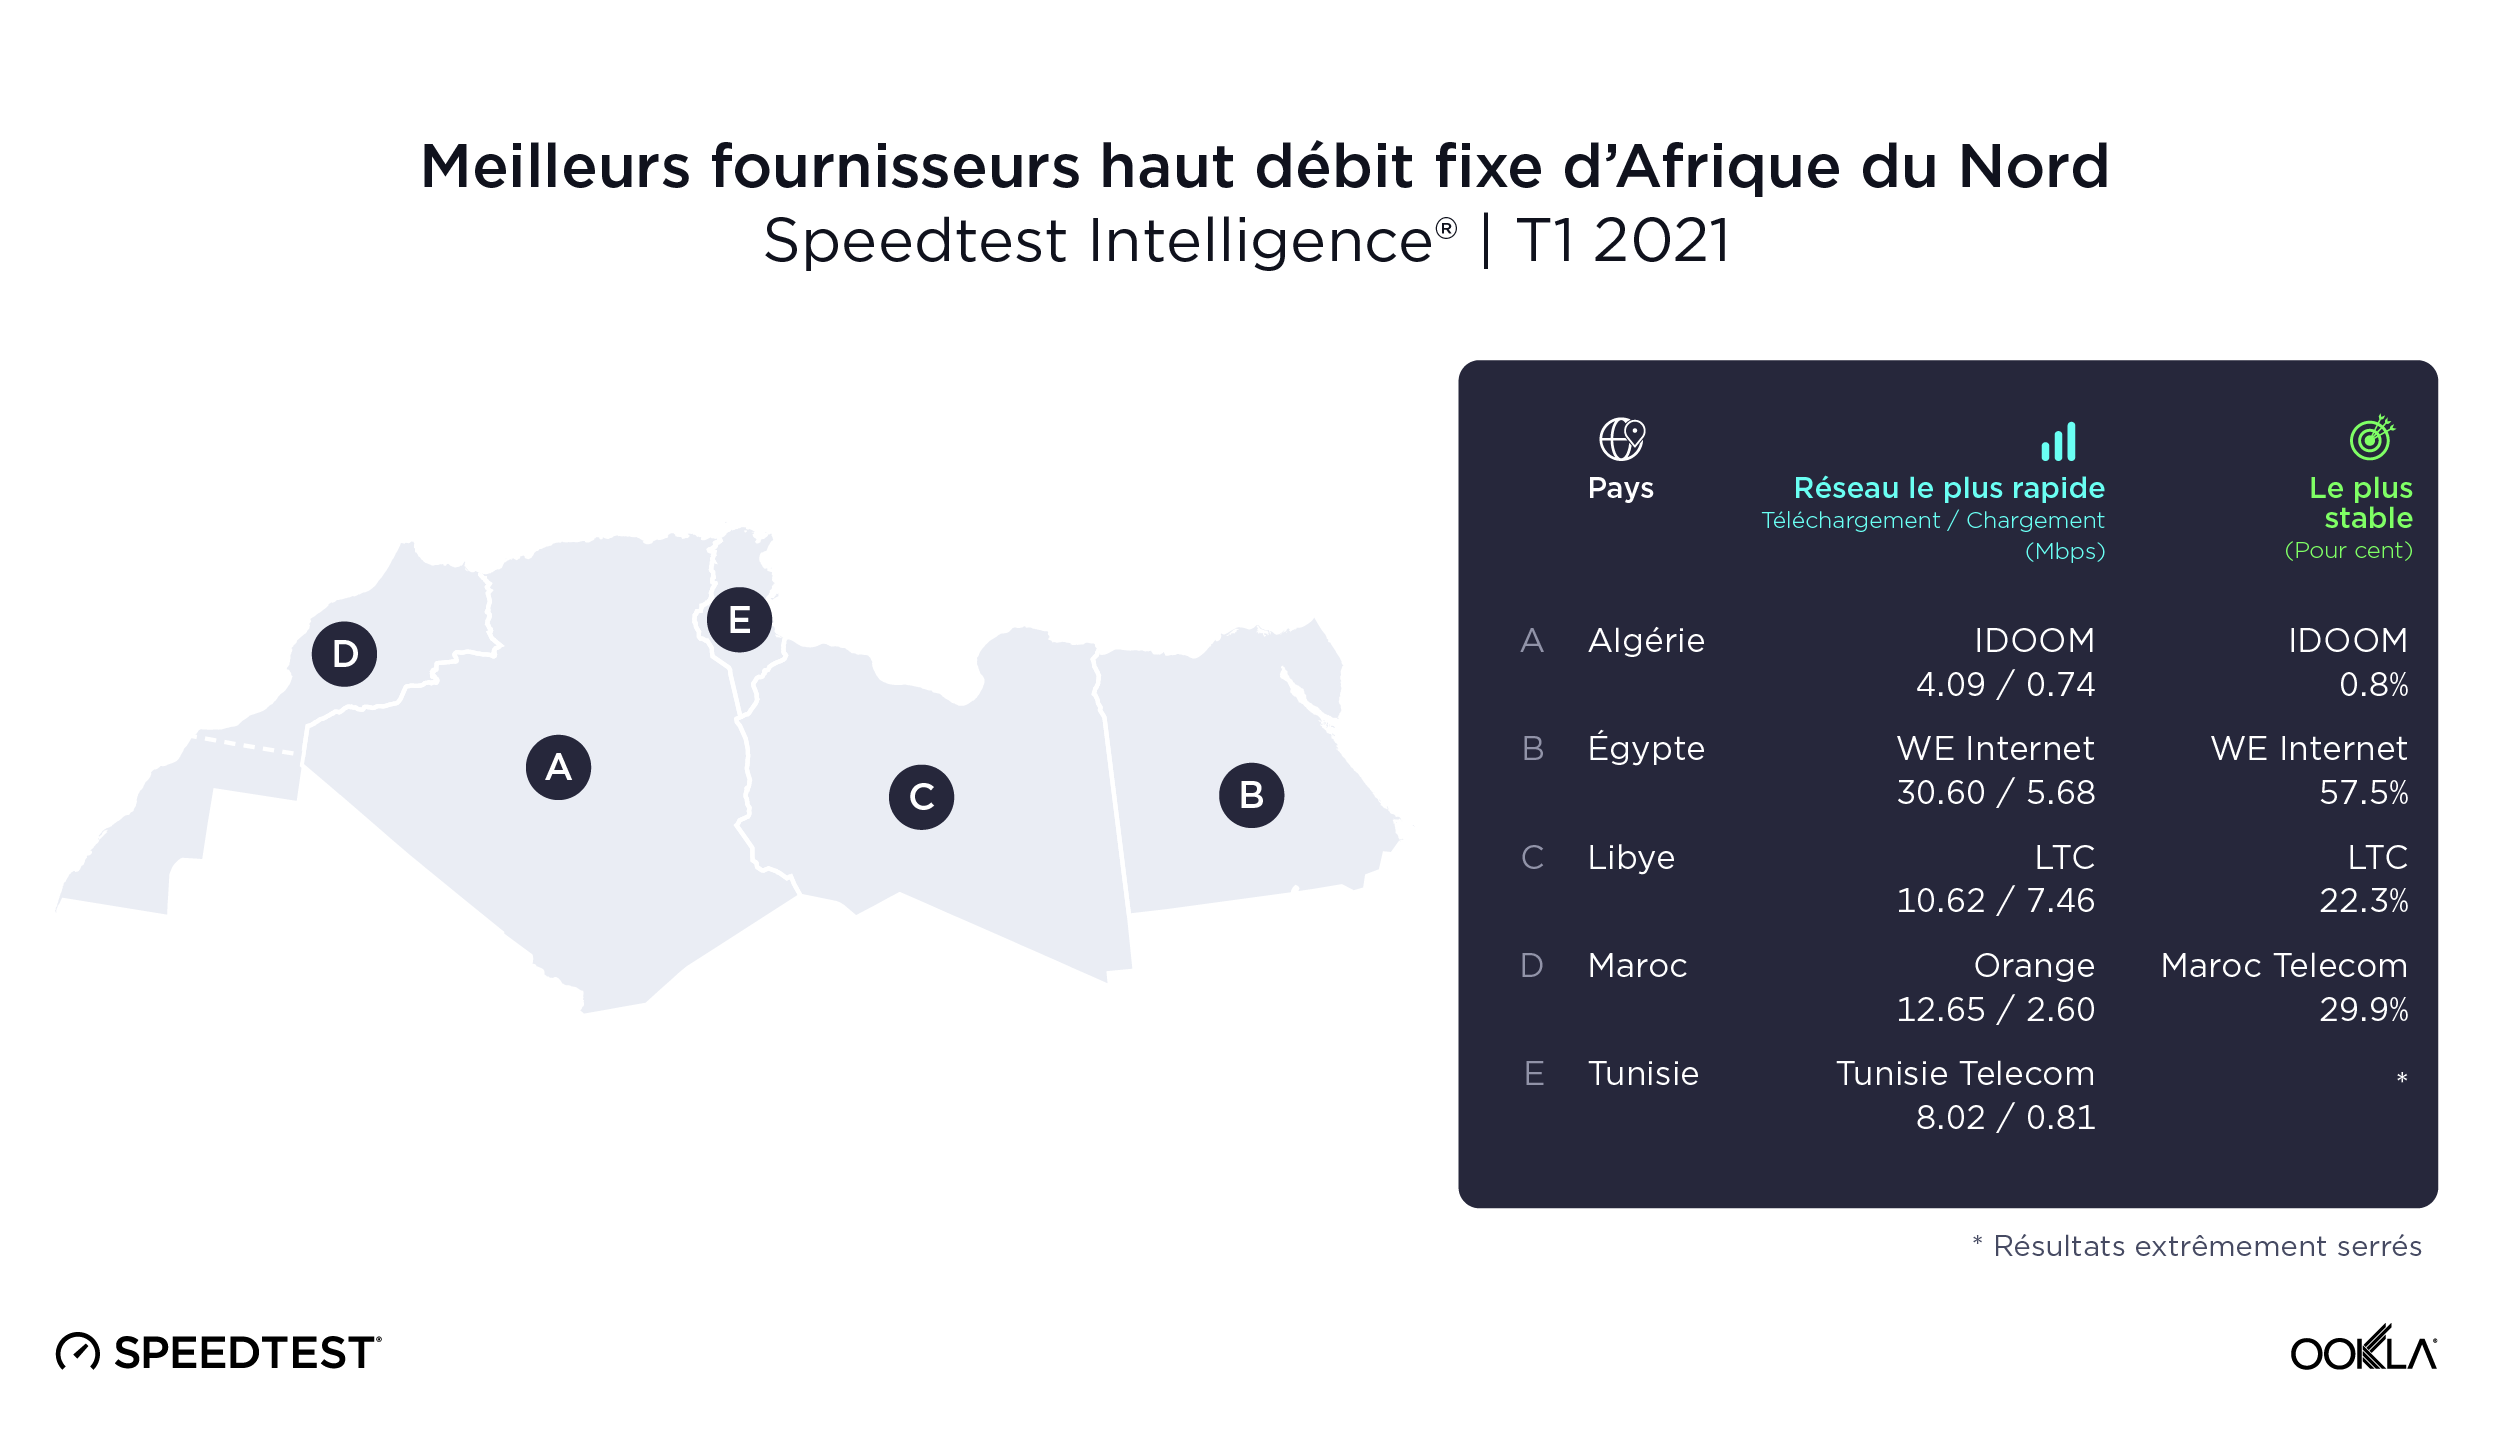
During Q1 2021, North African mobile operators showed a wide range of performance across the region. Morocco’s Maroc Telecom had the fastest median mobile download and upload speeds in North Africa during Q1 2021 at 40.32 Mbps and 12.60 Mbps, respectively. Egypt’s WE Internet had the fastest median download speed over fixed broadband at 30.60 Mbps while Libya’s LTC had the fastest median upload speed at 7.46 Mbps.

Morocco had the best 4G Availability in North Africa during Q1 2021 with all three of its top providers leading the region, including: inwi (78.6%), Maroc Telecom (78.0%) and Orange (77.4%). Outside of Morocco, Tunisia’s Ooredoo had the next best 4G Availability at 76.9%.

Mobile consistency varied widely across North Africa during Q1 2021, with Morocco’s Maroc Telecom showing the best consistency at 89.1%. Tunisia’s Tunisie Telecom had the next best consistency at 86.7%.

Fastest mobile operator in North African countries often showed highest consistency

ookla_mobile_performance_north-africa_map_0521_en

Here’s how mobile in each North African country fared during Q1 2021:

Algeria | Egypt | Libya | Morocco | Tunisia

Algeria

Ooredoo had the fastest median mobile speeds in Algeria during Q1 2021 (14.37 Mbps download // 8.78 Mbps upload). DJEZZY ranked second (8.15 Mbps download // 7.68 Mbps upload) and Mobilis was third (6.46 Mbps download // 6.03 Mbps upload). Ooredoo had the highest mobile Consistency Score (73.5%) followed by DJEZZY in second (55.9%) and Mobilis in third (51.9%). DJEZZY had the best 4G Availability at 69.7%, followed by Ooredoo in second (65.8%) and Mobilis in third (54.5%).

Egypt

During Q1 2021, Orange had the fastest median download and upload speeds over mobile in Egypt at 17.43 Mbps and 8.04 Mbps, respectively. Coming in second fastest, We had a median download speed at 15.56 Mbps (6.95 Mbps upload). Etisalat was third (15.20 Mbps download // 7.28 Mbps upload). Vodafone ranked last among top providers (13.11 Mbps download and 4.67 Mbps upload).

There was no clear statistical winner for mobile consistency in Egypt during Q1 2021: Orange had a Consistency Score of 77.8% and We had 77.7%. Etisalat ranked third at 74.7% while Vodafone came in last at 69.5%. There was also no statistical winner for 4G Availability, though Etisalat achieved 68.3%, Vodafone 67.7% and We 67.4%. Orange showed the lowest 4G Availability at 61.1%.

Libya

During Q1 2021, Libyana had the fastest median download and upload speeds over mobile in Libya at 13.49 Mbps and 7.03 Mbps, respectively, as well as the best mobile consistency with a Consistency Score of 67.8%. Almadar Aljadid came in second for speeds (10.71 Mbps download // 3.62 Mbps upload) and mobile consistency (63.8%). Almadar Aljadid had the best 4G Availability at 37.3% while Libyana showed 30.5%.

Morocco

During Q1 2021, Maroc Telecom had the fastest median mobile download and upload speeds in Morocco, attaining 40.32 Mbps and 12.60 Mbps, respectively. inwi was second (19.00 Mbps download // 7.90 Mbps upload) and Orange was third (15.84 Mbps download // 6.17 Mbps upload).

Maroc Telecom also had the best mobile consistency with a Consistency Score of 89.1%, followed by inwi (74.8%) and Orange (71.0%). There was no statistical winner for best 4G Availability, though inwi achieved 78.6%, Maroc Telecom achieved 78.0% and Orange achieved 77.4% — all of which were some of the best 4G Availability scores in North Africa.

Tunisia

Tunisie Telecom has the fastest median mobile download and upload speeds in Tunisia during Q1 2021 at 24.34 Mbps and 11.42 Mbps, respectively. Ooredoo was second with 22.50 Mbps download and 10.26 Mbps upload. Orange was third with 16.24 Mbps download and 8.25 Mbps upload.

Tunisie Telecom also had the best mobile consistency with a Consistency Score of 86.7%. Ooredoo was second at 83.3% and Orange was third at 78.1%. Ooredoo had the best 4G Availability at 76.9%, while Tunisie Telecom and Orange trailed at 72.4% and 72.3%, respectively.

Fixed broadband in North Africa is slow, but Egyptian providers have the fastest speeds

ookla_fixed_performance_north-africa_map_0521_en

Algeria | Egypt | Libya | Morocco | Tunisia

Algeria

IDOOM — the only fixed broadband provider that meets Ookla’s criteria as a top provider in Algeria in Q1 2021 — had a download speed of 4.09 Mbps (0.74 Mbps upload) and a Consistency Score of 0.8%.

Egypt

During Q1 2021, WE Internet led Egypt and North Africa with the fastest median fixed broadband download speed at 30.60 Mbps (5.68 Mbps upload), and the highest Consistency Score (57.5%). Vodafone was second for speeds (13.16 Mbps download // 1.65 Mbps upload), Orange was third (10.97 Mbps download // 0.82 Mbps upload) and Etisalat was fourth among top providers at 6.70 Mbps download and 0.81 Mbps upload.

Libya

LTC had the fastest median download and upload speeds over fixed broadband in Libya during Q1 2021 at 10.62 Mbps and 7.46 Mbps. LTC also had the highest fixed broadband Consistency Score at 22.3%. Libya Telecom followed at 8.31 Mbps download, 4.02 Mbps upload and a Consistency Score of 18.0%.

Morocco

Orange had the fastest median download speed over fixed broadband in Morocco during Q1 2021 at 12.65 Mbps (2.60 Mbps upload), while inwi had the best median upload speed at 4.18 Mbps (11.33 Mbps download). Maroc Telecom was third for fixed broadband speeds at 9.63 Mbps download and 0.81 Mbps upload. Maroc Telecom had the highest Consistency Score at 29.9%. Orange was second for consistency at 24.7% and inwi was third at 16.9%.

Tunisia

Tunisie Telecom had the fastest median download speed over fixed broadband in Tunisia during Q1 2021 at 8.02 Mbps (0.81 Mbps upload), while Ooredoo had the fastest median upload at 3.91 Mbps (7.03 Mbps download). TOPNET attained 7.12 Mbps download and 0.78 Mbps upload, followed by Orange (6.73 Mbps download // 0.94 Mbps upload) and Gnet (6.59 Mbps download // 0.77 Mbps upload).

There was no clear statistical winner for fixed broadband consistency, with Tunisie Telecom showing a Consistency Score of 10.6% and Ooredoo 10.1%. Orange was third at 4.6%, followed by Gnet (3.7%) and TOPNET (3.4%).

Tunis and Grand Casablanca had the fastest median mobile download speeds in North Africa, Alexandria Governorate had the fastest median fixed broadband speed

ookla_download-speeds_north-africa_map_0521_en

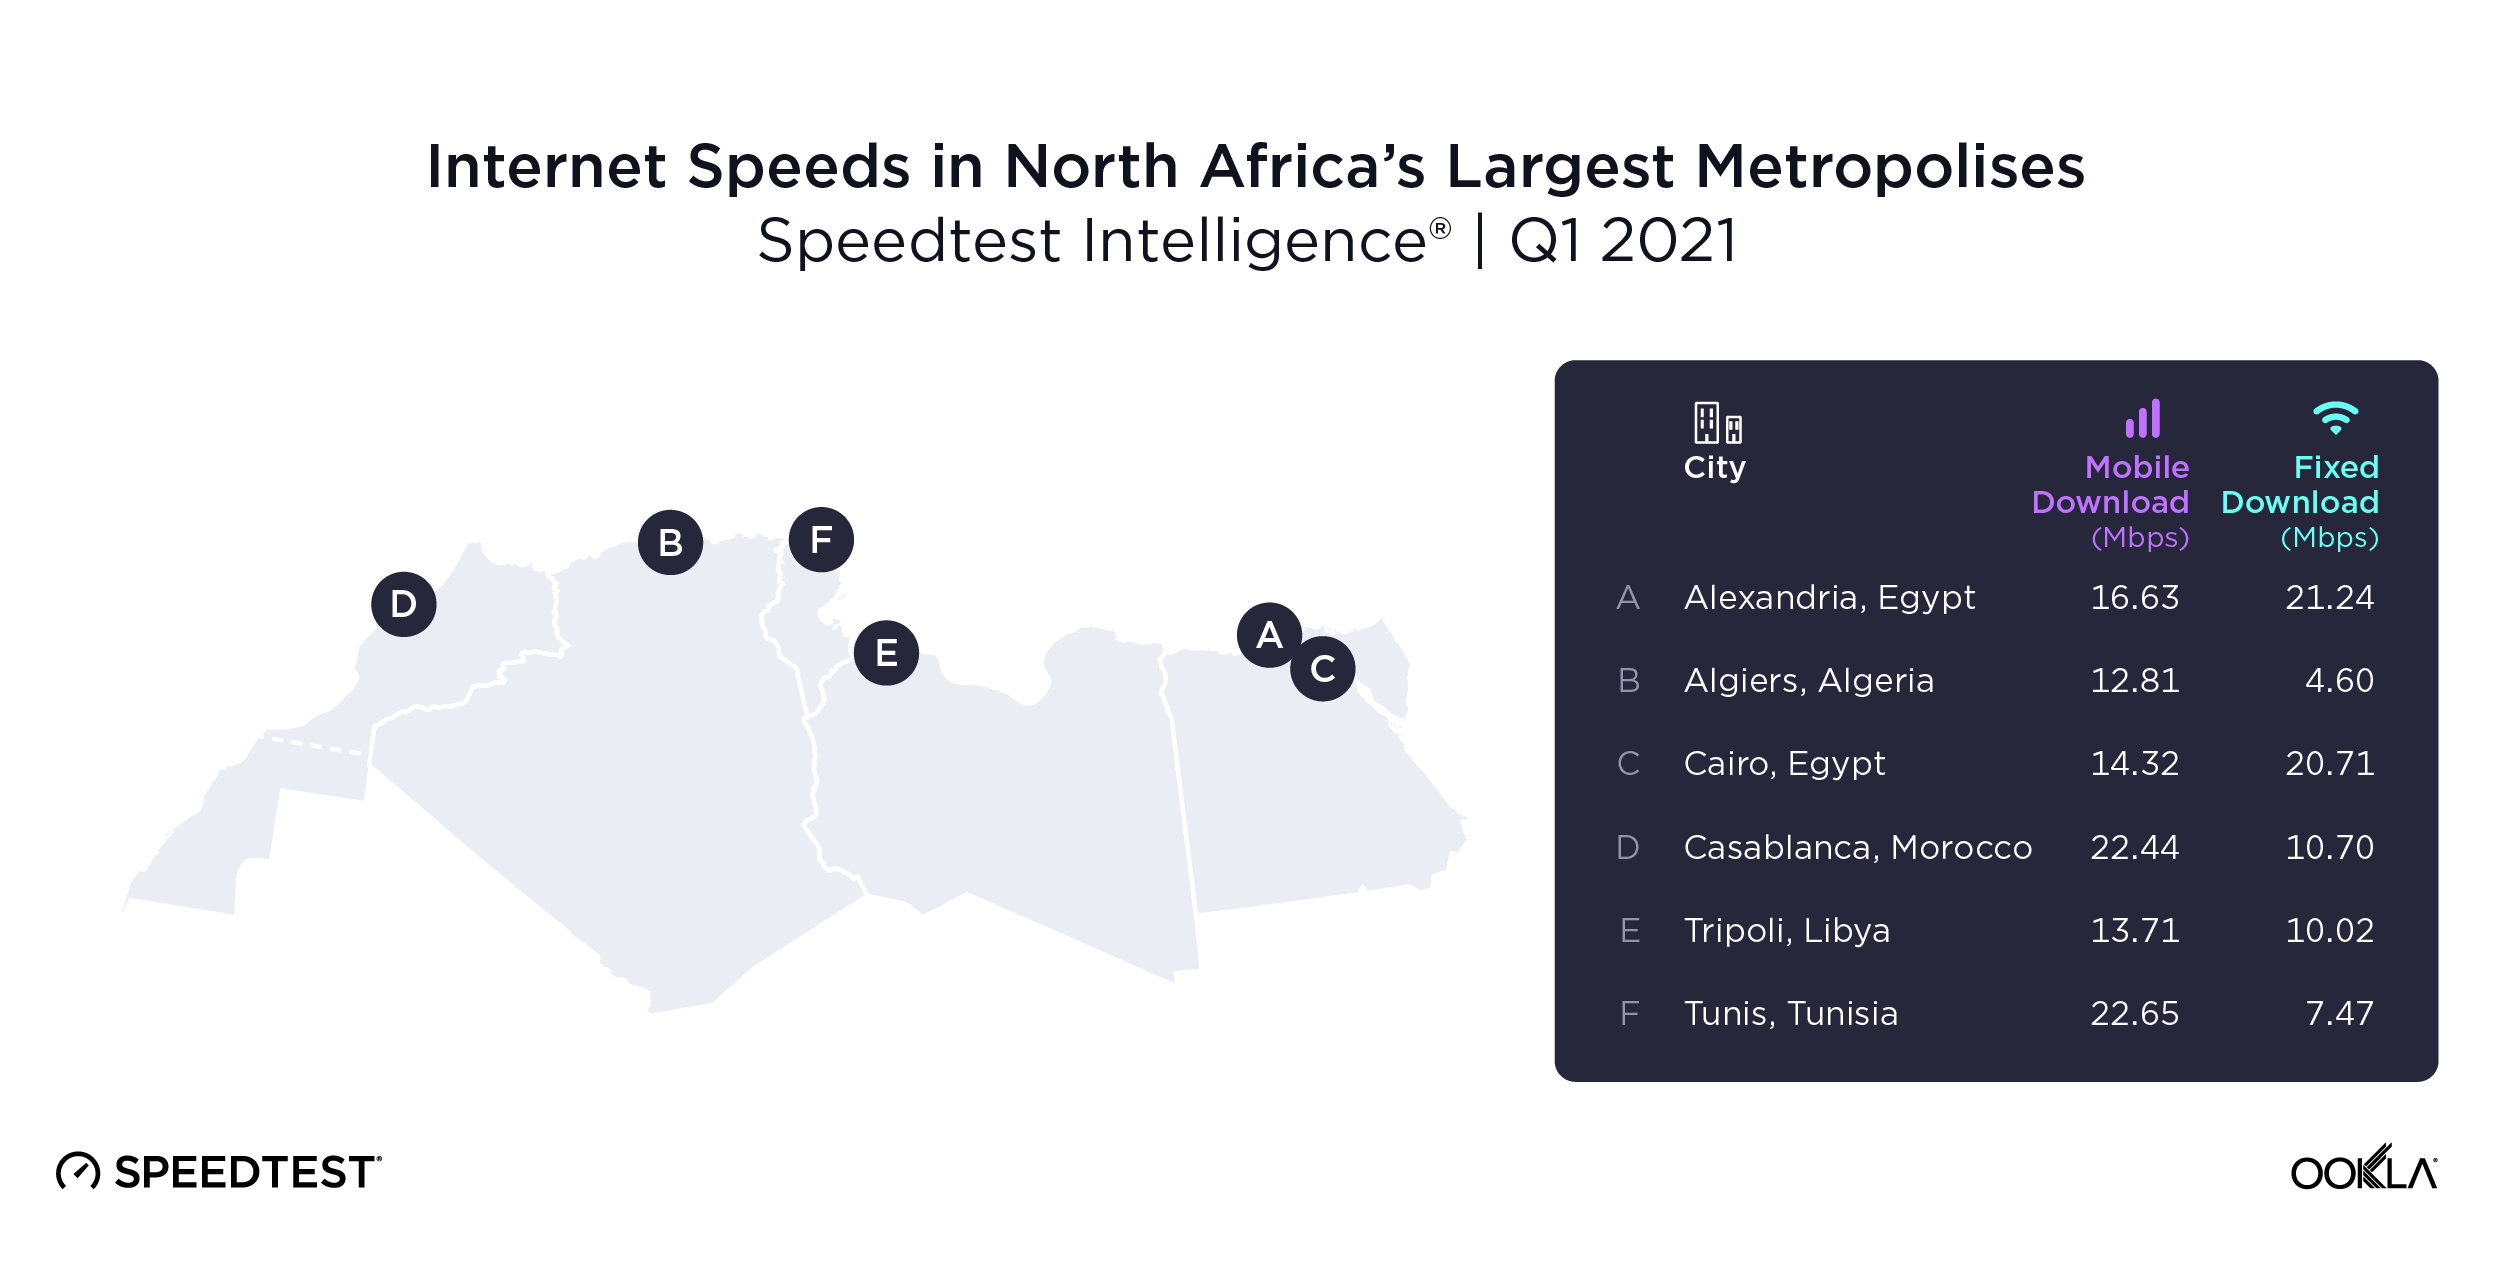
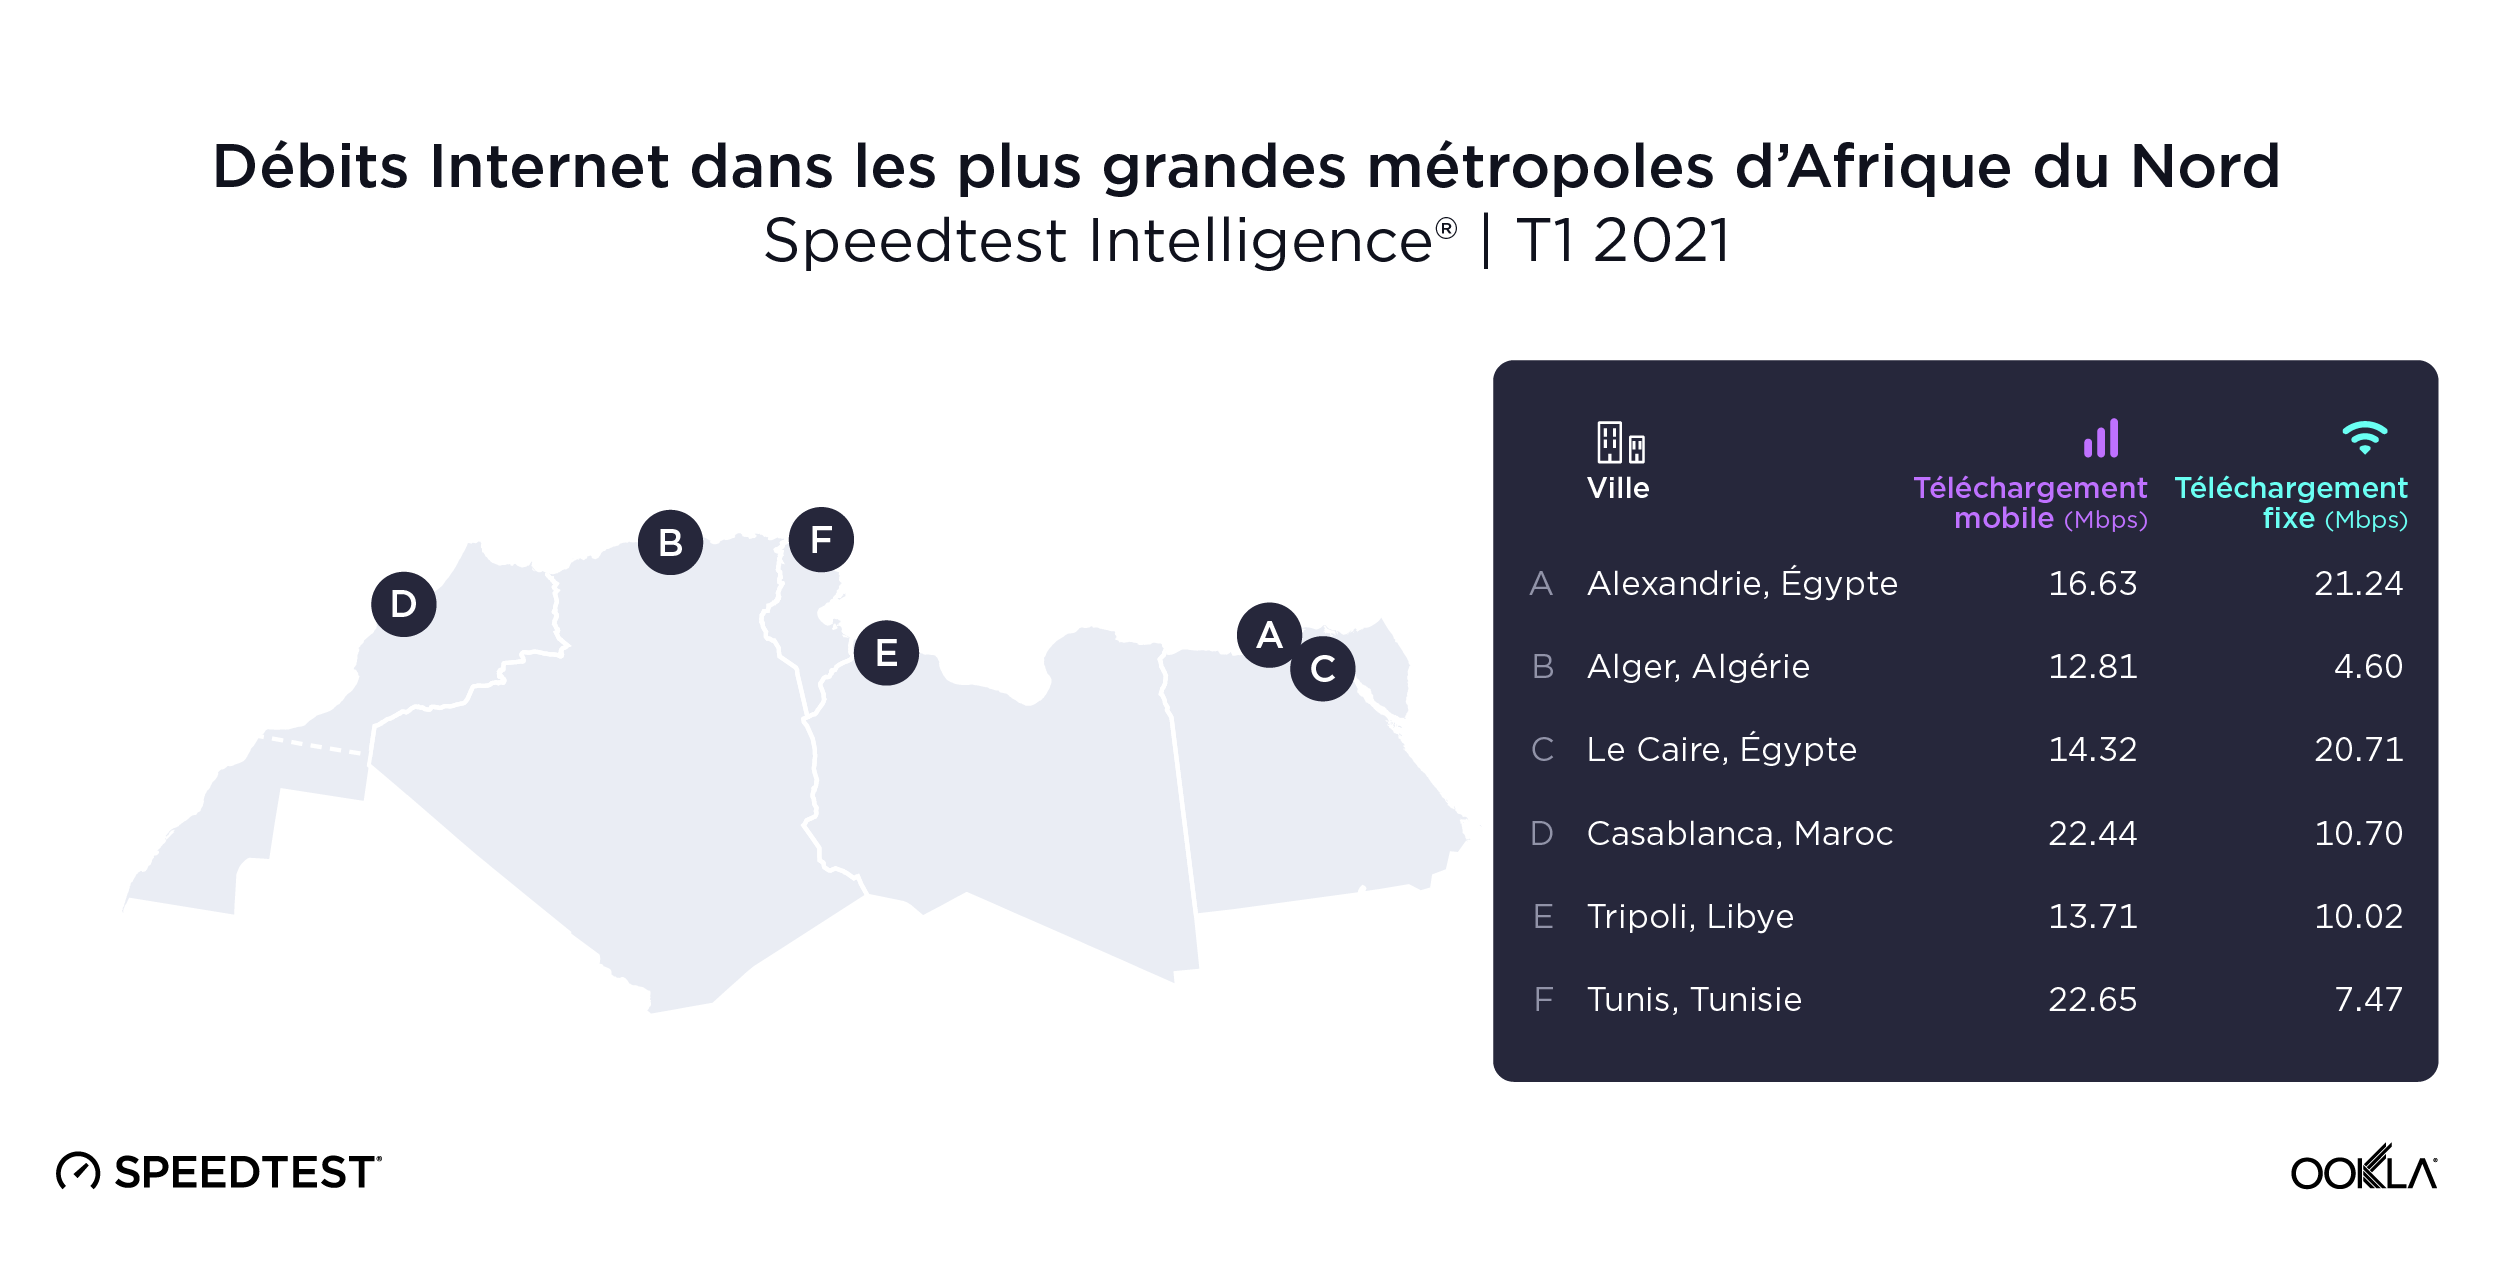
According to Speedtest Intelligence, Tunis, Tunisia and Grand Casablanca, Morocco had the fastest median mobile download speeds among North Africa’s most populous metropolitan areas during Q1 2021 at 22.65 Mbps and 22.44 Mbps, respectively. Alexandria Governorate, Egypt was third at 16.63 Mbps, followed by Cairo Governorate, Egypt (14.32 Mbps), Tripoli, Libya (13.71 Mbps) and Algiers, Algeria (12.81 Mbps).

Alexandria Governorate had the fastest median download speed over fixed broadband at 21.24 Mbps. Cairo Governorate was second at 20.71 Mbps, Grand Casablanca third (10.70 Mbps), Tripoli fourth (10.02 Mbps), Tunis fifth (7.47 Mbps) and Algiers sixth (4.60 Mbps).

Cell Analytics paints a fascinating picture of North Africa cities

Ookla’s Cell Analytics, is an invaluable tool to identify intelligence about wireless service quality, RF measurements (signal strength), data usage, user density (indoors and outdoors) and cell site locations for a given area. Cell Analytics can help mobile network operators improve their network and identify areas that need improvement with granular precision.

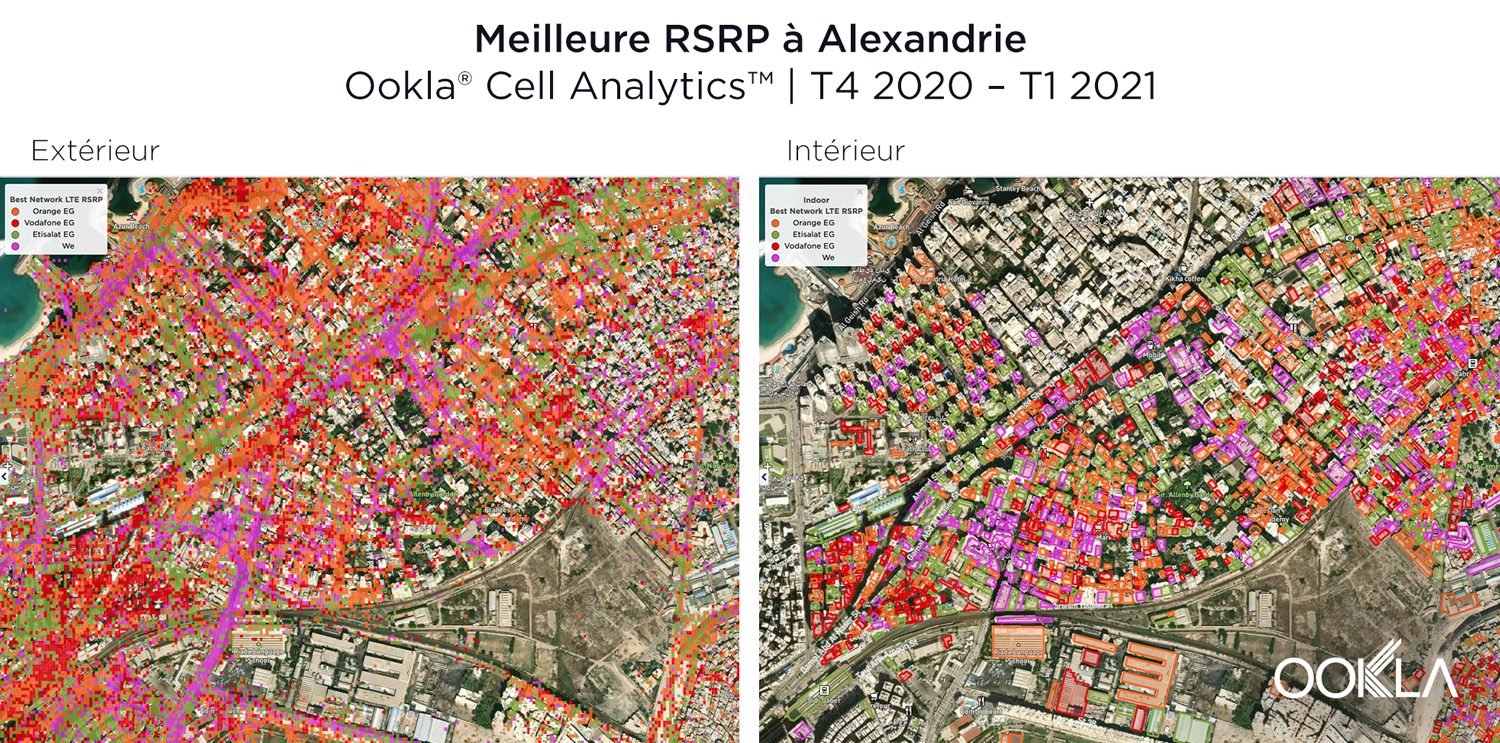
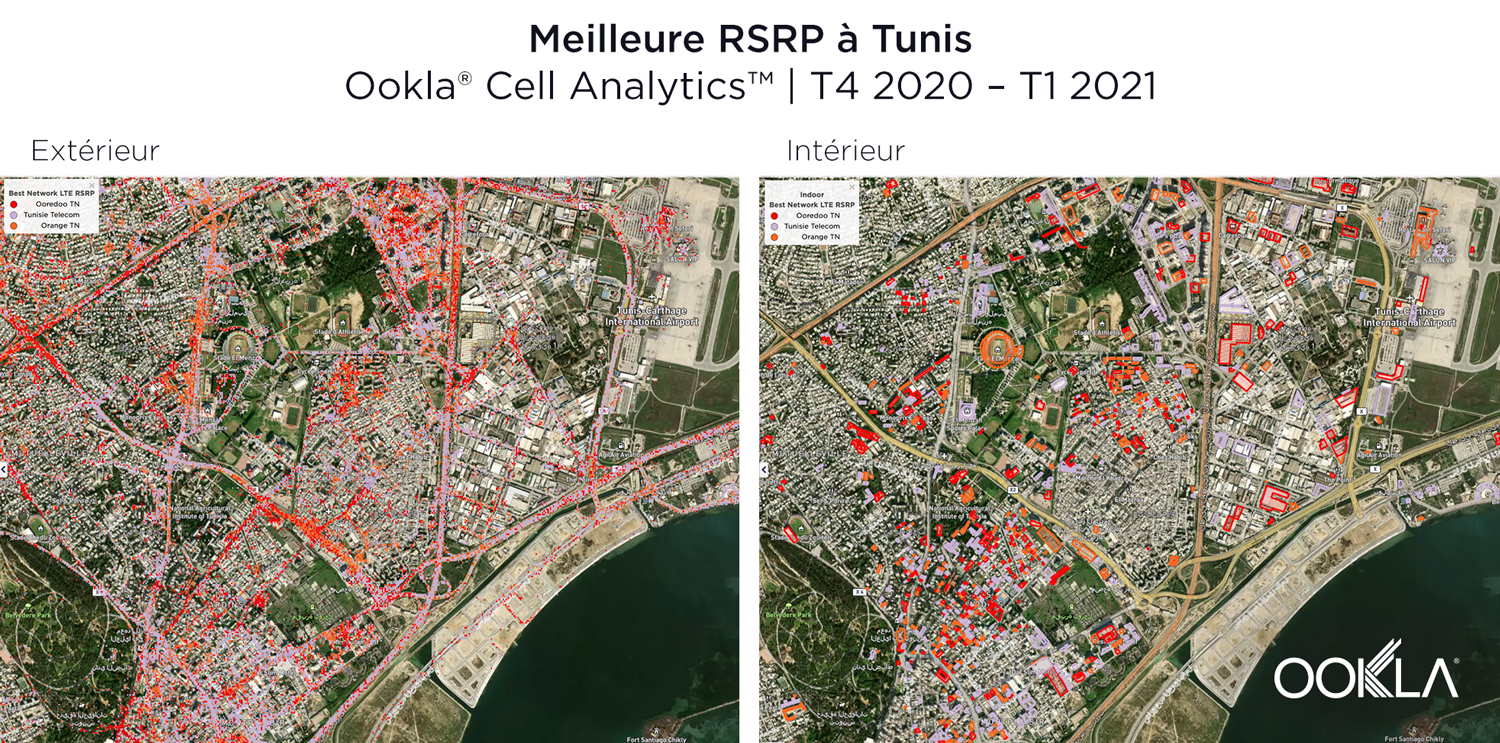
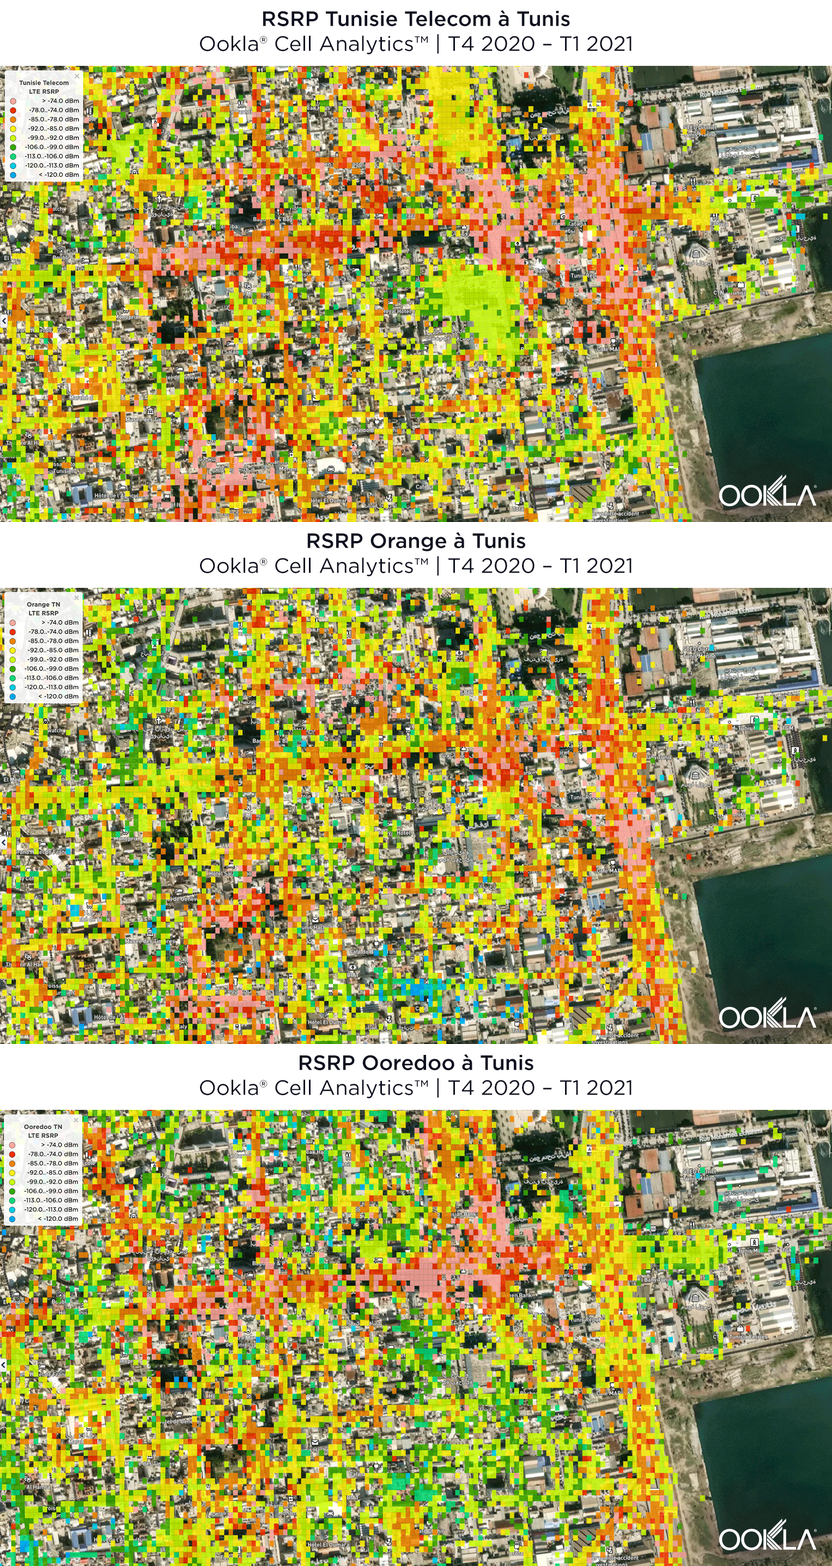
The maps below use Cell Analytics data from Q4 2020 to Q1 2021 to identify two items of interest in major North African cities: best provider for indoor and outdoor 4G LTE RSRP signal strength in a given area, and provider-level 4G LTE RSRP signal strength around key areas of interest. For indoor and outdoor 4G LTE RSRP maps, Cell Analytics identifies the best mobile network provider for a given area or building by color if there is a statistically significant winner. Provider-level maps show the performance of individual providers for a given area, with pink and red colors showing a strong signal and blue colors indicating a weak signal.

Scroll down for Cell Analytics maps of major North African cities or click on a city below:

Alexandria | Algiers | Cairo | Casablanca | Tripoli | Tunis

Alexandria

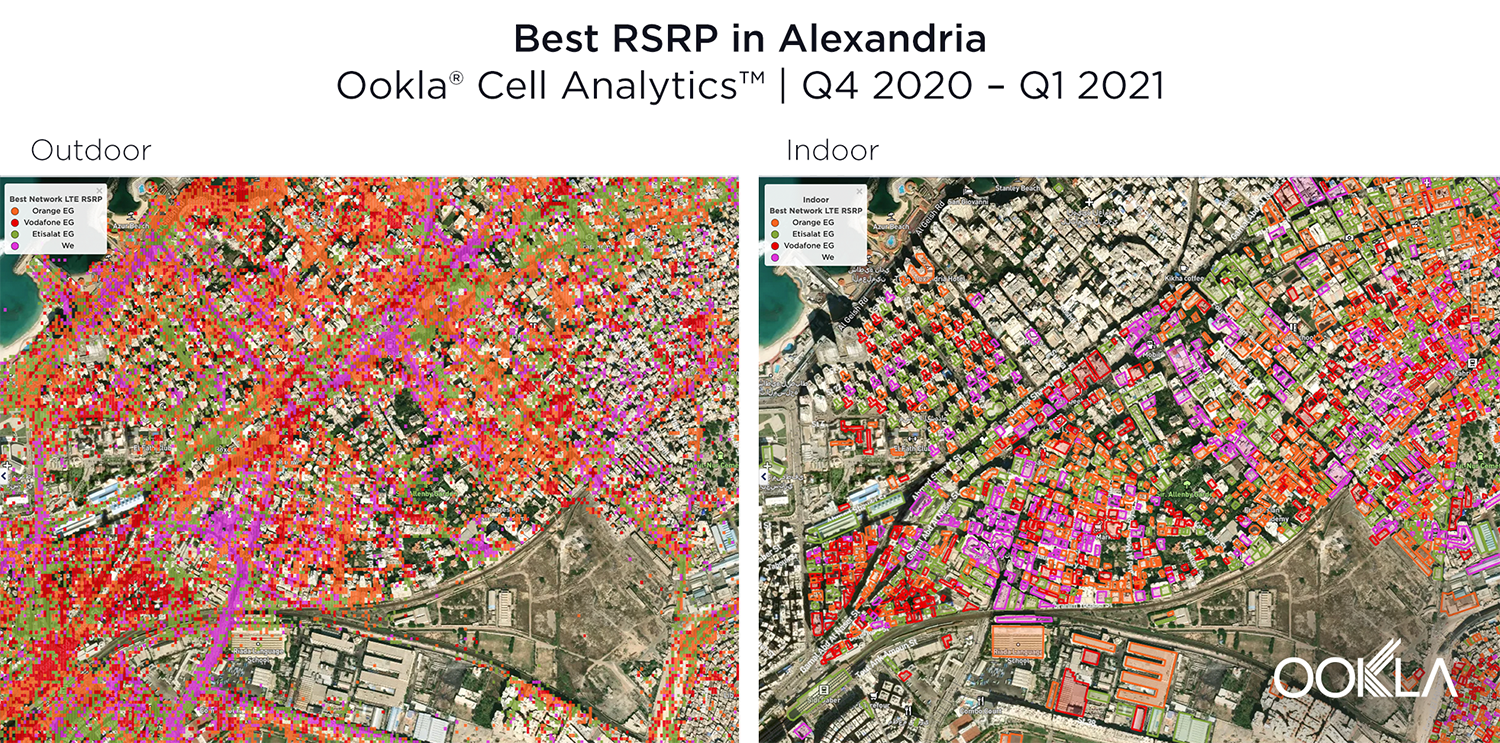
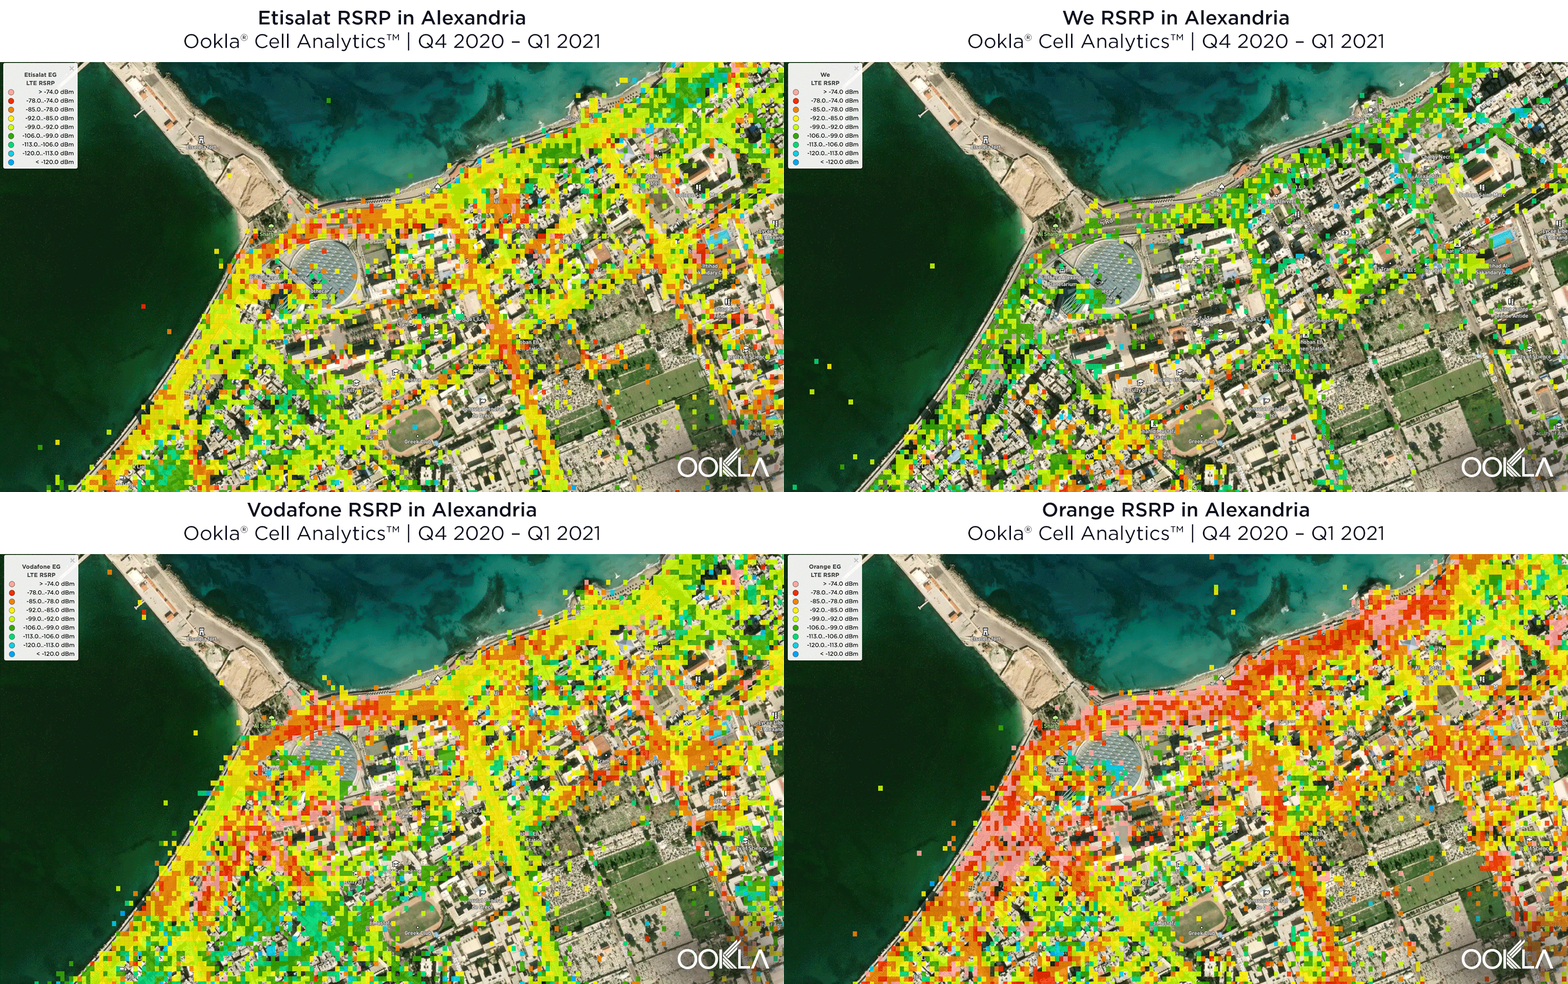
The Library of Alexandria has been lost to time but Bibliotheca Alexandrina stands as a testament to what the world has lost and as a major cultural center for Egypt. In the bustling metropolis, the 4G LTE RSRP maps below paint two different stories: the best mobile outdoor network signal strength and the best indoor network signal strength in Alexandria during Q4 2020 to Q1 2021. It’s clear that different providers provide the strongest cell signal in different parts of the city and that some buildings are better served than others.

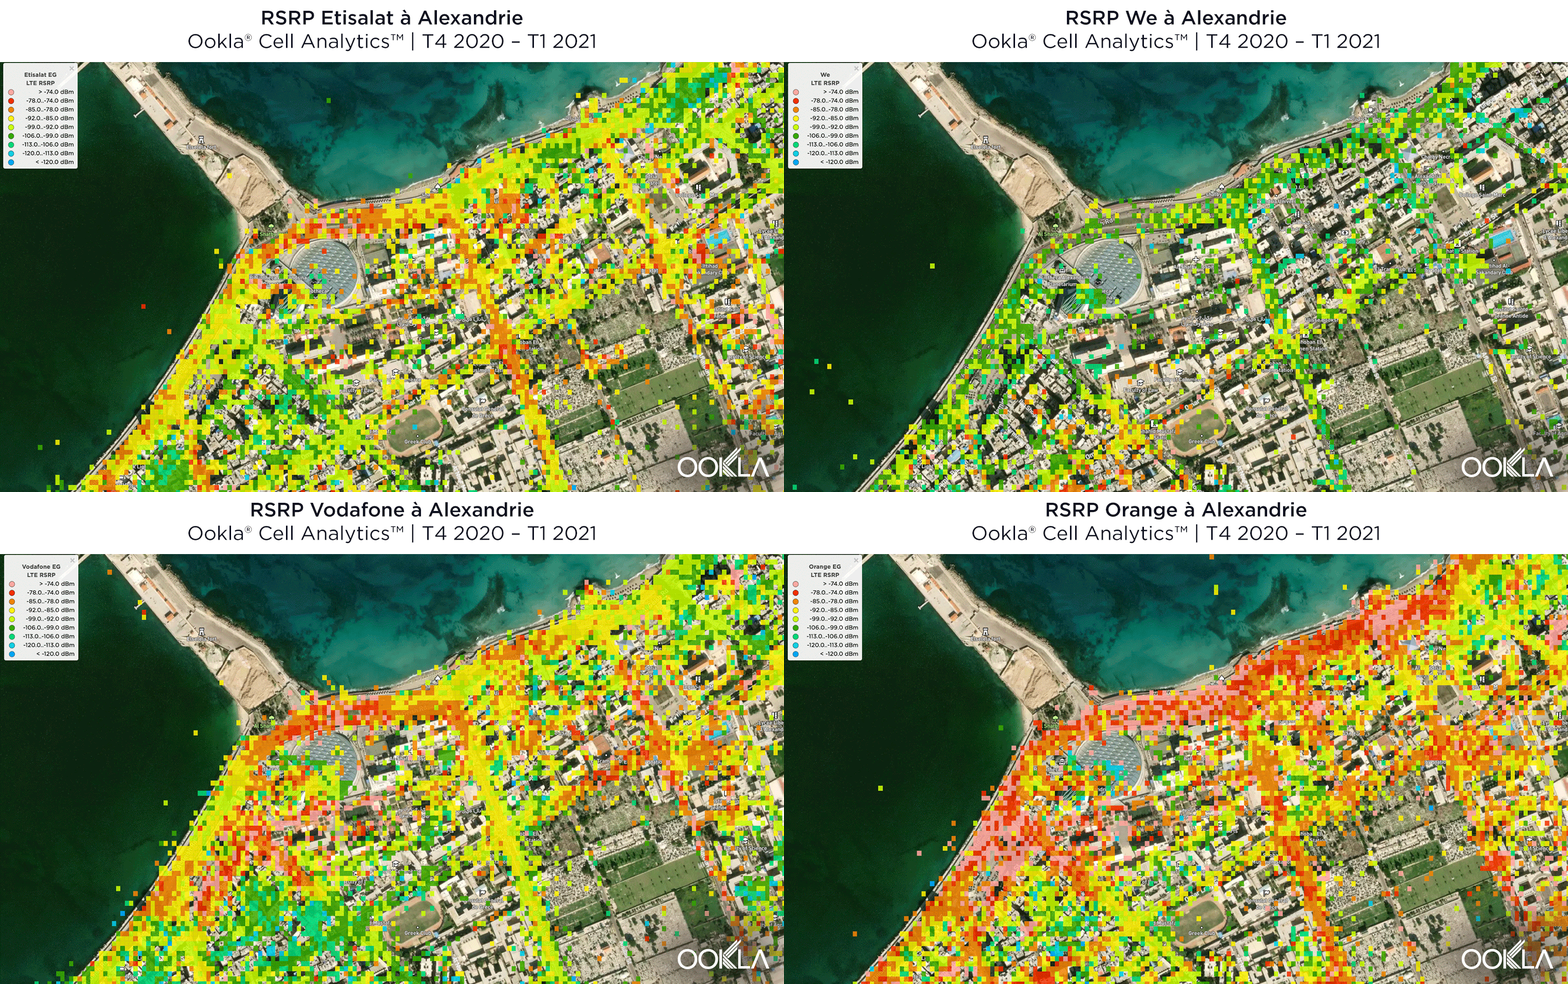
While it’s good to know where the best provider is in the places you frequent, Ookla Cell Analytics can also map 4G LTE RSRP (signal strength) results from each provider, shown below. The red areas show strong signals, while the blue areas show weak signals.

cell-analytics_alexandria_outdoor_indoor_0521_en

cell-analytics_rsrp_alexandria_0521_en-1

Algiers

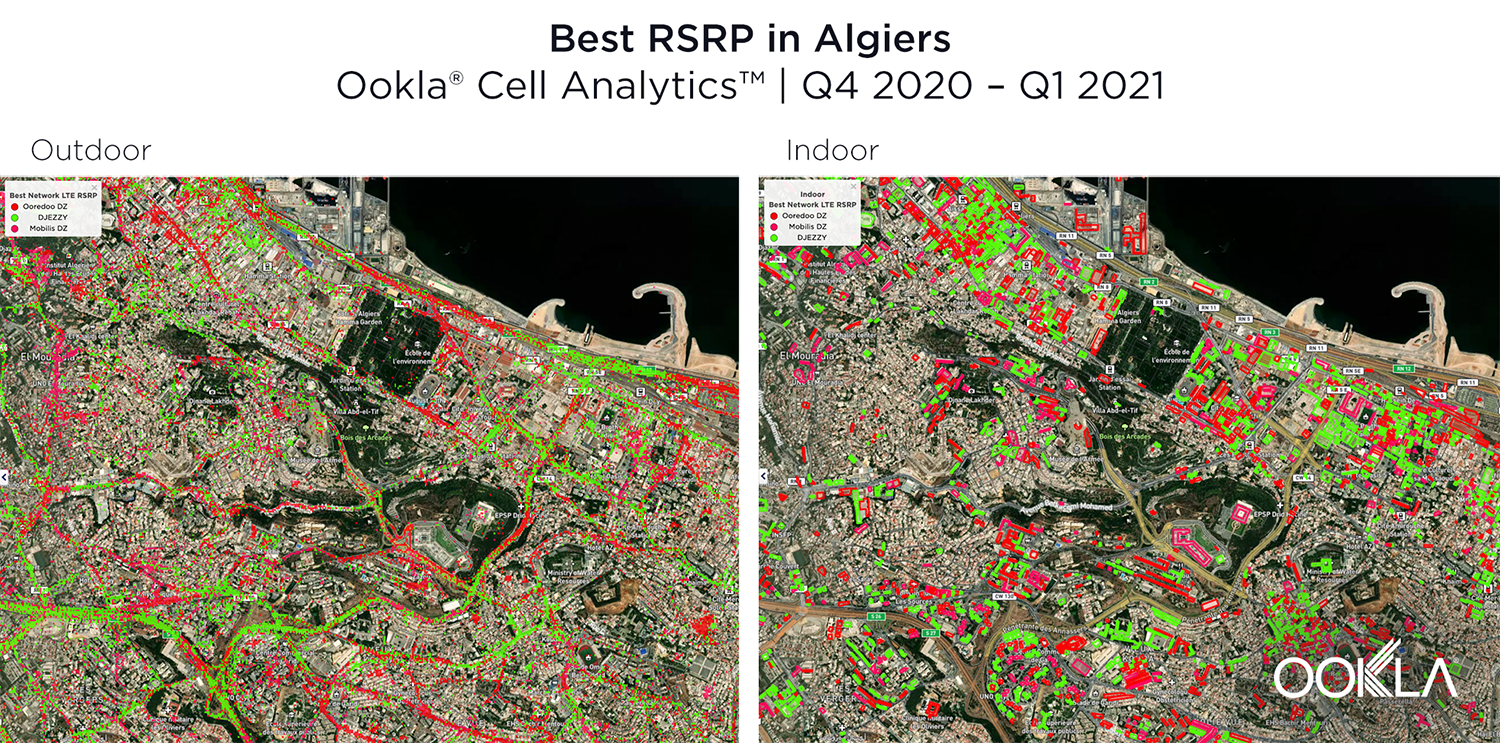
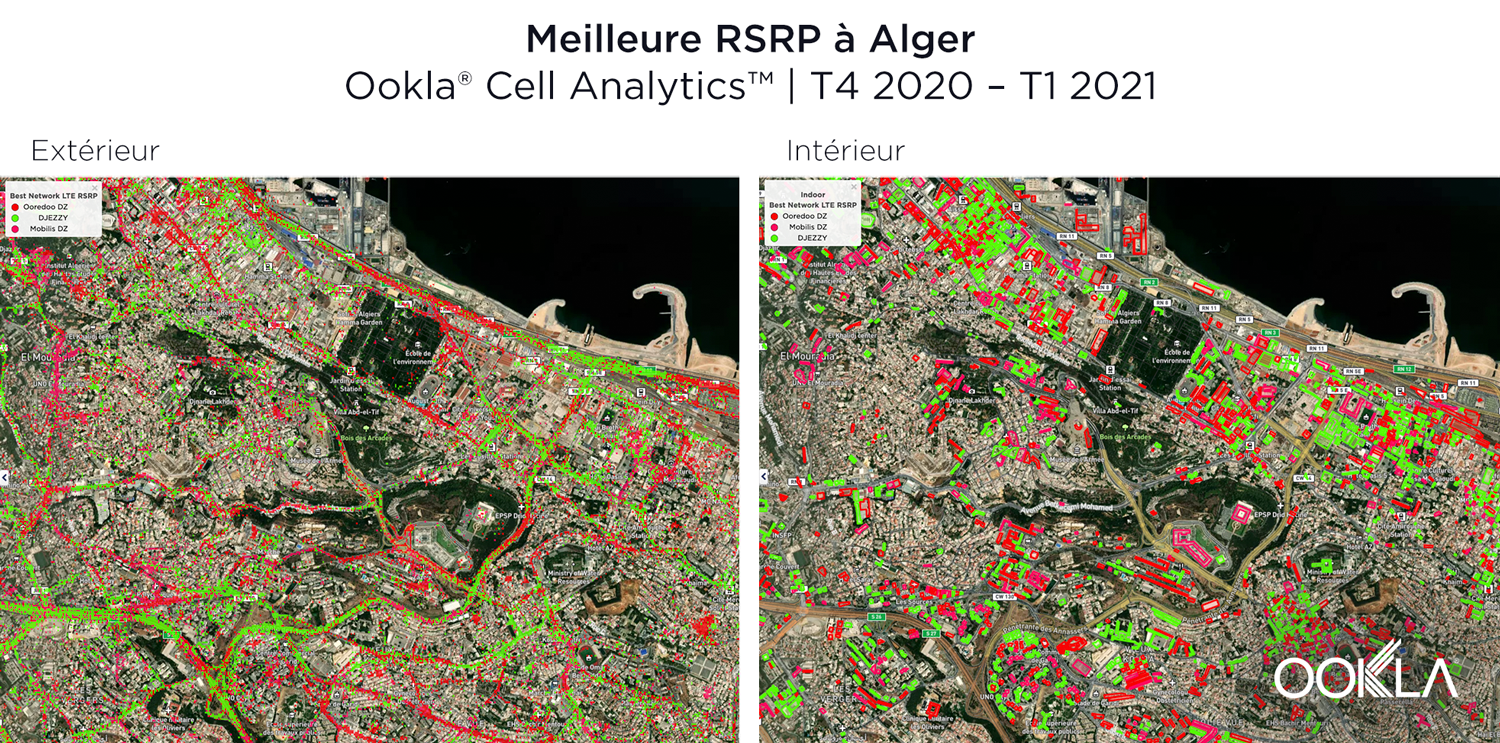
Algiers’ Botanical Garden Hamma is a vibrant green space in a thriving city. It’s also a good geographic point to test mobile performance. The first two maps below show the best network providers for outdoor (left) and indoor (right) 4G LTE RSRP signal strength in the area.

The next three maps show individual providers’ 4G LTE RSRP signal strength, with red being the strongest signals and blue being the weakest signals.

cell-analytics_algiers_best_rsrp_0521_en

cell-analytics_rsrp_algiers_0521_en-1

Cairo

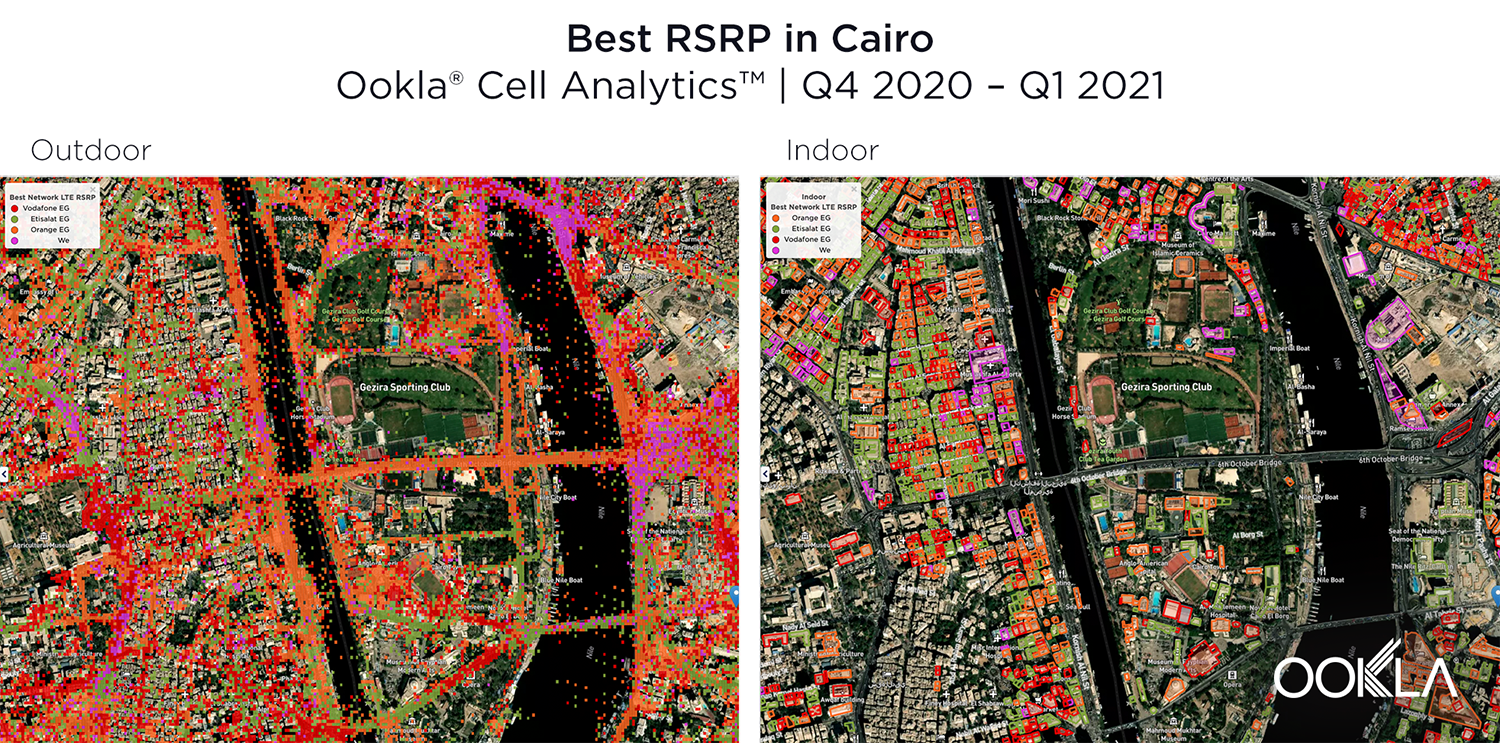
Located in the heart of Cairo, the Gezira Sporting Club offers an island view of the bustling city. The following maps show the best network providers for outdoor (left) and indoor (right) 4G LTE RSRP signal strength in the area:

cell-analytics_cairo_best_rsrp_0521_en
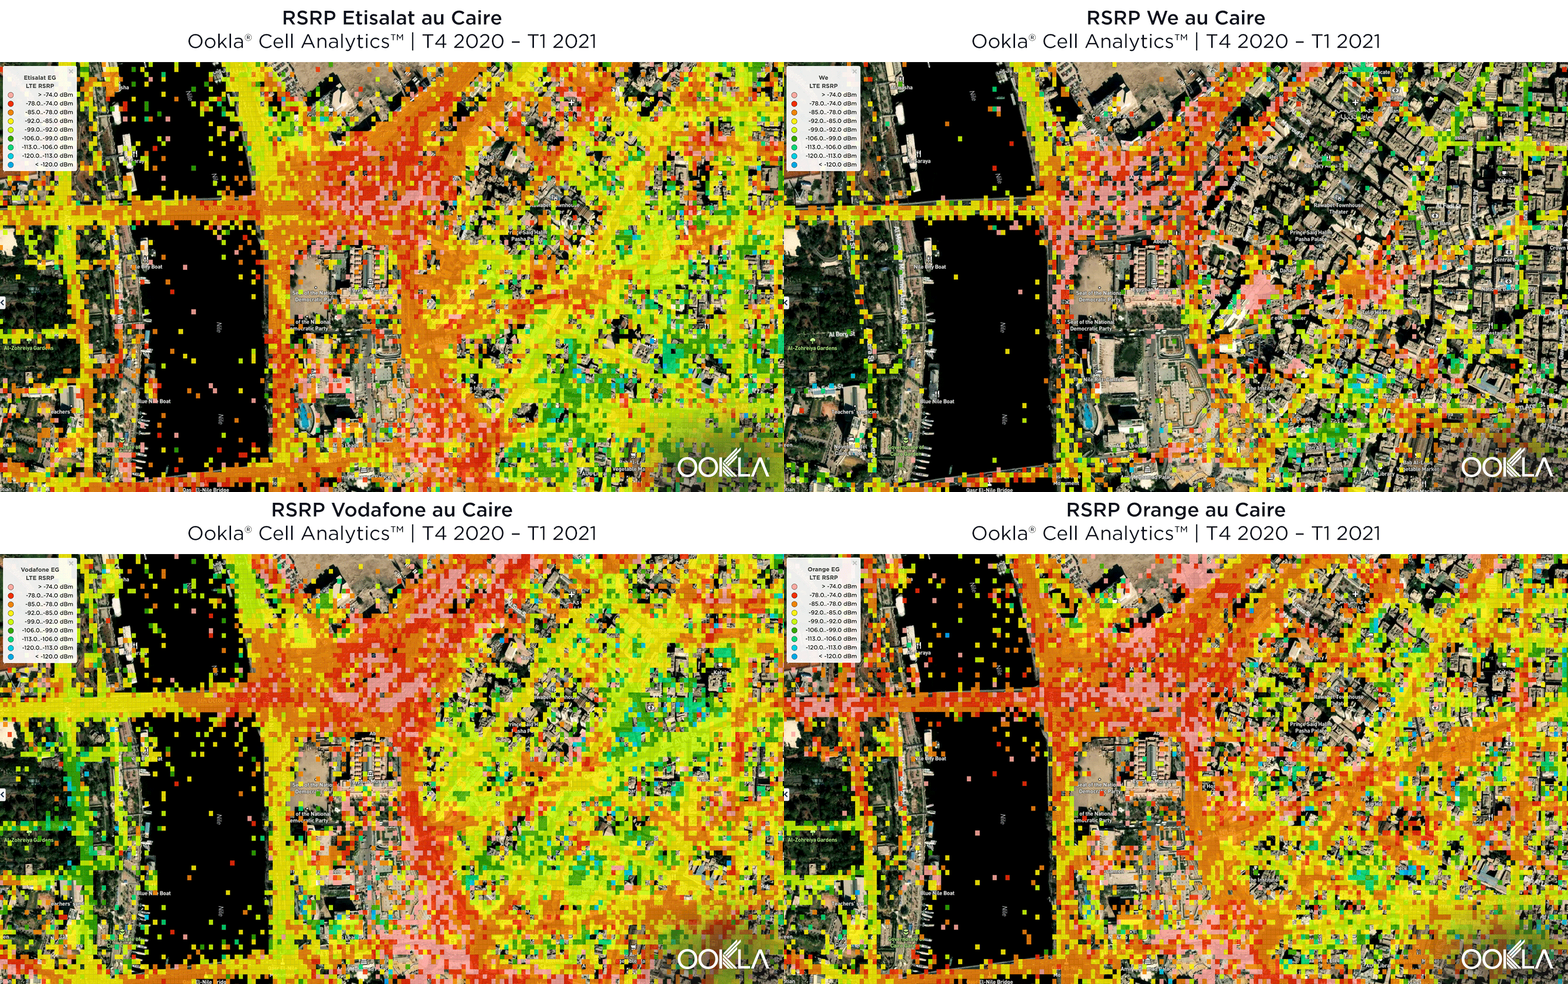
Across the river just to the east of Gezira Sporting Club lies the world famous Egyptian Museum. With mobile service at a premium in the busy area, Cell Analytics shows the 4G LTE RSRP signal strength for top providers. The following maps show red areas where the signal is strongest to blue areas where the signal is weakest.

cell-analytics_rsrp_cairo_0521_en-1

Casablanca

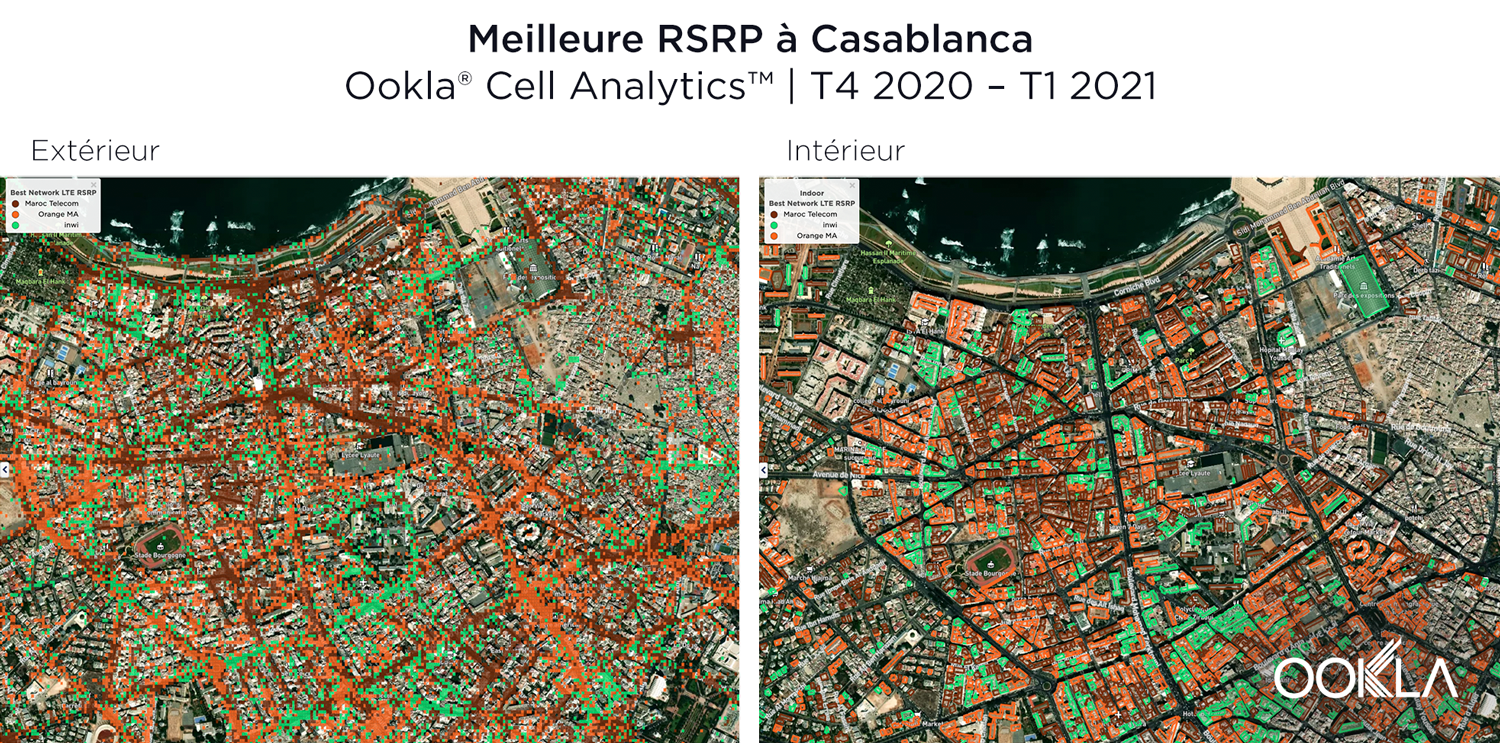
The Hassan II Mosque located near Casablanca’s northern coast is a major tourist hub, which makes it a prime location for strong mobile performance. The two maps below show the best 4G LTE RSRP signal strengths by top providers for outdoor and indoor areas:

cell-analytics_casablanca_best_rsrp_0521_en

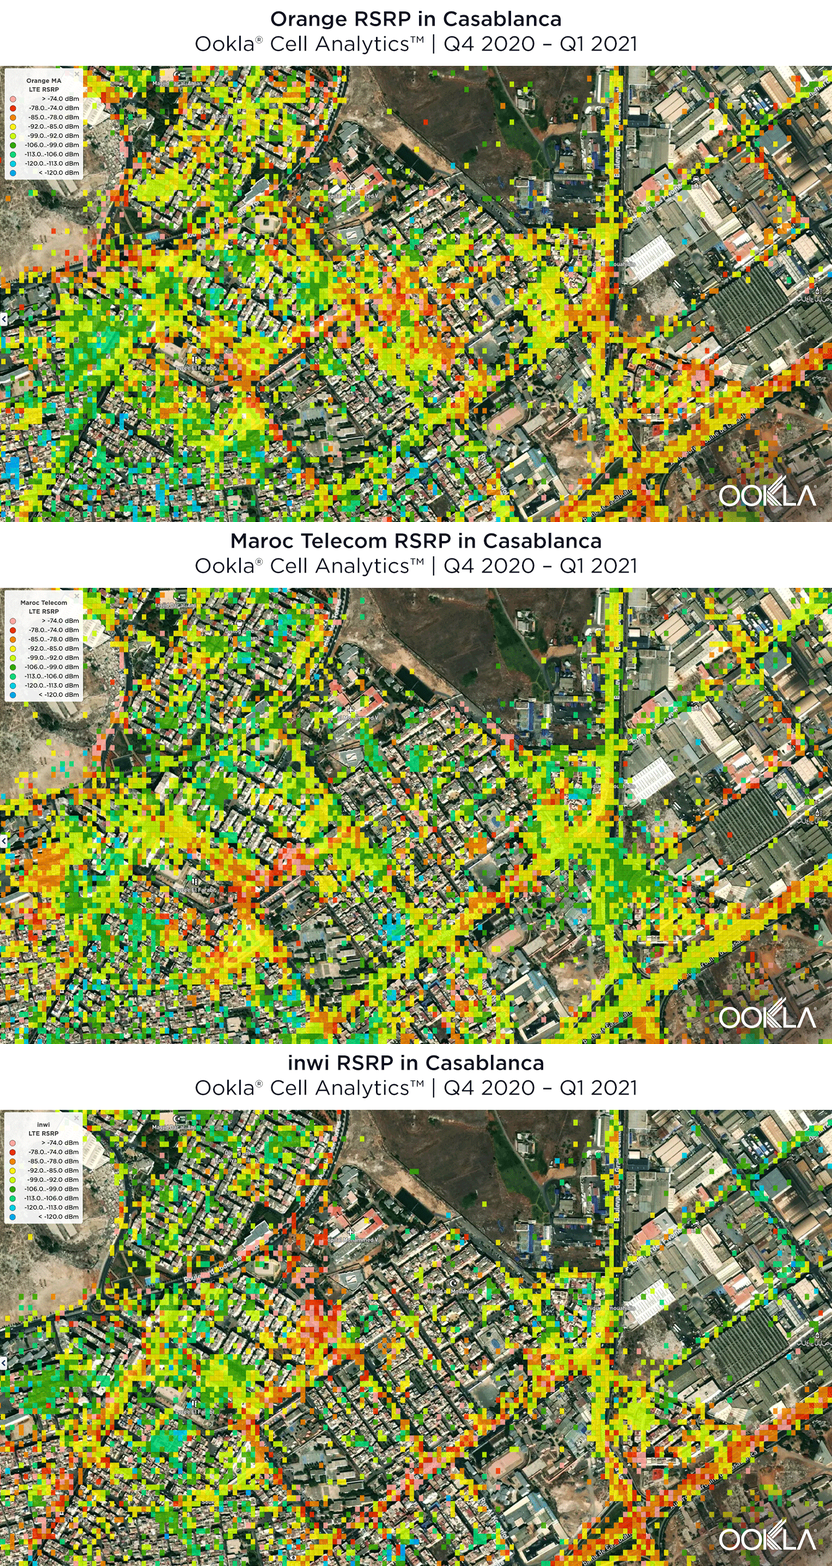
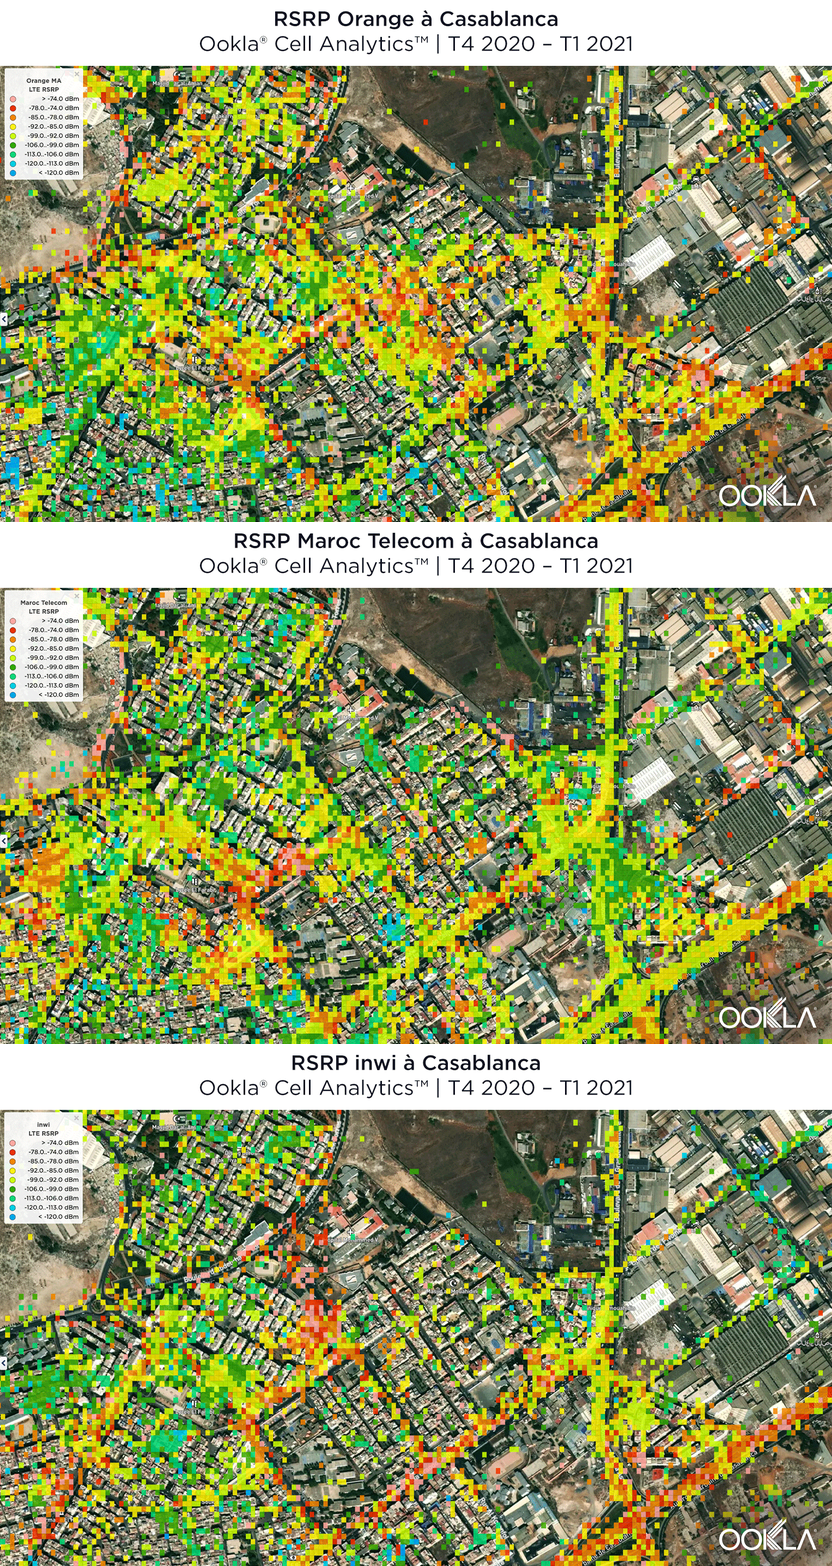
The next series of maps visualizes each top provider’s 4G LTE RSRP signal strengths in the area slightly southeast of the maps above. The signal is strongest in areas colored red and weakest areas in the blue areas.

cell-analytics_rsrp_casablanca_0521_en-1

Tripoli

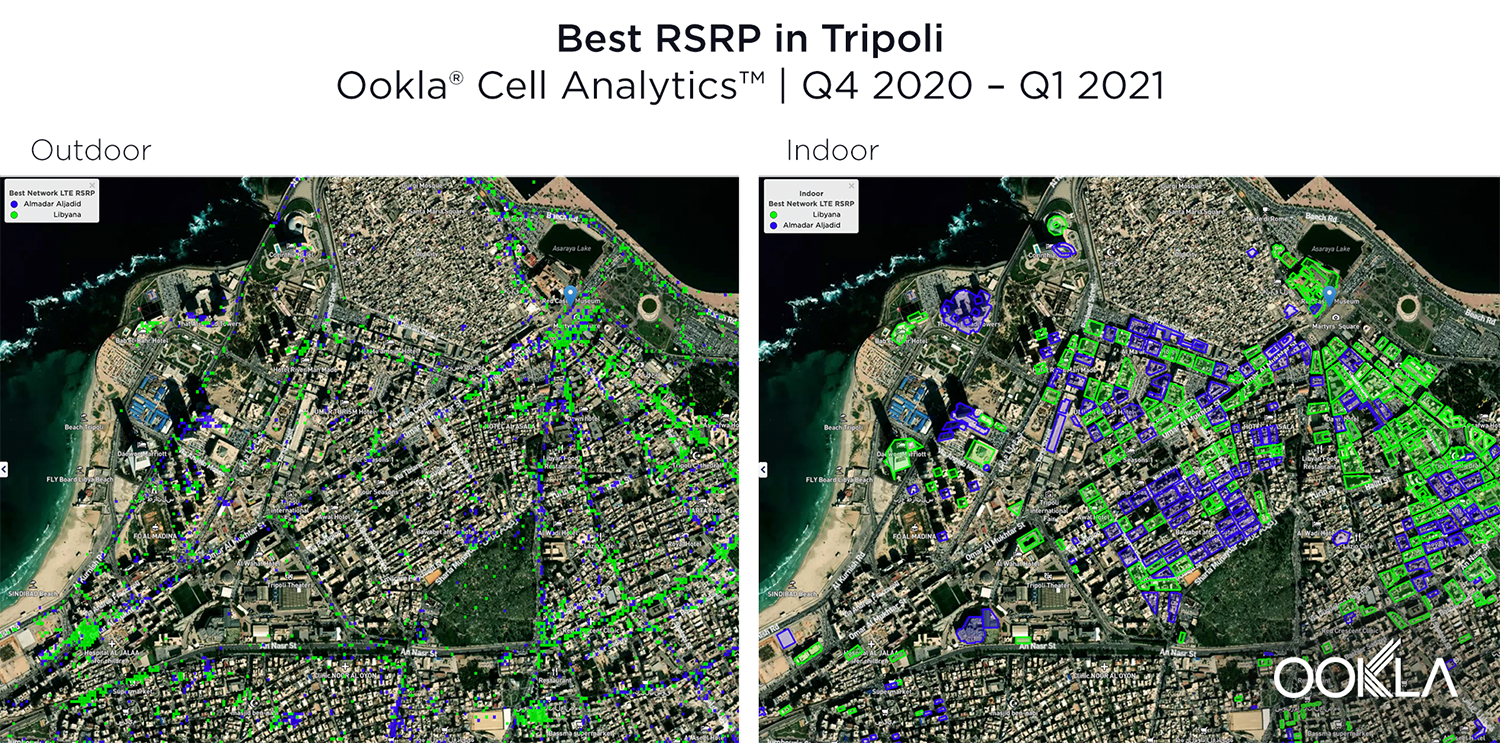
Tripoli’s northern coastline is an important cultural treasure. The maps below show Tripoli’s best 4G LTE RSRP providers for indoor and outdoor signal strength:

cell-analytics_tripoli_best_rsrp_0521_en

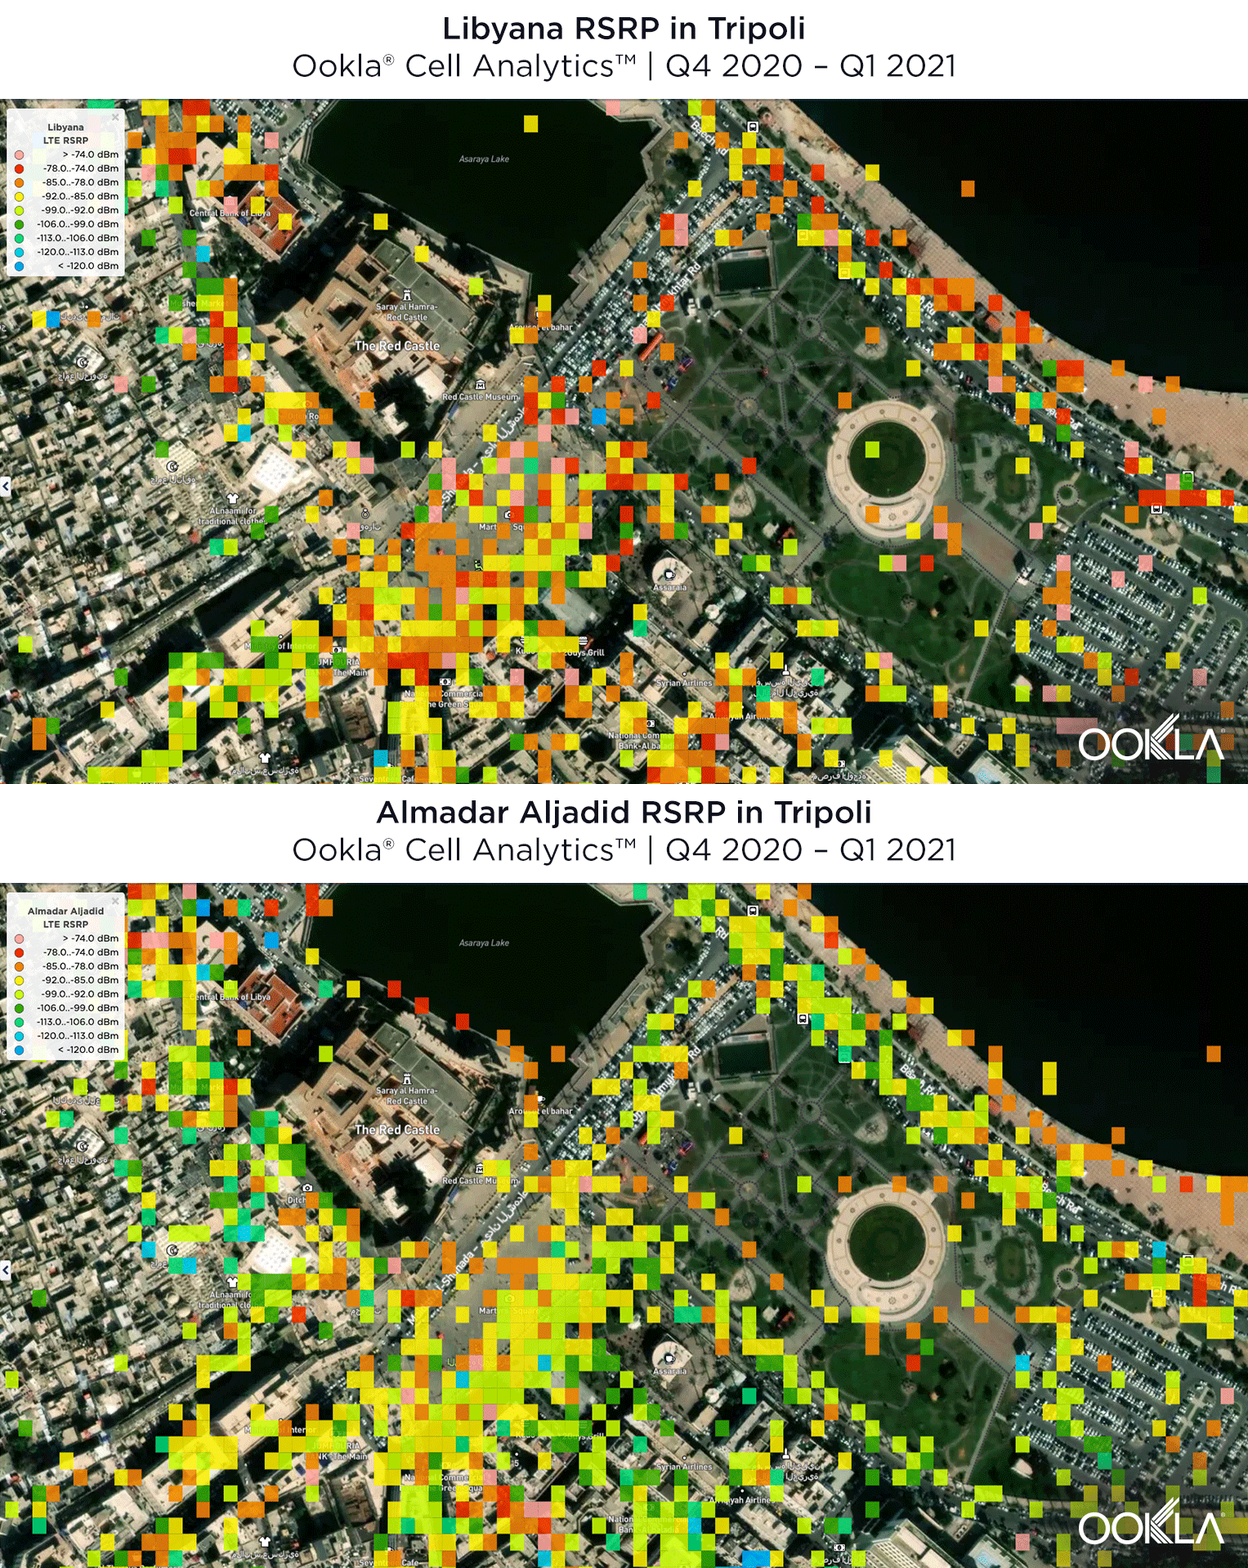
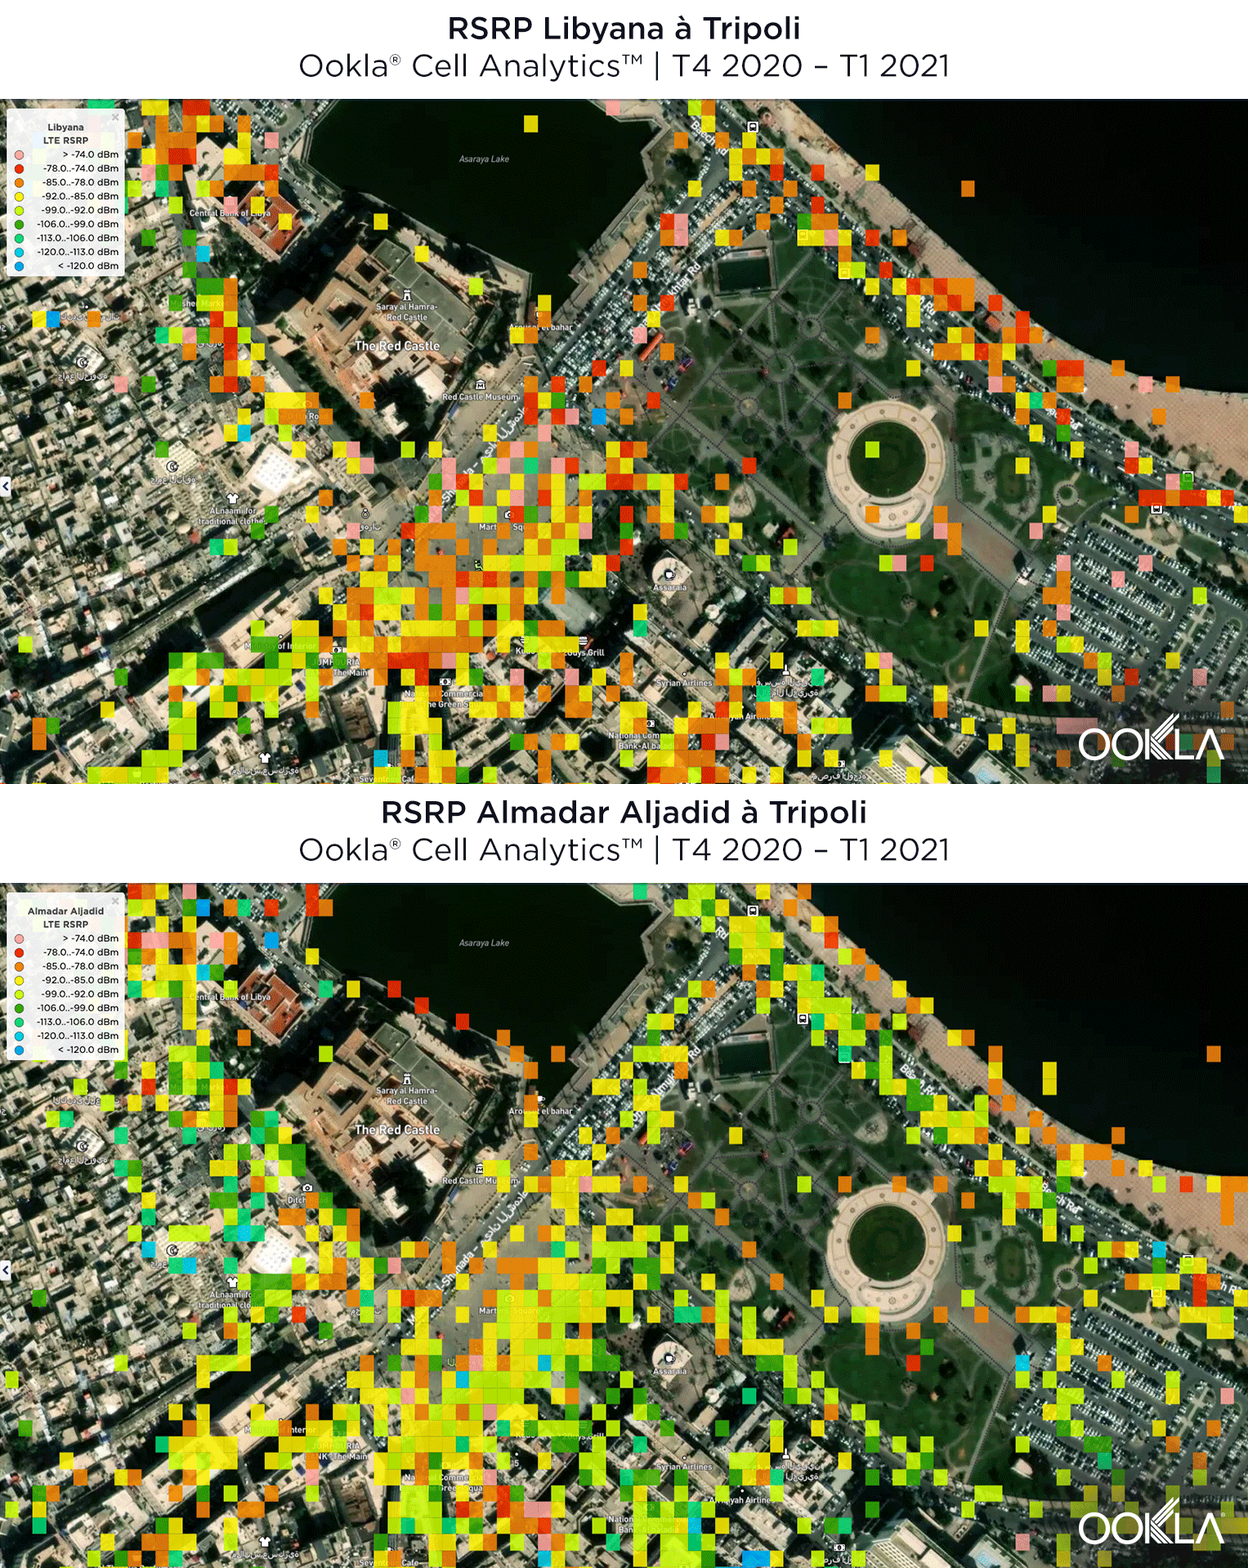
The Saraya Museum, also known as the Red Castle Museum, is one of Tripoli’s most prized attractions. The following maps show areas in red where the signal is strongest and areas in blue where the signal is weakest for Tripoli’s top providers:

cell-analytics_rsrp_tripoli_0521_en-1

Tunis

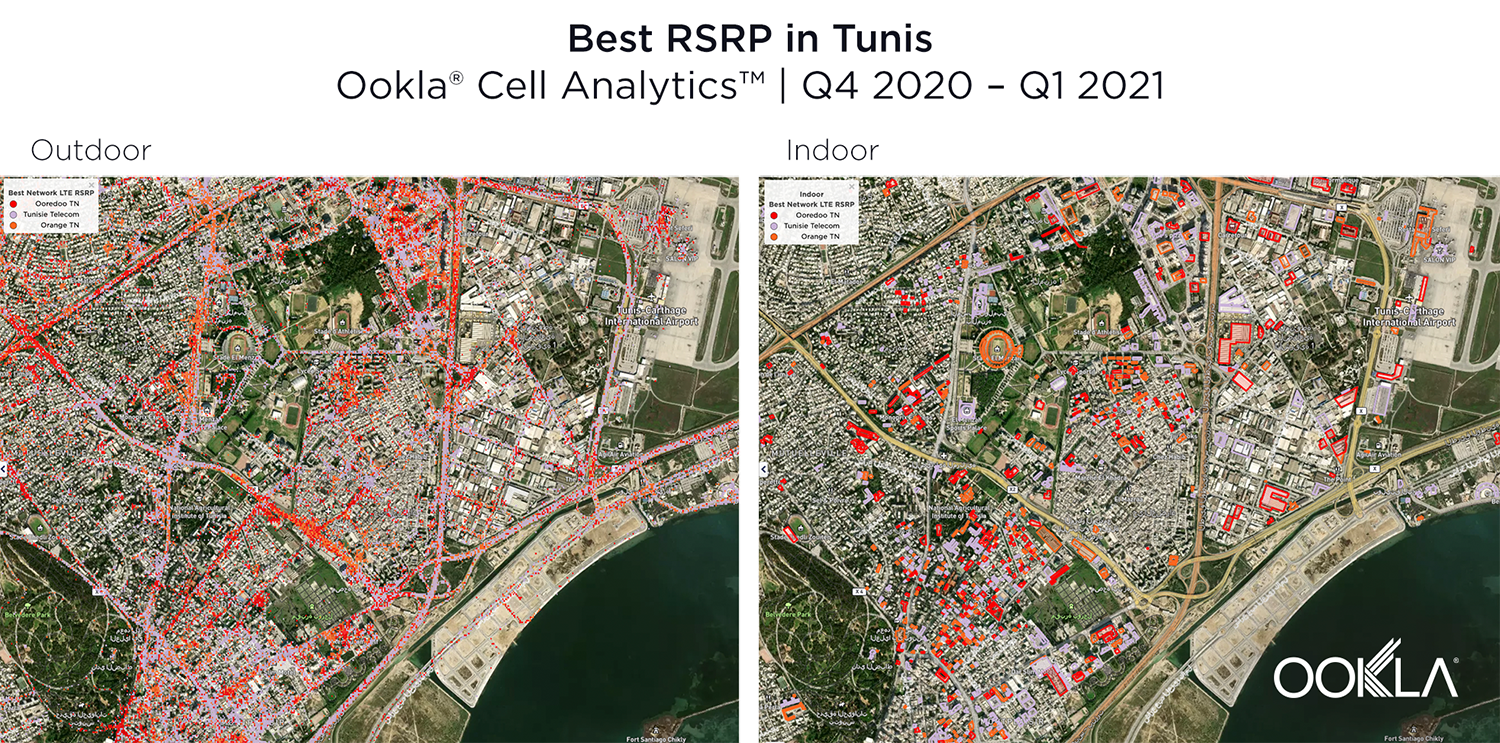
Tunis Centre is the heart of Tunis’ thriving culture. The maps below show the best providers for outdoor and indoor 4G LTE RSRP signal strength in the area.

cell-analytics_tunis_best_rsrp_0521_en

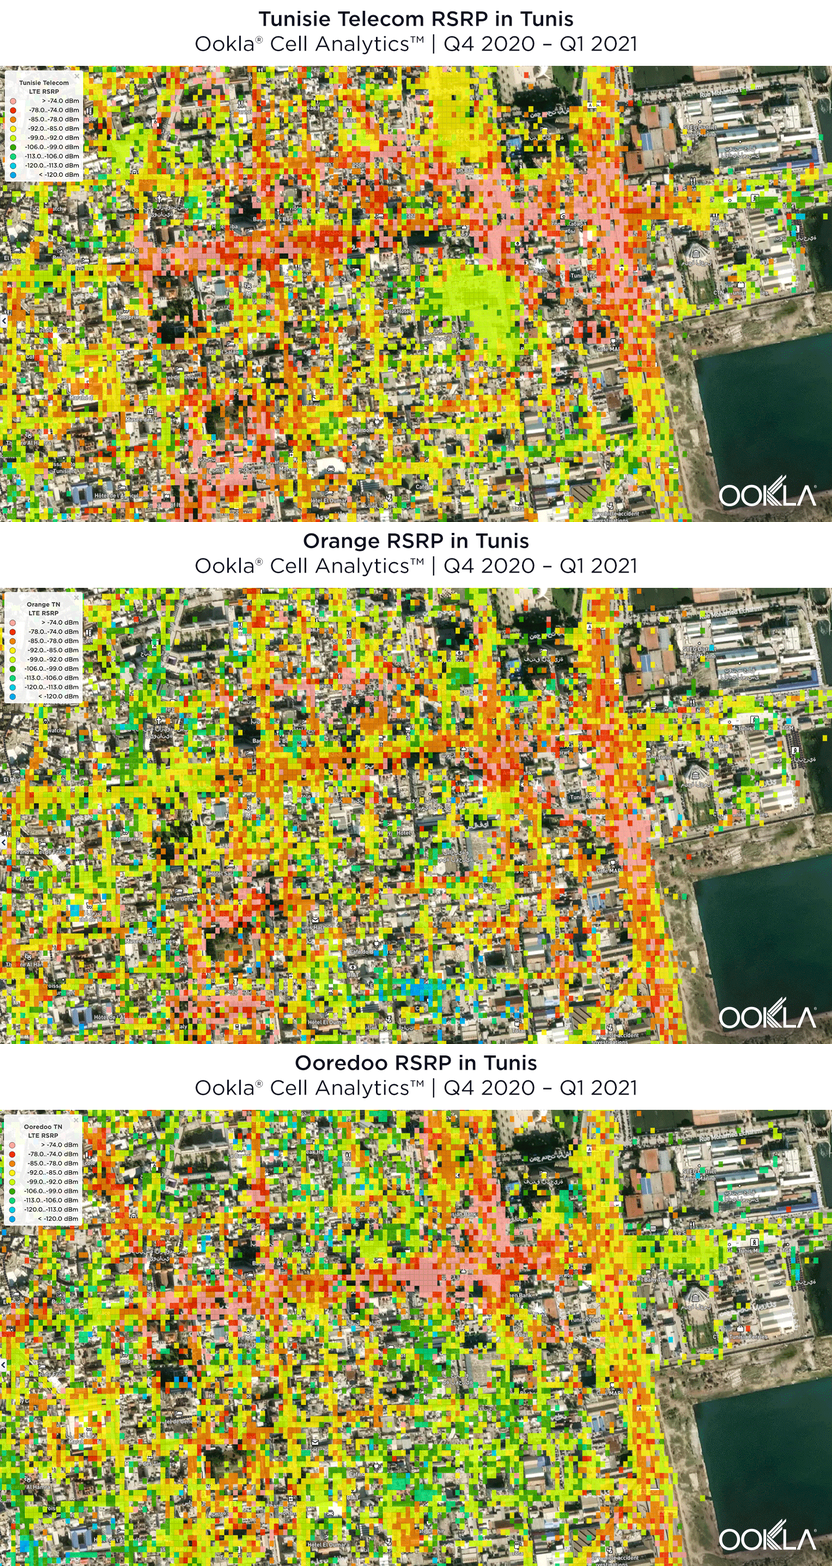
Zooming in further, we are able to see top providers’ individual 4G LTE RSRP signal strengths in a given area. Red areas show where the signal is strongest, while blue areas show the weakest signal for a given provider:

cell-analytics_rsrp_tunis_0521_en-1

North Africa internet performance is rapidly improving, and 5G is just around the corner

Internet performance in North Africa is rapidly improving, and with further operator and government investments in 4G and 5G networks — as well as expanded fixed broadband access — North Africa has a bright outlook for its internet users. We’ll continue monitoring the data from Speedtest Intelligence and Cell Analytics to see how internet performance changes during the year to come. If you’re in North Africa and want to see how your internet compares, take a Speedtest® on Android or iOS.


Le débit Internet s’accélère sensiblement en Afrique du Nord, mais accuse toujours un retard sur la plupart des régions du monde

2020 a été une année difficile dans presque tous les pays du monde en raison de la pandémie de COVID-19. Le bon côté, c’est que Speedtest Intelligence® révèle que chaque nation africaine a accéléré la vitesse des communications haut débit mobiles et fixes entre le deuxième trimestre 2020 et le premier trimestre 2021, malgré les graves difficultés subies par l’économie mondiale.

Le présent article dresse l’état des lieux du réseau Internet dans les pays d’Afrique du Nord que sont l’Algérie, l’Égypte, la Libye, le Maroc et la Tunisie entre le deuxième trimestre 2020 et le premier trimestre 2021. Nous examinons quels fournisseurs de haut débit mobile et fixe offrent les meilleures performances, la plus grande stabilité et la meilleure couverture 4G au premier trimestre 2021. Enfin, nous évaluons quelles sont les performances et la couverture Internet dans les plus grandes zones métropolitaines et étudions la force du signal cellulaire à l’aide des données d’Ookla Cell Analytics.

Le Maroc offre les vitesses de téléchargement les plus rapides d’Afrique du Nord, tandis que l’Égypte est la plus rapide en termes de haut débit fixe

L’analyse fondée sur les données de Speedtest Intelligence montre que les débits Internet varient beaucoup dans toute l’Afrique du Nord au cours du premier trimestre 2021, chaque pays, à l’exception de l’Égypte, présentant des vitesses moyennes de téléchargement mobiles supérieures à celles du haut débit fixe. Au cours de l’année dernière (du deuxième trimestre 2020 au premier trimestre 2021), le débit Internet a augmenté à la fois pour le haut débit mobile et fixe dans tous les pays d’Afrique du Nord.

L’Afrique du Nord n’est pas la seule dans ce cas : au début de l’année, Ookla® a conclu un partenariat avec la Banque mondiale dans le but d’analyser les performances Internet dans 18 pays africains pendant la pandémie de COVID-19. Cette étude a montré que les vitesses Internet ont globalement ralenti pendant les confinements successifs.

Le débit mobile a augmenté dans presque toute l’Afrique du Nord

ookla_median-mobile-speeds_north-africa_0521_fr

Le Maroc offrait la vitesse de téléchargement mobile moyenne la plus rapide (25,53 Mbps). La Tunisie arrivait en deuxième position (21,28 Mbps), l’Égypte en troisième position (14,95 Mbps), la Libye en quatrième position (11,65 Mbps) et l’Algérie en cinquième position (9,76 Mbps).

De nombreux Nord-Africains ont privilégié la technologie mobile étant donné que les performances et la couverture 3G et 4G n’ont cessé de s’améliorer. Du deuxième trimestre 2020 au premier trimestre 2021, tous les pays nord-africains (à l’exception de l’Égypte) ont enregistré une forte accélération des vitesses de téléchargement, la Libye présentant le pourcentage le plus élevé (67,4 %), suivie par l’Algérie (65,1 %), le Maroc (10,7 %), la Tunisie (10,0 %) et enfin l’Égypte (0,1 %).

L’Égypte a enregistré le haut débit le plus rapide

ookla_median-fixed-speeds_north-africa_0521_fr

Bien que l’Égypte soit à la traîne en matière de débit Internet mobile, elle excelle en ce qui concerne le haut débit fixe. Au cours du premier trimestre 2021, l’Égypte a enregistré la vitesse de téléchargement sur le réseau fixe la plus rapide d’Afrique du Nord, avec une moyenne de 26,58 Mbps (4,82 Mbps pour le chargement). Le Maroc arrivait deuxième pour le téléchargement (10,01 Mbps), la Libye troisième (8,71 Mbps), la Tunisie quatrième (6,95 Mbps) et l’Algérie cinquième (4,09 Mbps).

Tous les pays d’Afrique du Nord, à l’exception de la Tunisie, ont enregistré une augmentation moyenne du haut débit fixe de plus de 25 % du deuxième trimestre 2020 au premier trimestre 2021, l’Algérie plus que doublant sa vitesse avec une augmentation de 105,5 %. L’Égypte était deuxième avec une amélioration de 94,6 %, la Libye troisième (59,8 %), le Maroc quatrième (28,5 %) et la Tunisie cinquième (12,3 %).

Grandes variations des performances par fournisseur et par pays

Au cours du premier trimestre 2021, les opérateurs mobiles d’Afrique du Nord ont affiché des performances très variées. Maroc Telecom a enregistré les vitesses moyennes de téléchargement et de chargement mobile les plus rapides d’Afrique du Nord au cours du premier trimestre 2021 avec des vitesses respectives de 40,32 Mbps et 12,60 Mbps. WE Internet en Égypte a enregistré la vitesse moyenne de téléchargement la plus élevée pour le haut débit fixe avec 30,60 Mbps, tandis que l’opérateur lybien, LTC, enregistrait la vitesse de chargement la plus rapide, avec une moyenne de 7,46 Mbps.

Le Maroc offrait la meilleure couverture 4G d’Afrique du Nord au cours du premier trimestre 2021, avec ses trois principaux fournisseurs en tête dans la région : inwi (78,6 %), Maroc Telecom (78,0 %) et Orange (77,4 %). En dehors du Maroc, Ooredoo en Tunisie proposait la meilleure couverture 4G avec un taux de 76,9 %.

La stabilité mobile a connu d’importantes variations en Afrique du Nord au cours du premier trimestre 2021, Maroc Telecom affichant la meilleure performance avec un taux de 89,1 %. Tunisie Telecom arrivait en deuxième position avec un taux de 86,7 %.

L’opérateur mobile le plus rapide des pays d’Afrique du Nord offrait souvent la meilleure stabilité

ookla_mobile_performance_north-africa_map_0521_fr

Voici comment la téléphonie mobile s’est comportée dans chaque pays nord-africain au cours du premier trimestre 2021 :

Algérie | Égypte
| Libye | Maroc | Tunisie

Algérie

Ooredoo a enregistré les vitesses mobiles moyennes les plus rapides en Algérie au cours du premier trimestre 2021 (14,37 Mbps pour le téléchargement // 8,78 Mbps pour le chargement). DJEZZY s’est classé deuxième (avec 8,15 Mbps en téléchargement // 7,68 Mbps en chargement) et Mobilis troisième (avec 6,46 Mbps en téléchargement // 6,03 Mbps en chargement). Ooredoo a enregistré le meilleur score [en matière de stabilité mobile](/insights/blog/how-ookla-ensures-accurate-reliable-data-2021/#consistency-score] (73,5 %), suivi par DJEZZY (55,9 %) et Mobilis (51,9 %). DJEZZY offrait la meilleure couverture 4G avec un taux de 69,7 %, suivi par Ooredoo (65,8 %) et Mobilis (54,5 %).

Égypte

Au cours du premier trimestre 2021, Orange proposait les vitesses de téléchargement et de chargement les plus rapides d’Égypte, avec des moyennes respectives de 17,43 Mbps et 8,04 Mbps. En deuxième position, We enregistrait une vitesse de téléchargement moyenne de 15,56 Mbps (6,95 Mbps en chargement). Etisalat arrivait troisième (15,20 Mbps en téléchargement // 7,28 Mbps en chargement). Vodafone arrivait dernier des principaux fournisseurs (13,11 Mbps en téléchargement et 4,67 Mbps en chargement).

D’un point de vue statistique, il n’y avait pas de réel gagnant pour la stabilité mobile en Égypte au cours du premier trimestre 2021 : Orange a enregistré un score de 77,8 % et We, un score de 77,7 %. Etisalat arrivait en troisième position avec 74,7 %, tandis que Vodafone était dernier avec 69,5 %. Pas de vrai gagnant non plus en matière de couverture 4G, Etisalat obtenant un score de 68,3 %, Vodafone, 67,7 % et We, 67,4 %. Orange était à la queue avec la couverture 4G la plus faible, soit 61,1 %.

Libye

Au cours du premier trimestre 2021, Libyana a enregistré les vitesses de téléchargement et de chargement les plus rapides en Libye avec des moyennes respectives de 13,49 Mbps et 7,03 Mbps, ainsi que la meilleure stabilité mobile avec un score de 67,8 %. Almadar Aljadid arrivait deuxième pour les vitesses (10,71 Mbps en téléchargement // 3,62 Mbps en chargement) et pour la stabilité mobile (63,8 %). Almadar Aljadid offrait la meilleure couverture 4G avec un taux de 37,3 % et seulement 30,5 % pour Lybiana.

Maroc

Au cours du premier trimestre 2021, Maroc Telecom a enregistré les vitesses de téléchargement et de chargement moyennes les plus rapides au Maroc, atteignant respectivement 40,32 Mbps et 12,60 Mbps. inwi s’est classé deuxième (19,00 Mbps en téléchargement // 7,90 Mbps en chargement) et Orange a obtenu la troisième place (15,84 Mbps en téléchargement // 6,17 Mbps en chargement).

Maroc Telecom a également affiché la meilleure stabilité mobile avec un score de 89,1 %, suivi par inwi (74,8 %) et Orange (71,0 %). Du point de vue statistique, il n’y avait pas de vrai gagnant pour la couverture 4G, inwi réalisant un score de 78,6 %, Maroc Telecom un score de 78,0 % et Orange un score de 77,4 %. Tous ces fournisseurs figuraient parmi les meilleurs pour la couverture 4G en Afrique du Nord.

Tunisie

Tunisie Telecom a enregistré les vitesses moyennes de téléchargement et de chargement mobile les plus rapides en Tunisie au cours du premier trimestre 2021 avec des vitesses respectives de 24,34 Mbps et 11,42 Mbps. Ooredoo est arrivé deuxième avec 22,50 Mbps en téléchargement et 10,26 Mbps en chargement. Orange était troisième avec 16,24 Mbps en téléchargement et 8,25 Mbps en chargement.

Tunisie Telecom offrait également la meilleure stabilité mobile avec un score de 86,7 %. Ooredoo était deuxième avec 83,3 % et Orange troisième avec 78,1 %. Ooredoo affichait la meilleure couverture 4G avec un score de 76,9 %, tandis que Tunisie Telecom et Orange étaient à la traîne avec un score de 72,4 % et 72,3 %, respectivement.

Le haut débit fixe est plutôt lent en Afrique du Nord, mais les opérateurs égyptiens offrent les vitesses les plus élevées

ookla_fixed_performance_north-africa_map_0521_fr

Algérie | Égypte | Libye | Maroc | Tunisie

Algérie

IDOOM — le seul fournisseur de haut débit fixe répondant aux critères d’Ookla en tant que premier fournisseur en Algérie au premier trimestre 2021 — offrait une vitesse en téléchargement de 4,09 Mbps (0,74 Mbps en chargement) et une stabilité de 0,8 %.

Égypte

Au cours du premier trimestre 2021, WE Internet était le premier fournisseur en Égypte et en Afrique du Nord avec la vitesse de téléchargement haut débit la plus élevée atteignant une moyenne de 30,60 Mbps (5,68 Mbps en chargement), et la plus grande stabilité (57,5 %). Vodafone se classait deuxième (avec 13,16 Mbps en téléchargement // 1,65 Mbps en chargement), Orange arrivait troisième (avec 10,97 Mbps en téléchargement // 0,82 Mbps en chargement), et enfin Etisalat était quatrième parmi les plus grands fournisseurs avec 6,70 Mbps en téléchargement et 0,81 Mbps en chargement.

Libye

Au cours du premier trimestre 2021, LTC présentait les vitesses de téléchargement et de chargement moyennes les plus rapides sur le réseau fixe avec 10,62 Mbps et 7,46 Mbps respectivement. LTC enregistrait également la meilleure stabilité du haut débit fixe avec un score de 22,3 %. Suivait Libya Telecom avec une vitesse de 8,31 Mbps en téléchargement, 4,02 Mbps en chargement et une stabilité de 18,0 %.

Maroc

Au cours du premier trimestre 2021, Orange enregistrait la vitesse de téléchargement la plus rapide au Maroc pour le haut débit fixe avec une moyenne de 12,65 Mbps (2,60 Mbps en chargement), tandis qu’inwi offrait la vitesse de chargement la plus rapide avec une moyenne de 4,18 Mbps (11,33 Mbps en téléchargement). Maroc Telecom arrivait troisième avec une vitesse moyenne de 9,63 Mbps en téléchargement et 0,81 Mbps en chargement. Maroc Telecom affichait le meilleur score de stabilité avec 29,9 %. Orange était deuxième avec 24,7 %, et inwi troisième avec 16,9 %.

Tunisie

Au cours du premier trimestre 2021, Tunisie Telecom offrait la vitesse de téléchargement la plus rapide sur le réseau haut débit fixe tunisien avec une moyenne de 8,02 Mbps (0,81 Mbps en chargement), tandis qu’Ooredoo était le plus rapide pour le chargement avec une vitesse de 3,91 Mbps (7,03 Mbps en téléchargement). TOPNET a atteint 7,12 Mbps en téléchargement et 0,78 Mbps en chargement, suivi par Orange (avec 6,73 Mbps en téléchargement // 0,94 Mbps en chargement) et Gnet (avec 6,59 Mbps en téléchargement // 0,77 Mbps en chargement).

D’un point de vue statistique, il n’y avait de vrai gagnant s’agissant de la stabilité du haut débit fixe, avec Tunisie Telecom enregistrant un score de 10,6 % et Ooredoo un score de 10,1 %. Orange se classait troisième avec 4,6 %, suivi par Gnet (3,7 %) et TOPNET (3,4 %).

Tunis et Grand Casablanca ont enregistré les vitesses de téléchargement mobile les plus rapides d’Afrique du Nord. Le gouvernorat d’Alexandrie a bénéficié du haut débit fixe le plus rapide

ookla_download-speeds_north-africa_map_0521_fr
D’après Speedtest Intelligence, Tunis, en Tunisie, et Grand Casablanca, au Maroc, ont bénéficié au cours du premier trimestre 2021 des vitesses de téléchargement mobile les plus rapides parmi les zones métropolitaines les plus populaires d’Afrique du Nord avec des moyennes de 22,65 Mbps et 22,44 Mbps, respectivement. Le gouvernorat d’Alexandrie, en Égypte, arrivait en troisième position avec 16,63 Mbps, suivi par le gouvernorat du Caire en Égypte (14,32 Mbps), Tripoli en Libye (13,71 Mbps) et Alger en Algérie (12,81 Mbps).

Le gouvernorat d’Alexandrie affichait la vitesse de téléchargement la plus rapide sur le réseau haut débit fixe avec une moyenne de 21,24 Mbps. Le gouvernorat du Caire se classait deuxième avec 20,71 Mbps, le Grand Casablanca troisième (10,70 Mbps), Tripoli quatrième (10,02 Mbps), Tunis cinquième (7,47 Mbps) et Alger sixième (4,60 Mbps).

Cell Analytics brosse un tableau édifiant des villes d’Afrique du Nord

Cell Analytics d’Ookla, est un outil inestimable qui renseigne sur la qualité du réseau sans fil, les mesures RF (force du signal), l’utilisation des données, la densité des utilisateurs (à l’intérieur et à l’extérieur) et les emplacements des sites cellulaires d’un territoire donné. Cell Analytics permet aux opérateurs mobiles de renforcer la qualité de leur réseau et d’identifier avec une extrême précision les zones à améliorer.

Les cartes ci-dessous utilisent les données Cell Analytics du quatrième trimestre 2020 et du premier trimestre 2021 pour mettre en évidence deux éléments dignes d’intérêt dans les grandes villes d’Afrique du Nord : le meilleur fournisseur en termes de force du signal 4G LTE RSRP à l’intérieur et à l’extérieur dans une zone donnée et la force du signal 4G LTE RSRP par fournisseur dans les principales zones d’intérêt. Sur les cartes 4G LTE RSRP en intérieur et en extérieur, Cell Analytics identifie le meilleur opérateur de réseau mobile d’une zone donnée ou crée des zones par couleur en cas de très net gagnant d’un point de vue statistique. Les cartes par fournisseur montrent les performances de chacun dans une zone donnée, le rose et le rouge indiquant un signal fort et le bleu, un signal faible.

Faites défiler les cartes Cell Analytics des grandes villes nord-africaines ou cliquez sur une ville ci-dessous :

Alexandrie | Alger | Le Caire | Casablanca | Tripoli | Tunis

Alexandrie

La bibliothèque d’Alexandrie a disparu mais la Bibliotheca Alexandrina fait figure de testament de ce que le monde a perdu et de centre culturel majeur en Égypte. Dans la métropole trépidante, les cartes 4G LTE RSRP ci-dessous brossent deux situations différentes : le meilleur signal réseau mobile en extérieur et le meilleur signal réseau en intérieur relevés à Alexandrie au cours du quatrième trimestre 2020 et du premier trimestre 2021. Il apparaît clairement que plusieurs opérateurs fournissent le signal cellulaire le plus fort dans différentes parties de la ville et que certains bâtiments sont mieux servis que d’autres.

Alors qu’il est utile de savoir où opère le meilleur fournisseur dans les lieux que vous fréquentez, Ookla Cell Analytics peut également cartographier les résultats 4G LTE RSRP (force du signal) pour chaque fournisseur, comme représentés ci-après. Les zones rouges correspondent à un signal fort, tandis que les zones bleues correspondent à un signal faible.

cell-analytics_alexandria_best_rsrp_0521_fr

cell-analytics_rsrp_alexandria_0521_fr-1

Alger

Le jardin botanique du Hamma à Alger est un espace vert luxuriant au cœur de la ville en plein essor. C’est également un excellent lieu géographique pour tester les performances mobiles. Les deux premières cartes ci-dessous représentent les meilleurs opérateurs réseau en matière de force du signal 4G LTE RSRP en extérieur (à gauche) et en intérieur (à droite) dans la zone.

Les trois cartes suivantes montrent la force du signal 4G LTE RSRP pour chaque opérateur, la couleur rouge correspondant aux signaux les plus forts et la bleue, aux signaux les plus faibles.

cell-analytics_algiers_best_rsrp_0521_fr

cell-analytics_rsrp_algiers_0521_fr-1

Le Caire

Situé en plein cœur du Caire, le Gezira Sporting Club offre une vue insulaire sur la ville en pleine effervescence. Les cartes suivantes représentent les meilleurs opérateurs réseau en matière de force du signal 4G LTE RSRP en extérieur (à gauche) et en intérieur (à droite) dans la zone :

cell-analytics_cairo_best_rsrp_0521_fr

Sur la rive opposée, à l’est du Gezira Sporting Club se trouve le célèbre musée égyptien. Avec un réseau de téléphonie mobile saturé dans le quartier animé, Cell Analytics représente la force du signal 4G LTE RSRP des meilleurs opérateurs. Les cartes suivantes font apparaître des zones rouges où le signal est le plus fort et des zones bleues où il est le plus faible.

cell-analytics_rsrp_cairo_0521_fr-1

Casablanca

La mosquée Hassan-II située en bord de mer au nord de Casablanca est un centre touristique majeur et un lieu stratégique en matière de performances mobiles. Les deux cartes ci-dessous représentent la meilleure force de signal 4G LTE RSRP atteinte par les fournisseurs les plus performants en extérieur et en intérieur :

cell-analytics_casablanca_best_rsrp_0521_fr

La prochaine série de cartes représente la force du signal 4G LTE RSRP des meilleurs fournisseurs dans la zone située légèrement au sud ouest des cartes ci-dessus. Le signal est le plus fort dans les zones rouges et le plus faible dans les zones bleues.

cell-analytics_rsrp_casablanca_0521_fr-1

Tripoli

Le littoral nord de Tripoli est un trésor culturel de taille. Les cartes ci-dessous représentent les meilleurs fournisseurs 4G LTE RSRP en extérieur et en intérieur :

cell-analytics_tripoli_best_rsrp_0521_fr

Le musée As-Saraya al-Hamra, ou musée du Château rouge, est l’une des attractions les plus prisées de Tripoli. Les cartes suivantes font apparaître des zones rouges où le signal est le plus fort et des zones bleues où le signal est le plus faible pour les fournisseurs les plus performants de Tripoli :

cell-analytics_rsrp_tripoli_0521_fr-1

Tunis

Le centre de Tunis est le cœur du développement culturel de la ville. Les cartes ci-dessous représentent les meilleurs fournisseurs 4G LTE RSRP en extérieur et en intérieur dans le quartier.

cell-analytics_tunis_best_rsrp_0521_fr

En zoomant davantage, nous pouvons voir la puissance du signal 4G LTE RSRP de chaque fournisseur dans une zone donnée. Les zones rouges représentent un signal fort, tandis que les zones bleues correspondent à un signal faible pour un fournisseur donné :

cell-analytics_rsrp_tunis_0521_fr-1

Les performances Internet en Afrique du Nord s’améliorent rapidement, et l’arrivée de la technologie 5G est imminente

Les performances Internet en Afrique du Nord s’améliorent rapidement. Grâce à d’autres investissements de la part des opérateurs et des gouvernements dans les réseaux 4G et 5G, ainsi que dans l’extension de l’accès au haut débit fixe, l’Afrique du Nord offre des perspectives prometteuses à ses internautes. Nous continuerons à surveiller les données depuis Speedtest Intelligence et Cell Analytics pour suivre l’évolution des performances Internet au cours de l’année à venir. Si vous vous trouvez en Afrique du Nord et souhaitez connaître les performances de votre fournisseur, procédez à un Speedtest sur Android ou iOS.

Ookla retains ownership of this article including all of the intellectual property rights, data, content graphs and analysis. This article may not be quoted, reproduced, distributed or published for any commercial purpose without prior consent. Members of the press and others using the findings in this article for non-commercial purposes are welcome to publicly share and link to report information with attribution to Ookla.

| December 6, 2021

Ookla Video Analytics Reveals the State of Global Video Experience


Video is essential to today’s internet across the world. We use it to watch shows and movies, stream live events and even keep up to date on our favorite cats on social media. Ookla® launched video testing in the Speedtest® app for iOS and Android earlier this year so consumers can measure the quality of their video experience. Already, millions of video tests have been initiated by consumers. Today we’re sharing some of that data to provide insight into video experience around the world, specifically, we’ve analyzed adaptive start time and highest overall video resolution over all mobile technologies, 5G and fixed broadband in select countries during Q3 2021.

Switzerland had the fastest adaptive start time for all mobile technologies, South Africa fastest for 5G

Video streaming services use adaptive bitrate technology

All modern video streaming platforms use adaptive bitrate technology to automatically adjust video quality based on network conditions and device capabilities in order to display the highest quality video that a device can support, while minimizing buffering and slow video start time. Speedtest Video Analytics provides deep insights and competitive benchmarking for device and network video streaming capabilities.

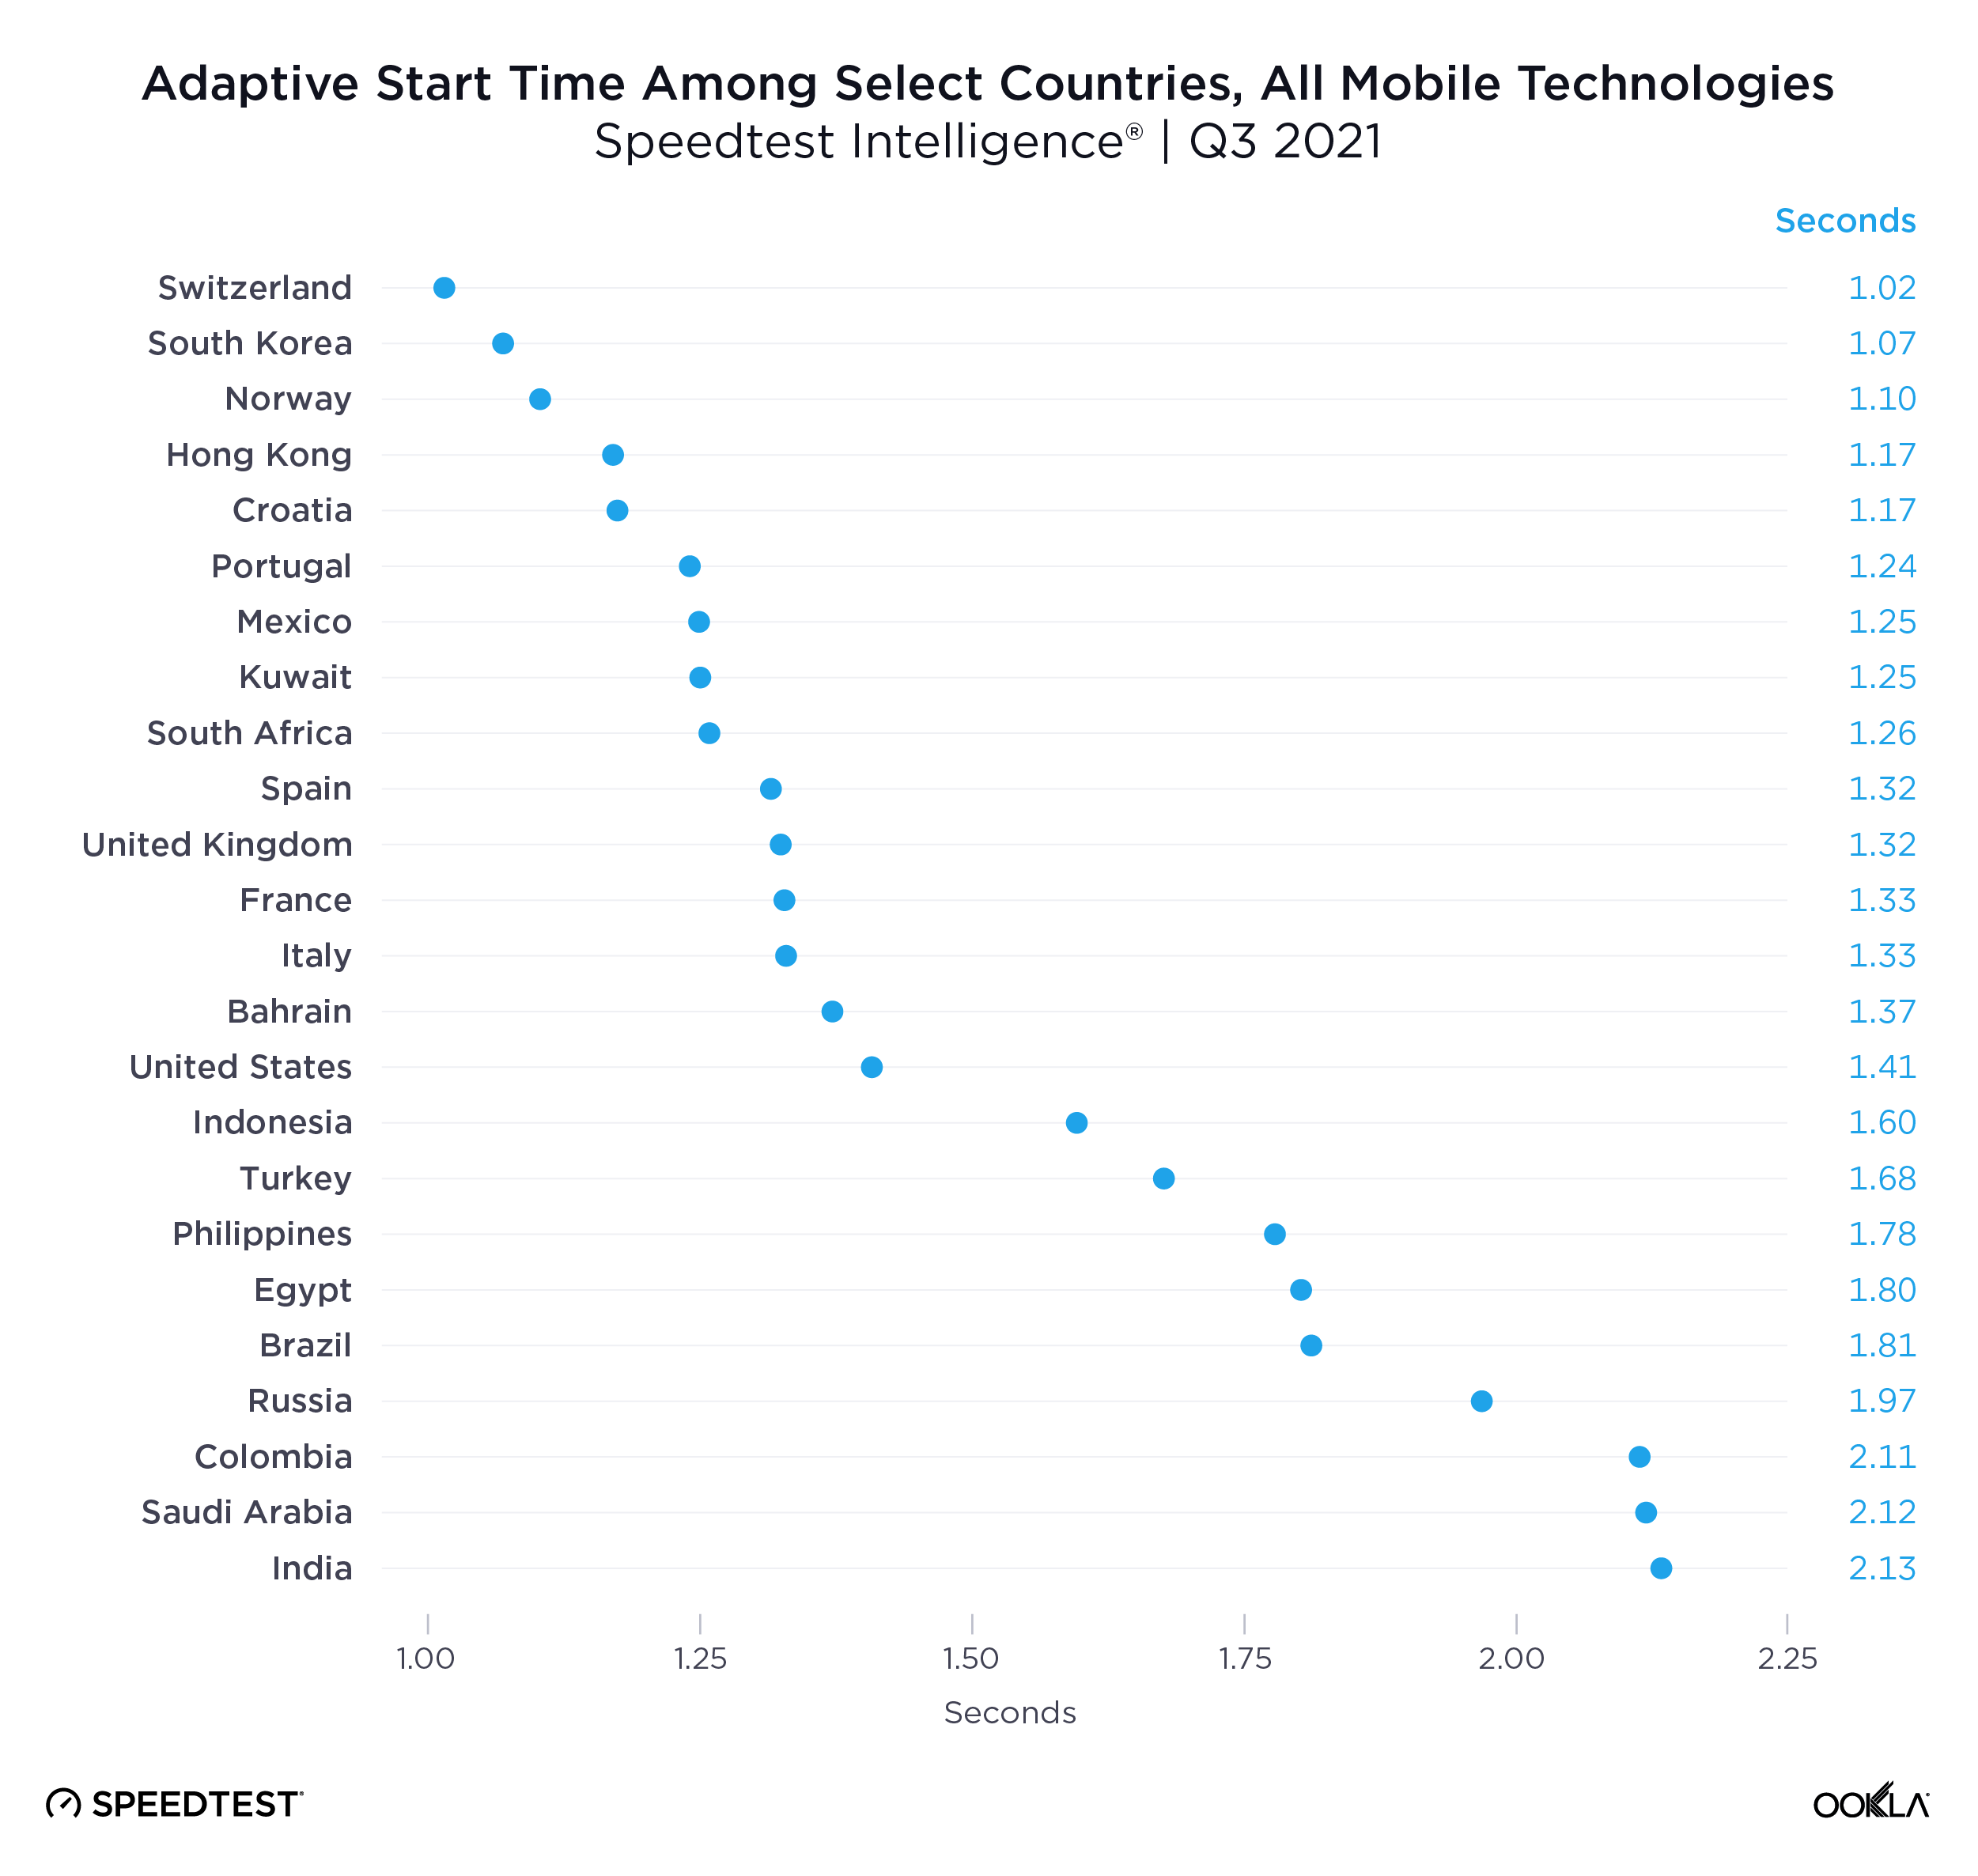
Adaptive start time — the time it takes for adaptive bitrate playback to initiate — allows us to see how quickly videos are loading. A 2012 study found that users will leave a video if it doesn’t begin playing within two seconds. We have to imagine in 2021, that timeframe is being squeezed even further. Our analysis shows how countries are performing against this important benchmark.

ookla_adaptive-start-time_all-mobile-tech_1121-01-3

Speedtest Intelligence® reveals that Switzerland had the fastest median adaptive start time for all mobile technologies combined among the countries we analyzed at 1.02 seconds during Q3 2021. South Korea and Norway were close behind at 1.07 seconds and 1.10 seconds, respectively. Five more countries achieved a median adaptive start time at or under 1.25 seconds during Q3 2021, including Hong Kong (SAR) and Croatia (1.17 seconds), Portugal (1.24 seconds), and Kuwait and Mexico (1.25 seconds). All but three of the remaining countries we surveyed achieved a median adaptive start time between 1.25 seconds and 2.00 seconds during Q3 2021 except Colombia (2.11 seconds), Saudi Arabia (2.12 seconds) and India (2.13 seconds).

Most 5G-capable video tests showed blazing fast adaptive start times

ookla_adaptive-start-time_5g_1121-01

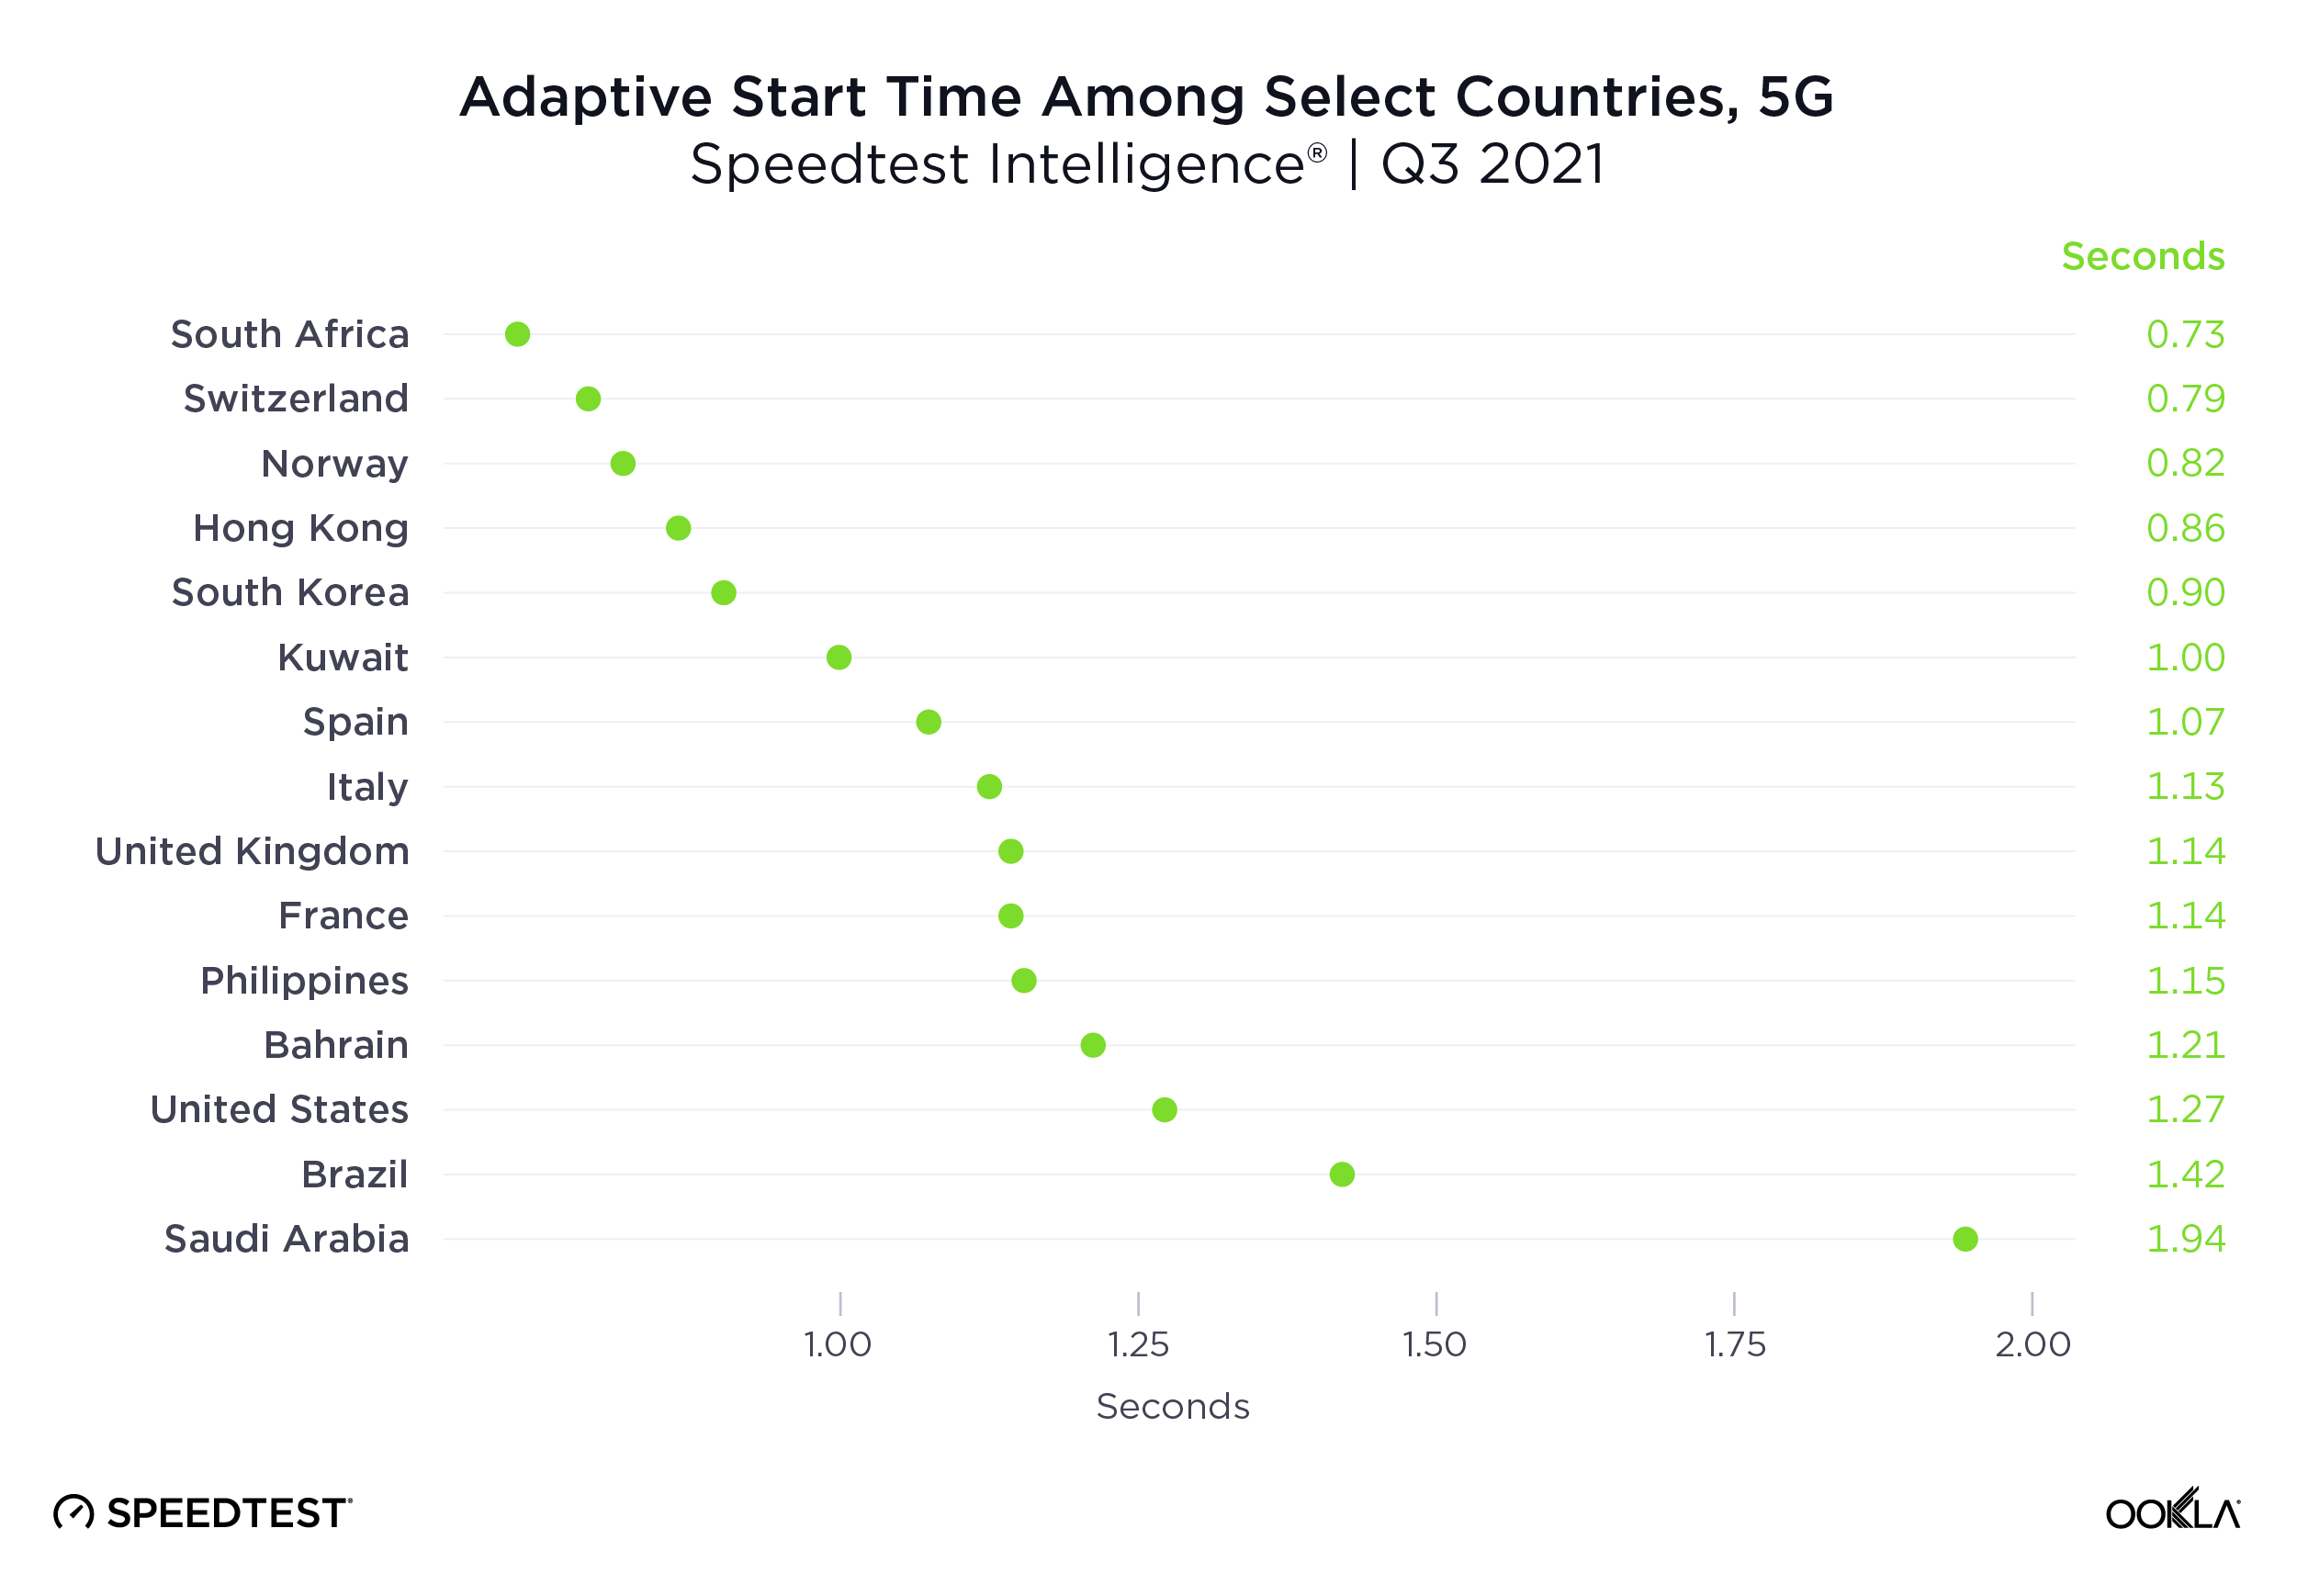
We’ve seen median 5G download speeds zoom ahead of traditional mobile technologies, even reaching median download speeds 10 times faster than on 4G LTE. It’s no surprise Video Analytics revealed adaptive start time was often much faster on 5G than on all mobile technologies combined. Five countries achieved median adaptive start times faster than 1.00 second during Q3 2021: South Africa (0.73 seconds), Switzerland (0.79 seconds), Norway (0.82 seconds), Hong Kong (0.86 seconds) and South Korea (0.90 seconds). Video Analytics shows the only countries with a median 5G adaptive start time slower than 1.25 seconds were the United States (1.27 seconds), Brazil (1.42 seconds) and Saudi Arabia (1.94 seconds).

Five countries’ adaptive start time improved more than 0.25 seconds on 5G compared to all technologies combined during Q3 2021: the Philippines (-0.62 seconds), South Africa (-0.53 seconds), Brazil (-0.39 seconds), Hong Kong (-0.31 seconds) and Norway (-0.29 seconds). However, several countries showed a less than 0.20 second improvement when comparing adaptive start rate on 5G to that on all technologies combined during Q3 2021: the U.S. (-0.14 seconds), Bahrain (-0.16 seconds), South Korea and Saudi Arabia (-0.17 seconds), and the United Kingdom (U.K.) and France (-0.18 seconds).

Adaptive start time is not always faster on fixed broadband

ookla_adaptive-start-time_fixed_1121-01-1

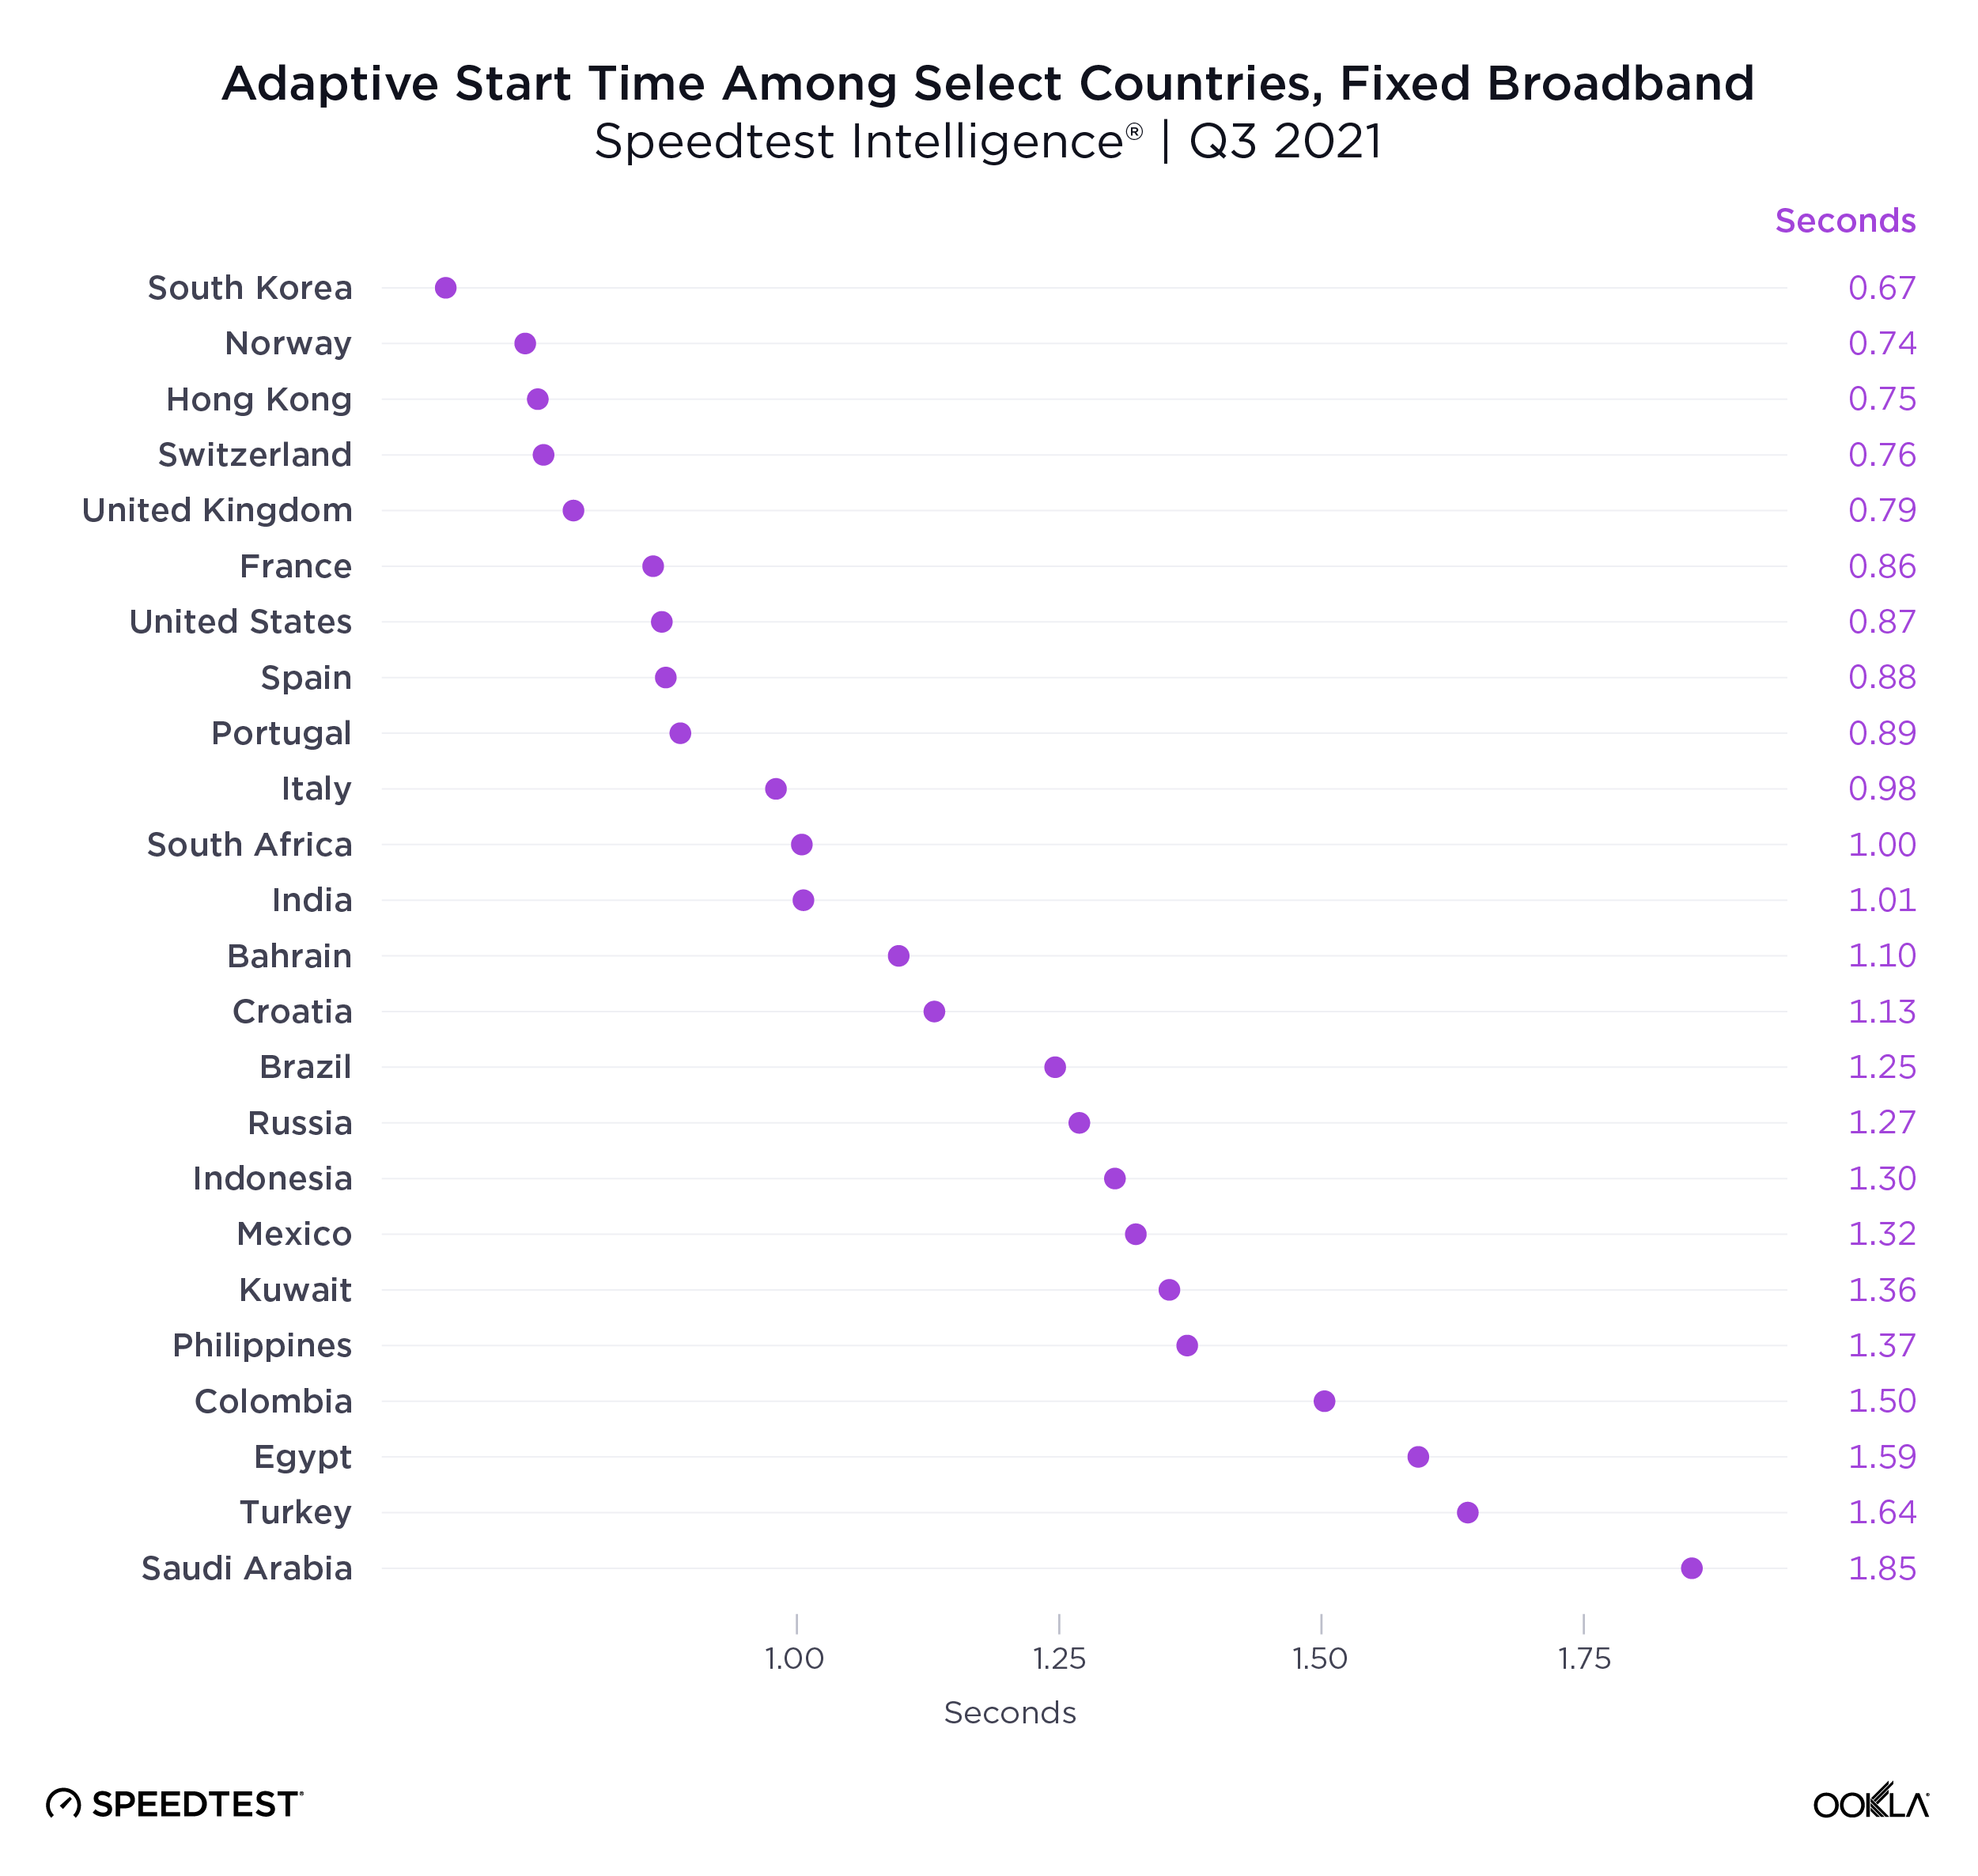
Speedtest Intelligence showed a narrower range for adaptive start time on fixed broadband than on 5G with every country on our list achieving between 0.67 and 1.85 seconds during Q3 2021. Ten countries on our list achieved a median adaptive start time faster than 1.00 second during Q3 2021: South Korea (0.67 seconds), Norway (0.74 seconds), Hong Kong (0.75 seconds), Switzerland (0.76 seconds), the U.K. (0.79 seconds), France (0.86 seconds), the U.S. (0.87 seconds), Spain (0.88 seconds), Portugal (0.89 seconds) and Italy (0.98 seconds).

Twenty out of the 24 countries we surveyed had a median fixed broadband adaptive start time faster than 1.50 seconds during Q3 2021. Colombia (1.50 seconds), Egypt (1.59 seconds), Turkey (1.64 seconds) and Saudi Arabia (1.85 seconds) were the only countries with a median adaptive start time slower than 1.50 seconds on fixed broadband during Q3 2021.

South Korea video tests reached 4K resolutions at the highest proportion on mobile and fixed broadband

Video resolution is incredibly important in the experience of streaming video and the higher the resolution, the more definition and clarity we are able to see. These days, the difference between an SD and 4K experience is gigantic. Resolution is measured in the numbers of pixels in a 16:9 ratio, with 2160 pixel height representing a 4K picture. Video Analytics measures the resolution rates, which represent the portion of samples that reach a particular resolution. In this analysis, we evaluated the resolution rates for 4K, typically the highest resolution users will need.

ookla_highest-video-resolution_all-mobile-tech_1121-01

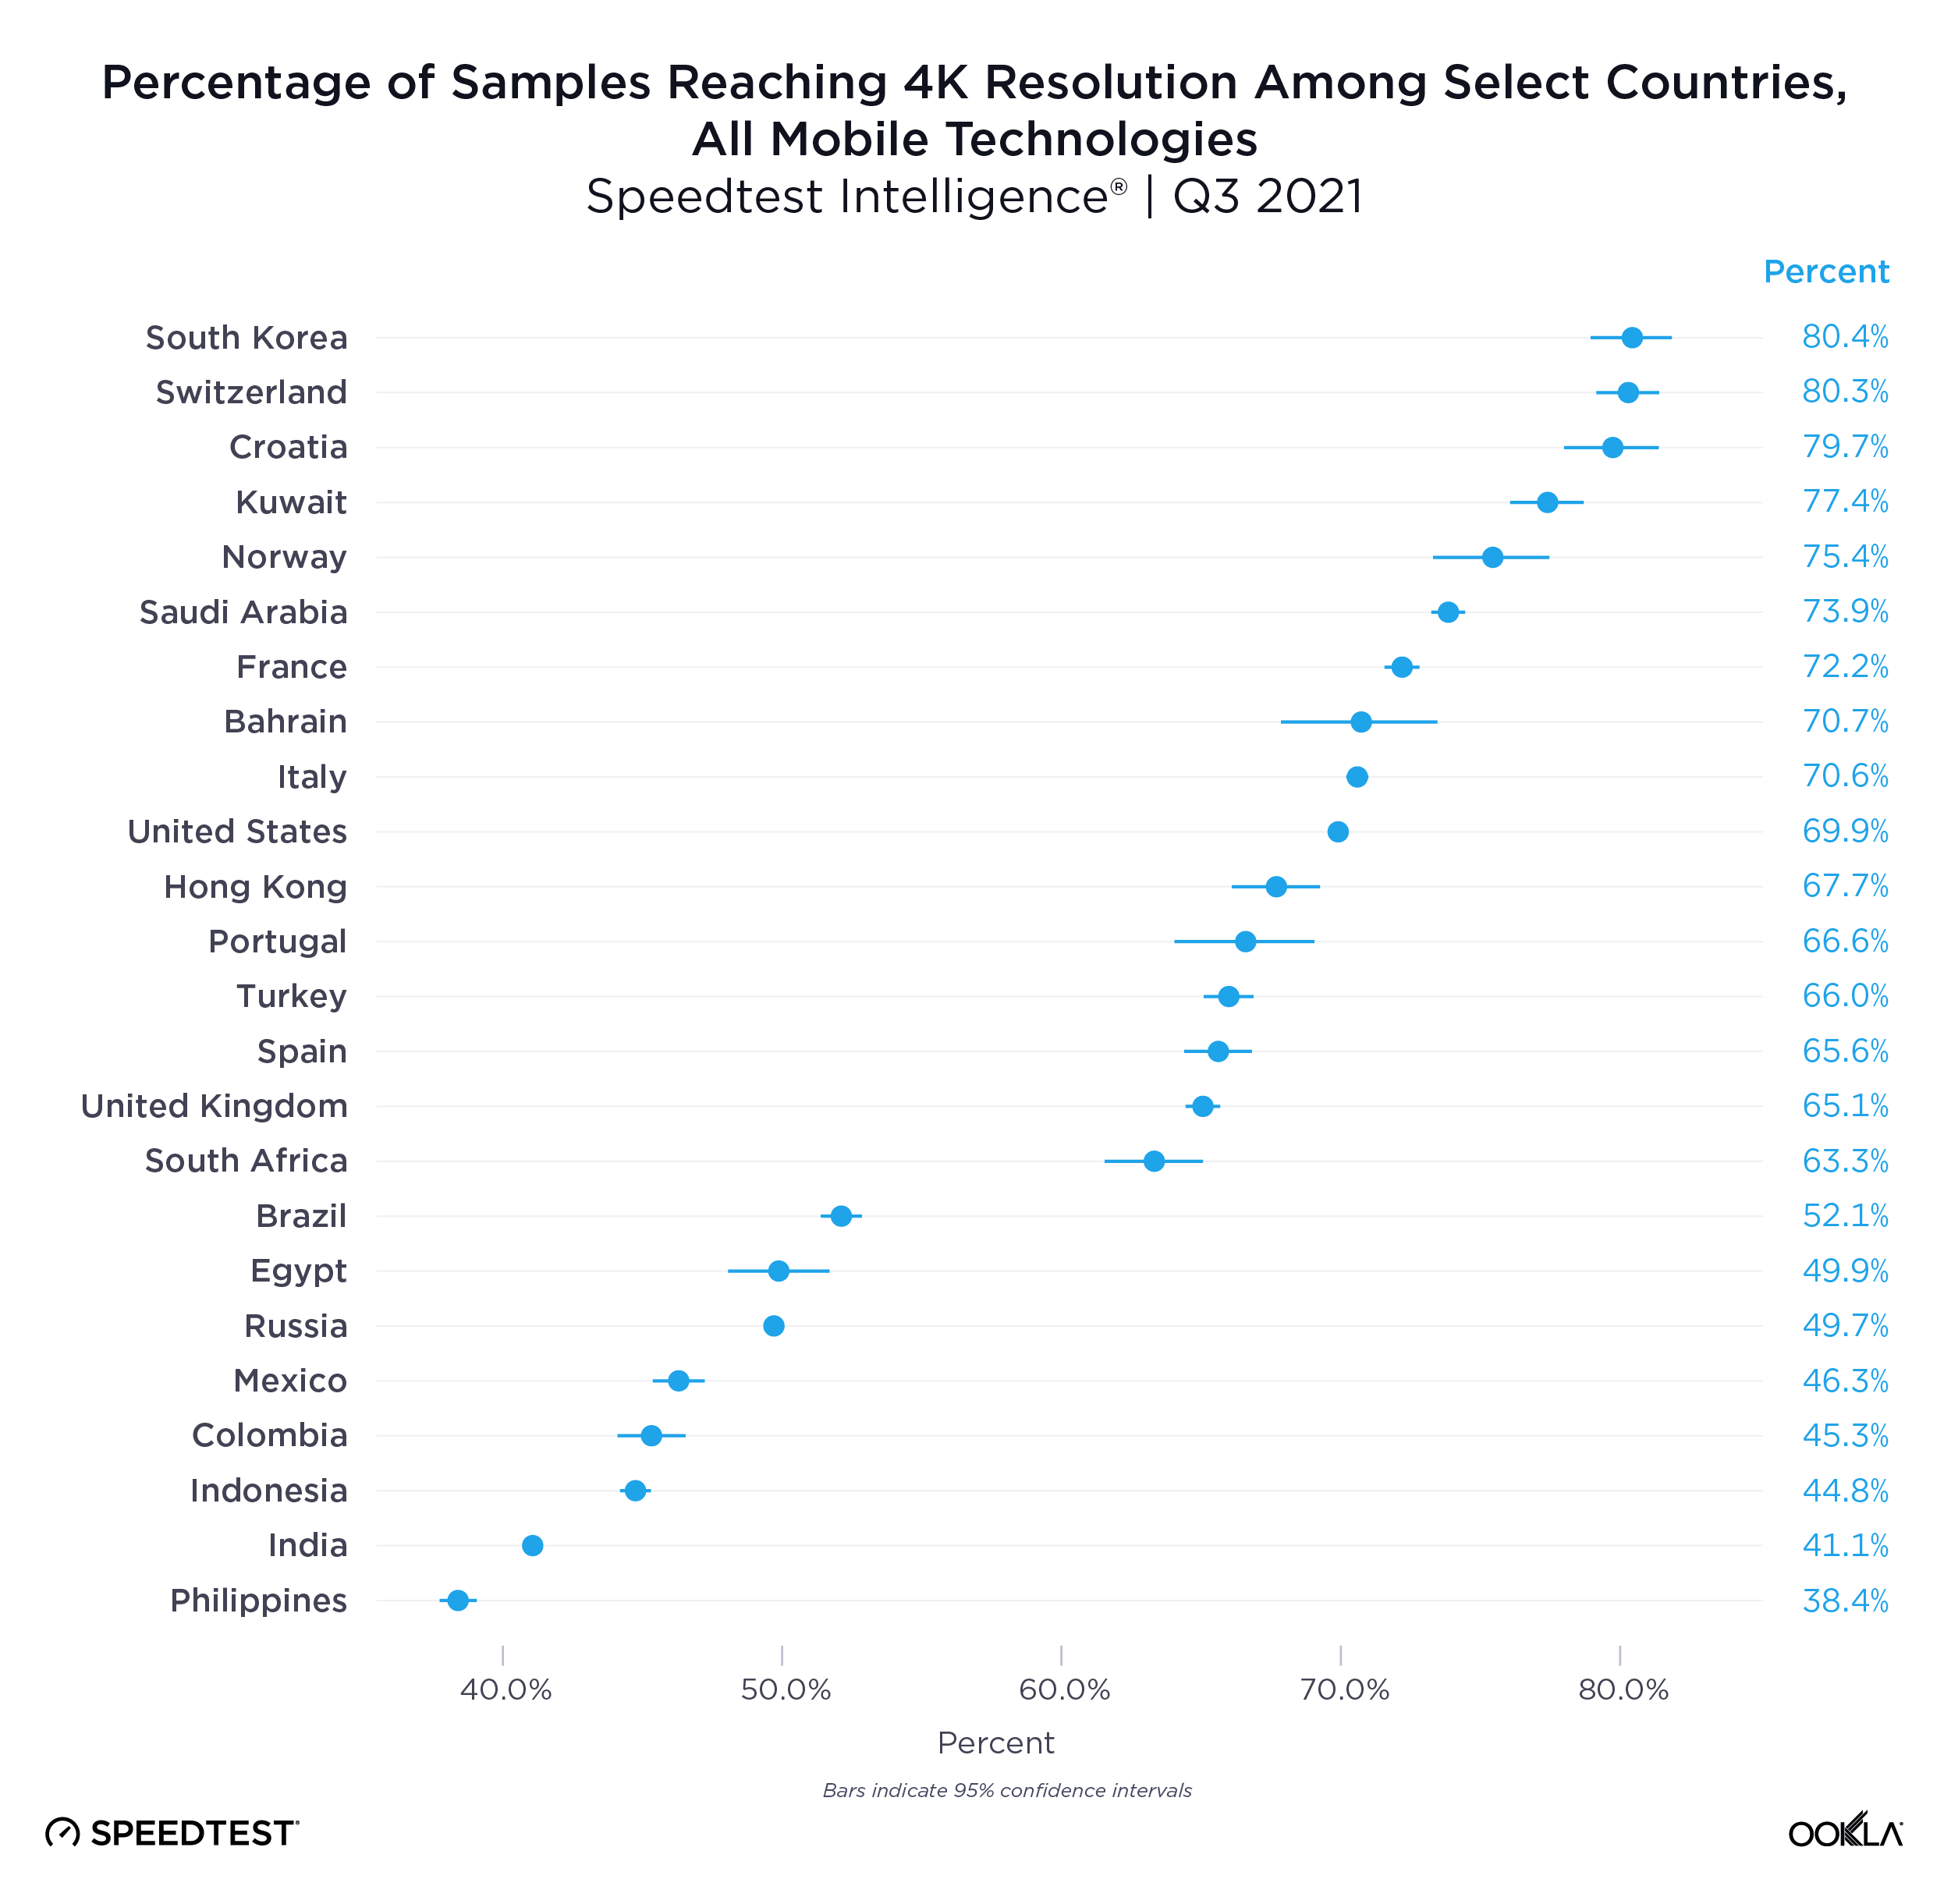
Using Speedtest Intelligence, we found South Korea and Switzerland had the highest overall successful resolution rates for all mobile technologies combined during Q3 2021, reaching 4K resolutions 80.4% and 80.3% of the time, respectively. Croatia (79.7%), Kuwait (77.4%) and Norway (75.4%) were the only other countries on our list that achieved 4K video resolution more than 75.0% of the time. Only seven countries on our list did not reach a 4K resolution at least 50% of the time on all mobile technologies combined: the Philippines (38.4%), India (41.1%), Indonesia (44.8%), Colombia (45.3%), Mexico (46.3%), Russia (49.7%) and Egypt (49.9%).

5G led to higher video resolution, but 4K mobile devices still remain rare

ookla_highest-video-resolution_5g_1121-01

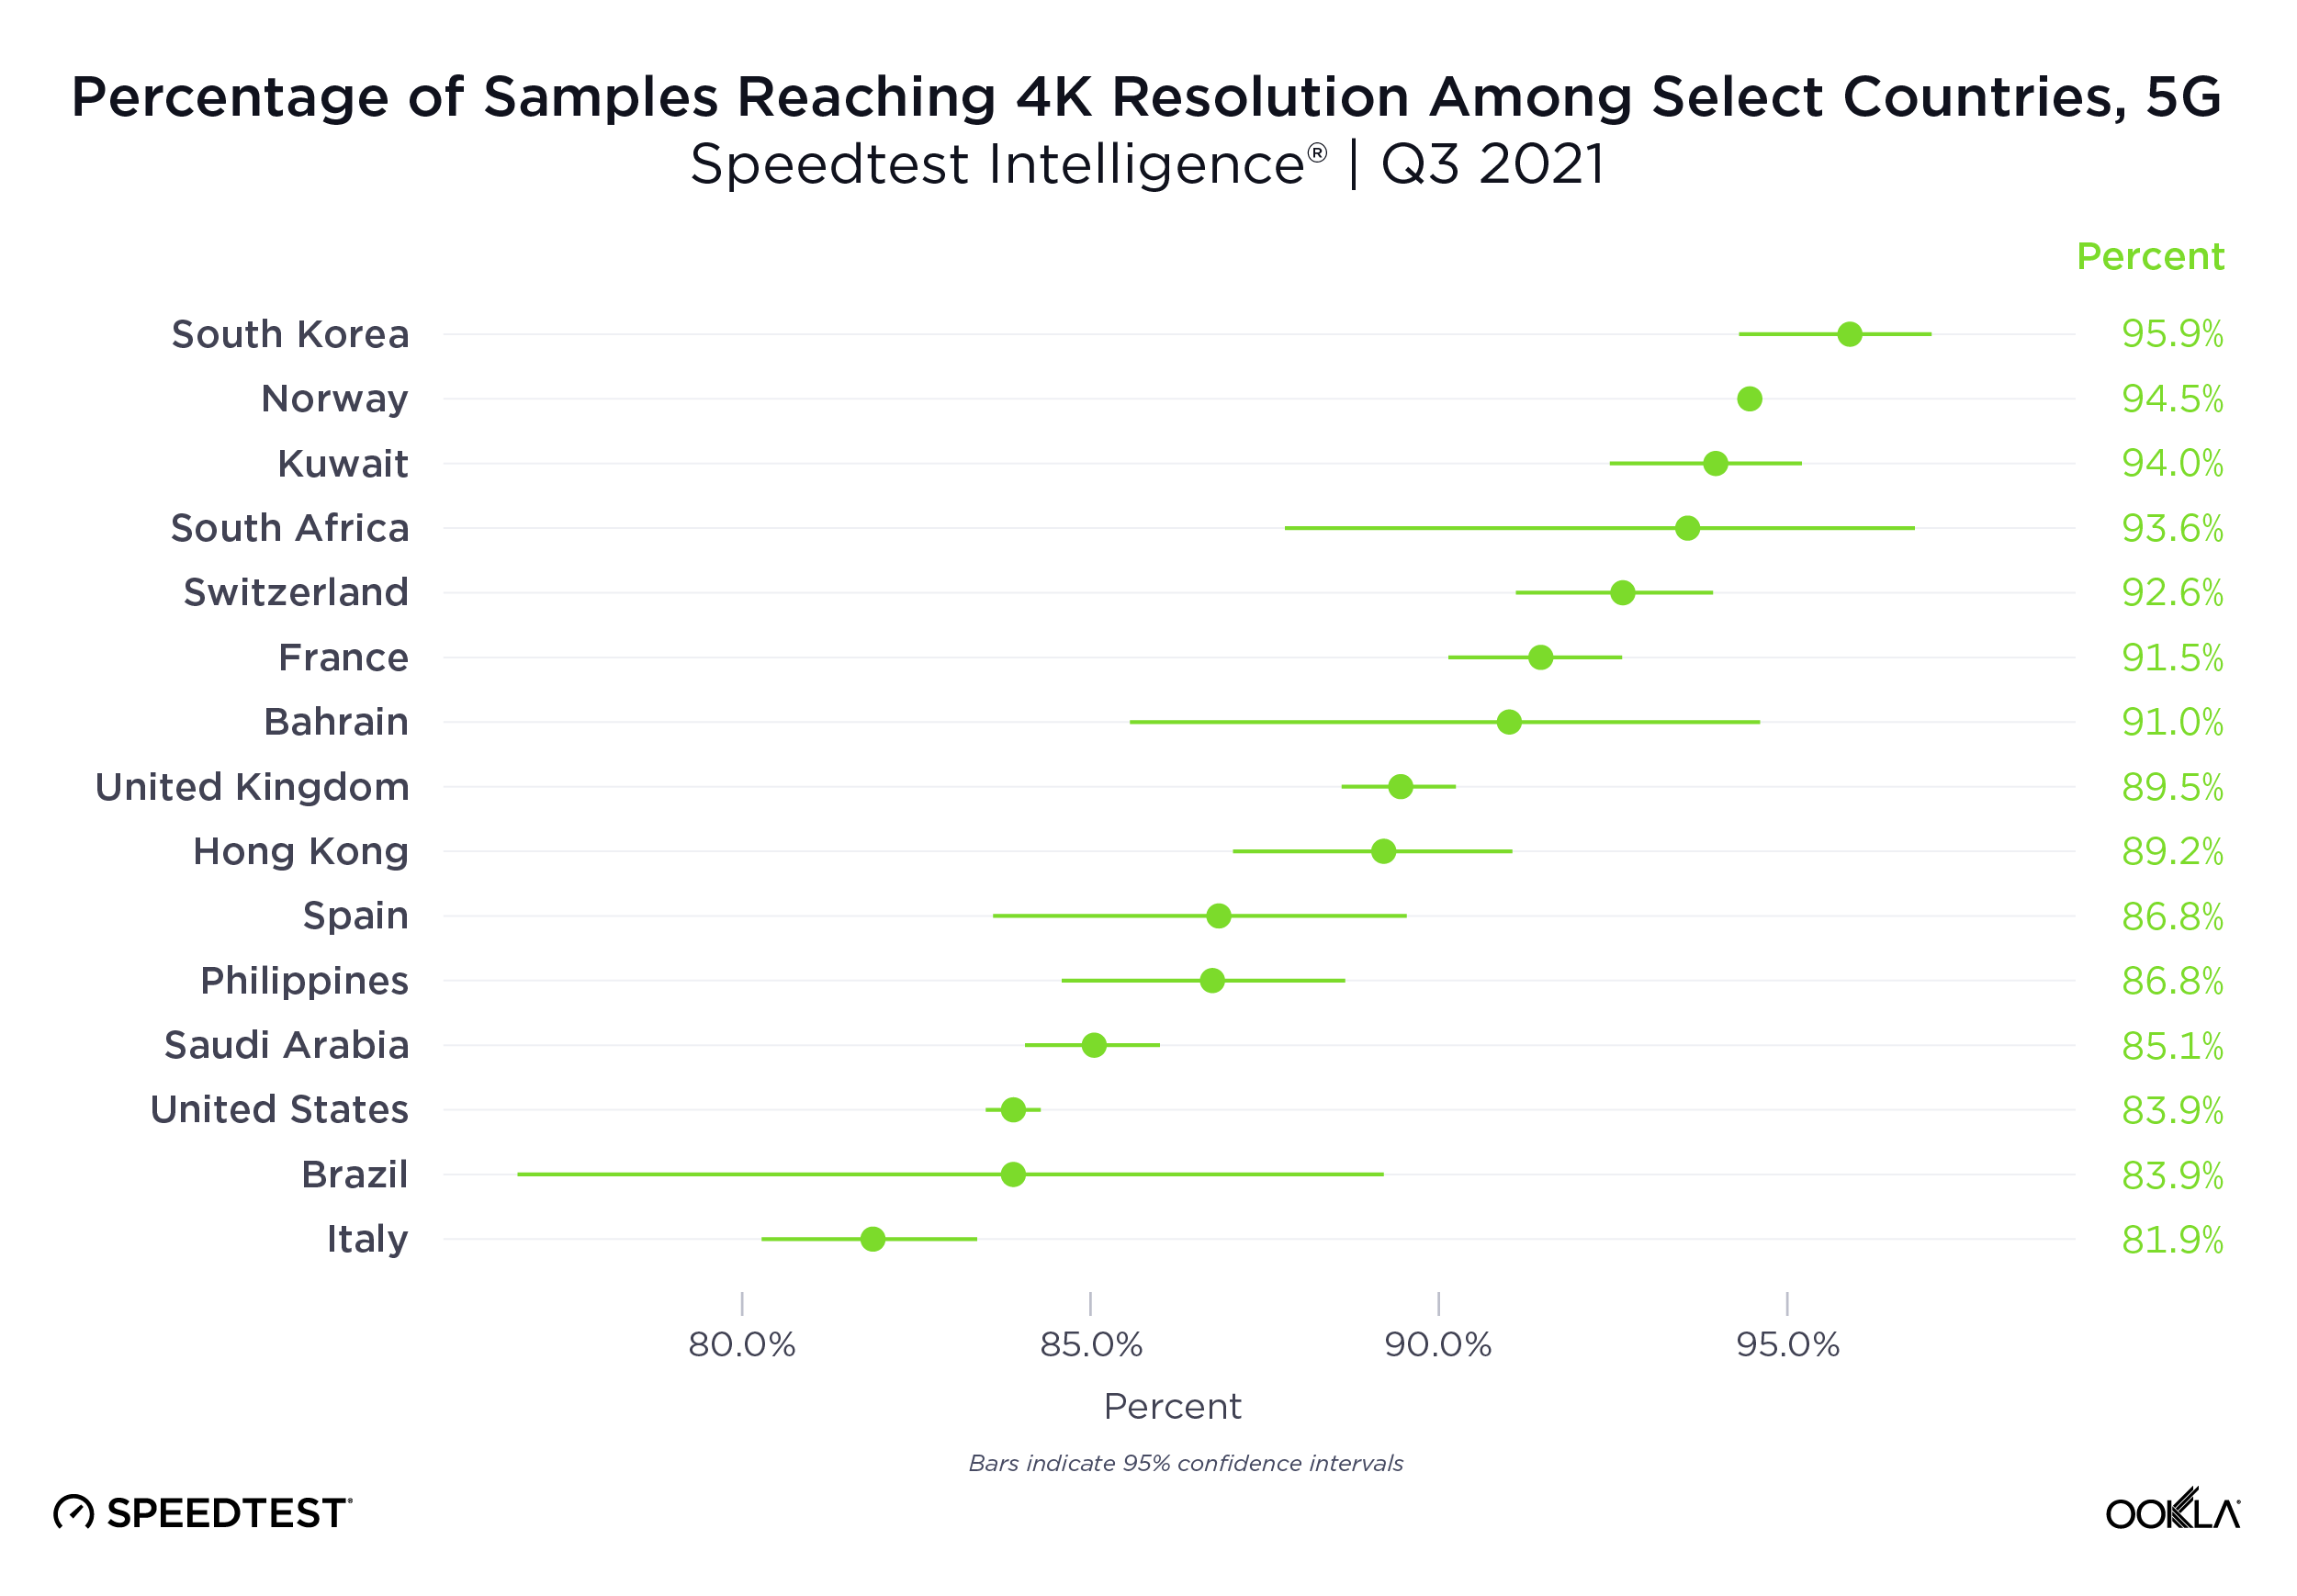
5G provided a higher resolution for mobile devices during Q3 2021 than all technologies combined. Every country we surveyed reached a 4K resolution over 80.0% of the time over 5G. In fact, six out of the 14 countries we surveyed for 5G achieved a 4K resolution more than 90.0% of the time, including South Korea (95.9%), Norway (94.5%), Kuwait (94.0%), South Africa (93.6%), Switzerland (92.6%) and France (91.5%). On the lower end of our list, only Italy (81.9%), Brazil (83.9%) and the U.S. (83.9%) achieved 4K resolutions less than 85.0% of the time.

While this is great news for the future of mobile devices, 4K resolutions in mobile devices still aren’t common: Sony is the only popular device manufacturer producing 4K mobile devices. In the meantime, users who can connect to 5G through either a hot spot or fixed wireless access (FWA) will reap the benefits of being able to stream on 4K devices like computers, televisions or tablets.

South Korean fixed broadband delivers ultra-high definition resolutions

ookla_highest-video-resolution_fixed_1121-01

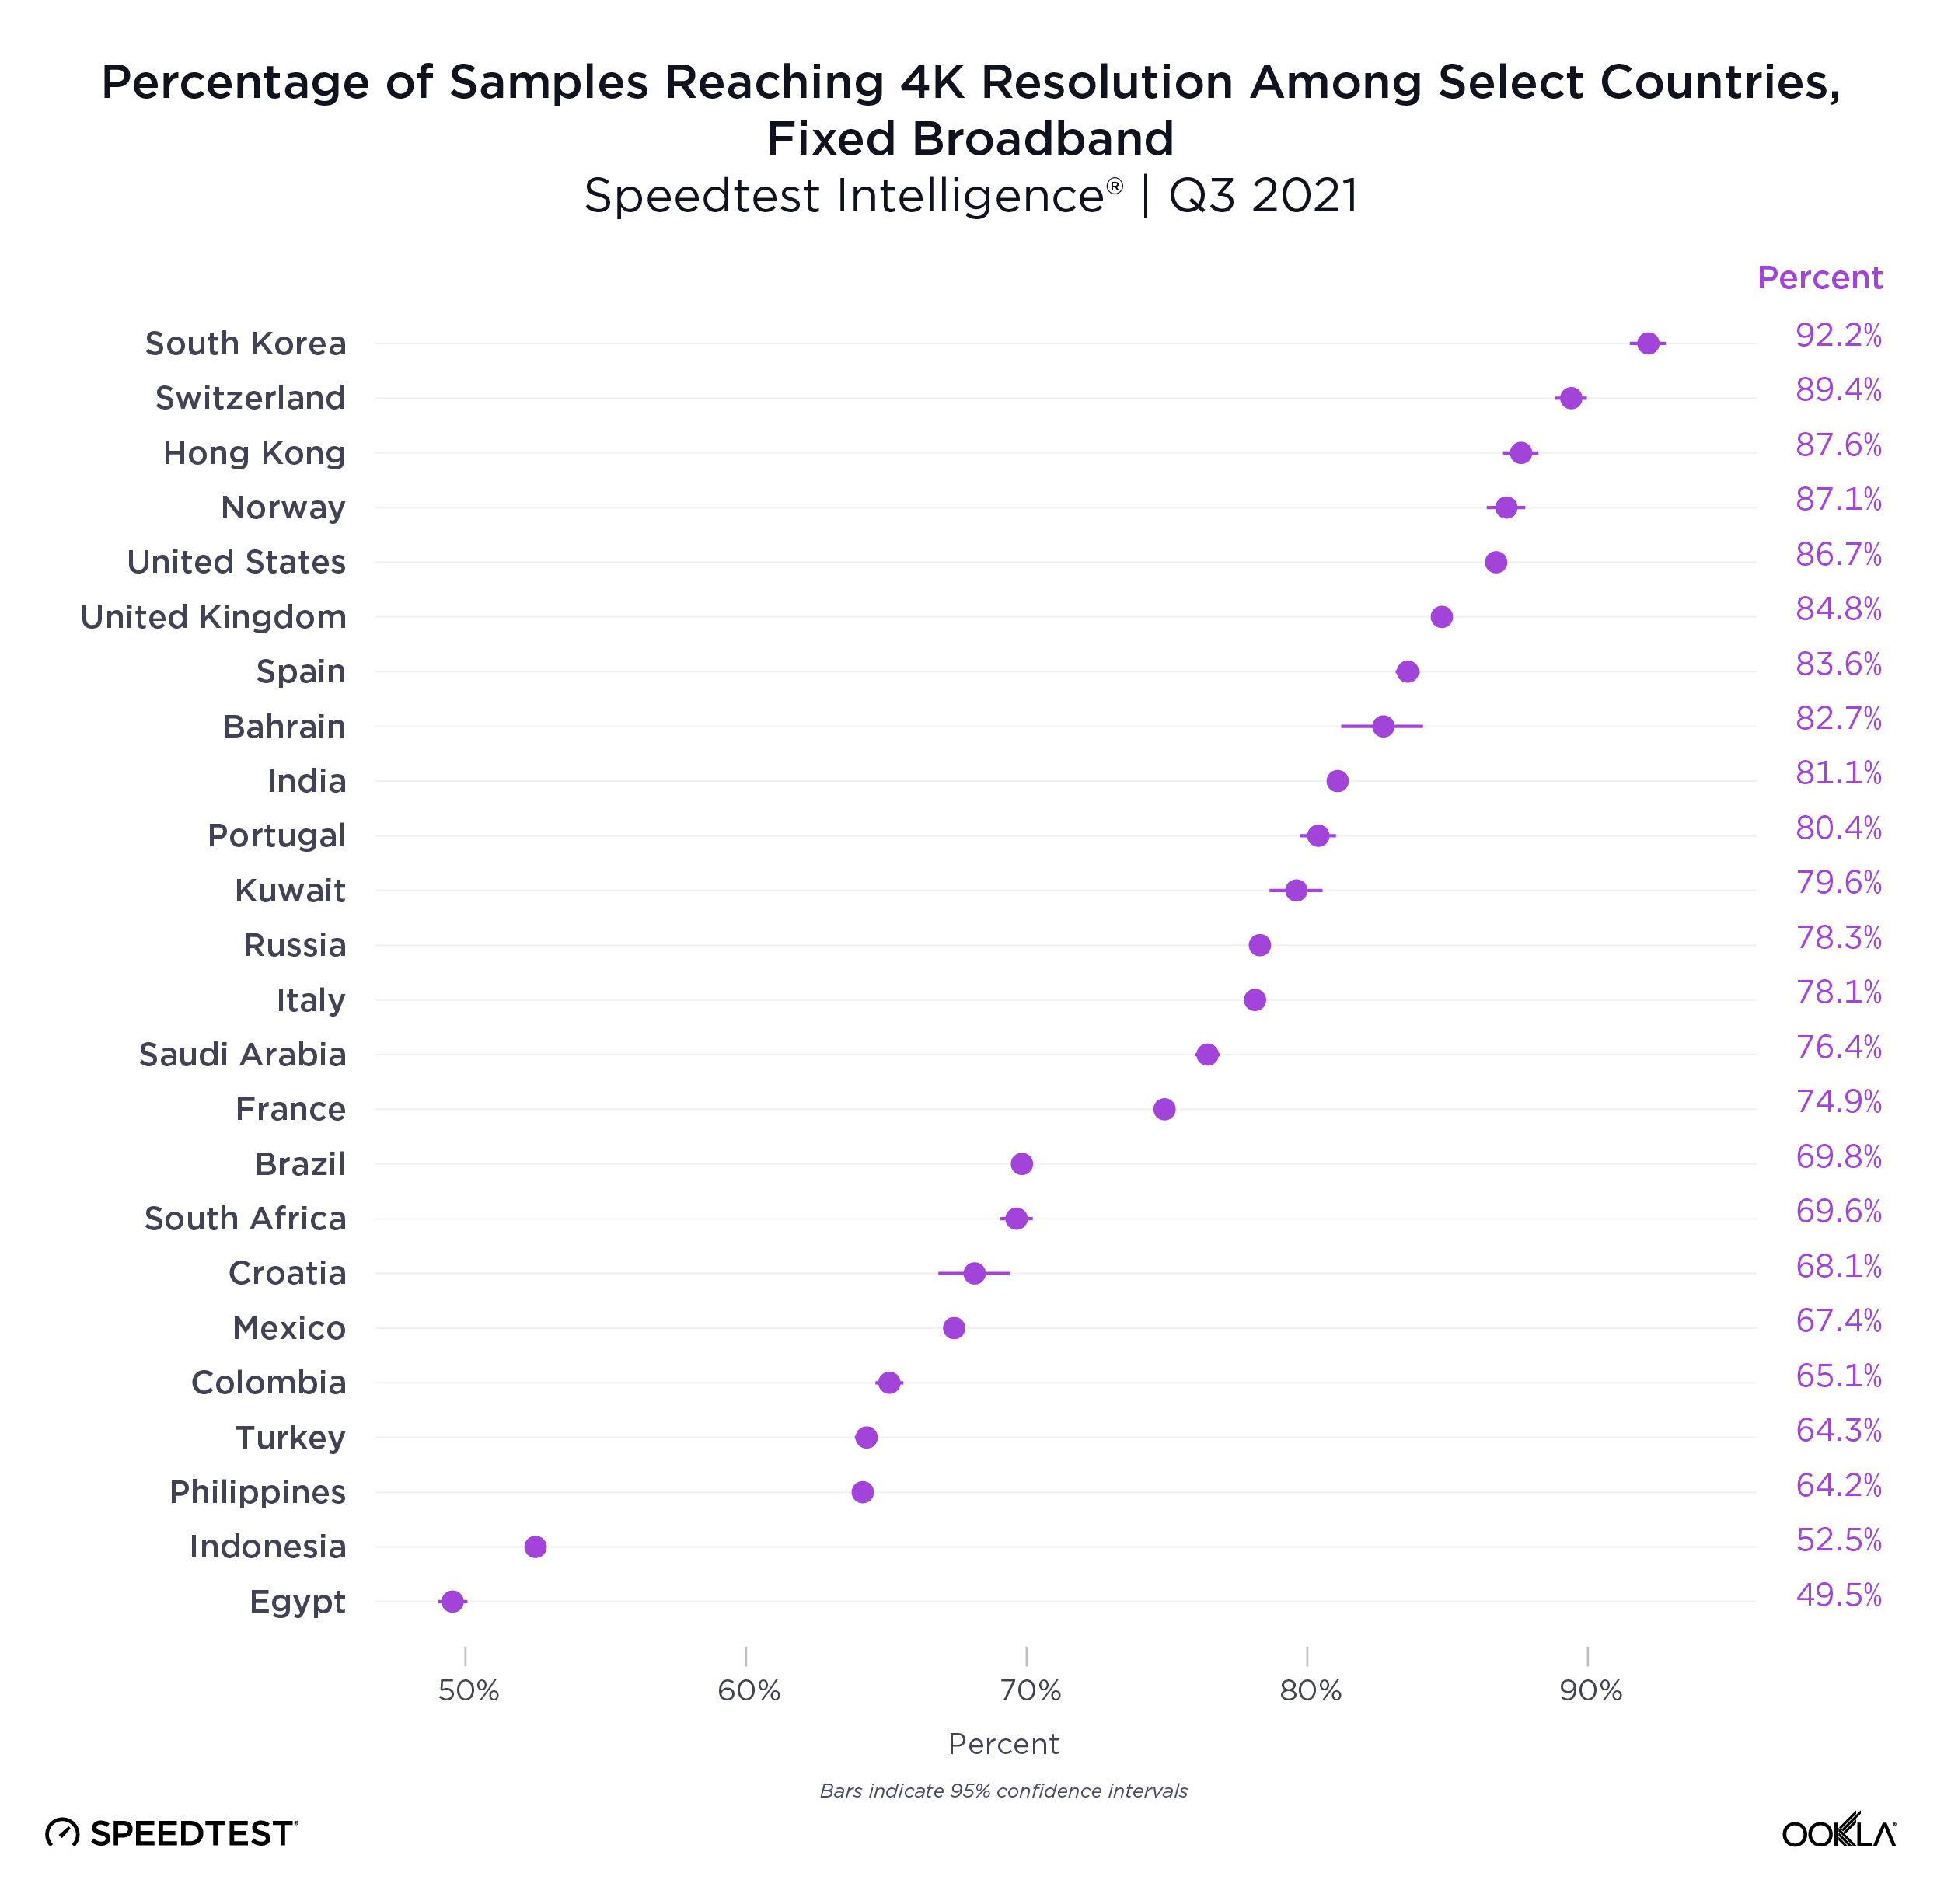
Speedtest Intelligence reveals South Korea had the highest fixed broadband 4K resolution rate among countries surveyed at 92.2% during Q3 2021. Other countries that achieved 4K resolution rates above 85.0% on fixed broadband during Q3 2021 included: Switzerland (89.4%), Hong Kong (87.6%), Norway (87.1%) and the U.S. (86.7%). Every other country in our analysis achieved 4K resolution rates between 65.0% and 85.0%, except Egypt (49.5%), Indonesia (52.5%), the Philippines (64.2%) and Turkey (64.3%).

Video Analytics gives you the information you need about your video playback

We’re excited to share more about video performance and quality of experience using Video Analytics in the coming months. In the meantime, if you want to learn more about Video Analytics and how it can help you benchmark and improve your network, please join our upcoming webinar, December 9 by clicking here.

Ookla retains ownership of this article including all of the intellectual property rights, data, content graphs and analysis. This article may not be quoted, reproduced, distributed or published for any commercial purpose without prior consent. Members of the press and others using the findings in this article for non-commercial purposes are welcome to publicly share and link to report information with attribution to Ookla.

| January 15, 2024

Fixed Internet Speeds are Improving in North Africa, and Fiber Could Boost Them Even Further

Français

Since 2020, fixed broadband speeds in North Africa have improved substantially. However, there is still potential for further enhancement and adoption. This article explores the performance drivers of fixed wired internet performance (excluding fixed wireless access (FWA)) in Algeria, Egypt, Morocco, and Tunisia between Q3 2020 and Q3 2023 and discusses the market prospects.

Key takeaways

  • Egypt leads North Africa in the Ookla Speedtest Global Index™ for fixed broadband in Q3 2023. Egypt widened its lead in North Africa, achieving a median download speed of 56.61 Mbps and an upload speed of 25.07 Mbps. Meanwhile, Algeria saw a significant improvement in median fixed broadband download speed, with a 4.5-fold increase to 11.34 Mbps between Q3 2020 and Q3 2023. Morocco’s upload speed has also significantly improved, rising more than 22-fold to 19.09 Mbps during that period.
  • North African countries adopted different DSL migration strategies. Egypt upgraded most of its ADSL to VDSL and concentrated FTTH/B in greenfield areas. On the other hand, Algeria focused on replacing copper lines with FTTH/B, while Morocco and Tunisia deployed VDSL in tandem with FTTH/B rollout.
  • Fiber upgrades and revised broadband packages help to boost speed. The deployment and adoption of FTTH/B do not necessarily lead to increased broadband speed. ISPs should consider increasing headline speeds of entry-level packages and offering discounts on higher-speed tiers to incentivize customers to upgrade.

Egypt tops North Africa in download and upload speeds for fixed broadband

In our June 2021 report on internet speed in North Africa, Egypt ranked first in North Africa for fixed broadband, followed by Morocco, Algeria, and Tunisia. All countries, except Tunisia, saw more than a 25% improvement in median broadband speeds from Q2 2020 to Q1 2021, with Algeria more than doubling its median broadband download speed.

This upward trend continued through Q3 2023, with most North African countries improving their median download and upload speeds over fixed broadband. This has resulted in a boost in their ranking in the Ookla Speedtest Global Index. Notably, Egypt extended its lead within North Africa, achieving a median download speed of 56.61 Mbps and a median upload speed of 25.07 Mbps.

Algeria showed a substantial improvement in median fixed broadband download speed between Q3 2020 and Q3 2023, increasing 4.5-fold to 11.34 Mbps. Other countries, except Tunisia, saw their median fixed broadband download speeds more than double over the same period.

Median Download Speed for Wired Fixed Broadband, Select African Countries
Speedtest Intelligence, Q3 2020 and Q3 2023

Morocco saw a significant rise in median upload speed, with a more than 22-fold increase to 19.09 Mbps in Q3 2023. Despite this, it still lags behind South Africa, the African leader, which boasts more than double the upload speed at 38.53 Mbps. The other North African countries saw more modest improvements in upload speeds, ranging from a 1.5-fold increase in Algeria to a 2.5-fold increase in Tunisia.

Median Upload Speed for Wired Fixed Broadband, Select African Countries
Speedtest Intelligence, Q3 2020 and Q3 2023

DSL and wireless access are the most common technologies used for fixed broadband services in North Africa

Digital Subscriber Line (DSL) is the leading technology for fixed broadband services in North Africa, as they use existing phone lines for internet connectivity. The two main types of DSL are Asymmetric Digital Subscriber Line (ADSL) with speeds of up to 24 Mbps and Very high-speed Digital Subscriber Line (VDSL) offering speeds of up to  52 Mbps for VDSL1 and 200 Mbps for VDSL2. The latter can be further enhanced with G.Fast technology.

VDSL employs fiber that terminates at a nearby cabinet, a configuration often referred to as Fiber-to-the-Cabinet (FTTC). The ‘last mile’ connection to users’ premises then uses existing copper lines. FTTC typically serves as a transitional step towards Fiber-to-the-Home/Building (FTTH/B), where the fiber extends directly to the user’s location premises.

In countries like Algeria and Tunisia, mobile broadband and FWA services that use 3G and 4G technologies account for almost 30% of all fixed broadband connections. However, these cellular connections are less prevalent in Morocco and Egypt. 4G offers download speeds comparable to ADSL and VDSL1 but falls short of VDSL2 and FTTH/B.

North Africa lags behind the Gulf region in fiber coverage, adoption, and internet speed. Ambitious fiber development plans placed Bahrain, Kuwait, Oman, Qatar, Saudi Arabia, and the U.A.E. high on the global speed leaderboard. For example, in Q3 2023, the U.A.E. ranked fourth on the Speedtest Global Index™ with a median download speed of 231.98 Mbps. Kuwait ranked twenty-second, and Qatar twenty-third. Other Gulf countries trailed the U.A.E. but were ahead of all markets in North Africa.

Fixed internet speeds are still relatively low in North Africa despite significant improvements in FTTH/B access

The slow pace of fiber deployment compared to the Gulf countries can be attributed to factors such as limited public funding, restrictive telecom regulations, scant private investments, as well as geographical and urbanization challenges. Most North African countries also have a larger land mass, more varied geology, and a lower level of urbanization, making fiber deployment more complex and costly.

The market’s competitive landscape is also a factor, with incumbents controlling over 80% of fixed internet subscriptions. Even in Tunisia, which boasts more alternative ISPs, Tunisie Telecom holds the majority of DSL and fiber subscriptions. By contrast, alternative network providers play a key role in accelerating fiber adoption in Europe. Furthermore, North Africans have a lower income than Gulf residents, and most cannot afford high-speed broadband services because of their high costs.

Market challenges delayed fiber deployment and limited service adoption and innovation. However, local ISPs have made significant progress since 2020 in upgrading the fixed infrastructure and making their services more affordable. Egypt has primarily upgraded its ADSL to VDSL and focused FTTH/B deployments in greenfield areas. Algeria concentrated on replacing copper lines with FTTH/B while Morocco and Tunisia deployed VDSL while also progressing with FTTH/B rollout.

As of June 2023, Algeria has the highest number of FTTH/B connections in North Africa, totaling 800,000. Morocco follows closely with 730,000 connections and boasts the largest fiber share of the wired broadband market (see chart below). Egypt has the highest number of VDSL connections in the region, and an estimated few hundred thousand active FTTH/B customers as of September 2023. Tunisia is in fourth position with 55,000 FTTH/B connections and 176,000 VDSL connections.

In the following sections, we provide an overview of the fixed broadband market in Algeria, Egypt, Morocco, and Tunisia. We highlight the status of fiber rollout, and its impact on network performance, and discuss ISPs’ future deployment plans.

FTTH/B Connections, Algeria, Morocco and Tunisia
Telecoms Regulators, ISPs | 2019-Q2 2023

FTTH/B Connections and Share of Fixed Wired Connections, Algeria, Morocco and Tunisia
Telecoms Regulators, ISPs | 2019-Q2 2023

Significant progress achieved in fiber coverage in Algeria but room to drive adoption and boost speed

As of March 2023, Algeria boasted over 3.4 million fixed wired connections, according to the Autorité de Régulation de la Poste et des Communications Electroniques (ARPCE). The state-owned Algerie Telecom (AT) is the sole provider of wired broadband services. With an additional 1.5 million 4G FWA connections, Algeria is among Africa’s largest fixed broadband markets.

AT prioritized the replacement of copper lines with fiber in major cities while maintaining its ADSL services. It also used 4G FWA technology to service areas where wired infrastructure is unavailable or costly to deploy. AT was late to the game but it rapidly expanded FTTH/B services since their introduction in 2018. It also increased maximum speeds on fiber from 100 Mbps to 300 Mbps for consumers in 2023. AT introduced regular promotions, such as free speed doubling for new customers. It has also reduced tariffs every year since 2020, with a 100 Mbps fiber line costing $22/month in 2023. These actions contributed to the surge in the number of fiber subscribers by nearly 14-fold between 2020 and November 2023, reaching the 1 million milestone, making Algeria one of the largest FTTH/B markets in Africa.

Fixed Broadband Connections by Technology, Algeria
ARPCE | 2019-Q1 2023

The migration from ADSL to FTTH has undoubtedly improved the quality of service for consumers. However, it has yet to boost the speed that most households experience. While the download speed of the fastest 10% samples increased from 8.01 Mbps in Q3 2020 to 45.71 Mbps in Q3 2023, the median download speed only reached 11.34 Mbps during that period, according to Ookla Speedtest Intelligence® data.

According to the ARPCE, more than 85% of connections had a download speed of 10 Mbps in March 2023. To improve the country’s median download speed, AT should increase the speed of its entry-level fiber package from the current 10-15 Mbps. It should also work towards lowering the price of its higher-speed packages. The government proposed to exempt fixed broadband services from VAT in 2024, which should help make it more affordable for customers to upgrade to higher-speed packages.

AT has set ambitious goals to expand its fiber coverage substantially. The number of households passed by fiber (i.e. premises that can connect to the fiber network) is expected to increase from 3.5 million in 2022 to 6 million by 2024 (out of an estimated 7.4 million households). This is part of the government’s broader strategy to provide two-thirds of households with fixed broadband service by 2024, potentially adding 2 million new subscribers to the market.

Rapid network performance improvement in Egypt thanks to the incumbent’s ambitious FTTC strategy

With nearly 11 million subscribers at the end of 2022, Egypt is North Africa’s biggest fixed broadband telecoms market. State-owned Telecom Egypt (TE) dominates the sector, controlling over 80.1% of the market with over 8.7 million fixed broadband subscribers.

Other operators such as Vodafone, Orange, and Etisalat by e&, offer broadband services through wholesale access to TE’s network. This allows them to provide comparable broadband speeds. Notably, the combined market share of these alternative ISPs has been on an upward trend year-on-year since 2019.

TE’s strategic focus has been to develop its core and transmission networks, upgrade ADSL to VDSL, and expand fiber to the street cabinets. As of September 2023, TE connected 95% of households to the next-generation FTTC network (up from 85% in 2019).

The introduction of VDSL services in Egypt in 2018 marked a significant shift in broadband speeds, raising the maximum from 16 Mbps to 100 Mbps. TE took this opportunity to increase the speed of its entry-level plan from 5 Mbps to 30 Mbps, with a modest price increase of 9%. Infrastructure upgrades also positively impacted alternative ISPs that boosted their broadband packages’ speeds.

These improvements in VDSL coverage, speeds, and affordability significantly accelerated the adoption of broadband services. The number of fixed broadband subscribers surged by 55% from the end of 2019 to June 2023. Raising the minimum broadband speed to 30 Mbps led to a substantial increase in the country’s median download speed to 56.61 Mbps in Q3 2023, up from 25.07 Mbps in Q3 2020, according to Ookla Speedtest Intelligence. Given that TE currently offers speeds of up to 150 Mbps, there’s ample opportunity to enhance download speeds further.

Fixed Broadband Connections by ISP, Egypt
Telecom Egypt | 2019-Q2 2023

TE launched FTTH/B services in 2009, making Egypt among the early adopters of fiber in the region. It prioritized FTTH/B deployments in greenfield areas such as new developments, gated communities, and residential compounds. TE aims to eventually migrate existing VDSL customers to FTTH/B.

The government allocated a $360 million budget in 2021 to extend Fiber-To-The-Home (FTTH) to a million households to improve fiber accessibility. The development of ‘New Cairo,’ a new mega-city located 35 km east of the Capital, is also expected to spur demand for fiber services.

The competitive fiber market in Morocco drove broadband adoption and speed improvements

Maroc Telecom (MT) dominates the fixed broadband market in Morocco. The operator’s control over the copper infrastructure has spurred other ISPs, inwi and Orange, to develop their own fiber infrastructure and lease capacity from local utility and transport companies.

The fixed wired broadband market has been expanding rapidly in Morocco, increasing from just over 1.6 million in 2019 to over 2.2 million connections in June 2023 (out of around 8 million households). This growth is mainly due to a shift from DSL to FTTH/B since 2020, as observed in the chart below.

Fixed Broadband Connections by Technology, Morocco
ANRT | 2019-Q2 2023

Consumers have been leaning toward faster and more reliable services, with demand for DSL connections falling since 2020 and FWA adoption decreasing since 2022. MT launched fiber in 2014 as a premium service with speeds of 100 Mbps and 200 Mbps. In 2022, MT accelerated the deployment of its FTTH/B network and increased network capacity by 40% year-on-year in June 2023, helping to expand its fiber customer base by 43%.

inwi and Orange introduced their fiber services in 2018, offering a broader range of speeds starting from 20 Mbps and lower price points than MT at the high end. These services are available in big cities like Casablanca, Rabat, and Fez. They accounted collectively for 52.69% of the fiber market in June 2023 which shows that the segment is quite competitive in Morocco.

This has resulted in a boost to user-end speeds. As of Q3 2023, the median download speed of fixed internet services had increased to 21.68 Mbps, up from 9.07 Mbps in Q3 2020, according to Ookla Speedtest Intelligence data. There has been a marked shift to higher-speed broadband packages, as evidenced by the fact that 17.3% of fixed broadband subscribers had speeds of at least 20 Mbps in June 2023, a dramatic increase from only 0.6% in 2019 who had a minimum speed of 16 Mbps, according to the Agence Nationale de Réglementation des Télécommunications (ANRT)

As only around one-third of wired broadband subscribers in Morocco use FTTH/B, there is still an ample opportunity to migrate more DSL customers to fiber and encourage existing fiber users to upgrade to higher-speed packages. This is especially relevant for inwi and Orange as they offer more affordable fiber packages starting at 20 Mbps, compared to MT’s 100 Mbps fiber package which costs around $50/month.

Looking ahead, the Moroccan government has ambitious plans to connect more households to high-speed broadband services under the “Maroc Digital 2030” program. The government aims to connect 5 million households with fiber by 2026, potentially making Morocco one of the largest FTTH/B markets in Africa.

Limited infrastructure sharing and investments in Tunisia constrained speed improvement

Tunisia has the lowest fixed download speeds in North Africa at 8.61 Mbps in Q3 2023, according to Ookla Speedtest Intelligence. This is despite having eight ISPs – compared to one in Algeria, three in Morocco, and five in Egypt. The poor network performance is due to the limited coverage of high-speed broadband services and their unaffordability for many households. For example, a 50 Mbps VDSL line costs more than $26/month. Furthermore, it was not until 2022 that the ISPs lifted the speed of basic DSL packages from 4 Mbps to 10 Mbps

The wired broadband sector has consistently grown, reaching over 1.2 million subscribers by June 2023. This represents a 50% increase from 2019 levels. Interestingly, this growth rate outpaced that of the 4G fixed wireless access segment, which only saw a 27.4% increase, reaching just over 470,000 connections during the same period. On the other hand, fiber service remains a niche offering due to its limited coverage and high cost. Fiber share of the fixed wired broadband market saw a minor increase, rising from 3.0% in 2019 to a modest 4.5% in June 2023.

Fixed Broadband Connections by Technology, Tunisia
INT | 2019-Q2 2023

Tunisie Telecom (TT), a state-owned entity, holds the majority stake in the fixed broadband sector. TT controls the national copper infrastructure, operates the nationwide fiber-optic backbone, and competes both directly and indirectly in the retail market via its subsidiary, Topnet. Ownership of TT is divided between the Tunisian state (at 65%) and Emirates International Telecommunications (EIT, at 35%).

TT maintains a strong position within this sector, controlling 72.9% of all fiber connections in Tunisia by June 2023. This figure includes direct customers (39.1%) and those provided through Topnet (33.8%). Fiber services, which were launched in 2012, are only available in Greater Tunis and Sfax. Additionally, TT dominates the VDSL market with a substantial 92.4% market share, mostly through Topnet.

Regulatory pressure from the telecom authority INT (Instance Nationale des Telecommunications) has urged TT to reduce its network access charges and expedite line activation to help other ISPs. Despite these efforts, various challenges persist, prompting operators such as Ooredoo and Orange to supplement their wired offerings with mobile broadband services based on 3G and 4G, in addition to TD-LTE-based FWA.

Ooredoo, which introduced fiber services in 2013, saw its share of the fiber market rise to 16.8% by June 2023. Its fiber network covers Greater Tunis and Sfax. Orange, however, lacks consumer fiber offerings. Other ISPs, including Bee, GlobalNet, and HexaByte, use a mix of ADSL, VDSL, and FTTH/B by accessing TT’s infrastructure.

In the short term, TT plans to upgrade most DSL ports to VDSL and promote higher-speed packages. This strategy aims to increase the average fixed speed from 10 Mbps in 2022 to 50 Mbps in 2024. Over the medium term, TT aims to expand its FTTH coverage and capacity from 100,000 connections in 2022 to 500,000 by 2025. These initiatives are expected to enhance fiber service accessibility and improve the country’s median download and upload speeds.

Furthermore, the INT initiated a consultation in August 2023 to set the conditions required to share facilities to avoid infrastructure duplication and ensure efficient fiber investments. The proposal is to have all ISPs and infrastructure operators provide shared access to their telecom facilities after 12 months of commercial operations. This initiative should help expand fiber coverage, reduce access costs, and support the development of 5G.

Fiber can further unlock the connectivity potential in North Africa

As discussed above, North African ISPs have adopted various strategies to roll out fiber and promote its take-up. They have made considerable strides in enhancing fiber accessibility and fixed broadband speed since 2020. However, a significant gap remains when compared to more advanced markets in the Middle East and Africa.

To bridge this gap, it is essential to facilitate fiber investment through public-private partnerships, promote infrastructure sharing, encourage competition, provide robust regulatory frameworks, and increase international bandwidth. Such initiatives will make high-speed broadband services more affordable and accessible, which is integral to advancing national digital transformation and boosting economic growth.

Ookla has been working with ISPs, such as Bahrain Network (BNET) and telecoms regulators, to support their national broadband plans, track improvements to fiber connectivity and coverage, and promote their networks to consumers. If you are interested in Ookla’s solutions and services for network intelligence and management, get in touch.


La Vitesse de l’Internet Fixe s’Améliore en Afrique du Nord, et la Fibre Pourrait l’Augmenter Encore d’Avantage

English

Depuis 2020, les débits du haut débit fixe en Afrique du Nord se sont considérablement améliorés. Cependant, il existe encore un potentiel d’amélioration et d’adoption. Cet article s’intéresse aux facteurs de performance de l’Internet fixe filaire (hors accès fixe sans fil (FWA)) en Algérie, en Égypte, au Maroc et en Tunisie, entre le troisième trimestre 2020 et le troisième trimestre 2023 et discute des perspectives du marché.

À retenir

  • L’Égypte est en tête de l’Afrique du Nord dans le Speedtest Global Index™ pour le haut débit fixe au troisième trimestre 2023. L’Égypte a élargi son avance en Afrique du Nord, atteignant une valeur médiane du débit descendant de 56,61 Mbps et celle du débit ascendant de 25,07 Mbps. Parallèlement, l’Algérie a connu une amélioration significative du débit descendant sur le fixe, avec une multiplication par 4,5 pour atteindre 11,34 Mbps entre le troisième trimestre 2020 et le troisième trimestre 2023. Le débit ascendant au Maroc s’est également considérablement amélioré, multiplié par plus de 22 pour atteindre 19,09 Mbps au cours de cette période.
  • Les pays d’Afrique du Nord ont adopté différentes stratégies de migration DSL. L’Égypte a mis à niveau la plupart de son ADSL vers le VDSL et a concentré le FTTH/B pour le déploiement .dans de nouvelles zones. D’autre part, l’Algérie s’est concentrée sur le remplacement des lignes de cuivre par du FTTH/B, tandis que le Maroc et la Tunisie ont déployé le VDSL parallèlement au déploiement du FTTH/B.
  • Les mises à niveau de la fibre optique et les forfaits haut débit révisés contribuent à augmenter la vitesse. Le déploiement du FTTH/B et son adoption ne conduisent pas nécessairement à une augmentation de la vitesse de haut débit. Les FAI devraient envisager d’augmenter les vitesses de pointe des forfaits d’entrée de gamme et d’offrir des réductions sur les niveaux de vitesse plus élevés pour inciter les clients à améliorer leur forfait.

L’Égypte est en tête de l’Afrique du Nord en termes de débit descendant et ascendant pour le haut débit fixe

Dans notre rapport de juin 2021 sur le débit Internet en Afrique du Nord, l’Égypte se classe au premier rang en Afrique du Nord pour le haut débit fixe, suivie du Maroc, de l’Algérie et de la Tunisie. Tous les pays, à l’exception de la Tunisie, ont connu une amélioration de plus de 25 % des valeurs médianes du débit descendant entre le deuxième trimestre 2020 et le premier trimestre 2021, l’Algérie ayant plus que doublé sa valeur médiane du débit descendant.

Cette tendance à la hausse s’est poursuivie jusqu’au troisième trimestre 2023, la plupart des pays d’Afrique du Nord améliorant leurs valeurs médianes médianes du débit descendant et ascendant sur le haut débit fixe. Cela a permis d’améliorer leur classement dans l’Ookla Speedtest Global Index™. L’Égypte a notamment accru son avance en Afrique du Nord, atteignant une valeur médiane du débit descendant de 56,61 Mbps et une valeur médiane du débit ascendant de 25,07 Mbps.

L’Algérie a enregistré une amélioration substantielle de la valeur médiane du débit descendant sur le fixe entre le troisième trimestre 2020 et le troisième trimestre 2023, augmentant de 4,5 fois à 11,34 Mbps. D’autres pays, à l’exception de la Tunisie, ont vu leurs valeurs médianes du débit descendant sur le fixe plus que doubler au cours de la même période.

Valeur Médiane du Débit Descendant sur le Fixe Filaire dans Certains Pays Africains
Speedtest Intelligence, T3 2020 and T3 2023

Le Maroc a connu une augmentation significative de la valeur médiane du débit ascendant, avec une multiplication par plus de 22 pour atteindre 19,09 Mbps au troisième trimestre 2023. Malgré cela, il reste à la traîne de l’Afrique du Sud, le leader africain, qui affiche plus du double du débit ascendant, à 38,53 Mbps. Les autres pays d’Afrique du Nord ont connu des améliorations plus modestes du débit ascendant, allant d’une multiplication par 1,5 en Algérie à une multiplication par 2,5 en Tunisie.

Valeur Médiane du Débit Ascendant sur le Fixe Filaire dans Certains Pays Africains
Speedtest Intelligence, T3 2020 et T3 2023

L’accès DSL et sans fil sont les technologies les plus couramment utilisées pour les services de haut débit fixe en Afrique du Nord.

La ligne d’abonné numérique (DSL) est la principale technologie pour les services fixes à haut débit en Afrique du Nord, exploitant les lignes téléphoniques existantes pour la connectivité Internet. Les deux principaux types de DSL sont la ligne d’abonné numérique asymétrique (ADSL) avec des vitesses allant jusqu’à 24 Mbps et la ligne d’abonné numérique à très haut débit (VDSL) offrant des vitesses allant jusqu’à 52 Mbps pour le VDSL1 et 200 Mbps pour le VDSL2. Cette dernière peut être encore améliorée grâce à la technologie G.Fast.

Le VDSL utilise une fibre optique qui se termine à une armoire à proximité, une configuration souvent appelée Fiber-to-the-Cabinet (FTTC). La connexion du « dernier mile » vers les locaux des utilisateurs utilise ensuite les lignes de cuivre existantes. Le FTTC sert généralement d’étape de transition vers la fibre jusqu’au domicile/bâtiment (FTTH/B), où la fibre s’étend directement jusqu’aux locaux de l’utilisateur.

En Algérie et la Tunisie, les services haut débit mobile et FWA qui utilisent les technologies 3G et 4G représentent près de 30 % de toutes les connexions haut débit fixes. Toutefois, ces connexions cellulaires sont moins répandues au Maroc et en Égypte. La 4G offre des débits descendants comparables à l’ADSL et au VDSL1 mais inférieures au VDSL2 et au FTTH/B.

L’Afrique du Nord est à la traîne par rapport à la région du Golfe en termes de couverture, d’adoption et de vitesse Internet de la fibre optique. Des plans ambitieux de développement de la fibre optique ont placé le Bahreïn, le Koweït, Oman, le Qatar, l’Arabie saoudite et les Émirats arabes unis en tête du classement mondial de vitesse. Par exemple, au troisième trimestre 2023, les Émirats arabes unis, classés quatrièmes dans le Speedtest Global Index™ avec une valeur médiane du débit descendant de 231,98 Mbps. Le Koweït s’est classé vingt-deuxième et le Qatar vingt-troisième. Les autres pays du Golfe sont à la traîne des Émirats arabes unis, mais étaient en avance sur tous les marchés d’Afrique du Nord.

Les débits Internet fixes restent relativement faibles en Afrique du Nord malgré des améliorations significatives de l’accès FTTH/B

La lenteur du déploiement de la fibre optique par rapport aux pays du Golfe peut être attribuée à des facteurs tels qu’un financement public limité, des réglementations restrictives en matière de télécommunications, des investissements privés limités, ainsi que des défis géographiques et d’urbanisation. La plupart des pays d’Afrique du Nord ont également une plus grande superficie terrestre, une géologie plus variée et un niveau d’urbanisation plus faible, ce qui rend le déploiement de la fibre optique plus complexe et plus coûteux.

Le paysage concurrentiel du marché joue également un rôle, les opérateurs historiques contrôlant plus de 80 % des abonnements Internet fixes. Même en Tunisie, qui compte davantage de FAI alternatifs, Tunisie Télécom détient la majorité des abonnements DSL et fibre. En revanche, les fournisseurs de réseaux alternatifs jouent un rôle clé dans l’accélération de l’adoption de la fibre optique en Europe. En outre, les Nord-Africains ont un revenu inférieur à celui des résidents du Golfe, et la plupart ne peuvent pas se permettre les services à haut débit en raison de leurs coûts élevés.

Les défis du marché ont retardé le déploiement de la fibre et limité l’adoption et l’innovation des services. Cependant, les FAI locaux ont réalisé des progrès significatifs depuis 2020 en modernisant l’infrastructure fixe et en rendant leurs services plus abordables. L’Égypte a principalement mis à niveau son ADSL vers le VDSL et concentré les déploiements FTTH/B dans les zones en friche. Pendant ce temps, l’Algérie s’est concentrée sur le remplacement des lignes de cuivre par du FTTH/B. Le Maroc et la Tunisie ont déployé le VDSL tout en progressant dans le déploiement du FTTH/B.

En juin 2023, l’Algérie possède le plus grand nombre de connexions FTTH/B en Afrique du Nord, soit 800 000. Le Maroc suit de près avec 730 000 connexions et possède la plus grande part de fibre sur le marché du haut débit filaire (voir graphique ci-dessous). L’Égypte possède le plus grand nombre de connexions VDSL de la région et comptait quelques centaines de milliers de clients FTTH/B actifs en septembre 2023. La Tunisie occupe la quatrième position avec 55 000 connexions FTTH/B et 176 000 connexions VDSL.

Dans les sections suivantes, nous donnons un aperçu du marché du haut débit fixe en Algérie, en Égypte, au Maroc et en Tunisie. Nous mettons en évidence l’état du déploiement de la fibre optique et son impact sur les performances du réseau, et discutons des futurs plans de déploiement des FAI.

Connexions FTTH/B, Algérie, Maroc et Tunisie
Autorités de régulation des télécommunications, FAI | 2019-T2 2023

Connexions FTTH/B et part des connexions filaires fixes, Algérie, Maroc et Tunisie
Autorités de Régulation des Télécommunications, FAI | 2019-T2 2023

Des progrès significatifs réalisés dans la couverture de la fibre optique en Algérie, mais il reste encore de la marge pour stimuler l’adoption et augmenter la vitesse

En mars 2023, l’Algérie comptait plus de 3,4 millions de connexions filaires fixes, selon l’ Autorité de Régulation de la Poste et des Communications Electroniques (ARPCE). La société publique Algérie Télécom (AT) est l’unique fournisseur de services haut débit filaires. Avec 1,5 million de connexions 4G FWA supplémentaires, l’Algérie figure parmi les plus grands marchés du haut débit fixe d’Afrique.

AT a privilégié le remplacement des lignes de cuivre par de la fibre dans les grandes villes tout en conservant ses services ADSL. Il a également utilisé la technologie 4G FWA pour desservir les zones où l’infrastructure filaire n’est pas disponible ou est coûteuse à déployer. AT a tardé à adopter la technologie, mais a rapidement étendu ses services FTTH/B depuis leur introduction en 2018. Il a également augmenté les vitesses maximales sur la fibre de 100 Mbps à 300 Mbps pour les consommateurs en 2023. AT a introduit des promotions régulières, telles que le doublement de la vitesse gratuit pour les nouveaux clients. Il a également réduit ses tarifs chaque année depuis 2020, avec une ligne fibre 100 Mbps coûtant 22 dollars/mois en 2023. Ces actions ont contribué à multiplier par près de 14 le nombre d’abonnés fibre entre 2020 et novembre 2023, pour atteindre le jalon important d’un million, faisant de l’Algérie l’un des plus grands marchés FTTH/B en Afrique.

Connexions à Haut Débit Fixe par Technologie, Algérie
ARPCE | 2019-T1 2023

La migration de l’ADSL vers le FTTH a sans aucun doute amélioré la qualité de service pour les consommateurs. Cependant, il lui reste encore à augmenter la vitesse que connaissent la plupart des ménages. Alors que le débit descendant des 10 % d’échantillons les plus rapides est passée de 8,01 Mbps au troisième trimestre 2020 à 45,71 Mbps au troisième trimestre 2023, la valeur médiane n’a atteint que 11,34 Mbps au cours de cette période, selon les données d’Ookla Speedtest Intelligence®.

Selon l’ARPCE, plus de 85 % des connexions avaient un débit descendant de 10 Mbps en mars 2023. Pour améliorer le débit descendant du pays, AT devrait augmenter le débit descendant de son forfait fibre d’entrée de gamme, qui est entre 10 et 15 Mbps. Il devrait également s’efforcer de réduire le prix de ses forfaits à vitesse plus élevée. Le gouvernement a proposé d’exonérer de TVA les services à haut débit fixe en 2024, ce qui devrait permettre aux clients de passer à un forfait à vitesse plus élevée plus abordable.

AT s’est fixé des objectifs ambitieux pour étendre considérablement sa couverture fibre. Le nombre de foyers desservis par la fibre (c’est-à-dire de locaux pouvant se connecter au réseau fibre) devrait passer de 3,5 millions en 2022 à 6 millions d’ici 2024 (sur un nombre estimé de 7,4 millions de foyers). Cela fait partie de la stratégie plus large du gouvernement visant à fournir un service haut débit fixe à deux tiers des foyers d’ici 2024, ce qui pourrait ajouter 2 millions de nouveaux abonnés au marché.

Amélioration rapide des performances du réseau en Égypte grâce à la stratégie ambitieuse FTTC de l’opérateur historique

Avec près de 11 millions d’abonnés fin 2022, l’Égypte est le premier marché de télécommunications à haut débit fixe d’Afrique du Nord. La société d’État Telecom Egypt (TE) domine le secteur, contrôlant plus de 80,1 % du marché avec plus de 8,7 millions d’abonnés au haut débit fixe.

D’autres opérateurs tels que Vodafone, Orange et Etisalat by e&, offrent des services haut débit via un accès de gros au réseau de TE. Cela leur permet de fournir des vitesses haut débit comparables. Il convient de noter que la part de marché combinée de ces FAI alternatifs suit une tendance à la hausse d’année en année depuis 2019.

L’objectif stratégique de TE a été de développer ses réseaux centraux et de transmission, de mettre à niveau l’ADSL vers le VDSL et d’étendre la fibre jusqu’aux armoires de rue. En septembre 2023, TE a connecté 95 % des foyers au réseau FTTC de nouvelle génération (contre 85 % en 2019).

L’introduction des services VDSL en Égypte en 2018 a marqué un changement significatif dans les vitesses du haut débit, augmentant le maximum de 16 Mbps à 100 Mbps. TE a aussi augmenté la vitesse de son forfait d’entrée de gamme de 5 Mbps à 30 Mbps, avec une modeste augmentation de prix de 9%. Les mises à niveau des infrastructures ont également eu un impact positif sur les FAI alternatifs, qui ont augmenté les vitesses de leurs forfaits haut débit.

Ces améliorations de la couverture VDSL, des vitesses et du prix abordable ont considérablement accéléré l’adoption des services haut débit. Le nombre d’abonnés au haut débit fixe a bondi de 55% entre fin 2019 et juin 2023. L’augmentation de la vitesse minimale du haut débit à 30 Mbps a entraîné une augmentation substantielle de la valeur médiane du débit descendant du pays, à 56,61 Mbps au troisième trimestre 2023, contre 25,07 Mbps au troisième trimestre 2020, selon Ookla Speedtest Intelligence. Étant donné que TE offre actuellement des vitesses allant jusqu’à 150 Mbps, il existe de nombreuses possibilités d’améliorer encore le débit descendant.

Connexions à Haut Débit Fixe par FAI, Egypte
Telecom Egypt | 2019-T2 2023

TE a lancé les services FTTH/B en 2009, faisant de l’Égypte l’un des premiers utilisateurs de la fibre optique dans la région. Il a donné la priorité aux déploiements FTTH/B dans des zones vierges telles que les nouveaux développements et les complexes résidentiels. TE vise à terme à migrer les clients VDSL existants vers FTTH/B.

Le gouvernement a alloué un budget de 360 millions de dollars en 2021 pour étendre la fibre jusqu’au domicile (FTTH) à un million de foyers afin d’améliorer l’accessibilité à la fibre. Le développement du “Nouveau Caire”, une nouvelle mégapole située à 35 km à l’est de la capitale, devrait également stimuler la demande de services de fibre optique.

Le marché concurrentiel de la fibre optique au Maroc a favorisé l’adoption du haut débit et l’amélioration de la vitesse

Maroc Telecom (MT) domine le marché du haut débit fixe au Maroc. Le contrôle de l’opérateur sur l’infrastructure cuivre a incité d’autres FAI, inwi et Orange, à développer leur propre infrastructure fibre, et louer de la capacité auprès des sociétés de services publics et de transport locales.

Le marché du haut débit fixe filaire connaît une croissance rapide au Maroc, passant d’un peu plus de 1,6 million en 2019 à plus de 2,2 millions de connexions en juin 2023 (sur environ 8 millions de foyers). Cette croissance est principalement due au passage du DSL au FTTH/B depuis 2020, comme on l’observe dans le graphique ci-dessous.

Connexions à Haut Débit Fixe par Technologie, Maroc
ANRT | 2019-T2 2023

Les consommateurs se tournent vers des services plus rapides et plus fiables, avec une demande de connexions DSL en baisse depuis 2020 et une adoption FWA en baisse depuis 2022. MT a lancé la fibre en 2014, offrant un service premium à 100 Mbps et 200 Mbps. En 2022, MT a accéléré le déploiement de son réseau FTTH/B et a augmenté la capacité de son réseau de 40 % sur un an en juin 2023, contribuant ainsi à élargir sa base de clients fibre de 43 %.

inwi et Orange ont lancé leurs services fibre en 2018, offrant une gamme de vitesses plus large à partir de 20 Mbps et des prix inférieurs à ceux de MT pour le haut de gamme. Ces services sont disponibles dans les grandes villes comme Casablanca, Rabat et Fès. Ils représentaient collectivement 52,69 % du marché de la fibre en juin 2023, ce qui montre que le segment est assez compétitif au Maroc.

Cela a entraîné une augmentation des vitesses côté utilisateur. Au troisième trimestre 2023, la valeur médiane du débit descendant des services Internet fixes était passée à 21,68 Mbps, contre 9,07 Mbps au troisième trimestre 2020, selon les données d’Ookla Speedtest Intelligence. Il y a eu une évolution marquée vers les forfaits haut débit fixe de vitesse supérieure, comme en témoigne le fait qu’en juin 2023, 17,3 % des abonnés au haut débit fixe disposaient d’une vitesse d’au moins 20 Mbps, soit une augmentation spectaculaire par rapport à seulement 0,6 % en 2019 qui avaient des vitesses d’au moins 16 Mbps, selon l’Agence Nationale de Réglementation des Télécommunications (ANRT)

Étant donné qu’environ un tiers seulement des abonnés au haut débit filaire au Maroc utilisent le FTTH/B, il existe encore de nombreuses opportunités de migrer davantage de clients DSL vers la fibre et d’encourager les utilisateurs existants de la fibre à passer à des forfaits à plus haut débit. Ceci est particulièrement pertinent pour inwi et Orange, car ils proposent des forfaits fibre plus abordables à partir de 20 Mbps, par rapport au forfait fibre 100 Mbps de MT qui coûte environ 50 $/mois.

Pour l’avenir, le gouvernement marocain a des projets ambitieux pour connecter davantage de foyers aux services à haut débit dans le cadre du programme “Maroc Digital 2030”. Le gouvernement vise à connecter 5 millions de foyers à la fibre optique d’ici 2026, faisant potentiellement du Maroc l’un des plus grands marchés FTTH/B d’Afrique.

Le partage limité des infrastructures et des investissements en Tunisie ont restreint l’amélioration du débit descendant

La Tunisie offre les plus bas débits descendants sur le fixe en Afrique du Nord, soit 8,61 Mbps au troisième trimestre 2023, selon Ookla Speedtest Intelligence. Et ce, malgré le nombre de huit FAI, contre un en Algérie, trois au Maroc et cinq en Égypte. La faible performance du réseau est due à la couverture limitée des services de haut débit à grande vitesse et à leur coût inabordable pour de nombreux foyers. Par exemple, une ligne VDSL à 50 Mbps coûte plus de 26 $/mois. De plus, il a fallu attendre 2022 pour que les FAI augmentent le débit des forfaits DSL de base de 4 Mbps à 10 Mbps.

Le secteur du haut débit filaire n’a cessé de croître, atteignant plus de 1,2 million d’abonnés en juin 2023. Cela représente une augmentation de 50 % par rapport aux niveaux de 2019. Il est intéressant de noter que ce taux de croissance a dépassé celui du segment de l’accès fixe sans fil 4G, qui n’a connu qu’une augmentation de 27,4 %, atteignant un peu plus de 470 000 connexions au cours de la même période. En revanche, le service fibre reste une offre de niche en raison de sa couverture limitée et de son coût élevé. La part de la fibre sur le marché du haut débit filaire fixe a connu une légère augmentation, passant de 3,0 % en 2019 à un modeste 4,5 % en juin 2023.

Connexions à Haut Débit Fixe par Technologie, Tunisie
INT | 2019-T2 2023

Tunisie Telecom (TT), une entité publique, détient la majorité des parts dans le secteur du haut débit fixe. TT contrôle l’infrastructure nationale de cuivre, exploite le réseau dorsal de fibre optique à l’échelle nationale et est en concurrence directe et indirecte sur le marché de détail via sa filiale Topnet. La propriété de TT est répartie entre l’État tunisien (à 65 %) et Emirates International Telecommunications (EIT, à 35 %).

TT maintient une position forte dans ce secteur, contrôlant 72,9 % de toutes les connexions fibre en Tunisie en juin 2023. Ce chiffre comprend les clients directs (39,1 %) et ceux fournis via Topnet (33,8 %). Les services fibre, lancés en 2012, ne sont disponibles que dans le Grand Tunis et à Sfax. De plus, TT domine le marché VDSL avec une part de marché substantielle de 92,4 %, principalement via Topnet.

La pression réglementaire exercée par l’autorité des télécommunications INT (Instance Nationale des Télécommunicationss) a exhorté TT à réduire ses frais d’accès au réseau et accélérer l’activation de la ligne pour aider les autres fournisseurs d’accès Internet (FAI). Malgré ces efforts, divers défis persistent, incitant les opérateurs tels que Ooredoo et Orange à compléter leurs offres filaires avec des services de haut débit mobile basés sur la 3G et la 4G, en plus du FWA basé sur TD-LTE.

Ooredoo, qui a introduit les services fibre en 2013, a vu sa part de marché fibre s’élever à 16,8 % en juin 2023. Son réseau fibre couvre le Grand Tunis et Sfax. Orange manque cependant d’offres fibre grand public. D’autres FAI, notamment Bee, GlobalNet et HexaByte, utilisent un mélange d’ADSL, de VDSL et de FTTH/B en accédant à l’infrastructure de TT.

À court terme, TT prévoit de mettre à niveau la plupart des ports DSL vers le VDSL et de promouvoir des forfaits à plus haut débit. Cette stratégie vise à augmenter le débit fixe moyen de 10 Mbps en 2022 à 50 Mbps en 2024. À moyen terme, TT vise à étendre sa couverture et sa capacité FTTH de 100 000 connexions en 2022 à 500 000 d’ici 2025. Ces initiatives devraient améliorer l’accessibilité du service de fibre optique et améliorer les valeurs médianes des débits descendants et ascendants du pays.

En outre, l’INT a lancé une consultation en août 2023 pour définir les conditions requises pour partager les installations afin d’éviter la duplication des infrastructures et garantir des investissements efficaces dans la fibre. La proposition est que tous les FAI et opérateurs d’infrastructures fournissent un accès partagé à leurs installations de télécommunications après 12 mois d’opérations commerciales. Cette initiative devrait permettre d’étendre la couverture fibre, de réduire les coûts d’accès et de soutenir le développement de la 5G.

La fibre peut libérer davantage le potentiel de connectivité en Afrique du Nord

Comme indiqué ci-dessus, les FAI nord-africains ont adopté diverses stratégies pour déployer la fibre optique et promouvoir son adoption. Ils ont fait des progrès considérables dans l’amélioration de l’accessibilité à la fibre optique et de la vitesse du haut débit fixe depuis 2020. Cependant, un écart important demeure par rapport aux marchés plus avancés du Moyen-Orient et d’Afrique.

Pour combler cet écart, il est essentiel de faciliter les investissements dans la fibre optique par le biais de partenariats public-privé, de promouvoir le partage des infrastructures, d’accroître la concurrence, de fournir des cadres réglementaires solides et d’étendre la bande passante internationale. De telles initiatives rendront les services à haut débit plus abordables et accessibles, ce qui fait partie intégrante de la progression de la transformation numérique nationale et de la stimulation de la croissance économique.

Ookla a travaillé avec des FAI, tels que Bahrain Network (BNET) et les régulateurs de télécoms, pour soutenir leurs plans nationaux de haut débit, suivre les améliorations de la connectivité et de la couverture fibre et promouvoir leur réseaux auprès des consommateurs. Si vous êtes intéressé par les solutions et services d’Ookla en matière d’intelligence et de gestion des réseaux, contactez-nous.

Ookla retains ownership of this article including all of the intellectual property rights, data, content graphs and analysis. This article may not be quoted, reproduced, distributed or published for any commercial purpose without prior consent. Members of the press and others using the findings in this article for non-commercial purposes are welcome to publicly share and link to report information with attribution to Ookla.
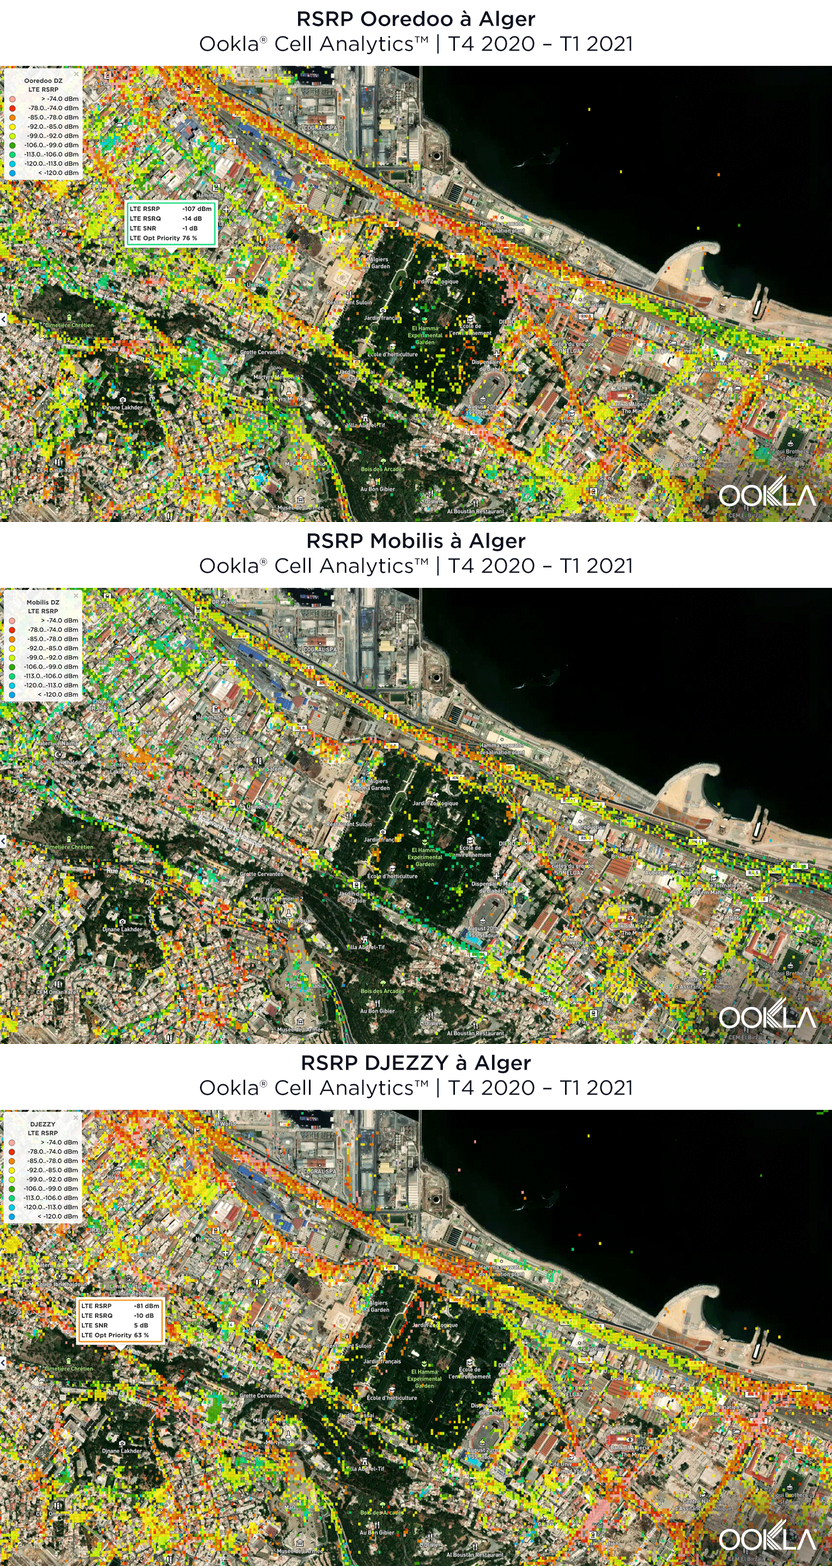
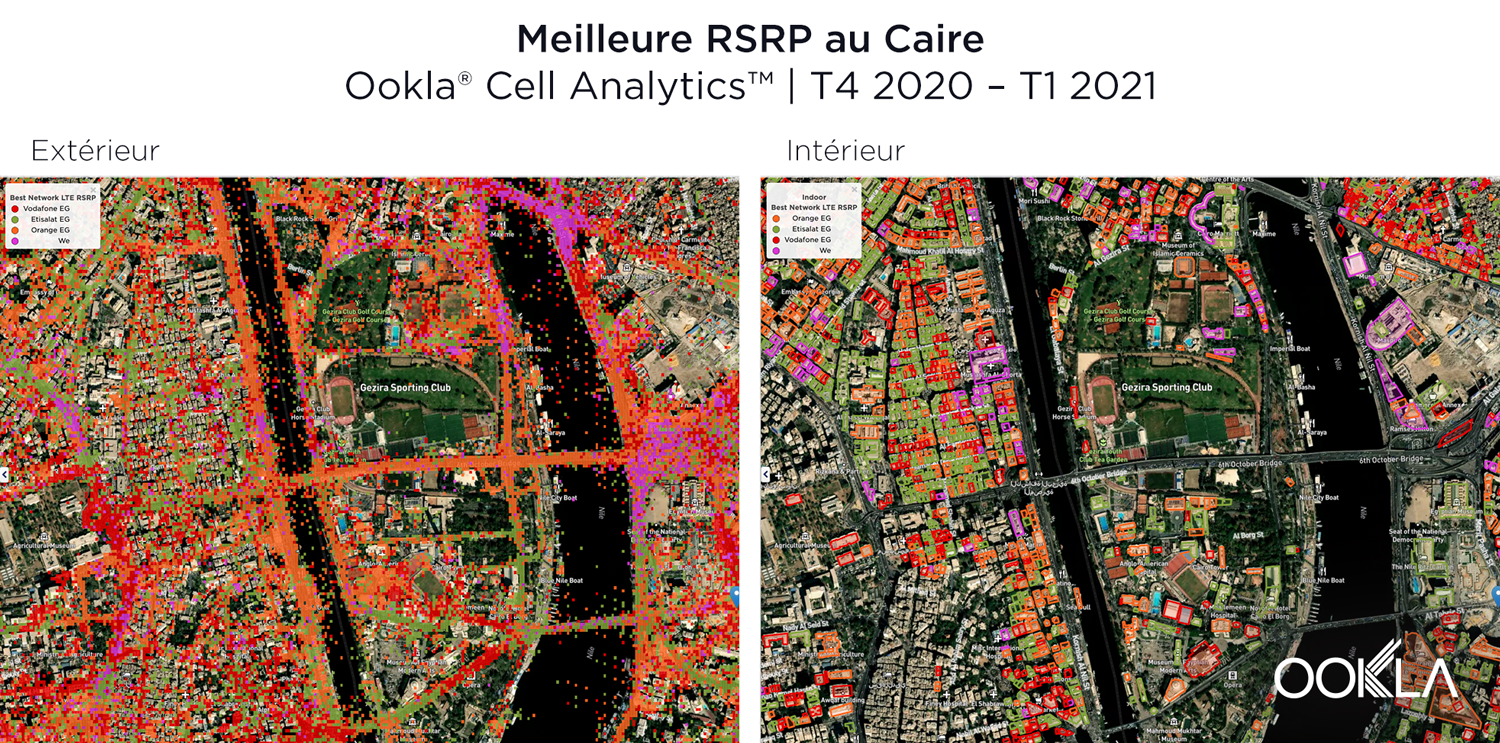
| July 5, 2017

How Internet Speeds at African Airports Compare

Our investigations of free airport Wi-Fi were nearly grounded when we reached Africa. Not only is free airport Wi-Fi not universally available on the African continent, when you do find it, it’s often very slow and available for only limited periods of time. But digging into Speedtest data for March-May 2017, we did discover a few bright spots.

Fastest airport Wi-Fi

Only five of the 10 busiest airports in Africa showed Speedtest results on free, publicly-available Wi-Fi during the time we surveyed. And three of those airports were in South Africa.

Fastest airport Wi-Fi

Of those five airports, though, Casablanca’s Mohammed V International Airport wins download speed by far. At 33.46 Mbps, the airport Wi-Fi is faster than any airport we’ve seen in Africa or Europe, and faster than all of the airports in Asia except for Dubai. Upload speed is terrible, though, so if Rick wants to send Ilsa a few snapshots of their final meeting, he’s going to spend more than a little time watching that upload wheel spin.

South Africa’s free airport Wi-Fi is all managed by VAST, an open-access Wi-Fi infrastructure provider, which doesn’t explain why the download speed at Durban’s King Shaka International Airport is about half that in Cape Town, but the company does seem to offer a general band of speed for free service. We saw other, faster tests on VAST-related SSIDs and can only assume that these are the pay-to-play options that are available to users after their first four hours of free Wi-Fi have expired.

Though we found many reports of free airport Wi-Fi, we were not able to verify tests on published SSIDs for airports in Cairo, Addis Ababa, Nairobi, Lagos and Tunis. And as far as we can tell, there is no free, public Wi-Fi at the airport in Algiers. If we’re wrong, take a Speedtest using your phone on the airport Wi-Fi and share your results with us on Twitter or Facebook.

Fastest airport cell

The good news is that cellular service is available at all the busiest African airports. The better news is that download speeds are decent at eight out of 10 of those airports.

Fastest airport cell

Mobile downloads are slower at all three of South Africa’s major airports than the country average of 34.45 Mbps, but they are still three of the four fastest airports in Africa for mobile.

The mobile download speed at Tunis’ airport is nearly twice as fast as the country average of 15.08 Mbps while the speed at Lagos’ Murtala Muhammed is just over 50% faster than Nigeria’s average of 10.64 Mbps. And although the Houari Boumediene download speed is among the slowest on the list, it’s 68% faster than the average download speed in Algeria.

Nairobi Kenyatta’s mobile download speed is closer to the Kenyan average of 14.51 Mbps, and downloads at Casablanca’s Mohammed V are slightly slower than the Moroccan average of 16.54 Mbps.

The slowest airports on our list, Bole and Cairo, are both located in countries with some of the slowest mobile downloads we saw, with Ethiopia at 10.50 Mbps and Egypt at 7.68 Mbps.

Upload speeds overall are slow, but they are in the same range as airports in Asia and Europe and they should get you by for any normal usage.

Wi-Fi or cell?

At five of the African airports we examined, the choice between Wi-Fi and cellular service is a no-brainer because the free Wi-Fi just doesn’t exist.

Wi-Fi or cell?

Casablanca’s download speed over Wi-Fi is 120% faster than over cellular, but it’s alone in this distinction.

At all other airports in Africa, choose cellular downloads rather than the free Wi-Fi. Cellular services is 88% faster than Wi-Fi at the Cape Town airport, 96% at Johannesburg, 326% at Durban and 53% at Addis Ababa.

Regional trends

Northern Africa

On the whole, the airports we surveyed in Northern Africa offer slower cellular downloads than those elsewhere on the continent. Tunisia is the exception.

Northern African airports were also the least likely to offer free Wi-Fi with three out of four airports showing no Speedtest results over free airport Wi-Fi. Morocco is the exception here, not only because Casablanca offers free airport Wi-Fi, but because that Wi-Fi is the fastest we found on the entire continent.

Eastern Africa

We only surveyed two airports in Eastern Africa, but what they have in common is ranking at the bottom of the list for cellular download speeds. Addis Ababa offered Wi-Fi, albeit slow. Cairo did not.

Western, Central, and Southern Africa

Africa is a very large and diverse continent and so we only examined one airport apiece in Western and Southern Africa this time around. And because we were focused on the busiest airports in Africa, we didn’t look at any airports in Central Africa at all. We’re hesitant to draw any trend lines based on this limited data, but we are definitely interested to learn more about internet performance in Africa as a whole and at airports in Africa. If you want to show us what your experience of the internet in any part of Africa (or anywhere else) is like, take a Speedtest on Android or iOS.

Ookla retains ownership of this article including all of the intellectual property rights, data, content graphs and analysis. This article may not be quoted, reproduced, distributed or published for any commercial purpose without prior consent. Members of the press and others using the findings in this article for non-commercial purposes are welcome to publicly share and link to report information with attribution to Ookla.

| January 24, 2018

GOOOOAL: Which World Cup Finalist Scored the Fastest Internet in their Capital City?

Whether you call it soccer or football, everyone calls the World Cup fun. We couldn’t wait for the actual match-ups in June, so we decided to pit the qualifying countries against one another to see who has the fastest internet speeds in their capital cities. The results might surprise you.

Get ready to watch Russia best Brazil and Portugal defeat Iran; meanwhile, Argentina and Nigeria and Belgium and England are preparing for penalty shoot-outs.

Using data from Speedtest Intelligence for Q3-Q4 2017, we’ve calculated which capital cities of World Cup-qualifying countries have the fastest mobile and fixed broadband speeds. We also took a peek at the fastest carriers and internet service providers (ISPs) in each capital using Speed Score, a comprehensive metric that combines measures of internet performance at all levels.

Mobile winners

Iceland’s sixth place ranking for mobile download speed in the Speedtest Global IndexTM virtually assured that Reykjavík would come out at the top of the list of fastest World Cup contenders. Canberra represents Australia well with a second place finish for mobile download speeds among World Cup capitals. And Brussels, Belgium barely surpasses Bern, Switzerland for a third place finish.

Mobile Internet Speeds
Capitals of World Cup Qualifying Countries | Q3 – Q4 2017
Country Capital City Average Download (Mbps) Average Upload (Mbps)
Iceland Reykjavík 55.49 21.53
Australia Canberra 44.24 12.60
Belgium Brussels 42.52 16.74
Switzerland Bern 42.02 17.52
South Korea Seoul 41.85 14.15
Denmark Copenhagen 41.78 18.29
Croatia Zagreb 41.16 16.40
Sweden Stockholm 40.12 12.63
Spain Madrid 38.30 14.02
Portugal Lisbon 30.60 11.39
Serbia Belgrade 30.33 12.49
France Paris 29.03 9.26
Poland Warsaw 26.94 9.84
Germany Berlin 25.83 9.51
England London 25.09 11.49
Russia Moscow 21.89 8.49
Japan Tokyo 19.89 7.10
Uruguay Montevideo 19.82 11.49
Mexico Mexico City 19.11 11.51
Peru Lima 18.33 12.90
Tunisia Tunis 18.27 8.07
Brazil Brasília 18.00 8.64
Morocco Rabat 17.32 9.76
Colombia Bogotá 16.87 9.50
Nigeria Abuja 16.17 6.76
Iran Tehran 15.05 7.04
Argentina Buenos Aires 13.77 7.70
Egypt Cairo 13.15 6.33
Panama Panama City 12.89 8.45
Saudi Arabia Riyadh 12.28 8.88
Senegal Dakar 8.85 3.81
Costa Rica San José 5.97 3.33

Looking at the group draw, Group A fares the worst with 16th place Moscow, Russia being the capital city with the fastest mobile downloads in the group. In Group B, Spain comes out on top. Australia wins Group C, Iceland takes Group D, Switzerland leads Group E and South Korea has the fastest mobile download speed in Group F. Belgium finishes first in Group G and Poland prevails in Group H, despite a 13th place finish overall.

From a regional perspective, European capitals top the rankings with all 14 European World Cup capitals sitting in the top half of the list. Latin American, Middle Eastern and African cities fare worst. Asia’s two contenders are split with Seoul boasting the fifth fastest mobile download speed among World Cup capitals and Tokyo, Japan coming in 17th.

The fastest World Cup capital in Latin America (Montevideo, Uruguay) shows a 64.3% slower mobile download speed than Reykjavík. First place among African World Cup capitals, Rabat, Morocco is 68.8% slower than Reykjavík for mobile downloads. And Tehran, Iran, the fastest World Cup capital in the Middle East, is 72.9% slower than Reykjavík.

Fastest carriers

We also looked into which carriers were fastest in each of the 32 World Cup capital cities.

With Speed Scores ranging from 8.89 in Dakar, Senegal to 46.57 in Brussels, mobile carrier Orange was fastest in four cities and tied for fastest in one. Vodafone was fastest in both Lisbon, Portugal and Madrid, Spain with comparable Speed Scores in the two locations. The rest of the cities show the diversity of fastest carriers that you might expect from a worldwide competition.

Fastest Carriers Speeds
Capitals of World Cup Qualifying Countries | Q3 – Q4 2017
Country Capital City Fastest Carrier Speed Score
Argentina Buenos Aires Personal 16.15
Australia Canberra Telstra 50.21
Belgium Brussels Orange 46.57
Brazil Brasília Claro 24.72
Colombia Bogotá Avantel 20.93
Costa Rica San José ICE 8.30
Croatia Zagreb Hrvatski Telekom 49.35
Denmark Copenhagen TDC / Telia 45.34 / 45.09
Egypt Cairo Orange 16.50
England London EE 36.83
France Paris Orange 33.15
Germany Berlin Telekom 53.54
Iceland Reykjavík Nova 64.61
Iran Tehran MTN IranCell 15.89
Japan Tokyo SoftBank 27.26
Mexico Mexico City AT&T 20.26
Morocco Rabat inwi 20.51
Nigeria Abuja MTN 29.23
Panama Panama City Cable & Wireless Panama / Movistar 14.85 / 14.80
Peru Lima Entel Peru 20.73
Poland Warsaw T-Mobile 36.07
Portugal Lisbon Vodafone 42.44
Russia Moscow MegaFon 37.06
Saudi Arabia Riyadh Zain 13.20
Senegal Dakar Orange 8.89
Serbia Belgrade Vip mobile 45.56
South Korea Seoul LG U+ 50.03
Spain Madrid Vodafone 40.17
Sweden Stockholm Telia 54.49
Switzerland Bern Sunrise / Swisscom 42.14 / 41.91
Tunisia Tunis Ooredoo / Orange 19.90 / 19.89
Uruguay Montevideo Antel 20.35

Fixed broadband winners

Given that Iceland ranks second in the world for fixed broadband download speed on the Speedtest Global Index and has the world’s highest gigabit user penetration (GUP), we’re not surprised to see Reykjavík shut out the competition by coming out on top of World Cup contenders for fixed broadband speed, too. Seoul, South Korea comes in second for fixed broadband download speed among World Cup capitals and Paris, France takes third.

Fixed Broadband Internet Speeds
Capitals of World Cup Qualifying Countries | Q3 – Q4 2017
Country Capital City Average Download (Mbps) Average Upload (Mbps)
Iceland Reykjavík 142.89 154.28
South Korea Seoul 130.75 131.96
France Paris 112.58 55.86
Sweden Stockholm 98.77 66.68
Spain Madrid 86.59 73.43
Japan Tokyo 75.88 70.46
Denmark Copenhagen 72.74 52.13
Switzerland Bern 68.82 54.44
Poland Warsaw 62.57 16.19
Portugal Lisbon 55.80 30.97
England London 52.53 16.12
Germany Berlin 46.84 9.52
Russia Moscow 45.25 42.96
Belgium Brussels 43.25 9.63
Panama Panama City 29.11 5.93
Australia Canberra 28.85 12.46
Serbia Belgrade 26.45 5.59
Croatia Zagreb 26.20 11.40
Mexico Mexico City 24.11 10.14
Uruguay Montevideo 23.02 5.82
Argentina Buenos Aires 22.03 4.26
Brazil Brasília 21.57 5.29
Saudi Arabia Riyadh 20.93 9.05
Peru Lima 18.15 3.51
Colombia Bogotá 13.43 6.48
Morocco Rabat 11.83 2.51
Iran Tehran 9.33 4.18
Costa Rica San José 8.79 4.29
Nigeria Abuja 8.07 5.27
Tunisia Tunis 7.82 4.49
Senegal Dakar 7.42 3.11
Egypt Cairo 5.61 1.92

Group A again suffers on the fixed side with leader Russia coming in 13th based on Moscow’s fixed broadband download speed. Spain’s still the front-runner of Group B. France takes Group C, Iceland wins Group D, Switzerland tops Group E, South Korea reigns over Group F, England heads up Group G and Japan starts Group H based on average download speeds over fixed broadband in their respective capitals.

European capitals again fare well, with 12 of the 14 placing in the top half of fastest World Cup capitals for fixed broadband download speed. Belgrade, Serbia and Zagreb, Croatia rank 17th and 18th, respectively. Tokyo ranks much better for fixed broadband download speed than for mobile, which puts both Asian World Cup capitals in the top six.

With the exception of Panama City, Panama, which ranks 15th, all Latin American World Cup capitals are in the bottom half of the list for download speed over fixed broadband. As are all Middle Eastern and African capital cities.

Panama City’s fixed broadband download speed is 79.6% slower than Reykjavík’s. Riyadh, Saudia Arabia boasts the title of fastest World Cup capital in the Middle East, but is still 85.4% slower for fixed broadband downloads than Reykjavík. The fastest World Cup capital in Africa — Rabat, Morocco — is 91.7% slower than Reykjavík.

Fastest providers

Comparing Speed Scores for fixed broadband across World Cup capitals, Vodafone had wins in Berlin, Germany and Lisbon and Orange took Paris and tied for first in Madrid. The rest of the fastest ISPs vary by location as listed below:

Fastest ISPs Speeds
Capitals of World Cup Qualifying Countries | Q3 – Q4 2017
Country Capital City Fastest ISP Speed Score
Argentina Buenos Aires Cablevisión Fibertel 21.72
Australia Canberra iiNet 33.23
Belgium Brussels Telenet 66.95
Brazil Brasília NET Virtua 27.30
Colombia Bogotá ETB 19.17
Costa Rica San José Cabletica 8.28
Croatia Zagreb vip 30.23
Denmark Copenhagen Fiberby 103.26
Egypt Cairo TE Data 4.84
England London Hyperoptic 117.40
France Paris Orange 107.20
Germany Berlin Vodafone 55.46
Iceland Reykjavík Nova 278.06
Iran Tehran Mobin Net 11.74
Japan Tokyo So-net 118.05
Mexico Mexico City Axtel 45.83
Morocco Rabat Maroc Telecom 9.25
Nigeria Abuja MTN 10.73
Panama Panama City Cable Onda 25.08
Peru Lima Movistar 16.64
Poland Warsaw UPC 82.72
Portugal Lisbon Vodafone 61.80
Russia Moscow MGTS 62.00
Saudi Arabia Riyadh STC 16.46
Senegal Dakar Tigo 6.42
Serbia Belgrade SBB 34.60
South Korea Seoul KT 162.45
Spain Madrid Masmovil / Orange 101.52 / 101.34
Sweden Stockholm Ownit 158.78
Switzerland Bern Fiber7 241.93
Tunisia Tunis TOPNET 7.61
Uruguay Montevideo Antel 22.01

Did your team not come out as expected? Or are you defending a tight match? Take a Speedtest on Android, iOS or on the web and we’ll check back in on scores closer to the main event.

Ookla retains ownership of this article including all of the intellectual property rights, data, content graphs and analysis. This article may not be quoted, reproduced, distributed or published for any commercial purpose without prior consent. Members of the press and others using the findings in this article for non-commercial purposes are welcome to publicly share and link to report information with attribution to Ookla.

| September 4, 2019

In-Depth Analysis of Changes in World Internet Performance Using the Speedtest Global Index

A lot has changed in the two years since 2017 when we first began ranking mobile and fixed broadband speeds of countries around the world with the Speedtest Global IndexTM. 5G is being deployed around the world and fiber continues to make gigabit speeds a reality in more and more countries. We’ve been tracking it all and are here to report on how much speeds have increased, which countries are leading internet performance and which are falling behind, and what trends we see across continents.

World mobile speed increased 21.4% with fixed broadband up 37.4%

World-Download-Speeds-2019-OG2

Looking just at the last year, the world’s mean download speed over mobile increased 21.4% from 22.81 Mbps in July 2018 to 27.69 Mbps in July 2019. Mean upload speed over mobile increased 18.1% from 9.13 Mbps to 10.78 Mbps. The world average for download speed over fixed broadband increased 37.4% from 46.48 Mbps in July 2018 to 63.85 Mbps in July 2019. Mean upload speed over fixed broadband increased 48.9% from 22.52 Mbps to 33.53 Mbps.

Shake-ups in the country rankings for internet performance

Fastest-Countries-Mobile-2018-2019

Mobile speeds in the fastest countries have skyrocketed in the past year which has dramatically shifted the rankings. South Korea, which was not even in the top ten a year ago, saw a 165.9% increase in mean download speed over mobile during the past 12 months, in large part due to 5G. Switzerland’s mean download speed increased 23.5%. Canada’s was up 22.2%, Australia 21.2%, the Netherlands 17.3%, UAE 11.1%, Malta 10.3% and Norway 5.8%. Qatar remained in the top ten, although the country’s mean download speed over mobile actually dropped 1.4% from July 2018 to July 2019.

Individual mobile operators can make a huge difference in a country’s speeds. In 2017 we were excited to see Telenor uncap their mobile speeds, which drove Norway to the top of the Speedtest Global Index. A big part of South Korea’s mobile success in the past year is the way KT, LG U+ and SK Telecom banded together to release 5G at the same time. Switzerland has also benefited from 5G and Sunrise leads the country with 262 5G deployments across the country while Swisscomm has 52.

Fastest-Countries-Fixed-2018-2019

Fixed broadband rankings on the Speedtest Global Index have not changed as dramatically during the past 12 months as those on mobile. Singapore remains the fastest country with an increase in mean download speed over fixed broadband of 5.6%. Taiwan had the largest jump in speeds among the top 10 with a 166.5% improvement in fixed download speed between July 2018 and July 2019. Mean download speed over fixed broadband increased 52.4% in South Korea, 26.4% in Macau, 21.7% in Romania, 21.0% in Switzerland, 19.3% in the United States and 3.5% in Hong Kong.

Monaco and Andorra did not have enough tests to qualify for the Speedtest Global Index one year ago, but massive fixed broadband improvements in both countries inspired us to lower our test count threshold for inclusion and also share these smaller countries’ success stories.

Technologies paving the way: 5G and gigabit

The presence of 5G is not enough to change a market

As discussed above, 5G has the potential to rocket a country to the top of the mobile rankings on the Speedtest Global Index. In practice, we’ve seen 5G speeds that were over 1000% faster than those on LTE.

Mobile-Download-Speeds-by-Country

In reality, though, unless 5G is commercially available widely across a country and from all mobile operators (as was the case in South Korea), the change in speeds at the country level is not that significant. Though commercial 5G was launched widely across Switzerland by Sunrise and Swisscom in April 2019, the country’s mean download speed only increased 2.8% in the three months since. The average mobile download speed in the U.S. has actually declined slightly since 5G was initially deployed. This is because 5G is still only available in a very limited number of markets to consumers with 5G-capable devices.

Visit the Ookla 5G Map for the latest on 5G deployments across the globe.

Gigabit is a game-changer, if you can get it

Unlike 5G, fiber connections have been rolling out since 2007, opening up the possibility of gigabit-speed fixed broadband. That said, it’s costly and time-intensive to lay miles and miles of fiber so progress has varied widely across the globe.

Gigabit-Test---Performance_Singapore-1

Geographically small countries like Singapore have the advantage when it comes to fiber, because It’s easier and cheaper to lay fiber optic cable across the country’s small footprint. Singaporean internet service providers (ISPs) have used this advantage to go beyond mere gigabit and offer connections as fast as 10 Gbps. This is reflected both in Singapore’s dominance of the fixed rankings on the Speedtest Global Index and in the fact that 2.87% of their total Speedtest results over fixed broadband are gigabit-speed (800 Mbps or higher).

Gigabit-Test---Performance_Brazil-1

Brazil offers a good contrast for how difficult it can be for gigabit to reach the masses. While the first Brazilian ISP to offer fiber-to-the-premises (FTTP) initially did so in 2007, easy access to gigabit speeds was slow to follow. However, that may be starting to change. Between June and July 2019 we saw a large uptick in gigabit-speed results in Brazil, where the proportion of gigabit speed tests increased from 0.02% of total fixed broadband tests to 0.17%. This corresponded with a large increase in mean download speed at the country level.

Comparing world mobile and fixed broadband at a glance

We were curious to see just how different internet performance experiences were around the world, so we plotted average mobile download speed against average download speed on fixed broadband. All of the graphs below use a percentage difference from the global average, a number that changed between 2018 and 2019.

fade-Performance-vs-Global---Quadrant-All

Speed Leaders

There was not much change in the list of countries that showed above-average download speeds on both mobile and fixed broadband between July 2018 and July 2019, the “Speed Leaders.” What did change was that fixed broadband speeds increased significantly enough among the group to bring the whole pack closer to Singapore and Hong Kong. On the mobile axis, South Korea’s major increase in download speed made that country more of an outlier, pushing the boundaries of what great performance can look like.

Fixed-Focused countries

Between July 2018 and July 2019 we saw the number of countries considered to be “Fixed-Focused” (having faster download speeds over fixed broadband than the world average while their average mobile download speeds were slower than average) increase. Ireland was the only country that solidly fit this category in 2018. Thailand and Chile started near the midline for fixed speeds and below-average for mobile speeds in 2018. 2019 found both countries squarely in the Fixed-Focused category. Israel also edged into this category as their mobile download speed fell between July 2018 and 2019.

Mobile-Focused countries

The “Mobile-Focused” category saw the most movement between July 2018 and July 2019 as some countries (the UAE and Qatar) increased their fixed speeds sufficiently to join the Speed Leaders. Meanwhile, Bosnia and Herzegovina’s mobile download speed increased year-over-year to move them into the Mobile-Focused quadrant. Georgia’s mobile download speed decreased enough to move them from Mobile-Focused to Speed Laggers.

It will be interesting to see how many of these Mobile-Focused countries double down on their mobile investments and explore 5G alternatives to fixed broadband.

Speed Laggers

No country wants to be in the position of having slower than average mobile and fixed broadband speeds. We saw 57 countries in this “Speed Laggers” quadrant in July 2018 and 78 in July 2019. This increase is mostly due to our expansion of the number of countries we consider for the Speedtest Global Index based on test count. There were enough countries in this category that we’ve considered them separately by continent below.

Regional views of mobile and fixed broadband performance

Mobile-and-Fixed-Broadband-Improvement-by-Continent-02

We aggregated Speedtest results by continent to analyze mobile and fixed broadband performance by continent.

Mobile-and-Fixed-Performance-by-Continent-01

Asia had the highest percentage increase in mobile download speed followed by North America, Oceania, South America, Africa and Europe. Oceania had the fastest mean download speed in July 2019. North America placed second, Europe third, Asia fourth, South America fifth and Africa sixth.

On the fixed broadband side, South America saw the highest percentage increase in download speed. Asia came in second, Europe third, Africa fourth, North America fifth and Oceania sixth. North America had the fastest mean download speed in July 2019. Europe was second, Asia third, and Oceania fourth. As we saw with mobile, South America and Africa again ranked fifth and sixth, respectively.

A zoomed-in view of the speed quadrants separated by continent offers a more detailed view of each country’s role in these rankings.

Africa mostly lags in internet speeds

2019-Performance-vs-Global---Africa

In July 2019, all but two African countries in the Speedtest Global Index fell into the Speed Laggers category, having mobile and fixed broadband speeds that were below global averages. The exceptions were South Africa and Guinea, which both had fast enough mobile speeds to place them in the mobile-focused quadrant.

Asian markets show a wide breadth of internet performance

2019-Performance-vs-Global---Asia

Asia was the most diverse continent we examined in terms of internet performance. We saw a plurality of countries in each of the four quadrants in July 2019. Most of the Speed Leaders were in East Asia: China, Hong Kong (SAR), Japan, Macau (SAR), South Korea, and Taiwan. If we include Singapore, another Speed Leader, these are among the wealthiest nations in Asia (using GDP per capita). Two of Asia’s Fixed-Focused countries are in Southeast Asia (Malaysia and Thailand) and one is in the Middle East (Israel).

The Speed Laggers category contained countries from South Asia (including Afghanistan, India and Pakistan), Southeast Asia (Brunei, Cambodia, the Philippines and Vietnam) and the Middle East (Jordan). Mobile-Focused countries in Asia were mostly Middle Eastern, including Kuwait, Lebanon, Oman, Saudi Arabia and Turkey.

European mobile performance is mostly strong, fixed varies

2019-Performance-vs-Global---Europe

With the exception of Ireland, the European countries on the Speedtest Global Index fell into the Speed Leaders, Mobile-Focused, and Speed Laggers categories. All of the Speed Laggers (Belarus, Kazakhstan, Russia and the Ukraine) were from Eastern Europe. Countries from Southeast Europe (including Albania, Bosnia and Herzegovina, Croatia, Greece, Montenegro, Moldova, Serbia and Slovenia) and Central Europe (Austria and the Czech Republic) made up the bulk of the Mobile-Focused category.

Speed Leaders included countries from the Baltics (Estonia, Latvia and Lithuania), the Nordics (Denmark, Norway and Sweden), Central Europe (Poland and Romania), and Western Europe (including Belgium, France, Germany, the Netherlands, and Spain).

North American internet performance is sharply divided

2019-Performance-vs-Global---North-America

Canada and the U.S. are the only two North American countries in the Speed Leaders category. Panama is the only North American country under Fixed-Focused. Mexico and all of the Central American countries fall into the Speed Laggers category. There are no North American countries that are Mobile-Focused.

Each country in Oceania has a very different internet story

2019-Performance-vs-Global---Ocean

Oceania is represented in three of the four quadrants: Speed Leaders (New Zealand), Mobile-Focused (Australia) and Speed Laggers (Papua New Guinea) with Fiji straddling the divide between Speed Laggers and Mobile-Focused.

South America mostly lags in mobile and fixed internet speeds

2019-Performance-vs-Global---South-America

Most of the South American countries represented on the Speedtest Global Index are in the Speed Laggers quadrant (Argentina, Bolivia, Brazil, Colombia, Ecuador, Paraguay, Peru, Suriname and Venezuela). Chile is an exception, being part of the Fixed-Focused group, as is Uruguay which sits in Mobile-Focused.

Global internet speeds are improving on average and 5G and gigabit are compounding those advances where available. However, not all countries are benefitting equally. We’ll be interested to see how 5G continues to push mobile speeds in the next year and also whether 5G Wi-Fi becomes a game changer for fixed broadband. Remember to check the Speedtest Global Index on a monthly basis for updated country rankings. And take a Speedtest to make sure your experience is represented in your country’s averages.

Editor’s Note: This article was edited on September 10, 2019 to correct an error in the labeling on the first image. The colors in a later image were updated for consistency.

Ookla retains ownership of this article including all of the intellectual property rights, data, content graphs and analysis. This article may not be quoted, reproduced, distributed or published for any commercial purpose without prior consent. Members of the press and others using the findings in this article for non-commercial purposes are welcome to publicly share and link to report information with attribution to Ookla.

| June 6, 2022

Analyzing Time of Day Internet Usage During Ramadan

Arabic | Français | Bahasa Indonesia | Bahasa Malaysia

Muslims across the world recently observed the month of Ramadan. During this sacred time, observing Muslims abstain from eating and drinking sunrise to sunset, acts of charity are encouraged, and work hours are often shortened. People often gather with friends and family during the evening meal, iftar, and new entertainment programming is often released for people to enjoy together. We were curious how this observance affected internet usage, so we analyzed Speedtest Intelligence® data from a variety of Muslim-majority countries around the world. We looked specifically at test volume during local fast times and iftar (when the fast is broken) and how those numbers compared to test volume during the month prior. 

Only some countries showed fewer tests during fast times

We analyzed Speedtest Intelligence data from Algeria, Bangladesh, Egypt, Indonesia, Malaysia, Morocco, Pakistan, Saudi Arabia, Somalia, Sudan, Tunisia, and Turkey during Ramadan to see how the distribution of Speedtest results between fast and iftar times varied by country. It should be noted that while all of the countries we surveyed have a majority Muslim population, the percentage of the population that is Muslim (and therefore likely to observe Ramadan) varies from Somalia (99.8%) to Malaysia (61.3%). 

Internet usage patterns changed during Ramadan 

Speedtest Intelligence showed that testing behavior changed during Ramadan when compared with the month prior. There was a decrease in the percentage of tests completed in the daytime between Ramadan and the month prior in all of the countries we surveyed. Somalia, Algeria, Saudi Arabia, and Tunisia showed the highest change in trends of daytime Speedtest results when comparing the fasting part of the day during Ramadan to daytime during the month prior. Malaysia, Bangladesh, Turkey, Indonesia, and Pakistan showed the smallest difference between the two periods. 

There was also an increase in the percentage of Speedtest results from iftar when comparing Ramadan to the month prior. Somalia and Algeria saw the largest increase when compared with the month prior. Malaysia, Bangladesh, Turkey, and Pakistan saw the smallest increases. This corresponds with the idea that people shift their online activity to iftar during Ramadan, connecting with friends and family, donating to charity, and enjoying the variety of new shows that networks release to coincide with the holiday.

This is a good reminder that every country has special events that their network operators need to prepare in advance for as we saw recently with Expo 2020 Dubai. If you’re interested in coverage of major network events from around the world, subscribe to Ookla® InsightsTM.


Analyse de l’utilisation d’internet en journée durant le Ramadan

Les Musulmans du monde entier ont récemment observé le mois du Ramadan. Pendant ce temps sacré, les Musulmans pratiquants ne mangent pas et ne boivent pas de l’aube au coucher du soleil, les actes de charité sont encouragés et les heures de travail sont souvent réduites. Les gens se retrouvent fréquemment entre amis et en famille pour le repas du soir, l’iftar, et de nouveaux programmes de divertissement sont souvent diffusés pour que les gens puissent en profiter ensemble. Nous étions curieux de savoir comment cette observance affectait l’utilisation d’Internet. Nous avons donc analysé les données de Speedtest Intelligence® provenant de divers pays à majorité musulmane dans le monde. Nous avons particulièrement examiné le volume des tests pendant les heures de jeûne locales et l’iftar (lorsque le jeûne est rompu), puis nous avons comparé ces chiffres au volume des tests du mois précédent.

Seuls quelques pays témoignent d’une réduction de tests pendant les périodes de jeûne

Nous avons analysé les données de Speedtest Intelligence provenant d’Algérie, du Bangladesh, d’Égypte, d’Indonésie, de Malaisie, du Maroc, du Pakistan, d’Arabie Saoudite, de Somalie, du Soudan, de Tunisie et de Turquie pendant le Ramadan pour voir comment la répartition des résultats de Speedtest entre les heures de jeûne et l’iftar variait selon les pays. Il convient de noter que si tous les pays étudiés ont une population majoritairement Musulmane, le pourcentage de la population Musulmane (et donc susceptible d’observer le ramadan) varie de la Somalie (99,8 %) à la Malaisie (61,3 %).

La Turquie, le Bangladesh, la Malaisie, l’Indonésie et le Pakistan ont montré un pourcentage plus élevé de résultats Speedtest pendant le jeûne que pendant l’iftar tout au long du Ramadan 2022. Les pourcentages de tests pendant le jeûne et l’iftar étaient presque équivalents au Maroc, en Égypte, en Algérie, en Tunisie et en Somalie. L’Arabie Saoudite et le Soudan avaient plus de résultats Speedtest pendant l’iftar que pendant le jeûne.

Les habitudes d’utilisation d’internet ont changé pendant le Ramadan

Speedtest Intelligence a montré que le comportement de test a changé pendant le Ramadan par rapport au mois précédent. Il y a eu une diminution du pourcentage de tests effectués dans la journée entre le Ramadan et le mois précédent dans tous les pays que nous avons étudiés. La Somalie, l’Algérie, l’Arabie Saoudite et la Tunisie ont enregistré la plus forte baisse du pourcentage de résultats de Speedtest effectués dans la journée lors de la comparaison entre la journée de jeûne au cours du Ramadan à la journée du mois précédent. La Malaisie, le Bangladesh, la Turquie, l’Indonésie et le Pakistan ont montré la plus petite différence entre les deux périodes.

Une augmentation du pourcentage de résultats Speedtest a été observée lors de l’iftar en comparant le Ramadan au mois précédent. La Somalie et l’Algérie ont connu la plus forte augmentation par rapport au mois précédent. La Malaisie, le Bangladesh, la Turquie et le Pakistan ont connu les plus faibles augmentations. Ces résultats correspondent à l’idée que les gens reportent leur activité en ligne à l’iftar pendant le Ramadan, pour passer du temps avec leurs amis et leur famille, faire des dons à des œuvres de charité et profiter de la variété des nouveaux programmes que les réseaux diffusent pour coïncider avec la période des fêtes.

Cette étude est un bon rappel que chaque pays a des événements spéciaux auxquels ses opérateurs de réseau doivent se préparer à l’avance, comme nous l’avons vu récemment avec l’Expo 2020 Dubaï. Si vous êtes intéressé par la couverture des grands événements réseau du monde entier, abonnez-vous à Ookla® Insights™.


Analisis Waktu Penggunaan Internet Selama Ramadan

Umat Islam di seluruh dunia baru-baru ini merayakan bulan Ramadan. Selama bulan suci ini, umat Islam menjalani ibadah puasa sejak matahari terbit hingga terbenam, banyak beramal, dan sering kali mengurangi jam kerja. Orang-orang berkumpul dengan teman dan keluarga saat makam malam, berbuka puasa, dan program hiburan baru seringkali dirilis untuk dinikmati bersama. Kami penasaran bagaimana kepatuhan ini memengaruhi penggunaan internet, jadi kami pun menganalisis data Speedtest Intelligence® dari berbagai negara mayoritas Muslim di seluruh dunia. Kami secara khusus mencermati volume tes pada waktu puasa dan berbuka (saat puasa dihentikan) setempat dan bagaimana perbandingan angka-angka tersebut dengan volume tes di bulan sebelumnya.

Hanya beberapa negara yang menunjukkan tes yang lebih sedikit di waktu puasa

Kami menganalisis data Speedtest Intelligence dari Aljazair, Bangladesh, Mesir, Indonesia, Malaysia, Maroko, Pakistan, Arab Saudi, Somalia, Sudan, Tunisia, dan Turki selama Ramadan untuk mencari tahu bagaimana distribusi hasil Speedtest antara waktu puasa dan waktu berbuka puasa bervariasi antarnegara. Perlu dicatat bahwa meskipun semua negara yang kami survei berpenduduk mayoritas Muslim, persentase penduduk yang beragama Islam (dan, karena itu, mungkin merayakan Ramadan) itu bervariasi, dari Somalia (99,8%) hingga Malaysia (61,3%).

Data dari Turki, Bangladesh, Malaysia, Indonesia, dan Pakistan menunjukkan persentase hasil Speedtest yang lebih tinggi selama waktu puasa dibandingkan waktu berbuka selama Ramadan 2022. Adapun menurut data dari Maroko, Mesir, Aljazair, Tunisia dan Somalia, persentase tes waktu puasa dan berbukanya kurang lebih sama. Sementara Arab Saudi dan Sudan hasil Speedtest-nya selama waktu berbuka lebih banyak daripada waktu puasa.

Pola penggunaan internet berubah selama Ramadan

Speedtest Intelligence menunjukkan bahwa perilaku pengujian berubah selama Ramadan jika dibandingkan dengan bulan sebelumnya. Terjadi penurunan persentase tes yang dilaksanakan pada siang hari antara bulan Ramadan dan bulan sebelumnya di semua negara yang kami survei. Somalia, Aljazair, Arab Saudi, dan Tunisia menunjukkan penurunan persentase hasil Speedtest terbesar di siang hari bulan Ramadan dibandingkan siang hari di bulan sebelumnya. Data dari Malaysia, Bangladesh, Turki, Indonesia, dan Pakistan menunjukkan selisih terkecil di antara kedua periode tersebut.

Juga terjadi peningkatan persentase hasil Speedtest mulai waktu berbuka puasa di bulan Ramadan dengan bulan sebelumnya. Somalia dan Aljazair mengalami peningkatan terbesar jika dibandingkan dengan bulan sebelumnya. Malaysia, Bangladesh, Turki, dan Pakistan mengalami peningkatan terkecil. Ini selaras dengan asumsi bahwa orang-orang mengalihkan aktivitas online mereka ke waktu berbuka selama Ramadan, berbaur dengan teman dan keluarga, bederma, dan menikmati berbagai acara baru yang dirilis oleh jaringan bertepatan dengan hari raya.​​

Ini adalah pengingat yang bagus bahwa setiap negara memiliki acara-acara khusus yang perlu dipersiapkan terlebih dulu oleh para operator jaringan seperti yang kita lihat baru-baru ini pada Expo 2020 Dubai. Jika Anda tertarik dengan liputan acara-acara jaringan utama dari seluruh dunia, silakan berlangganan Ookla® Insights™.


Menganalisis Masa Penggunaan Internet Semasa Bulan Ramadan

Orang islam di seluruh dunia baru-baru ini telah menyambut bulan Ramadan. Semasa bulan suci ini, mereka menahan diri dari makan dan minum bermula dari waktu matahari terbit hingga matahari terbenam, aktiviti kebajikan digalakkan, dan waktu bekerja kebiasaannya dipendekkan. Orang ramai biasanya akan berkumpul bersama-sama rakan dan keluarga semasa waktu berbuka puasa, iftar, dan rancangan hiburan baru sering disiarkan untuk ditonton dan dinikmati bersama-sama.

Kami ingin tahu bagaimana sambutan bulan Ramadan ini memberi kesan terhadap penggunaan internet, jadi kami telah menganalisis data Speedtest Intelligence® dari pelbagai negara dengan majoriti Muslim di seluruh dunia. Kami melihat secara khusus jumlah ujian semasa waktu berpuasa dan iftar (waktu berbuka puasa) tempatan dan membandingkan nilai tersebut dengan jumlah ujian semasa bulan sebelumnya.

Hanya beberapa negara yang menunjukkan bilangan ujian lebih rendah semasa waktu berpuasa

Kami telah menganalisis data Speedtest Intelligence dari Algeria, Bangladesh, Mesir, Indonesia, Malaysia, Maghribi, Pakistan, Arab Saudi, Somalia, Sudan, Tunisia, dan Turki semasa bulan Ramadan untuk melihat pengagihan keputusan Speedtest di antara waktu berpuasa dan iftar yang berbeza mengikut negara. Perlu dinyatakan bahawa, walaupun semua negara yang diselidik mempunyai penduduk majoriti Muslim, peratusan penduduk yang beragama Islam (dan oleh itu lebih berkemungkinan menyambut Ramadan) berbeza-beza dari Somalia (99.8%) ke Malaysia (61.3%).

Turki, Bangladesh, Malaysia, Indonesia, dan Pakistan menunjukkan peratusan keputusan Speedtest yang lebih tinggi semasa waktu berpuasa berbanding waktu berbuka semasa bulan Ramadan 2022. Peratusan ujian waktu berpuasa dan iftar adalah agak sama dengan Morocco, Mesir, Algeria, Tunisia dan Somalia. Saudi Arabia dan Sudan mempunyai keputusan Speedtest yang lebih tinggi semasa waktu berbuka berbanding waktu berpuasa.

Corak penggunaan Internet berubah semasa bulan Ramadan

Speedtest Intelligence menunjukkan bahawa tingkah laku ujian berubah semasa bulan Ramadan apabila dibandingkan dengan bulan sebelumnya. Terdapat penurunan dalam peratusan ujian yang dilengkapkan semasa waktu siang antara bulan Ramadan dan bulan sebelumnya dalam semua negara yang dikaji selidik. Somalia, Algeria, Saudi Arabia, dan Tunisia menunjukkan penurunan terbesar dalam peratusan keputusan waktu siang Speedtest apabila dibandingkan dengan waktu berpuasa semasa bulan Ramadan dengan waktu siang bulan sebelumnya. Malaysia, Bangladesh, Turki, Indonesia, dan Pakistan menunjukkan perbezaan terkecil di antara dua tempoh ini.

Terdapat juga peningkatan dalam peratusan keputusan Speedtest dari waktu iftar apabila membandingkan bulan Ramadan kepada bulan sebelumnya. Somalia dan Algeria mempunyai peningkatan terbesar apabila dibandingkan dengan bulan sebelumnya. Malaysia, Bangladesh, Turki, dan Pakistan mempunyai peningkatan terkecil. Ini selari dengan pendapat bahawa ramai yang menukar aktiviti dalam talian mereka kepada iftar semasa bulan Ramadan, berhubung dengan rakan dan keluarga, menderma kepada badan kebajikan, dan menikmati pelbagai rancangan baru yang disiarkan oleh rangkaian yang bersesuaian dengan sambutan ini.

Ini adalah satu peringatan yang baik bahawa setiap negara mempunyai peristiwa istimewa yang pengendali rangkaian perlu sediakan lebih awal seperti yang kita lihat baru-baru ini di Expo 2020 Dubai. Jika anda berminat dengan liputan acara rangkaian besar dari seluruh dunia, langganlah  Ookla® Insights™.

Ookla retains ownership of this article including all of the intellectual property rights, data, content graphs and analysis. This article may not be quoted, reproduced, distributed or published for any commercial purpose without prior consent. Members of the press and others using the findings in this article for non-commercial purposes are welcome to publicly share and link to report information with attribution to Ookla.