| May 12, 2022

Introducing a Better Measure of Latency

Latency can seem like a sleeper metric — one that you may not think about when you’re troubleshooting your connections but one that deeply affects your online experience. As speeds increase globally, it’s becoming increasingly obvious to many that something is still getting in the way of the seamless video calls, streaming, and gaming we dream of. That something is often latency and we at Ookla® have recently redesigned how Speedtest® measures latency to give you better access to this essential metric.

What latency is and why it matters

Latency (sometimes called ping) measures how quickly your device gets a response after you’ve sent out a request. A low latency means the server is responding quickly to your request whereas a high latency means a slow response. An example of how this works in online gaming is when you ask your character to move — if your character moves almost immediately, you have a low latency, if there is a delay in your character completing that movement, you might have a high latency.

Latency has always mattered to online experience. However, it has often been difficult to tell the difference between a slow connection and a high latency as both can delay you from getting what you want from the internet. These days, many folks have faster connections but there’s still a disconnect between asking their device to perform an action online and having it complete that action. Which means poor latency is becoming more obvious as the internet gets faster and more devices are connected online.

How our metric is changing (and why)

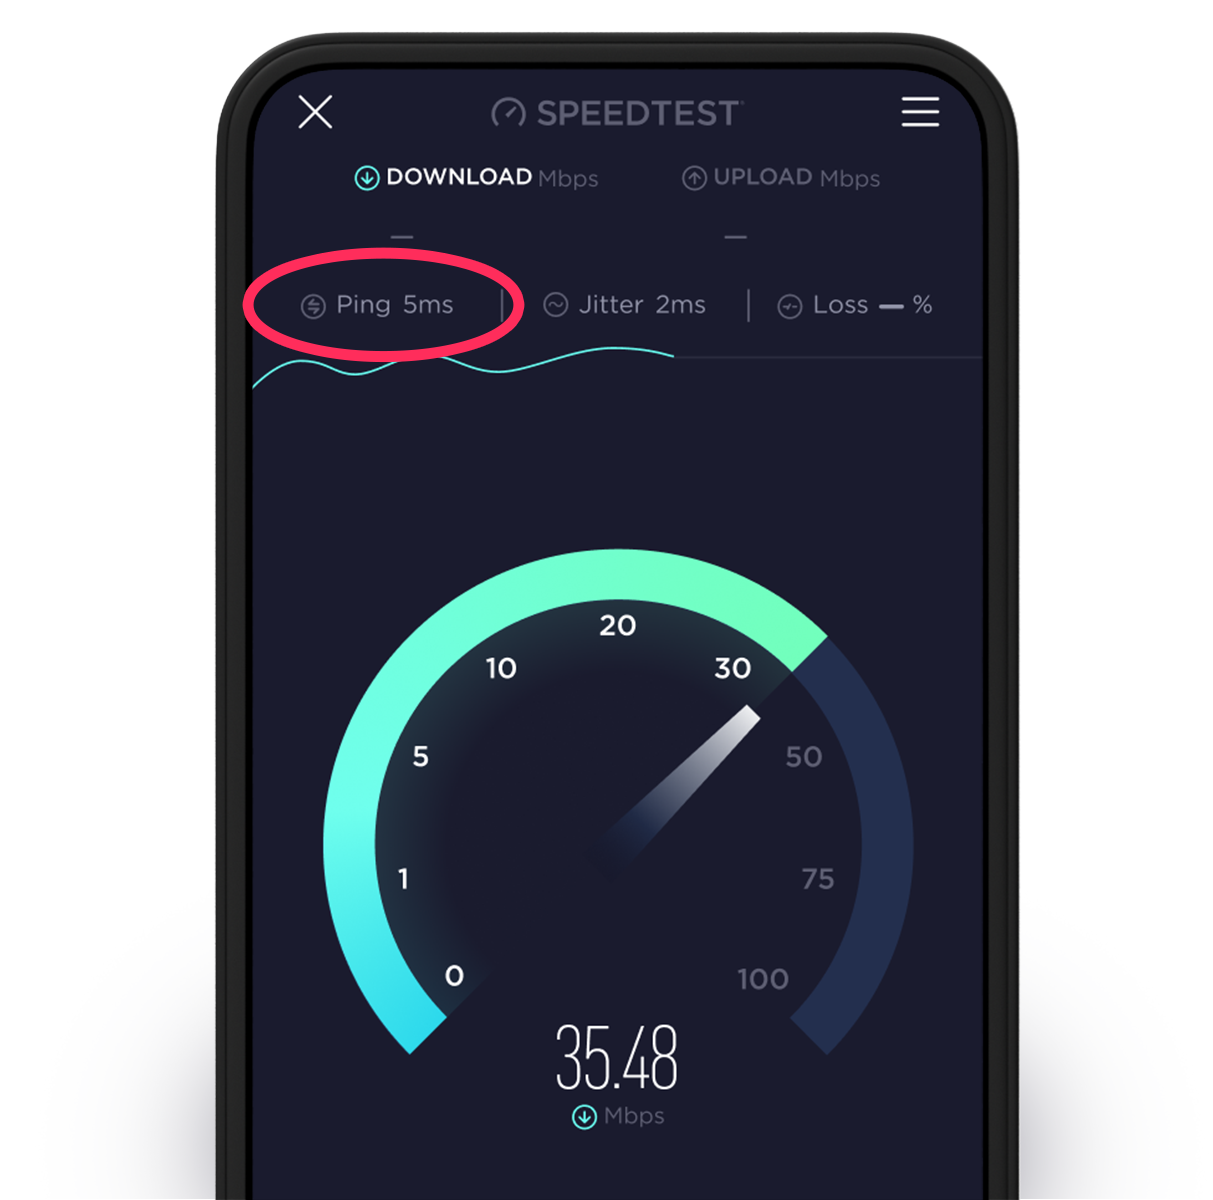
Speedtest has always tested for latency. A simple measure, labeled “ping,” has been at the top of the app next to download speed. However, we’re no longer living in a world where one device is connected to one router. Instead, you might find yourself with a laptop, tablet, phone, TV and even other smart devices connected to Wi-Fi all at once. And that’s just in your living room.

Former Latency Location in iOS Speedtest

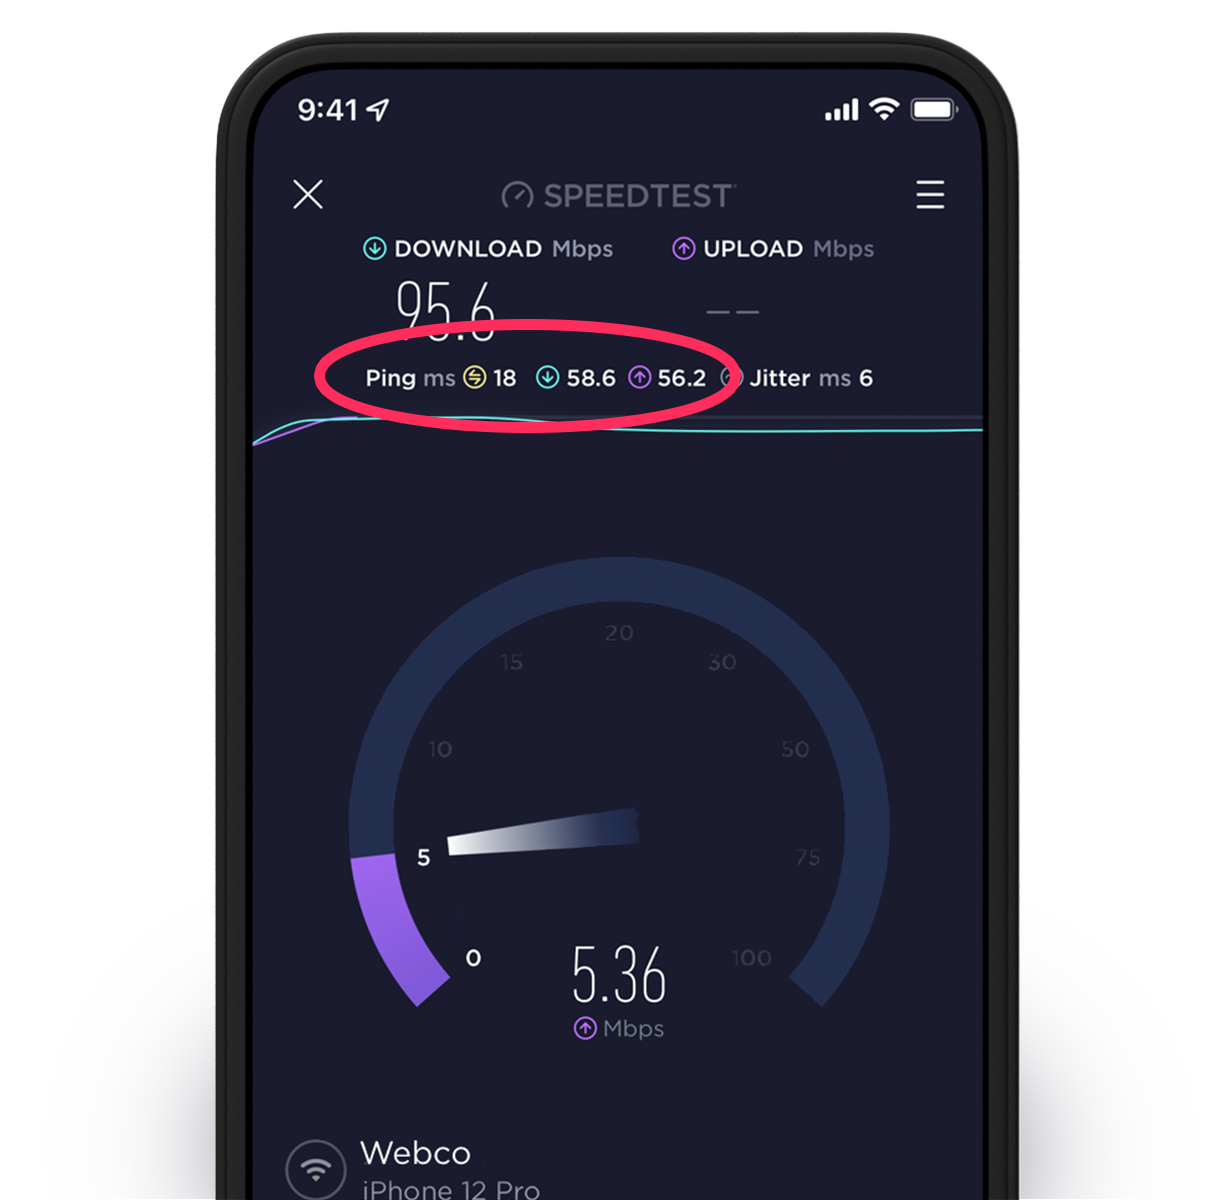
Our new latency test measures loaded latency, giving a more nuanced picture of responsiveness and what the bottlenecks in your connection really are. The loaded latency test measures ping during three stages, giving you a convenient, easy to use way to better understand your network experience. These three stages are:

  • Idle Ping. This test at the beginning of your Speedtest measures the response of a request on your network as if it is not in use.
  • Download Ping. Latency is measured while the download test is in progress to see how it is affected by download activity on your network, like a household member downloading a large game while you’re trying to work.
  • Upload Ping. Latency is also measured while the upload test is in progress to see how it is affected by upload activity on your network, like someone on your home network uploading a year’s worth of photos.

Location of new Loaded Latency information during testing

Our mission at Ookla is to empower consumers across the globe to understand and optimize their internet experience. This new metric gives you the detailed information you need to understand where the bottlenecks in your network’s responsiveness really are. If you’re looking for our old latency metric for comparison, look for the “idle low” in the detailed section of the test.

How you can use our new latency metrics in the real world

All you have to do to get these new latency measures is take the same Speedtest on your Android or iOS device that you’ve been using all along. It’s free (always) and will give you even more insight into the performance of your network. If you don’t see it yet on your mobile device, simply update the app.

Run the Speedtest to see where your latency issues actually lie. You can use your mobile device to test both your cellular network (which you don’t have a lot of control over) and your Wi-Fi network (which you have a lot of room to troubleshoot).

  • If your idle ping is high, you have an overall latency problem. You will want to test the network with another device to see if the issue affects both. If it does, restart your router. If the problem continues, consider moving your router someplace more central.
  • If your download or upload ping is high, you may have a bigger problem. Contact your router manufacturer or internet service provider (ISP) to see if they can help. Advanced users may find this guide useful.

Improve the responsiveness of your online experience. Test your latency on Android or iOS today.

Editor’s note: This article was updated on May 20 with details on where to find the older latency metric.

Ookla retains ownership of this article including all of the intellectual property rights, data, content graphs and analysis. This article may not be quoted, reproduced, distributed or published for any commercial purpose without prior consent. Members of the press and others using the findings in this article for non-commercial purposes are welcome to publicly share and link to report information with attribution to Ookla.

| July 27, 2022

Ookla Acquires CellRebel

Ookla® has acquired CellRebel, an independent company focused on helping operators and other telecommunications companies improve mobile networks worldwide. Together, Ookla and CellRebel will bring enhanced consumer network experience insights to the global telecommunications marketplace.

“The complexity of modern networks demands diversified streams of data to fuel holistic insights on performance, quality, and accessibility,” said Doug Suttles, founder and CEO of Ookla. “It is vital that we understand more about consumer experiences with networks, and CellRebel brings billions of daily data points with innovative analytical views to help fulfill this need worldwide.”

Along with robust localized network experience data, CellRebel brings sophisticated data visualization capabilities to support mobile network performance and optimization use cases, and a host of novel real-world consumer experience measurements to Ookla’s portfolio.

“We are beyond thrilled to join Ookla and their mission of improving connectivity for everyone,” said Tibor Rathonyi, CellRebel’s founder and CEO. “Ookla’s brand, technology, and presence in the market, combined with CellRebel’s advanced analytics use cases, mass-scale network quality measurements, and user experience data, will position us with must-have solutions for any telecom company building the networks of both the present and the future.”

Ookla retains ownership of this article including all of the intellectual property rights, data, content graphs and analysis. This article may not be quoted, reproduced, distributed or published for any commercial purpose without prior consent. Members of the press and others using the findings in this article for non-commercial purposes are welcome to publicly share and link to report information with attribution to Ookla.

| August 16, 2020

Problems on the 37th Floor: Analyzing In-Building Network Performance and Coverage (Webinar)

Drive testing and walk testing are useful for capturing isolated snapshots of network performance and quality, but not efficient ways to discover where users are having problems connecting. Mobile network operators must understand where users are experiencing poor indoor network performance or a weak 5G signal to provide consumers with good quality of service. It is especially important to understand performance issues in densely populated urban areas with many tall high-rise buildings, because indoor service issues can sometimes be limited to specific floor groups.

In the upcoming Ookla® webinar, we’ll share three real-world use cases where operators in Asia can improve performance and coverage with Cell Analytics™ data on user density and traffic, indoor vs. outdoor performance and 5G network metrics.

Read on to discover how operators can monitor 5G networks and identify problem buildings and cells with crowdsourced data — and don’t miss the webinar on Wednesday, August 26 at 12:00 GMT+8 (9:30 Mumbai, 11:00 Bangkok, 12:00 Singapore/Kuala Lumpur/China, 13:00 Tokyo, 14:00 Sydney).


1. Monitor your 5G network performance and coverage as well as competitors’

As mobile network operators invest heavily in 5G, it’s critical to monitor progress and compare network coverage and performance to that of your competitors. Powered by hundreds of millions of signal measurements collected daily by Speedtest®, Cell Analytics provides intelligence about wireless service quality, RF measurements, data usage, user density, cell site locations and much more, including 5G network metrics. By tracking your own and competitors’ performance, you can understand where new 5G deployments are impacting user experience and quality of service.

5G-HK-SS-RSRP-1

3hk-5g-ss-rsrp-2

In the above example, we can see China Mobile Hong Kong provides 5G coverage over a much larger area than the 3 Hong Kong network.

2. Identify problem buildings and cells with crowdsourced data — and prioritize efforts to improve them

Cell Analytics makes it easy to identify buildings where users are experiencing issues and to prioritize which network improvements will have the most impact. By looking at user density (both indoor and outdoor), you can understand where the highest volume of users are impacted and determine which cell sites need low-cost or no-cost adjustments to improve service.

Mumbai-LTE-RSRP-1

In-Building-User-Density-Mumbai-1

In the above example, we see Nirlon Knowledge Park, a busy office park in Mumbai with very high user density, but very low LTE signal level on the Jio network. By comparing these views, Jio can discover opportunities to improve in-building performance and coverage in popular locations.

3. Analyze network performance in tall buildings, down to individual floor groups

With new z-axis views in Cell Analytics, it is possible to determine the altitudes at which users experience poor network quality or performance. By analyzing which floor groups within a building are showing network issues, you can identify good buildings for DAS or other capacity expansion.

NTTDoCoMo-LTE-Tokyo-2

In the above example, we can see that the upper floors of several buildings are experiencing poor quality on the NTT DoCoMo network in Tokyo.

To see in-depth recommendations for the operators in the above scenarios, don’t miss the webinar on August 26 at 12:00 GMT+8. If you cannot make the presentation, you can register to receive a video recording after the live event. We look forward to showing you how to leverage real-world data to make better network decisions and answering any questions you may have. Register now

Ookla retains ownership of this article including all of the intellectual property rights, data, content graphs and analysis. This article may not be quoted, reproduced, distributed or published for any commercial purpose without prior consent. Members of the press and others using the findings in this article for non-commercial purposes are welcome to publicly share and link to report information with attribution to Ookla.

| October 15, 2019

FESIQ Software Suite Now Part of Ookla

Ookla FES Logos

Following a successful partnership with FES that began earlier this year, Ookla® now owns the complete FESIQ software suite. Formally uniting FESIQ with Ookla’s already unparalleled views into the performance and quality of worldwide networks further cements Ookla’s position as the de facto source for data-backed visualizations of network coverage, performance and usage density. FESIQ enables operators and infrastructure providers to rapidly analyze wireless networks down to the city block and individual building levels, reducing or eliminating traditional expenses associated with measuring and mapping networks.

As part of the transition, Ookla welcomes senior RF and software engineering team members who will focus on further developing the capabilities of the FESIQ software suite along with the broader Ookla team. FES and Ookla will continue their strategic partnership, providing FES with ongoing access to the FESIQ software suite and Ookla network performance data. FES is poised to continue offering superior RF engineering and network consulting services to mobile network operators.

To learn more or inquire about FESIQ and Speedtest Intelligence®, visit ookla.com/speedtest-intelligence. For more information about FES and the wireless design and optimization services they provide, visit furtherllc.com.

Ookla retains ownership of this article including all of the intellectual property rights, data, content graphs and analysis. This article may not be quoted, reproduced, distributed or published for any commercial purpose without prior consent. Members of the press and others using the findings in this article for non-commercial purposes are welcome to publicly share and link to report information with attribution to Ookla.

| February 21, 2019

10 Gbps? There's a Speedtest for That

Internet speeds keep getting faster and faster and Speedtest is ready to measure the fastest speed available — the 10 Gbps connection.


If you can’t see the above video, please check your Adblock settings.

Most of us don’t need a 10 Gbps test, yet…

Ten gigabits per second is 10 times faster than the gigabit connection your techie friend has been bragging about. For most of us, a connection this fast is overkill (right now), as you can watch a 4K Ultra streaming movie with just 25 Mbps. But there are some ISPs around the globe that are already offering 10 Gbps service.

10 Gbps opens the doors

People who upload and download huge files will love 10 Gbps. Whether you’re uploading large videos to share with clients, downloading 100 videos in the final seconds before leaving for your trip, waiting on huge game patches, or hosting the world’s largest LAN party at your house, 10 Gbps will change your life.

Having a 10 Gbps Speedtest means that organizers of huge events like Mobile World Congress (MWC) can use Speedtest to ensure that their infrastructure is fast enough to serve thousands of attendees.

Achieving a 10 Gbps Speedtest result

To get a 10 Gbps Speedtest result, you need a connection that fast and devices that are capable of handling those speeds. We tested between two Mac Minis with 9000 byte jumbo frames.

Web browsers max out around 3 Gbps, so we used our our desktop app. The test is data- intensive — our multi-thread test used over 17 GB to measure the download speed and nearly 13 GB to measure upload. We have many servers that can handle tests this large, so if you are trying to replicate our result and think your test is being limited by the server you’re using, try another.

Again, this is what a 10 Gbps Speedtest result looks like:


You’ll note that the test doesn’t quite hit 10 Gbps. This is because any connection is subject to overhead. So a 1 Gbps payload usually loses 6-9% to overhead and a 10 Gbps connection loses about the same percentage.

To see a 10 Gbps Speedtest in action, schedule a meeting at MWC or come see us in Hall 2 at Booth 2i25.

Ookla retains ownership of this article including all of the intellectual property rights, data, content graphs and analysis. This article may not be quoted, reproduced, distributed or published for any commercial purpose without prior consent. Members of the press and others using the findings in this article for non-commercial purposes are welcome to publicly share and link to report information with attribution to Ookla.

| December 14, 2021

Ookla Acquires RootMetrics

Ookla® has acquired RootMetrics®, bringing together two industry leaders that deliver outstanding network connectivity insights to the world. Together they will combine the industry-standard first-party crowdsourced data from Speedtest® with the RootMetrics’ scientifically controlled drive and walk testing data collection for the benefit of the mobile operators who build the networks and the consumers who rely on them.

Ookla CEO and co-founder Doug Suttles says, “Ookla plus RootMetrics fully enables the network assessment trifecta of crowd measurement, controlled testing and consumer perception—with a sustainable business model that should thrive through the privacy revolution.”

Mobile operators, network infrastructure providers and governments will be able to jointly leverage Ookla and RootMetrics’ respective network performance analytics, software products, testing capabilities and data science methodologies to better understand, market, deploy and optimize their networks. With RootMetrics and Ookla’s recently acquired Wind™ platform, Ookla’s portfolio of real-time mobile network coverage and performance measurement solutions now extends to traditional drive testing, indoor walk testing and live event monitoring.

“Becoming part of Ookla completes the vision that Doug and I shared when we first met years ago,” says RootMetrics CEO Kevin Hasley. “With our combined experience and expertise we can better help our customers overcome challenges, optimize their networks and create opportunities. I am very excited to see our joint future unfold.”

As part of Ookla, RootMetrics will continue to serve customers in the same capacity.

Ookla retains ownership of this article including all of the intellectual property rights, data, content graphs and analysis. This article may not be quoted, reproduced, distributed or published for any commercial purpose without prior consent. Members of the press and others using the findings in this article for non-commercial purposes are welcome to publicly share and link to report information with attribution to Ookla.

| July 20, 2021

Solutelia Joins Ookla

Ookla®, the global leader in network intelligence, testing platforms and related technologies, is proud to announce the acquisition of Solutelia and its flagship WINd® software suite. Together we will disrupt and forever change the wireless network test and measurement industry.

Ookla’s enterprise products give mobile network operators unparalleled competitive insights into the consumer experience on networks all over the world, while Solutelia’s WINd platform evolves legacy drive-testing and walk-testing tools and eliminates the need for outdated, time-consuming methods of post-processing data. Solutelia’s innovative solutions for indoor, outdoor and competitive benchmark testing allow network operators and integrators to rapidly improve mobile network performance with real-time streaming KPIs, remote control of test devices, near-real-time post-processing and cloud-based analytics — with consumer network experience at the heart of the system.

“The addition of WINd will bring much deeper network insights and testing capabilities to Ookla’s enterprise customers,” said Doug Suttles, CEO of Ookla. “Over the past few years we have invested in solutions and talent to help our clients solve more engineering-grade problems. Acquiring Solutelia is another concrete example of Ookla helping our clients more accurately measure and continuously improve their deployed networks.”

Mohssen Davari, CEO of Solutelia adds, “We are thrilled to be joining Ookla. Our mission has been to redefine mobile network performance measurement with near-real-time analytical capabilities that drive operational efficiencies and faster network improvements. We first partnered with Ookla to integrate its best-in-class Speedtest software, and now together we will bring the benefits of the WINd software platform to the global marketplace.”

The advent of 5G is resulting in substantial changes to the physical footprint of networks, which will require more cell sites and more intelligent, complex radio networks. This radical shift in the industry means that network operators need to be able to massively scale their testing and optimization efforts, without a commensurate increase in operational spending. Solutelia’s revolutionary approach to data collection has fundamentally reimagined drive and walk testing, creating process efficiencies and delivering instant network insights, while removing operational complexity and reducing network management costs.

Mobile network operators using Ookla’s solutions for crowdsourced network intelligence (Speedtest Intelligence®, Cell AnalyticsTM and SpatialBuzz) already have an unrivaled view into network performance, quality, coverage, user density, data usage, consumer satisfaction and other key metrics. Solutelia’s WINd platform, which natively leverages Ookla’s best-in-class Speedtest methodology for throughput testing, allows operators to turn that network intelligence into immediate action in the field. With the addition of Solutelia’s WINd platform to its enterprise product suite, Ookla now provides solutions to support operators through each stage of mobile network planning, site verification, monitoring, optimization and performance assurance.

To learn more about Ookla and Solutelia’s solutions for mobile network operators and integrators, inquire here. For media inquiries, please send a message to press@ookla.com

Ookla retains ownership of this article including all of the intellectual property rights, data, content graphs and analysis. This article may not be quoted, reproduced, distributed or published for any commercial purpose without prior consent. Members of the press and others using the findings in this article for non-commercial purposes are welcome to publicly share and link to report information with attribution to Ookla.

| July 28, 2021

Introducing the Speedtest Mobile SDK

We are excited to announce that the Speedtest SDK™ is now available for both iOS and Android applications. The new Speedtest Mobile SDK allows providers to integrate Speedtest® into their mobile applications with a fully custom user interface. With Speedtest results delivered directly into your application, you can immediately surface network performance insights to your customer care team, network operations center and other key stakeholders.

Joining the Speedtest Web SDK in our suite of Speedtest Powered™ solutions, the Mobile SDK provides even more rich insights about mobile network conditions, signal metrics, device information and other data. With Speedtest integrated directly into your mobile applications, you can more easily diagnose customer issues and make network improvements.

A world-class consumer testing experience

Speedtest is the name consumers across the globe trust when they need to better understand the performance and quality of their internet connections. Daily, Speedtest is used over 10 million times for unbiased network performance data, and over 35 billion tests have been taken with Speedtest to date.

Our industry-leading methodology makes Speedtest the most reliable tool for measuring internet performance and providing network diagnostics. The Speedtest Mobile SDK allows providers to integrate this same robust, accurate testing experience into their mobile applications.

Seamless integration, highly configurable testing

The Speedtest Mobile SDK allows you to install Speedtest as the testing solution into your Android or iOS app. It integrates seamlessly into your custom UI and offers configuration over test stages, signal scan triggers and data delivery.

The Speedtest Mobile SDK measures over 200 potential test and performance data elements to help you understand and improve your network. The Android SDK includes background signal scans, which provide additional data about LTE and 5G signal level and quality. All data elements can be delivered via extract, CSV file, JSON or real-time feeds.

mobile-sdk-image-1

Get actionable insight into network performance

Enterprises can use the Speedtest Mobile SDK to better understand the network performance experience of their remote staff and customers. The Speedtest data collected within your app can help you:

  • Troubleshoot individual problems
  • Identify problem hotspots and potential solutions
  • Improve a customer’s call with customer care
  • Save money on field support costs
  • Prevent customer churn on a case-by-case basis

On a larger scale, Speedtest data can help you analyze trends in network performance so that you can plan and validate network improvements – helping you build a better network for the long-term satisfaction of your customers.

Inquire about the Speedtest Mobile SDK today to learn how you can join leading network operators around the world in integrating Speedtest into your mobile applications.

Ookla retains ownership of this article including all of the intellectual property rights, data, content graphs and analysis. This article may not be quoted, reproduced, distributed or published for any commercial purpose without prior consent. Members of the press and others using the findings in this article for non-commercial purposes are welcome to publicly share and link to report information with attribution to Ookla.

| October 4, 2021

Introducing Video Analytics in Speedtest Intelligence


With video content being the most dominant form of global network traffic, it’s important to understand your customers’ real-life experience with internet and mobile connectivity when they are consuming video content. To that end, we are excited to announce the launch of Video Analytics in Speedtest Intelligence®.

We launched video testing in the Speedtest® app for iOS and Android earlier this year. Since then, millions of video tests have been initiated by consumers to gain insights about the quality of their video streaming experience. Speedtest Intelligence now allows enterprises to surface key insights into the real-world consumer video experience on their network. With these insights, internet service providers and mobile network operators can monitor video performance and quality over time, benchmark against competitors, assess the impact of network build-outs on video performance, and much more.

Consumer video tests, enterprise video analytics

When a user presses the play button on the Speedtest video test, it initiates adaptive bitrate video playback which dynamically adjusts the buffering of various quality video renditions to provide the best playback experience possible based on the device and network capabilities. The purpose of this is to deliver the maximum quality video supported by the network and device, while minimizing undesired behaviors such as stall events and long preplay buffering times. Speedtest video testing uses adaptive bitrate streaming and prevalent streaming protocols, codecs, containers, and CDNs to make our test as short as possible while also enabling us to detect the stabilized bitrate and stalls in playback.

If the highest resolution of 4K is not achieved in the adaptive bitrate stage, then the test moves on to the fixed stage, during which a series of short videos are played at increasing resolutions until the test either fails to complete in a given period of time or else reaches a maximum resolution of 4K. When the test is complete, consumers get a snapshot of their results, including maximum resolution, load time, buffering percentage, and suggested devices to stream video at their current performance level.


Network operators and other enterprises can now gain insight from millions of consumer video tests to better understand how fixed and mobile subscribers experience industry-standard video KPIs. Metrics available in the Video Analytics dashboard include:

  • Average media bitrate for the adaptive bitrate stage
  • Distribution of primary resolution for the adaptive bitrate stage
  • Rebuffering ratio for the adaptive bitrate and fixed stages
  • Start failures for the adaptive bitrate and fixed stages
  • Start time for the adaptive bitrate and fixed stages
  • Overall distribution of highest successful resolution

chart-art

How ISPs and MNOs can use Video Analytics

With Video Analytics in Speedtest Intelligence, network operators can gain insights about their customers’ video streaming experience. Video Analytics data can help you:

  • Directly measure consumer video experience
  • Monitor consumer video performance & quality over time
  • Benchmark against competitors
  • Assess the impact of network optimization or build-out on video performance
  • Prioritize engineering efforts in areas with poor video experience
  • Prioritize marketing efforts in areas where competitors provide poor video experience
  • Identify areas with good video streaming experience for upsell of bundled OTT services
  • Correlate poor mobile video experience to specific cell sites and RF issues

Want to give your customers a world-class video streaming experience? Inquire about adding the Video Analytics dashboard to your Speedtest Intelligence subscription today.

Ookla retains ownership of this article including all of the intellectual property rights, data, content graphs and analysis. This article may not be quoted, reproduced, distributed or published for any commercial purpose without prior consent. Members of the press and others using the findings in this article for non-commercial purposes are welcome to publicly share and link to report information with attribution to Ookla.

| September 15, 2020

Introducing New 3D Views of Network Performance and Coverage in Cell Analytics

Tall buildings present a particular challenge when analyzing indoor mobile network performance and coverage, because those metrics can vary significantly by height. New 3D “z-axis” views in Cell Analytics™ from Ookla® allow mobile network operators to spot problems at specific elevations that a traditional two-dimensional view could miss.

Powered by hundreds of millions of daily performance, coverage and signal measurements from Speedtest®, Cell Analytics provides unparalleled intelligence about wireless service quality, RF measurements, data usage, indoor and outdoor user density, cell site locations and much more — surfaced in one intuitive platform. With the release of the new 3D views, operators can use this real-world data to pinpoint areas of poor mobile service, down to individual floor groups in buildings.

Network engineering and planning teams can see metrics like LTE RSRP, RSRQ, RSSNR and more, broken out vertically in 15-meter intervals. This article will explore three ways operators can use these powerful new views.

View conditions and user density by height in buildings

Cell Analytics provides data from locations that are not accessible by traditional data collection methods like drive testing and walk testing, such as private businesses and residences. The new 3D views show how any operator’s network performance, coverage and quality vary by floor groups within individual buildings, as well as user density by floor group across all operators. These views help to identify areas of high user concentration within buildings where you are also experiencing poor performance.

In the below example, we looked at the Smart network in Manila. By examining RF conditions in floor groups with high user counts, we can identify floor groups in individual buildings where the Smart network is providing marginal or poor coverage to a large number of users. Conversely, we can see where Smart has a competitive advantage: superior RF conditions and a large pool of potential new subscribers.

Cell_Analytics_Manila_RSRP

Cell_Analytics_Manila_User-Density

Identify which buildings are suffering poor quality on upper floors due to interference

Performance and quality of a network can vary dramatically within tall buildings. A customer may have a variable experience on your network, depending on where they are located in a given building, which can make a critical difference in a populous office high-rise or on the ground floor of a hospital. Detailed in-building analysis can show by height where performance is suffering, down to individual floor groups.

Using the 3D z-axis view in Cell Analytics, you can see where optimization is needed to accommodate for variable performance in important buildings. In the below example, we can see Kwong Wa Hospital in Hong Kong. This large, 1141-bed hospital has high user density and sees good coverage, but poor quality, on the csl network. We can also see that coverage increases with height in this building, while quality decreases. This behavior indicates interference within the building — and highlights an area where csl may want to build a new cell site or focus optimization efforts on the existing network.

Cell_Analytics_Hong-Kong_LTE-RSRP

Cell_Analytics_Hong-Kong_LTE-RSRQ_1

Identify buildings where your competitors have installed indoor systems

In addition to discovering areas of competitive strength and weakness, Cell Analytics z-axis views can help you discover where other operators have installed indoor systems, such as small cells or distributed antenna systems (DAS). By analyzing network performance and coverage data by floor group, you can determine the location of indoor cell sites, with high confidence.

If a tall building has excellent coverage and quality all the way through the uppermost floors, it is a likely indicator that the building contains indoor systems. Further confirmation can be provided by comparing the cell IDs serving users within and outside the building.

Cell_Analytics_Hong-Kong_LTE-RSRQ_2

The 3D views in Cell Analytics can be panned, tilted and rotated to get a full view of in-building performance and coverage. Never before has it been so easy to explore network metrics in the locations that are most important to your customers — at all elevations.

Ready to get unparalleled insights into your own and competitor networks? Request a demo of Cell Analytics today.

Ookla retains ownership of this article including all of the intellectual property rights, data, content graphs and analysis. This article may not be quoted, reproduced, distributed or published for any commercial purpose without prior consent. Members of the press and others using the findings in this article for non-commercial purposes are welcome to publicly share and link to report information with attribution to Ookla.