| December 2, 2024

Too Big to Fail? The Largest Outages in 2024 According to Downdetector

Our reliance on technology is so total that for many it feels like the world is ending when a popular site or service on the internet is inaccessible, and 2024 saw many outages that reminded us how much one such interruption can disrupt the daily lives of millions. We analyzed Downdetector® data from Q1-Q3 2024 to see where that pain of disconnection was felt most acutely. Read on to revisit the largest outages of 2024 at a global level and sorted by region.

Note that while some companies experienced more than one large outage during this time period, we’ve listed only the largest incident per company in each chart.

The world’s biggest outages this year

Chart of World's Largest Outage i, Downdetector, Q1-Q3 2024

Users of social media sites, internet providers, and gaming sites and services suffered the most disruptions this year according to Downdetector data on the world’s biggest outages. Facebook had the largest outage on our list. On March 5, over 11.1 million people across the world reported issues with the popular social media site.

The second largest global outage may be the most memorable. While CrowdStrike is not a service most people think of, we saw nearly 5 million reports to services that rely on it (or rely on Microsoft which relies on Crowdstrike), including emergency services, airlines, and ride sharing apps when a routine software update went bad on July 19.

AT&T suffered the third largest outage in the world, according to Downdetector data, when an equipment configuration error caused customers across the entire United States to lose network access for over 12 hours.

Biggest outages in each region

Asia Pacific region hit by global outages

Chart of Largest Outage in Asia-Pacific Region, Downdetector, Q1-Q3 2024

The March 5 Facebook outage also topped the list of outages in the Asia-Pacific region, instigating over 908k user reports to Downdetector and taking Instagram down with it as the second largest outage. The third largest outage happened on June 26 when over 168k Microsoft 365 users in the Asia-Pacific region reported service disruptions on the service. Japan was especially hard hit with over 139k user reports from that country alone.

People in the Asia-Pacific region were also affected by local outages, with over 76k users reporting issues with Japanese payment system PayPay in May, and 65k users in India reported issues with Jio during a September service disruption.

Europe struggles with social media sites

Chart of Largest Outage in Europe, Downdetector, Q1-Q3 2024

Social media sites were the main source of disconnection in Europe according to data from Downdetector. Over 3.4 million European users reported issues with Facebook during the March 5 outage, making that the largest outage in Europe during Q1-Q3 2024. WhatsApp users suffered the second largest outage in Europe with over 1.1 million people reporting issues during an outage in early April.

Two German companies also showed up on our list of largest outages in Europe with over 218k reports of issues with 1&1 and over 209k reports of issues with Deutsche Telekom when the two companies experienced service disruptions almost a week apart in late May.

Latin America feels pain from global social outages

Chart of Largest Outage in Latin America, Downdetector, Q1-Q3 2024

Latin America’s top three outages mirrored those in Europe with social media sites causing the most pain for users according to data from Downdetector. The March 5 Facebook outage was felt profoundly with almost 850k user reports on Downdetector in Latin America for issues related to Facebook and over 260k related to Instagram. WhatsApp had the second largest outage in the region with almost 420k user reports during the two hours the service was down on April 3.

Bait, a Mexican Mobile Virtual Network Operator (MVNO) owned by Walmart, suffered an outage on April 2 where almost 99k users reported issues to Downdetector. And on September 24, over 74k users reported issues with Brazilian fintech bank Nubank.

Middle East and Africa experience mix of local and global outages

Chart of Largest Outage in the Middle East and Africa, Downdetector, Q1-Q3 2024

Outage patterns in the Middle East and Africa differed from those in other regions with users reporting about as many issues with local sites and services as global ones. The two largest outages, Microsoft 365 on March 14 and Facebook on March 5, were part of global events.

The third largest outage in the region was with South African telecommunications provider Telkom. Almost 55k users across Africa reported issues to Downdetector when Telkom experienced an outage on May 13. MTN, Vodacom, and du are other telecom providers that made our list of top outages in the Middle East and Africa during Q1-Q3 2024.

United States and Canada

Chart of Largest Outage in U.S. and Canada, Downdetector, Q1-Q3 2024

As we saw with much of the rest of the world, Facebook topped the list of outages in the U.S. according to Downdetector with over 5.8 million users reporting issues with the service during its outage on March 5. The Crowdstrike and AT&T outages also hit the U.S. hard with almost 5 million and over 3.4 million user reports, respectively. Gaming sites and services and telecom providers filled out the rest of the list in the U.S.

Downdetector is your source for information about service disruptions, monitoring real-time performance for thousands of popular web services globally. Find Downdetector on the web or in the free Speedtest app for Android or iOS. We’ve recently introduced push notifications so you can learn about outages as soon as they happen. Businesses looking for early alerting on service issues may be interested in Downdetector ExplorerTM.

Ookla retains ownership of this article including all of the intellectual property rights, data, content graphs and analysis. This article may not be quoted, reproduced, distributed or published for any commercial purpose without prior consent. Members of the press and others using the findings in this article for non-commercial purposes are welcome to publicly share and link to report information with attribution to Ookla.

| November 12, 2024

More Fast, Free Airport Wi-Fi Just in Time for the Holidays

Airports in the United States have seen record-breaking numbers of travelers this year, and the always-busy Thanksgiving weekend could put even more stress on airport services. Including free Wi-Fi. We took a careful look at recent performance at the 50 largest airports by passenger volume in the U.S. as part of our ongoing series to help you plan ahead. Speeds have slipped at some of the top airports, but two more airports have free Wi-Fi download speeds over 150 Mbps than last year. Read on for details.

10 airports have free fixed broadband Wi-Fi over 150 Mbps

Fixed Broadband Internet Download Speeds Over Free Wi-Fi at U.S. Airports
Speedtest Intelligence® | Q3 2024
A map showing fixed broadband speeds in selected airports in the United States.

Chart of Fixed Broadband Internet Speeds Over Free Wi-Fi at U.S. Airports

Speedtest Intelligence® shows Norman Y. Mineta San José International Airport, Daniel K. Inouye International Airport, and Cincinnati/Northern Kentucky International Airport were once again home to some of the fastest free airport Wi-Fi among the country’s busiest airports, with median download speeds of 195.89 Mbps (down from 259.37 Mbps last year), 181.94 Mbps (down from 187.58 Mbps), and 176.29 Mbps (down from 210.09 Mbps), respectively, during Q3 2024.  

Rounding out the top 10 were:

  • John Glenn Columbus International Airport (173.52 Mbps),
  • San Francisco International Airport (166.37 Mbps), 
  • Fort Lauderdale–Hollywood International Airport (162.18 Mbps in Terminal 3), 
  • Phoenix Sky Harbor International Airport (160.39 Mbps), 
  • Fort Lauderdale–Hollywood International Airport (158.38 Mbps), 
  • Louis Armstrong New Orleans International Airport (157.68 Mbps), 
  • Pittsburgh International Airport (154.02 Mbps), and LaGuardia Airport (152.77 Mbps). 

Keep in mind that 150 Mbps is more than fast enough for 4K streaming and multi-player gaming

Ekahau®, our Wi-Fi solution, helps airports and other large-scale businesses ensure the networks you depend on are meeting your needs. Unfortunately, some airports are still not meeting the Wi-Fi optimization challenge. Specifically, two airports (William P. Hobby Airport and George Bush Intercontinental Airport) showed median download speeds over Wi-Fi of less than 25 Mbps. However, we are heartened that this is down from five last year with Raleigh-Durham International Airport, Philadelphia International Airport (Free PHL Airport WiFi-24), and Logan International Airport graduating by improving their speeds.

There was one change to our airport list this year, which is based on passenger volume: Kahului Airport was removed and John Glenn Columbus International Airport added. We have not included Kansas City International Airport, San Francisco Bay Oakland International Airport, San Antonio International Airport, or San Diego International Airport because there were insufficient samples.

Fort Lauderdale-Hollywood International Airport splits their free airport Wi-Fi among four separate SSIDs for different terminals, which we have listed separately in these results. While terminals 2 and 3 have a slight edge, the performance does not vary widely enough between them to intentionally hang out in the wrong terminal just to get a minor bump in speed, but if you’re in Philadelphia you definitely want to choose “Free PHL Airport WiFi” when possible, rather than “Free PHL Airport WiFi-24” if your device supports 5 GHz.

Mobile performance at 24 airports beats 150 Mbps

Mobile Internet Download Speeds at U.S. Airports
Speedtest Intelligence® | Q3 2024

Chart of Mobile Internet Speeds at U.S. Airports

Speedtest Intelligence® shows Sacramento International Airport and John Wayne Airport were the fastest airports on our list for mobile download speed during Q4 2024 at 535.02 Mbps and 451.72 Mbps, respectively. In all, 24 airports in our study had median download speeds over 150 Mbps, up from 18 in 2023. Fifteen of the airports showed median download speeds over 200 Mbps in 2024. 

We’re happy to report that no airport on our list showed median mobile download speeds of less than 25 Mbps.

Wi-Fi or mobile? The airports where it makes a difference

Where Wi-Fi wins

Wi-Fi is the fastest choice at 10 airports where download speed over mobile network service is significantly slower than the free airport Wi-Fi. Details on how much faster the Wi-Fi is than mobile are as follows:

  • 102% at Hartsfield–Jackson Atlanta International Airport, 
  • 90% at Orlando International Airport, 
  • 82% at San Francisco International Airport, 
  • 77% at Dallas/Fort Worth International Airport, 
  • 70% at Seattle-Tacoma International Airport, 
  • 42% at Baltimore/Washington International Airport, 
  • 28% at John F. Kennedy International Airport, 
  • 25% at Harry Reid International Airport, and 
  • 10% at Daniel K. Inouye International Airport. 

It’s important to note that many of these differences are smaller than last year as mobile speeds are catching up to Wi-Fi capabilities.

Places to choose mobile service instead

Twenty-nine airports had faster download speeds over mobile than over free airport Wi-Fi during Q3 2024. Special mention goes to the following airports with massive improvements:

  • Southwest Florida International Airport showed mobile service 635% faster than airport Wi-Fi,
  • Mobile at Tampa International Airport was 528% faster than Wi-Fi, and 
  • Mobile was 341% faster than airport Wi-Fi at Sacramento International Airport. 

Mobile service was 4X faster than airport Wi-Fi at:

  • Salt Lake City International Airport, Logan International Airport, and 
  • Cleveland Hopkins International Airport. 

Mobile was 3X faster than airport Wi-Fi at: 

  • Philadelphia International Airport, 
  • Indianapolis International Airport, 
  • John Wayne Airport, 
  • Denver International Airport, 
  • Detroit Metropolitan Airport, and 
  • George Bush Intercontinental Airport. 

Mobile service was 2X faster at: 

  • Raleigh-Durham International Airport, 
  • Midway International Airport, 
  • Portland International Airport, 
  • St. Louis Lambert International Airport, 
  • Austin–Bergstrom International Airport, 
  • William P. Hobby Airport, 
  • Minneapolis–Saint Paul International Airport, 
  • Los Angeles International Airport, 
  • Louis Armstrong New Orleans International Airport, 
  • Phoenix Sky Harbor International Airport, 
  • John Glenn Columbus International Airport, 
  • Ronald Reagan Washington National Airport, and 
  • Miami International Airport. 

And mobile service was 1X faster than airport Wi-Fi at: 

  • Charlotte Douglas International Airport, 
  • Washington Dulles International Airport, 
  • LaGuardia Airport, and 
  • Nashville International Airport.

All in all, it looks like your airport internet will probably be faster than the security line, and in many airports, faster than your mobile service. Set yourself up for success by downloading a few of your favorite shows along with the Speedtest apps for Android and iOS before you leave the house. And while you’re waiting for that flight, help out travelers next year by taking a Speedtest at the airport to share your experience. 

Ookla retains ownership of this article including all of the intellectual property rights, data, content graphs and analysis. This article may not be quoted, reproduced, distributed or published for any commercial purpose without prior consent. Members of the press and others using the findings in this article for non-commercial purposes are welcome to publicly share and link to report information with attribution to Ookla.

| July 23, 2024

Is Parisian Mobile Coverage Ready for the Gold?

All eyes are on Paris this month for the 2024 Olympic Games. Hundreds of thousands of people will converge to watch the events or compete, and every single one will want to share their experience with friends, loved ones, and the internet at large. Which can only happen if they can find mobile coverage. So we analyzed Speedtest® data from Q2 2024 to help you find the best connection near the various Olympic venues in Paris.

Paris is 5G-ready overall

Map Best Available Mobile Technology in Paris

Our analysis of Speedtest data across Paris shows that 5G is available in almost every corner of the city. Coverage is not quite as complete in or near the cemeteries of Montparnasse or Pere Lachaise or in the parks of Bois de Boulogne or Bois de Vincennes, but for the most part you’ll have a hard time finding an area where you cannot connect at all. 5G offers better performance for mobile customers than 4G LTE, providing higher speeds and lower latency. To learn more about 5G, visit our 5G FAQ.

Each of the sections below will give you a good idea of what cellular connection type is most common in the area. For a view of the most common connection types for each mobile carrier, download the Speedtest app for Android or iOS and check the map tab. Pull up the drawer to select a carrier and whether you want to see the best connection type available or the most common. Remember that if you’re roaming, you may not get the performance you’re used to at home.

4th Arrondissement: Hôtel de Ville

Map of Most Common Mobile Technology in 4th Arrondissement in Paris

The Olympic marathon begins at Paris’s iconic city hall. You should be in luck for 5G coverage both at the start of the race and anywhere you wander along Rue de Rivoli and into the Arsenal section of the Marais. In northern parts of the Marais, 4G is more common, though you may still be able to connect to 5G.

7th Arrondissement: Eiffel Tower Stadium, Champ de Mars Arena, Invalides

Map of Most Common Mobile Technology in 7th Arrondissement in Paris

You’ll probably visit the Eiffel Tower and nearby Champ de Mars, even if you aren’t a fan of beach volleyball, judo, or wrestling. The good news is that 5G is the most common mobile technology near both those venues. The bad news is that there are a few small areas running up the middle of the 7th arrondissement where you’ll be on 3G or you could have no service at all. If this happens, keep walking east because you’ll pass through those areas quickly and find 5G again close to Les Invalides and leading up to Pont Alexandre III.

8th Arrondissement: Grand Palais, La Concorde, Pont Alexandre III

Map of Most Common Mobile Technology in 8th Arrondissement in Paris

The 8th arrondissement is home to venues featuring some of the newest Olympic sports, including breakdancing and skateboarding; it’s also teeming with 5G coverage and shows no dead zones. So whether you’re into fencing, taekwondo, cycling, or swimming, you’ll have access to 5G near all the major venues in this district.

12th Arrondissement: Bercy Arena

Map of Most Common Mobile Technology in 12th Arrondissement in Paris

Sharing all the gymnastics highlights should be easy at Bercy Arena in the 12th arrondissement with 5G solidly covering the southwest side of the venue up and down the Seine on Quai de Bercy. LTE is more common along the northeast side of the venue and deeper into the middle of the district. There are a few anomalous spots of 3G or no service dotted throughout the 12th arr., including near the Musée des Arts Forains, Place de la Nation, and in the Bois de Vincennes.

15th Arrondissement: South Paris Arenas

Map of Most Common Mobile Technology in 15th Arrondissement in Paris

5G is most commonly found along the southwest edge of the 15th arrondissement, including near the South Paris Arena. If you’re walking south from the Eiffel Tower and the 7th arrondissement for the handball, table tennis, volleyball, or weightlifting events at South Paris Arenas, you’ll likely be bumping back and forth between 4G and 5G. There are also a few small areas of 3G or no service scattered throughout the district, so if you’re having trouble connecting, walk a few hundred meters and try again because you’ll be back on LTE.

16th Arrondissement: Trocadéro, Parc des Princes, Stade Roland-Garros

Map of Most Common Mobile Technology in 16th Arrondissement in Paris

If you’re watching football, cycling, boxing, or tennis at any of the three Olympic venues in the 16th arrondissement, you’ll likely have 5G. However, you may quickly find yourself on 4G LTE if you’re wandering the district at large. As we saw in other districts, the edge of the Seine is a reliable place to find 5G should you need a faster connection.

18th Arrondissement: Porte de la Chapelle Arena

Map of Most Common Mobile Technology in 18th Arrondissement in Paris

Fans of badminton and rhythmic gymnastics will find the area around Porte de la Chapelle Arena in the 18th arrondissement to be well covered with 5G. In general, the northern part of this district has more 5G coverage, but there are a few areas of 3G or no service scattered throughout the southern half of the 18th arr.

To see what mobile coverage you can expect at Olympic venues outside of Paris or for a personalized view of mobile coverage by operator, download the free Speedtest app for Android or iOS and check the map tab. Be aware that massive crowds can weigh heavily on a network, so if you are having trouble connecting, check Downdetector® to see if there’s an outage or if a particular service is down.

Ookla retains ownership of this article including all of the intellectual property rights, data, content graphs and analysis. This article may not be quoted, reproduced, distributed or published for any commercial purpose without prior consent. Members of the press and others using the findings in this article for non-commercial purposes are welcome to publicly share and link to report information with attribution to Ookla.

| June 24, 2024

How Much Faster is 5G Anyway? An Analysis of Page Load Speed

There’s nothing quite like picking up your phone for a little “me” time only to open up that first web page… and wait for it to load. Maybe the images aren’t there yet or the content jumps around while the ads load — it’s the worst. 5G is meant to help, so we dug into Speedtest® quality of experience data to see if this newer technology is living up to its promise. Read on for an analysis of page load speed (how many milliseconds it takes for a page to load) on three popular services in nine major countries around the world during Q1 2024.

Click the country below to go directly to that section or read on for the full article:

Brazil | Canada | France | India 

Mexico | Nigeria 

South Africa | Spain | United States

Page speed relies on low latency for the best internet experience

Page load speed is a critical measure of your web browsing experience. It measures how long it takes for a page to load, fully displaying the content on that page. This is directly impacted by latency, which is how quickly your device gets a response after you’ve sent out a request. A typical request on the internet requires two to five round trip communications between various entities over different latency sensitive protocols.

One of the promises of 5G is lower latency, which should lead to a faster (lower) page load speed on any page. The Speedtest Global IndexTM reported the global average for mobile latency as 27 milliseconds (0.027 seconds) with fixed broadband at 9 ms (0.009 s) in May 2024. As seen in the video below, it can take 7x longer to load a full webpage when latency is high, and “40% of users will abandon a site if it takes more than 3 seconds to load,” according to one source. Read more about the importance of latency to quality of experience.

5G lived up to the latency promise, showing a faster page load speed than 4G on all services in all countries we surveyed. However, the improvement was not the same in all places, with Canada topping the list of fastest page load speed over 5G on all the services we surveyed while South Africa had the slowest 5G page load speed on Google and YouTube of countries reviewed here. Read on for details.

5G loads 20-30% faster than 4G in Brazil

Chart of 5G vs. 4G Page Load Speed in Brazil

Speedtest data shows that 5G delivered a much lower page load speed than 4G on all three services in Brazil during Q1 2024. Google loaded 20% faster on 5G than 4G, YouTube was 25% faster, and Facebook was 30% faster on 5G.

Canada’s 5G page load speed among the fastest on all 3 services

Chart of 5G vs. 4G Page Load Speed in Canada

As mentioned, Canada’s 5G page load speed was the fastest or among the fastest for all countries analyzed in this article, with Canada having the fastest page load speed on Facebook, Google, and YouTube. Our analysis demonstrated that 5G delivered a decently faster page load speed than 4G on all three services in Canada during Q1 2024. YouTube loaded 16% faster on 5G than 4G, Google was 18% faster, and Facebook was 23% faster on 5G.

French 5G loads 14-20% faster than 4G

Chart of 5G vs. 4G Page Load Speed in France

Speedtest data shows 5G page load speed on all three services was decently faster than on 4G in France during Q1 2024. YouTube loaded 14% faster on 5G than 4G, Facebook was 19%, and Google was 20% faster on 5G.

5G loads 23-33% faster than 4G in India

Chart of 5G vs. 4G Page Load Speed in India

Analysis of Speedtest data shows the page load speed on all three services was much lower on 5G than 4G in India during Q1 2024. Google loaded 23% faster on 5G than 4G, YouTube was 32% faster, and Facebook was 33% faster on 5G. India and Mexico had the slowest page load speeds for Facebook over 5G of any of the countries we looked at.

Mexican 5G loads 26-28% faster than 4G

Chart of 5G vs. 4G Page Load Speed in Mexico

Speedtest data shows 5G delivered a much lower page load speed than 4G on all three services in Mexico during Q1 2024. Google and Facebook loaded 26% faster on 5G than 4G and YouTube was 28% faster on 5G. Mexico and India had the slowest 5G page load speeds for Facebook among the countries examined.

5G loads up to 47% faster than 4G in Nigeria

Chart of 5G vs. 4G Page Load Speed in Nigeria

Our analysis revealed 5G delivered a much lower page load speed than 4G on all three services in Nigeria during Q1 2024. Google loaded 24% faster on 5G than 4G, YouTube was 27% faster, and Facebook was a whopping 47% faster on 5G.

South Africans see 22-36% faster 5G page load over 4G, but slow Google and YouTube

Chart of 5G vs. 4G Page Load Speed in South Africa

Speedtest data shows 5G delivered a much lower page load speed than 4G on all three services in South Africa during Q1 2024. Google loaded 22% faster on 5G than 4G, YouTube was 27% faster, and Facebook was 36% faster on 5G. South Africa had the slowest 5G page load speed for both Google and YouTube of any of the countries analyzed.

5G loads 11-15% faster than 4G in Spain

Chart of 5G vs. 4G Page Load Speed in Spain

5G page load speed in Spain was somewhat faster than 4G on all three services during Q1 2024. YouTube loaded 11% faster on 5G than 4G, Google was 14% faster than 4G, and Facebook was 15% faster on 5G.

U.S. 5G loads 21-26% faster than 4G

Chart of 5G vs. 4G Page Load Speed in United States

Speedtest data from the U.S. shows 5G delivered a much lower page load speed than 4G on all three services during Q1 2024. Google loaded 21% faster on 5G than 4G, YouTube was 22% faster, and Facebook was 26% faster on 5G.

Your time is valuable. Our data shows that you can get some of that important time back if you have access to 5G and can afford to upgrade. To learn more about your network experience, download the Speedtest app for Android or iOS. Remember, too, that there’s a Downdetector® tab in the Speedtest apps to help you troubleshoot pages that aren’t loading at all.

Ookla retains ownership of this article including all of the intellectual property rights, data, content graphs and analysis. This article may not be quoted, reproduced, distributed or published for any commercial purpose without prior consent. Members of the press and others using the findings in this article for non-commercial purposes are welcome to publicly share and link to report information with attribution to Ookla.

| June 17, 2024

Your Guide to Airport Wi-Fi and Mobile Performance at 50+ Global Airports in 2024

Airports around the world have been packed with travelers this year, which puts extra stress on the Wi-Fi. With summer travel already well in swing in the northern hemisphere, we’re back with fresh data for our series on airport Wi-Fi performance to help you plan for connectivity at all your connections. You’ll find information about Wi-Fi on free networks provided by the individual airports as well as mobile speeds at some of the busiest airports in the world during Q1 2024. Read on for a look at internet performance at over 50 of the world’s busiest airports with data on download speed, upload speed, and latency.

Key takeaways

  • The seven fastest airports for downloads over Wi-Fi were in the United States: San Francisco International Airport, Newark Liberty International Airport, John F. Kennedy International Airport, Phoenix Sky Harbor International Airport, Seattle–Tacoma International Airport, Dallas Fort Worth International Airport, and Harry Reid International Airport.
  • Six U.S. airports had the fastest uploads over Wi-Fi: San Francisco International Airport, Phoenix Sky Harbor International Airport, Newark Liberty International Airport, Seattle–Tacoma International Airport, Dallas Fort Worth International Airport, and John F. Kennedy International Airport.
  • The fastest mobile download speeds on our list were at Hamad International Airport in Doha, Qatar, Shanghai Hongqiao International Airport in China, and Phoenix Sky Harbor International Airport in the U.S.
  • Eight of the 10 airports with the fastest mobile upload speeds were in China.

9 airports have 100+ Mbps Wi-Fi download speeds

Speedtest Intelligence® showed seven of the nine airports with median Wi-Fi download speeds over 100 Mbps were in the U.S.:

  • San Francisco International Airport (173.55 Mbps),
  • Newark Liberty International Airport (166.51 Mbps),
  • John F. Kennedy International Airport (151.59 Mbps),
  • Phoenix Sky Harbor International Airport (151.28 Mbps),
  • Seattle–Tacoma International Airport (137.31 Mbps),
  • Dallas Fort Worth International Airport (119.92 Mbps), and
  • Harry Reid International Airport (107.84 Mbps).

Charles de Gaulle Airport in Paris, France and China’s Hangzhou Xiaoshan International Airport rounded out the list with median download speeds of 107.13 Mbps and 101.01 Mbps, respectively. Hartsfield–Jackson Atlanta International Airport and Sea–Tac had the lowest median multi-server latency on Wi-Fi of any of the airports surveyed during Q1 2024.

Hover on the pins on the map below to see full details for download and upload speeds as well as latency at all the airports analyzed.

Fixed Broadband Internet Speeds Over Free Wi-Fi at Global Airports
Speedtest Intelligence® | Q1 2024
A map showing fixed broadband speeds in selected global airports.

At Ookla®, we’re dedicated to making sure the networks you depend on are always at their best. With Ekahau®, our Wi-Fi solution, we know firsthand just how challenging it can be to optimize Wi-Fi at airports, especially when you have up to 900 people waiting at each boarding gate during the busiest travel times. While the speeds achieved by these top airports are impressive, we saw two smaller U.S. airports with median Wi-Fi download speeds over 200 Mbps during our U.S.-only analysis of airport Wi-Fi in the fall.

Six airports on our list use multiple SSIDs for their Wi-Fi networks for different terminals or to take advantage of the coverage advantages of 2.4 GHz and the speed advantages of 5 GHz frequencies. We have included data for all the SSIDs with sufficient samples in the map and reported in the text on the best result when using multiple SSIDs results in dramatically different speeds.

Eighteen airports on our list had median Wi-Fi download speeds of less than 25 Mbps. Mexico City International Airport in Mexico had the lowest median Wi-Fi download speed at 5.11 Mbps, followed by:

  • Tan Son Nhat International Airport in Vietnam (7.07 Mbps),
  • Beijing Capital International Airport in China (9.45 Mbps),
  • Cairo International Airport in Egypt (10.62 Mbps), and
  • Tokyo Haneda Airport in Japan (11.37 Mbps).

You may struggle with everything from video chatting to streaming at any airport with a download speed below 25 Mbps. Latency is also a factor in performance so if your airport is one of the three with a median Wi-Fi latency over 60 ms, a mobile hotspot may be a better option for a stable connection.

Wi-Fi 6 has arrived

Our analysis shows at least 15 airports on our list were using the new Wi-Fi 6 standard in their Wi-Fi setup. Wi-Fi 6 uses Multi-User Multiple Input, Multiple Output (MU-MIMO) and Orthogonal Frequency Division Multiple Access (OFDMA) to increase performance and throughput, especially when serving multiple devices. This offers a real advantage at a large public location like an airport. In order to get maximum benefit from Wi-Fi 6, consumers would need to be using Wi-Fi 6-compatible devices. Speedtest data shows a fairly even split between airports that saw faster download speeds on Wi-Fi 6 and airports where Wi-Fi 6 results were comparable to those on other earlier Wi-Fi generations.

As you know, international travel can be complicated. Even if the airport offers free Wi-Fi, you may encounter other barriers to access. For example, a local number is required in Cairo to receive the access code to connect to the airport Wi-Fi. And while we’d love to include other large airports like Nigeria’s Murtala Muhammed International Airport in future Wi-Fi analyses, they currently do not offer free Wi-Fi so we have included mobile data below.

11 airports show mobile speeds over 200 Mbps

Speedtest® data shows mobile speeds massively outpaced Wi-Fi, with 14 airports showing faster median downloads over mobile than the fastest airport for Wi-Fi. Hamad International Airport in Qatar had the fastest median download speed over mobile on our list at 442.49 Mbps during Q1 2024, followed by:

  • Shanghai Hongqiao International Airport (341.19 Mbps),
  • Phoenix Sky Harbor International Airport (295.94 Mbps),
  • Shanghai Pudong International Airport (264.71 Mbps),
  • Chongqing Jiangbei International Airport (258.42 Mbps), and
  • Istanbul Airport (255.51 Mbps).

Mobile Network Speeds at Global Airports
Speedtest Intelligence® | Q1 2024

Fastest mobile speeds at airports in Africa and South America

Jomo Kenyatta International Airport in Kenya had the fastest mobile download speeds of the four African airports we analyzed at 88.12 Mbps during Q1 2024. São Paulo/Guarulhos International Airport in Brazil was the faster of the two Latin American airports analyzed with a median download speed of 55.44 Mbps.

Airports with slow mobile speeds

Mobile can’t fix everything, because six airports came in with a median mobile download speed below 25 Mbps. Mexico City International Airport was again at the bottom with 8.75 Mbps, followed by:

  • Josep Tarradellas Barcelona–El Prat Airport (15.21 Mbps),
  • Orlando International Airport (15.84 Mbps),
  • Adolfo Suárez Madrid–Barajas Airport (20.37 Mbps),
  • Chhatrapati Shivaji Maharaj International Airport (20.96 Mbps), and
  • Indira Gandhi International Airport (21.80 Mbps).

Latency on mobile was generally higher than that on Wi-Fi with 46 airports showing a Wi-Fi latency lower than the lowest latency on mobile, 27.51 ms at China’s Shanghai Hongqiao International Airport. As noted above, latency is an important factor in performance, so it might be worth investigating the airport Wi-Fi by running a Speedtest if your mobile performance seems to lag.

Airport Wi-Fi or mobile? Connecting on your next trip

We created a quick guide to help you decide whether to try out the Wi-Fi or simply use the local mobile network if you have access. Use it to compare free airport Wi-Fi performance against mobile performance for the 52 airports we have both Wi-Fi and mobile data for during Q1 2024. Twenty-six airports had faster mobile internet than airport Wi-Fi. Eight airports had faster Wi-Fi than mobile, and seven airports showed only a slight distinction between Wi-Fi and mobile or download speeds over 100 Mbps on both, so we gave both the green check marks. We were able to include more airports in the mobile analysis because there were more mobile samples to analyze at those airports than there were samples over Wi-Fi.

Chart of Comparing Airport Wi-Fi and Mobile Speeds at World Airports

The averages reported here are based on real-world data, so your experience may differ, especially on a busy travel day. Take a Speedtest® at the airport to see how your performance compares. Cheers to safe travels and rapid connections wherever you’re flying.

Ookla retains ownership of this article including all of the intellectual property rights, data, content graphs and analysis. This article may not be quoted, reproduced, distributed or published for any commercial purpose without prior consent. Members of the press and others using the findings in this article for non-commercial purposes are welcome to publicly share and link to report information with attribution to Ookla.

| November 15, 2023

Your Black Friday/Cyber Monday Guide to iPhone 15 and Samsung Galaxy Z Fold5 and Flip5 Performance

To upgrade or not to upgrade, with Black Friday and Cyber Monday deals on the latest iPhone and Samsung devices on the horizon you may be asking yourself just that question. We analyzed data from Speedtest Intelligence® in 13 major markets to see how well the Apple iPhone 15 devices and the Samsung Galaxy Z Fold5 and Flip5 models are performing in comparison to last year’s models over 5G to help you make an informed decision. For details on performance by Samsung Galaxy S23 models, read our analysis from earlier this year. We’re especially interested in seeing if technical improvements on iPhone 15 models including support for WiFi 6E drive better performance.

Data for iPhone models is provided for the period from September 22-October 20, 2023, while data for the Samsung models is for the period from August 11-October 20, 2023. Keep in mind that device data differs across markets due to a variety of factors, including: 5G investments by governments and mobile operators, different 5G spectrum allocations, and mobile 5G plans. As many of these devices are very new, the sample counts in some countries are still low so the statistical ranges of expected performance are wider for the newer devices than the older models.

Half of models surveyed worth the upgrade in Australia

Chart of New Device Performance on 5G in Australia

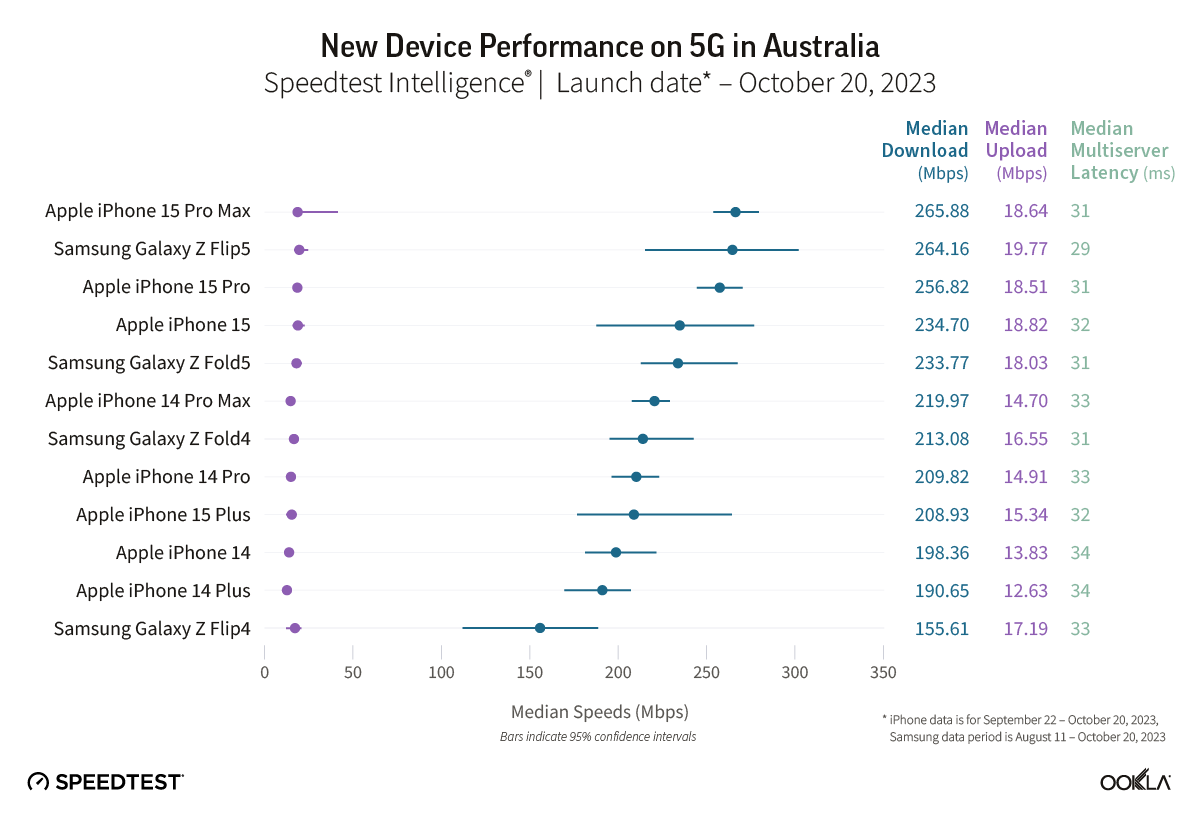
In Australia, two out of four iPhone 15 models showed median 5G download speeds that were significantly faster than their iPhone 14 equivalents during the September 22-October 20, 2023 period. Speedtest Intelligence reveals the iPhone 15 Pro and the iPhone 15 Pro Max both had a 14% better download speed than their prior year counterparts. There was no statistical winner for the iPhone standard model or the iPhone Plus in Australia during this period.

The Galaxy Z Flip5 had a 30% better download speed than the Galaxy Z Flip4 during the August 11-October 20, 2023 period in Australia, while there was no statistical winner for the Galaxy Z Fold.

Recommendation: Depending on your model of choice, only half the devices surveyed merit an upgrade based on performance alone in Australia.

iPhones mostly worth the upgrade in Brazil

Chart of New Device Performance on 5G in Brazil

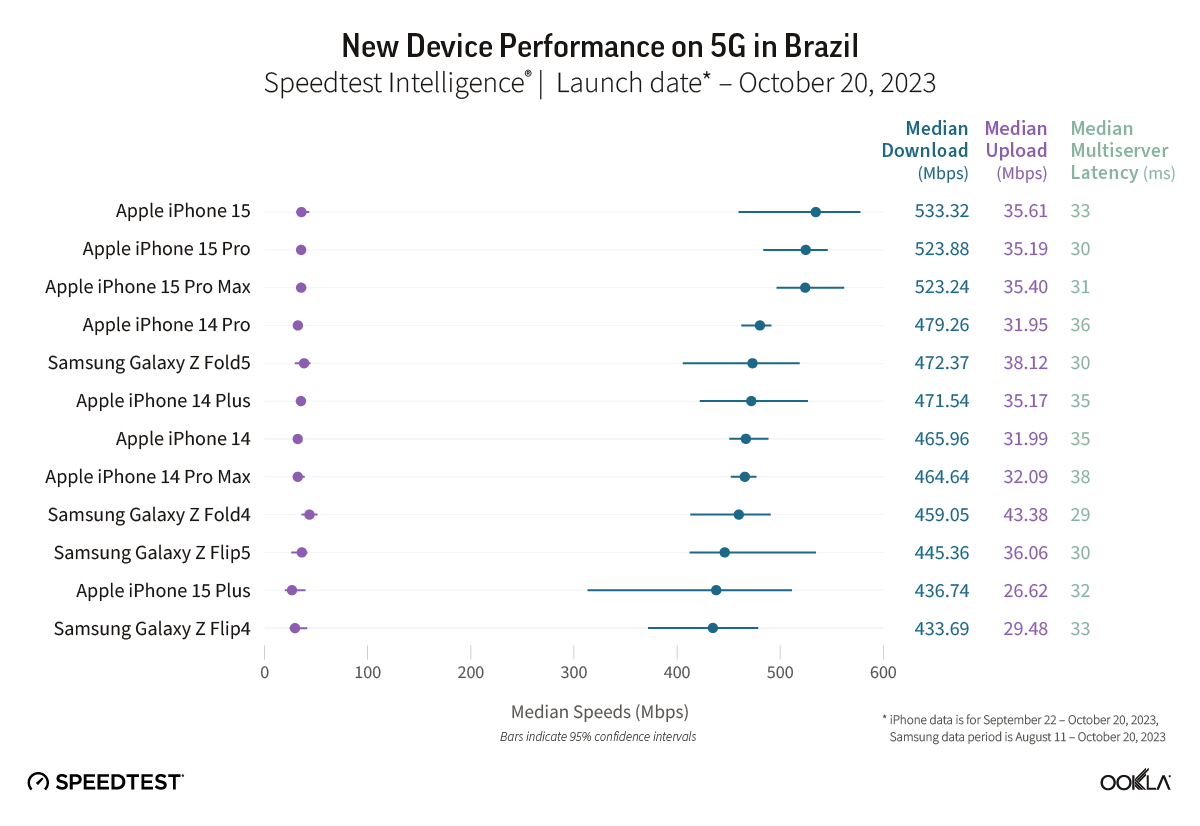
Three out of four iPhone 15 models in Brazil showed median 5G download speeds that were significantly faster than their iPhone 14 equivalents during the September 22-October 20, 2023 period. Speedtest Intelligence showed the iPhone 15 had a better download speed than the iPhone 14, with the iPhone 15 Pro Max having a 8% better download speed than the iPhone 14 Pro Max, and the iPhone 15 Pro showing a 1% better download speed than the iPhone 14 Pro. There was no statistical winner for the iPhone Plus in Brazil during this period.

There was no statistical winner for 5G median download speed during the August 11-October 20, 2023 period for the Galaxy Z Flip or the Galaxy Z Fold in Brazil.

Recommendation: iPhone users in Brazil should consider an upgrade based on performance, while Samsung Galaxy fans only need to upgrade if they are looking for feature improvements.

All iPhones show improvement over prior models in Canada

Chart of New Device Performance on 5G in Canada

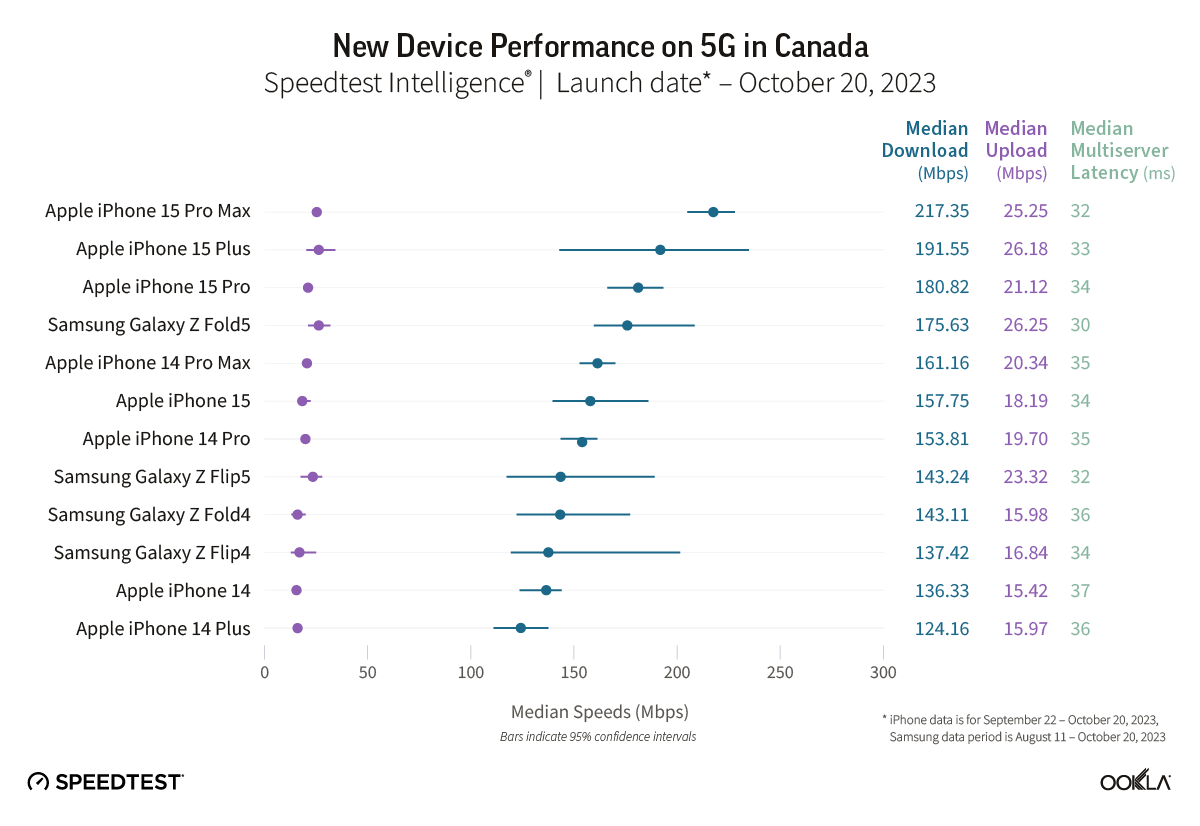
All four iPhone 15 models in Canada showed median 5G download speeds that were significantly faster than their iPhone 14 equivalents during the September 22-October 20, 2023 period. Data from Speedtest Intelligence demonstrated the iPhone 15 had a better download speed than the iPhone 14, with the iPhone 15 Pro Max having a 26% better download speed than the iPhone 14 Pro Max, the iPhone 15 Pro Plus showed a 12% better download speed than the iPhone 14 Pro Plus, and the iPhone 15 Pro had an 8% better download speed than the iPhone 14 Pro.

The Galaxy Z Fold5 had a better download speed than the Galaxy Z Fold4 during the August 11-October 20, 2023 period in Canada, while there was no statistical winner for the Galaxy Z Flip.

Recommendation: iPhone users in Canada should consider an upgrade based on performance, while Samsung Galaxy fans should make a decision based on which model they’re considering.

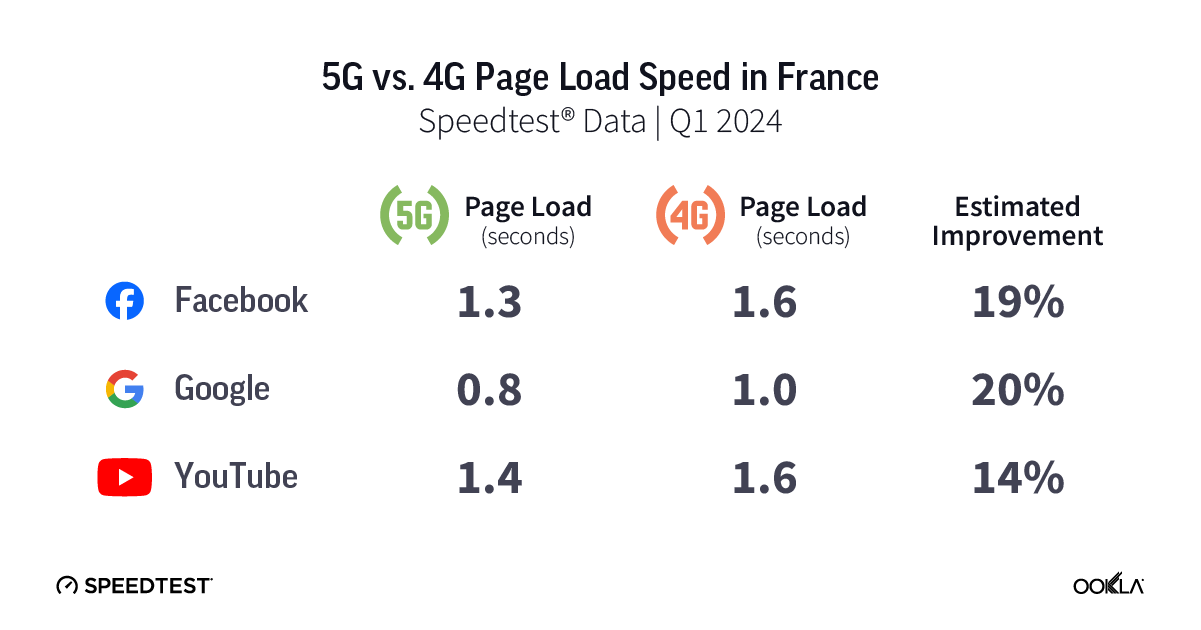
Three iPhone models show decent improvement over prior versions in France

Chart of New Device Performance on 5G in France

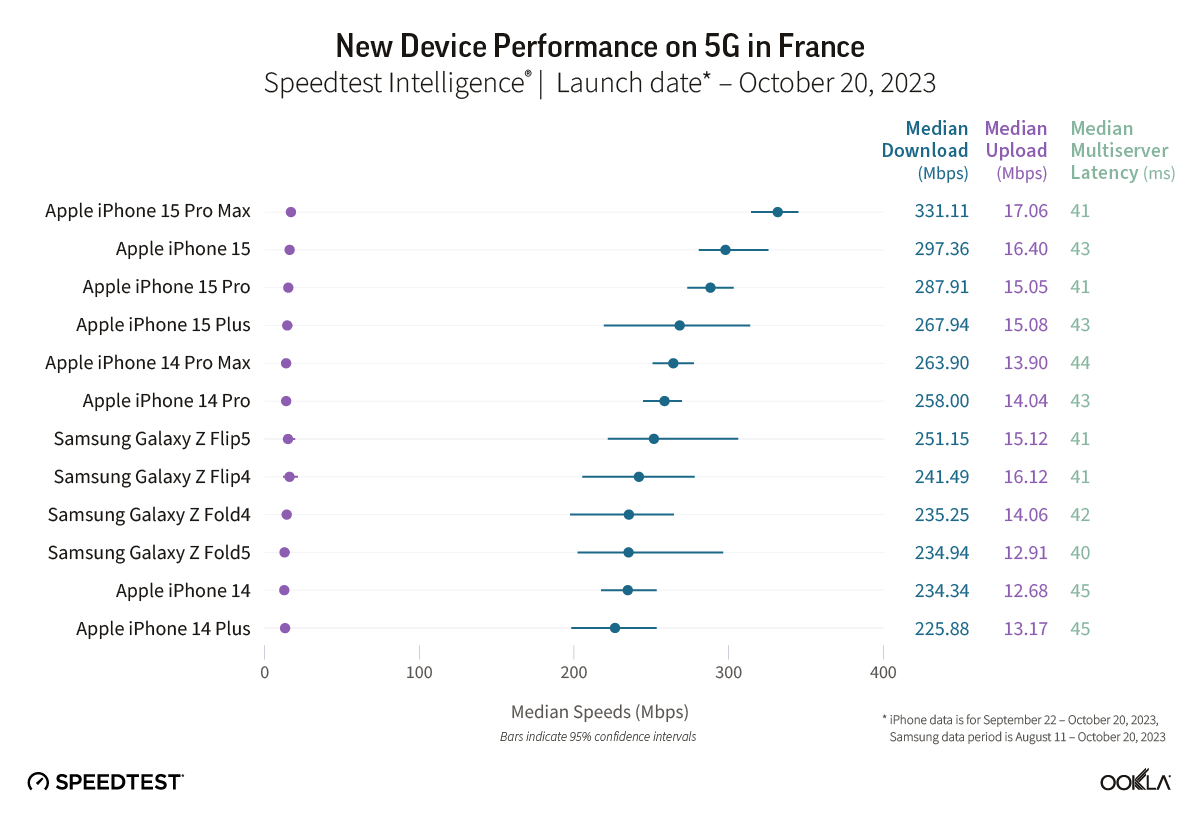
Three out of four iPhone 15 models in France showed median 5G download speeds that were significantly faster than their iPhone 14 equivalents during the September 22-October 20, 2023 period. Speedtest Intelligence reveals the iPhone 15 and the iPhone 15 Pro Max both had 18% better download speeds than their respective prior year models. The iPhone 15 Pro had a 5% better download speed than the iPhone 14 Pro. There was no statistical winner for the iPhone Plus in France during this period.

There was no statistical winner for 5G median download speed during the August 11-October 20, 2023 period for the Galaxy Z Flip or the Galaxy Z Fold in France.

Recommendation: iPhone users in France should consider an upgrade based on performance, and Samsung Galaxy users only need to upgrade if they are looking for feature improvements.

Galaxy Z Fold5 shows some improvements in Germany

Chart of New Device Performance on 5G in Germany

Two out of four iPhone 15 models showed median 5G download speeds that were significantly faster than their iPhone 14 equivalents in Germany during the September 22-October 20, 2023 period. Speedtest Intelligence reveals slight improvements with the iPhone 15 Pro Max having a 6% better download speed than the iPhone 14 Pro Max and the iPhone 15 Pro having a 2% better download speed than the iPhone 14 Pro. There was no statistical winner for the iPhone standard model or the iPhone Plus in Germany during this period.

The Galaxy Z Fold5 had a 13% better download speed than the Galaxy Z Fold4 during the August 11-October 20, 2023 period in Germany, while there was no statistical winner for the Galaxy Z Flip.

Recommendation: Apple users won’t see major performance improvements from the new models, but the Galaxy Z Fold5 is worth the upgrade on performance alone.

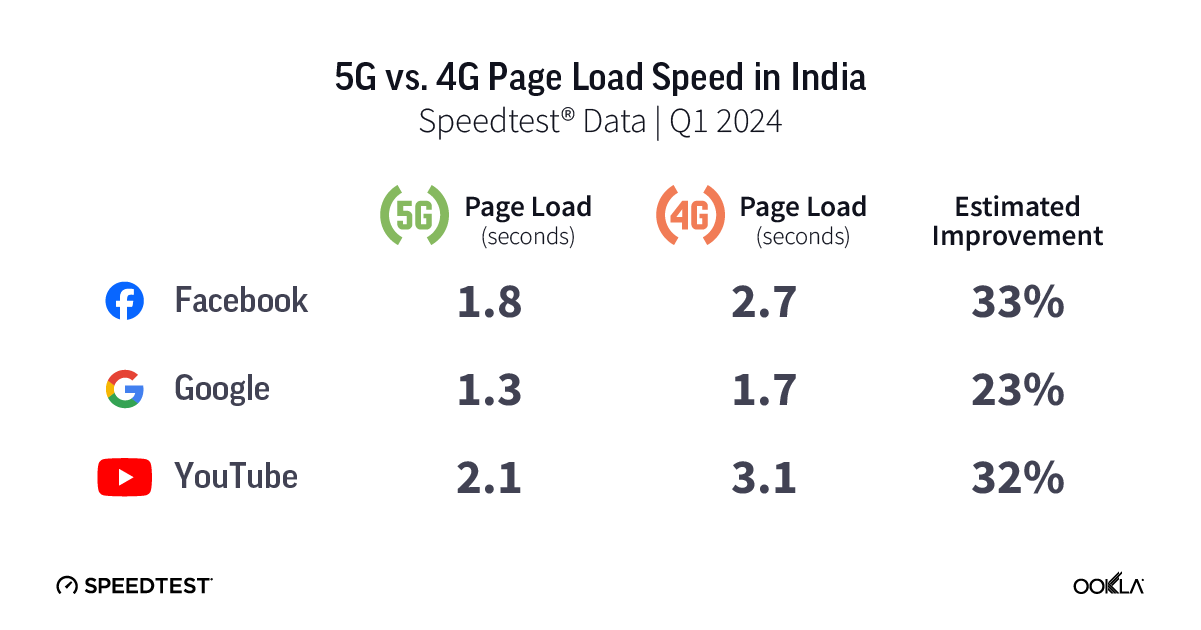
India sees better performance on three iPhone models

Chart of New Device Performance on 5G in India

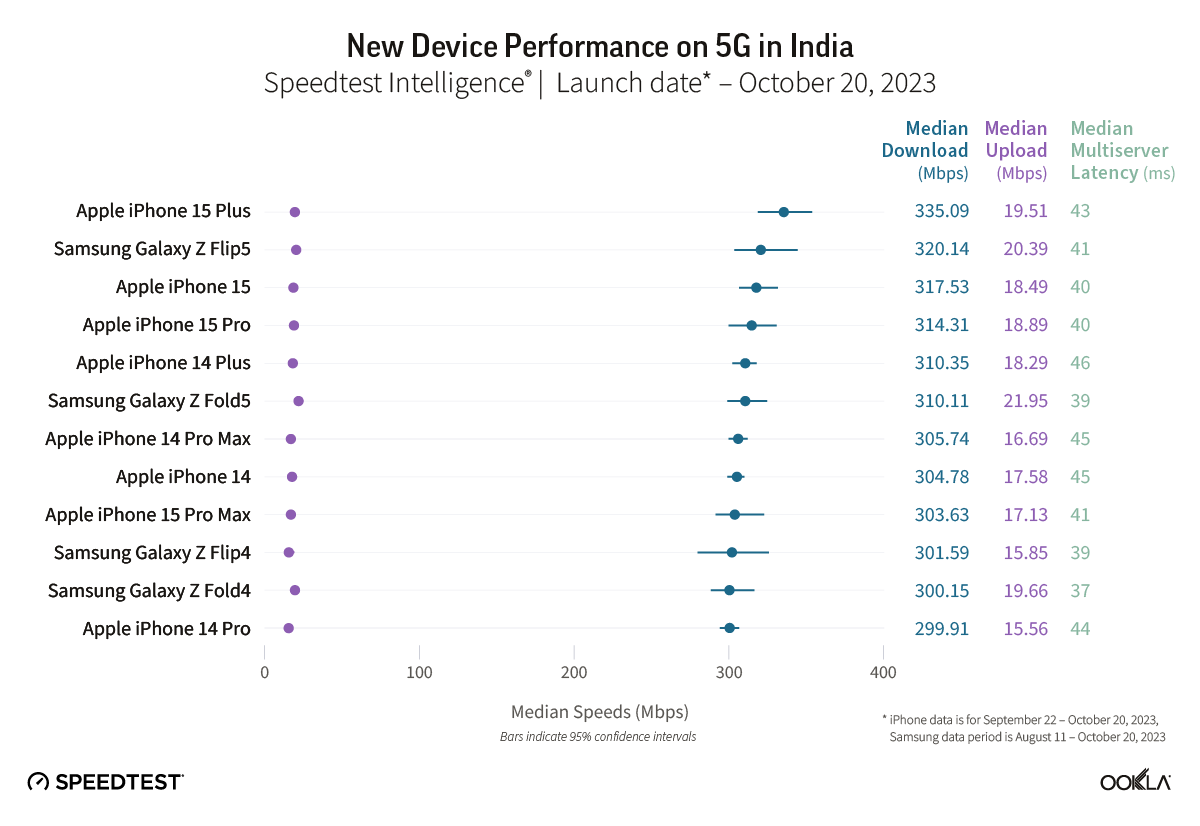
Three out of four iPhone 15 models in India showed median 5G download speeds that were significantly faster than their iPhone 14 equivalents during the September 22-October 20, 2023 period. Speedtest Intelligence showed the iPhone 15, iPhone 15 Pro, and the iPhone 15 Plus had better speeds than their respective prior models. There was no statistical winner for the iPhone Pro Max in India during this period.

There was no statistical winner for 5G median download speed during the August 11-October 20, 2023 period for the Galaxy Z Flip or the Galaxy Z Fold in India.

Recommendation: Indian iPhone users should consider an upgrade based on performance, and Samsung Galaxy users only need to upgrade if they are looking for feature improvements.

No significant performance gains on new devices in the Philippines

Chart of New Device Performance on 5G in the Philippines

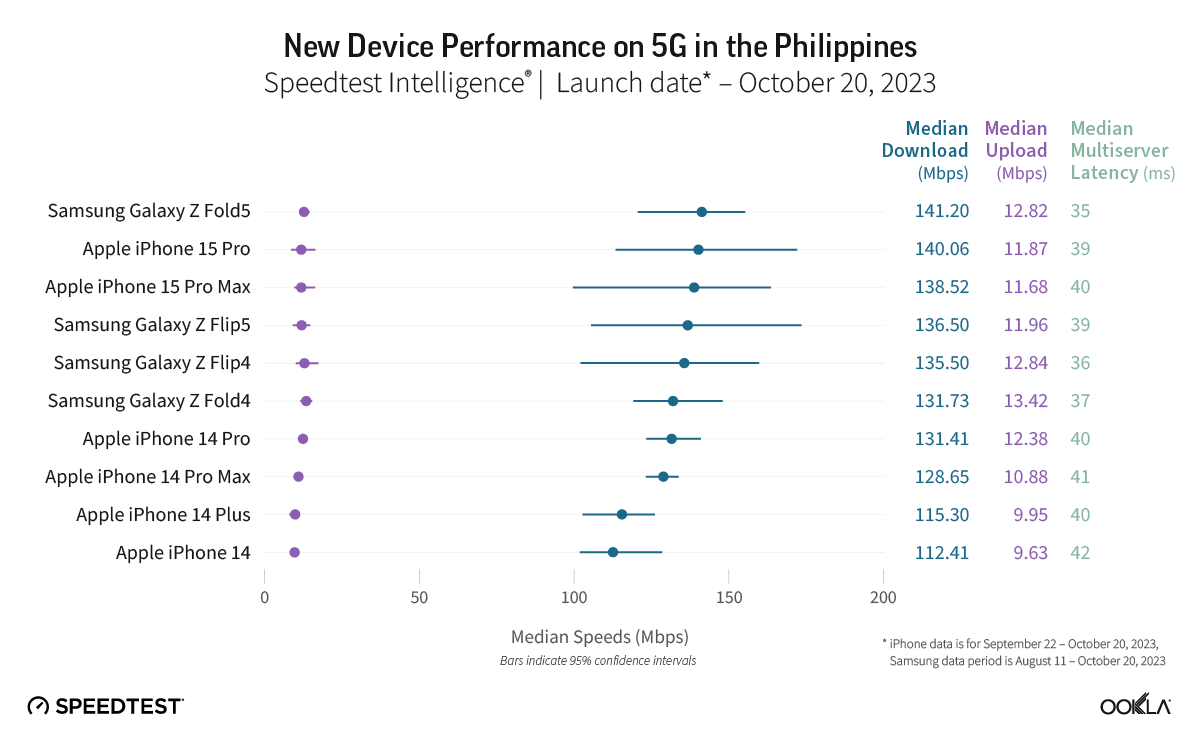
Neither the iPhone 15 Pro nor the iPhone 15 Pro Max had a statistically better median download speed over 5G than their prior year models during the September 22-October 20, 2023 period in the Philippines. There were not enough samples to properly assess the performance of the other two iPhone models.

Likewise, there was no statistical winner for 5G median download speed during the August 11-October 20, 2023 period for the Galaxy Z Flip or the Galaxy Z Fold in the Philippines.

Recommendation: Filipino consumers looking to upgrade their phones to the latest models will have to look for reasons beyond performance.

Galaxy Z Fold5 sees performance improvement in South Korea

Chart of New Device Performance on 5G in South Korea

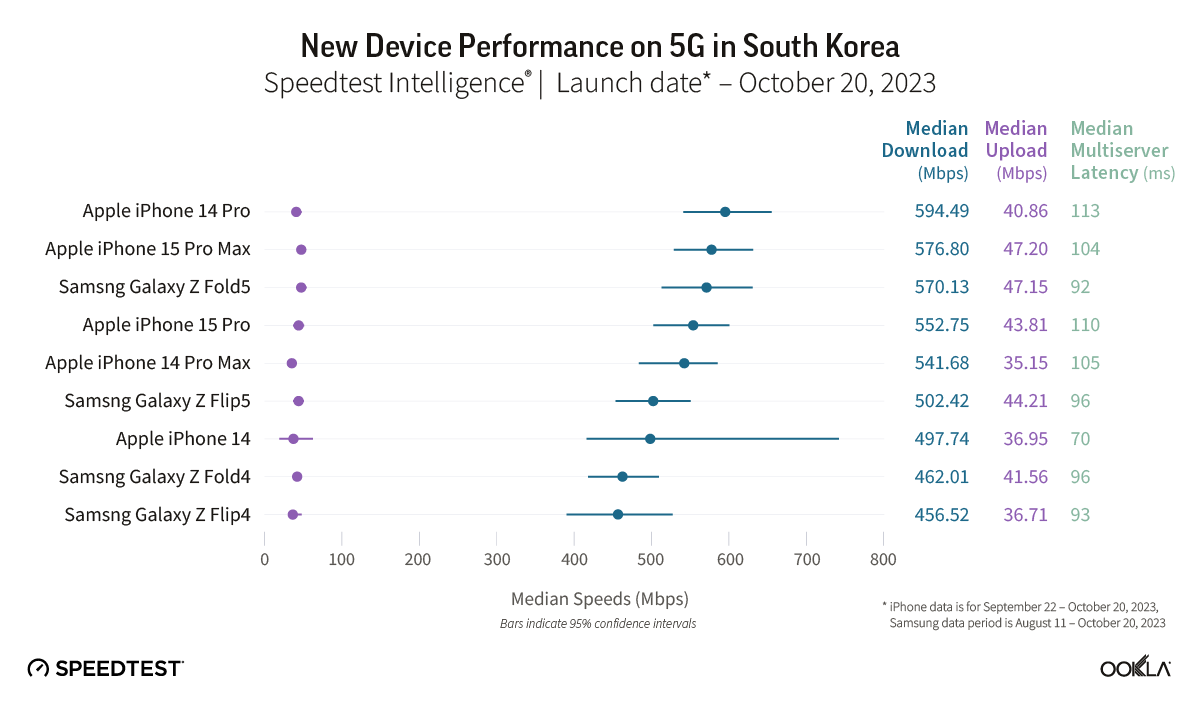
Mobile speeds in South Korea are already fast with a top 10 performance on the Speedtest Global Index™ as of September 2023. New phones may not push performance boosts, though, as Speedtest Intelligence data did not show significant increases in median download speed over 5G for the iPhone 15 Pro or the iPhone 15 Pro Max in South Korea during the September 22-October 20, 2023 period. However, the iPhone 15 Pro Max had a 16% better upload speed than the iPhone 14 Pro Max. There were not enough samples to properly assess the performance of the other two iPhone models.

On the other hand, the Galaxy Z Fold5 had a 10% better download speed than the Galaxy Z Fold4 during the August 11-October 20, 2023 period in South Korea, while there was no statistical winner for the Galaxy Z Flip.

Recommendation: If South Korean consumers are looking for better performance, upgrading from the Galaxy Z Fold4 to the Galaxy Z Fold5 is worth looking into.

Spain sees major increases in iPhone speed

Chart of New Device Performance on 5G in Spain

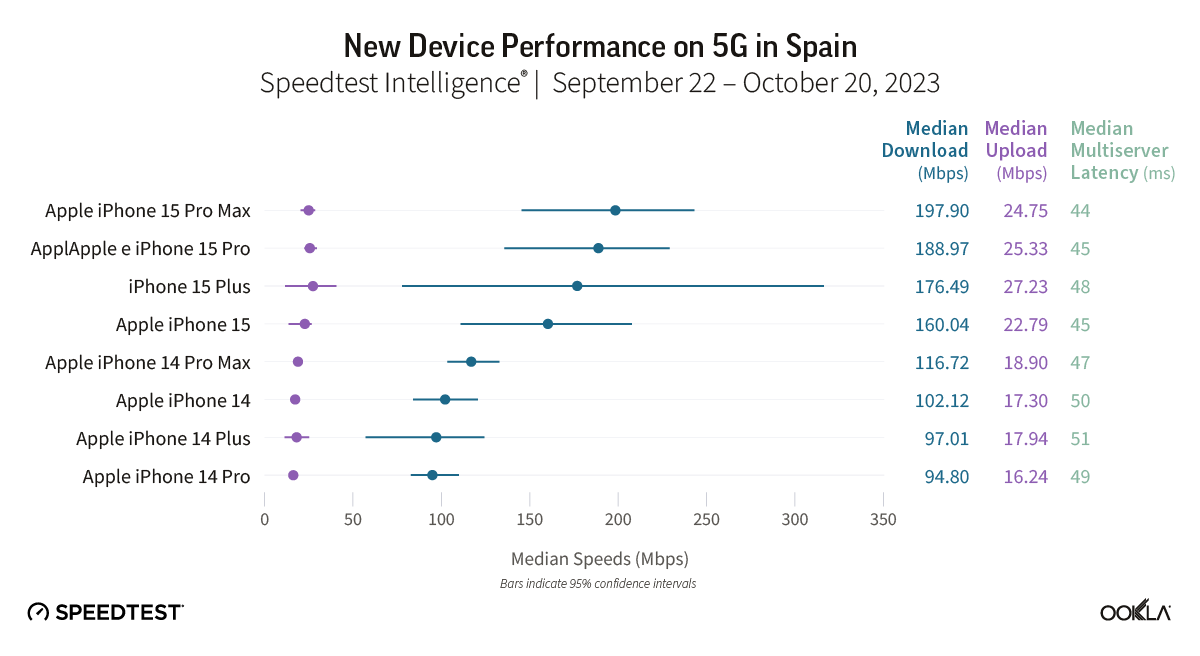
Three iPhone 15 models in Spain showed median 5G download speeds that were significantly faster than their iPhone 14 equivalents during the September 22-October 20, 2023 period, and the improvements in performance were mostly greater than we saw in other countries, with the exception of the United States. Speedtest Intelligence reveals the iPhone 15 Pro had a 40% better download speed than the iPhone 14 Pro, the iPhone 15 Pro Max had a 36% better download speed than the iPhone 14 Pro Max, and the iPhone 15 had an 11% better download speed than the iPhone 14. There were not enough samples to properly assess the performance of the iPhone Plus.

There were not enough samples to evaluate the Galaxy Z Flip or the Galaxy Z Fold during the August 11-October 20, 2023 period in Spain.

Recommendation: Spanish iPhone fans should definitely upgrade their devices while Samsung users can hold off for now.

Unbeatable performance in U.A.E. makes upgrades unnecessary

Chart of New Device Performance on 5G in U.A.E.

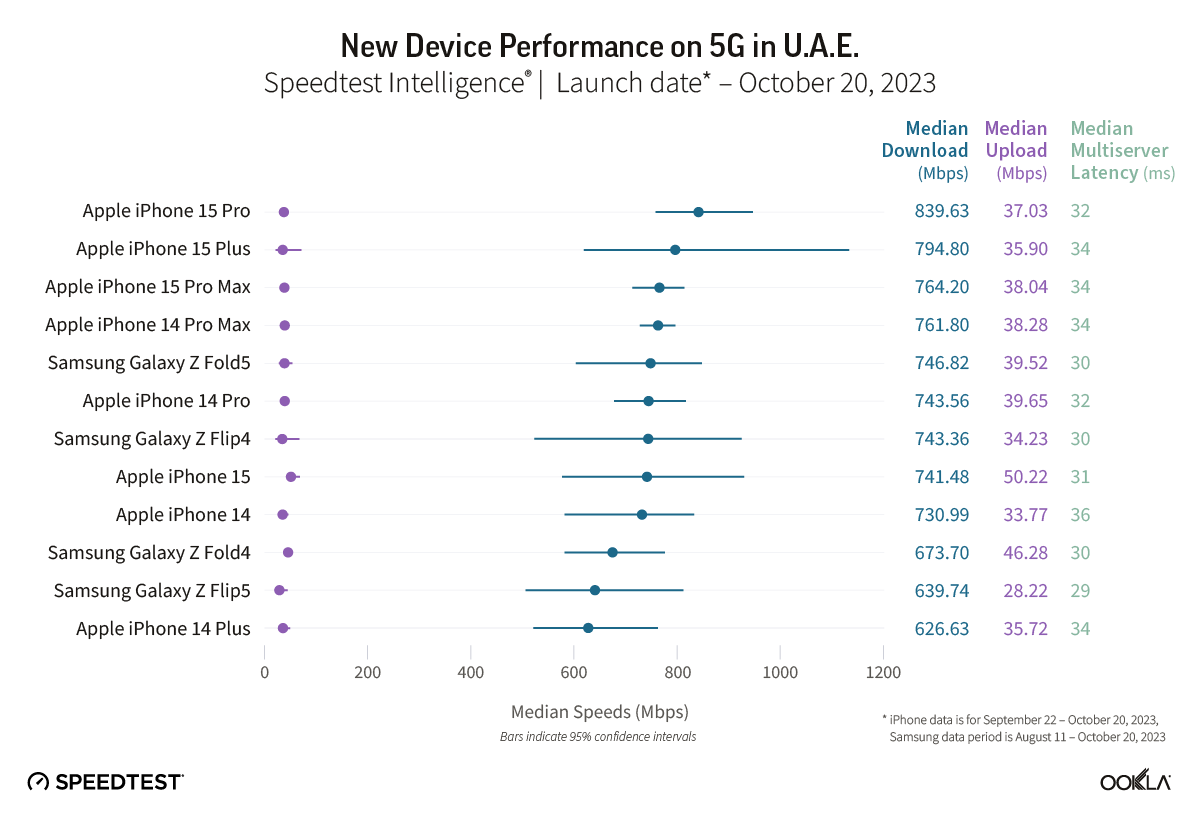
While Speedtest Intelligence data did not show significant increases in median download speed over 5G for the iPhone 15 Pro or the iPhone 15 Pro Max during the September 22-October 20, 2023 period, performance likely isn’t a concern in the United Arab Emirates, whose blisteringly fast download speeds topped the Speedtest Global Index™ in September 2023. There were not enough samples to properly assess the performance of the other two iPhone models.

Similarly, there was no statistical winner for 5G median download speed during the August 11-October 20, 2023 period for the Galaxy Z Fold in the U.A.E., and there were not enough samples to evaluate the Galaxy Z Flip.

Recommendation: Consumers in the U.A.E. should upgrade if they are looking for the new features on the new phone models, but upgrades for performance are unnecessary.

iPhone upgrades are the way to go in the U.K.

Chart of New Device Performance on 5G in the United Kingdom

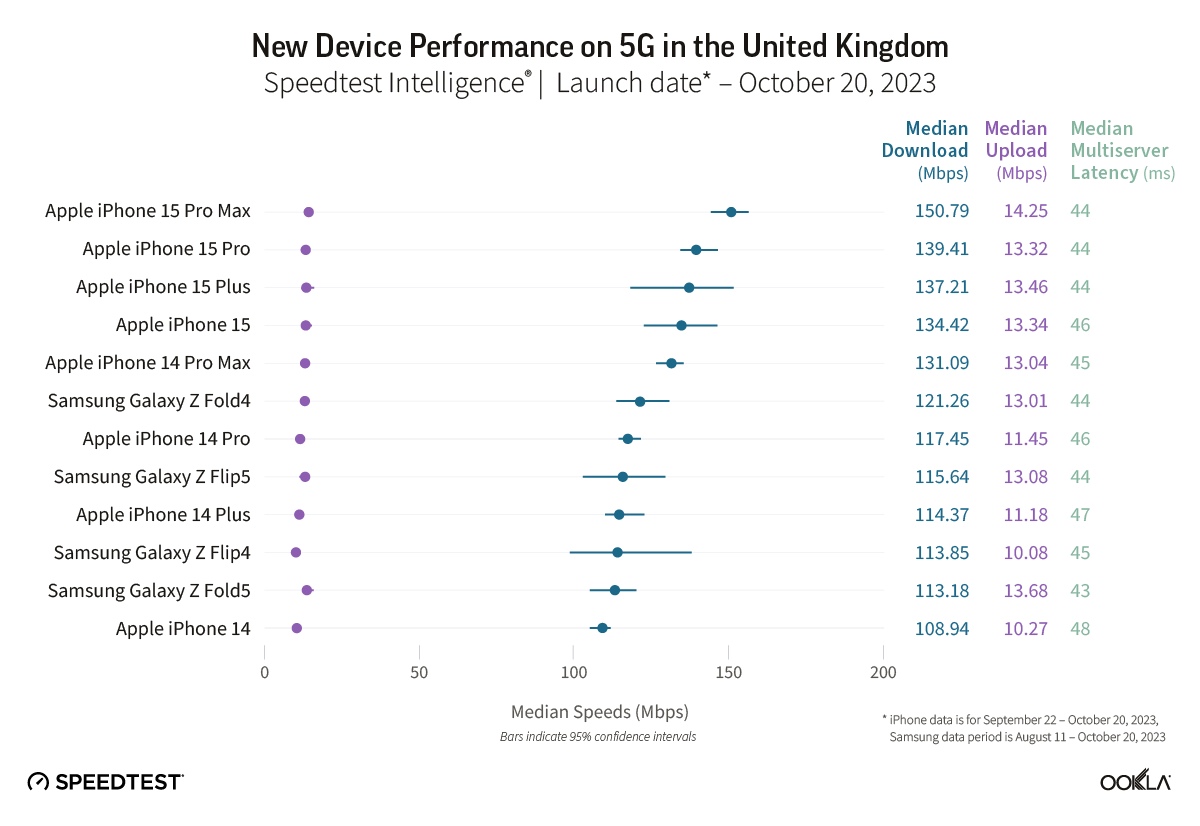
All four iPhone 15 models in the United Kingdom showed median 5G download speeds that were significantly faster than their iPhone 14 equivalents during the September 22-October 20, 2023 period. Speedtest Intelligence reveals the iPhone 15 had a 16% better download speed than the iPhone 14, the iPhone 15 Pro had a 14% better download speed than the iPhone 14 Pro, iPhone 15 Pro Max had a 10% better download speed than the iPhone 14 Pro Max, and iPhone 15 Plus has a 4% better download speed than the iPhone 14 Plus. 

There was no statistical winner for 5G median download speed during the August 11-October 20, 2023 period for the Galaxy Z Flip or the Galaxy Z Fold in the U.K.

Recommendation: iPhone users in the U.K. should see performance improvements that make upgrading to the latest models worthwhile. Samsung Galaxy users only need to upgrade if they are looking for new features.

U.S. consumers see some of the highest improvements when upgrading to new iPhone models

Chart of New Device Performance on 5G in United States

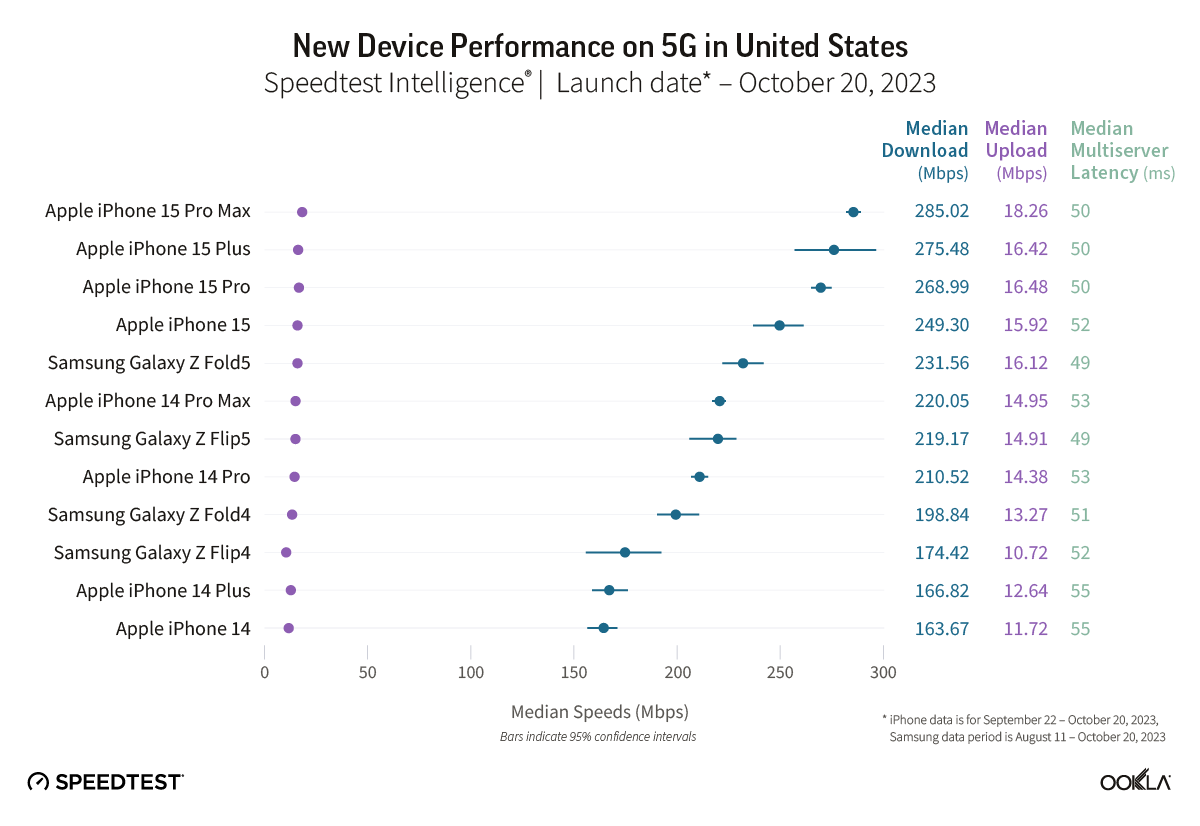
Not only did all four iPhone 15 models in the United States show median 5G download speeds that were significantly faster than their iPhone 14 equivalents during the September 22-October 20, 2023 period, the improvements in performance were greater than we saw in most other countries, with the exception of Spain. Speedtest Intelligence showed the iPhone 15 Plus had a 54% better download speed than the iPhone 14 Plus, the iPhone 15 had a 45% better download speed than the iPhone 14, iPhone 15 Pro Max had a 27% better download speed than the iPhone 14 Pro Max, and iPhone 15 Pro has a 25% better download speed than the iPhone 14 Pro. 

Samsung users also saw increased median download speeds over 5G when using the newer models during the August 11-October 20, 2023 period in the U.S. The Galaxy Z Flip5 had a 15% better download speed than the Galaxy Z Flip4, and the Galaxy Z Fold5 had a 10% better download speed than the Galaxy Z Fold4.

Recommendation: Upgrades for all this holiday season!

No performance boost on iPhone 15 Pro Max in Vietnam

Chart of New Device Performance on 5G in Vietnam

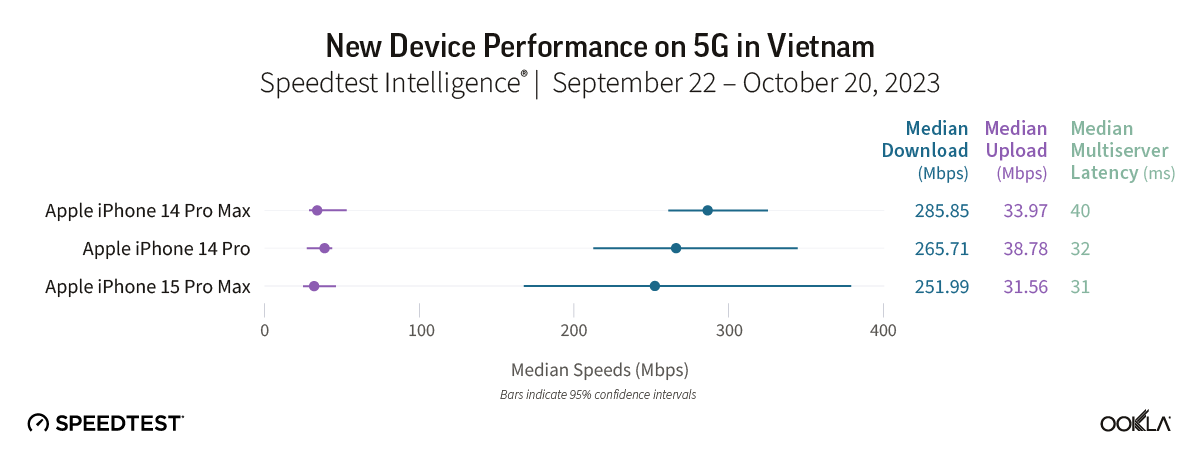
The iPhone 15 Pro Max did not have a statistically better median download speed over 5G than the iPhone 14 Pro Max during the September 22-October 20, 2023 period in Vietnam. There were not enough samples to properly assess the performance of the other three iPhone models. Likewise, there were not enough samples to evaluate the Galaxy Z Flip or the Galaxy Z Fold.

Recommendation: Vietnamese consumers don’t need to upgrade to newer models on performance alone.

Ookla will continue evaluating device performance

We’re excited by the number of countries where mobile device performance increased with the new models and even more excited by the countries where performance is so fast that consumers can look to new modes of connectivity. Even if your country didn’t see the speed boosts you were hoping for, don’t hold back on upgrading if you want to treat yourself or a loved one based on any other number of reasons. Remember to download the iOS or Android Speedtest® app on any new devices to make sure your mobile operator is delivering the speeds you expect.

Ookla retains ownership of this article including all of the intellectual property rights, data, content graphs and analysis. This article may not be quoted, reproduced, distributed or published for any commercial purpose without prior consent. Members of the press and others using the findings in this article for non-commercial purposes are welcome to publicly share and link to report information with attribution to Ookla.

| November 7, 2023

Improvements in Free Airport Wi-Fi: The Holiday Gift You Didn’t Know You Needed

With the holiday travel season on the horizon in the United States, we checked back in on our previous analysis of free airport Wi-Fi at 50 of the busiest airports in the U.S. to see what you can expect when you’re waiting for your flight home to see the family. We found you may have a lot to be thankful for this year. Three more airports have free Wi-Fi download speeds over 100 Mbps than last year. Read on for detailed performance at the specific airports you’ll be flying through.

20 airports have free fixed broadband Wi-Fi at over 100 Mbps

Fixed Broadband Internet Speeds Over Free Wi-Fi at U.S. Airports
Speedtest Intelligence® | Q3 2023
A map showing fixed broadband speeds in selected airports in the United States.

Speedtest Intelligence® shows Norman Y. Mineta San José International Airport, Cincinnati/Northern Kentucky International Airport, and Oakland International Airport, were among the fastest free airport Wi-Fi among the 50 busiest airports in the U.S. with median download speeds of 259.37 Mbps, 210.09 Mbps, and 206.25 Mbps, respectively, during Q3 2023. Daniel K. Inouye International Airport (187.58 Mbps) and Phoenix Sky Harbor International Airport (178.32 Mbps) rounded out the top five. San Francisco International Airport (155.99 Mbps) slipped down the list compared to last year. 100 Mbps is more than fast enough to stream video and keep the whole family entertained for as long as your devices hold a charge.

On the other end of performance, six airports (William P. Hobby Airport, Raleigh-Durham International Airport, Philadelphia International Airport on SSID Free PHL Airport WiFi-24, George Bush Intercontinental Airport, and Logan International Airport) showed median download speeds over Wi-Fi of less than 25 Mbps, the threshold set by the FCC to qualify as broadband. Learn more about how much speed you need for specific activities here.

There was one change to our airport list this year, which is based on passenger volume: John Glenn Columbus International Airport was removed from the list and Kahului Airport added. We have not included Kansas City International Airport or San Diego International Airport because there were insufficient samples.

Fort Lauderdale-Hollywood International Airport splits their free airport Wi-Fi among four separate SSIDs for different terminals, which we have listed separately in these results. The performance does not vary widely enough between them to hang out in the wrong terminal, but if you’re in Philadelphia you definitely want to choose “Free PHL Airport WiFi” when possible, rather than “Free PHL Airport WiFi-24”.

Mobile performance at 24 airports beats 100 Mbps

Mobile Broadband Internet Speeds Over Free Wi-Fi at U.S. Airports
Speedtest Intelligence® | Q3 2023
A map showing mobile broadband speeds in selected airports in the United States.

Speedtest Intelligence® shows John Wayne Airport, Midway International Airport, St. Louis Lambert International Airport, Salt Lake City International Airport, and Sacramento International Airport were among the airports with the fastest mobile download speeds on our list in the U.S. with median download speeds of 369.29 Mbps, 283.56 Mbps, 281.74 Mbps, 277.65 Mbps, and 275.87 Mbps, respectively, during Q3 2023.

Three airports (Washington Dulles International Airport, Orlando International Airport, and William P. Hobby Airport) showed median download speeds over mobile of less than 25 Mbps.

Wi-Fi or mobile? The airports where it makes a difference

Wi-Fi is the correct choice at 12 airports where download speed over mobile network service is significantly slower than the free airport Wi-Fi. Free airport Wi-Fi is 291% faster than mobile service at Orlando International Airport, 225% at Dallas/Fort Worth International Airport, 193% at Washington Dulles International Airport, and 110% at Hartsfield–Jackson Atlanta International Airport. Wi-Fi at Cincinnati/Northern Kentucky International Airport was 91% faster than mobile, 87% at San Francisco International Airport, 79% at Norman Y. Mineta San José International Airport, 72% at Seattle–Tacoma International Airport, 62% at John F. Kennedy International Airport, 47% at Harry Reid International Airport, 46% at Fort Lauderdale–Hollywood International Airport, and 42% at Baltimore/Washington International Airport.

Twenty-one airports had faster download speeds over mobile than over free airport Wi-Fi during Q2 2023. Mobile service at Logan International Airport was a whopping 1,037% faster than airport Wi-Fi. At Tampa International Airport, mobile was 851% faster than Wi-Fi, and mobile was 341% faster than airport Wi-Fi at Raleigh-Durham International Airport.

Mobile service was 3X faster than airport Wi-Fi at Salt Lake City International Airport, Philadelphia International Airport, Indianapolis International Airport, Southwest Florida International Airport, and John Wayne Airport. Mobile was 2X faster than airport Wi-Fi at Cleveland Hopkins International Airport, Sacramento International Airport, Midway International Airport, George Bush Intercontinental Airport, Portland International Airport, Minneapolis–Saint Paul International Airport, and Detroit Metropolitan Airport. And mobile service was 1X faster than airport Wi-Fi at Charlotte Douglas International Airport, Kahului Airport, Los Angeles International Airport, Denver International Airport, LaGuardia Airport and Louis Armstrong New Orleans International Airport.

We know from our work with Ekahau® that optimizing Wi-Fi at airports is particularly challenging. There can be up to 900 people waiting at each boarding gate, especially during busy travel periods. Airport IT teams have to decide how many Wi-Fi access points to put in each location and how to balance the load across all those access points. Not to mention that mobile hotspots can interfere with all this careful planning. All of this to say that the averages we report here are based on real-world data, but your experience may differ, especially on a busy travel day.

Based on this data, we predict your airport Wi-Fi experience this year will be a big improvement over last year. You can always do your part by downloading at least a few of your entertainment options before you leave the house. While you’re downloading, don’t forget the Speedtest apps for Android and iOS. Help out travelers next year by taking a Speedtest at the airport to share your experience.

Ookla retains ownership of this article including all of the intellectual property rights, data, content graphs and analysis. This article may not be quoted, reproduced, distributed or published for any commercial purpose without prior consent. Members of the press and others using the findings in this article for non-commercial purposes are welcome to publicly share and link to report information with attribution to Ookla.

| September 5, 2023

College Towns Where Mobile Gaming Makes the Grade (And Where it Fails)

August means back to school in the northern hemisphere and students across the United States are settling into carefully chosen schools, ready to embark on new adventures. While they may have chosen those schools based on academics, athletics, and even location, there may be a hidden benefit for some students: great mobile gaming. We analyzed Speedtest Intelligence® from 100 college towns across the U.S. with a large percentage of students where college is a major part of the industry to look for the kind of mobile performance that lends itself to a strong mobile gaming experience. We also took a sidebar look at 10 schools that are known for their varsity esports programs to see how they stack up.

Introducing Game Score

We know what online gamers care most about: low “ping” in competitive games, voice chat quality and stability, quickly downloading new games and patches, live streaming, and cloud gaming. We developed Game Score to provide insight into the metrics that matter most to that game experience: download speed, upload speed, and latency and jitter measurements taken to real-world game servers. Game Score includes calculations on median performance as well as 10th and 90th percentile performance to provide a trustworthy assessment of expected network performance.

College towns with the best (and worst) mobile gaming experience

Speedtest Intelligence data from Q2 2023 reveals that three states: Maryland, Michigan, and California contain most of the top 10 college towns from our list for mobile Game Score on all cellular technologies for all providers combined.

Mobile Game Score in Select U.S. College Towns
Speedtest Intelligence® | Q2 2023
A map of the United States with map markers over select college towns. Hovering over a map marker reveals the name of the town and its Mobile Game Score.

Top college towns for mobile gaming

Students living in College Park, Maryland; Annapolis, Maryland; East Lansing, Michigan; Berkeley, California; and Ann Arbor, Michigan can expect top mobile gaming performance, though all the towns on this list do very well. Dover represented for Delaware, State College for Pennsylvania, and Providence for Rhode Island. Madison, New Jersey very narrowly missed out on the top 10. Click the map above for performance information in each town.

These would all be good towns to try your skill at MOBAs like League of Legends, real-time strategy games like StarCraft II, or Battle Royales like Call of Duty: Warzone or Fall Guys where the game mechanics typically rely on real-time communication or reaction. Who knows, your new virtual friends and rivals could be the start of your new IRL community.

College towns where mobile game performance lags

The 10 college towns with the lowest game scores based on Speedtest® data from Q2 2023 are more geographically distributed than the top 10. Socorro, New Mexico had the lowest Game Score on this list, followed by Anchorage, Alaska; Bozeman, Montana; Starkville, Mississippi; and Hanover, New Hampshire. Missoula, Montana; Fayetteville, Arkansas, Bowling Green, Kentucky; Middlebury, Vermont; and College Station, Texas rounded out the bottom 10. These college towns might be better suited for games where players try to best themselves, like practicing math with Sudoku or brushing up on adulting with a game like Florence.

Mobile gaming in places with top varsity esports programs

We took a close look at mobile Game Score in Q2 2023 for 10 locations that are home to colleges with some of the top varsity esports programs.

Mobile Game Score in Select Varsity Esports Locations
Speedtest Intelligence® | Q2 2023
A map of the United States with map markers over select college towns. Hovering over a map marker reveals the name of the town and its Mobile Game Score.

Berkeley, California, home to UC Berkeley, had the highest Game Score on this list. It was also the only location that made both the “college towns” and “varsity esports” lists, with most of these places primarily known for more than their universities. Irvine, California, second on this list, is home to UC Irvine. Dallas, Texas, home of UT Dallas, may have room to complain to the administration about their mobile performance as they had the lowest Game Score on this list. Akron, Ohio (University of Akron); St. Louis, Missouri (Maryville University); and Oxford, Ohio (Miami University) followed closely.

Most notable for the competitive nature of esports is the range of performance here, with nine of these varsity esports university towns showing mobile game scores that would not qualify them for the top 10 in the U.S. overall.

We’re excited for your feedback on mobile gaming where you’re at, so please take a Speedtest on Android or iOS then send your thoughts and results to us via Twitter or Facebook. We’re also interested in your suggestions for what locations to cover next year. You can also check month-by-month performance for your town and compare expected speeds for internet providers in the Speedtest Performance Directory, and if you’re struggling to connect to an online game at all, check out Downdetector® for details on service outages.

If you’re a network operator interested in Game Score performance on your network, contact us.

Ookla retains ownership of this article including all of the intellectual property rights, data, content graphs and analysis. This article may not be quoted, reproduced, distributed or published for any commercial purpose without prior consent. Members of the press and others using the findings in this article for non-commercial purposes are welcome to publicly share and link to report information with attribution to Ookla.

| August 1, 2023

European Vacation: Your Guide to Roam Like at Home Performance this Summer

Summer is here and with it the August vacation season that most of Europe has been waiting for. We’re here with fresh data from Speedtest Intelligence® to help you know in advance if your phone will be a help or a hindrance on your travels. We’ve examined results from Android devices in the European Union (EU) and the United Kingdom (U.K.) during Q2 2023 and included data on 5G performance to see if “Roam Like at Home” is living up to its promise.

5G boosts European roaming speeds but latency varies 

Speed and latency are two important indicators of online performance. Speed will have a greater effect on streaming content while latency will affect gaming and video chatting. Both come into play while browsing online maps for that hot new gelato place your friends told you about. 

While the EU extended “Roam Like at Home” regulations until 2032, our previous analyses demonstrated that mobile speeds are usually slower when roaming than when exploring your home country. The actual speeds vary dramatically based on roaming agreements between mobile operators, something you can’t really control unless you’re prepared to do the research then shop for a whole new plan before your trip. What you can control is whether you spring for 5G before your big trip. The data below represents the local speeds and multi-server latency for each country as well as those experienced by residents of the named country while roaming in the EU or the U.K. during Q2 2023.

Roaming speeds can’t live up to local performance

Median Mobile Roaming Performance in Europe
Speedtest Intelligence | Q2 2023
Country Local Download (Mbps) Roaming Download (Mbps) Local 5G Download (Mbps) Roaming 5G Download (Mbps)
Austria 59.28 42.77 161.00 80.51
Belgium 48.00 59.86 157.23 124.64
Bulgaria 78.27 48.97 252.75 93.24
Croatia 73.65 47.86 184.29 124.38
Cyprus 56.93 40.83 197.22 64.24
Czechia 46.50 31.96 104.36 72.26
Denmark 118.48 51.74 206.95 115.82
Estonia 64.99 77.51 * *
Finland 78.00 53.43 217.13 106.54
France 61.64 43.46 187.42 95.56
Germany 46.30 39.54 114.07 84.27
Greece 57.41 66.17 143.26 153.28
Hungary 40.44 48.28 85.12 132.98
Ireland 34.49 36.10 98.70 85.38
Italy 36.97 37.68 130.85 99.38
Latvia 59.73 65.13 220.51 146.15
Lithuania 64.70 53.04 * *
Luxembourg 74.86 46.88 * *
Malta 44.56 48.11 109.97 110.80
Netherlands 96.77 37.61 128.04 87.84
Poland 42.14 34.23 78.82 99.51
Portugal 57.86 39.91 212.95 79.88
Romania 43.34 59.59 153.35 99.84
Slovakia 43.16 41.53 139.53 85.16
Slovenia 52.73 49.86 145.83 95.50
Spain 32.33 35.77 85.75 116.48
Sweden 84.00 51.24 160.93 129.43
United Kingdom 40.74 48.06 108.74 98.92

Although EU residents can roam call, text, and surf without additional charges, a drop in speed is an issue while roaming according to Q2 2023 data. Residents from 17 countries showed faster local download speeds than roaming speeds when considering results over all technologies during Q2 2023. The 11 exceptions were Romania (which was much faster roaming), Belgium, Hungary, Estonia, the U.K, Greece, and Spain, which all showed faster roaming speeds, and Latvia, Malta, Ireland, and Italy which showed only slightly improved speeds.  

While roaming speeds varied widely based on country of origin, every country on this list saw much higher median download speeds when roaming on 5G than roaming on all technologies. Despite this uplift, 20 countries showed faster local 5G download speeds than roaming 5G speeds during Q2 2023. The exceptions were Hungary, Spain, and Poland, which all saw faster 5G roaming than locally, while Greece had marginally better 5G roaming than at home, and people from Malta didn’t really see any major difference. Estonia, Lithuania, and Luxembourg did not have enough 5G samples to qualify for analysis.

Latency suffers awfully when roaming

Median Mobile Roaming Latency in Europe
Speedtest Intelligence | Q2 2023
Country Local Multi-server Latency (ms) Roaming Multi-server Latency (ms) Local 5G Multi-server Latency (ms) 5G Multi-server Latency (ms)
Austria 32.19 91.24 30.96 111.08
Belgium 36.51 84.96 31.89 67.61
Bulgaria 31.72 125.60 26.41 124.63
Croatia 39.03 85.25 35.96 80.37
Cyprus 27.90 200.18 23.52 184.68
Czechia 34.72 80.18 30.77 78.72
Denmark 29.47 94.77 28.08 81.85
Estonia 33.10 87.00 * *
Finland 33.67 102.84 32.16 99.14
France 46.97 92.61 44.39 87.49
Germany 41.78 87.19 39.07 77.57
Greece 38.16 137.29 34.63 132.91
Hungary 36.27 85.39 35.06 77.26
Ireland 36.21 116.62 31.70 118.47
Italy 50.87 100.20 49.96 93.87
Latvia 29.88 101.91 26.28 94.70
Lithuania 34.03 107.79 * *
Luxembourg 33.45 67.70 * *
Malta 47.44 146.57 38.69 135.43
Netherlands 33.24 83.25 31.17 79.81
Poland 42.41 108.69 40.25 100.36
Portugal 35.98 123.05 31.62 126.54
Romania 40.65 122.91 34.22 121.21
Slovakia 30.47 80.28 26.39 70.96
Slovenia 30.61 76.68 27.70 75.27
Spain 51.53 112.81 47.11 102.94
Sweden 37.52 114.69 32.97 99.48
United Kingdom 50.45 111.01 46.04 107.59

Residents of every country surveyed had a much higher multi-server latency when roaming during Q2 2023. This is because roaming signals are routed through a user’s home network, making latency a significant issue for Europeans when traveling. The difference was smallest in Italy and France where locals had about a 97% higher latency when roaming compared to at home. On the other end of the scale, residents of Cyprus saw over a 615% higher latency while roaming compared to at home. A high latency means a long response time for any request you send over the internet, perhaps adding more frustration to your vacation than you would want.

The results were similar over 5G with Italy showing the smallest difference between latency while roaming and at home (about 88% greater) and Cyprus having the largest difference (about 685%). Surprisingly, 5G did not reliably improve multi-server latency. 

What this data tells you is that it’s worth upgrading to 5G before a trip if speed is your main concern. Whether 5G will help you with your latency will depend heavily on which country you are traveling from. Regardless, you should expect a high latency while roaming. Plan ahead accordingly.

Outbound roaming speeds vary dramatically

As discussed above, roaming speeds depend heavily on where you are traveling from, where you are traveling to, and what agreements your home mobile operator has with operators in the country you’re visiting. That said, it’s fun to look at what’s possible, so we looked at the very best and very worst roaming speeds in Europe during Q2 2023.

Fastest roaming speeds in Europe

Customers from Italy roaming in Portugal saw one of the fastest median roaming download speeds over 5G in all of Europe during Q2 2023 at 317.94 Mbps. Estonians roaming in Finland saw a 278.69 Mbps median 5G download speed, and Finns in Sweden experienced a median 5G download of 252.57 Mbps. 

Looking at the highest results from all technologies combined, Latvians roaming in Finland experienced a median download speed of 137.49 Mbps, while Greeks saw median download speeds of 129.75 while roaming in Bulgaria and 125.83 Mbps while roaming in Austria.

Slowest roaming speeds in Europe

On the other end of the scale, Slovakian visitors to Poland had one of the slowest median download speeds over all technology while roaming during the same time period at 10.82 Mbps. Polish roamers saw a median download speed of 13.27 Mbps in the U.K. and 14.78 Mbps in Romania. Ten of the 20 slowest roaming speeds on our country-by-country list for all technologies were for Europeans roaming in the U.K. This means that travelers going to the U.K are not only seeing poorer performance, they could also be paying more for the privilege as they do not benefit from “Roam Like at Home” regulations.

Germans in Italy had the slowest median 5G download speed on our list during Q2 2023 at 33.64 Mbps. Austrians in the U.K. saw a median download speed over 5G of 41.57 Mbps, and Portuguese roamers in Spain experienced a median download speed over 5G of 44.18 Mbps.

Whether you choose to roam, pick up a local SIM or eSIM, or simply spend less time online, we hope this information helps you make the most of your vacation. If you have an extra minute between activities, take a Speedtest® to see how your performance compares. 

Ookla retains ownership of this article including all of the intellectual property rights, data, content graphs and analysis. This article may not be quoted, reproduced, distributed or published for any commercial purpose without prior consent. Members of the press and others using the findings in this article for non-commercial purposes are welcome to publicly share and link to report information with attribution to Ookla.

| May 23, 2023

U.S. Airports Have Fastest Free Airport Wi-Fi, Chinese Airports Have Faster Mobile

The summer travel season is about to officially begin across the northern hemisphere and we’re back with fresh data for our series on airport Wi-Fi performance. This year we examined mobile Wi-Fi on free Wi-Fi provided by the individual airports as well as mobile speeds at some of the busiest airports in the world during Q1 2023. While airports in the United States top the list of fastest free airport Wi-Fi, the fastest mobile speeds we saw were in China. Read on for a specific look at internet performance including: download speed, upload speed, and latency.

U.S. airports have fastest airport Wi-Fi

Speedtest Intelligence® showed two U.S. airports at the top of the list for free airport Wi-Fi with Fort Lauderdale’s Hollywood International Airport Terminal 3 and San Francisco International Airport showing median download speeds of 157.60 Mbps and 156.66 Mbps, respectively, during Q1 2023. This represented a small drop for SFO since our November analysis but an increase for FLL. Dallas/Fort Worth International Airport (143.42 Mbps), John F. Kennedy International Airport (136.06 Mbps), and Seattle–Tacoma International Airport (136.02 Mbps) rounded out the top five with three additional SSIDs from FLL following closely behind with median download speeds from 122.07 Mbps to 134.62 Mbps.

Chart of Mobile Internet Performance Over Free Wi-Fi at Select Airports

As we’ve seen in most recent analyses, the airports with the fastest Wi-Fi are international hubs that passengers from around the world pass through on their way to all kinds of destinations. If you are connecting through any of these airports, you should have no trouble with internet speeds this fast. In case of video calls, upload speeds are even faster than downloads at almost all of these airports, and SFO had the fastest uploads on the list.

Hartsfield–Jackson Atlanta International Airport and SEA had the lowest median multi-server latency on Wi-Fi of any of the airports surveyed during Q1 2023. This means your device should see very little delay when relaying information across the web.

Shanghai tops Wi-Fi performance at global airports

Shanghai Pudong International Airport was the fastest non-U.S. airport on our list with a fastest median download speed of 118.67 Mbps. Charles de Gaulle Airport in Paris (98.82 Mbps), Amsterdam Airport Schiphol (82.83 Mbps), Dubai International Airport (67.21 Mbps), and Frankfurt Airport (59.10 Mbps) followed for median download speeds at non-U.S. airports. All of these airports have internet speeds that qualify as at least good, which means you should be okay unless you want to try multi-player gaming (which is probably not your first choice on an airport layover anyway). Both Mexican airports on our list showed speeds in the slow range, so log off early and enjoy your vacation if you’re at the airport in Cancún or Mexico City.

Chinese airports have fastest mobile speeds

Get ready to connect to local mobile service or tether your phone to your laptop if you’re traveling through airports in Shanghai and Beijing and have access to 5G. Not only did Shanghai Pudong International Airport, Beijing Capital International Airport, and Beijing Daxing International Airport have the fastest median downloads over mobile on our list at 308.51 Mbps, 304.87 Mbps, and 300.70 Mbps, respectively, during Q1 2023 — the mobile speeds at these airports were dramatically faster than the airport Wi-Fi. Salt Lake City International Airport (282.21 Mbps) and Hangzhou Xiaoshan International Airport (259.86 Mbps) rounded out the top five.

Chart of Mobile Network Performance at Select Airports

While latency on mobile was generally higher than that on Wi-Fi, these same three Chinese airports (PEK, PKX, and PVG) also showed the lowest median multi-server latency on mobile during Q1 2023, indicating that your internet experience at these airports will have the least lag. Airports outside the U.S. performed better for latency overall with the top 16 airports for latency all located outside North America. CUN had the highest latency on mobile.

We were able to include more airports in the mobile analysis because there were more mobile samples to analyze at those airports than there were samples over Wi-Fi.

Airport Wi-Fi or mobile? Connecting on your next trip

Save yourself time by using this checklist to decide whether to try out the Wi-Fi or simply use the local mobile network. We compared internet performance on free airport Wi-Fi with median download speeds over mobile for the 38 airports we have both Wi-Fi and mobile data for during Q1 2023. Twenty-one airports had faster mobile internet than airport Wi-Fi. Twelve airports had faster Wi-Fi than mobile, and four airports showed only a slight distinction between Wi-Fi and mobile so we gave both the green check marks.

Chart Comparing Airport Wi-Fi and Mobile Speeds at Select Airports

Airport Wi-Fi has come a long way since we started this series in 2017. We hope your connections are smooth and if you’re traveling this summer, take a Speedtest® at the airport to see how your experience compares.

Ookla retains ownership of this article including all of the intellectual property rights, data, content graphs and analysis. This article may not be quoted, reproduced, distributed or published for any commercial purpose without prior consent. Members of the press and others using the findings in this article for non-commercial purposes are welcome to publicly share and link to report information with attribution to Ookla.