| July 18, 2024

Why Customer-Centric Companies Turn to Crowdsourced Service Disruption Management

The reliability of online services has become more important than ever as service providers face the constant challenge of maintaining a seamless user experience across an expanding array of websites, applications, and cloud-based platforms. 

All it takes is a little bit of downtime for sites like YouTube or Facebook to turn into national headlines. For end users, the source of the issue is irrelevant; if the video isn’t playing on Facebook, it’s a Facebook issue. For businesses, internal tracking systems may not trigger if a downstream service like a contracted Content Delivery Network (CDN) experiences a service disruption. Scenarios like those mean that user-reported issues become the key to identifying the correlation and restoring connectivity.

Service Disruption Management (SDM) has emerged as a crucial tool for addressing these challenges, and Ookla is at the forefront of this approach with its two Crowdsourced Service Disruption Management (CSDM) solutions: Downdetector Explorer™ and Downdetector Connect™.

In this article, we’ll take a closer look at how these solutions work together to help service providers quickly identify and manage service disruptions, enhance customer experiences, reduce operational costs, and lower churn. 

For a deeper look into how service disruption management solutions have benefitted providers, check out our detailed white paper, How to Increase Customer Lifetime Value with Crowdsourced Service Disruption Management Solutions

What is Service Disruption Management or SDM?

Service disruption management (SDM) is a solution that enables service providers to identify, diagnose, resolve, and communicate service outages and other issues quickly and efficiently. In this context, the term “service provider” refers to a broad range of organizations, including ISPs, mobile carriers, telecommunications companies, and digital service providers like Netflix, Reddit, and scores of others. Traditionally, SDM has been implemented through various internal tracking tools and systems, such as network monitoring and fault management solutions. 

However, these internal systems can be enhanced by integrating them with crowdsourced service disruption management (CSDM) solutions, such as Downdetector Explorer and Downdetector Connect. CSDM tools leverage the collective intelligence and feedback of millions of users to help service providers prioritize issues that matter most to their customers. 

By integrating CSDM with existing network management systems, service providers can gain a more comprehensive view of their performance and take swift action to mitigate the impact of service disruptions on end users. 

Ookla’s solutions: leading the Crowdsourced SDM charge

Ookla has taken SDM to the next level with Downdetector Explorer and Downdetector Connect. These innovative platforms work together to provide service providers with a comprehensive approach to managing service disruptions.

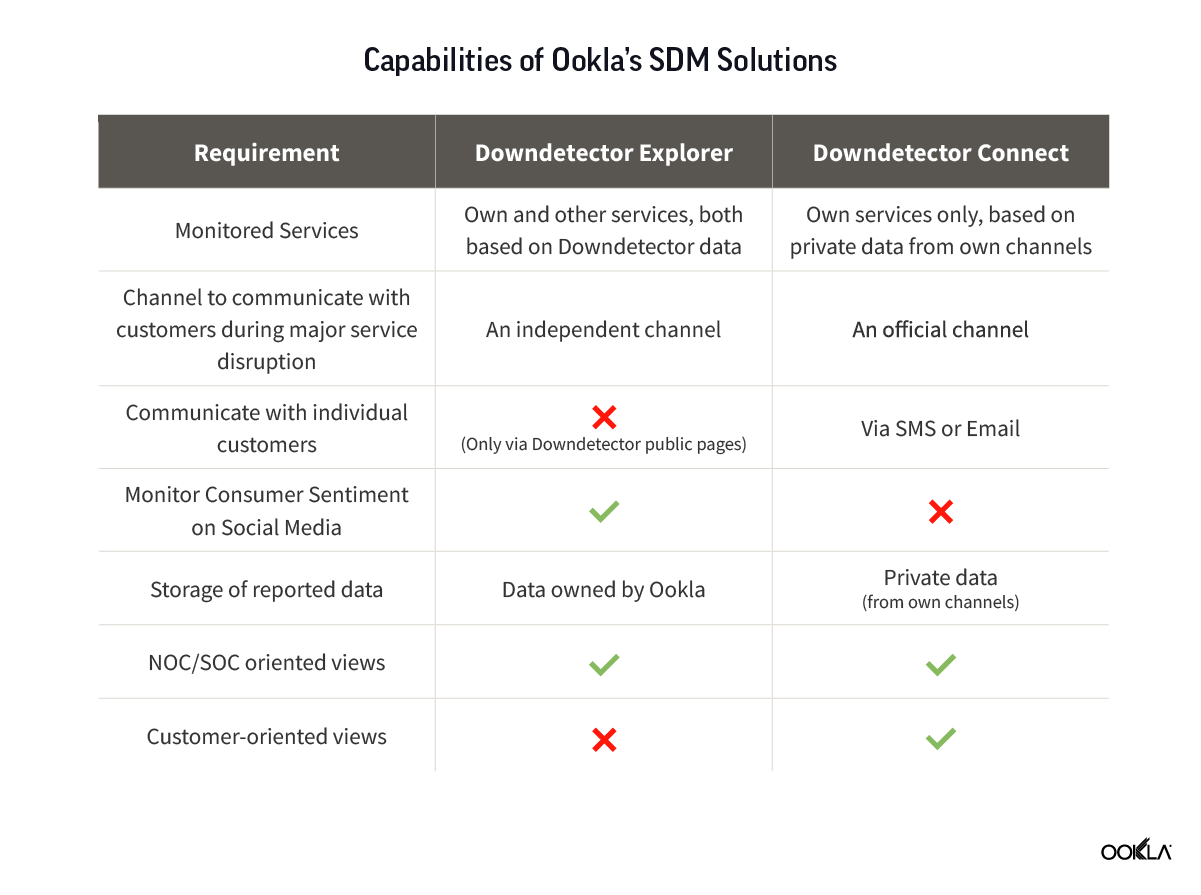
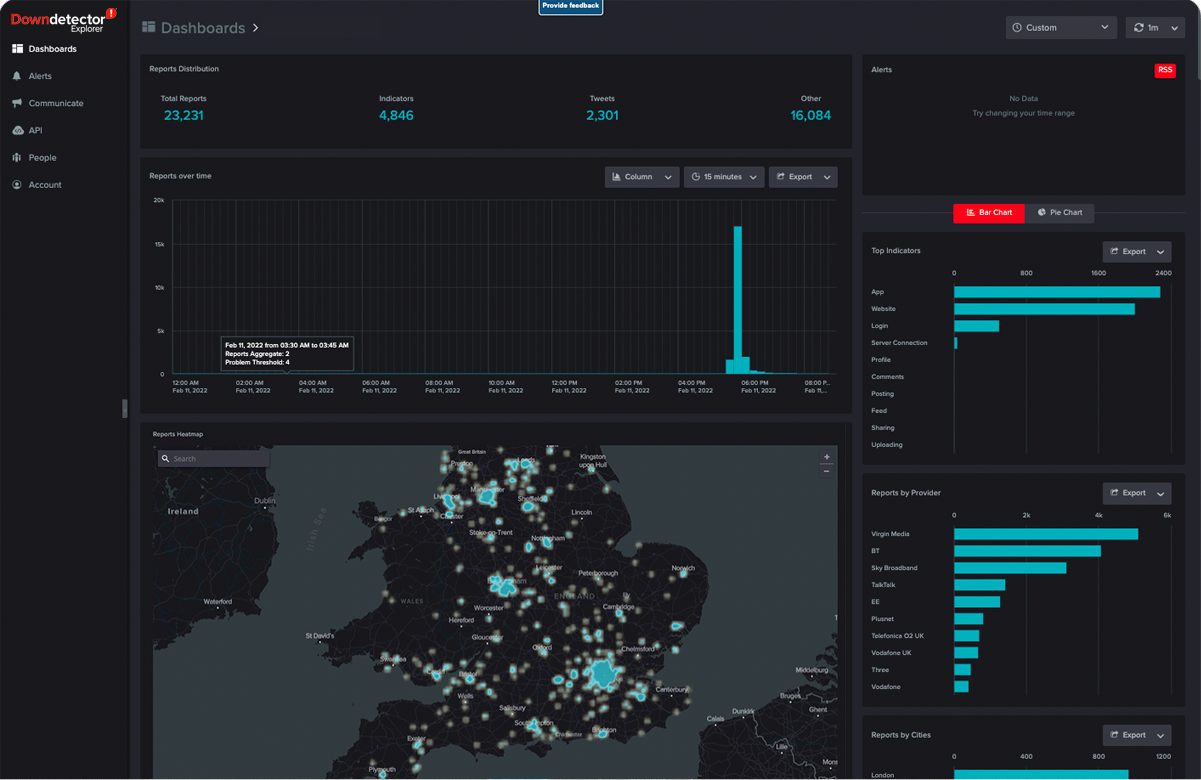
Downdetector Explorer leverages the power of crowdsourced data on Downdetector.com to identify outages and disruptions in real-time for various online services, such as websites, apps, and cloud services. It harnesses the collective input of millions of users worldwide to provide real-time status and outage information for thousands of services, giving service providers valuable insights to resolve issues quickly and efficiently.

A key feature of Downdetector Explorer is its ability to monitor outages for third-party services that an ISP or mobile carrier doesn’t own, such as CDN providers like Akamai or various OTT services. This unique capability allows service providers to better understand the cause of an outage, even if it’s not directly related to their own infrastructure.

Downdetector Connect complements Downdetector Explorer by providing a custom-branded and official service disruption detection platform that incorporates digital customer engagement channels, advanced analytics to direct engineering efforts where needed, and customer messaging capabilities for personalized communication. It also incorporates a mobile SDK that collects connectivity information to provide insights into the customer’s experience.

Together, these solutions help service providers understand disruptions to vital services by using unbiased, transparent user reports and problem indicators from around the web. The Downdetector platform tracks over 14,000 services around the globe, from your favorite social media and gaming websites, to banks and internet service providers and more. It receives more than 25 million monthly reports from users, real-time analysis, and verification of outage reports, empowering network operations centers and customer care teams when an issue happens.

Chart of Capabilities of Ookla's SDM Solutions

Ookla’s CSDM solutions in action: real-world success stories

The effectiveness of Ookla’s CSDM solutions has been demonstrated through their successful implementation by several tier-1 operators worldwide. These operators have integrated Downdetector Explorer and Downdetector Connect into their network management strategies, achieving significant improvements in key performance indicators (KPIs) and customer satisfaction.

For example, an operator from the Asia Pacific region leveraged Ookla’s CSDM solutions to offer a highly personalized customer experience and reduce the costs of credits for issues unrelated to service disruptions. The platform delivered the following benefits:

  • Achieved a 65% resolution rate for service issues
  • Reduced service-related contacts by 17%
  • Decreased credits for non-service-related issues by 51%
  • Improved its Net Promoter Score (NPS) — a key performance indicator of customer experience — from -13 to +34.8, indicating a substantial boost in customer loyalty

Another operator, this one in Western Europe, increased its transparency and digital engagement while improving its customer acquisition process. By using Ookla’s tools, the operator achieved:

  • A 400x increase in digital engagement
  • A 40% reduction in support calls
  • An 80% decrease in support calls during major outages
  • One of the highest NPS scores in their market, showcasing the platform’s impact on customer satisfaction

Service providers can now proactively identify and resolve network issues, leading to improved customer experiences, increased loyalty, and reduced operational costs. As more and more providers adopt and integrate crowdsourced SDM tools into their service management strategies, we expect to see similar success stories and industry-wide improvements going forward. 

Downdetector Explorer screenshot

The Future of CSDM 

As the complexity of online services and the demand for their reliability continue to grow, the importance of crowdsourced service disruption management will only continue to increase. The emergence of new technologies and new use cases will further drive the need for advanced CSDM solutions that can quickly identify and resolve service disruptions and keep customers happy.

One area of huge potential in the CSDM space is the integration of artificial intelligence (AI) and machine learning (ML) technologies into CSDM solutions. These technologies have the potential to enhance the accuracy and efficiency of service disruption detection and resolution, allowing service providers to stay ahead of the curve in ensuring the reliability of online services and maintaining customer satisfaction. 

AI- and ML-powered CSDM solutions can analyze vast amounts of data from multiple sources in real-time, identifying patterns and anomalies that may indicate potential service disruptions. Integrating AI and ML into CSDM solutions would allow providers to proactively identify and address potential problems before they occur, significantly improving outage resolution times and enabling the prediction of future disruptions based on historical data.

Conclusion 

The reliability of online services is paramount in our increasingly digital world, and crowdsourced service disruption management has emerged as a game-changer for online service providers. CSDM solutions leverage the power of crowdsourced data, enabling providers to quickly identify service disruptions and respond more effectively. This protects them from potential reputational damage and financial losses.

As CSDM continues to advance, service providers that adopt these crowdsourced solutions will be better equipped to reduce downtime and provide excellent customer experiences. With improved issue detection and more rapid responses to disruptions, service providers will also be able to foster long-lasting customer relationships and maintain a competitive edge in an increasingly demanding market.

Image of Ookla White paper | How to Increase Customer Lifetime Value with Crowdsourced Service Disruption Management Solutions

To learn more about how CSDM solutions like Downdetector Explorer and Downdetector Connect can transform your service disruption management strategy, reach out to our team. 

And for a more in-depth exploration of how SDM can help service providers maximize Customer Lifetime Value (CLV) and support the different stages of Customer Lifecycle Management (CLM), read our comprehensive white paper, How to Increase Customer Lifetime Value with Crowdsourced Service Disruption Management Solutions

Ookla retains ownership of this article including all of the intellectual property rights, data, content graphs and analysis. This article may not be quoted, reproduced, distributed or published for any commercial purpose without prior consent. Members of the press and others using the findings in this article for non-commercial purposes are welcome to publicly share and link to report information with attribution to Ookla.

| March 19, 2024

Broadband Consumer Labels are Coming Soon, and Ookla’s Data Can Help ISPs Prepare

The internet has become a fundamental tool of daily life, serving as a key resource for consumers and businesses alike. As our reliance on connectivity continues to grow, it’s become critical for all internet users to have access to accurate and transparent information about their internet service providers (ISPs). This need for transparency has prompted the FCC to introduce its Broadband Consumer Label initiative, which will educate consumers with standardized, easy-to-understand information about the broadband services that ISPs across the United States are offering. 

Broadband Consumer Labels are similar in appearance to the nutrition labels affixed to nearly every product at the grocery store, with both types of labels providing consumers with key information–and transparency–about the products they’re buying. ISPs will soon be required to display their own version of “nutrition labels” at the point of sale, including in marketing materials and on provider websites. Broadband Consumer Labels, which must be machine-readable, are required to disclose several key service attributes, such as the typical download and upload speeds associated with a plan, the typical latency users can expect, as well as pricing and other information. Specifically, ISPs are required to display the following information on Broadband Consumer Labels: 

  • Plan name/tier
  • Monthly pricing information, including one-time charges, early termination fees, introductory discounts, and bundled services
  • Whether or not an ISP participates in the Affordable Connectivity Program (ACP), though this could change if the ACP program isn’t extended 
  • Performance metrics, including typical download and upload speed, as well as typical latency
  • Data cap information
  • Links to ISP policy information 
  • Customer support contact information
  • FCC reference ID (a unique identifier supplied by the FCC), as well as a link to the FCC’s consumer page

Providers with more than 100,000 subscribers are required to display Broadband Consumer Labels by April 10, 2024, while all other providers have until October 10, 2024. 

screenshot of navigating FCC broadband label requirements from webinar

For a more detailed breakdown of the risks, challenges, and importance of these labels, watch our webinar: Navigating FCC Broadband Label Requirements.

The benefit to consumers is clear: transparency

Broadband Consumer Labels will provide consumers with much-needed transparency into the level of service they can expect when choosing an ISP. By organizing performance and pricing details in a simple, repeatable format, users can be sure they’re getting what they pay for, and they can compare different providers and plans more easily. The benefits to providers, meanwhile, largely comes in the form of increased consumer trust, confidence, and ultimately, brand loyalty. The labels will also provide ISPs with a medium to promote their offerings to users across the country.

image of FCC broadband consumer label

Broadband Consumer Label risks & challenges

On the other hand, the introduction and continued maintenance of broadband labels marks a sea change for the telco industry at large. The more pricing tiers and technologies that exist across multiple markets, the more unique labels will need to be published. For example, one provider’s label in Seattle could be different from the same provider’s label in nearby Tacoma in terms of price, plan tiers, speeds, and more. It will be a behemoth effort for many ISPs to create and update labels, and internet providers will undoubtedly face challenges. Providers not only need to adhere to the FCC’s guidelines in relatively short order, but labels must also be updated every six months, as well any time an ISP modifies an existing plan or introduces a new one. 

Providers also face both regulatory and commercial risks with the new labels. Some of those risks and challenges include: 

Regulatory Risks:

  • Although the program begins in April, the rules are subject to change as the FCC is still requesting input from key stakeholders.
  • Latency is considered particularly important for people who use video conferencing, including those with disabilities.
  • The FCC has yet to define what “typical” means in the context of speeds and latency. 
  • Consumer advocacy groups believe many subscribers are not getting what they pay for.
  • Expect FCC enforcement mechanisms to be developed for situations in which the information displayed on labels doesn’t match with the real-world user experience. 

Commercial Risks

  • Competition will have broad visibility into performance claims for every plan a provider offers. 
  • Administrative overhead for ISPs driven by the number of price plans, markets, technologies, etc.
  • Existing subscriber misconceptions of service experienced compared to the actual service delivered.
  • Resellers must provide performance metrics even though they have limited control over quality of service (QoS) metrics.
  • Consumer advocacy groups and consumers pose a legal risk for providers if information on labels isn’t reflected in reality. 

How Ookla can help ISPs with the broadband label revolution 

With deadlines for providers right around the corner, it’s critical for ISPs to coordinate across IT, marketing, legal, and regulatory teams to determine the number of labels needed for various regions, price points, performance metrics, and more. Two label requirements that may prove particularly difficult for providers to manage are the typical speed and latency performance metrics in a given area. 

While the FCC hasn’t yet defined what “typical” means for performance metrics on broadband labels, providers could find it difficult to both determine and validate those metrics because the real-world speeds experienced by consumers often differ from a provider’s advertised speeds, and it can also be difficult to distinguish real-world performance between different technologies or tiers of service, such as fiber or cable. 

That’s where Ookla can help. Ookla receives over 11 million consumer-initiated Speedtests per day from all over the world, with over 50 billion total tests taken to date. Ookla’s detailed data and insights on speed, latency, and a host of other metrics can help Internet Service Providers substantiate typical speed or latency claims, ensuring their subscribers know what to expect and ultimately get what they pay for. 

Three Ookla solutions that should be particularly helpful in both the rollout and maintenance of broadband labels are Speedtest Embedded™, Speedtest Custom™, and the Ookla Enrichment API™. 

  • Speedtest Embedded allows Speedtest to be integrated as a testing solution on servers and desktops, as well as CPE devices. Ookla captures millions of these CPE tests every day on consumer gateways, Wi-Fi routers, and set-top boxes, providing ISPs with measurements directly from or very near to the service connection. 
  • Speedtest Custom provides users with accurate network performance testing backed by the same trusted testing engine as Speedtest, helping ISPs and their customers understand their connected experiences with performance metrics including download, upload, latency, and jitter.  
  • Ookla Enrichment API lets ISPs link a given test to a specific plan subscription, allowing providers to enrich test data with subscriber tiers/provisioned speeds, technology types, whether a test was conducted in a residential or commercial area, and more. Please reach out to learn more about the Ookla Enrichment API.

Conclusion 

As we navigate the quickly approaching deadlines of April and October 2024 for the implementation of Broadband Consumer Labels, the urgency for ISPs to adapt cannot be overstated. These labels should add a new level of transparency and trust within the telecommunications sector, offering consumers and businesses clear, standardized information about broadband services. 

However, the path to compliance won’t be easy. ISPs must navigate complex logistical and data management hurdles to produce and maintain these labels accurately. Each label must reflect specific service characteristics relevant to the geographic location it serves, which will require a granular level of detail and regular updates (every six months) to ensure accuracy. What’s more, regulatory uncertainties and the dynamic nature of broadband services can add layers of additional complexity to this endeavor. The FCC will likely offer some latitude on implementation during the first several months, but ISPs should prepare to contend with eventual enforcement of the rules. Perhaps more immediate is the potential for challenges from aggressive public interest groups and impassioned subscribers. 

Ookla is here to help! With an unmatched depth and breadth of connectivity data derived from millions of consumer-initiated Speedtests taken daily, Ookla’s solutions can help ISPs streamline the process of substantiating the claims made on these new broadband labels. With Speedtest Embedded, Speedtest Custom, and the Ookla Enrichment API, ISPs can access real-time insights into network performance, customer experience, and other critical metrics. 

These tools are instrumental in validating the typical speed and latency performance information required on broadband labels, ensuring that ISPs can meet FCC guidelines with confidence and precision. Contact us to learn more. 

Ookla retains ownership of this article including all of the intellectual property rights, data, content graphs and analysis. This article may not be quoted, reproduced, distributed or published for any commercial purpose without prior consent. Members of the press and others using the findings in this article for non-commercial purposes are welcome to publicly share and link to report information with attribution to Ookla.

| June 23, 2020

Investigating the Gaming Experience in Indonesia


Bahasa Indonesia

Gaming is a fast-growing industry in Indonesia with millions of daily players. However, latency, a key metric for a high-quality gaming experience, is not equal across the country. And while most games are played on mobile devices, the fixed broadband networks that support console and PC games often show a much lower latency in many areas. Today we’re examining latency on both fixed broadband and mobile at the country, province and city level in Indonesia to see where players are most likely to have smooth gameplay with less lag.

Latency (or ping) is the reaction time of a connection and it is measured in milliseconds. For the best gaming experience, users should expect their latency to be 59 ms or less. Latency when gaming can vary, depending on the servers connected to, and connecting to a server within a gamer’s own region is preferred. Speedtest tests to the closest, lowest-latency server — often within the same population center as the user.

Telkom offered lowest latency in Q1 2020

ookla_Indonesia_mobile_fixed_latency_0620

During Q1 2020, Indonesia’s mean latency on fixed broadband was 20 ms. On mobile, mean latency was 42 ms. At the country level, fixed broadband providers in Indonesia showed a range of latency between 16 ms and 35 ms during Q1 2020. Telkom had the lowest latency on fixed broadband at 16 ms. MyRepublic followed closely with 17 ms. Biznet and First Media had the highest latency at 24 ms and 35 ms, respectively.
ookla_Indonesia_fixed_provider_latency_chart_0620-

Telkomsel and 3 had the lowest latency on mobile at 36 ms. Mean mobile latency on IM3 Ooredoo, XL and Smartfren ranged between 36 ms and 48 ms during this period.
ookla_Indonesia_mobile_provider_latency_chart_0720_en

Internet performance stayed consistent during the pandemic

Internet speed also matters when gaming. We’ve been using data from Speedtest Intelligence® to track internet speeds at a global level during the pandemic, and Indonesia’s mobile and fixed broadband speeds have largely been consistent with pre-pandemic performance.
ookla_Indonesia_performance_0620

The volume of users taking a Speedtest increased dramatically on both fixed and mobile between the weeks of March 9 and April 13, 2020 as people adjusted to new internet usage patterns during the pandemic. Test volume started decreasing after the week of April 13.
ookla_Indonesia_volume_change_0620

Bandung had lowest latency on fixed broadband, Bekasi on mobile

Looking at fixed and mobile latency in the five largest cities in Indonesia during Q1 2020, we found slight variation in fixed broadband latency and a wider spread on mobile.
Ookla_Indonesia_cities_latency_0620

Bandung, a city in West Java, showed the lowest fixed broadband latency of the group at 15 ms during Q1 2020. Surabaya and Bekasi had the highest latency at 22 ms. The biggest improvement on fixed broadband latency was seen in Medan, which showed a decrease in fixed broadband latency from 32 ms in Q1 2019 to 20 ms in Q1 2020.

The city of Bekasi, located west of Jakarta, had the lowest mobile latency at 32 ms during Q1 2020, followed closely by Bandung.

We saw significant improvements on mobile latency in all five cities when comparing Q1 2019 to Q1 2020. Most notably, mobile latency in Medan improved from 72 ms in Q1 2019 to 51 ms in Q1 2020.

East and Central Kalimantan had lowest fixed broadband latency

Ookla_Indonesia_province_fixed_latency_0620-2

An analysis of latency on fixed broadband in Indonesia’s 34 provinces during Q1 2020 revealed that all provinces had mean latencies within the acceptable range for online gaming. Latency on fixed broadband ranged from 16 ms in East Kalimantan and Central Kalimantan to 38 ms in Gorontalo.

Banten had lowest mobile latency during Q1 2020

Ookla_Indonesia_province_mobile_latency_0620-2

Mean latency on mobile showed a much wider range among Indonesia’s provinces in Q1 2020 than we saw on fixed broadband. Mobile latency during this period ranged from a low of 33 ms in Banten to a high of 116 ms in North Maluku.

Internet performance looks to be strong and improving in many parts of Indonesia, which is essential to a good gaming experience. We look forward to seeing if the lagging provinces catch up in the near future. To learn more about how other Asian countries’ internet performance compares to Indonesia, visit the Speedtest Global IndexTM.

Editor’s note: This article was updated on July 16, 2020 to correct an error in the latency by provider section.


Meneliti Pengalaman Bermain Game di Indonesia

Industri game adalah salah satu bidang yang berkembang pesat di Indonesia dengan jutaan pemain setiap harinya. Namun, latensi, patokan utama untuk pengalaman bermain game berkualitas tinggi, belum tersebar secara merata di negara ini. Meskipun sebagian besar game dimainkan pada perangkat seluler, jaringan broadband tetap yang mendukung game konsol dan PC sering menunjukkan latensi yang jauh lebih rendah di banyak wilayah. Kini, kami sedang memeriksa latensi pada broadband tetap dan seluler di tingkat negara, provinsi, dan kota di Indonesia untuk melihat di wilayah mana pemain dapat bermain dengan lancar dengan hanya mengalami sedikit jeda.

Latensi (disebut juga ping) adalah waktu reaksi koneksi yang diukur dalam milidetik. Untuk mendapatkan pengalaman bermain game terbaik, pengguna setidaknya perlu mengharapkan latensi sebesar 59 ms atau kurang. Latensi saat bermain game dapat bervariasi, tergantung pada server yang terhubung. Selain itu, menghubungkan ke server di dalam wilayah pemain game sendiri lebih disukai. Speedtest menguji ke server terdekat dengan latensi terendah—sering kali dalam pusat populasi yang sama dengan pengguna.

Telkom menunjukkan latensi terendah di Q1 2020

ookla_Indonesia_mobile_fixed_latency_chart_0620id

Selama Q1 2020, latensi rata-rata Indonesia pada broadband tetap adalah 20 ms. Sedangkan pada broadband seluler, latensi rata-rata adalah 42 ms. Pada tingkat negara, penyedia layanan broadband tetap di Indonesia menunjukkan latensi dalam kisaran antara 16 ms hingga 35 ms selama Q1 2020. Telkom memiliki latensi terendah sebesar 16 ms pada broadband tetap. Kemudian disusul oleh MyRepublic dengan 17 ms. Biznet dan First Media memiliki latensi tertinggi, masing-masing sebesar 24 ms dan 35 ms.

ookla_Indonesia_fixed_provider_latency_chart_0620id

Telkomsel dan 3 memiliki latensi terendah pada ponsel di 36 ms. Selama periode ini, latensi rata-rata IM3 Ooredoo, XL, dan Smartfren berkisar antara 36 ms hingga 48 ms.

ookla_Indonesia_mobile_provider_latency_chart_0720_id

Kinerja internet tetap konsisten selama pandemi

Kecepatan internet juga menjadi hal yang sangat penting saat bermain game. Kami telah menggunakan data dari Speedtest Intelligence® untuk melacak kecepatan internet di tingkat global selama pandemi. Hasilnya, kecepatan broadband seluler dan tetap di Indonesia sebagian besar konsisten dengan kinerja pra-pandemi.

ookla_Indonesia_performance_0620id

Volume pengguna yang menggunakan Speedtest pada broadband seluler dan tetap meningkat drastis antara minggu 9 Maret hingga 13 April 2020 ketika banyak orang menyesuaikan diri dengan pola penggunaan internet baru selama pandemi. Volume pengujian mulai menurun setelah minggu 13 April.

ookla_Indonesia_volume_change_0620id

Bandung memiliki latensi terendah pada broadband tetap, sedangkan Bekasi pada broadband seluler

Berkaca pada latensi tetap dan seluler di lima kota terbesar di Indonesia selama Q1 2020, kami menemukan sedikit variasi pada latensi broadband tetap dan variasi yang lebih luas pada latensi seluler.

Ookla_Indonesia_cities_latency_0620-1

Bandung, sebuah kota di Jawa Barat, menunjukkan latensi broadband tetap terendah dalam kelompoknya sebesar 15 ms pada Q1 2020. Surabaya dan Bekasi memiliki latensi tertinggi sebesar 22 ms. Peningkatan terbesar dalam hal latensi broadband tetap terlihat di Medan, yang menunjukkan penurunan latensi broadband tetap dari 32 ms pada Q1 2019 menjadi 20 ms pada Q1 2020.

Kota Bekasi, yang terletak di sebelah barat Jakarta, memiliki latensi seluler terendah sebesar 32 ms selama Q1 2020, diikuti oleh Bandung.

Saat membandingkan Q1 2019 hingga Q1 2020, kami melihat peningkatan latensi seluler signifikan di kelima kota tersebut. Paling mencolok, latensi seluler di Medan meningkat dari 72 ms pada Q1 2019 menjadi 51 ms pada Q1 2020.

Kalimantan Timur dan Kalimantan Tengah memiliki latensi broadband tetap terendah

Ookla_Indonesia_province_fixed_latency_0620id-1

Analisis latensi pada broadband tetap di 34 provinsi di Indonesia selama Q1 2020 menunjukkan bahwa semua provinsi memiliki latensi rata-rata dalam kisaran yang dapat diterima untuk bermain game online. Latensi broadband tetap berkisar antara 16 ms di Kalimantan Timur dan Kalimantan Tengah hingga 38 ms di Gorontalo.

Banten memiliki latensi seluler terendah selama Q1 2020

Ookla_Indonesia_province_mobile_latency_0620id-1

Latensi seluler rata-rata menunjukkan kisaran yang jauh lebih luas di antara provinsi-provinsi Indonesia pada Q1 2020 dibanding yang kami lihat pada broadband tetap. Latensi seluler selama periode ini berkisar antara 33 ms di Banten (terendah) hingga 116 ms di Maluku Utara (tertinggi).

Kinerja internet terlihat sangat baik dan meningkat di berbagai daerah di Indonesia. Hal ini penting untuk pengalaman bermain game yang baik. Kami berharap dapat melihat provinsi yang tertinggal mampu mengejar dalam waktu dekat. Untuk mempelajari lebih lanjut tentang kinerja internet negara-negara Asia lainnya dibandingkan dengan Indonesia, kunjungi Indeks Global SpeedtestTM.

Catatan editor: Artikel ini diperbarui pada 16 Juli 2020 untuk memperbaiki kesalahan dalam latensi oleh bagian penyedia.

Ookla retains ownership of this article including all of the intellectual property rights, data, content graphs and analysis. This article may not be quoted, reproduced, distributed or published for any commercial purpose without prior consent. Members of the press and others using the findings in this article for non-commercial purposes are welcome to publicly share and link to report information with attribution to Ookla.

| December 6, 2021

Ookla Video Analytics Reveals the State of Global Video Experience


Video is essential to today’s internet across the world. We use it to watch shows and movies, stream live events and even keep up to date on our favorite cats on social media. Ookla® launched video testing in the Speedtest® app for iOS and Android earlier this year so consumers can measure the quality of their video experience. Already, millions of video tests have been initiated by consumers. Today we’re sharing some of that data to provide insight into video experience around the world, specifically, we’ve analyzed adaptive start time and highest overall video resolution over all mobile technologies, 5G and fixed broadband in select countries during Q3 2021.

Switzerland had the fastest adaptive start time for all mobile technologies, South Africa fastest for 5G

Video streaming services use adaptive bitrate technology

All modern video streaming platforms use adaptive bitrate technology to automatically adjust video quality based on network conditions and device capabilities in order to display the highest quality video that a device can support, while minimizing buffering and slow video start time. Speedtest Video Analytics provides deep insights and competitive benchmarking for device and network video streaming capabilities.

Adaptive start time — the time it takes for adaptive bitrate playback to initiate — allows us to see how quickly videos are loading. A 2012 study found that users will leave a video if it doesn’t begin playing within two seconds. We have to imagine in 2021, that timeframe is being squeezed even further. Our analysis shows how countries are performing against this important benchmark.

ookla_adaptive-start-time_all-mobile-tech_1121-01-3

Speedtest Intelligence® reveals that Switzerland had the fastest median adaptive start time for all mobile technologies combined among the countries we analyzed at 1.02 seconds during Q3 2021. South Korea and Norway were close behind at 1.07 seconds and 1.10 seconds, respectively. Five more countries achieved a median adaptive start time at or under 1.25 seconds during Q3 2021, including Hong Kong (SAR) and Croatia (1.17 seconds), Portugal (1.24 seconds), and Kuwait and Mexico (1.25 seconds). All but three of the remaining countries we surveyed achieved a median adaptive start time between 1.25 seconds and 2.00 seconds during Q3 2021 except Colombia (2.11 seconds), Saudi Arabia (2.12 seconds) and India (2.13 seconds).

Most 5G-capable video tests showed blazing fast adaptive start times

ookla_adaptive-start-time_5g_1121-01

We’ve seen median 5G download speeds zoom ahead of traditional mobile technologies, even reaching median download speeds 10 times faster than on 4G LTE. It’s no surprise Video Analytics revealed adaptive start time was often much faster on 5G than on all mobile technologies combined. Five countries achieved median adaptive start times faster than 1.00 second during Q3 2021: South Africa (0.73 seconds), Switzerland (0.79 seconds), Norway (0.82 seconds), Hong Kong (0.86 seconds) and South Korea (0.90 seconds). Video Analytics shows the only countries with a median 5G adaptive start time slower than 1.25 seconds were the United States (1.27 seconds), Brazil (1.42 seconds) and Saudi Arabia (1.94 seconds).

Five countries’ adaptive start time improved more than 0.25 seconds on 5G compared to all technologies combined during Q3 2021: the Philippines (-0.62 seconds), South Africa (-0.53 seconds), Brazil (-0.39 seconds), Hong Kong (-0.31 seconds) and Norway (-0.29 seconds). However, several countries showed a less than 0.20 second improvement when comparing adaptive start rate on 5G to that on all technologies combined during Q3 2021: the U.S. (-0.14 seconds), Bahrain (-0.16 seconds), South Korea and Saudi Arabia (-0.17 seconds), and the United Kingdom (U.K.) and France (-0.18 seconds).

Adaptive start time is not always faster on fixed broadband

ookla_adaptive-start-time_fixed_1121-01-1

Speedtest Intelligence showed a narrower range for adaptive start time on fixed broadband than on 5G with every country on our list achieving between 0.67 and 1.85 seconds during Q3 2021. Ten countries on our list achieved a median adaptive start time faster than 1.00 second during Q3 2021: South Korea (0.67 seconds), Norway (0.74 seconds), Hong Kong (0.75 seconds), Switzerland (0.76 seconds), the U.K. (0.79 seconds), France (0.86 seconds), the U.S. (0.87 seconds), Spain (0.88 seconds), Portugal (0.89 seconds) and Italy (0.98 seconds).

Twenty out of the 24 countries we surveyed had a median fixed broadband adaptive start time faster than 1.50 seconds during Q3 2021. Colombia (1.50 seconds), Egypt (1.59 seconds), Turkey (1.64 seconds) and Saudi Arabia (1.85 seconds) were the only countries with a median adaptive start time slower than 1.50 seconds on fixed broadband during Q3 2021.

South Korea video tests reached 4K resolutions at the highest proportion on mobile and fixed broadband

Video resolution is incredibly important in the experience of streaming video and the higher the resolution, the more definition and clarity we are able to see. These days, the difference between an SD and 4K experience is gigantic. Resolution is measured in the numbers of pixels in a 16:9 ratio, with 2160 pixel height representing a 4K picture. Video Analytics measures the resolution rates, which represent the portion of samples that reach a particular resolution. In this analysis, we evaluated the resolution rates for 4K, typically the highest resolution users will need.

ookla_highest-video-resolution_all-mobile-tech_1121-01

Using Speedtest Intelligence, we found South Korea and Switzerland had the highest overall successful resolution rates for all mobile technologies combined during Q3 2021, reaching 4K resolutions 80.4% and 80.3% of the time, respectively. Croatia (79.7%), Kuwait (77.4%) and Norway (75.4%) were the only other countries on our list that achieved 4K video resolution more than 75.0% of the time. Only seven countries on our list did not reach a 4K resolution at least 50% of the time on all mobile technologies combined: the Philippines (38.4%), India (41.1%), Indonesia (44.8%), Colombia (45.3%), Mexico (46.3%), Russia (49.7%) and Egypt (49.9%).

5G led to higher video resolution, but 4K mobile devices still remain rare

ookla_highest-video-resolution_5g_1121-01

5G provided a higher resolution for mobile devices during Q3 2021 than all technologies combined. Every country we surveyed reached a 4K resolution over 80.0% of the time over 5G. In fact, six out of the 14 countries we surveyed for 5G achieved a 4K resolution more than 90.0% of the time, including South Korea (95.9%), Norway (94.5%), Kuwait (94.0%), South Africa (93.6%), Switzerland (92.6%) and France (91.5%). On the lower end of our list, only Italy (81.9%), Brazil (83.9%) and the U.S. (83.9%) achieved 4K resolutions less than 85.0% of the time.

While this is great news for the future of mobile devices, 4K resolutions in mobile devices still aren’t common: Sony is the only popular device manufacturer producing 4K mobile devices. In the meantime, users who can connect to 5G through either a hot spot or fixed wireless access (FWA) will reap the benefits of being able to stream on 4K devices like computers, televisions or tablets.

South Korean fixed broadband delivers ultra-high definition resolutions

ookla_highest-video-resolution_fixed_1121-01

Speedtest Intelligence reveals South Korea had the highest fixed broadband 4K resolution rate among countries surveyed at 92.2% during Q3 2021. Other countries that achieved 4K resolution rates above 85.0% on fixed broadband during Q3 2021 included: Switzerland (89.4%), Hong Kong (87.6%), Norway (87.1%) and the U.S. (86.7%). Every other country in our analysis achieved 4K resolution rates between 65.0% and 85.0%, except Egypt (49.5%), Indonesia (52.5%), the Philippines (64.2%) and Turkey (64.3%).

Video Analytics gives you the information you need about your video playback

We’re excited to share more about video performance and quality of experience using Video Analytics in the coming months. In the meantime, if you want to learn more about Video Analytics and how it can help you benchmark and improve your network, please join our upcoming webinar, December 9 by clicking here.

Ookla retains ownership of this article including all of the intellectual property rights, data, content graphs and analysis. This article may not be quoted, reproduced, distributed or published for any commercial purpose without prior consent. Members of the press and others using the findings in this article for non-commercial purposes are welcome to publicly share and link to report information with attribution to Ookla.

| July 11, 2022

More Consumers are “Always On” Your Network, Here’s What They Need From You

We know the COVID-19 pandemic changed mobile user behavior, but new research commissioned by Ookla® shows just how much more consumers came to rely on their mobile connections. Ookla conducted a survey of five thousand mobile phone users from a diversity of demographic groups across Switzerland, the United Kingdom, and the United States to learn more about how they use their devices and how they view their mobile operators. Computer Weekly recently shared a look at what this looked like in the U.K. For this article, we’ve paired this information with Speedtest® data on consumer sentiment in all three countries to get a full picture of what consumers expect from their mobile operators today.

Key takeaways:

  • The percentage of consumers who describe themselves as always online grew from 30% to 69%.
  • Fewer than two-thirds of respondents are satisfied with customer service with “always on” customers at least twice as likely to report issues with customer service.
  • “Always on” consumers have different support needs, prioritizing a more well-rounded customer service experience.
  • Nearly half (47.4%) of customers who have had customer service issues in the past 18 months are likely to want to switch to another operator.

Increasing numbers of mobile customers are “always on”

The number of mobile customers who described themselves as always online grew from 30% in November 2019 to 69% in November 2021. Whereas consumers used to put down their phones for a variety of reasons, “always on” users are online for a variety of economic reasons (accessing customers and generating business, traffic information and remote working, social media, and information sharing) and lifestyle reasons (parenting and caregiving, health and fitness, and gaming). It’s no surprise then, that these valuable customers need reliable networks to keep up with the demands of their mobile internet use.

Chart of how more users are "always on" comparing 2019 versus 2021

Between 2019 and 2021 we saw a drop in users who were only “always on” for only economic reasons from 16% to 7%. Meanwhile, users who were “always on” for lifestyle reasons grew from 3% to 32%. The largest increases were in users who were “always on” for economic and lifestyle reasons.

Fewer than two-thirds of respondents satisfied with customer service

The 2020 American Customer Satisfaction Index found the telecom industry lags significantly in customer satisfaction. While customer service could be a key component of improving customer satisfaction, our survey revealed that fewer than two-thirds of respondents were satisfied with the customer service they received. Wait time had the lowest proportion of satisfied respondents (51%) while clarity of communication and multiple options for contact had the highest (62%). In addition, an operator-by-operator analysis showed that between 10% and 25% of customers of each operator had to submit a formal complaint. This obviously leaves significant room for improvement.

Chart of net satisfaction with operator customer service

“Always on” users have different support needs

With more customers categorizing themselves online all the time, it’s increasingly important that their network be available whenever they need it. It is also vital that they get the kind of customer support they need when they encounter a problem.

Chart of top three rated components of customer satisfaction

We asked respondents to rank the top three components of customer satisfaction that make for good customer service. While customers who are not “always on” are looking for well trained staff, a quick resolution, and clear communication, “always on” users are looking for a more well-rounded customer service experience. “Always on” users also prioritize short wait times, clear paths to resolution, multiple methods of communication, and that they feel valued as a customer.

This means operators with a robust support network that customers can comprehend and access in the ways that they prefer to communicate will win the customer service race — and consequently, customer retention. Our clients have seen this already with Spatialbuzz™, which allows mobile operators to identify, prioritize, and diagnose customer dissatisfaction areas in real time with quick, actionable resolutions.

“Always on” customers experience more problems with customer service

Chart of percentage of users who report customer service issues

“Always on” respondents in all three countries were at least twice as likely to report issues with customer service. The difference was especially pronounced in the U.K. where “always on” users were more than three times as likely to report customer service issues than their counterparts. This, plus the growth in the number of “always on” customers, poses a difficulty for mobile operators whose customer support programs have not evolved to meet these changing needs. If operators want to retain these key customers, there is work to be done.

Users who contact customer service are still likely to churn

The fact that customer service is a key factor in customer retention is no surprise, still our survey revealed that nearly half (47.4%) of customers who have had customer service issues in the past 18 months are likely to want to switch to another operator. The data tells us that even when issues are resolved, customers are often not satisfied with how they have been dealt with and still consider switching.

Infographic comparing customer satisfaction and likelihood to churn

Respondents in the U.S. were the most likely to consider switching (24-37%, depending on operator). Customers in the U.K. were open to switching (25%, 29%, 29%, and 32%, depending on operator) and those in Switzerland were slightly less likely to consider switching (25, 27%, and 32%, depending on operator).

As important as adequate customer service is, it’s clear that mobile operators need to meet customers’ needs before they have to resort to customer service. Providing a high level of network performance is important to this as is checking in with consumer sentiment, especially as consumers’ habits shift toward being “always on.”

Solving customer issues is not enough to retain your customer base. Those issues need to be resolved with care through clear communication and expertise in a timely manner. To learn more about Consumer SentimentTM data or how Spatialbuzz could help you connect with in-need customers faster and more efficiently, contact us.

Ookla retains ownership of this article including all of the intellectual property rights, data, content graphs and analysis. This article may not be quoted, reproduced, distributed or published for any commercial purpose without prior consent. Members of the press and others using the findings in this article for non-commercial purposes are welcome to publicly share and link to report information with attribution to Ookla.