| December 14, 2021

Ookla Acquires RootMetrics

Ookla® has acquired RootMetrics®, bringing together two industry leaders that deliver outstanding network connectivity insights to the world. Together they will combine the industry-standard first-party crowdsourced data from Speedtest® with the RootMetrics’ scientifically controlled drive and walk testing data collection for the benefit of the mobile operators who build the networks and the consumers who rely on them.

Ookla CEO and co-founder Doug Suttles says, “Ookla plus RootMetrics fully enables the network assessment trifecta of crowd measurement, controlled testing and consumer perception—with a sustainable business model that should thrive through the privacy revolution.”

Mobile operators, network infrastructure providers and governments will be able to jointly leverage Ookla and RootMetrics’ respective network performance analytics, software products, testing capabilities and data science methodologies to better understand, market, deploy and optimize their networks. With RootMetrics and Ookla’s recently acquired Wind™ platform, Ookla’s portfolio of real-time mobile network coverage and performance measurement solutions now extends to traditional drive testing, indoor walk testing and live event monitoring.

“Becoming part of Ookla completes the vision that Doug and I shared when we first met years ago,” says RootMetrics CEO Kevin Hasley. “With our combined experience and expertise we can better help our customers overcome challenges, optimize their networks and create opportunities. I am very excited to see our joint future unfold.”

As part of Ookla, RootMetrics will continue to serve customers in the same capacity.

Ookla retains ownership of this article including all of the intellectual property rights, data, content graphs and analysis. This article may not be quoted, reproduced, distributed or published for any commercial purpose without prior consent. Members of the press and others using the findings in this article for non-commercial purposes are welcome to publicly share and link to report information with attribution to Ookla.

| November 15, 2021

Improving the Speedtest Global Index with Data on Median Speeds

The Speedtest Global Index has long been the go-to resource for detailed information about internet performance around the world. It’s about to get even better. Starting today, we are also including data on median performance to better reflect the speeds a user is more likely to achieve in a market and we will eventually transition to only displaying median speeds. While we initially planned to switch entirely to median on February 15, 2022, we have extended the date the “mean” tab will be available until February 15, 2023 to allow regulators who rely on this information to transition over to the new metric. Read on for details as to why we are making this switch and the impact we expect it to have on world rankings for fixed broadband and mobile internet speeds.

How to get the data you want

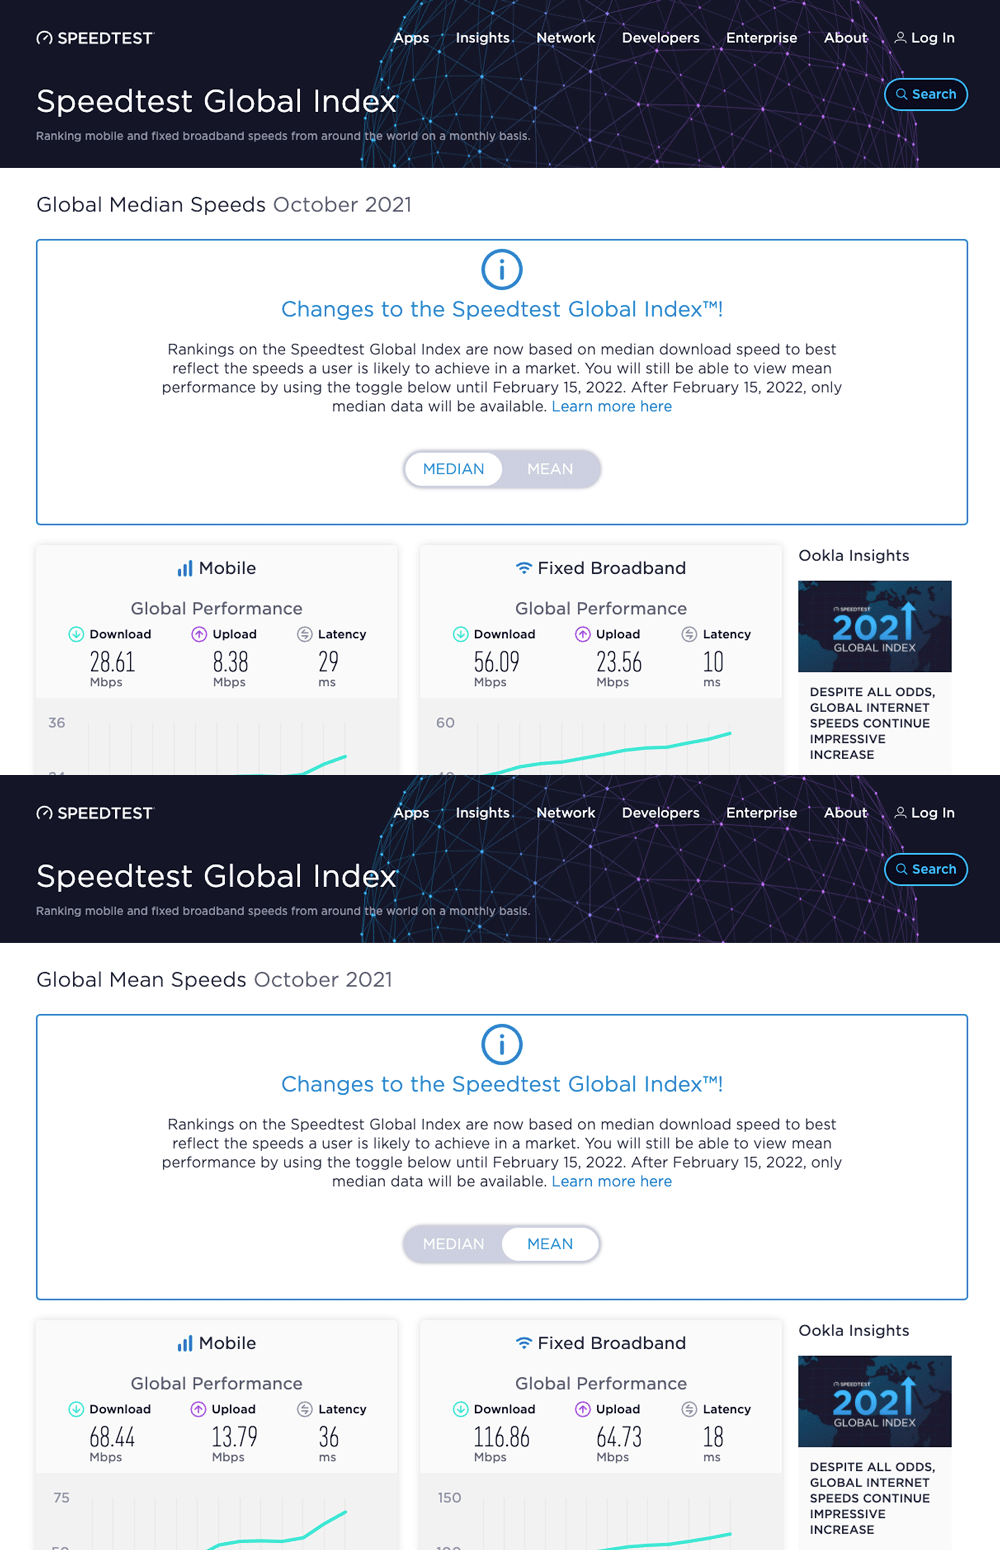
We have included a toggle at the top of the Speedtest Global Index so you can switch between median and mean speeds. The default view for this toggle shows median speeds as that will be the metric used on the Speedtest Global Index going forward.

ookla_global-index_mean_median_1121

This toggle will be available at the top of the page for the next three months. This gives you time to adjust to the new metric and play with the comparisons between median and mean to gain a deeper understanding of why we are making this change. Speaking of which …

We are making this change because median is a better measure of everyday experience

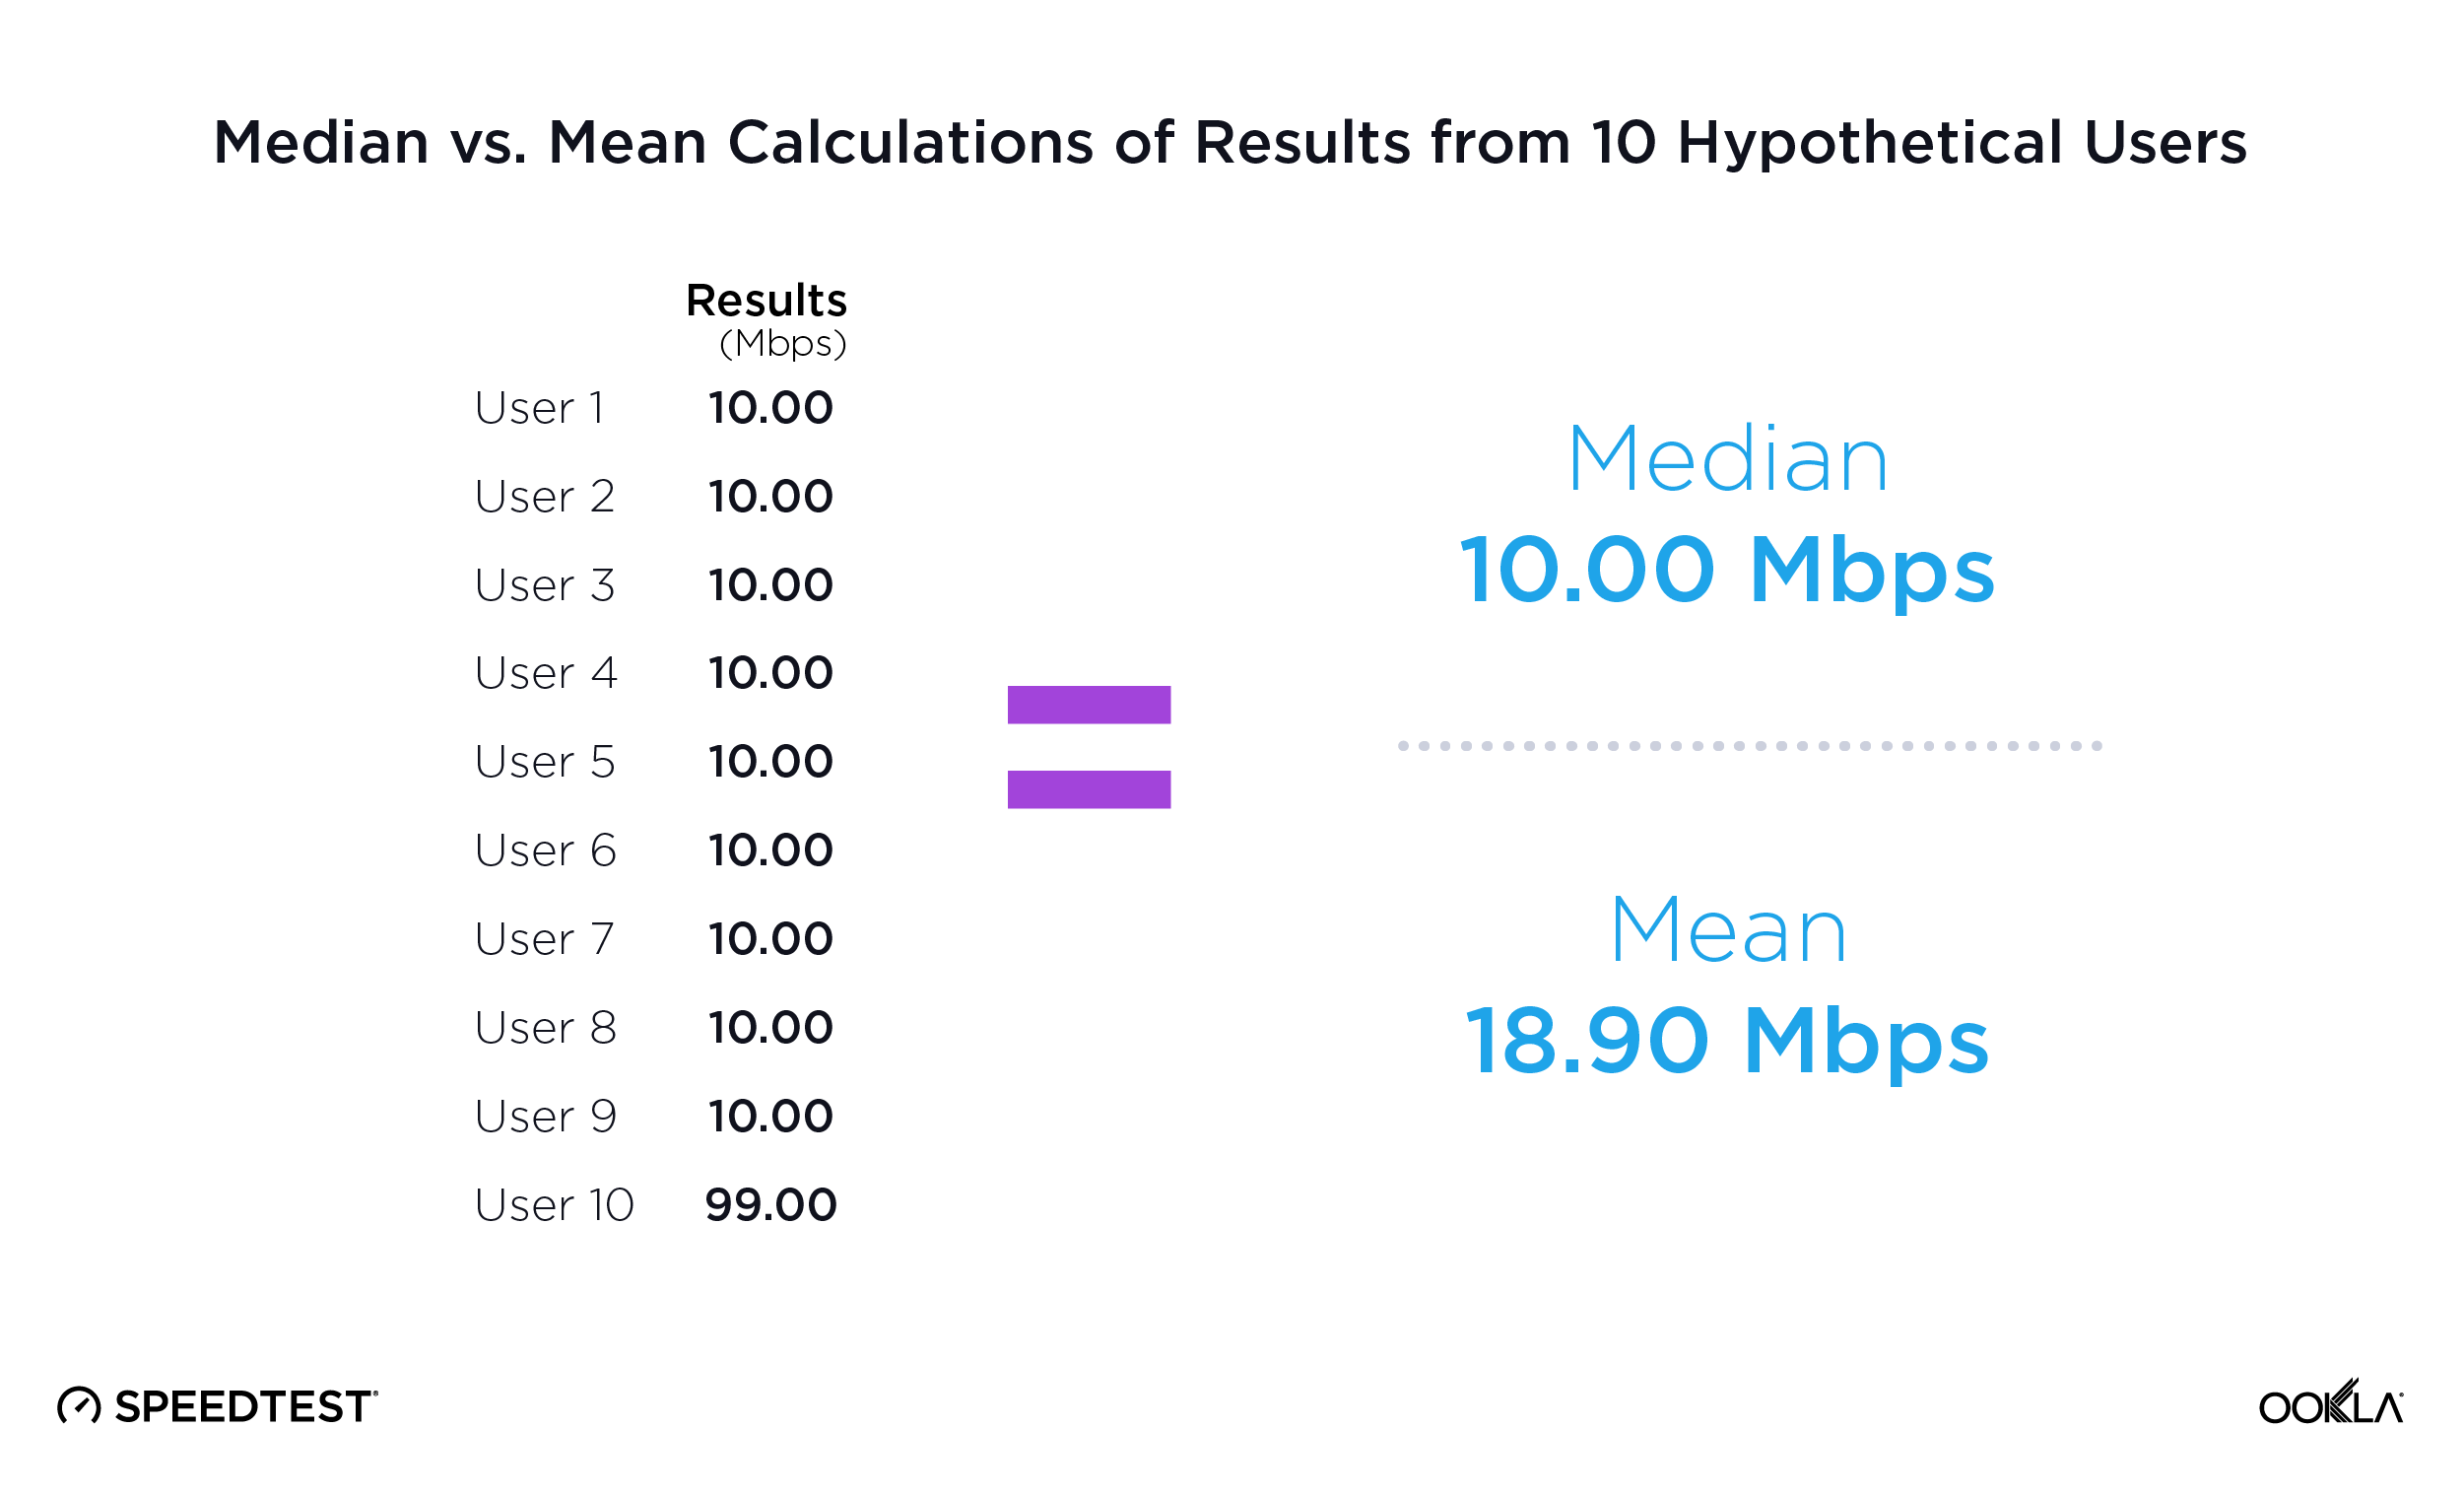
Median is a measure that captures the typical user’s experience. In statistical terms, median is less likely to be influenced by outliers than mean is. The chart below shows how median and mean return very different values when considering a simple number set of ten values.

ookla_median_vs_mean_1121-01

You can see how that one final value of 99 draws the mean, the arithmetical average, way up whereas the median continues to reflect the typical value of the set.

As 5G and gigabit internet have expanded across the globe, we are seeing more and more high speed results on Speedtest®. This is worth celebrating, but mean values can mask the fact that not everyone’s internet is improving. Switching the Speedtest Global Index to median allows countries where a greater share of people have high speed internet to rank higher on the Index, rather than rewarding countries where a few areas have really high speeds and everyone else is left waiting.

This changes the rankings, but not for everyone

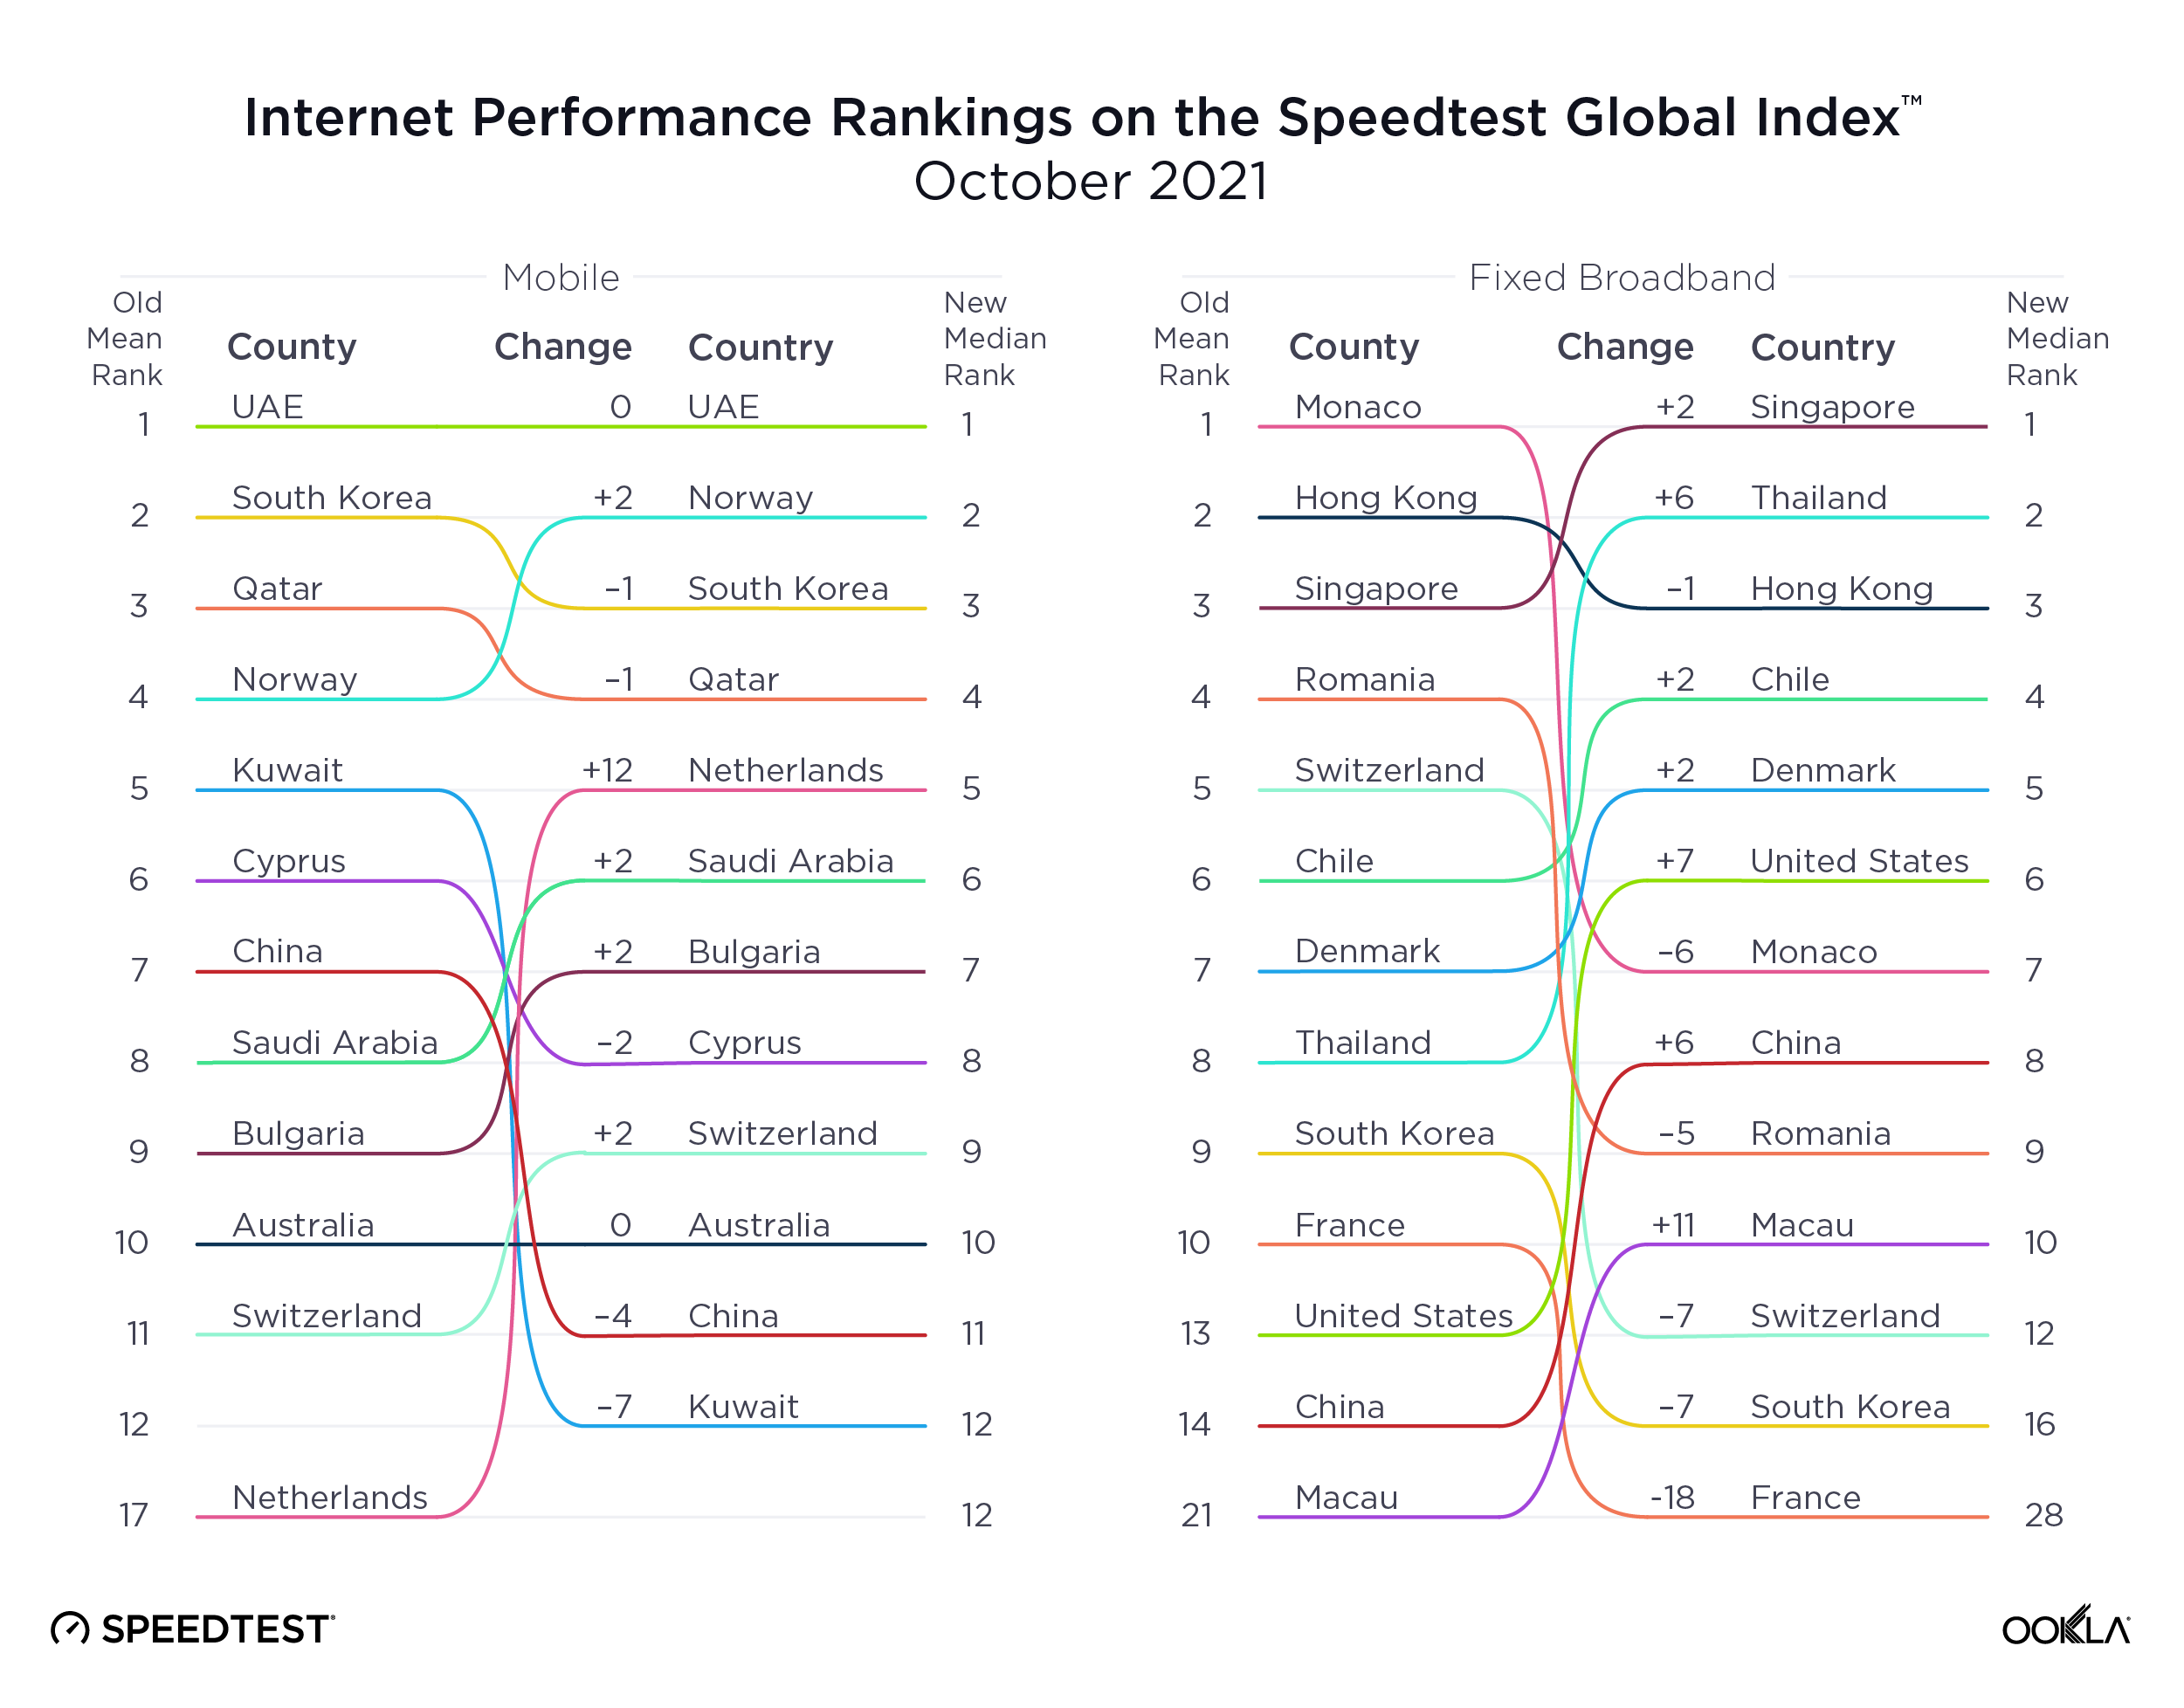
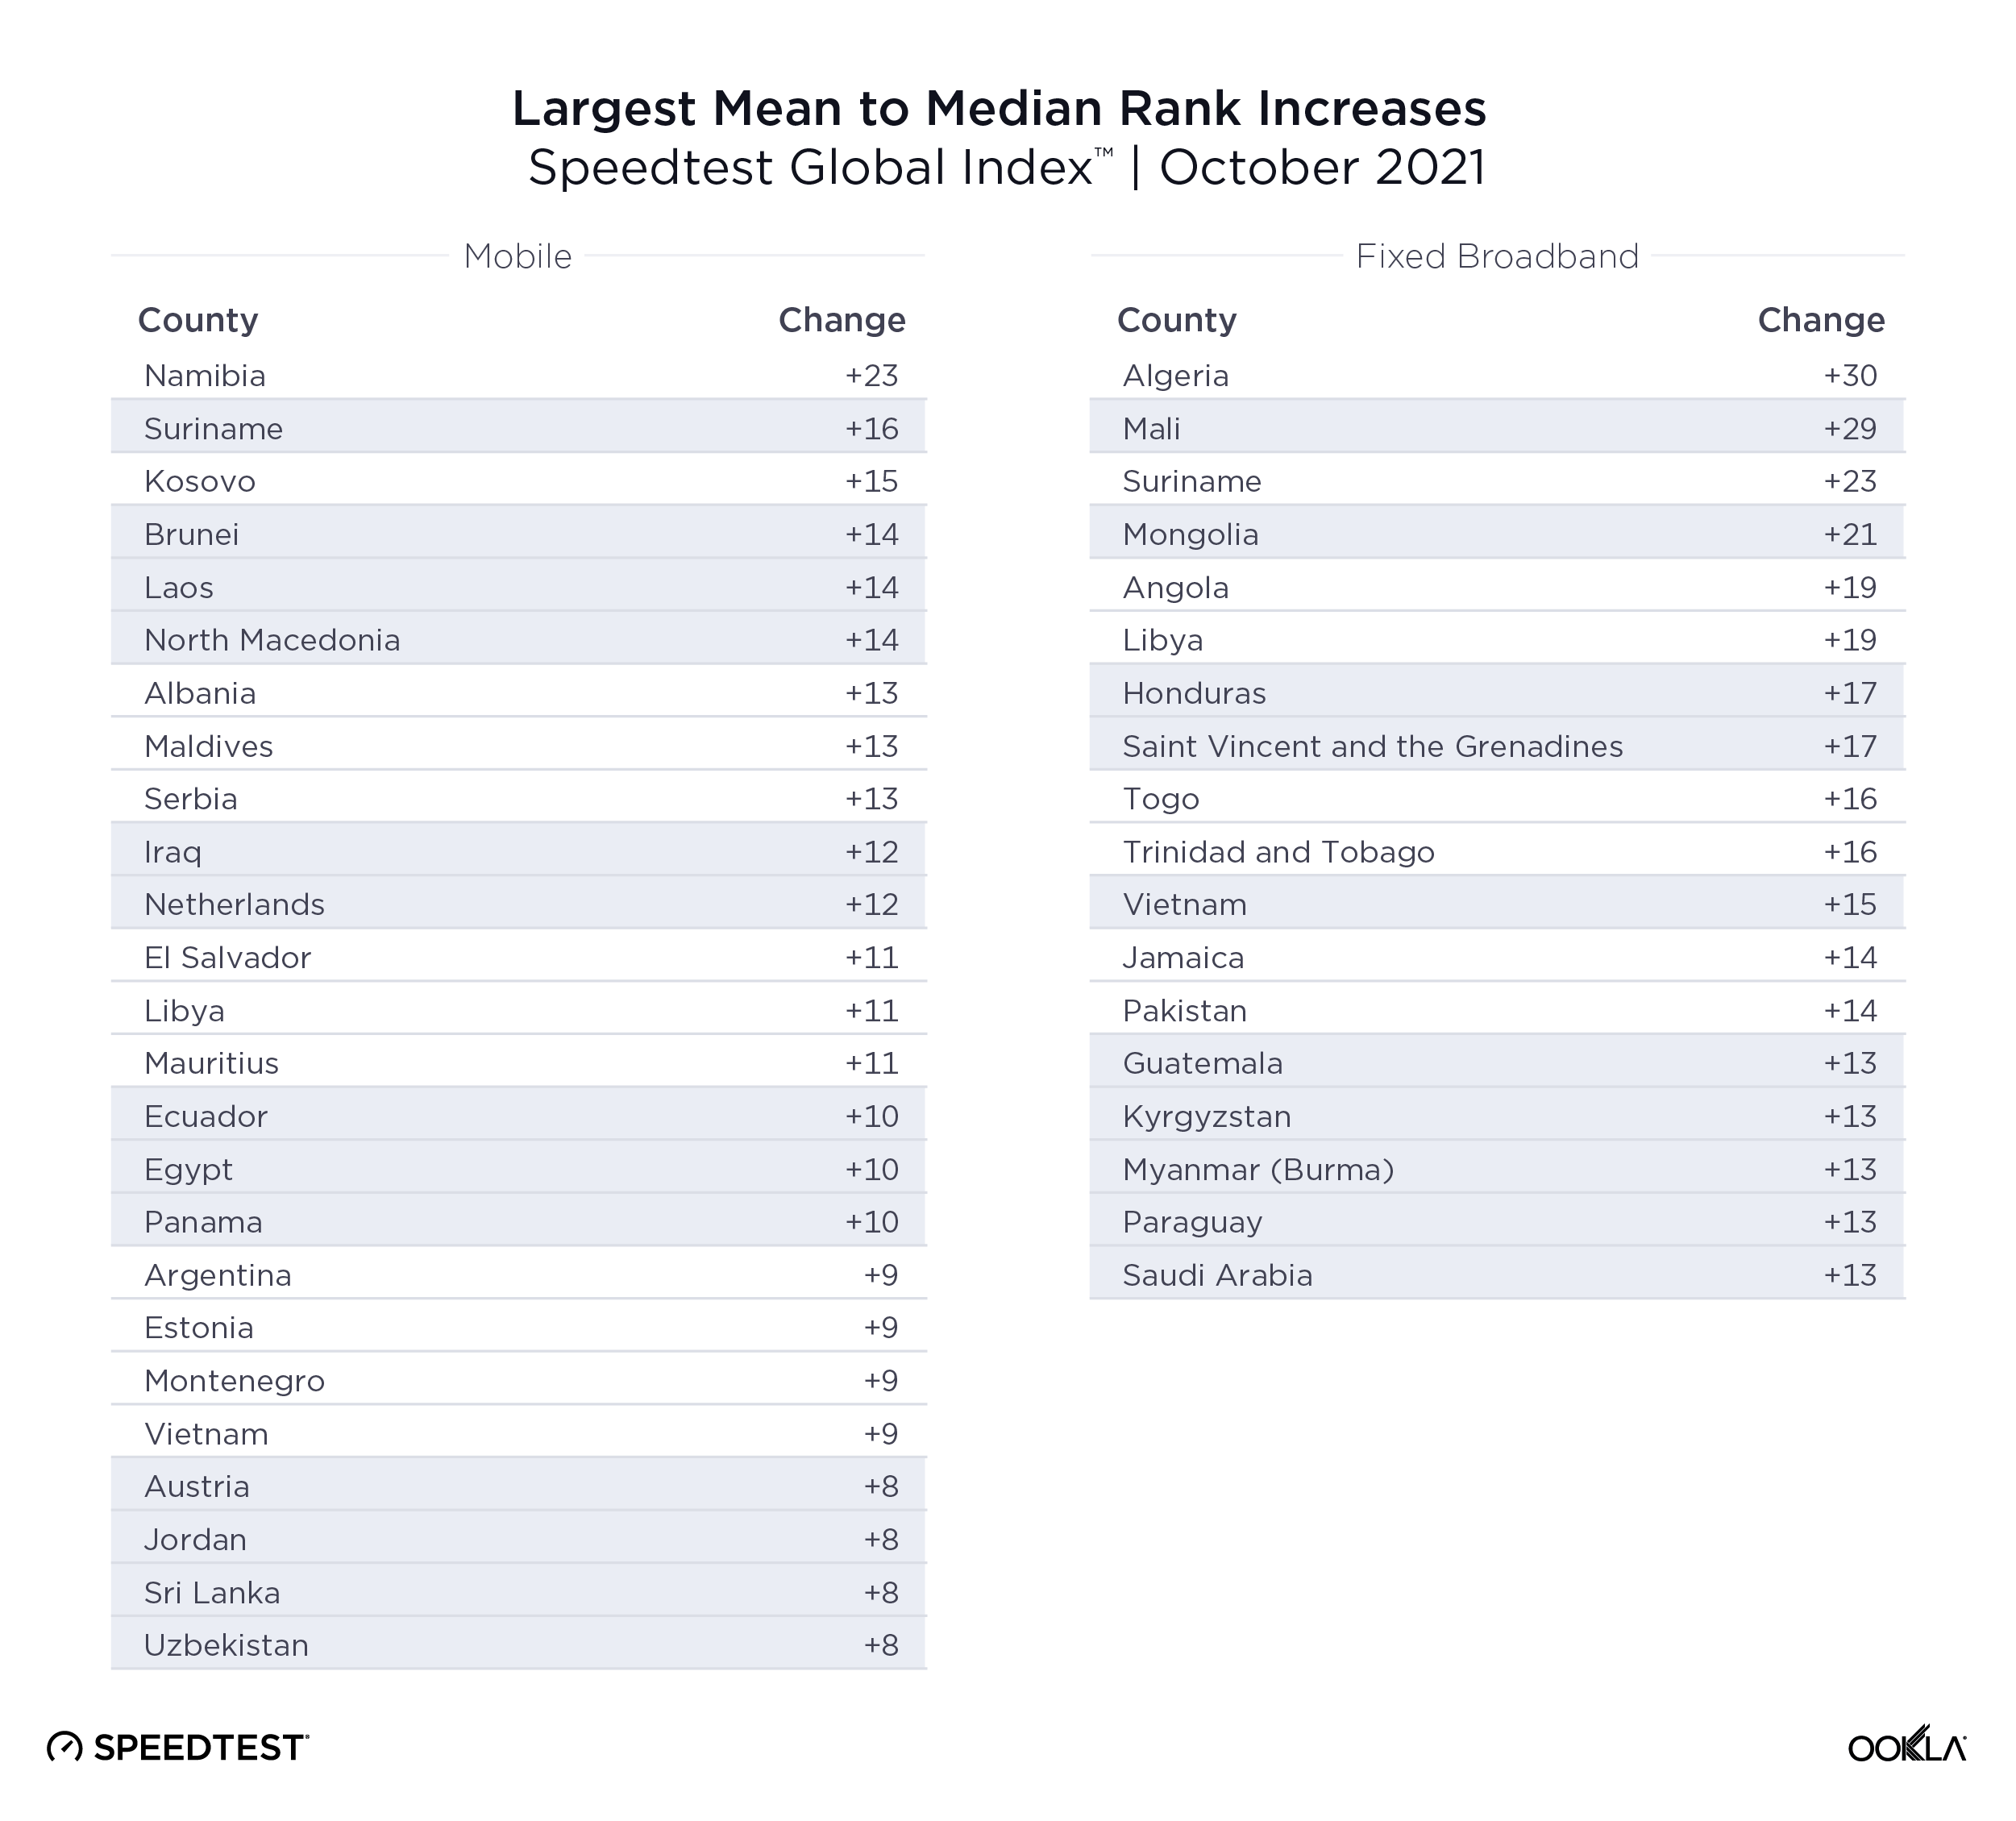
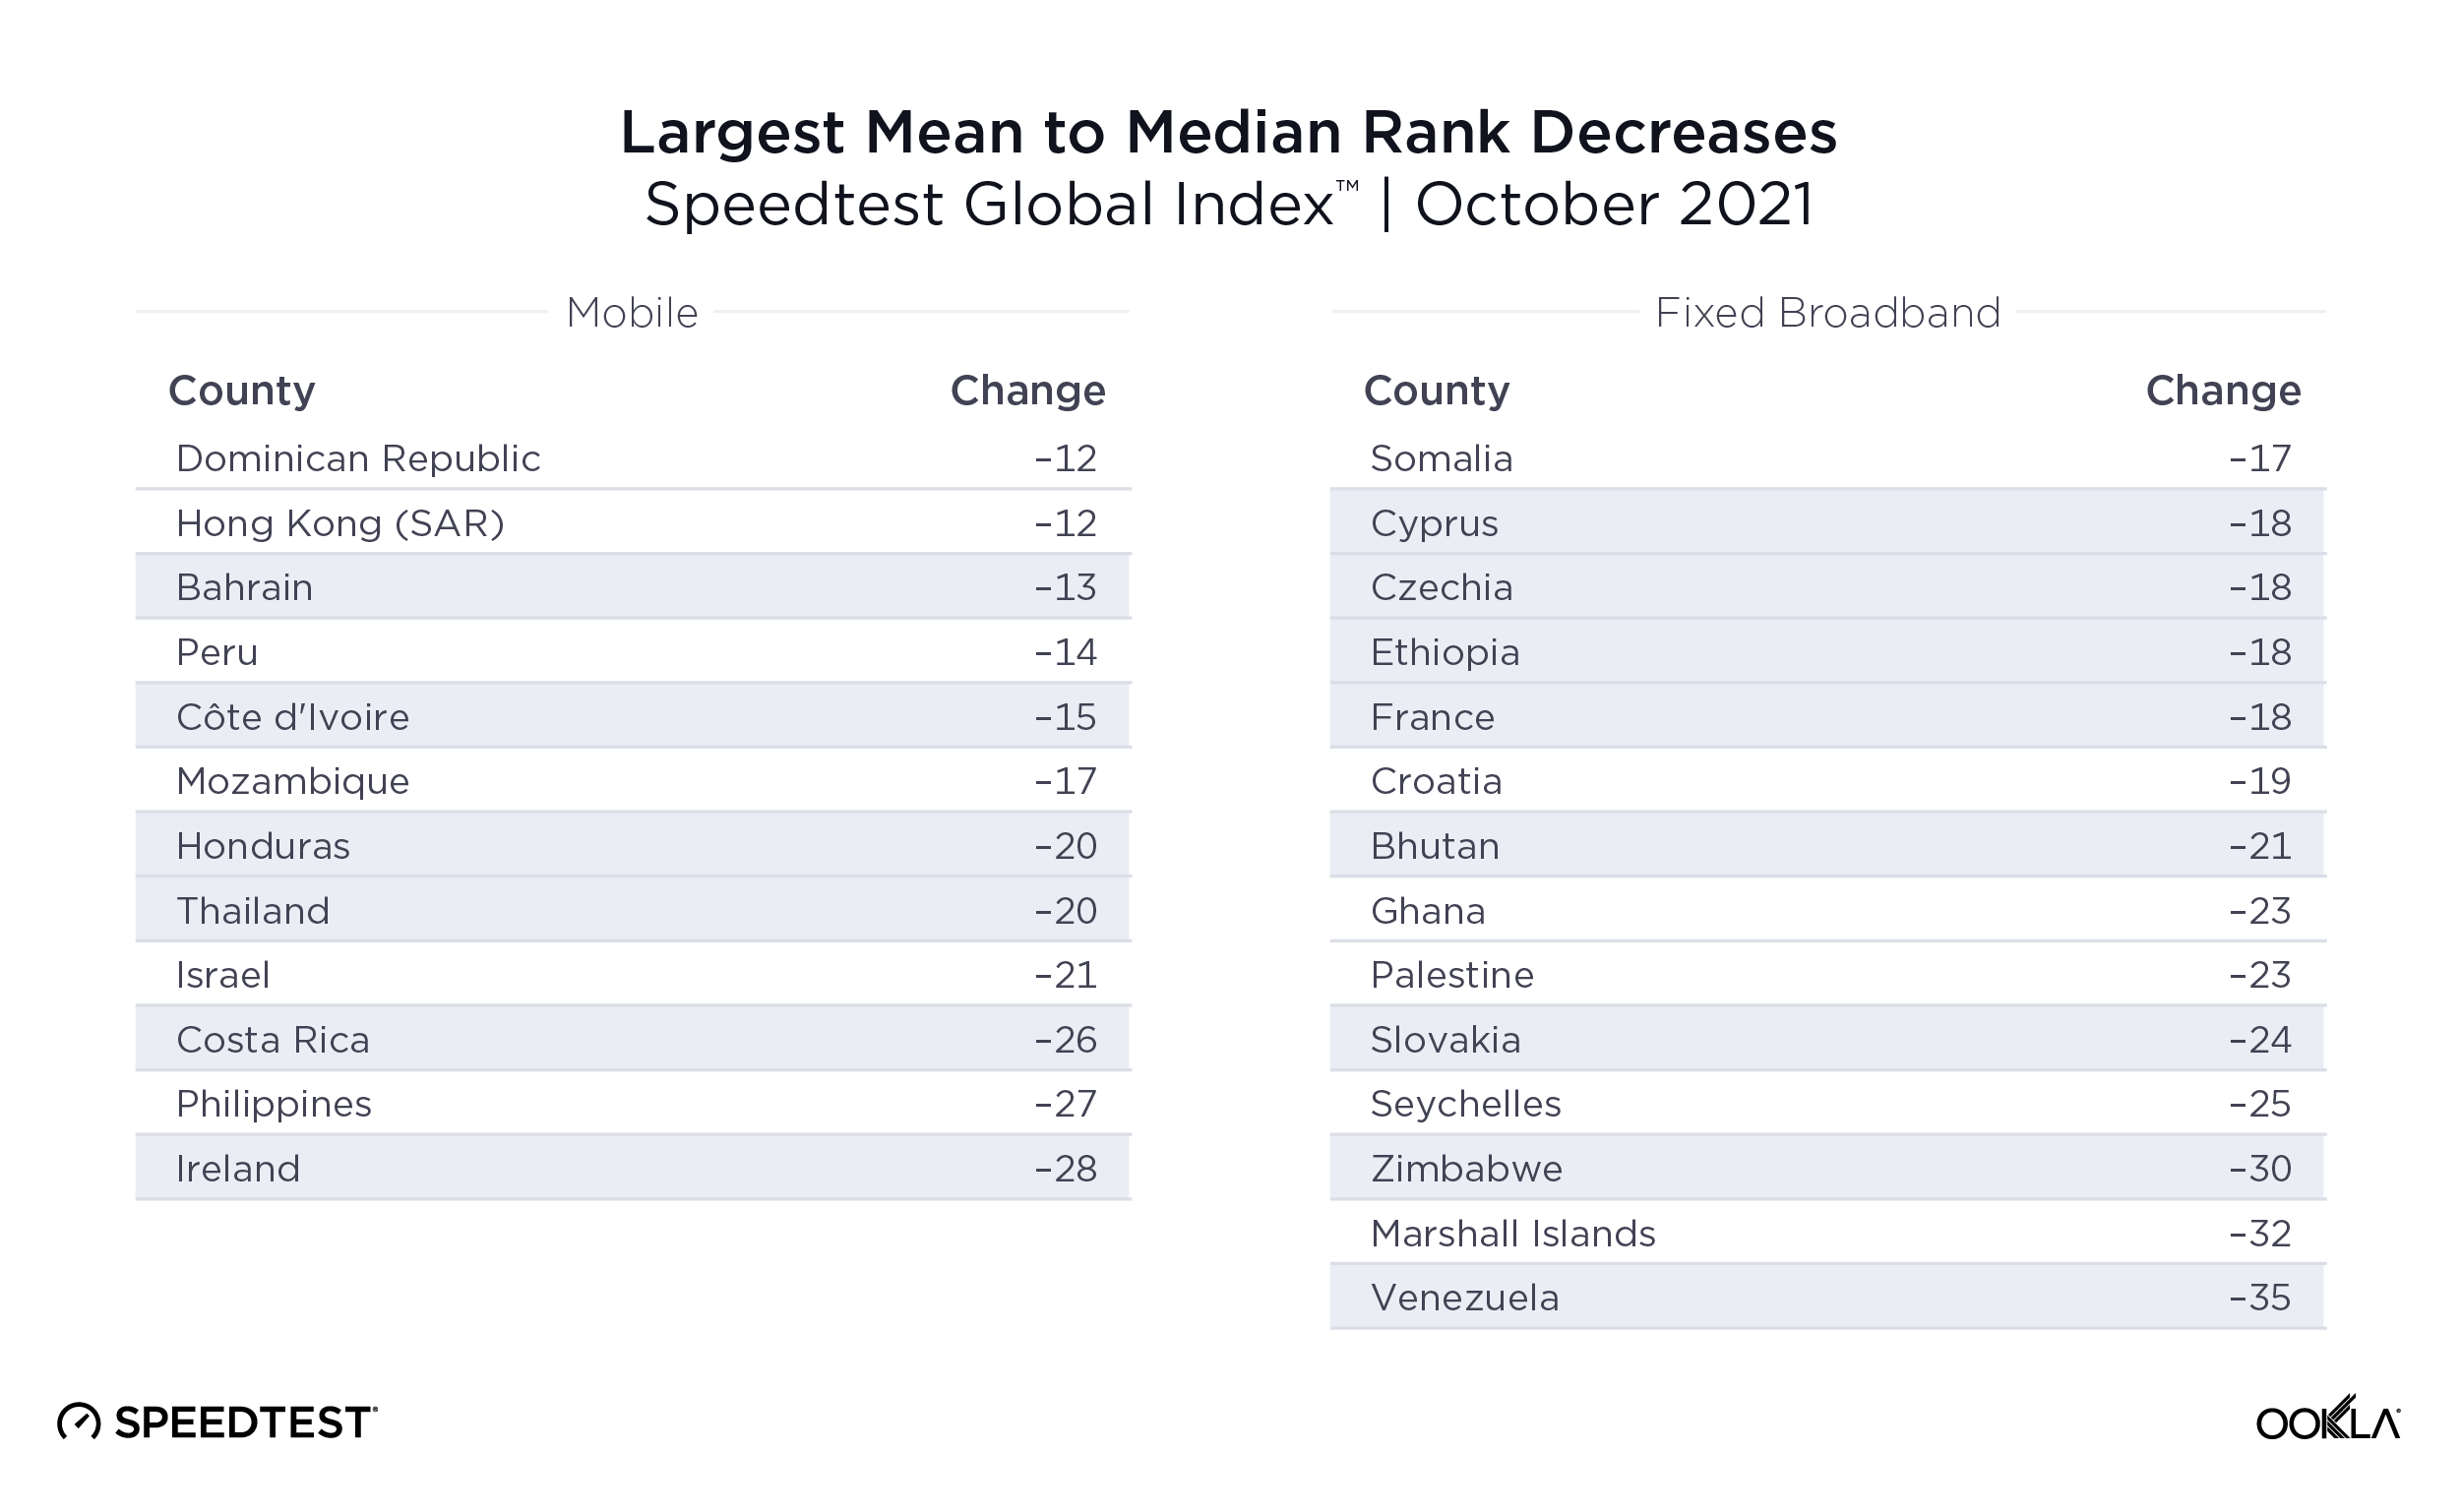
Changing the Speedtest Global Index from mean to median shakes up the global rankings quite a bit. Namibia jumps 23 places on mobile while Ireland drops 28 places on mobile. Countries like South Korea where 5G is well established and widely available see little change in their mobile rankings. On fixed broadband, Algeria sees a dramatic increase of 30 places while Venezuela suffers the largest drop of 35 places. You can see how this affects the top 10 list in the graphic below.

ookla_speedtest_global_index_rank_change_1121-01

In the example we gave above, we saw how rare, but extremely large values can sway the mean. The same is true with extremely low numbers. Countries whose rankings increase with the switch to median were likely held back by small numbers of low-performing tests.

And here are the countries that see the largest changes in rank, both positive and negative.

ookla_speedtest_global_index_rank_increase_1121-01

ookla_speedtest_global_index_rank_decrease_1121-01

The Speedtest Global Index remains the best source for worldwide internet rankings. See how your country is affected by this new view and see how well internet speeds are improving where you live and if everyone is seeing the same benefit.

Editor’s note: This article was updated on April 18 to note the extended deadline for discontinuing the “mean” tab.

Ookla retains ownership of this article including all of the intellectual property rights, data, content graphs and analysis. This article may not be quoted, reproduced, distributed or published for any commercial purpose without prior consent. Members of the press and others using the findings in this article for non-commercial purposes are welcome to publicly share and link to report information with attribution to Ookla.

| October 15, 2021

How Banks and Financial Services Companies can Detect Outages Faster [Webinar]

The shift from in-person to online banking has been under way for years, but the pandemic has cemented digital banking as the new normal for most consumers. As a result, it’s critical to effectively communicate and resolve issues when customers experience a disruption in your service. Diagnosing the issue and detecting problems with external services can be challenging for technical operations and IT management teams — especially when internal monitoring tools don’t detect any problems. That’s where Downdetector® comes in.

Over 25 million consumers report problems each month with online banking, financial services companies, internet service providers and other websites and services. Downdetector can alert you when customers are reporting issues with your services — often long before internal monitoring tools send out the alarm. By monitoring your company, external services like content delivery networks (CDNs) and web hosting platforms, internal productivity tools and your customers’ sentiment surrounding emergent problems, your team can troubleshoot issues faster, decrease mean time to recovery (MTTR) and provide your customers with better, more contextual support.

The upcoming Downdetector webinar on Oct. 28 will show you how some of the world’s leading banks and financial service providers are using Downdetector Enterprise to detect and resolve issues faster, as well as manage the customer experience during an issue.

Read on to discover three ways Downdetector Enterprise can help banks and financial service providers detect issues faster and improve the customer experience during an incident.


Conduct competitive benchmarking and monitor external services your company relies on

After an incident occurs, business intelligence and incident management teams are often pressed to answer the questions: “Did our competitors experience similar problems?” and “Was the issue a problem with our services or an external service our company relies on, such as a downstream payment processor?”

Downdetector Enterprise makes it easy for teams to answer these questions with competitive intelligence and analysis of the services your company relies on.

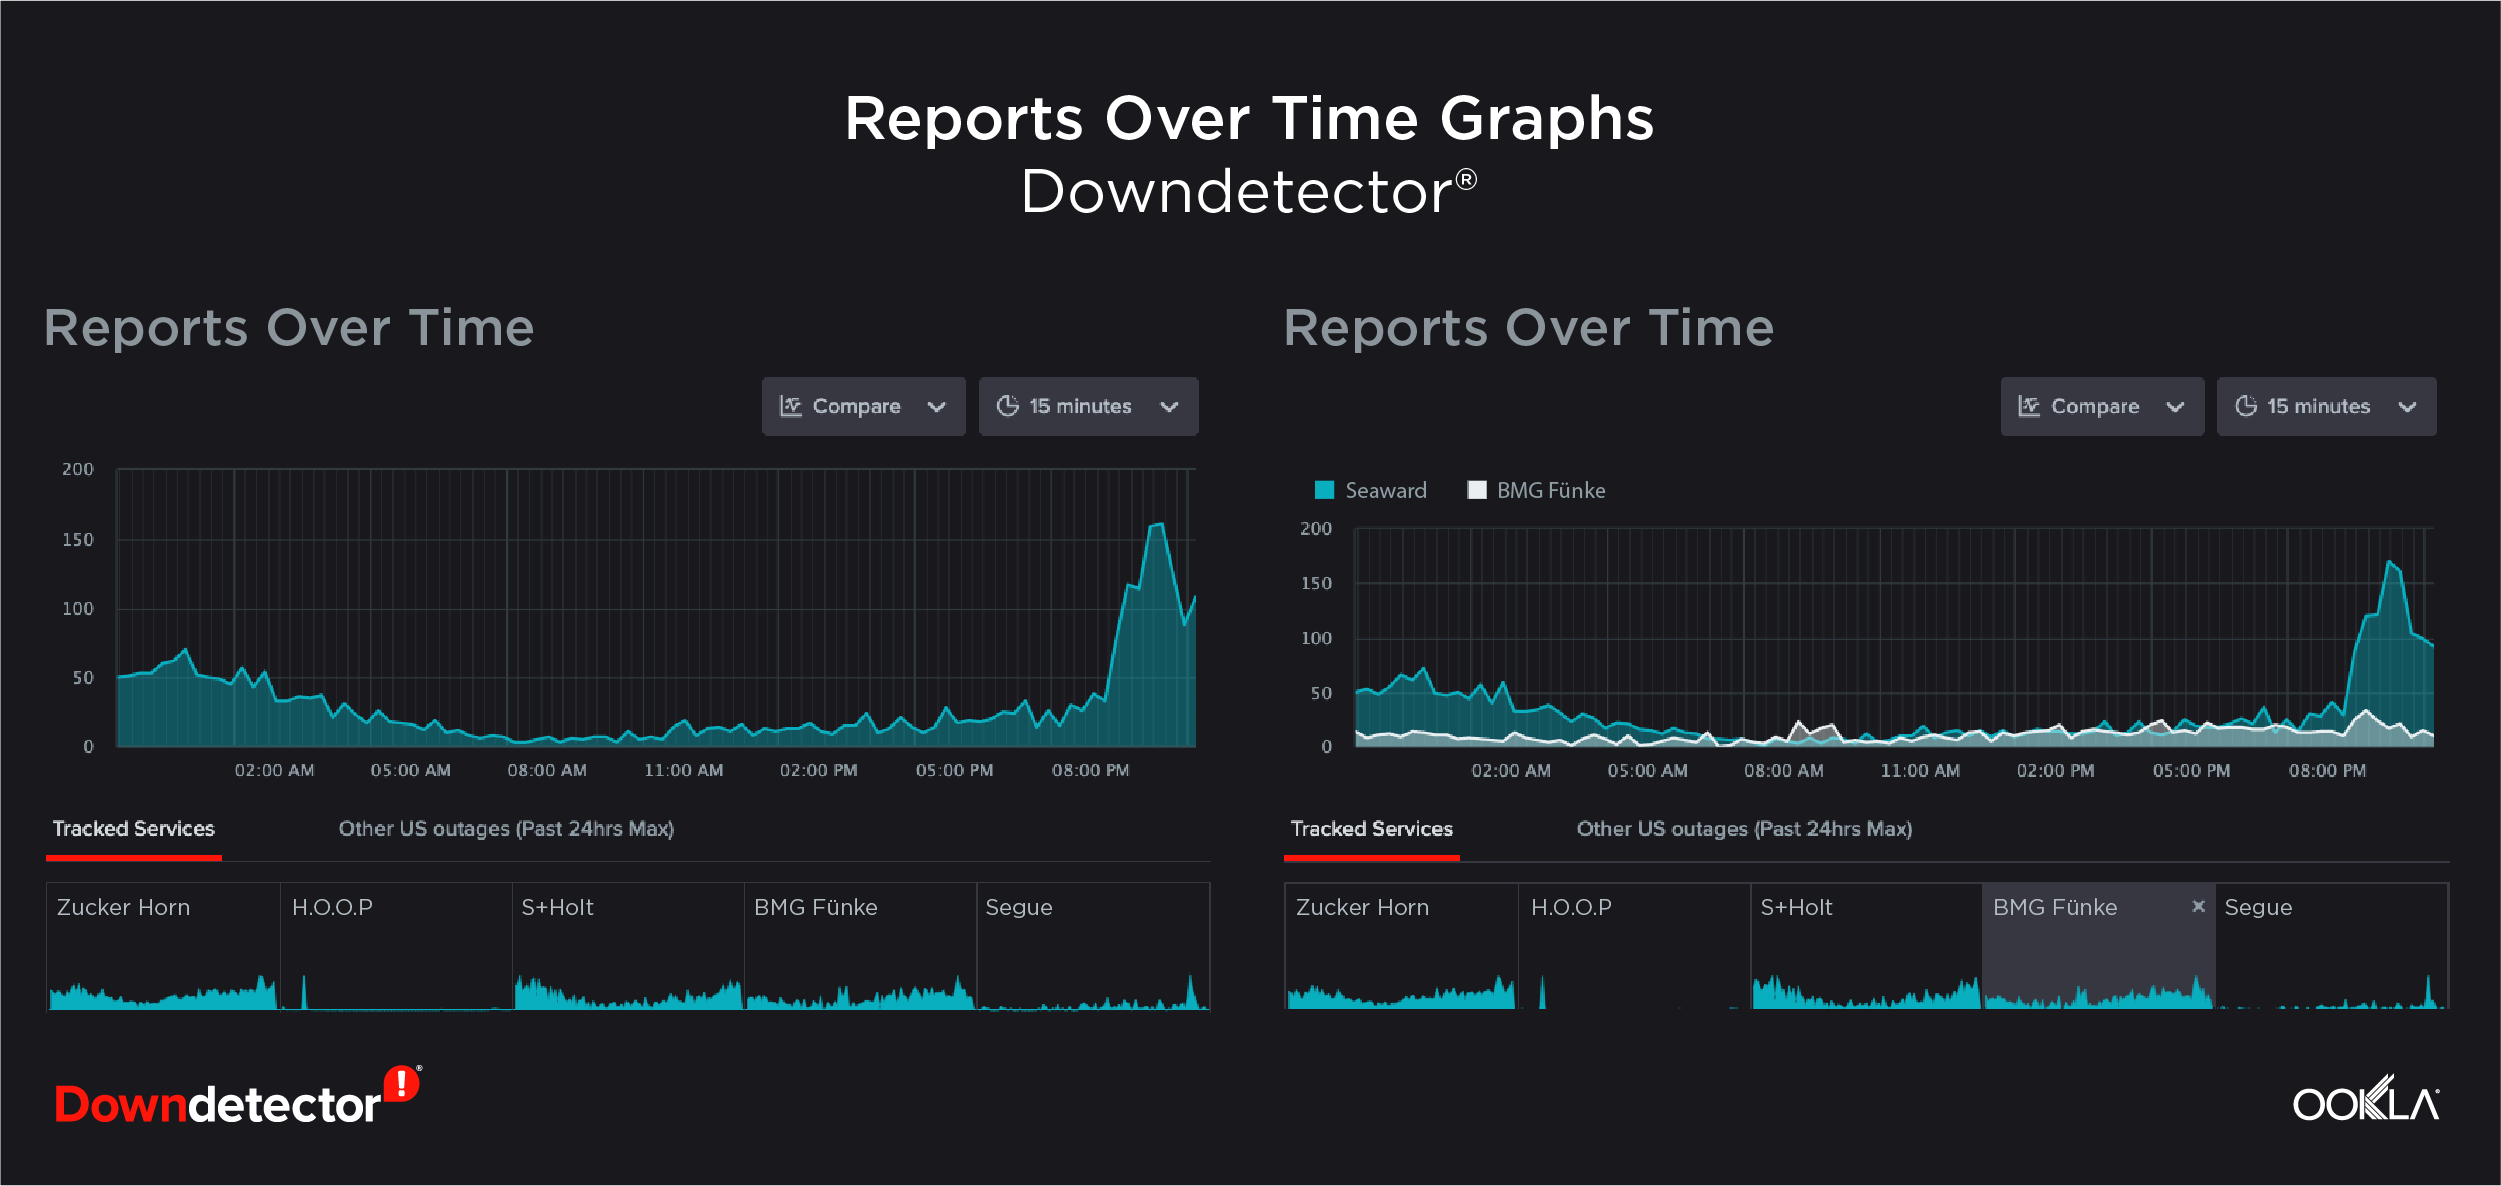
downdetector_enterprise_compare_1021

Teams can get visibility into competitors’ problem reports on Downdetector, which offers quick insight into whether or not competitors are facing similar issues. If internal monitoring tools aren’t indicating that there’s an issue, this view can also help you diagnose if an external service, such as a CDN, is experiencing similar patterns in elevated problem reports, you can infer that it might be an issue with the CDN impacting customers.

Access real-time and historical data to validate internal monitoring

Banks and financial service companies often look to Downdetector’s real-time and historical data to validate whether findings in internal monitoring tools have impacted customer experience — or fill in the gaps when internal monitoring tools don’t detect a known problem.

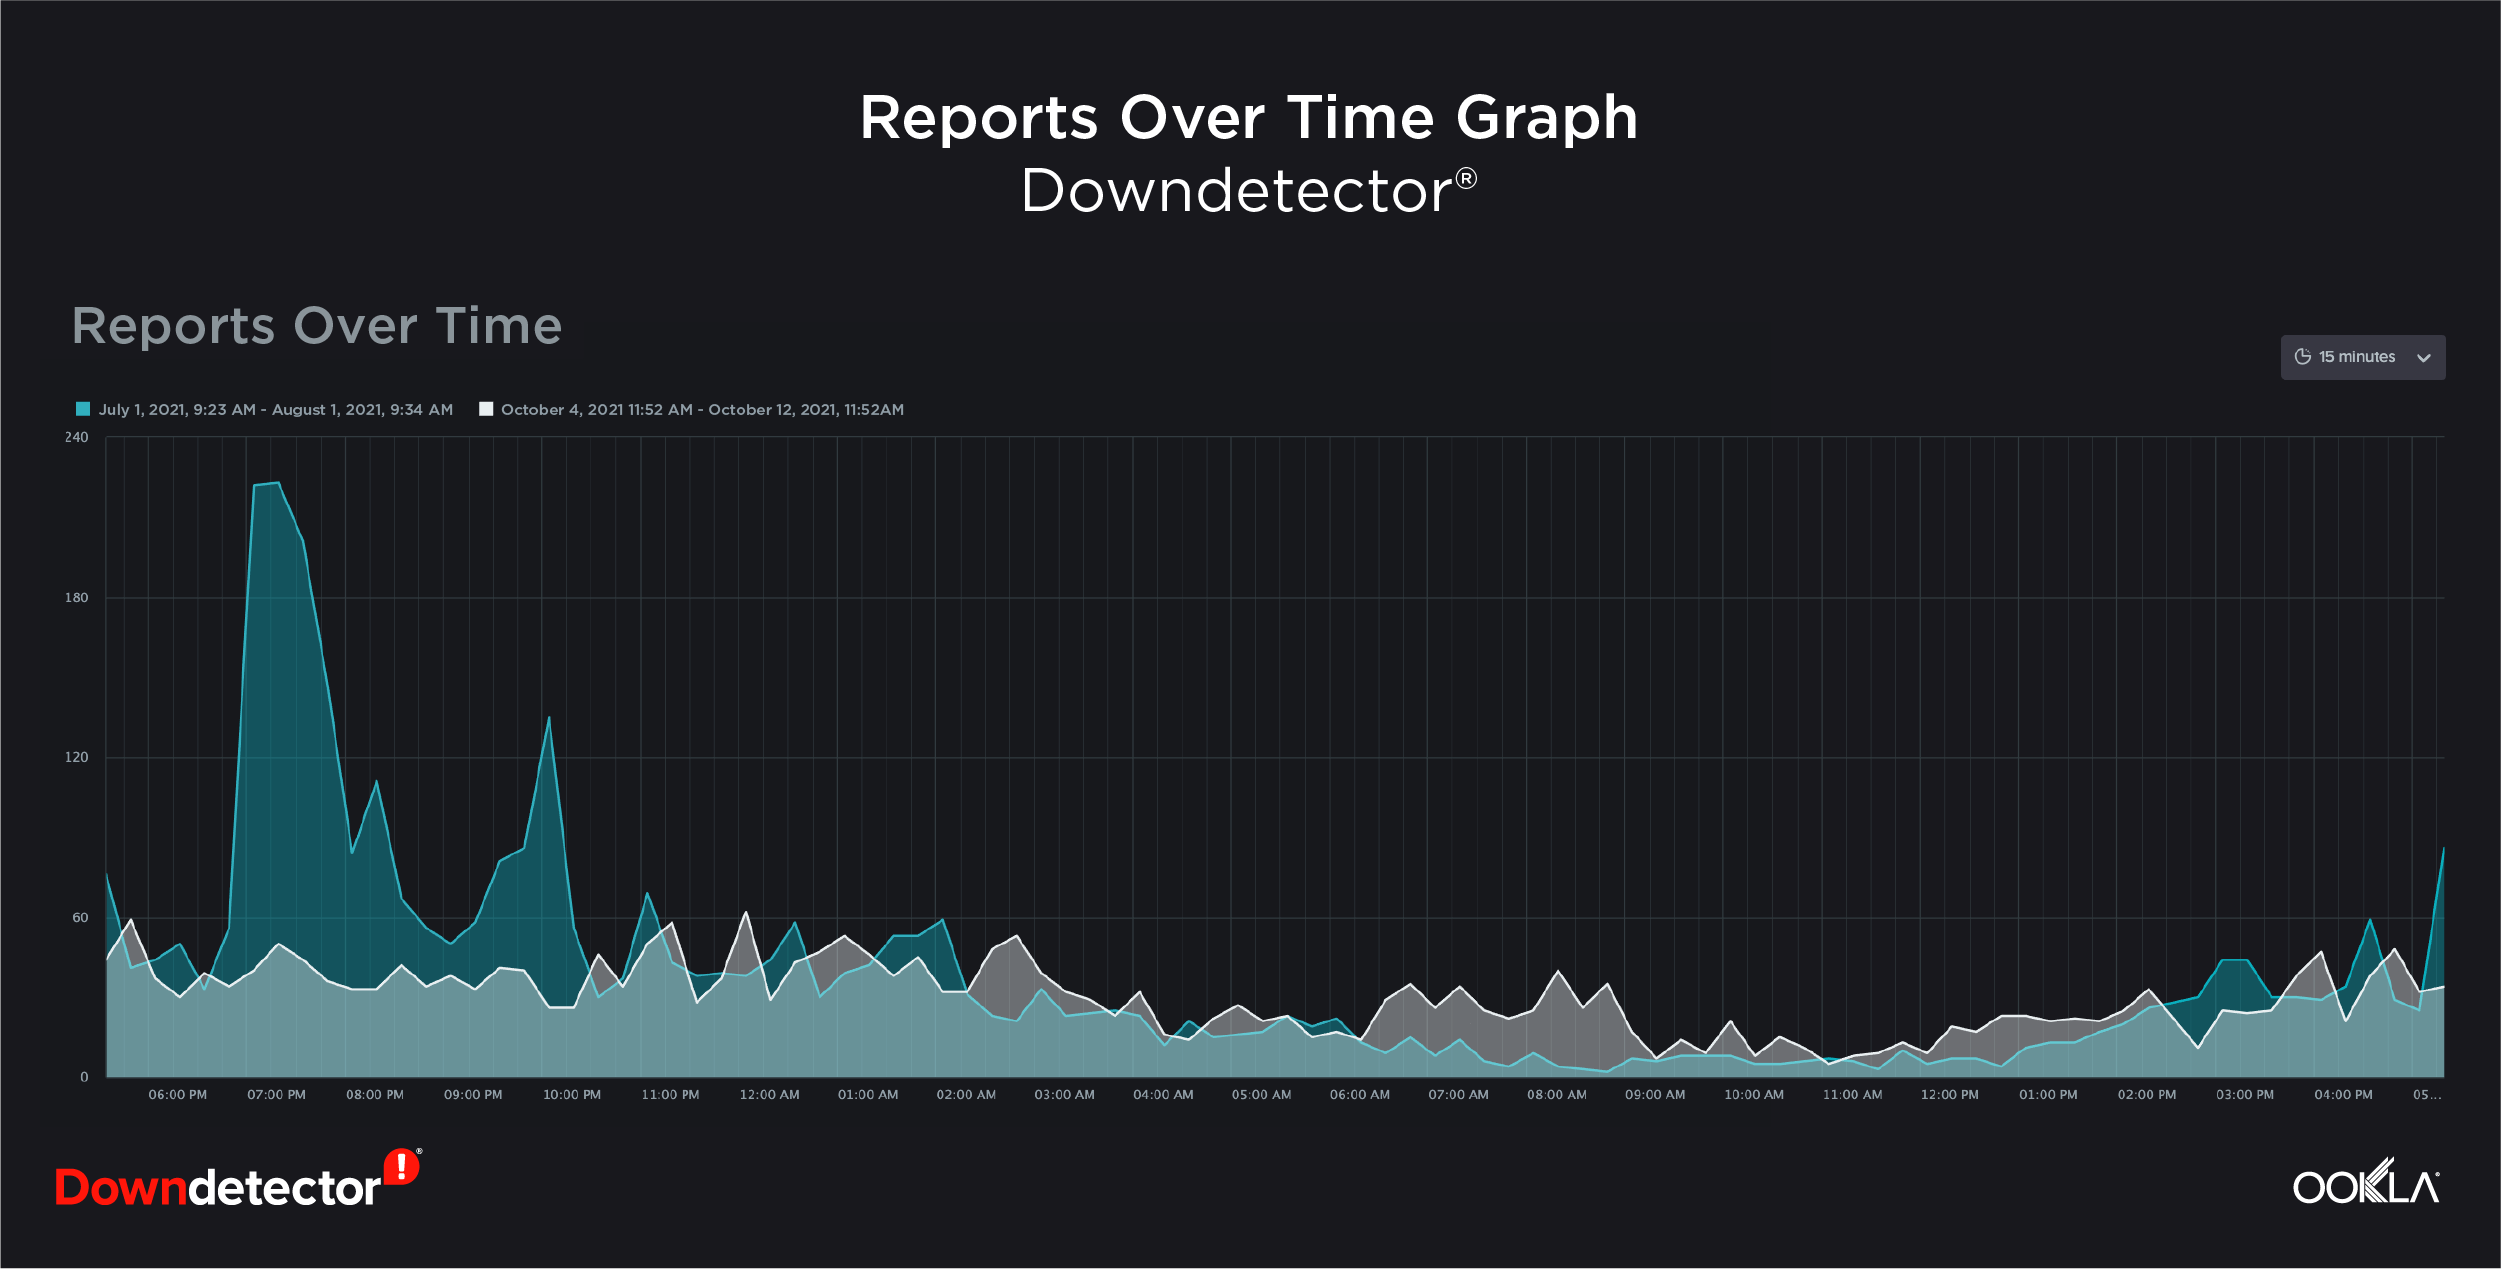
For example, during the Facebook outage Oct. 4, 2021, a Fortune 500 bank turned to Downdetector Enterprise when problem reports escalated — but their internal monitoring systems hadn’t detected any problems. They were able to use data from Downdetector Enterprise to see that Facebook was experiencing issues. From there, they were able to determine that problem reports weren’t due to an internal problem, and then communicate to their customer base that issues were likely related to Facebook’s outage.

downdetector_enterprise_reports-over-time-historical_1021

However, if the incident is determined to be internal, business intelligence teams can use Downdetector Enterprise to analyze historical outage information to spot any patterns. Historical data can also be used for reporting and compliance purposes, such as communication with a regulatory body after customers have reported an incident. The Downdetector API makes it easy to integrate and surface this data directly in your existing tools.

Directly communicate with customers who report an issue on Downdetector

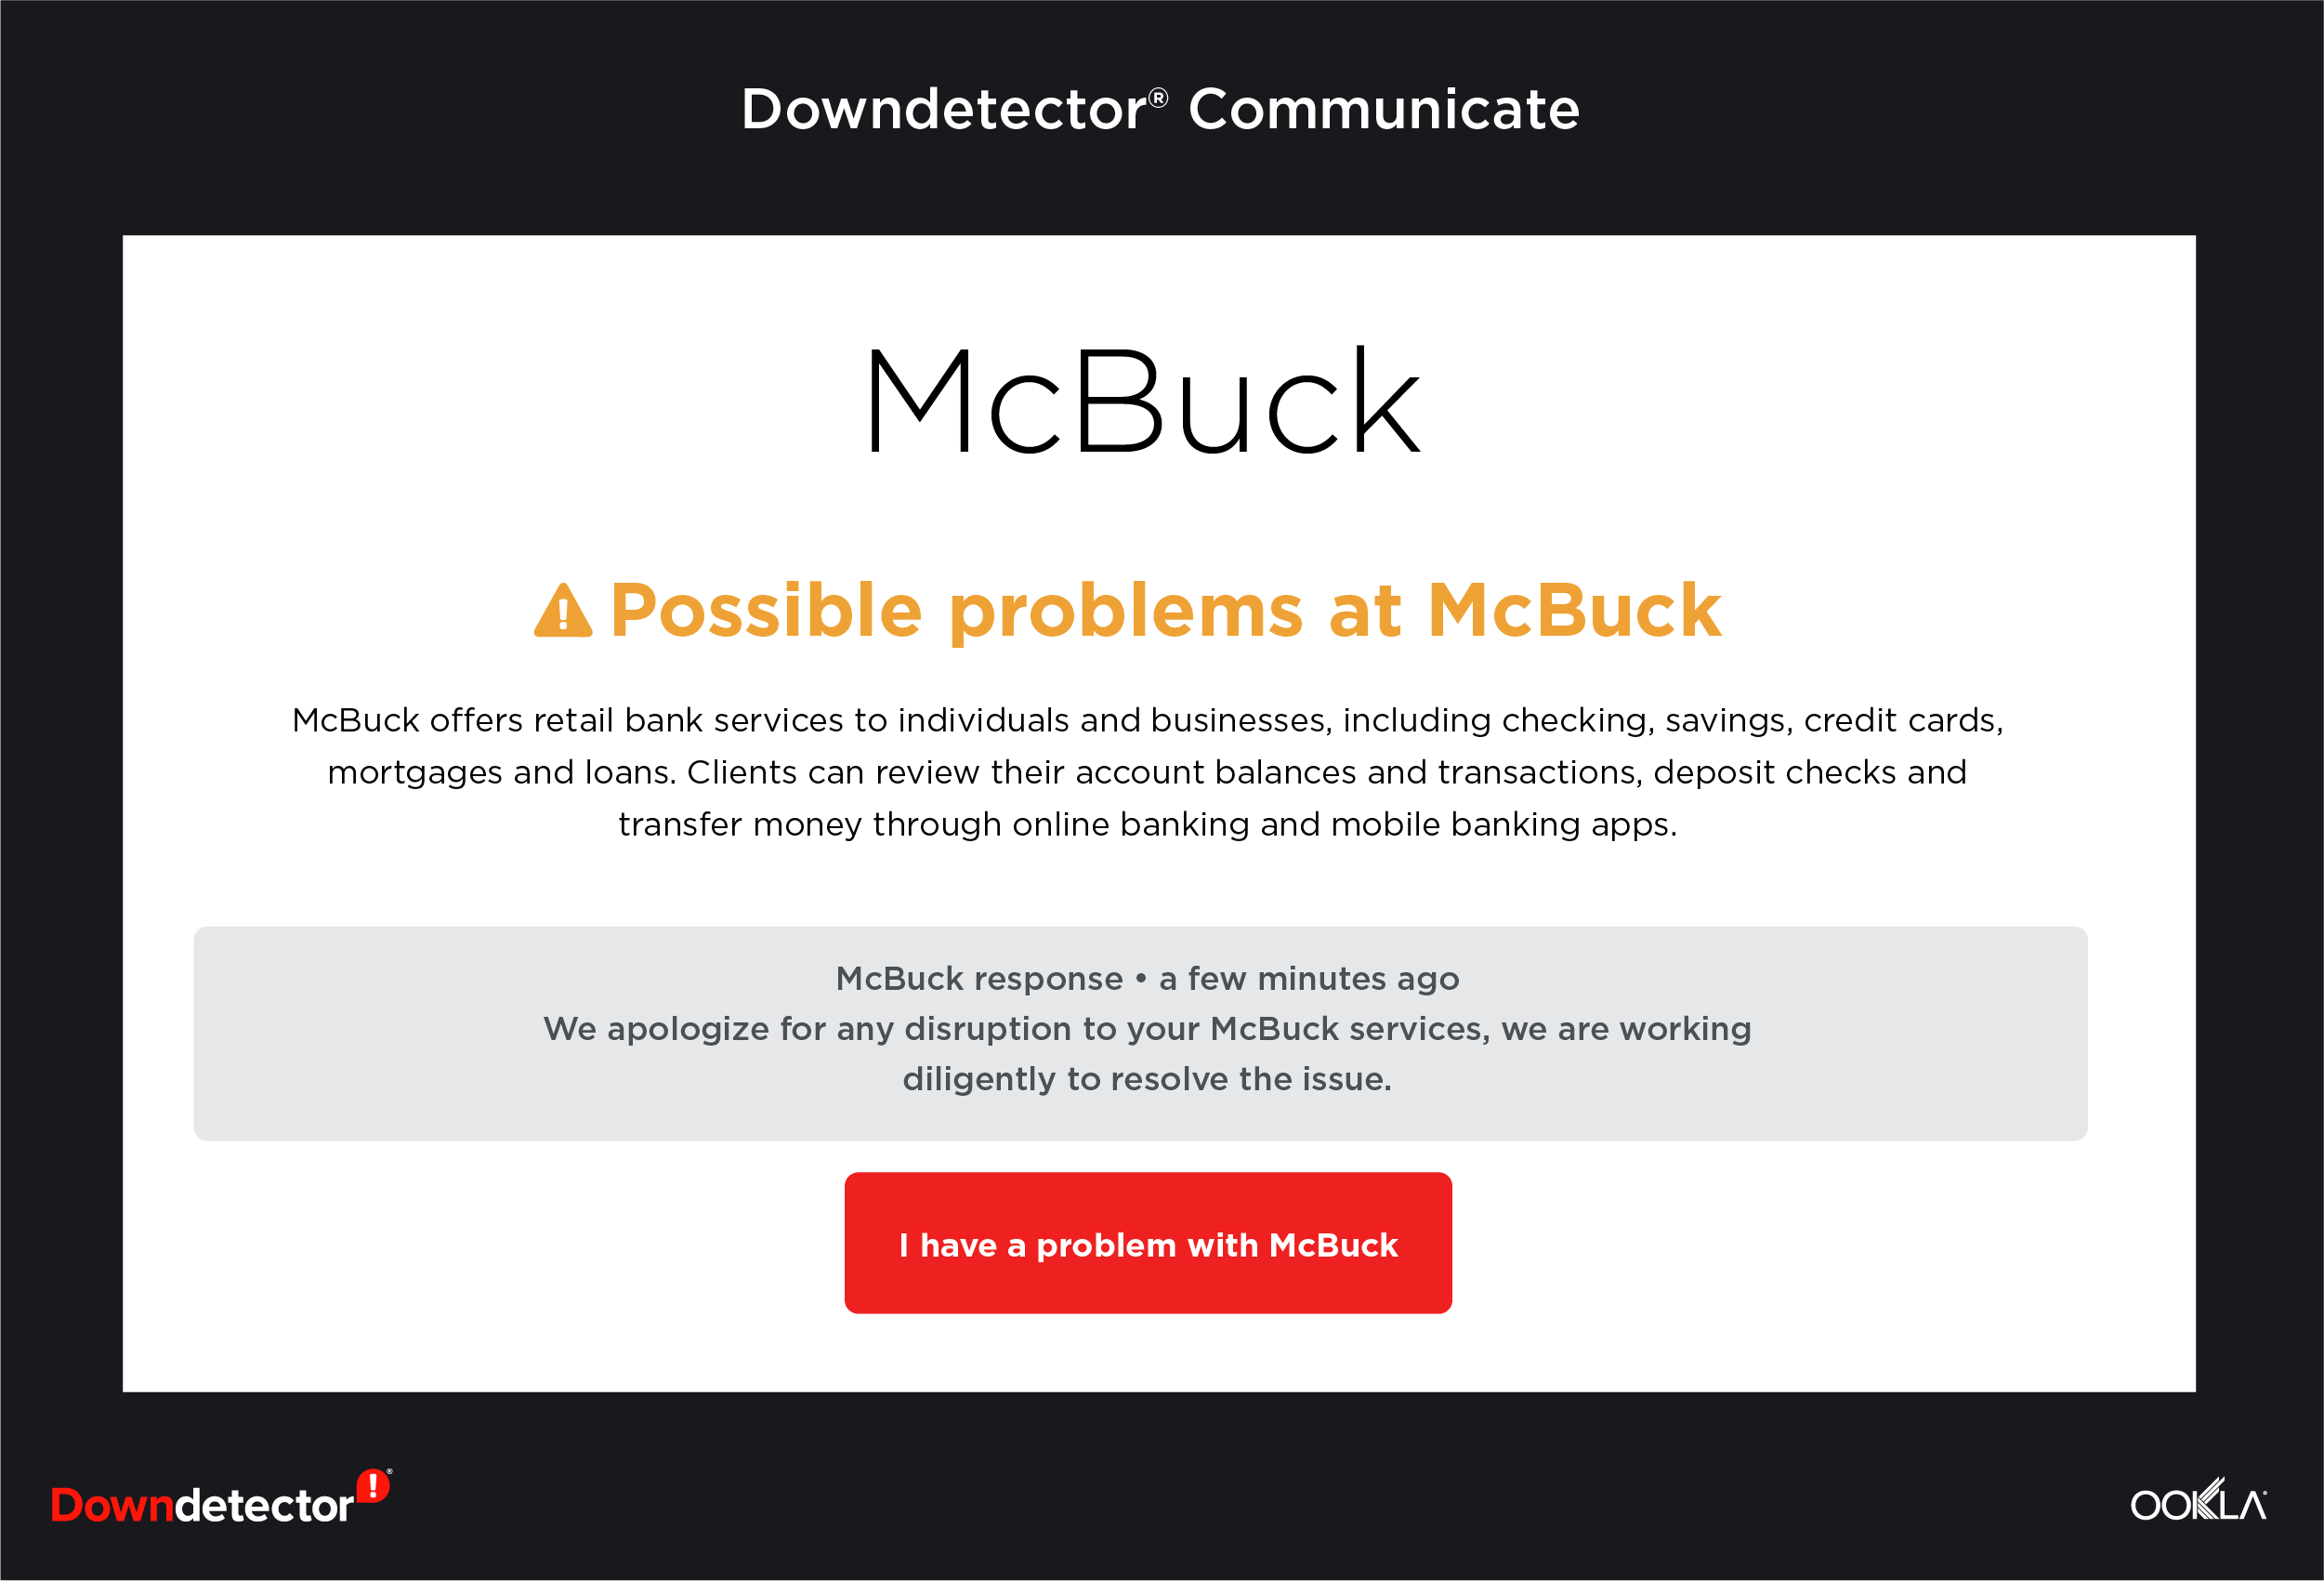
Companies that don’t provide timely, contextual communication during an incident are likely to see dissatisfied customers flooding social media and customer support channels looking for answers. Downdetector allows companies to provide direct communication to customers reporting issues with specific aspects of your service, such as mobile banking or payments.

downdetector_enterprise_communicate_1021

This additional communication channel is available even if your website or other services go down — and typically helps lower call center and digital support ticket volume.

Ready to see how leading U.S. and European banks have improved their incident management and customer experience using customer-reported data? Join the upcoming webinar; all registrants will receive a link to the recorded presentation.


Ookla retains ownership of this article including all of the intellectual property rights, data, content graphs and analysis. This article may not be quoted, reproduced, distributed or published for any commercial purpose without prior consent. Members of the press and others using the findings in this article for non-commercial purposes are welcome to publicly share and link to report information with attribution to Ookla.

| October 7, 2021

Improving Customer Experience During a Network Outage: A Tale of Two Operators


Network outages are inevitable. According to a study done by Heavy Reading, mobile network operators experience five outages per year on average — and according to consumer-reported information from Downdetector®, some operators experience many more service issues. During an outage, it’s critical that operators provide their customers with a clear path to a satisfying resolution. As we saw Monday, when Facebook’s outage impacted the perceived availability of many network operators around the world, it’s especially important to be able to manage the customer experience when an OTT service provider goes down.

Since most consumers don’t want to sit on hold with a busy call center — or simply can’t make the call if the outage has impacted their voice services — it’s crucial to provide digital support. Without a clear path to resolve their issues, customers will often turn to external platforms, such as Downdetector and Twitter, to voice their frustrations. When customers turn to external platforms, operators may find themselves trending for the wrong reasons.

Consumers respond best to timely, contextual communication around problems with their mobile network. Do you have the tools to proactively communicate network status, known issues and impending improvements to your subscribers? In this article we will take a closer look at two leading mobile network operators who have very different paths for digital customer engagement during an outage. When major outages occurred for each network earlier this year, they faced vastly different customer responses, as measured by Downdetector.

Using consumer-reported outage information for early alerting

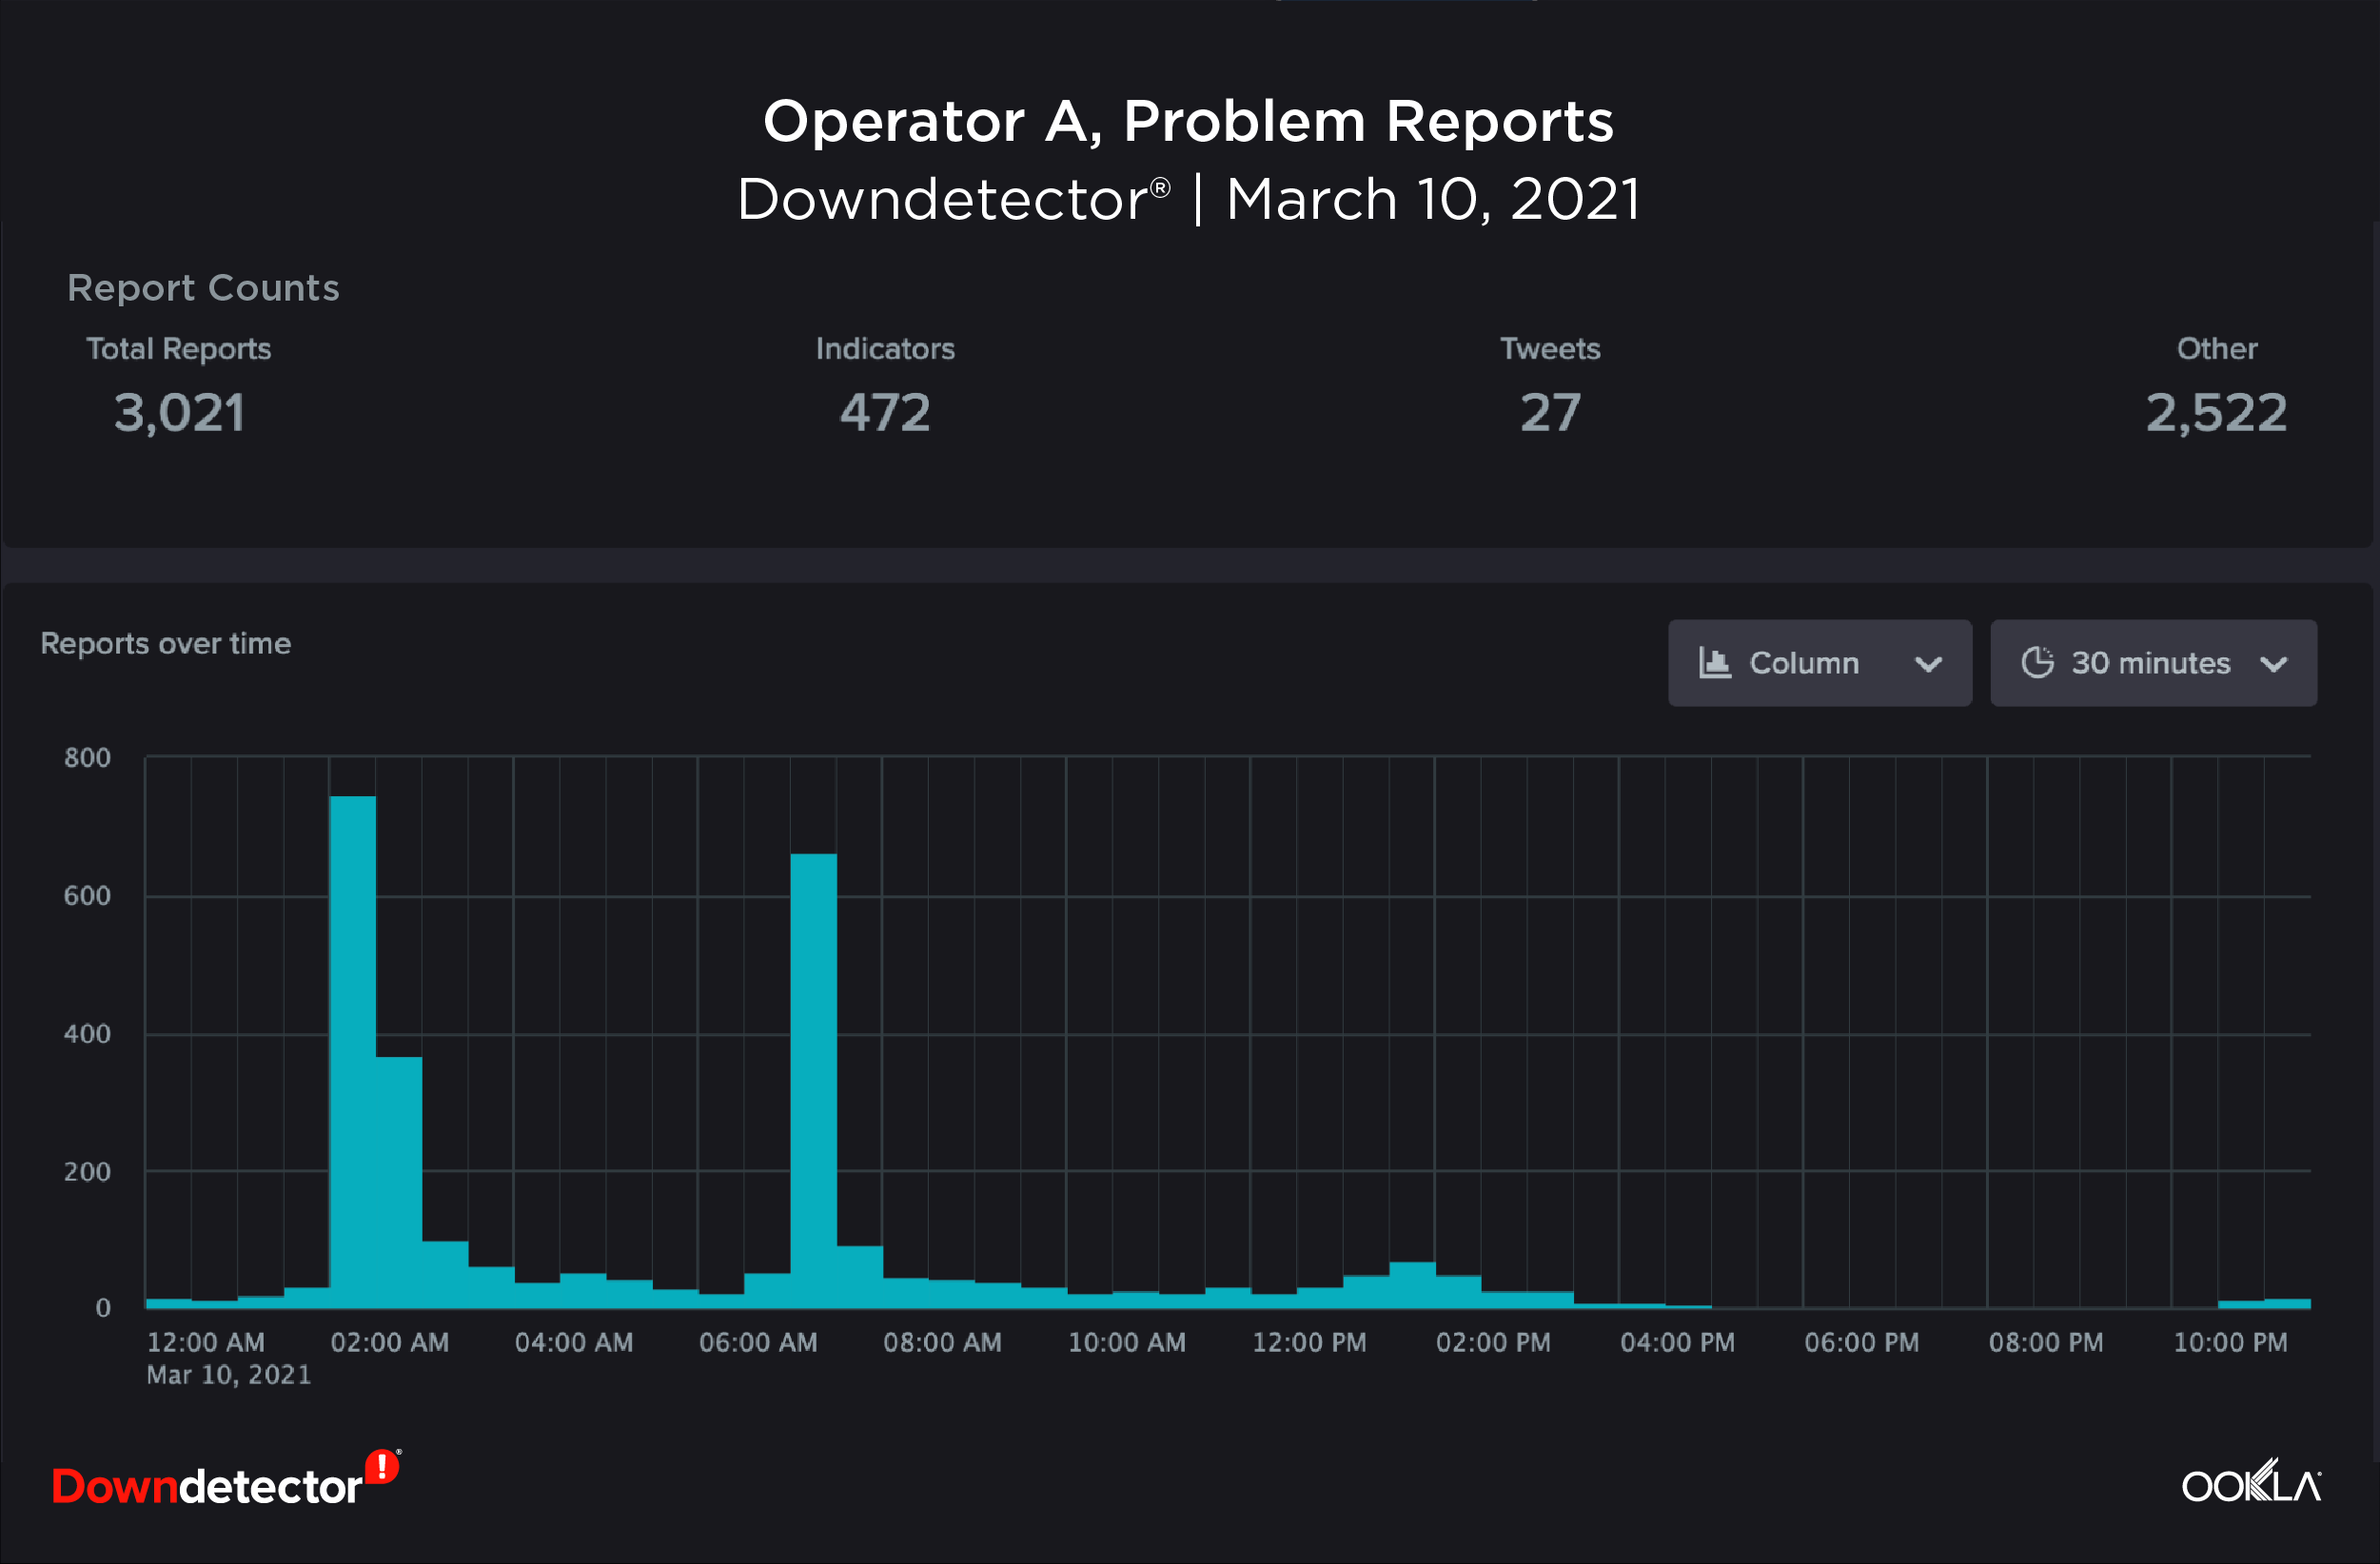
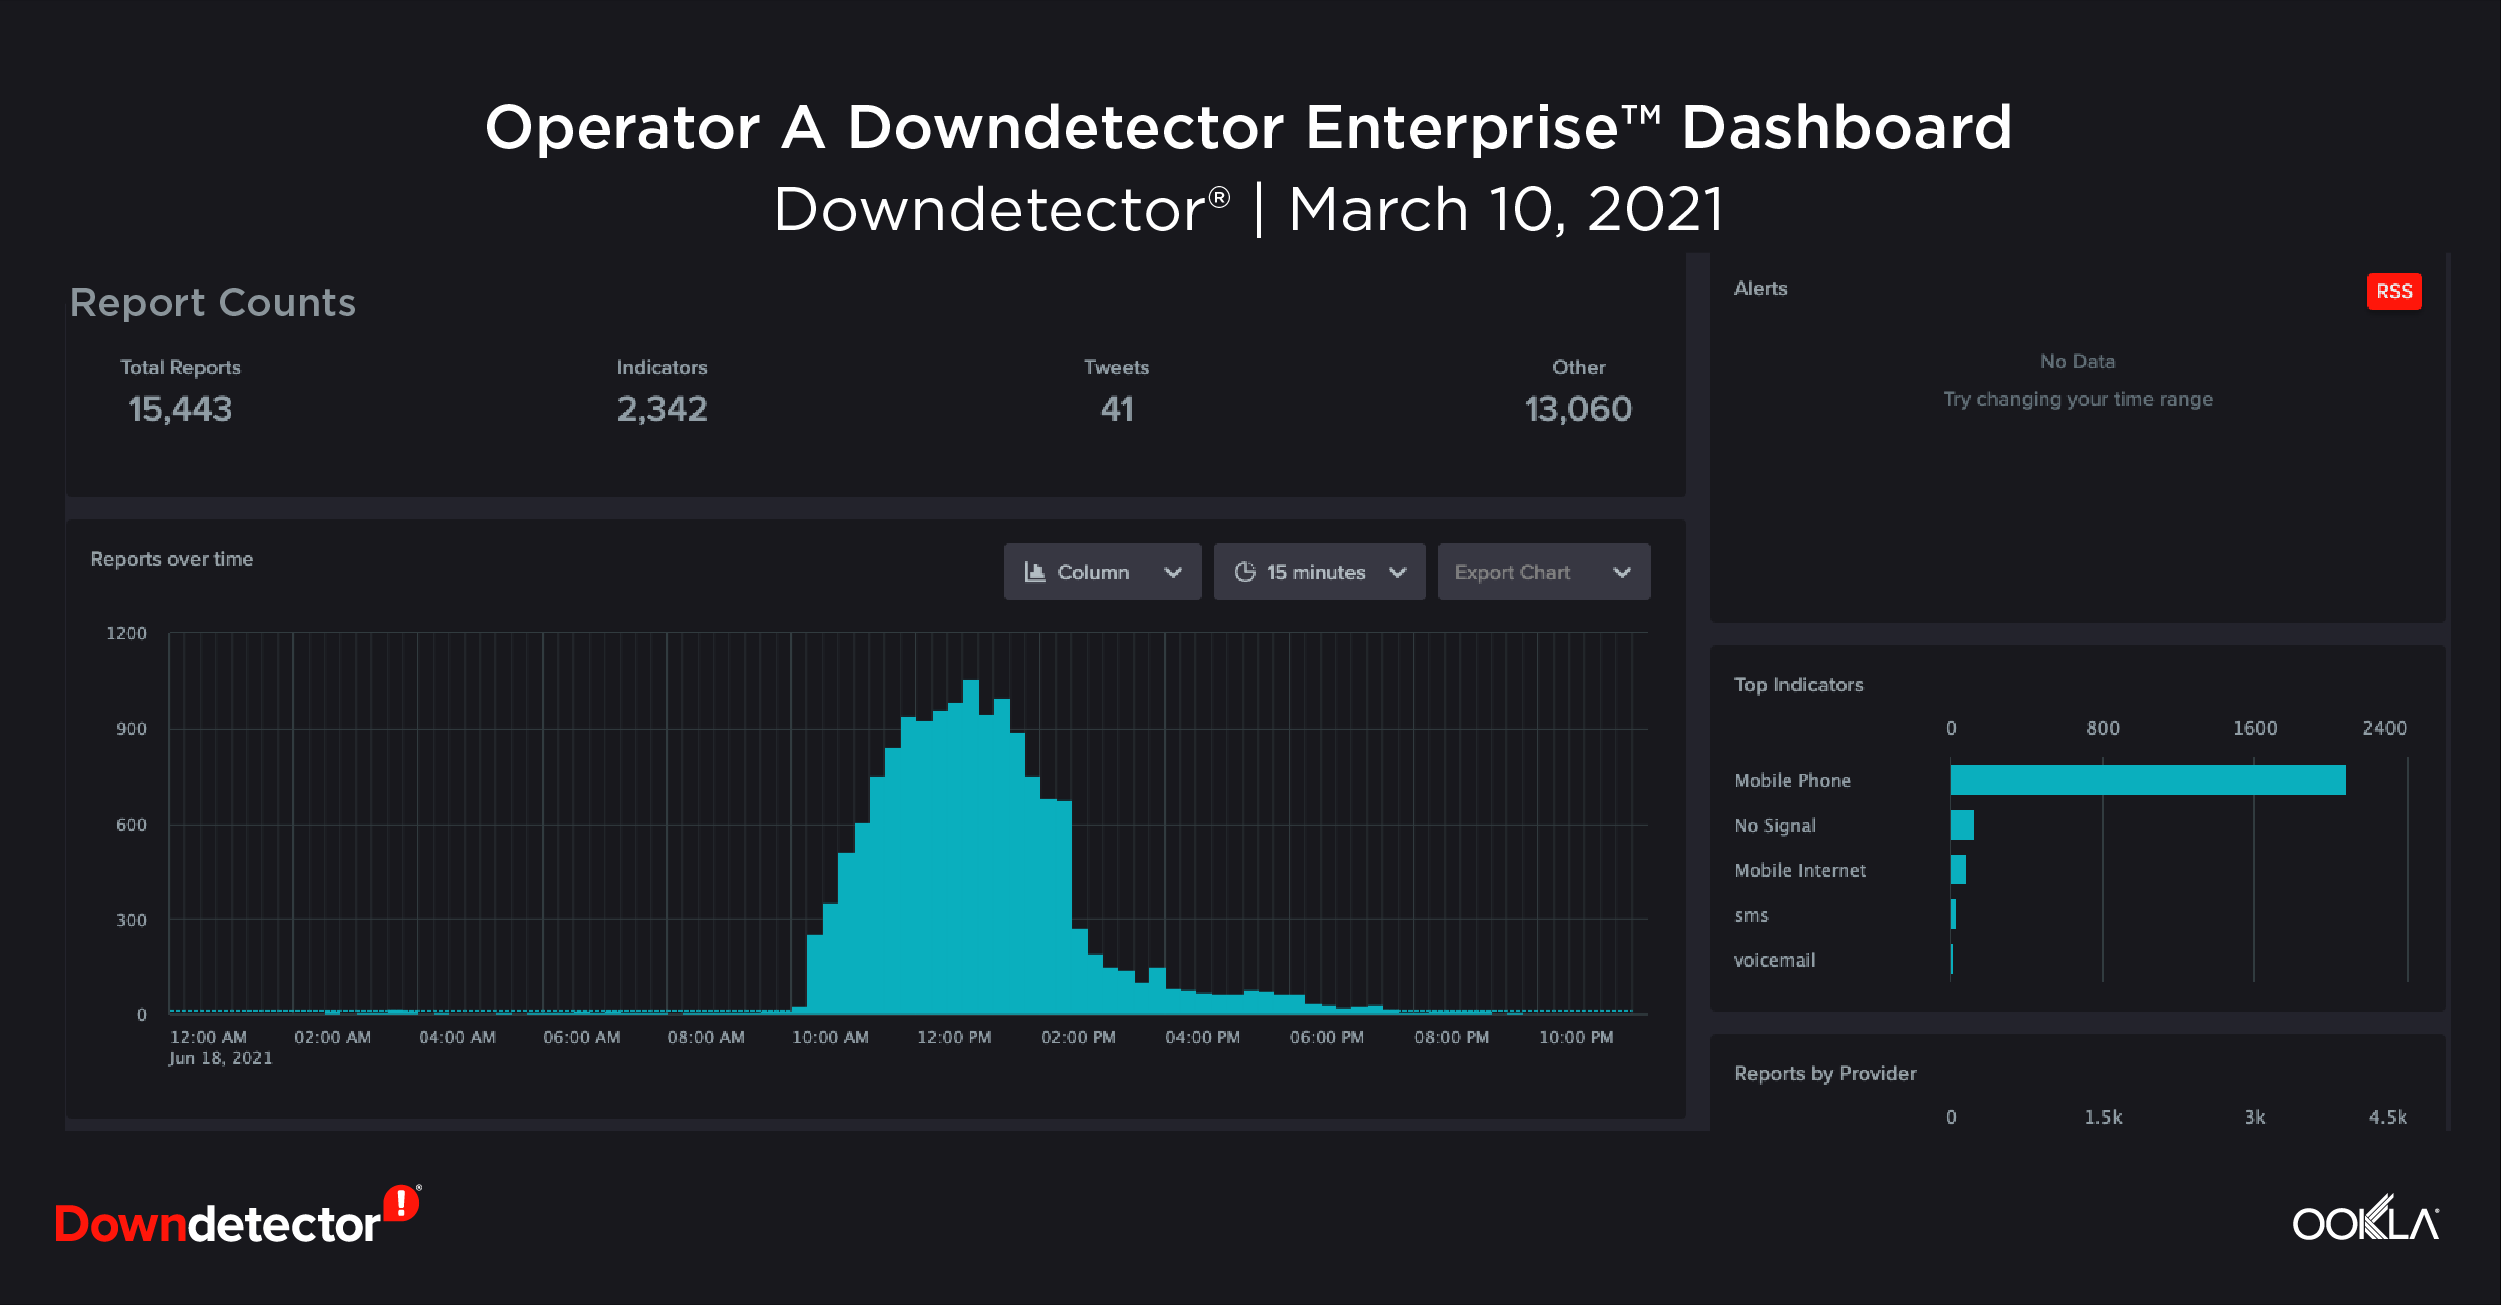
According to data from Downdetector, the world’s most popular platform for user-reported service status information, Operator A experienced elevated problem reports on March 10, 2021.
downdetector_a_problem-reports_0921

downdetector_a_top-indicators_0921

We can see that during this 24-hour period Operator A had a total of 3,021 problem reports. In the report counts chart we can see that there were only 27 customer tweets related to Operator A’s incident.

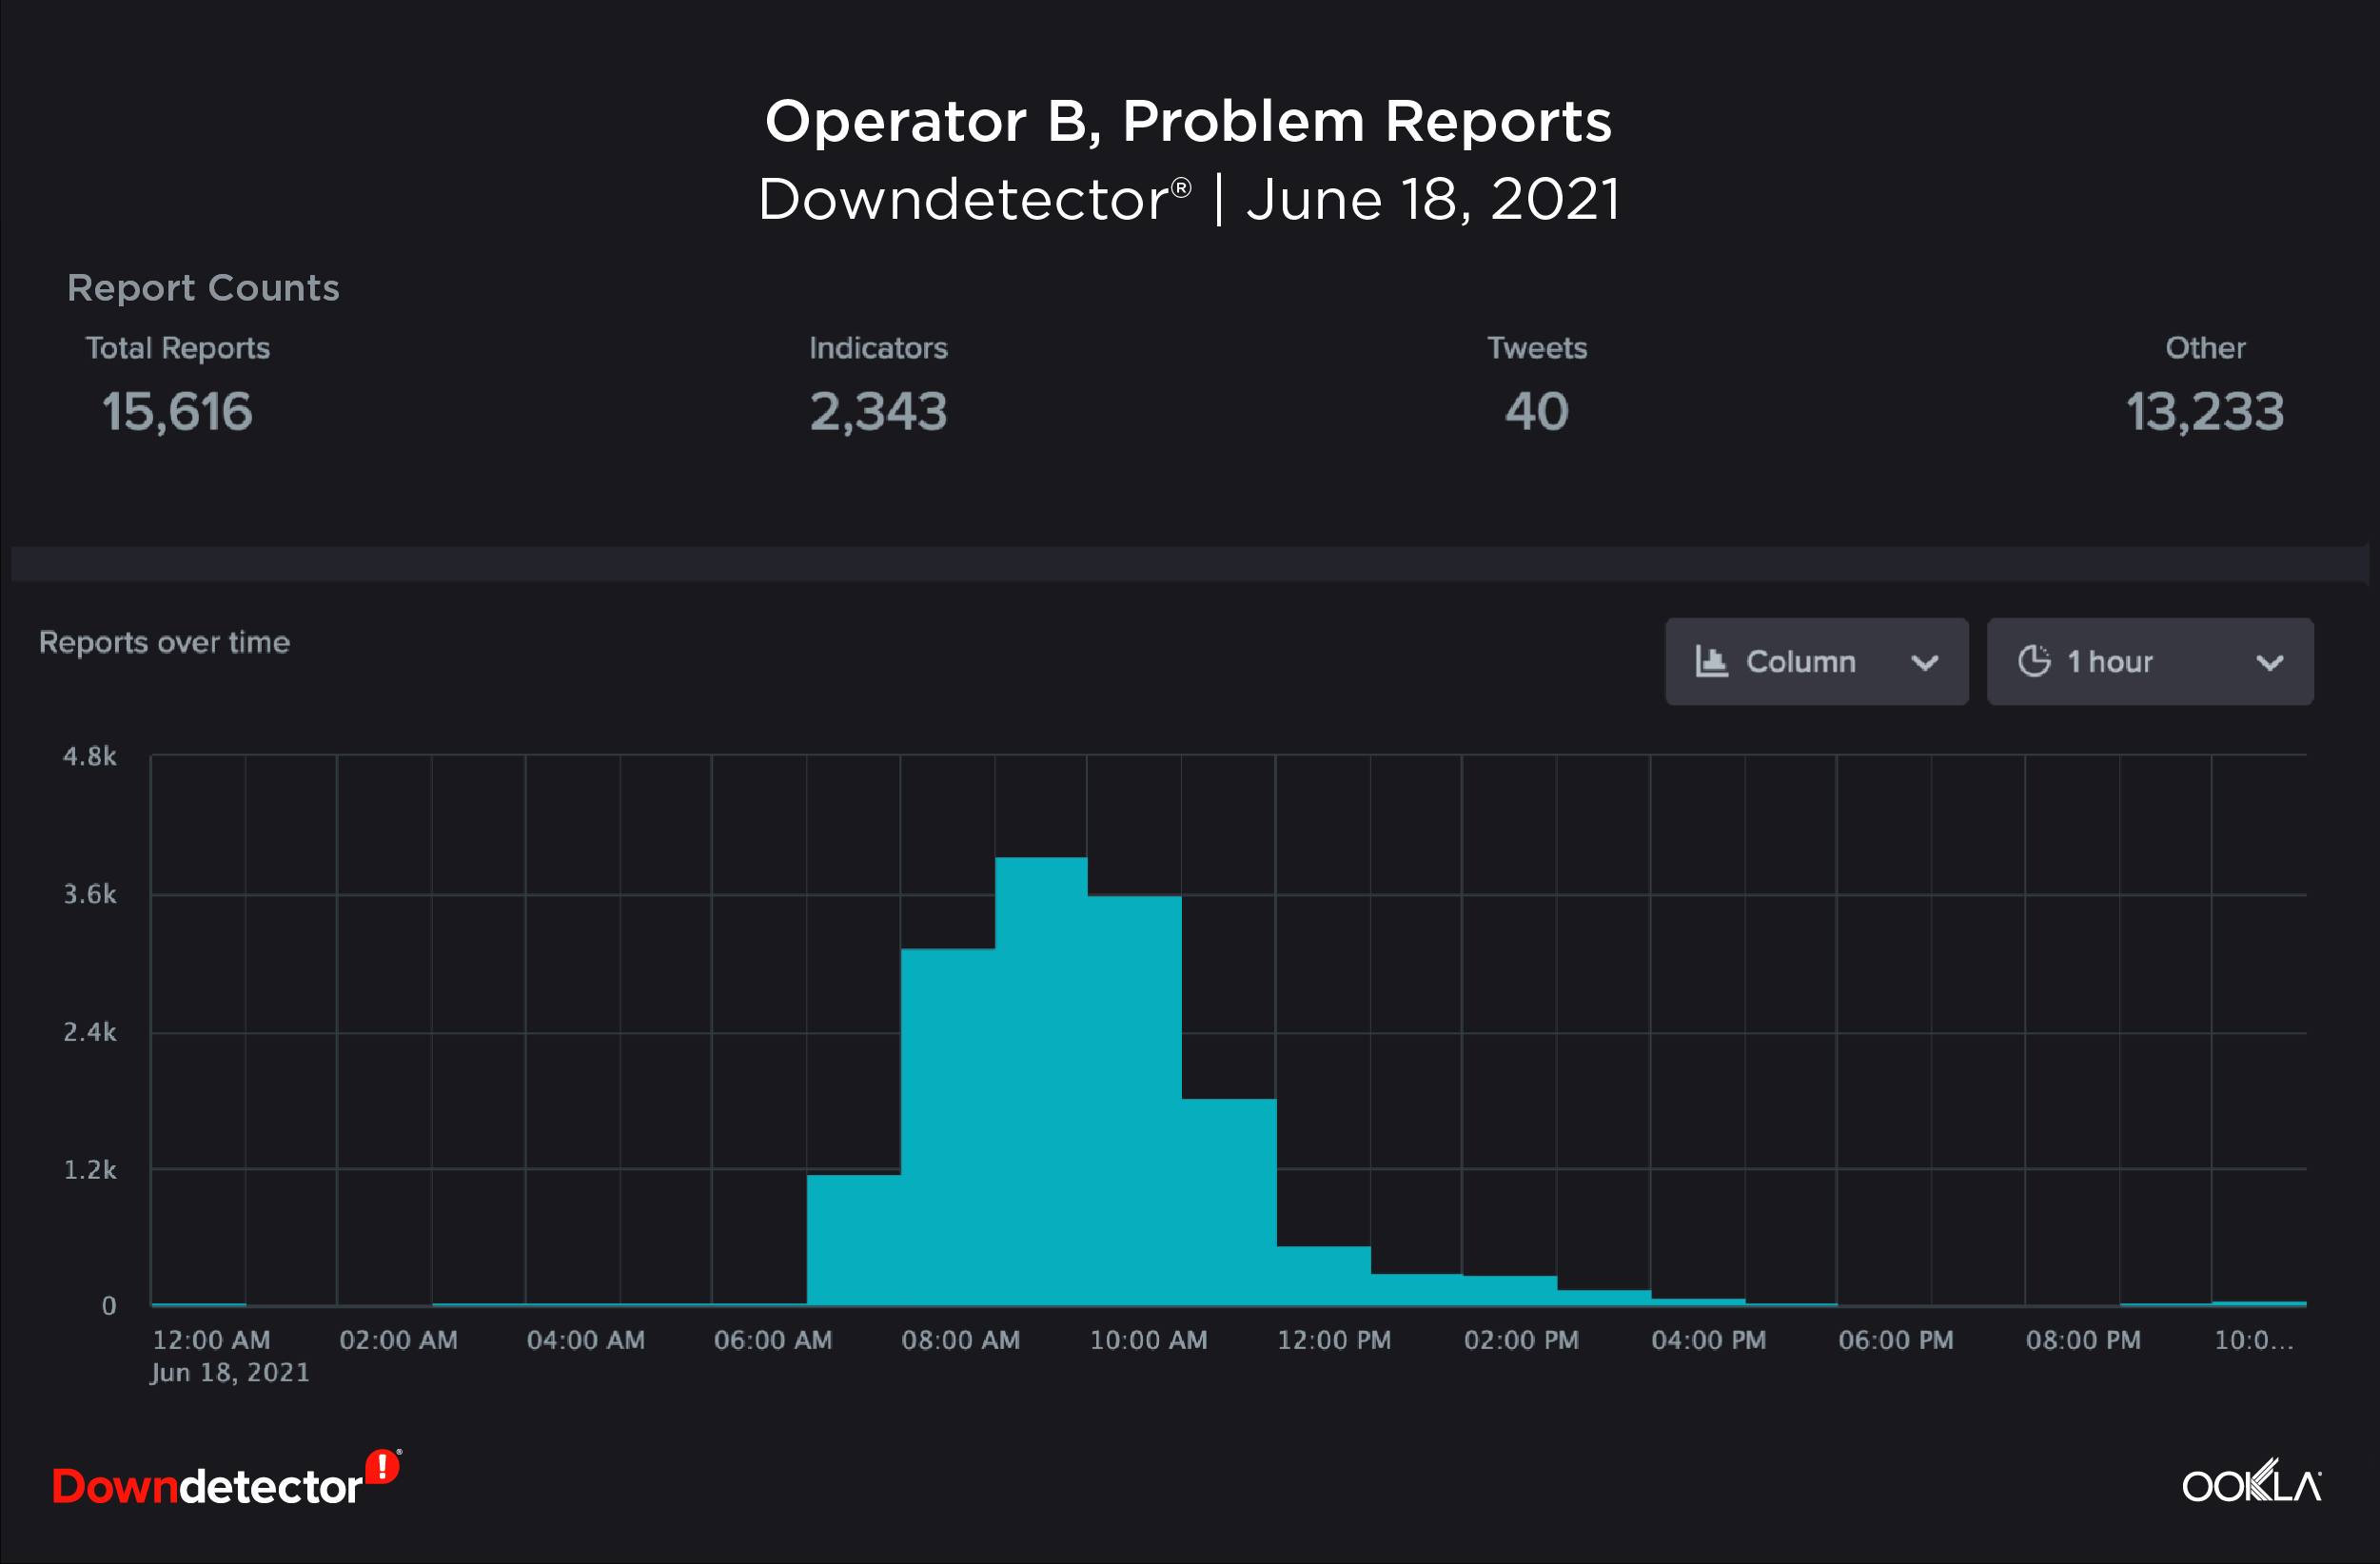
Compare this with an outage experienced by Operator B on June 18, 2021.
downdetector_b_problem-reports_0921

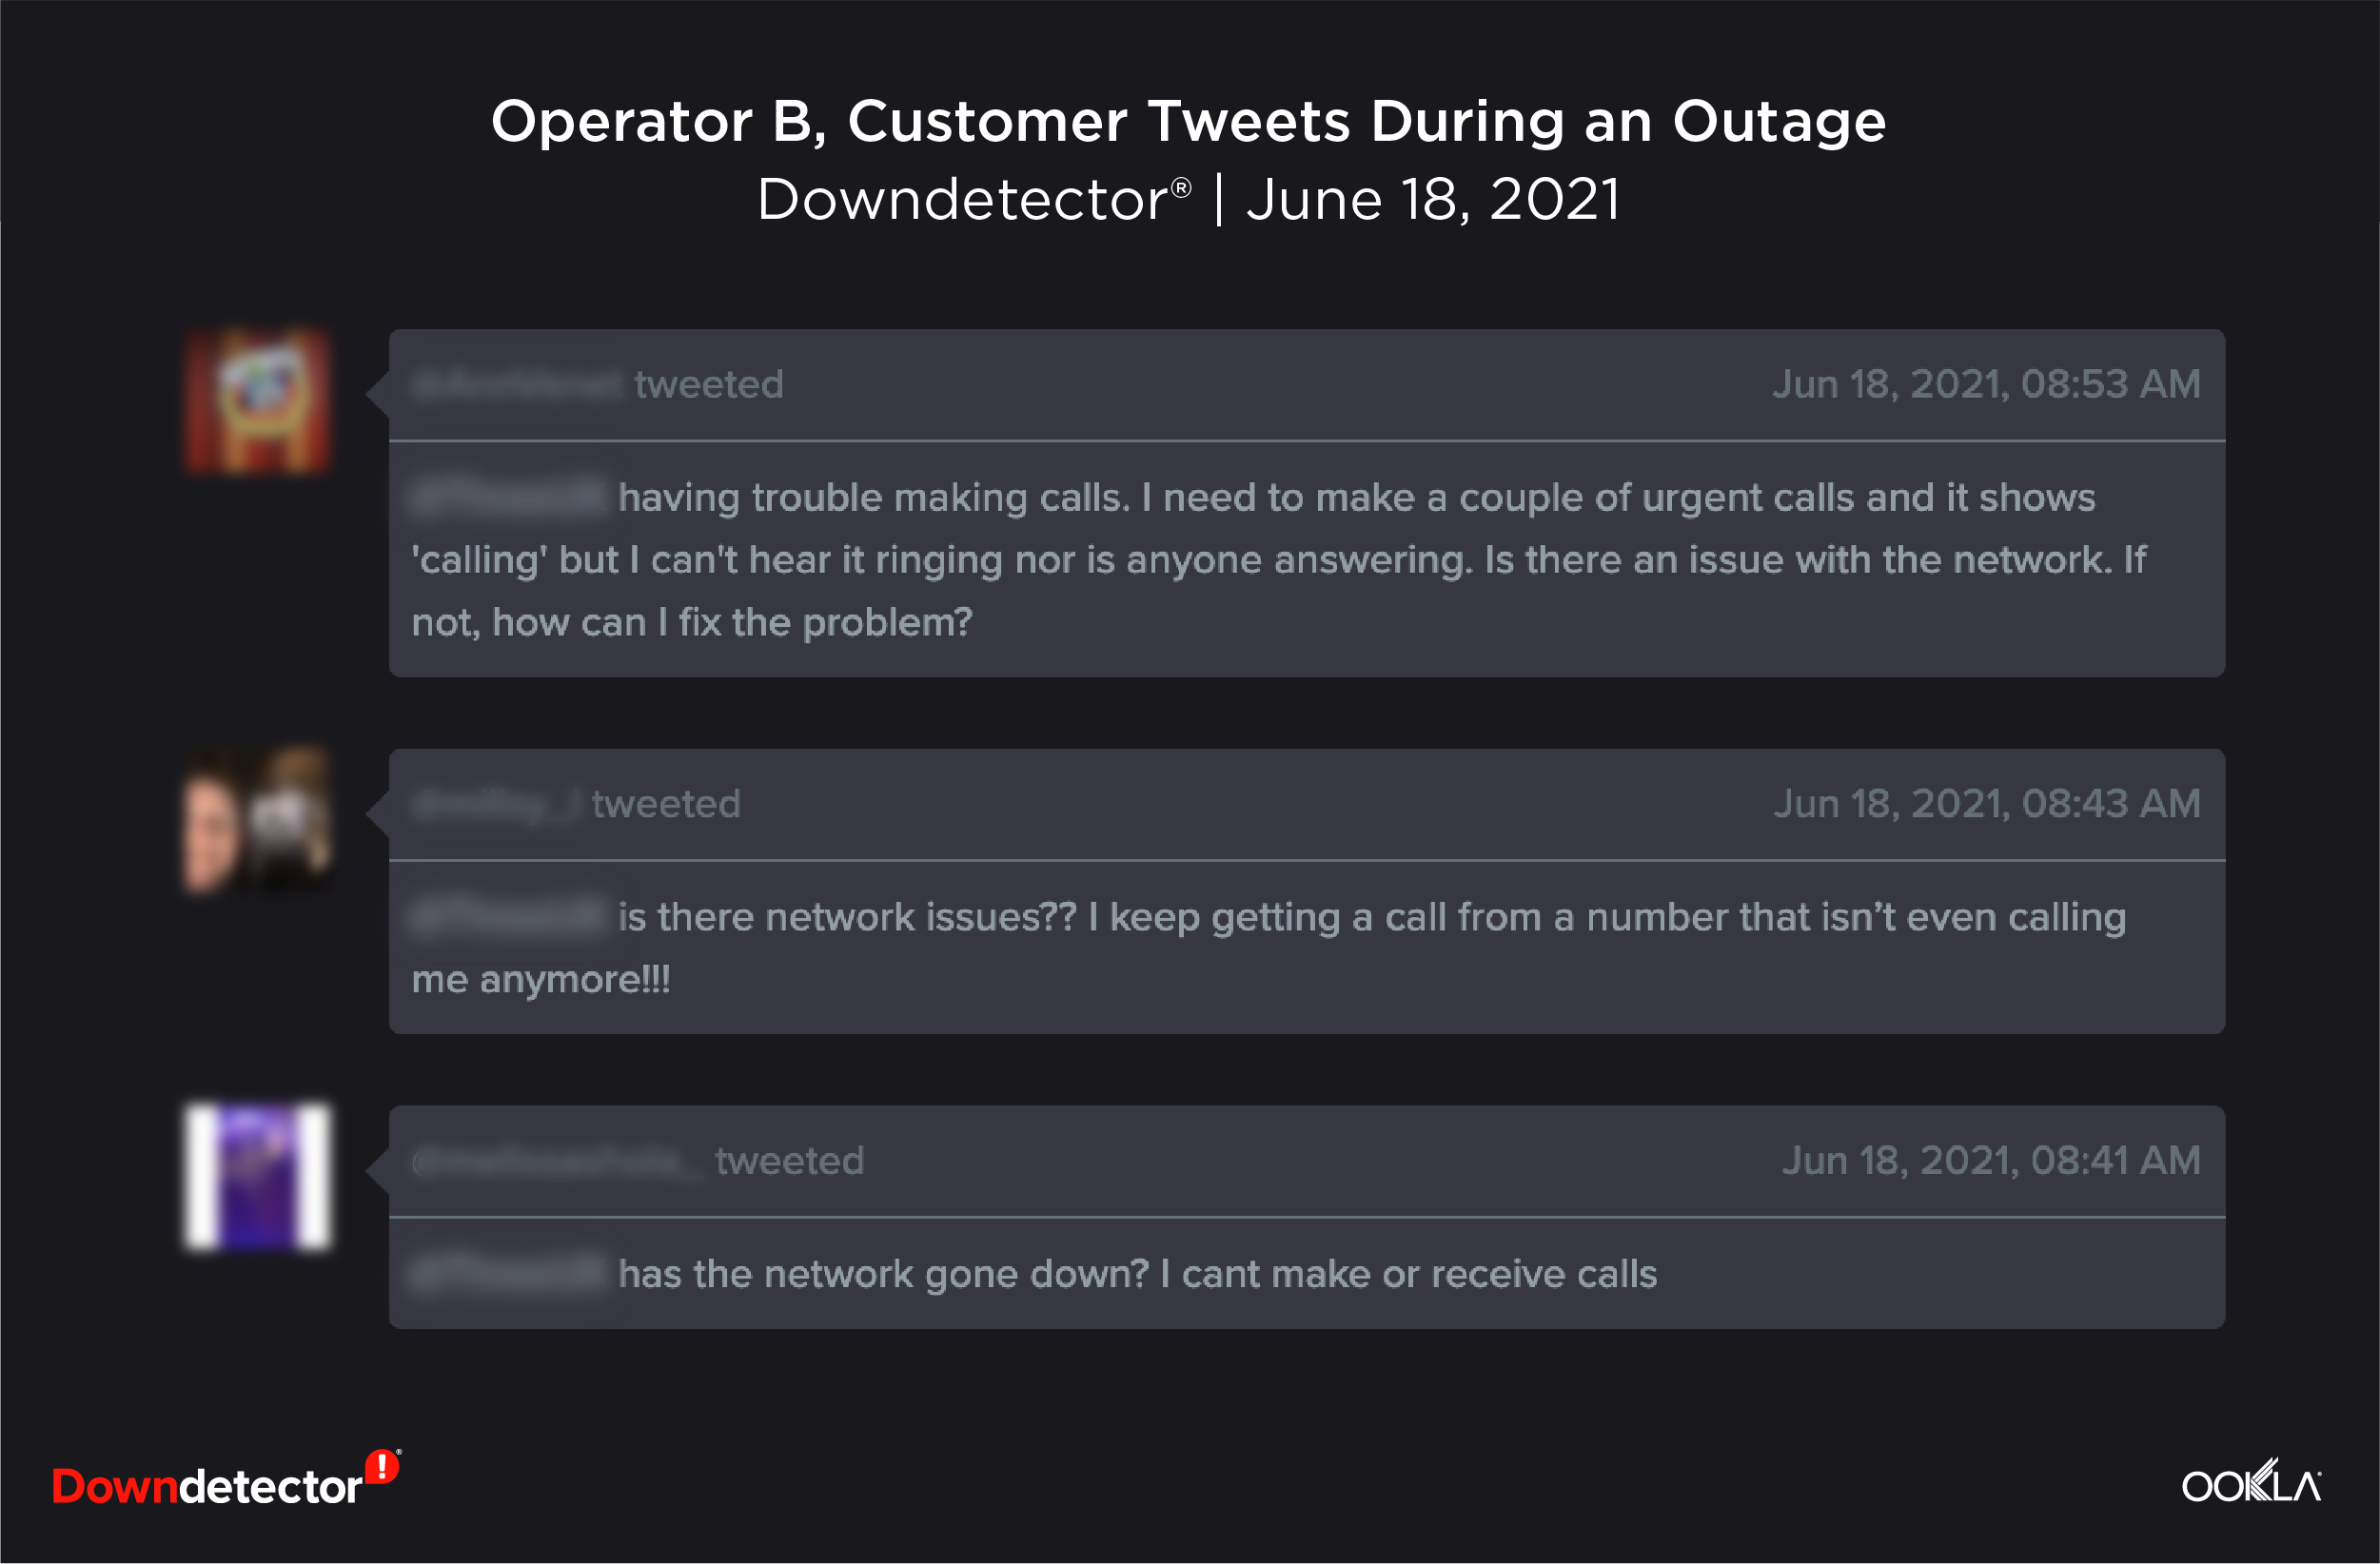
We can see that Operator B received over 15,000 more problem reports than Operator A did during their March outage — despite having 10 million fewer customers. Operator B also had significantly more tweets detected in comparison to Operator A, most of which showed negative consumer sentiment surrounding the incident.
downdetector_b_tweets_0921-1

How did Operator A have significantly fewer problem reports on Downdetector during their outage, despite having millions more customers than Operator B — as well as more positive consumer sentiment surrounding the outage? The likely answer comes down to Operator A’s digital customer experience. Operator A provides a clear path for customers to check their network status and report their problems — without dialing in to the call center.

By leveraging Ookla Spatialbuzz™, Operator A empowered their customers with self-serve tools to check their network status, report issues and opt in to network updates. Spatialbuzz is a customer-driven network improvement platform that helps mobile operators to deliver the best customer experience possible — and use customer network data to make improvements in the areas with the most impacted customers.

By providing customers with these tools, Operator A was able to reduce the number of customers turning to external platforms to voice their frustrations. On the other hand, Operator B’s customers had no easy way to provide feedback or receive communication based on network conditions — leading to a spike in dissatisfied customers filing problem reports on Downdetector and complaining on social media platforms.

The power of Spatialbuzz and Downdetector

With Downdetector and Spatialbuzz, network operations center (NOC) and service operations center (SOC) teams can get information about critical incidents as soon as customers report an issue. This information can help them prioritize network issues and decrease mean time to resolution (MTTR).
downdetector_a_dashboard_0921

Downdetector Enterprise™ provides NOC teams with immediate alerts when customers are impacted and they can use the Downdetector Enterprise Dashboard to view the scale, duration and problem indicators of the incident. Downdetector also helps diagnose external issues with information about over-the-top (OTT) services such as Facebook, WhatsApp, SnapChat and others. For example, NOC teams can quickly see if customers are experiencing a problem with their own network or if an OTT service is experiencing issues. The Downdetector Communicate feature allows operators to place a banner message on their Downdetector company page to inform consumers of any known issues with their network or an OTT service.

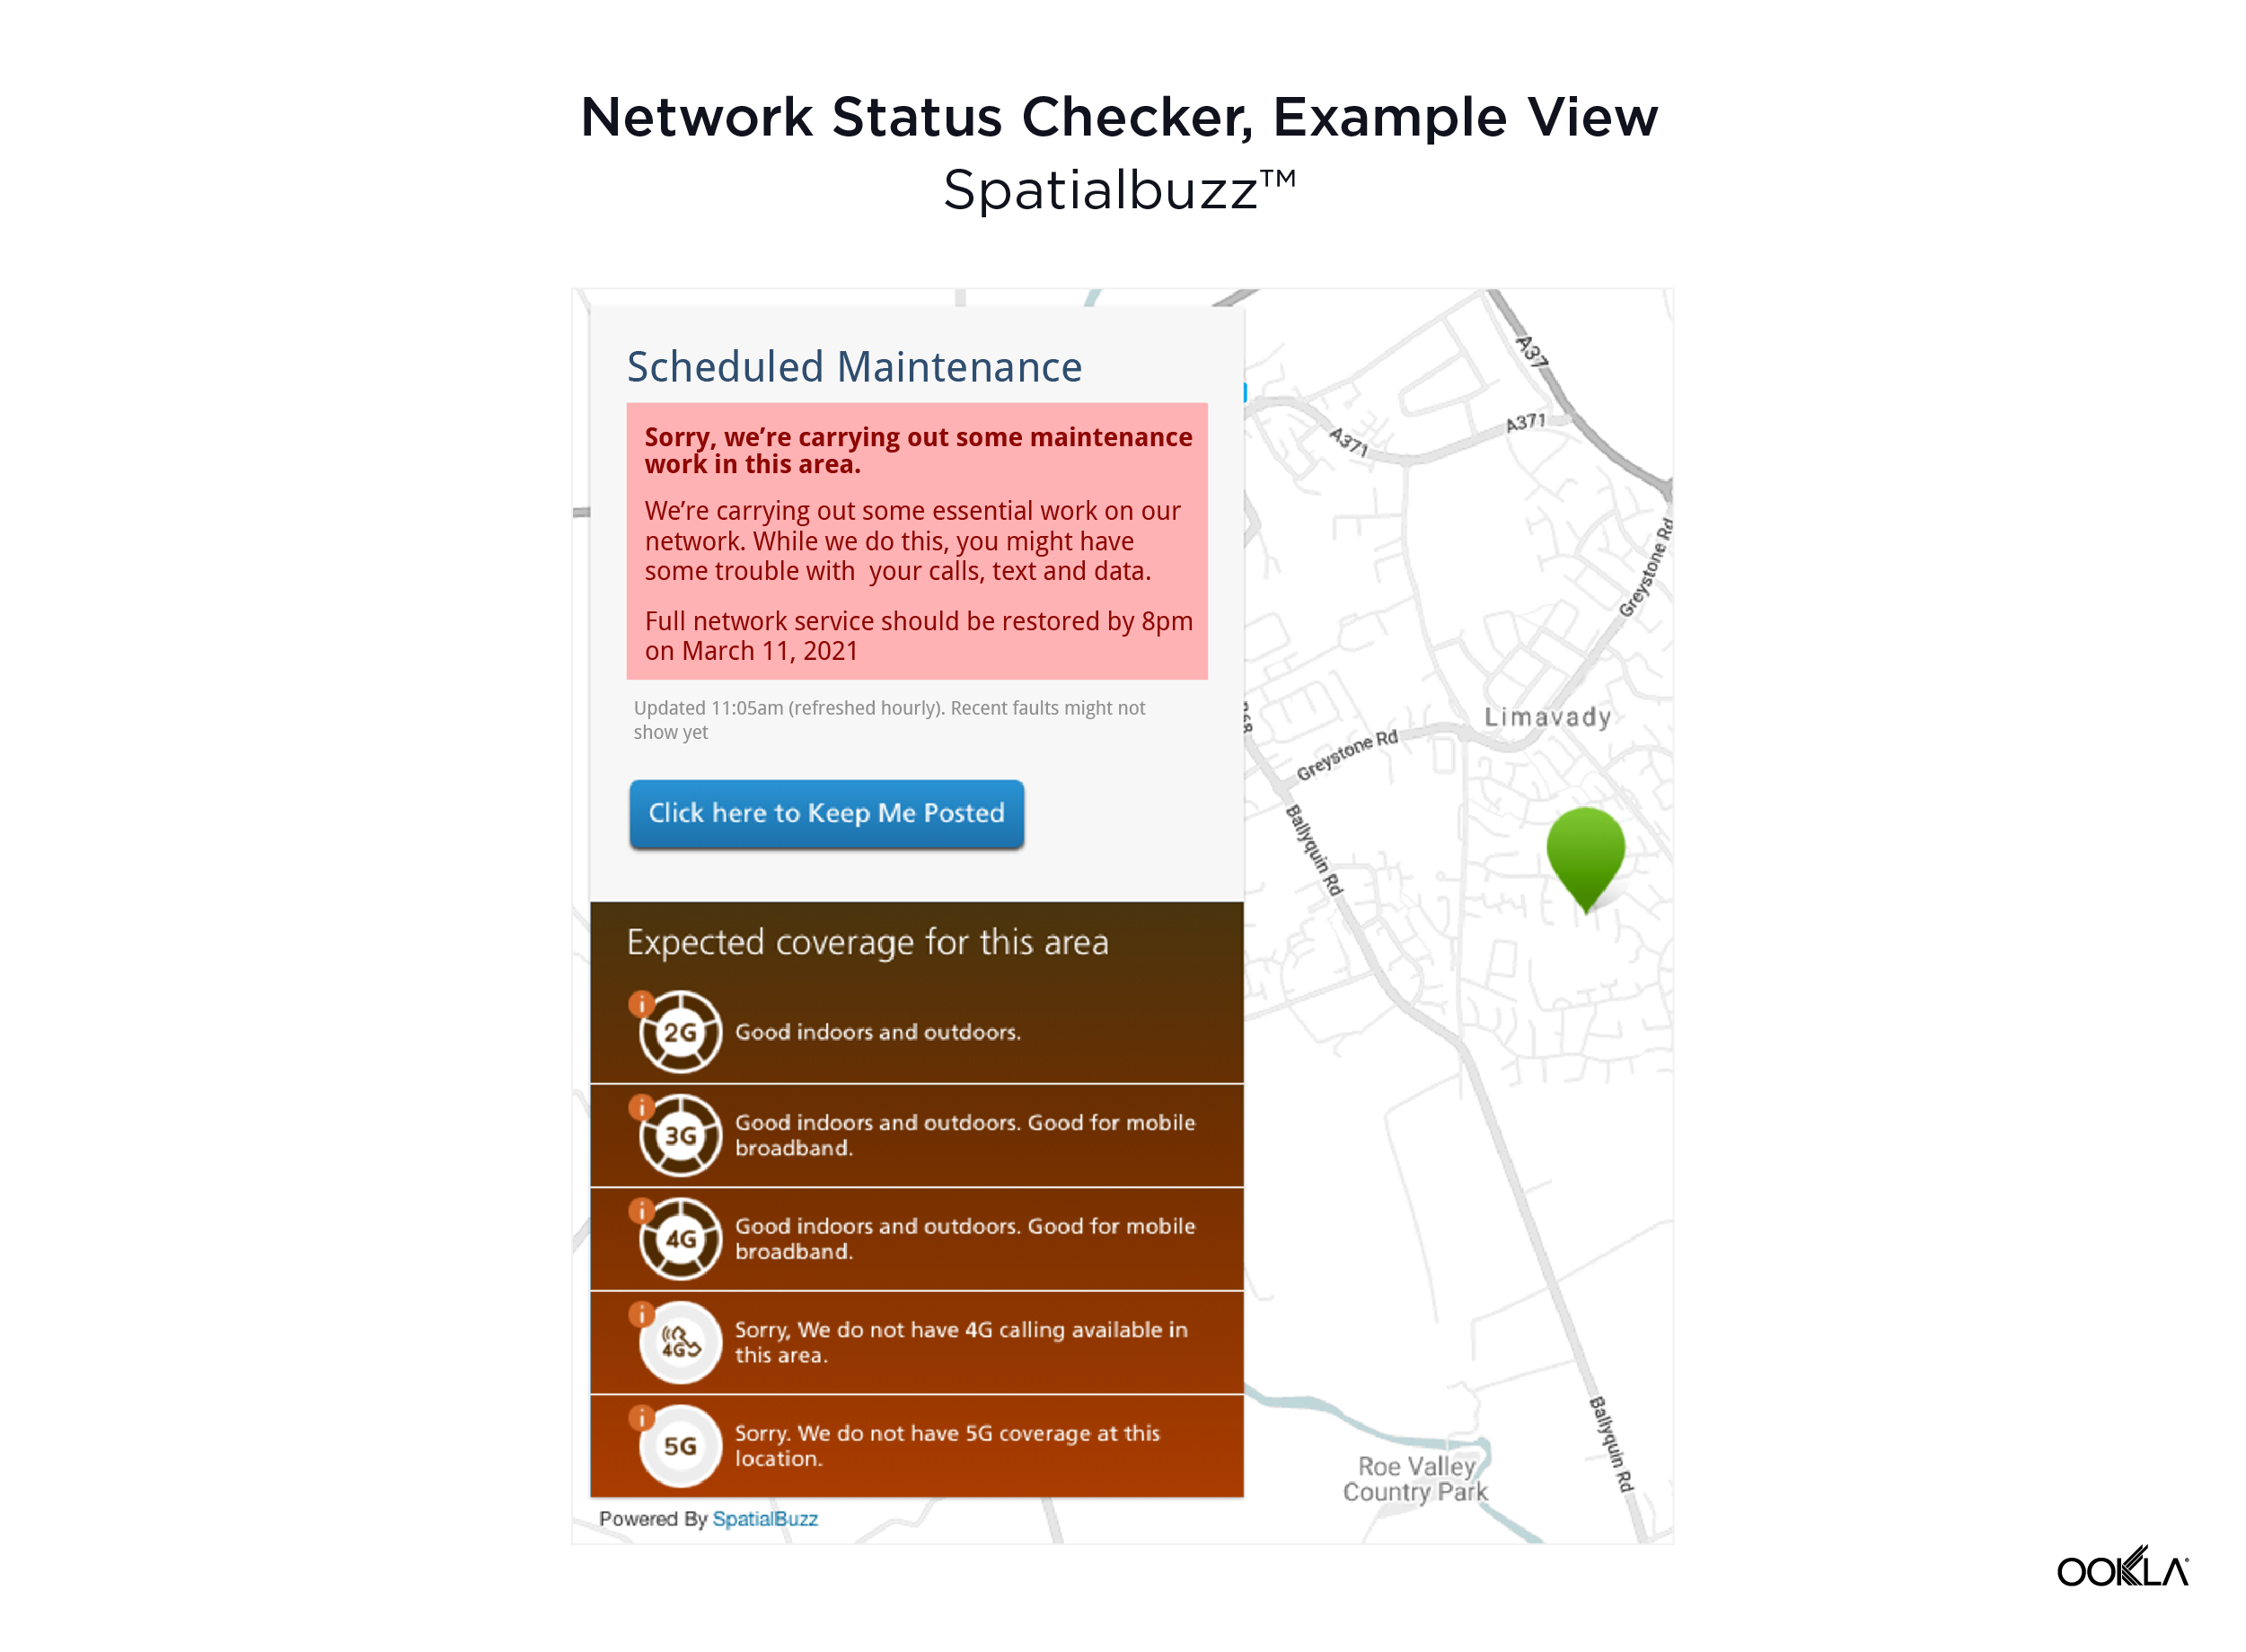
Spatialbuzz provides operators with a single source of truth that connects incidents to customer experience. Spatialbuzz directly integrates with an operator’s website, mobile app, customer care and other applications. By combining real-time customer engagement tools with real-world device measurements, Spatialbuzz gives operators the intelligence they need to prioritize network issues using consumer-initiated data — and to increase customer satisfaction by closing the loop on service issues.
ookla_spatialbuzz_network-status-checker_0921-1
Above you can see just how easy it is for a customer to check their network status and report issues with their service on an internal platform. After reporting the issue, customers can opt in to receive updates about the issue they’re experiencing. If there’s already a known issue, customers will immediately receive contextual communication about it.

On the back end, Spatialbuzz makes it easy for NOC, SOC and engineering teams to quickly prioritize network issues based on customer impact. Below, you can see an example of the analytics provided by Spatialbuzz. From this view, network engineers can quickly prioritize network improvements in areas with widespread customer dissatisfaction, then provide transparent communication about network status, known issues and improvements to customers.

ookla_spatialbuzz_analysis_0921-1

While Operator A and Operator B both faced outages this year, Operator A used Spatialbuzz to provide a meaningful customer engagement during their outage. Using Spatialbuzz led to significantly less negative customer perception on Downdetector and Twitter. Outages are inevitable. Learn how Spatialbuzz and Downdetector can help you detect and resolve them while proactively communicating with customers and providing a clear path to resolution through digital engagement.

Ookla retains ownership of this article including all of the intellectual property rights, data, content graphs and analysis. This article may not be quoted, reproduced, distributed or published for any commercial purpose without prior consent. Members of the press and others using the findings in this article for non-commercial purposes are welcome to publicly share and link to report information with attribution to Ookla.

| October 4, 2021

Introducing Video Analytics in Speedtest Intelligence


With video content being the most dominant form of global network traffic, it’s important to understand your customers’ real-life experience with internet and mobile connectivity when they are consuming video content. To that end, we are excited to announce the launch of Video Analytics in Speedtest Intelligence®.

We launched video testing in the Speedtest® app for iOS and Android earlier this year. Since then, millions of video tests have been initiated by consumers to gain insights about the quality of their video streaming experience. Speedtest Intelligence now allows enterprises to surface key insights into the real-world consumer video experience on their network. With these insights, internet service providers and mobile network operators can monitor video performance and quality over time, benchmark against competitors, assess the impact of network build-outs on video performance, and much more.

Consumer video tests, enterprise video analytics

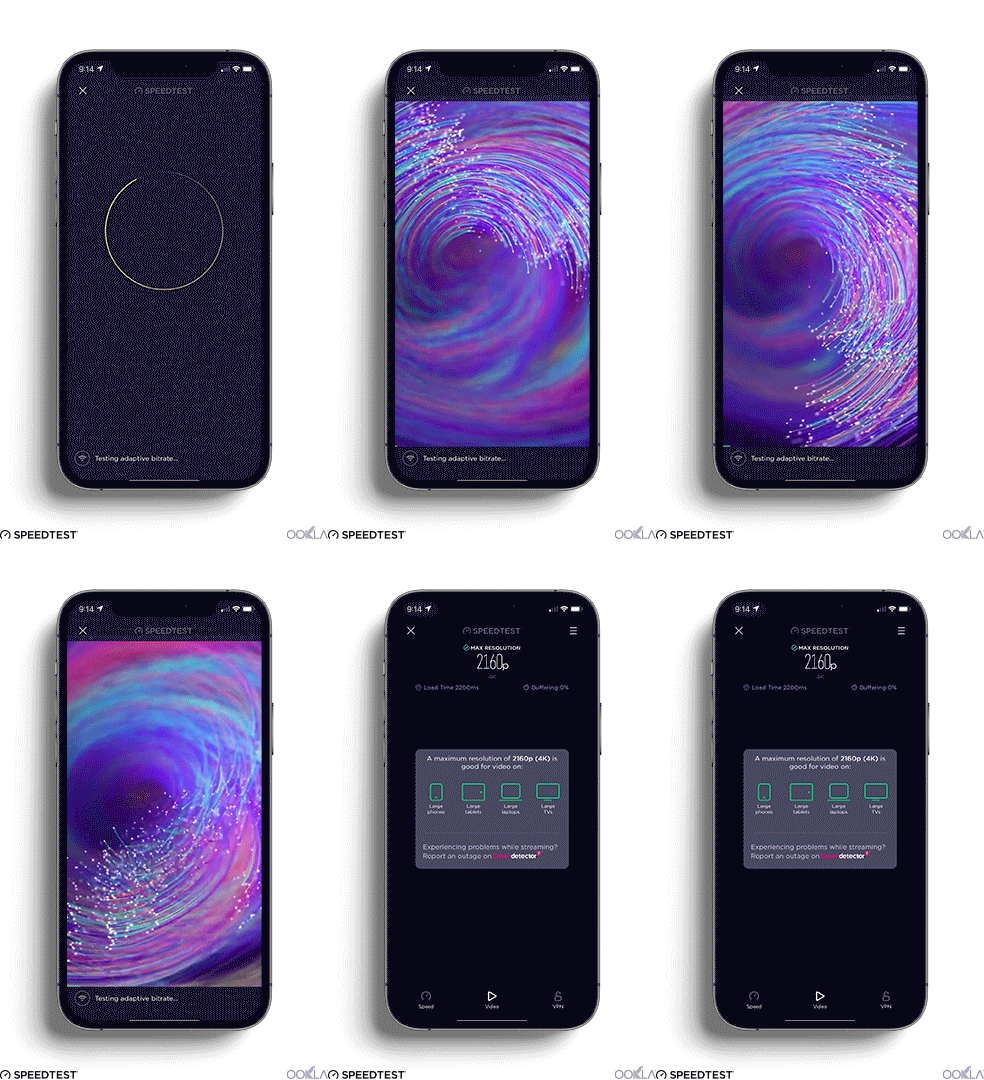
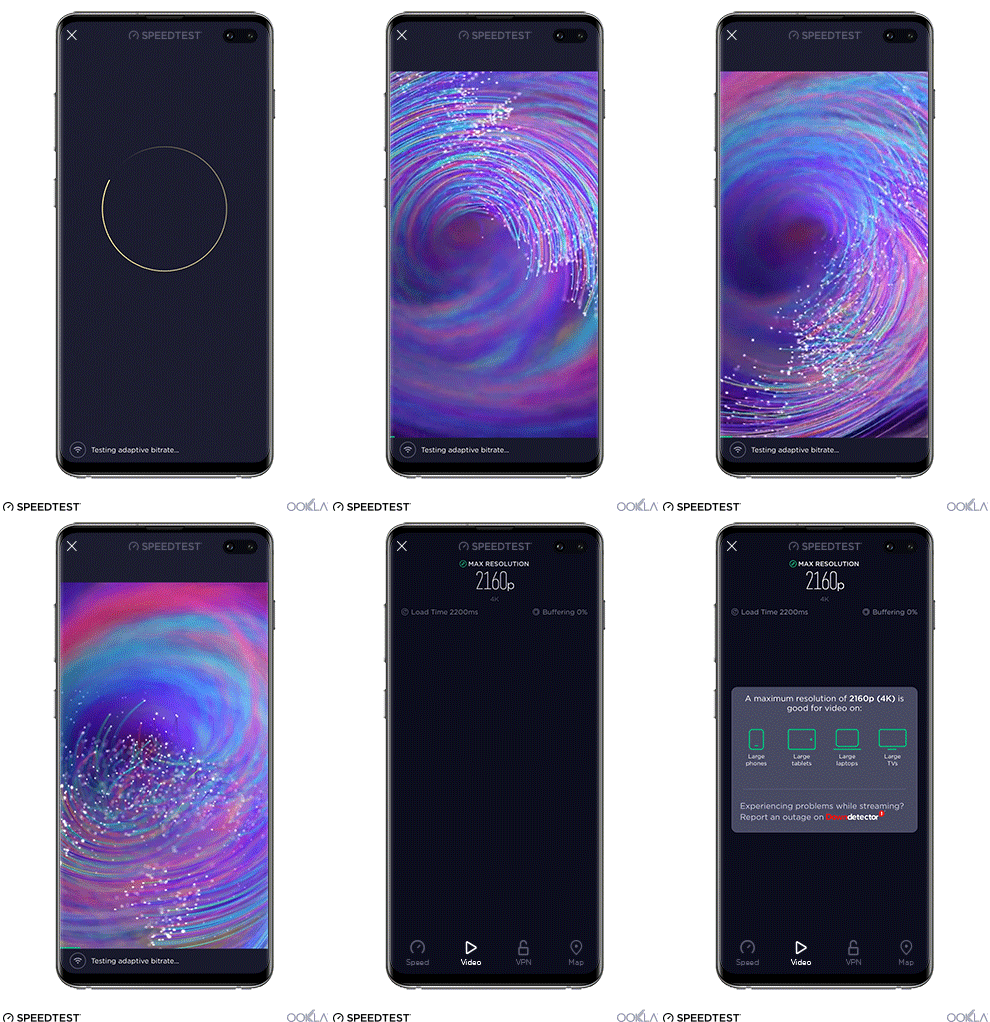
When a user presses the play button on the Speedtest video test, it initiates adaptive bitrate video playback which dynamically adjusts the buffering of various quality video renditions to provide the best playback experience possible based on the device and network capabilities. The purpose of this is to deliver the maximum quality video supported by the network and device, while minimizing undesired behaviors such as stall events and long preplay buffering times. Speedtest video testing uses adaptive bitrate streaming and prevalent streaming protocols, codecs, containers, and CDNs to make our test as short as possible while also enabling us to detect the stabilized bitrate and stalls in playback.

If the highest resolution of 4K is not achieved in the adaptive bitrate stage, then the test moves on to the fixed stage, during which a series of short videos are played at increasing resolutions until the test either fails to complete in a given period of time or else reaches a maximum resolution of 4K. When the test is complete, consumers get a snapshot of their results, including maximum resolution, load time, buffering percentage, and suggested devices to stream video at their current performance level.


Network operators and other enterprises can now gain insight from millions of consumer video tests to better understand how fixed and mobile subscribers experience industry-standard video KPIs. Metrics available in the Video Analytics dashboard include:

  • Average media bitrate for the adaptive bitrate stage
  • Distribution of primary resolution for the adaptive bitrate stage
  • Rebuffering ratio for the adaptive bitrate and fixed stages
  • Start failures for the adaptive bitrate and fixed stages
  • Start time for the adaptive bitrate and fixed stages
  • Overall distribution of highest successful resolution

chart-art

How ISPs and MNOs can use Video Analytics

With Video Analytics in Speedtest Intelligence, network operators can gain insights about their customers’ video streaming experience. Video Analytics data can help you:

  • Directly measure consumer video experience
  • Monitor consumer video performance & quality over time
  • Benchmark against competitors
  • Assess the impact of network optimization or build-out on video performance
  • Prioritize engineering efforts in areas with poor video experience
  • Prioritize marketing efforts in areas where competitors provide poor video experience
  • Identify areas with good video streaming experience for upsell of bundled OTT services
  • Correlate poor mobile video experience to specific cell sites and RF issues

Want to give your customers a world-class video streaming experience? Inquire about adding the Video Analytics dashboard to your Speedtest Intelligence subscription today.

Ookla retains ownership of this article including all of the intellectual property rights, data, content graphs and analysis. This article may not be quoted, reproduced, distributed or published for any commercial purpose without prior consent. Members of the press and others using the findings in this article for non-commercial purposes are welcome to publicly share and link to report information with attribution to Ookla.

| September 20, 2021

How CST Makes Evidence-Based, Data-Driven Spectrum Policy Decisions Supported by Ookla Analysis [Case Study]
The Kingdom of Saudi Arabia’s (KSA) Vision 2030 program has laid out national goals to create a thriving digital economy in the coming decade. High-speed, widely accessible mobile networks are central to that digital transformation. KSA’s telecommunications regulator, the Communications, Space & Technology Commission (CST), enables the nation’s communications infrastructure while assuring that services meet specific standards of accessibility, performance, fairness, and value. CST has developed a three-year spectrum roadmap to establish the country as a world leader in radio communication — while supporting soaring consumer data consumption and future wireless technologies that will fuel economic growth.

While developing its ambitious spectrum outlook, CST conducted extensive trials and technical analysis, leveraging data from Ookla® and other sources. As a result of this spectrum outlook, its collaborative regulation with other national stakeholders and other key policies and initiatives, CST was recently designated as a fifth-generation (G5) regulator by the International Telecommunications Union (ITU) — the highest level of regulatory maturity.

Situation

CST has a strategic vision to embrace digitalization as a central anchor for the country, connecting its constituents to economic opportunities and reshaping the national approach to connectivity. In previous years, Saudi Arabia’s spectrum was split evenly between three operators. However, to enable technologies like 5G, satellite broadband, and Wi-Fi 6e, a progressive spectrum policy was needed to meet the growing demand for wireless proliferation.

In advance of its upcoming spectrum auction, CST needed data to inform the development of its spectrum strategy, including intelligence on similar spectrum policies in other global markets. CST committed to a new, evidence-based approach to spectrum assignment drawing from technology trials and consultations with network operators, device and chipset manufacturers, infrastructure providers, end users, and network data providers, including Ookla. Most notably, CST needed data to expand its analysis of spectrum usage, performance of various bands and existing network infrastructure to see where investments had been made within certain bands (e.g., extra capacity in specific bands in urban areas and coverage of rural areas using adequate bands).

Read the full case study

Ookla retains ownership of this article including all of the intellectual property rights, data, content graphs and analysis. This article may not be quoted, reproduced, distributed or published for any commercial purpose without prior consent. Members of the press and others using the findings in this article for non-commercial purposes are welcome to publicly share and link to report information with attribution to Ookla.
| August 18, 2021

How Loudoun County, VA Secured Over $17M in Broadband Funding Using Ookla Data to Create Accurate Maps and Challenge FCC Data [Case Study]

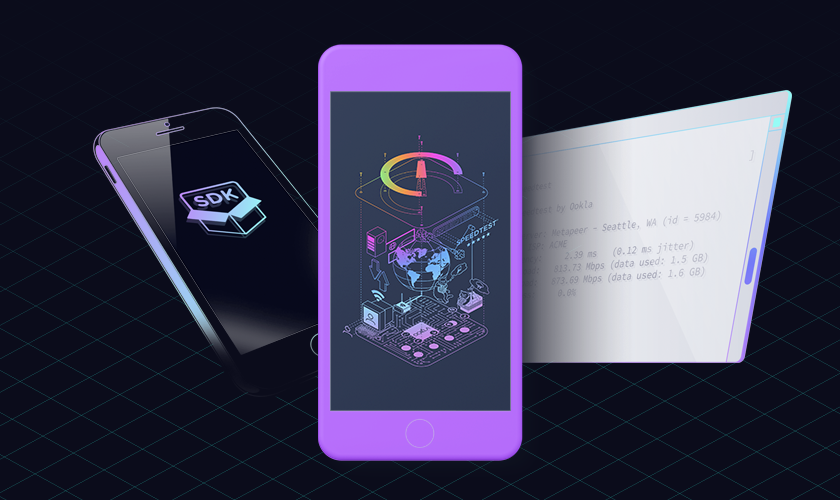
Virginia’s Loudoun County is interwoven with rural and suburban landscapes, making it especially difficult for policymakers to understand where the county’s residents are — or are not — able to access the Internet. FCC Form 477 broadband availability data shows that nearly 100% of Loudoun residents have access to what the FCC defines as broadband (25 Mbps download, 3 Mbps upload). This is inconsistent with the connectivity experiences of county residents, so Loudoun Broadband Alliance (LBA) set out to create an accurate, reliable broadband access mapping methodology using real-world network performance data.

Loudoun Broadband Alliance (LBA) chose Ookla® Speedtest Intelligence® to research residents’ actual connectivity and network performance. With this data, LBA identified a large number of unserved households in contrast to FCC data which showed them as served. Loudoun County was subsequently awarded over $17 million of funding to help eliminate the broadband gap.

Situation

In an effort to close the digital divide in rural and urban communities across the nation, the United States federal government has allocated billions of dollars in broadband funding with the American Rescue Plan (ARP) Act. Funding allocation is based on current federal broadband mapping through FCC Form 477 data. For Loudoun County, FCC data reports:

loudon-map-1-3

loudon-map-2-2

However, the FCC’s findings were not reflective of the real-world network experience of Loudoun County residents. LBA used Speedtest Intelligence data in conjunction with other publicly available datasets to get a more accurate picture of broadband accessibility in their county.

Read the full case study

Editorial note: This case study was updated on April 25, 2022 to include the broadband funding won by Loudoun County.

Ookla retains ownership of this article including all of the intellectual property rights, data, content graphs and analysis. This article may not be quoted, reproduced, distributed or published for any commercial purpose without prior consent. Members of the press and others using the findings in this article for non-commercial purposes are welcome to publicly share and link to report information with attribution to Ookla.
| July 28, 2021

Introducing the Speedtest Mobile SDK

We are excited to announce that the Speedtest SDK™ is now available for both iOS and Android applications. The new Speedtest Mobile SDK allows providers to integrate Speedtest® into their mobile applications with a fully custom user interface. With Speedtest results delivered directly into your application, you can immediately surface network performance insights to your customer care team, network operations center and other key stakeholders.

Joining the Speedtest Web SDK in our suite of Speedtest Powered™ solutions, the Mobile SDK provides even more rich insights about mobile network conditions, signal metrics, device information and other data. With Speedtest integrated directly into your mobile applications, you can more easily diagnose customer issues and make network improvements.

A world-class consumer testing experience

Speedtest is the name consumers across the globe trust when they need to better understand the performance and quality of their internet connections. Daily, Speedtest is used over 10 million times for unbiased network performance data, and over 35 billion tests have been taken with Speedtest to date.

Our industry-leading methodology makes Speedtest the most reliable tool for measuring internet performance and providing network diagnostics. The Speedtest Mobile SDK allows providers to integrate this same robust, accurate testing experience into their mobile applications.

Seamless integration, highly configurable testing

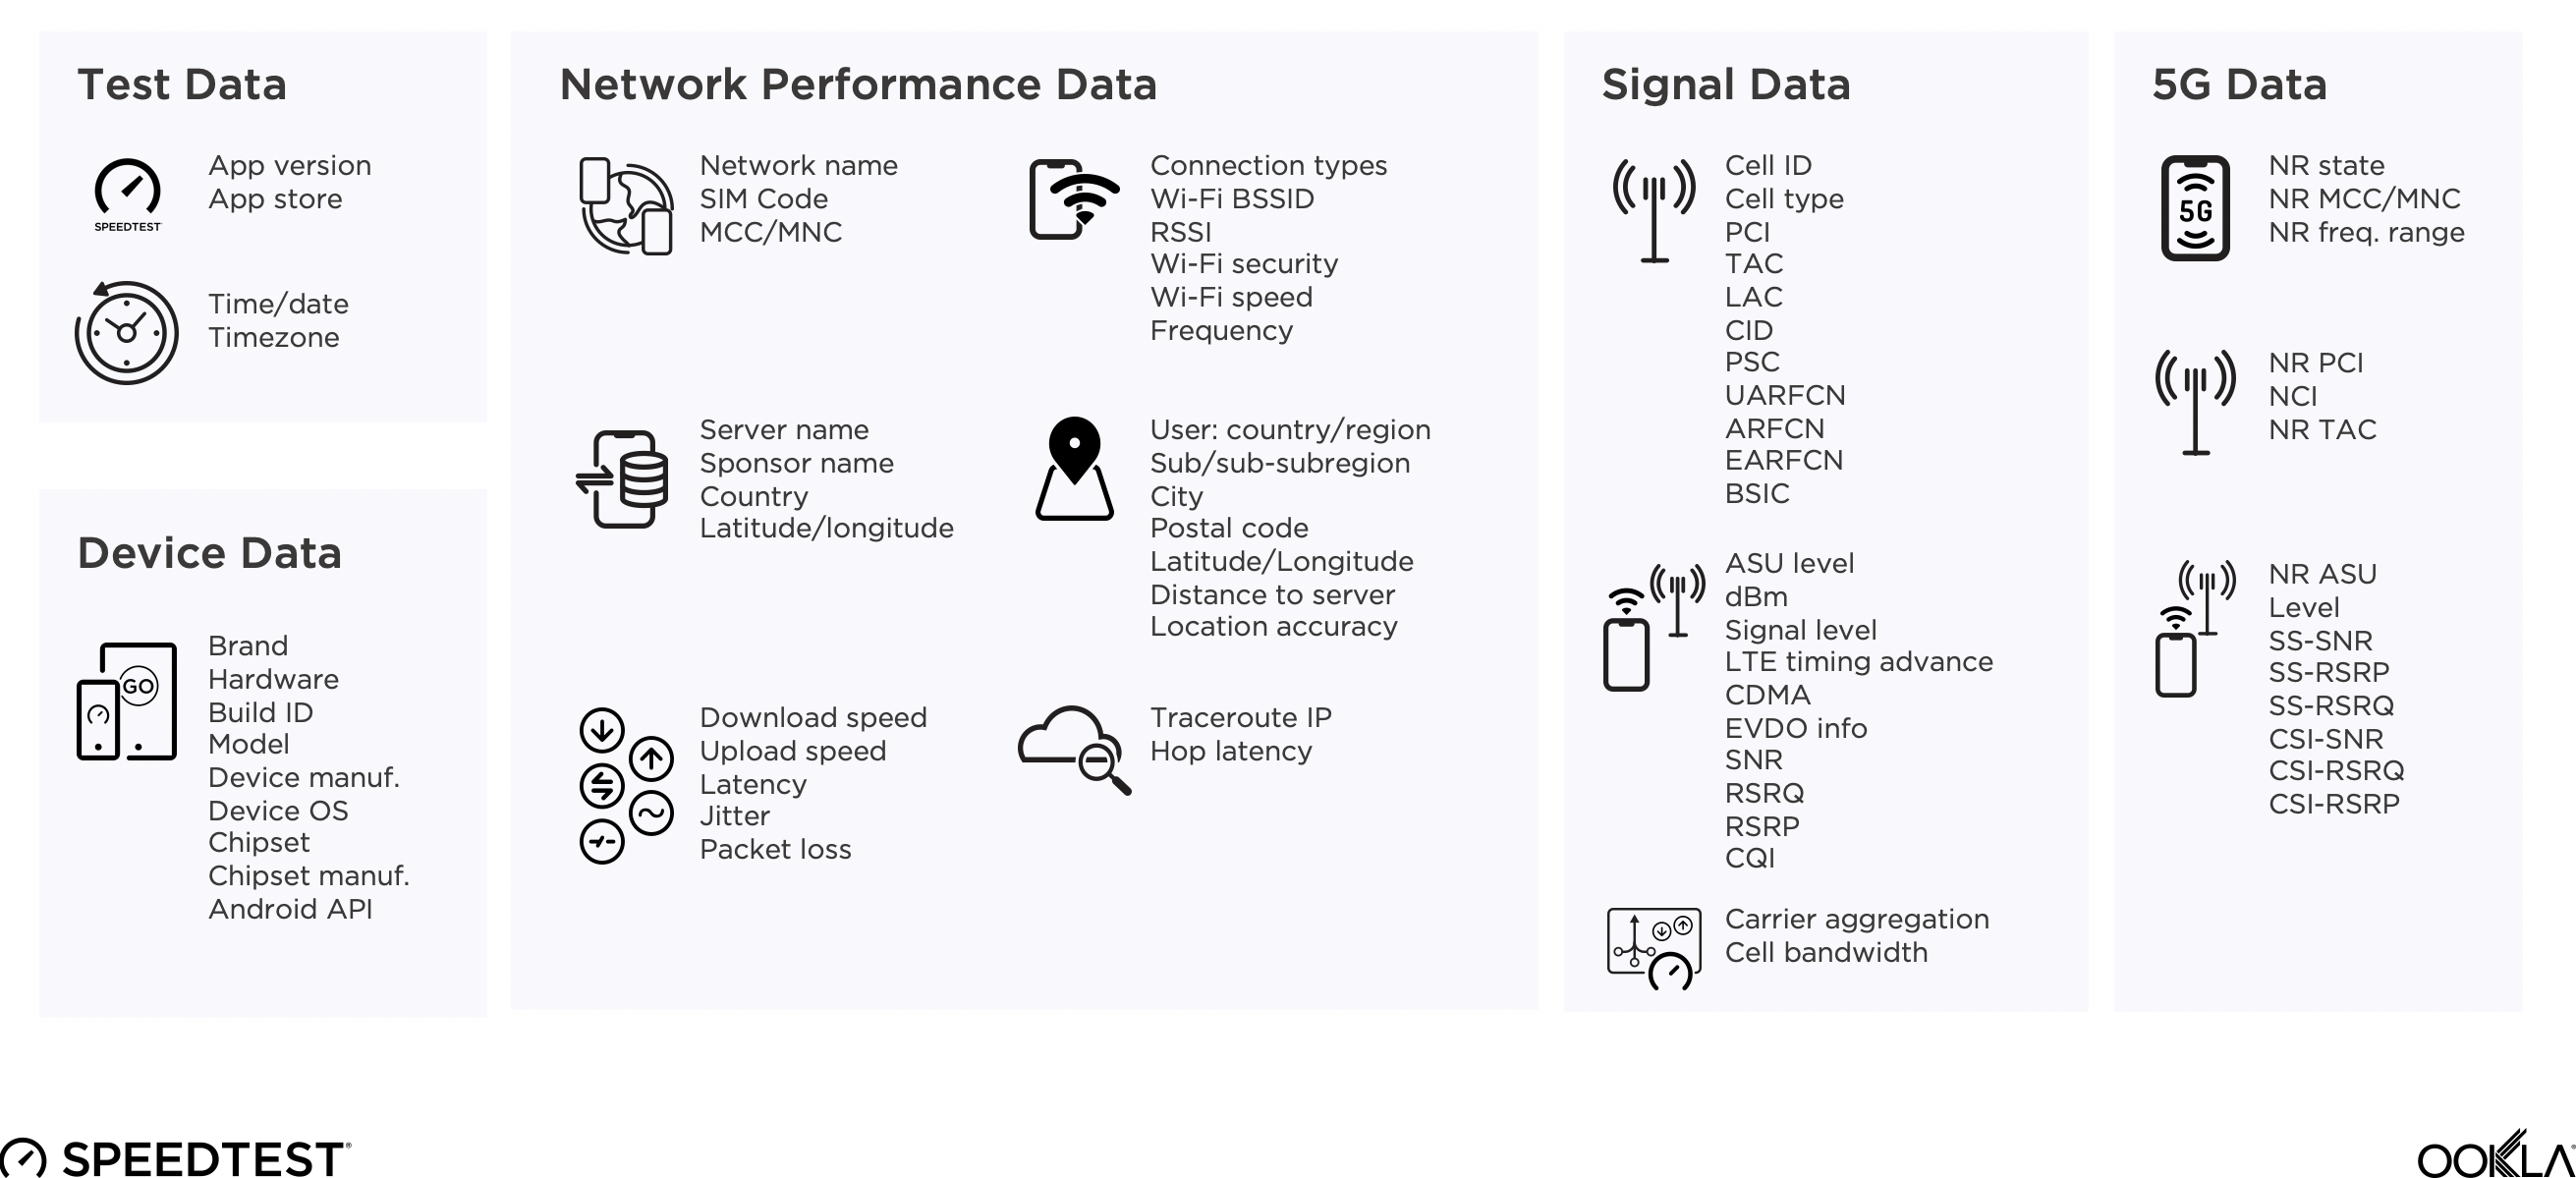
The Speedtest Mobile SDK allows you to install Speedtest as the testing solution into your Android or iOS app. It integrates seamlessly into your custom UI and offers configuration over test stages, signal scan triggers and data delivery.

The Speedtest Mobile SDK measures over 200 potential test and performance data elements to help you understand and improve your network. The Android SDK includes background signal scans, which provide additional data about LTE and 5G signal level and quality. All data elements can be delivered via extract, CSV file, JSON or real-time feeds.

mobile-sdk-image-1

Get actionable insight into network performance

Enterprises can use the Speedtest Mobile SDK to better understand the network performance experience of their remote staff and customers. The Speedtest data collected within your app can help you:

  • Troubleshoot individual problems
  • Identify problem hotspots and potential solutions
  • Improve a customer’s call with customer care
  • Save money on field support costs
  • Prevent customer churn on a case-by-case basis

On a larger scale, Speedtest data can help you analyze trends in network performance so that you can plan and validate network improvements – helping you build a better network for the long-term satisfaction of your customers.

Inquire about the Speedtest Mobile SDK today to learn how you can join leading network operators around the world in integrating Speedtest into your mobile applications.

Ookla retains ownership of this article including all of the intellectual property rights, data, content graphs and analysis. This article may not be quoted, reproduced, distributed or published for any commercial purpose without prior consent. Members of the press and others using the findings in this article for non-commercial purposes are welcome to publicly share and link to report information with attribution to Ookla.

| July 20, 2021

Solutelia Joins Ookla

Ookla®, the global leader in network intelligence, testing platforms and related technologies, is proud to announce the acquisition of Solutelia and its flagship WINd® software suite. Together we will disrupt and forever change the wireless network test and measurement industry.

Ookla’s enterprise products give mobile network operators unparalleled competitive insights into the consumer experience on networks all over the world, while Solutelia’s WINd platform evolves legacy drive-testing and walk-testing tools and eliminates the need for outdated, time-consuming methods of post-processing data. Solutelia’s innovative solutions for indoor, outdoor and competitive benchmark testing allow network operators and integrators to rapidly improve mobile network performance with real-time streaming KPIs, remote control of test devices, near-real-time post-processing and cloud-based analytics — with consumer network experience at the heart of the system.

“The addition of WINd will bring much deeper network insights and testing capabilities to Ookla’s enterprise customers,” said Doug Suttles, CEO of Ookla. “Over the past few years we have invested in solutions and talent to help our clients solve more engineering-grade problems. Acquiring Solutelia is another concrete example of Ookla helping our clients more accurately measure and continuously improve their deployed networks.”

Mohssen Davari, CEO of Solutelia adds, “We are thrilled to be joining Ookla. Our mission has been to redefine mobile network performance measurement with near-real-time analytical capabilities that drive operational efficiencies and faster network improvements. We first partnered with Ookla to integrate its best-in-class Speedtest software, and now together we will bring the benefits of the WINd software platform to the global marketplace.”

The advent of 5G is resulting in substantial changes to the physical footprint of networks, which will require more cell sites and more intelligent, complex radio networks. This radical shift in the industry means that network operators need to be able to massively scale their testing and optimization efforts, without a commensurate increase in operational spending. Solutelia’s revolutionary approach to data collection has fundamentally reimagined drive and walk testing, creating process efficiencies and delivering instant network insights, while removing operational complexity and reducing network management costs.

Mobile network operators using Ookla’s solutions for crowdsourced network intelligence (Speedtest Intelligence®, Cell AnalyticsTM and SpatialBuzz) already have an unrivaled view into network performance, quality, coverage, user density, data usage, consumer satisfaction and other key metrics. Solutelia’s WINd platform, which natively leverages Ookla’s best-in-class Speedtest methodology for throughput testing, allows operators to turn that network intelligence into immediate action in the field. With the addition of Solutelia’s WINd platform to its enterprise product suite, Ookla now provides solutions to support operators through each stage of mobile network planning, site verification, monitoring, optimization and performance assurance.

To learn more about Ookla and Solutelia’s solutions for mobile network operators and integrators, inquire here. For media inquiries, please send a message to press@ookla.com

Ookla retains ownership of this article including all of the intellectual property rights, data, content graphs and analysis. This article may not be quoted, reproduced, distributed or published for any commercial purpose without prior consent. Members of the press and others using the findings in this article for non-commercial purposes are welcome to publicly share and link to report information with attribution to Ookla.

| July 12, 2021

Introducing Video Testing for Android


In February, we announced video testing from Speedtest® for iOS, and millions of internet speed enthusiasts have since used this free video test to measure the quality of their streaming experience. Today we are excited to announce that video testing is now available for Android users.

How the video test works

The video test begins by playing a short video using adaptive bitrate streaming. This will measure the typical video streaming experience on your device.


Next, a series of very short videos will be played at increasing video resolutions until the test fails to complete in a reasonable amount of time or reaches a resolution of 4K. This process assesses the maximum video capability of your network — which may exceed the capabilities of your device.


When the test is complete you will get actionable results including maximum resolution, load time, buffering percentage and suggested devices to stream video on at that performance level.

Optimize your online video experience

Taking a video test will give you valuable information to help you optimize your video streaming experience. Here are some examples of what you can do with Speedtest video testing:

  • Find out whether your network is giving you the expected video quality playback
  • Get recommendations for which devices will work best for video on your network
  • Compare historical streaming experiences to your current network performance with test result history
  • Investigate potential outages of the services you are trying to use with Ookla’s Downdetector® if you find that you are unable to stream your video even when the test finds that your video streaming quality meets or exceeds the resolution supported by your device

Where to find video testing in the Speedtest Android app

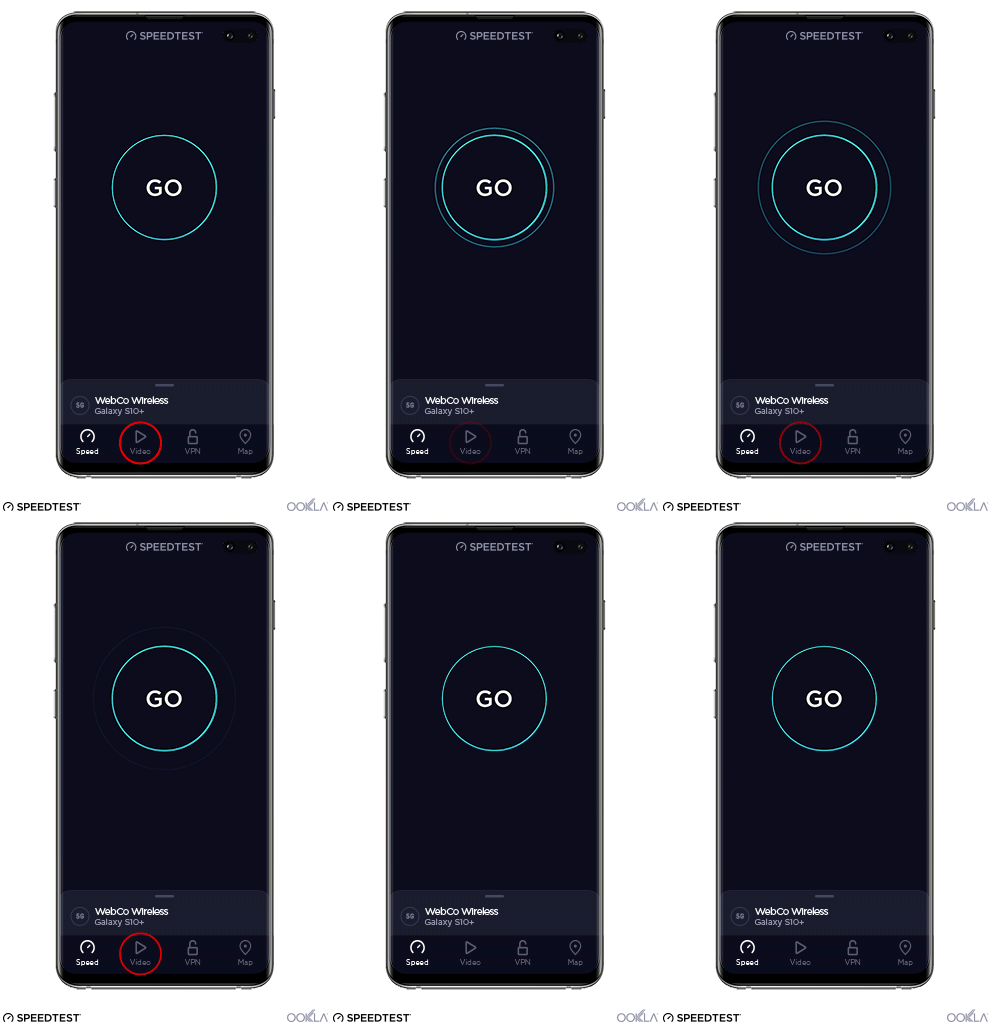
You can now test your network’s video streaming capability in the Speedtest for Android app. Simply open the app and tap on “video” from the menu bar at the bottom of the screen. This will initiate the video test and within one minute you’ll have actionable results and recommendations to optimize your online video experience.


Take a video test today today by opening the Speedtest app on your Android device. If you don’t already have the app, you can download it from the Google Play Store.


Ookla retains ownership of this article including all of the intellectual property rights, data, content graphs and analysis. This article may not be quoted, reproduced, distributed or published for any commercial purpose without prior consent. Members of the press and others using the findings in this article for non-commercial purposes are welcome to publicly share and link to report information with attribution to Ookla.