| May 4, 2026

Europe's Hidden Mobile Performance Gap: Peak-Hour Congestion and Seasonality

Evening performance drop exposes the congestion problems telecom policy still misses.

The standard way of evaluating mobile network quality in Europe still leans heavily on aggregate metrics. National median speeds, coverage percentages, and 5G adoption rates are useful, but they flatten the hour-by-hour load profile that determines how networks feel when demand is highest.

Across the 30 markets in this analysis, the most consistent trough in download performance appears between 19:00 and 21:00 local time. We use that window as the evening peak and compare it with 02:00 to 05:00 local time, when demand is lowest. The difference between those windows captures a practical form of congestion: how much performance is lost when shared radio, backhaul, and core resources are under pressure.

This analysis draws on consumer-initiated Speedtest® samples across all 27 EU member states plus Norway, Switzerland, and the United Kingdom during Q1 2026, with trend and seasonality views extending from January 2024 through March 2026. For this article, we developed a peak-hour congestion framework that combines five dimensions of degradation: median download speed loss, loaded latency inflation, queue growth, jitter increase, and the decline in 10th percentile download speeds. The higher the value on the 0 to 100 scale, the more severe the measured peak-hour degradation.

Key Takeaways:

  • Spain is Europe’s most congested mobile market at evening peak, with a framework value of 62. Median download speed fell from 161.20 Mbps off-peak to 54.10 Mbps during peak hours in Q1 2026, a 66% drop, while loaded latency increased 60% to 724 ms.
  • Six markets maintained near-flat daily performance. Luxembourg (~0), Belgium (2), Norway (8), Slovakia (8), France (11), and the Netherlands (12) sit in the resilient tier, each with distinct structural characteristics across data-usage intensity, population mobility, and network density that help mitigate congestion.
  • Switzerland is the clearest example of why headline metrics alone are insufficient. Despite having Europe’s highest mobile ARPU at €50.90 (US$59.58) per subscriber and a 74% 5G connection share, Switzerland has the third-highest congestion value in the analysis at 47. Its median speed drop is moderate, but loaded latency rises 46% and the bottom 10% of users see download speeds fall 81%, from 25.50 Mbps to 4.80 Mbps.
  • Investment intensity and network management explain more than wealth, spectrum holdings, or market concentration. Capex as a share of revenue shows the strongest relationship with congestion resilience among the structural variables tested, although it is a moderate relationship rather than a deterministic rule. Operator gaps reinforce the point: in Poland, the evening-peak gap between T-Mobile and Plus is 4.1x, compared with 2.2x off-peak, meaning peak load can amplify rather than merely reflect baseline differences.
  • 5G improves the experience under load, but it does not remove congestion. Across 10 high-5G European markets, the average speed drop at peak is 32% for 4G and 27% for 5G. The more consistent 5G advantage is latency: 5G loaded latency at peak is 12% to 44% lower than 4G in every market tested.
  • Seasonality materially changes the congestion picture. Spain and Croatia show repeated summer pressure linked to tourism, Nordic markets show a summer shift toward rural and holiday-home locations, while Switzerland and Austria see congestion ease in summer, pointing to winter demand concentration at ski resorts as the sharper stress pattern.

Network Congestion Is a Regulatory Blind Spot

Mobile networks operate over a shared radio medium where spectrum is finite and the capacity of each cell sector is bounded by spectral efficiency, antenna configuration, interference management, and backhaul dimensioning. Unlike fixed broadband, where each subscriber typically has a dedicated last-mile connection, every mobile user in a cell sector draws from the same pool of radio resources.

When simultaneous demand exceeds what the available spectrum, radio configuration, and transport layer can deliver, per-user throughput falls, latency increases as queues build in network buffers, and the experience of every user on that sector deteriorates in tandem. This is why congestion is not just a speed issue. It is also a latency, consistency, and worst-user issue.

The anatomy of a single mobile cell at off-peak versus evening peak, showing shared spectrum, queue buildup, throughput compression, and tail-user collapse

The challenge is compounded by the geographic unpredictability of mobile demand. Operators must dimension networks for the busiest hour of the busiest day, even though average utilization is far lower. They must also do so across thousands of sites where traffic patterns shift with commuter flows, events, tourism, and seasons.

Despite this, most regulatory benchmarks and national performance reports still do not distinguish clearly between off-peak and peak-hour outcomes. The EU’s Digital Decade targets specify gigabit networks for all households and 5G coverage for all populated areas by 2030, but they do not set a comparable benchmark for performance under load.

BEREC’s 2024 implementation report on geographical surveys of network deployment also illustrates the difficulty. Expected peak-time speed is treated as one of the more challenging indicators for regulators to collect and standardize, and mobile quality-of-service reporting remains uneven across markets. The European Commission’s proposed Digital Networks Act may help simplify investment conditions, but it does not remove the need for better evidence on how networks perform during the hours of greatest demand.

Profiling Congestion Requires Looking Beyond Headline Speed

The congestion framework used for this article combines five dimensions of peak-hour degradation, each capturing a different facet of user experience. Throughput loss, weighted at 30%, measures the drop in median download speed from off-peak to peak. Loaded latency inflation, also weighted at 30%, captures how much delay increases during active data transfer, a direct indicator of network queuing that affects video calls, gaming, interactive web browsing, and increasingly AI-enabled real-time applications.

The five components of the peak-hour congestion framework — speed drop 30%, latency under load 30%, buffer pressure 20%, stability decay 10%, worst-served users 10%

Queue growth, weighted at 20%, isolates congestion from baseline network quality by measuring how the gap between idle and loaded latency widens. Jitter inflation, weighted at 10%, reflects the stability degradation that impairs real-time communication. The 10th percentile download drop, weighted at 10%, captures how much the worst-served users suffer, which is especially relevant to policy debates about universal service quality.

Loaded latency is particularly important. A network can maintain superficially reasonable throughput while loaded latency rises from 400 ms to 700 ms or more, degrading video calls, increasing application response lag, and creating a perceptibly worse user experience that median speed alone does not reveal.

A Wide Peak-Hour Gap Separates Europe’s Best and Worst Mobile Markets

The 30 markets analyzed segment into four tiers when applying the congestion framework used for this research. The top and bottom of the distribution are not separated by marginal differences. Spain’s framework value of 62 is more than five times the Netherlands’ 12 and roughly eight times Norway’s 8.

Spain Tops Europe's Peak-Hour Congestion Severity by a Wide Margin
Speedtest Intelligence® | Q1 2026

Six markets are congestion-resilient: Luxembourg, Belgium, Norway, Slovakia, France, and the Netherlands. These markets maintain near-flat performance profiles across the day. The Netherlands delivers 157.90 Mbps at evening peak, just 15% below its off-peak level. Norway’s loaded latency varies by fewer than 70 ms across the 24-hour cycle.

Belgium and Luxembourg show speed gains, meaning evening peak speeds actually exceed their nighttime baseline, likely reflecting business-hour demand relaxation (unsurprising in Luxembourg where many commute into and out of the country each day for work) and, in some cases, overnight energy-saving configurations that reduce available radio capacity (i.e., disabling higher bands and features like higher order carrier aggregation) during the off-peak reference window.

Europe's 24-hour mobile heartbeat across selected European markets, showing the synchronized evening trough

Eleven markets fall into the moderate tier. Speed drops here range from around 30% to more than 45%, but absolute peak performance varies significantly, from Bulgaria’s 142.80 Mbps to Romania’s 62.10 Mbps. Germany, Europe’s largest mobile market by revenue, sits in this tier with a 34% speed drop and a congestion trajectory that has been quietly worsening.

Ten markets show significant congestion. Italy, hosting the EU’s most fragmented mobile market structure (by HHI concentration), delivers just 45.20 Mbps at peak, the lowest absolute peak speed of any major EU economy in the analysis. The Herfindahl-Hirschman Index (HHI) is a measure of market concentration: lower values indicate a more fragmented (or competitive) market structure. This potentially reflects the real-world network quality costs imposed by the market’s historical focus on price competitiveness.

Three markets face severe congestion: Switzerland, Ireland, and Spain. All three are three-operator markets (although DIGI is building a fourth network in Spain) and all three feature below-average capex intensity. Ireland and Spain also combine low to medium ARPU, high mobile data usage, and widespread unlimited or near-unlimited tariffs, which likely contribute to higher load pressure per subscriber despite high FTTH penetration.

Peak-hour congestion framework values across 30 European markets, Q1 2026 — Spain, Ireland, and Switzerland in the severe tier

The three Benelux markets form a notable cluster at the resilient end of the scale. Their shared characteristics, including small and dense geography, high urbanization, strong fixed broadband penetration supporting Wi-Fi offload, mature three-operator market structures (changing as DIGI becomes a fourth operator in Belgium), and less exposure to national-scale seasonal coastal tourism, appear to create structural conditions that resist congestion.

Speed Rankings Alone Disguise Severe Latency Degradation in Europe’s Wealthiest Markets

Switzerland’s congestion outcomes challenge several assumptions about what makes a well-performing mobile market. It features the highest mobile ARPU in Europe at €50.90 (US$59.58) per subscriber (based on GSMA Intelligence data), the highest 5G connection share at 74%, and 99% reported outdoor 5G population coverage. In aggregate speed terms, Switzerland would not look like an obvious congestion outlier.

Under the congestion framework, however, Switzerland ranks third-worst in Europe with a value of 47. The headline speed drop of 36% appears moderate. But loaded latency inflates 46% at peak, and the bottom 10% of Swiss users experience an 81% collapse in download speed, from 25.50 Mbps off-peak to 4.80 Mbps at peak. This 10th percentile collapse is the worst of any market in the analysis, meaning the most vulnerable Swiss mobile users, likely those in congested urban cells or at the edge of coverage, effectively lose functional mobile broadband during evening hours.

Each European market's evening-peak failure mode — speed loss versus latency inflation, with severely congested markets clustering in the upper-left quadrant

Operator-level data identifies the specific source of the problem. Sunrise, which holds approximately 27% of the Swiss mobile market with 3.1 million mobile customers, shows a 73% speed drop at peak, falling from 164.00 Mbps off-peak to 44.50 Mbps. Its loaded latency inflates 57% and its 10th percentile download speed falls to 3.10 Mbps. Swisscom, operating in the same geography with approximately 54% market share, drops 31% and maintains 97.90 Mbps at peak with a 10th percentile download speed of 10.60 Mbps. Salt, the third operator, falls between the two with a 41% speed drop.

The difference is not simply that Swisscom is faster in general. Off-peak, the gap between the fastest and slowest Swiss operator is only 23.40 Mbps, or 1.17x. At peak, the gap expands to 53.40 Mbps, or 2.2x. Evening demand therefore exposes an operator-level resilience gap that is mostly hidden overnight.

Spectrum holdings provide part of the explanation. Swisscom holds 743 MHz of total assigned spectrum, including 613 MHz of mid-band capacity across the 1500, 1800, 2100, and 2600 MHz bands. That is roughly 2.7x the mid-band depth available to Sunrise (224 MHz) or Salt (220 MHz). Because Swisscom also serves a larger customer base, that advantage is less dramatic on a per-subscriber basis, but it remains directionally favorable. The fact that Salt has broadly comparable mid-band depth to Sunrise yet manages a materially better peak outcome suggests that deployment, traffic mix, site configuration, and network management matter alongside raw MHz.

Switzerland also presents a useful caution on investment interpretation. Its capex-to-revenue ratio is the lowest in the analysis at approximately 10% (based on GSMA Intelligence data), but absolute capex may look less weak because Swiss ARPU is high. The ratio still matters because it measures reinvestment intensity: how much of a high-revenue market is being put back into capacity.

Loaded Latency Reveals a Different Map of European Mobile Stress
Speedtest Intelligence® | Q1 2026

Regulation may also contribute. Switzerland’s non-ionizing radiation rules are more precautionary than the international exposure limits used in many other markets, and new or modified antenna installations must demonstrate compliance. These rules do not explain the Sunrise-Swisscom gap on their own, but they can raise the practical complexity of densification and capacity upgrades. The combination of high ARPU, low reinvestment intensity, strict site constraints (forcing high grid density), and large operator-level dispersion points to a market where headline metrics mask material quality-of-experience gaps that only become visible under demand pressure.

Intra-Market Differences Can Exceed Inter-Market Gaps

Our operator-level analysis shows that congestion outcomes within a single country can diverge more sharply than outcomes between countries. Four markets illustrate different patterns.

Spain, for example, shows a high-ceiling, high-collapse pattern. Orange, operating as part of MasOrange following the 2024 merger with MasMovil, delivers 329.40 Mbps off-peak, among the fastest off-peak speeds recorded for any operator in any market in this analysis. By evening peak, this falls 72% to 91.20 Mbps, with the 10th percentile dropping 91%. The raw network capacity demonstrably exists. The challenge appears to be distributing that capacity under concentrated evening demand, a pattern consistent with the complexity of post-merger network integration and traffic migration.

Movistar starts from a more moderate off-peak level of 120.00 Mbps but drops just 26% and maintains 89.20 Mbps at peak. Vodafone Spain shows the weakest absolute peak performance at 27.30 Mbps, with loaded latency reaching 1,189 ms.

Spain's Operator Performance Diverges Sharply Under Peak Load
Speedtest Intelligence® | Q1 2026

Poland shows an investment-divergence pattern. T-Mobile delivers 99.50 Mbps at peak with a 10th percentile download speed of 11.80 Mbps. Plus manages 24.30 Mbps with a 10th percentile of 1.90 Mbps. The 75.20 Mbps gap between operators serving the same country is the largest intra-market spread in our analysis. Crucially, the off-peak gap is much smaller proportionally: T-Mobile is 2.2x faster than Plus off-peak, but 4.1x faster at peak. That means the result is not merely a static speed hierarchy (i.e., peak demand amplifies the gap).

Poland’s congestion outcomes are also improving overall, with evening peak speeds up 35% year-on-year, largely driven by the T-Mobile and Orange networks and by the recent launch of mid-band 5G.

Peak demand doesn't always widen the operator gap — sometimes it shrinks it. Off-peak versus evening-peak operator speed ratios across seven European markets

Ireland, by contrast, shows a shared-ceiling pattern. Three, Vodafone, and Eir diverge widely off-peak, ranging from 99.20 Mbps to 167.00 Mbps. At peak, all three converge within a 13.80 Mbps band, between 34.60 Mbps and 48.40 Mbps. This convergence pattern is unusual among the operator markets analyzed and points to a structural capacity ceiling rather than one operator underperforming in isolation. Ireland’s three-operator market, high per-connection data usage, and low collective capex-to-revenue ratio (atop a rural-skewed geography) appear to create conditions where no operator can easily break away from the market-wide evening constraint.

Portugal, meanwhile, exhibits a deterioration pattern. The country’s evening-to-night performance gap widened from 11% to 34% between Q1 2025 and Q1 2026, the fastest deterioration in our analysis. The primary driver at the operator level is MEO, where peak 10th percentile download speed has fallen to 1.40 Mbps, the lowest figure recorded for any major operator in our European operator sample. This effectively represents a loss of functional service for MEO’s worst-served users during peak hours.

DIGI, which launched as Portugal’s fourth MNO in November 2024, shows a 25% speed drop with near-zero latency inflation of 7%. That result is consistent with the low utilization expected from a new entrant still building its customer base, rather than evidence of superior network engineering at full market scale.

5G Raises the Speed Ceiling but Does Not Prevent It From Being Hit

A persistent assumption in regulatory and industry discourse is that 5G deployment will resolve capacity constraints. Our data offers a more nuanced picture.

Across 10 European markets with significant 5G adoption, we segmented Speedtest® results by device-reported connection type. The average speed drop at peak is 32% for 4G and 27% for 5G. In absolute terms, 5G is substantially faster. A 5G user in Spain still receives 106.40 Mbps at peak versus 20.30 Mbps for a 4G user in the same market.

The proportional pattern, however, varies by market. In France and Norway, 5G peak speeds are actually higher than the 5G off-peak baseline. In Denmark and Switzerland, the proportional 5G speed drop is steeper than the 4G drop. The broad conclusion is therefore not that 5G removes congestion but that it raises the performance ceiling and often softens the evening decline, but it remains exposed to shared capacity constraints.

Peak-hour 4G versus 5G comparison across 10 European markets — 5G's most consistent advantage at evening peak is loaded latency, not the proportional speed drop

The more consistent 5G advantage lies in latency under load. In every market tested, 5G loaded latency at peak is lower than 4G, by margins ranging from 12% in Denmark to 44% in the United Kingdom. The U.K. contrast is the starkest. 4G users experience 904 ms loaded latency at peak, while 5G users experience 507 ms. This gap means congested 5G still materially outperforms congested 4G for applications sensitive to delay, including video conferencing, cloud gaming, interactive browsing, and emerging live voice and video AI applications.

This distinction matters for how policymakers and operators frame the 5G value proposition. 5G deployment expands the performance ceiling and delivers a real latency improvement that persists under congestion. But it should not be conflated with congestion resilience. A market can achieve high 5G adoption and still rank among Europe’s most congested. The variables that determine whether peak-hour performance holds, as mentioned earlier, are a combination of capacity investment, densification, spectrum deployment depth, backhaul dimensioning, and traffic management, not the generation label attached to the radio interface.

Seasonal Travel Shifts Europe’s Mobile Congestion Patterns

Analysis of monthly Speedtest® data from January 2024 through March 2026 shows that congestion is not static. It follows seasonal rhythms that differ sharply by geography. This long window allows two summers, two winters, and Q1 2026 to be compared.

Our seasonality analysis uses broad evening and nighttime windows rather than a single hour, reducing sensitivity to daylight-saving changes and one-off hourly effects. The metric here is the ratio of evening download speed to nighttime download speed. Lower values indicate a larger evening gap.

Three seasonal patterns emerge. In several markets, congestion worsens materially in summer. Spain shows the most extreme swing. The evening-to-night speed ratio fell from 60% in January 2024 to the low teens during summer 2024, then remained much weaker in July and August 2025 than in winter.

This aligns with Spain’s position as one of Europe’s most-visited countries. Spain welcomed 96.8 million international tourists in 2025, with a large share of arrivals concentrated in the summer months. These visitors are disproportionately mobile-dependent because they lack residential Wi-Fi offload, and they cluster in geographically constrained coastal zones.

Europe's seasonal congestion fingerprints — monthly evening-to-night download speed ratios from January 2024 through March 2026, grouped by pattern

Croatia shows an even more precise seasonal signature. Evening peak speed fell from 58.70 Mbps in January 2024 to 34.90 Mbps in August 2024. The pattern repeated in 2025, with evening speed falling from 71.60 Mbps in June to 35.30 Mbps in August. Croatia recorded 4.7 million tourist arrivals and 27.2 million tourist nights in commercial accommodation in August 2024, a major seasonal load for a country with a resident population of roughly 3.9 million. The concentration of tourism along the Adriatic coast creates acute demand pressure on a relatively narrow cellular footprint.

Nordic markets show a different summer pattern driven less by inbound tourism than by domestic movement toward second homes and rural leisure areas. Norway’s evening peak speed dipped to 77.10 Mbps in July 2024 and 102.40 Mbps in July 2025, compared with 121.40 Mbps and 130.70 Mbps in the respective January periods. Norway has a large stock of holiday homes, many in low-density areas where cellular capacity is designed around lower year-round demand. When urban populations move to these areas during summer, demand shifts toward cell sites that may not be dimensioned for short seasonal peaks. Denmark, Sweden, and Finland display related patterns tied to summer-house traditions.

A final group moves in the opposite direction. In Switzerland, the evening-to-night speed ratio improved from 44% in January 2024 to 76% in August 2024, and from 63% in January 2025 to 85% in August 2025. Austria shows a similar, though less pronounced, pattern.

This points to winter demand concentration as the sharper stress period, likely reflecting a combination of indoor usage, tourism in ski regions, and more difficult terrain for capacity planning.

Investment Intensity Is the Better Indicator of Congestion Resilience

To test which structural factors may shape congestion outcomes, we compared the framework values against market variables drawn from GSMA Intelligence, national statistical authorities, and public data sources.

Our results challenge several common assumptions. National wealth does not explain congestion well. GDP per capita has only a weak negative relationship with measured congestion. For example, Austria, with a GDP per capita of €49,777 (US$58,269; per World Bank data), carries a congestion value of 37, while Romania, at €17,154 (US$20,080), records a lower framework value of 28.

Mobile ARPU tells a similarly mixed story. Higher ARPU appears to support higher absolute peak speeds, but it does not determine whether those speeds hold under peak demand. Switzerland has Europe’s highest mobile ARPU and still ranks third-worst under our congestion framework. ARPU can fund capacity, but it only improves resilience when revenue is actually converted into spectrum deployment, site upgrades, densification, and transport capacity.

Spectrum holdings also require care. Total spectrum per operator shows only a weak relationship with congestion outcomes, and mid-band spectrum per operator shows almost no relationship in this dataset. Spectrum enables capacity, but it does not create capacity on its own. It must be deployed, sectorized, integrated with backhaul, and matched to traffic demand. This is where cell site density likely matters.

The strongest structural relationship we found is capex as a share of revenue. In plain terms, markets where operators reinvest a larger share of revenue tend to hold up better at peak, although the relationship is moderate rather than absolute. Norway, at 24% capex-to-revenue, records a framework value of 8. Switzerland, at 10%, records 47. Both are small, wealthy, three-operator markets with high ARPU. The difference is not simply that one has more money available. It is that one reinvests a larger share of revenue into the network (but also, importantly, has a less intense usage profile).

Market concentration, measured by the Herfindahl-Hirschman Index, shows a weak and counterintuitive negative relationship with congestion. More concentrated markets are not necessarily worse. Italy, the most fragmented mobile market in our sample by this measure, carries a framework value of 41 and the lowest absolute peak speed of any major EU economy at 45.20 Mbps. The Netherlands, among the more concentrated markets with three operators, records 12 and delivers 157.90 Mbps at peak.

Rural population share shows a moderate positive relationship with congestion and the strongest relationship in our dataset with 10th percentile performance. More rural countries systematically deliver weaker outcomes for the most poorly served users at peak (likely contributing to Ireland’s weak standing, for instance), consistent with the challenge of dimensioning capacity across dispersed populations and more extensive coverage footprints.

Peak-Hour Performance Should Become a Regulatory and Competitive Benchmark

The gap between what European mobile networks can deliver under light load and what they provide during the hours of highest demand is material, measurable, and largely invisible to most public benchmarks.

The trajectory of Speedtest® data offers cautious grounds for optimism in some markets. Ireland’s evening peak speed improved from 20.90 Mbps in Q1 2025 to 47.00 Mbps in Q1 2026, a 125% gain (reflecting diversified spectrum deployment post-auction). Poland improved 35% over the same period, reflecting the early impact of mid-band 5G rollout. The U.K. improved 18%, a trend consistent with early network-integration effects following the Vodafone-Three merger, which completed on 31 May 2025.

Year-on-Year Trajectory Splits Europe Into Improvers and Decliners
Speedtest Intelligence® | Q1 2025 vs Q1 2026

But these gains coexist with deterioration elsewhere. Portugal’s evening-to-night performance gap widened from 11% to 34% over 12 months, a 23 percentage point increase. Germany’s widened from 20% to 29%, a 9 percentage point increase, even though its evening speed improved slightly. In Germany’s case, nighttime performance improved faster than evening performance, widening the gap that consumers experience between low-load and high-load hours.

Congestion is not an inevitable consequence of demand growth (which itself is slowing in mature markets). Countries with sustained mobile investment intensity, well-managed spectrum deployment, sufficient densification, and enough revenue to fund capacity demonstrate that peak-hour performance can be maintained even as traffic grows or spikes shift.


Methodology

This analysis draws on Speedtest® data from consumer-initiated mobile Speedtest measurements. The primary snapshot covers Q1 2026, January through March, across all 27 EU member states plus Norway, Switzerland, and the United Kingdom. Trend and seasonality analysis extends from January 2024 through March 2026.

Peak hours are defined as 19:00 to 21:00 local time, confirmed as the consistent trough across markets by examining full 24-hour performance profiles. The off-peak baseline is defined as 02:00 to 05:00 local time. The off-peak period is not intended to represent normal consumer usage. It is a low-load reference window used to estimate what the network can deliver when demand pressure is minimal. However, the off-peak baseline should be interpreted as a low-load observed baseline, not necessarily a maximum engineering-capacity baseline, because some networks may apply overnight energy-saving configurations that reduce available radio capacity.

The peak-hour congestion framework combines five components: 30% median download speed drop, 30% loaded latency inflation, 20% queue growth, 10% jitter inflation, and 10% 10th percentile download speed drop. Higher values indicate more severe measured peak-hour degradation.

Ookla retains ownership of this article including all of the intellectual property rights, data, content graphs and analysis. This article may not be quoted, reproduced, distributed or published for any commercial purpose without prior consent. Members of the press and others using the findings in this article for non-commercial purposes are welcome to publicly share and link to report information with attribution to Ookla.

| April 29, 2026

Starlink-powered O2 Satellite Puts the UK at the Front of Europe’s D2D Race

Early Ookla signal scan data shows broad but shallow uptake across UK not-spots, as Ofcom’s first-mover framework turns the market into Europe’s direct-to-device testbed

The UK has become the first country in Western Europe where a smartphone can reach a satellite directly without specialist hardware or a separate app. Virgin Media O2 launched O2 Satellite on February 26, 2026, using SpaceX’s Starlink Mobile constellation over licensed 1800 MHz spectrum, and priced it at £3 per month on Pay Monthly plans or at no extra cost on high-end “Ultimate” tariffs. The launch follows a partnership announced in October 2025 and an Ofcom authorization framework finalized in December 2025.

Analysis of Ookla’s background signal scan data captures that launch from the real-world handset side. Between July 2025 and March 2026, the number of unique monthly UK users registering with a direct-to-device (D2D) satellite rose from negligible early levels to a clearly visible footprint, an order-of-magnitude shift that has already lifted the U.K. from a rounding error in our global D2D dataset to the world’s third-largest market by unique-user count by March 2026, behind only the United States and Australia and ahead of Canada, Chile, and Peru.

Key Takeaways:

  • The UK has quickly become one of the largest detected D2D markets globally, but not one of the deepest. By March 2026, the UK ranked third among countries with live commercial D2D services by detected D2D users, behind the U.S. and Australia, but only eighth by D2D user share and ninth by D2D scans per detected user. In the U.K., the dominant pattern appears to be many users briefly crossing into satellite-eligible conditions, with relatively few remaining on D2D for extended periods.
  • D2D utilization within the UK mobile base reached 0.30% in March 2026 (based on the share of all mobile users coming from D2D), and scans per D2D user averaged four, well below Canada’s 29. The utilization rate matches the US nine months into its T-Mobile service, and within VMO2’s addressable base utilization rises to approximately 1.4%, in line with more mature D2D markets.
  • Geographic concentration tracks the UK’s known coverage gaps. From November 2025 onward, we observed D2D samples lighting up across the Scottish Highlands, the Outer Hebrides, the Welsh uplands, the Southwest peninsula, and the North York Moors, the same areas Ofcom’s Connected Nations 2025 report identifies as all-operator coverage blackspots and that the £1.3 billion Shared Rural Network is committed to closing by January 2027.
  • A multi-operator D2D split is already forming in the UK. VodafoneThree received Ofcom’s second D2D license variation on April 15, 2026 on 900 MHz (Band 8), paired with AST SpaceMobile’s broadband-capable BlueBird satellites through Satellite Connect Europe. BT/EE has not yet announced a D2D handset service and is instead prioritising fixed Starlink broadband. It also appears best placed to support any satellite layer for the UK’s Emergency Services Network, the national communications platform being built to connect police, fire, ambulance and other first responders.

Methodological note: This analysis draws on nine months of Ookla signal scan data from UK Android handsets that registered at least once with a known D2D carrier network between July 2025 and March 2026. Coverage is limited to recent Samsung flagships, reflecting O2’s narrower device support versus more mature D2D services elsewhere. Our data shows O2 Satellite emerging in the data before its public launch on February 26, 2026, then scaling across the first full month of commercial availability.


O2 Satellite was already ramping before the public launch

Virgin Media O2 announced its Starlink Direct to Cell (D2C) partnership on October 30, 2025, describing O2 Satellite as a service that would initially provide messaging and data, work automatically in areas without traditional O2 coverage, and aim to raise O2 landmass coverage from 89% to more than 95% within 12 months of launch. The same announcement said internal trials were already underway.

Analysis of our background signal scan data offers the first clear empirical sign of a structured internal rollout becoming visible in passive measurement before any public announcement. UK detected D2D users were essentially negligible and flat between July and October 2025. In November, during the period in which VMO2 publicly noted that its employees were “already using the technology in real-world conditions across the country,” we captured a sharp inflection in usage, with activity moving well above the Q3 2025 baseline by the end of 2025.

UK D2D activity jumped twice before and after launch
Ookla Background Signal Scans | United Kingdom, July 2025 to March 2026 | Q3 2025 average = 1x

The second inflection landed in February 2026, when Ofcom granted VMO2 its first D2D license variation on 17 February. The Exemption Regulations came into force on February 25th, and the consumer service switched on the following day. As a result, detected D2D activity stepped up again in both February and March post-launch and is now scaling further.

The UK’s early D2D usage is broad, but still shallow

The UK ranked third globally by unique D2D users by March 2026 in our dataset, with 11% of the world’s tracked D2D user count, behind the U.S. at 37% and Australia at 14%. It sits ahead of Peru, Canada, Chile, Ukraine, New Zealand, Puerto Rico, and Japan. On scan volume the UK is sixth, a more modest figure that reflects how recently the O2 service launched and how little behavioral load each UK user is yet carrying.

UK ranks third by detected D2D user share, but scans-per-user remain low
Ookla Background Signal Scans | March 2026, Speedtest-derived

To clarify, a unique detected user means a device appeared on a D2D network (like Starlink Mobile) at least once in the month. Scans per detected user indicate how much repeat background activity (or usage of the D2D service) those detected users generated.

In the context of the UK data, this means the initial D2D service is appearing across a meaningful detected user base, but each detected user is generating relatively few satellite scans. For example, one user might take a long trip into the backcountry, generating lots of scans over the course of days. Another user might briefly link to a satellite during a walk in the country, generating only one scan. Both are considered unique D2D users, but one generates far more scans. That points to short or intermittent satellite registrations, a fallback service that appears at the edge of terrestrial coverage (which may be less likely to be encountered frequently in the U.K. compared to other large landmass countries due to the very high level of urbanization, see below), and a product that is still constrained by few supported devices (only the two most recent generations of Samsung flagships are supported), supported apps, outdoor use, and the requirement for an open view of the sky.

It would be premature to read scan depth alone as a direct measure of user engagement or paying customers at this early stage. Background scan cadence, device mix, app eligibility, operating-system behavior, and movement patterns all affect the data. Even so, the cross-country contrast is large enough to be analytically useful here. In the U.K., the dominant pattern appears to be many users briefly crossing into satellite-eligible conditions, with relatively few remaining on D2D for extended periods. Penetration within the mobile base (based on the share of all signal scans) reached 0.30% in March 2026, compared with 0.46% in the U.S., 0.70% in Canada, 1.26% in Chile, and 1.91% in New Zealand. That places U.K. penetration at roughly the level the U.S. had reached within its first nine months of service. Within VMO2’s addressable base, and assuming our background scans distribute across U.K. operators in approximate proportion to their mobile market share, penetration rises to approximately 1.4% in March 2026, closer to more established markets despite only six weeks of commercial service.

The contrast with the U.S. and Canada is instructive. Both those markets have seen D2D user counts fall since summer 2025, by 17% and 48% respectively through March 2026, coinciding with T-Mobile and Rogers ending their initial free-trial D2D tiers and moving to pricing gated by high-tier plans. VMO2 launched with a £3 bolt-on and free inclusion on its Ultimate tariffs from day one. The U.K. model therefore likely avoids the drop that free-trial expiration has produced in mature markets, though whether that pricing structure holds as the service scales beyond the early-adopter cohort is an open question. Seasonality is also likely to matter: outdoor travel and recreation typically dip in winter and should be watched again through spring and summer 2026.

The geospatial pattern shows D2D forming at the edge of O2’s network

Analysis of the geospatial distribution of the U.K. D2D usage shows three phases between November 2025 and March 2026. In November and December, the footprint was sparse and more concentrated in southern and eastern England (likely reflecting early testing), including areas closer to higher population density and travel corridors. By January and February, detections had spread more clearly into Wales, the Midlands, northern England, and Scotland (concentrated in the areas that Ofcom’s Connected Nations reports identify as the U.K.’s most coverage-constrained, which also happen to be popular for outdoor activities).

This pattern is important because it complicates the idea that D2D demand is only about the most remote places. O2 Satellite works where the main O2 network is unavailable and satellite coverage is available (notably excluding the major indoor cellular coverage gaps that persist), which means it can matter in partial not-spots as well as total not-spots. A partial not-spot can still be a real coverage gap for an O2 customer, even if another mobile operator has terrestrial service there. In practical terms, a hillwalking route, coastal road, or visitor-heavy rural area can be a D2D use case even when it is not a vast wilderness.

In Scotland, D2D usage clusters have been observed in Argyll and Bute, the Northwest Highlands, the Inner Hebrides, and the Outer Hebrides. Ofcom’s latest figures put Scotland at 89% 4G coverage from at least one operator and 65% from all four, the lowest in the U.K., and parts of the Highlands and Islands still sit materially below that average. These are the places where a satellite-to-phone overlay has the most work to do, and they show up distinctly in our data.

A second cluster runs through Wales, concentrating in Powys, Gwynedd, and mid-Ceredigion. A third picks up across the Southwest peninsula, particularly North Devon, Exmoor, Bodmin Moor, and West Cornwall. A fourth sits across the North of England, across the Yorkshire Dales, the North York Moors, Northumberland, and parts of the Lake District. The East Anglian coast and the Lincolnshire Wolds complete the rural pattern.

This is why the overlap with Shared Rural Network target areas matters. The SRN is the £1.3 billion joint program between the four U.K. operators and government designed to raise all-operator 4G coverage to 89.2% of U.K. landmass by January 2027, with Scotland and Wales carrying the largest share of the uplift. As of the 2025 update, Extended Area Service site deployments are contributing an additional 0.25% to 1% of UK landmass coverage across operators, and 40 Scottish SRN sites are now live.

Our data suggests that for many of the same locations, D2D is now delivering a first-layer (albeit highly constrained in its current form) connectivity experience well before the SRN timeline concludes. This helps explain why early U.K. detections can appear around populated and visitor-heavy regions rather than only in the least populated parts of the country. The relevant question is not simply where the U.K. is empty but where compatible O2 customers, outdoor use, travel patterns, coastal and upland activity, and O2-specific terrestrial gaps overlap.

O2’s own launch framing points to that same use case. The operator described the service as helping users when hiking, climbing, doing water sports, sailing, or traveling in rural, coastal, and remote locations. The early geospatial evidence fits that edge-coverage proposition better than it fits a pure wilderness-connectivity proposition (aligning with trends we observed in the U.S. previously, where D2D usage skews toward national parks and popular hiking areas).

European geography makes D2D different from Australia, Canada, Chile, and Peru

As mentioned, the U.K.’s early D2D usage profile looks different from lower-density and more geographically expansive markets. World Bank data puts the U.K. at about 283 people per km2 in 2023, compared with about 3.5 in Australia, 4.6 in Canada, 26.5 in Chile, and 26.4 in Peru. The U.K. also has a much smaller land area than those markets and a dense pattern of towns, roads, and transport corridors.

That matters for D2D because the U.K.’s commercial opportunity is not primarily about bringing basic connectivity to vast unserved interiors. Instead, it is about filling residual gaps in a market where terrestrial mobile networks already cover most outdoor premises and much of the country’s landmass, but where rural, coastal, upland, road, indoor, and operator-specific gaps remain highly consequential for users.

This makes O2 Satellite (and future competing D2D services in the U.K. and elsewhere in Europe) strategically different from a terrestrial substitute. O2 says the service lifts its landmass coverage from 89% to 95%, equivalent to an area around two-thirds the size of Wales. But O2 Satellite is not equivalent to Ofcom’s good-quality 4G coverage definition, which includes a sustained 2 Mbps downlink and the ability to sustain a 90-second voice call. O2’s own public help page confirms that standard text messaging and standard voice calls, including emergency calls, are not currently supported on O2 Satellite, and that 999 texts and government emergency alerts are similarly unavailable while connected to the service. This distinction matters commercially (especially for the towerco business model) and politically, since it means satellite coverage is not yet interchangeable with terrestrial mobile coverage such as that delivered by the SRN. That will very likely change as D2D solutions become more capable.

Ofcom’s framework turned U.K. D2D into a first-mover licensable mobile service

The U.K.’s D2D market was the first in Western Europe because the U.K.’s regulator acted first. Ofcom’s December 2025 statement set out a framework for authorizing D2D in mobile spectrum that was the earliest in any European country and broadly followed the Federal Communications Commission’s (FCC) Supplemental Coverage from Space model in the U.S., though it extended authorization across a wider set of eligible bands, including 700 MHz, 800 MHz, 900 MHz, 1400 MHz, 1800 MHz, 2.1 GHz, and 2.6 GHz.

The authorization works through two instruments. The first is a license exemption for handsets and SIM-enabled devices, made under section 8(3) of the Wireless Telegraphy Act 2006, which came into force on February 25, 2026 (applying in the U.K. and territorial seas, excluding the Channel Islands and the Isle of Man). The second is a variation to each mobile network operator’s existing wireless telegraphy license to add a D2D schedule on specific bands. VMO2 received the first such variation on 17 February 2026 on 1800 MHz (Band 3).

This spectrum choice has important operational consequences. Band 3 is a mainstream global LTE and 5G carrier, supported on almost every modern smartphone, which means handset compatibility for O2 Satellite is effectively a question of which devices VMO2 whitelists rather than which devices can physically receive the signal.

The date sequence also shows how directly regulation shaped launch timing. Ofcom received Telefónica (O2 owner) UK’s completed application on January 28, 2026, published notice of its intent to vary the license on February 4, approved the variation on February 12, made the exemption regulations on February 16, and said those regulations were intended to come into effect on February 25. O2 launched O2 Satellite on February 26.

The UK is moving from first launch to competitive testbed

O2 has a first-mover advantage in U.K. D2D, but it is unlikely to remain the only U.K. D2D architecture for long. On April 15, 2026, Ofcom granted a second D2D license variation to VodafoneThree on 900 MHz Band 8, authorizing a service that will run over AST SpaceMobile’s BlueBird satellites through the Satellite Connect Europe joint venture Vodafone Group and AST announced in early 2025. VodafoneThree has said customer trials will begin in summer 2026, with commercial launch targeted for the end of the year.

VodafoneThree is positioning its upcoming D2D service around data, voice, and SMS, which differs from O2’s current app-based data proposition and lack of standard voice and SMS. That reflects a constraint of Starlink’s large first-generation constellation, which is optimised for LTE messaging and low-throughput data, but should improve materially as V2 satellites add more capable payloads, greater cell capacity, and a broader spectrum base to support richer handset services.

The use of the 900 MHz band for VodafoneThree’s service also creates a different radio and device context from O2’s 1800 MHz implementation, although real-world performance will depend on satellite payloads, beam design, power limits, device support, software behavior, and interference constraints as much as on frequency alone.

Taken together, this means that the U.K. could become one of the first markets where two satellite-to-smartphone models are tested under the same national regulator, but with different operator spectrum positions, satellite partners, service propositions, and launch timing.

BT, which runs the U.K.’s largest mobile network through EE, has taken a different path. It announced a Starlink partnership in early 2026, but only for fixed home broadband to hard-to-reach premises, not for D2D handset services. That positions BT as the natural incumbent for any Emergency Services Network satellite D2D overlay, particularly because ESN is designed around resilient nationwide coverage for police, fire, ambulance, and other public safety users. The UK Space Agency opened a formal industry call on this in January 2026, but EE is still left without a consumer D2D handset product at a moment when its two largest mobile competitors are both moving.

The MVNO layer adds a further wrinkle, with Sky Mobile, Tesco Mobile, and Giffgaff on VMO2 and iD Mobile and SMARTY on VodafoneThree, each a potential future D2D reseller.

Europe still has to solve the harmonization question

The UK moved quickly because Ofcom created a national authorization route for D2D in mobile spectrum. The European Union is working through a more complex harmonization problem.

The Radio Spectrum Policy Group’s June 2025 D2D opinion was explicit about that tension. It said that D2D in harmonized ECS mobile bands is currently not possible in EU Member State ECS licenses, because those licenses and technical harmonization decisions were built for terrestrial mobile use. The RSPG recommended that the European Commission issue a mandate to CEPT to develop harmonized technical conditions for D2D-IMT satellite operations in ECS harmonized bands, with follow-up after WRC-27.

The WRC-27 link is important because Agenda Item 1.13 will test the global framework for connecting satellites directly to ordinary IMT handsets through mobile-satellite service allocations, including how those services can coexist with terrestrial mobile networks in bands between 694/698 MHz and 2.7 GHz.

This matters for operators and satellite providers because D2D becomes much more valuable when roaming, interference management, device support, emergency service obligations, lawful intercept, privacy, competition, and market access can be handled consistently across borders. That cross-border layer is now moving from theory into commercial reality, with Rogers extending satellite-to-mobile roaming for Canadian customers in the U.S. and KDDI expanding au Starlink Direct roaming from the U.S. to Canada, the Philippines, and New Zealand from June 2026.

The issue also intersects with the European Commission’s separate assessment of the future use of the EU 2 GHz MSS band, where current authorisations for Viasat and EchoStar expire in May 2027. That band is central to broader debates about 3GPP NTN, MSS continuity, potential new entrants, and European strategic autonomy, but would require new handsets to put into action.

The U.K. is therefore both ahead of much of Europe and still linked to European outcomes. Cross-border coordination, WRC-27 decisions, CEPT technical conditions, satellite market-access safeguards, and the availability of compatible devices will all shape how quickly D2D scales from national firsts to mass-market coverage features.

Ookla retains ownership of this article including all of the intellectual property rights, data, content graphs and analysis. This article may not be quoted, reproduced, distributed or published for any commercial purpose without prior consent. Members of the press and others using the findings in this article for non-commercial purposes are welcome to publicly share and link to report information with attribution to Ookla.

| April 1, 2026

Alpine Connectivity: How Mobile Networks Perform Across Europe’s Premier Ski Resorts

Austria leads on the slopes, where Alpine-specific auction incentives, public co-funding, and deep low-band spectrum holdings drive superior outcomes in some of Europe’s most challenging yet lucrative radio environments.

Europe’s largest ski resorts are among the most demanding environments for mobile networks. Extreme terrain, steep changes in elevation between sites and users, seasonal demand spikes that can exceed baseline capacity by an order of magnitude, and remote power constraints all combine to make Alpine connectivity an infrastructure challenge that separates well-invested operators from the rest.

For the tens of millions of visitors who pass through the Alps’ major ski resorts each winter, mobile connectivity is no longer a luxury. It underpins safety communications, real-time slope monitoring, social media sharing from the chairlift, and the growing dependence on digital lift passes and resort apps.

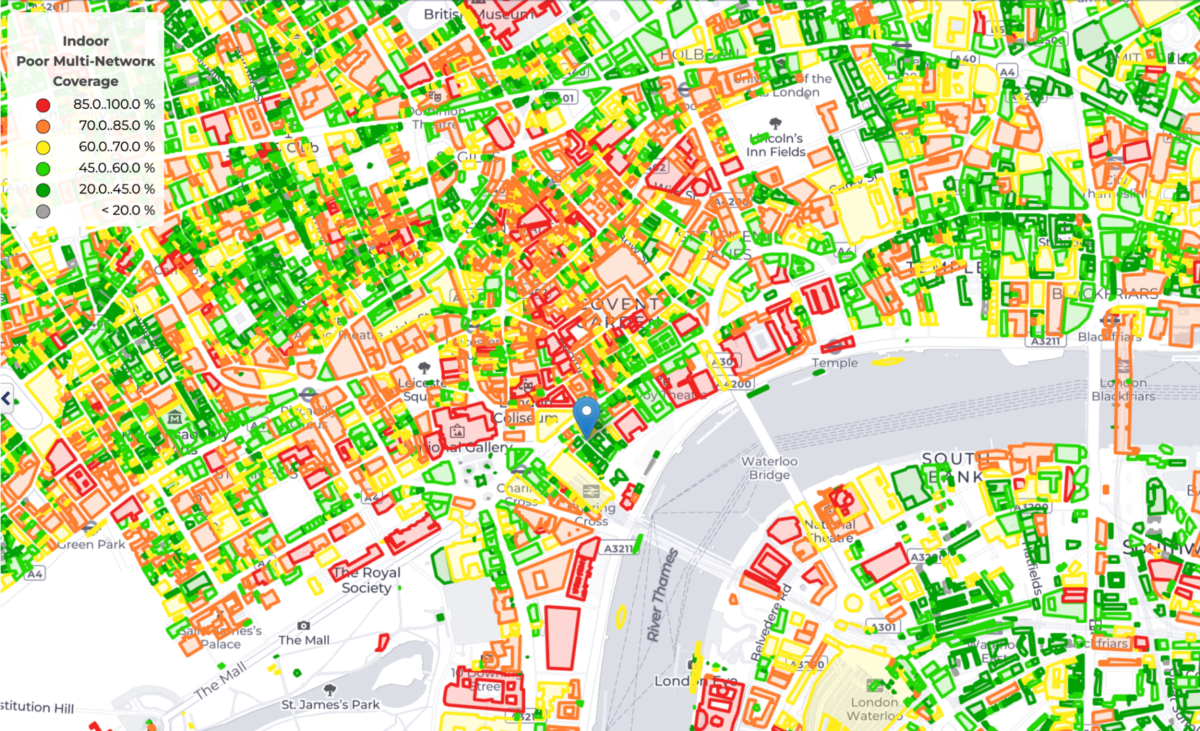
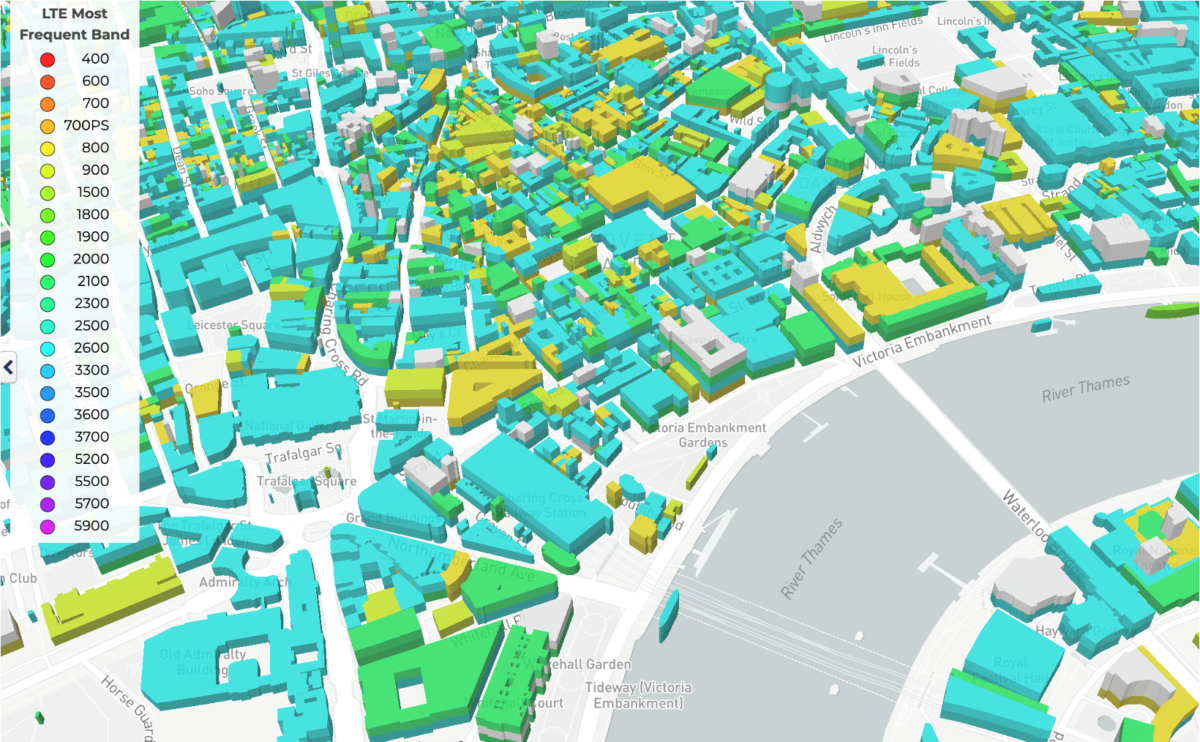
To understand how operators are meeting this challenge, we examined Speedtest Intelligence® data across 17 of Europe’s top ski resorts in five Alpine nations (France, Switzerland, Austria, Italy, and Germany) over a 12-month period from March 2025 to March 2026. The analysis draws on consumer-initiated Speedtest results, background signal scans measuring 4G and 5G signal strength and quality, and quality of experience (QoE) metrics including web page load times.

Key Takeaways

  • Austria leads its Alpine peers in median mobile download speeds at top ski resorts. A1 delivered median download speeds of 144.21 Mbps and the strongest 10th percentile outcomes (20.97 Mbps) of all 17 studied operators. The combination of Breitbandstrategie 2030 co-funding, alpine-specific spectrum auction incentives, and deep low-band holdings (Magenta Telekom alone holds 120 MHz across 700 MHz, 800 MHz, and 900 MHz spectrum) has resulted in infrastructure density that sustains performance even in the worst 10% of network conditions.
  • Italy’s mobile network outcomes at top ski resorts are the most competitively balanced of the five countries studied. The country’s four operators sit within just 16.66 Mbps of each other on median download speed (99.06 to 115.72 Mbps), and it is the only market where every operator exceeds 95 Mbps at the median. This reflects the broader national picture in a fiercely competitive and price-sensitive four-player market. The collective 700 MHz spectrum coverage obligation, which requires all operators to jointly reach 99.4% population coverage by June 2027, and the Milano Cortina 2026 Olympic 5G buildout, have driven competition across the Dolomites.
  • France has the widest within-country performance gap at resorts. SFR leads with a median download speed of 165.32 Mbps while Free trails at 48.79 Mbps, a 116.53 Mbps spread that reflects divergent spectrum and technology strategies across French Alpine terrain. While ARCEP’s New Deal Mobile has resulted in 3,200+ shared 4G sites and converging signal strength, shared infrastructure alone has not closed the throughput gap.
  • Germany’s top resorts record the lowest median download speeds (66.43 Mbps) but the best latency and fastest web page loads, while Swisscom leads the pack in Switzerland. Household-centric auction conditions tied to population coverage and transport corridors rather than tourism zones have left Bavarian resorts as a secondary priority in Germany. Without the geographic deployment mandates seen in France or the public co-funding of Austria, operator commercial strategy is the decisive variable, and Salt’s −110 dBm 4G RSRP, the weakest of any operator across all five countries, shows what happens when that incentive is absent.

The Alps poses a unique radio engineering challenge for mobile operators in tough mountain terrain

Providing cellular connectivity at ski resorts in the Alps is an order of magnitude more difficult than serving a comparable number of users in a lowland town. The physics, the logistics, and the economics all work against European operators.

Operators building remote mountain sites increasingly deploy hybrid solar-wind power systems that can supply as much as 80% of daily load from renewables, reducing diesel generator dependence by 70% to 80%, but the upfront engineering cost for a hardened Alpine installation can run 2.5 to 3.5 times that of an equivalent lowland site.

At 3,000 meters, base station equipment needs to operate in temperature ranges of −30 to +40 degrees Celsius across a single year. At −20 degrees Celsius, conventional lithium-ion batteries used for power backup retain roughly 50% of rated capacity, and charging rates must be throttled to prevent damage, meaning that a site designed for eight hours of backup power in summer may deliver fewer than four in winter.

Wet snow, which behaves like rain for signal propagation purposes, produces measurable attenuation on mid-band frequencies, while ice accumulation of even a quarter-inch on antenna radomes “changes the entire deployment scenario” according to engineering guidance. Avalanche protection adds further cost. Steel and concrete snow sheds, flexible net barriers, and reinforced catching dams are standard protective infrastructure around mountain base stations, and in extreme cases operators rely on remote avalanche control systems to manage hazards without placing personnel at risk.

Backhaul is a major constraint. Fiber installation in Alpine terrain requires specialized ASU (Aerial Self-Supporting) cable rated for heavy snowfall and high wind, or trenching through rocky substrate that in many areas can only be excavated during summer months. Where fiber is uneconomical, satellite backhaul can be installed in one to two days at roughly a third of the cost of a microwave link, and A1 in Austria has adopted this approach to connect alpine huts and remote mountain refuges through a partnership with the Austrian and German Alpine associations.

Similarly, Swisscom’s experience in the Ueschinen Valley in the Bernese Oberland illustrates the tradeoffs. When fiber was assessed for this mountain valley serving primarily summer-inhabited alpine huts, the cost-benefit case failed. Instead, Swisscom deployed a 5G site in autumn 2021, providing the entire valley with broadband at a fraction of the fiber cost (and making use of pre-existing fiber for the site backhaul only rather than needing to deploy it to every home).

Equipment logistics present their own challenge. Helicopter delivery to high-altitude sites is standard practice across the Alps, but thin air at elevation reduces rotor lift capacity, and flight windows are constrained by weather. Deutsche Telekom demonstrated one alternative at the Jizerska 50 cross-country ski race in the Czech Jizera Mountains, deploying a drone-mounted base station at 2.3 kilometers altitude that provided connectivity to over 4,400 race participants. This solution provided measured speeds of 95 Mbps download and 34 Mbps upload, a proof-of-concept for temporary surge capacity at mountain events (noting though that drone usage is still at an early stage in the Alpine context and features severe constraints like short battery runtime).

Austria’s sets the Alpine benchmark

Austria emerges as the strongest overall performer in ski resort connectivity in our analysis, combining the highest median download speeds with solid upload performance and latency. The country-level median download of 110.48 Mbps and upload of 17.69 Mbps both rank first among the five countries studied.

The four resorts studied (Ski Arlberg, Saalbach-Hinterglemm-Leogang-Fieberbrunn, Ischgl, and KitzSki) include Austria’s highest-profile ski domains, and our data suggests these destinations benefit from deliberate investment in Alpine connectivity.

Austria Leads European Ski Resort Download Speeds
Speedtest Intelligence® | Mar 2025 – Mar 2026

A1 drives much of this result. At 144.21 Mbps median download and 24.64 Mbps upload, A1 ranks second among all 17 operators on download and first on upload. Critically, A1 also delivers the strongest 10th percentile download performance of any operator at 20.97 Mbps, meaning that even users experiencing the worst 10% of conditions still receive a usable broadband-grade connection.

The gap between A1’s median and 10th percentile download across top Austrian resorts (a ratio of roughly 7:1) is notably tighter than operators like Orange in France (24:1) or Sunrise in Switzerland (21:1), pointing to more consistent infrastructure density across Austrian resort terrain.

Drei (3) follows at 100.89 Mbps median download, and Magenta Telekom sits at 86.85 Mbps. The 57.36 Mbps spread between A1 and Magenta is material but moderate by Alpine standards, and all three operators deliver acceptable performance for typical resort usage.

A1 and SFR Top the Operator Rankings at European Ski Resorts
Speedtest Intelligence® | Mar 2025 – Mar 2026

Analysis of signal strength data further supports A1’s lead. Its median 4G signal strength (known as Reference Signal Received Power or RSRP) of −100 dBm is the strongest of any operator in our data, and its 4G signal quality (RSRQ) of −9 dB is among the best. Magenta Telekom’s 5G signal stands out with a median RSRP of −95 dBm, the strongest 5G reading across all operators, likely reflecting the usage of its leading 120MHz-wide low-band allocation (prime spectrum for wide coverage that travels further in Alpine terrain) across the 700, 800, and 900 MHz bands.

Median web page load times at the top resorts in Austria cluster around 1.4 seconds across all three operators. The fact that A1’s outcomes here are essentially equivalent to Drei despite its significantly higher download speeds illustrate the diminishing returns of raw speed on QoE metrics that are dominated by deeper factors like core interconnect, peering, and content delivery network (CDN) routing. These are the behind-the-scenes infrastructure elements that determine how efficiently data travels between servers and end users, rather than simply how fast the last mile connection can go.

Italy’s tight operator spread points to competitive balance

Italy’s ski resorts deliver the second-highest median download speeds (101.85 Mbps) and present the most balanced competitive picture of any country in the analysis. The three Italian resorts studied (Sella Ronda, Cortina d’Ampezzo, and Kronplatz) sit directly in the zone that received Olympic infrastructure investment, and the post-Games persistence of this network will be a critical test for long-term connectivity improvement in the Dolomites.

All four operators measured (Vodafone, WINDTRE, Iliad, and TIM) sit between 99.06 Mbps and 115.72 Mbps on median download, a total spread of just 16.66 Mbps or roughly 14% variance. The strong showing is somewhat surprising, as it runs counter to Italy’s broader country-level mobile standing. In the latest edition of the Speedtest Global Index™, Italy ranked 52nd globally and ahead of only Germany among the peer group.

A1 and TIM Lead on 4G Signal Strength Across Alpine Resorts
Speedtest Intelligence® | Mar 2025 – Mar 2026 | Median 4G RSRP in dBm (closer to 0 = stronger signal)

Vodafone leads with a median download speed of 115.72 Mbps and with the lowest latency in the country (43 milliseconds). TIM, despite ranking last among Italian operators on median download speed at 99.06 Mbps, delivers the strongest 10th percentile download (12.51 Mbps) and the best 4G RSRP (-100 dBm), consistent with its position as the operator with the largest physical footprint in Italy. TIM’s extensive 4G population coverage and 60 MHz of low-band spectrum give it deep reach that translates into more consistent mountain coverage, even if peak throughput is modestly lower.

WINDTRE deserves attention for upload performance. With a median of 17.98 Mbps, it delivers the highest upload speed of any Italian operator and one of the highest in the full five-country dataset, a finding that may reflect its 170 MHz of mid-band spectrum and capacity optimization choices.

Iliad, the newest entrant, delivers a competitive 101.40 Mbps median download speed, demonstrating that its national roaming and infrastructure-sharing arrangements provide reasonable resort coverage.

Italy features the poorest QoE outcomes among the five studied countries, with median web page load times ranging from 1.4 seconds (Vodafone) to 1.5 seconds (Iliad), roughly 0.1 to 0.2 seconds slower than the fastest country, Germany. This disconnect between relatively strong download speeds and slower page loads strongly suggests that network routing, CDN proximity, and peering arrangements, rather than raw throughput, may be the constraint on user experience in Italian resort areas.

France features the widest operator divide in the Alps

The four French resorts studied (Les 3 Vallees, Paradiski, Tignes-Val d’Isere, and Chamonix-Mont-Blanc) include the largest ski domains in the Alps and represent peak-demand environments where infrastructure sharing alone may not fully address congestion.

France’s overall median download speed of 83.44 Mbps across its top resorts place it fourth among the five studied countries, but this average masks a striking divergence between operators. SFR leads at 165.32 Mbps, the single highest median download of any operator across all five markets. Bouygues Telecom follows at 120.08 Mbps, while Orange sits at 61.62 Mbps and Free trails at 48.79 Mbps. The 116.53 Mbps spread between SFR and Free represents a 70% variance, the widest of any country in the study. It is also notable that this runs counter to the broader national pattern over recent quarters, where Orange leads on speed and consistency ahead of Bouygues, with both well ahead of SFR and Free.

France's Upload Deficit at Ski Resorts Is Pronounced
Speedtest Intelligence® | Mar 2025 – Mar 2026

The French upload story at ski resorts is even more notable. With an overall median upload speed of 6.20 Mbps, France’s upload speed is less than half the next-lowest country (Italy at 13.85 Mbps) and barely a third of Austria’s 17.69 Mbps. Even SFR, France’s fastest downlink operator, manages only 8.38 Mbps upload. Orange’s 10th percentile upload speed drops to 0.35 Mbps, and Free’s to 0.41 Mbps, levels that would render video calls and cloud uploads essentially nonfunctional. This upload deficit may reflect TDD configuration choices on mid-band spectrum, uplink resource allocation policies, or (most likely) backhaul constraints and seasonal congestion specific to French mountain infrastructure.

French Operators Show Extreme Download/Upload Imbalance at Ski Resorts
Speedtest Intelligence® | Mar 2025 – Mar 2026 | Ratio of median download to upload speed (lower = more balanced)

Deeper analysis of the 10th percentile outcomes expose an Alpine consistency problem across all French operators. Orange’s 10th percentile download is just 2.59 Mbps, meaning the worst 10% of user experiences deliver less than 3 Mbps despite a median of 61.62 Mbps. This 24:1 ratio between median and 10th percentile is the highest in our data and points to potential severe congestion or coverage holes within the resort footprint. Free (16:1 ratio) and Bouygues (20:1) show similar patterns. SFR, despite leading on median download, drops to 9.48 Mbps at 10th percentile (17:1) ratio.

Median multi-sever latency performance in France (56 to 58 ms across all four operators) is tightly clustered, suggesting that latency is not the differentiating factor between French operators at ski resorts. The more impactful divergence is on signal. Three of four operators (Orange, SFR, and Bouygues Telecom) feature an identical 4G RSRP of −103 dBm, while Free registers −106 dBm, consistent with Free’s smaller national site footprint and narrower low-band allocation (37 MHz total vs. 47 MHz to 57 MHz for its competitors).

Swisscom dominates, but Switzerland’s overall position is middle of the Alpine pack

Switzerland’s overall median download of 84.76 Mbps at resorts places it third, just above France, despite Swisscom delivering 130.40 Mbps, a figure that would rank among the top operators in any country. The gap reflects the sharp dropoff below Swisscom. Salt records 69.39 Mbps and Sunrise 57.13 Mbps, a 73.27 Mbps spread between top and bottom that represents a wide 56% variance.

On upload and latency, Switzerland is more competitive. Median upload speeds reach 15.91 Mbps overall (second only to Austria), and the median multi-server latency of 48 ms is the second-best, with Swisscom delivering the lowest single-operator latency in our entire dataset at 33 ms.

Analysis of the 10th percentile outcomes highlights a consistency challenge. Sunrise’s 10th percentile download speed is just 2.71 Mbps (a 21:1 ratio to its median) and Salt’s is 4.93 Mbps (14:1). Even Swisscom’s 10th percentile of 8.08 Mbps represents a 16:1 ratio. These floor-performance readings suggest that at peak times or in terrain-challenged areas of Zermatt, Verbier, and the Jungfrau Region, users on any operator can experience severe performance degradation (over and above what is observed in countries like Austria).

Floor Performance Varies Dramatically Across Alpine Operators
Speedtest Intelligence® | Mar 2025 – Mar 2026

Signal data provides a partial explanation for these challenges. Swisscom’s median 4G RSRP of −102 dBm is acceptable but not exceptional. Salt’s median −110 dBm is the weakest 4G reading of any operator across all five countries, consistent with coverage limitations in peripheral Alpine valleys. Salt’s 5G signal at −106 dBm tracks similarly weak.

Swisscom holds the largest low-band allocation in Switzerland (80 MHz across the 700, 800, and 900 MHz bands) and the deepest total spectrum portfolio at 454 MHz across all bands, vs. Sunrise at 294 MHz and Salt at 270 MHz. This spectrum depth, and the operator’s status as the universal service licence holder, likely underpins Swisscom’s clear Alpine advantage.

Switzerland’s market-driven regulatory model, which lacks the kind of direct government co-funding seen in France (ARCEP New Deal Mobile) or Austria (Alpine Infrastructure Fund), places the burden of mountain investment on operator economics.

Germany trades raw speed for latency and QoE

Germany’s ski resort performance is unique. With a 66.43 Mbps median download speed, it ranks last among the five countries. But with a median latency of 42 ms, it delivers the best multi-server responsiveness, 6 ms faster than second-placed Switzerland and 26 ms better than France. Garmisch-Partenkirchen, Oberstdorf, and Sudelfeld are located in Bavaria but do not sit on priority transport corridors, creating a gap where commercial incentive alone drives investment.

Telekom dominates the German market on speed at resorts, recording a 120.58 Mbps median download, more than double its nearest domestic competitor (Vodafone at 58.95 Mbps, O2 at 54.39 Mbps). Telekom also leads on upload (20.22 Mbps) and latency (35 ms), the latter being the second-lowest single-operator figure in our entire dataset after Swisscom.

But Telekom’s 10th percentile download drops to 6.14 Mbps (a 20:1 ratio), notably weaker than the consistency levels seen in Austria. Vodafone’s 10th percentile download speed of 9.38 Mbps actually represents a tighter ratio (6:1), suggesting more even if lower-ceiling coverage. O2’s 5.69 Mbps 10th percentile and modest signal readings (4G RSRP −105 dBm, 5G −103 dBm) likely reflect some rural coverage gaps.

Germany Leads on Latency and Web Page Load Times at Ski Resorts
Speedtest Intelligence® | Mar 2025 – Mar 2026

The profile of results align closely with the relative spectrum position of each German operator. Telekom, with 70 MHz of low-band spectrum (the largest low-band allocation among German operators, spanning 700, 800, and 900 MHz), has the propagation advantage needed for mountain terrain. Vodafone and O2, with weaker low-band positions, therefore compete less effectively at altitude.

Overall, Germany delivers the best median web page load times of any country. Telekom records 1.2 seconds, the lowest figure across all 17 operators, while Vodafone and O2 also perform well at 1.3 seconds each. This QoE advantage aligns with Germany’s latency leadership (and the inherent advantage that it features the highest density of hyperscale infrastructure in the DACH region) and suggests favorable CDN positioning, routing decisions and peering arrangements for German networks.

Policy approaches to Alpine coverage vary widely from subsidized infrastructure sharing to targeted rollout obligations

The regulatory frameworks shaping Alpine connectivity differ materially across the five countries studied, and these differences can help to explain the performance patterns in our data.

France’s policy approach is the most prescriptive. ARCEP’s New Deal Mobile program, announced in January 2018, replaced the traditional auction logic with a commitment-based framework in which operators accepted binding coverage obligations in exchange for administrative renewal of their spectrum rights. The targeted coverage mechanism requires each operator to cover up to 5,000 areas, with government orders issued at a rate of roughly 600 to 800 areas per year per operator and each designated location to be activated within at most 24 months.

Infrastructure sharing is central, but more selectively than the original text implied. Of those 5,000 areas, 2,000 are explicitly intended for four-operator RAN sharing in places where no operator provides “good coverage”; in the remaining areas operators must at least share passive infrastructure, and in some cases active sharing also applies. Separately, operators must reach 99.8% population “good coverage” for voice and SMS, with deadlines staggered between 2028 and 2031 depending on operator. Compliance is enforced with fines. Historically, SFR was penalized €380,000 for failing to cover 47 town centers by the January 2016 deadline, and Orange received a €27,000 penalty for missing five. Critically for ski areas, the 3.4 to 3.8 GHz obligations require 25% of sites in the final two rollout phases to be located in sparsely populated areas.

Austria, meanwhile, has combined spectrum policy with direct public funding. The Breitbandstrategie 2030 targets nationwide symmetric gigabit-capable connectivity by 2030, and the federal government has made €1.4 billion (US $1.6 billion) available through 2026 under Broadband Austria 2030. Coverage obligations from the 2020 multi-band auction (700, 1500, and 2100 MHz) require A1, Hutchison, and T-Mobile Austria to cover 1,702 of 2,100 underserved cadastral communities, roughly 81%, with first deadlines in summer 2022 and most remaining obligations falling in late 2023 and late 2025. Embedding rural buildout directly into the award process helps explain why operators with stronger rural network positions perform relatively well in Alpine terrain.

Five distinct regulatory approaches shape Alpine connectivity investment decisions across Europe.

By contrast, Switzerland takes the most market-driven approach. Swisscom is the universal service licence holder for 2024 to 2031, but the obligation remains modest: basic telephony plus internet access at 10/1 Mbit/s, or 80/8 Mbit/s on request, with reduced rates permitted in exceptional cases. The February 2019 spectrum auction raised around €414 million (US$477 million) and imposed mainly population-based obligations: licensees with 700 MHz spectrum had to reach at least 50% of the population with their own infrastructure by December 2024, while those without 700 MHz spectrum faced a 25% threshold. Those benchmarks can be met without specifically targeting remote Alpine terrain.

Italy’s 700 MHz auction, concluded in October 2018, included a distinctive collective coverage obligation. The 700 MHz licensees must jointly reach 99.4% of the population within 54 months of the band’s July 2022 availability. This joint structure creates a cooperative incentive, since any single operator’s shortfall affects the group, and it is consistent with infrastructure-sharing approaches. Earlier this year, TIM and Fastweb+Vodafone first announced a preliminary RAN-sharing agreement focused on municipalities with fewer than 35,000 inhabitants, and later announced a non-binding initiative to develop up to 6,000 new towers.

Italy’s Piano Italia 5G program provides major public support for fiber backhaul to more than 10,000 existing mobile sites and for new 5G sites in underserved areas, with public funding covering up to 90% of project cost. The Milano Cortina 2026 Winter Olympics added a further layer, with TIM as Official Telecommunications Partner and FiberCop as Fiber Infrastructure Partner connecting venues to high-capacity fiber infrastructure.

Germany’s regulatory model is the most explicitly focused on household and transport coverage. BNetzA’s 2019 auction required at least 100 Mbps for 98% of households in each federal state by the end of 2022, alongside obligations covering motorways, major federal roads, and rail routes. According to operators’ submissions, all three incumbents met the household threshold, but BNetzA said gaps remained in some transport locations and tunnels. That structure is aimed at population density and corridors rather than tourism zones, leaving mountain coverage more dependent on commercial incentive.

Federal support exists, but execution has been slower than the headline ambition suggests. The Mobilfunkstrategie earmarked about €1.1 billion (US$1.3 billion) from the Special Fund for Digital Infrastructure to support up to 5,000 additional masts, and by the end of 2024 the Mobilfunkinfrastrukturgesellschaft had funded 267 sites, with the first masts in operation and the remainder still in the realization phase. Updated obligations adopted in 2025 require at least 50 Mbps over 99.5% of Germany’s land area from 2030, so German ski resorts are still likely to rely primarily on operator-led investment for the foreseeable future.

Bars on the piste matter for competitive differentiation

For operators, the Alpine corridor is both a technical challenge and a strategic opportunity, a place where network quality is highly visible, directly experienced by affluent and digitally engaged visitors, and increasingly essential to resort operations.

The performance landscape across Europe’s top ski resorts reveals a set of structural themes that extend beyond the mountains. Markets where regulation explicitly targets geographic coverage (e.g., France’s ARCEP New Deal Mobile, Austria’s Alpine investment incentives, Italy’s joint coverage obligations) show stronger outcomes than markets where obligations are tied primarily to population thresholds and transport corridors. Germany’s household-centric auction conditions, despite generating significant auction revenue, leave tourism-dependent mountain zones as a secondary priority.

Operator strategy matters as much as regulation. A1 in Austria and Swisscom in Switzerland have built measurable Alpine advantages that function as competitive differentiation. In markets where operator performance is more tightly clustered (Italy) or where infrastructure sharing dominates (France), the quality of the user experience can become more uniform or constrained by shared bottlenecks.

Emerging direct-to-device (D2D) satellite services from providers like SpaceX’s Starlink and AST SpaceMobile represent a potential complementary layer for the highest-altitude and most remote Alpine terrain where terrestrial economics remain prohibitive. Switzerland’s Salt, for example, was the the first operator in Europe to report a successful (albeit non-commercial) Starlink direct-to-cell test, sending satellite-based text messages to a standard 4G smartphone over its mobile spectrum, touting it as a future coverage extension and resilience layer in the most remote areas.

Ookla retains ownership of this article including all of the intellectual property rights, data, content graphs and analysis. This article may not be quoted, reproduced, distributed or published for any commercial purpose without prior consent. Members of the press and others using the findings in this article for non-commercial purposes are welcome to publicly share and link to report information with attribution to Ookla.

| March 30, 2026

France’s Rail Connectivity Gap: Why Coverage Targets Alone Cannot Close the Mobile Experience Divide on Track

French/Français

Analysis of Speedtest data across 20 major French rail corridors reveals sharp operator disparities in throughput, latency, and quality of experience.

France operates one of Europe’s most heavily used passenger rail networks, carrying hundreds of millions of riders each year across a system that spans high-speed LGV corridors, intercity Intercités routes, and dense regional TER services. As mobile connectivity has shifted from a convenience to a baseline expectation for rail passengers, the quality of cellular service along these corridors has become an infrastructure question in its own right.

The French government and France’s telecom regulator, ARCEP, recognized this early: the 2018 New Deal Mobile established explicit obligations for 4G coverage along approximately 23,000 km of regional rail track, with a target of 90% coverage of daily train services by the end of 2025. By ARCEP’s own reporting, trackside 4G coverage now reaches 97.7% to 99.3% of daily train services, depending on the operator.

Yet coverage presence and coverage quality are not the same thing, and the gap between them is where the passenger experience is actually shaped. Analysis of Speedtest Intelligence® data across a sample of 20 high-traffic French rail routes, encompassing LGV, intercity, and regional corridors, reveals that the passenger’s designated operator matters enormously for throughput, latency, and real-time application performance. The underlying driver is not a mystery: it maps closely to each operator’s spectrum position, particularly in the sub-1 GHz and mid-band ranges most relevant to rail propagation, and network footprint.

This analysis draws on Speedtest Intelligence data collected between March 2025 and March 2026, alongside quality of experience (QoE) and signal metrics, for all four French mobile network operators: Orange, SFR, Bouygues Telecom, and Free. Tests were captured within a 100-meter buffer of the 20 sampled rail corridors.

Key Takeaways:

  • Orange leads with a median download speed of 283.4 Mbps across the sampled rail corridors, 52% faster than second-place SFR (186.5 Mbps) and more than double Free’s 120.4 Mbps. Orange holds the largest sub-1 GHz spectrum portfolio in France at 57.4 MHz, including both 700 and 800 MHz bands, giving it materially deeper low-band reach in the radio environment along rail corridors where propagation and carriage penetration advantages are most pronounced.
  • Multiserver latency splits the market into two distinct tiers: Orange (33 ms) and Bouygues Telecom (34 ms) cluster within a millisecond of each other, while SFR (43 ms) and Free (64 ms) trail significantly. This two-tier pattern persists almost identically across content delivery networks (CDN), gaming, and video conferencing latency, suggesting potential structural network architecture differences in core routing rather than route-specific variation.
  • Orange recorded a leading median 4G signal quality (RSRQ) of -9 dB, a 3 dB advantage over all three rivals (each at -12 dB), despite near-identical signal strength (RSRP) readings of -100 to -104 dBm across operators. The RSRQ gap points to better spectral isolation or more effective load management across Orange’s rail-adjacent cell sites, potentially supported by its 10 MHz mid-band spectrum advantage at 2600 MHz and greater carrier aggregation depth.
  • Application-layer quality of experience (QoE) metrics partially compress the operator gap: median web page load times span only ~0.1 seconds from Orange (1.1 seconds) to Bouygues Telecom (1.2 seconds), and video conferencing jitter varies by just 2 ms across all four operators (4 to 6 ms). However, video start time inverts the throughput ranking, with SFR leading at 1.3 seconds and Bouygues trailing at 1.6 seconds, pointing to differences in CDN peering, edge caching, or video optimization strategy.
  • France’s New Deal Mobile already provides a relatively robust coverage obligation framework. However, ARCEP’s February 2025 enforcement notices to all four operators cites over 300 blocked or delayed deployment sites. This highlights that meeting even geographic coverage targets remains a challenge before quality of service (QoS) metrics can enter the regulatory conversation. Among major European markets, only Germany has moved toward mandating performance floors on rail, while the UK, Spain, and Italy lag further behind.

Orange’s speed lead maps to spectrum depth, not just signal reach

During the period of analysis between March 2025 and March 2026, the download speed disparity observed across French operators on rail is striking. Orange’s median of 283.4 Mbps is approximately 52% above SFR’s 186.5 Mbps, ~110% above Bouygues Telecom’s 135.0 Mbps, and ~135% above Free’s 120.4 Mbps. This is not a marginal gap: it represents a fundamentally different user experience in bandwidth-intensive applications such as video streaming, large file transfers, and cloud-based workflows.

Orange leads on download speed, while Bouygues is ahead on upload
Speedtest Intelligence® | March 2025 – March 2026

Analysis of spectrum data published by GSMA Intelligence provides an explanation for this disparity. Orange holds 257 MHz of total assigned spectrum nationally, the largest portfolio among the four operators, compared with 227 MHz for SFR, 217 MHz for Bouygues Telecom, and 207 MHz for Free. More critically for rail environments, where low-frequency propagation and in-vehicle penetration matter most, Orange leads in sub-1 GHz holdings at 57.4 MHz spanning both the 700 and 800 MHz bands.

SFR and Bouygues Telecom each hold 47.4 MHz of sub-1 GHz spectrum, while Free holds only 37.4 MHz and notably lacks any 800 MHz assignment entirely, relying on 700 MHz and 900 MHz for its low-band coverage layer. Free’s absence from the 800 MHz band, the workhorse of 4G coverage in rural and semi-rural terrain, is a constraint for rail corridor performance.

Orange also holds a 10 MHz mid-band advantage at 2600 MHz (40 MHz vs. 30 MHz for SFR and Bouygues Telecom), which, when combined with its low-band depth, affords greater carrier aggregation flexibility across the frequency layers most relevant to rail. At 3.5 GHz, where Orange holds 90 MHz, the performance impact on rail is limited: the propagation characteristics of C-band are less well suited to the extended inter-site distances and in-carriage penetration losses typical of rail environments.

Orange's unique low-band depth lends it a coverage advantage
Analysis of GSMA Intelligence Data | 2026

Upload speeds tell a different story. Bouygues Telecom leads at 24.7 Mbps, narrowly ahead of Orange at 23.6 Mbps, with SFR at 16.6 Mbps and Free at 9.2 Mbps. The Bouygues-Orange convergence on upload, despite Orange’s clear download lead, may reflect uplink scheduling optimization or time division duplexing (TDD) configuration choices that weight differently across operators.

Analysis of the signal environment confirms this spectrum narrative. Median 4G reference signal received power (RSRP) readings, which measure the strength of the signal from the cell tower, are tightly clustered across operators, ranging from -100 dBm (Bouygues Telecom) to -104 dBm (Free), indicating that all four operators reach rail corridors at broadly comparable signal strength. Yet Orange’s reference signal received quality (RSRQ), which measures the quality of the signal, of -9 dB is 3 dB better than every rival (all at -12 dB).

Since RSRQ captures signal quality relative to total received power including interference, this gap suggests that Orange achieves better spectral isolation on rail, whether through denser site grids, more effective inter-cell interference management, or the greater carrier aggregation depth that its wider spectrum portfolio likely enables.

Orange's 3 dB signal quality advantage persists despite comparable signal strength
Speedtest Intelligence® | March 2025 – March 2026

When coverage does not equal quality: the QoE picture on French rail

While throughput and latency capture raw network capability, QoE metrics reflect what passengers actually feel when using applications. Here, the operator gap narrows considerably at the application layer, even as it remains wide at the access layer.

Median web page load times span just ~0.1 seconds across operators: from Orange at 1.1 seconds to Bouygues Telecom at 1.2 seconds, with SFR (1.2 seconds) and Free (1.2 seconds) in between. That ~10% spread stands in contrast to the 135% gap in raw download throughput, illustrating how application-layer optimization, CDN placement, and protocol efficiency can partially compensate for underlying network differences. A web page load is shaped by DNS resolution, TLS negotiation, and content rendering, all of which are less sensitive to peak throughput than to latency and connection reliability.

Video start time introduces an inversion: SFR leads at 1.3 seconds, followed by Free at 1.4 seconds, Orange at 1.4 seconds, and Bouygues Telecom at 1.6 seconds. The fact that SFR and Free outperform Orange on video start, despite trailing on throughput, points to potential differences in CDN peering arrangements, edge caching topology, or video player optimization that are distinct from raw radio performance. Video start time is heavily influenced by the initial buffering phase, where server proximity and connection setup overhead can outweigh sustained bandwidth.

Application-layer QoE compresses the operator gap despite wide throughput differences
Speedtest Intelligence® | March 2025 – March 2026

Video conferencing metrics reveal a broadly similar picture across all four networks on rail, with median jitter ranging from just 4 ms (Bouygues Telecom) to 6 ms (Free) and mean packet loss from 2.79% (Orange) to 3.47% (Bouygues Telecom). These are not dramatic spreads. Median video conferencing latency falls into the same two-tier structure as multiserver latency: Orange and SFR at 59 ms, Free at 68 ms, and Bouygues Telecom at 77 ms.

CDN and gaming latency mirror this pattern exactly: Orange and SFR share a 59 ms median, Free sits at 68 ms, and Bouygues Telecom at 77 ms. The consistency of this tiering across multiple latency endpoints suggests a core network or peering architecture difference rather than a radio access variation.

Two-tier latency: Orange & Bouygues lead on multi-server, Orange & SFR on apps
Speedtest Intelligence® | March 2025 – March 2026

France’s rail coverage framework: obligations, enforcement, and the quality blind spot

France’s approach to mobile coverage on rail rests primarily on the New Deal Mobile, the landmark 2018 agreement between the government, ARCEP, and all four operators that embedded legally binding coverage commitments into operator frequency licenses. For rail specifically, the framework mandated 4G coverage along 90% of daily train services across approximately 23,000 km of regional rail track by December 31, 2025, with phased obligations for in-vehicle coverage on the 700 MHz band extending to 2030.

ARCEP enforces these obligations through a combination of operator-reported coverage maps, field measurement campaigns exceeding one million data points annually, and its public Mon Reseau Mobile platform. The framework has delivered measurable progress: white zones with zero mobile coverage have fallen from 11% of the territory in 2017 to under 2% (by Q3 2023), and trackside 4G coverage rates now exceed 97% for all operators.

However, ARCEP’s 2024 quality of service campaign found that web page loads succeeded in only around 70% of attempts on average across TGV, Intercites, and TER services, with per-operator success rates varying from around 64% to 79%. Coverage presence, in other words, does not guarantee usable service.

The enforcement reality is challenging. France has demonstrated willingness to levy penalties, but the clearest recent example is from the fixed side rather than mobile: ARCEP fined Orange €26 million (US$30 million) in November 2023 for failing to meet its legally binding FTTH rollout commitments in AMII areas. On the mobile side, ARCEP has also issued multiple formal notices under the New Deal Mobile framework.

Looking ahead, the transition from GSM-R to FRMCS (Future Railway Mobile Communication System), the 5G-based European standard for railway operational communications, will add a new dimension to rail connectivity.

SNCF Réseau appears to be pursuing a hybrid FRMCS model in which dedicated railway infrastructure remains central on the core network, while commercial mobile networks may be used selectively to extend coverage or reduce deployment cost on certain regional or cross-border sections. This will tie commercial network quality on rail directly to operational railway communications for the first time, potentially raising the stakes for on-rail mobile performance beyond passenger experience.

How France’s approach compares: regulatory lessons from Germany, the UK, Spain, and Italy

France sits in the middle of a wide European spectrum on rail mobile regulation, a position that becomes clearer when compared against its four largest peer markets.

Germany has moved furthest toward regulating quality rather than just coverage on rail. Under conditions attached to its 2019 5G spectrum auction, BNetzA set explicit bandwidth floors: 100 Mbps along major railway lines (Hauptschienenwege) and 50 Mbps along other railway lines. Operators have equipped approximately 400 rail tunnels with mobile coverage as part of broader transport corridor obligations. The GINT program has allocated €6.4 million to test 5G feasibility on rail, and FRMCS pilots are expected from 2026. Germany’s approach represents a regulatory philosophy fundamentally different from France’s: it targets what the network delivers, not merely where it reaches.

The United Kingdom sits at the other end of the spectrum. Ofcom’s last dedicated rail connectivity study dates to 2019, and Parliament has repeatedly called for annual reporting that has not materialized. The UK lacks rail-specific spectrum obligations, and responsibility for rail connectivity is fragmented across multiple government departments. The Shared Rural Network targets rural coverage broadly but does not address rail corridors specifically. A Network Rail and Neos Networks infrastructure agreement signals momentum, but a coordinated rail connectivity program is not expected to deliver results before 2027 at the earliest.

Spain has adopted a public-private partnership model. ADIF, the national rail infrastructure manager, signed a €25.5 million (US$29.4 million) contract with Vodafone and SEMI for 5G deployment on high-speed AVE routes, funded in part through the EU Recovery and Resilience Facility. The Spanish approach is project-driven rather than obligation-based, delivering targeted improvements on flagship routes without establishing a universal framework.

Italy has focused on nodes rather than links. FS Group and TIM have partnered on tunnel coverage across high-speed corridors, while INWIT has deployed 5G infrastructure at major stations including Roma Termini. Italy’s PNRR-funded feasibility studies have explored corridor-level connectivity, but AGCOM has not imposed rail-specific coverage or quality obligations. The emphasis remains on ensuring connectivity at stations rather than along the routes between them.

At the EU level, the Connecting Europe Facility (CEF) Digital program allocates approximately €300 million (US$345 million) for 5G corridors along Trans-European Transport Network (TEN-T) routes through 2027. Several France-relevant inception studies have been approved, including projects for the Paris-Brussels and Frejus cross-border rail corridors. The revised TEN-T Regulation (2024/1679) emphasizes digital connectivity as a component of transport infrastructure, but defers specific mandates to member states.

Coverage is a floor, not a ceiling, on rail

France has built one of Europe’s most progressive mobile coverage obligation frameworks for rail, and it has largely eliminated coverage dead zones across the national network thanks to proactive collaboration with industry. Our data reveals that the challenge has now shifted to deeper network optimization, which requires going beyond baseline coverage metrics to understand what passengers actually experience on trains when they have a signal.

The constraints of coverage obligations alone in stimulating better outcomes should be taken into account in the absence of other supporting measures. Orange’s dominant speed performance likely maps to its spectrum advantages, a 57.4 MHz sub-1 GHz portfolio and a 10 MHz lead in mid-band holdings, that no coverage obligation can easily replicate for its rivals. Competitive dynamics beyond the mandate may also play a role here.

As FRMCS approaches and CEF Digital projects advance from inception studies toward deployment, the strategic question shifts from whether trains have signals to what that signal can deliver. Germany’s model of regulating bandwidth floors on rail, rather than just coverage existence, offers a forward-looking template. It could be reinforced with additional metrics for video, latency, QoE, etc. For France and the rest of Europe, the next phase of rail connectivity policy will need to grapple not just with where networks reach, but with how well they perform when they get there.


L’écart de connectivité ferroviaire en France : pourquoi les seuls objectifs de couverture ne peuvent pas combler le fossé d’expérience mobile sur les voies ferrées

L’analyse des données Speedtest sur 20 corridors ferroviaires majeurs français révèle des disparités nettes entre opérateurs en termes de débit et de latence, exposant les limites d’un cadre réglementaire qui impose la portée géographique mais pas encore la qualité de service.

La France opère l’un des réseaux ferroviaires de passagers les plus intensément utilisés d’Europe, transportant des centaines de millions de voyageurs chaque année sur un système qui s’étend des corridors LGV à grande vitesse, aux services Intercités et aux services régionaux TER denses. À mesure que la connectivité mobile est passée d’une commodité à une attente de base pour les passagers des trains, la qualité du service cellulaire le long de ces corridors est devenue une question d’infrastructure à part entière.

Le gouvernement français et le régulateur français des télécommunications, l’ARCEP, ont reconnu ce fait précocement : le New Deal Mobile de 2018 a établi des obligations explicites pour la couverture 4G le long d’environ 23 000 km de voies ferrées régionales, avec un objectif de 90 % de couverture des services de trains quotidiens d’ici fin 2025. Selon le propre rapport de l’ARCEP, la couverture 4G en bordure de voies ferrées atteint désormais 97,7 % à 99,3 % des services de trains quotidiens, selon l’opérateur.

Cependant, la présence de couverture et la qualité de la couverture ne sont pas la même chose, et c’est le fossé entre elles qui façonne réellement l’expérience des passagers. L’analyse des données Speedtest Intelligence® sur un échantillon de 20 routes ferroviaires françaises à fort trafic, englobant des corridors LGV, Intercités et régionaux, révèle que l’opérateur auquel s’abonne un passager importe énormément pour le débit, la latence et les performances des applications en temps réel. Le facteur sous-jacent n’est pas un mystère : il correspond étroitement au portefeuille de spectre de chaque opérateur, particulièrement dans les bandes sub-1 GHz et moyennes les plus efficaces pour la propagation ferroviaire, ainsi qu’à son empreinte réseau.

Cette analyse s’appuie sur les données Speedtest Intelligence collectées entre mars 2025 et mars 2026, ainsi que sur les métriques de qualité d’expérience (QoE) et de signal, couvrant les quatre opérateurs mobiles français : Orange, SFR, Bouygues Telecom et Free. Les tests ont été capturés dans un rayon de 100 mètres autour des 20 corridors ferroviaires échantillonnés.

Enseignements clés :

  • Orange domine avec un débit descendant médian de 283,40 Mbps sur les corridors ferroviaires échantillonnés, 52 % plus rapide que SFR en deuxième position (186,53 Mbps) et plus du double des 120,41 Mbps de Free. Orange détient le plus grand portefeuille de spectre sub-1 GHz en France avec 57,4 MHz, incluant les bandes 700 et 800 MHz, lui donnant une portée clairement plus importante en bande basse dans l’environnement radio le long des corridors ferroviaires où les avantages de propagation et de pénétration dans les wagons sont les plus importants.
  • La latence multi-serveurs divise le marché en deux niveaux distincts : Orange (33 ms) et Bouygues Telecom (34 ms) se situent à moins d’une milliseconde l’une de l’autre, tandis que SFR (43 ms) et Free (64 ms) accusent un retard important. Ce schéma à deux niveaux persiste presque identiquement sur les réseaux de distribution de contenu (CDN), les jeux et la conférence vidéo en latence, suggérant des différences potentielles d’architecture réseau structurelle dans l’acheminement central plutôt qu’une variation spécifique aux itinéraires.
  • Orange a enregistré une qualité de signal 4G médiane dominante (RSRQ) de -9 dB, un avantage de 3 dB sur les trois rivaux (chacun à -12 dB), malgré des lectures de puissance de signal (RSRP) pratiquement identiques de -100 à -104 dBm sur tous les opérateurs. L’écart RSRQ pointe vers une meilleure isolation spectrale ou une gestion de charge plus efficace sur les sites cellulaires adjacents aux voies ferrées d’Orange, potentiellement soutenue par son avantage de spectre en mi-bande de 10 MHz sur 2600 MHz et une profondeur d’agrégation de porteuses plus importante.
  • Les métriques de qualité d’expérience (QoE) au niveau des applications compriment partiellement l’écart opérateur : les temps de chargement des pages Web médians s’étendent sur seulement environ 0,1 secondes d’Orange (1,1 secondes) à Bouygues Telecom (1,2 secondes), et la gigue (jitter) de conférence vidéo varie de seulement 2 ms sur les quatre opérateurs (4 à 6 ms). Cependant, le temps de démarrage vidéo inverse le classement du débit, SFR se classant en tête à 1,3 secondes et Bouygues en retard à 1,6 secondes, pointant vers des différences dans l’appairage CDN, l’utilisation de serveur cache en périphérie ou la stratégie d’optimisation vidéo.
  • Le New Deal Mobile français fournit déjà un cadre d’obligation de couverture relativement robuste. Cependant, les avis d’application de février 2025 de l’ARCEP à tous les quatre opérateurs citent plus de 300 sites de déploiement bloqués ou retardés. Cela souligne que respecter même les objectifs de couverture géographique reste un défi avant que les métriques de qualité de service (QoS) puissent entrer dans le débat réglementaire. Parmi les grands marchés européens, seule l’Allemagne a avancé pour mandater des minimums de performance sur les voies ferrées, tandis que le Royaume-Uni, l’Espagne et l’Italie accusent davantage de retard.

L’avance en vitesse d’Orange correspond à la profondeur spectrale, pas seulement à la portée du signal

Au cours de la période d’analyse entre mars 2025 et mars 2026, la disparité de vitesse de téléchargement observée entre les opérateurs français sur les voies ferrées est frappante. La médiane d’Orange de 283,40 Mbps est environ 52 % supérieure aux 186,53 Mbps de SFR, ~110 % supérieure aux 135,02 Mbps de Bouygues Telecom, et ~135 % supérieure aux 120,41 Mbps de Free. Ce n’est pas un écart marginal : il représente une expérience utilisateur fondamentalement différente dans les applications intensives en bande passante telles que la transmission vidéo, les transferts de fichiers volumineux et les applications cloud.

Débits descendants et montants des opérateurs sur les corridors ferroviaires français
Speedtest Intelligence® | mars 2025 – mars 2026

L’analyse des données de spectre publiées par GSMA Intelligence fournit une explication de cette disparité. Orange détient 257 MHz de spectre assigné au total au niveau national, le plus grand portefeuille parmi les quatre opérateurs, comparé avec 227 MHz pour SFR, 217 MHz pour Bouygues Telecom et 207 MHz pour Free. Plus crucialement pour les environnements ferroviaires, où la propagation en basse fréquence et la pénétration dans les wagons comptent le plus, Orange domine les allocations sub-1 GHz avec 57,4 MHz couvrant à la fois les bandes 700 et 800 MHz.

SFR et Bouygues Telecom détiennent chacun 47,4 MHz de spectre sub-1 GHz, tandis que Free n’en détient que 37,4 MHz et ne dispose notamment d’aucune attribution dans la bande 800 MHz, s’appuyant sur 700 et 900 MHz pour sa couche de couverture en bande basse. L’absence de Free de la bande 800 MHz, l’outil de base de la couverture 4G dans le terrain rural et semi-rural, est une contrainte pour la performance des corridors ferroviaires.

Orange détient également un avantage en mi-bande de 10 MHz sur 2600 MHz (40 MHz comparés à 30 MHz pour SFR et Bouygues Telecom), qui, combiné avec sa profondeur en bande basse, lui confère une flexibilité d’agrégation de porteuses plus importante sur les couches de fréquence les plus efficaces pour les voies ferrées. Sur 3,5 GHz, où Orange détient 90 MHz, l’impact sur la performance ferroviaire est limité : les caractéristiques de propagation de la bande C conviennent moins bien aux distances inter-sites étendues et aux pertes de pénétration dans les wagons typiques des environnements ferroviaires.

Portefeuille de spectre des opérateurs mobiles français
Analyse des données GSMA Intelligence | 2026

Les débits montants dénotent une toute autre réalité. Bouygues Telecom mène à 24,75 Mbps, de justesse devant Orange à 23,59 Mbps, avec SFR à 16,59 Mbps et Free à 9,18 Mbps. La convergence Bouygues-Orange sur la vitesse ascendante, malgré la nette avance en descente d’Orange, peut refléter des choix d’optimisation de planification ou de configuration TDD qui pèsent différemment selon les opérateurs.

L’analyse de l’environnement de signal confirme cette observation. Les lectures médianes de puissance du signal de référence reçu 4G (RSRP), qui mesurent la force du signal de la tour cellulaire, sont étroitement regroupées entre opérateurs, allant de -100 dBm (Bouygues Telecom) à -104 dBm (Free), indiquant que les quatre opérateurs atteignent les corridors ferroviaires à une intensité de signal comparable. Cependant, la qualité du signal de référence reçu (RSRQ) d’Orange, qui mesure la qualité du signal, de -9 dB, est 3 dB meilleure que celle de chaque rival (tous à -12 dB).

Étant donné que RSRQ capture la qualité du signal par rapport à la puissance totale reçue incluant les interférences, cet écart suggère qu’Orange réalise une meilleure isolation spectrale sur les voies ferrées, que ce soit par des grilles de sites plus denses, une gestion plus efficace des interférences inter-cellules, ou la profondeur d’agrégation de porteuses plus importante que son portefeuille de spectre plus large favorise probablement.

Qualité du signal 4G sur les corridors ferroviaires français
Speedtest Intelligence® | mars 2025 – mars 2026

Quand la couverture ne rime pas avec qualité : l’état de la QoE sur les lignes ferroviaires françaises

Bien que le débit et la latence capturent la capacité réseau brute, les métriques de qualité d’expérience reflètent ce que les passagers perçoivent réellement lorsqu’ils utilisent les applications. Ici, l’écart opérateur se rétrécit considérablement au niveau application, même s’il reste large au niveau de l’accès.

Les temps de chargement des pages Web médians s’étendent sur seulement environ 0,1 secondes entre opérateurs : d’Orange à 1,1 secondes à Bouygues Telecom à 1,2 secondes, avec SFR (1,2 secondes) et Free (1,2 secondes) entre les deux. Cet écart d’environ 10 % contraste fortement avec l’écart de 135 % en débit de téléchargement brut, illustrant comment l’optimisation au niveau application, le placement CDN et l’efficacité des protocoles peuvent partiellement compenser les différences réseau sous-jacentes. Un chargement de page Web est façonné par la résolution DNS, la négociation TLS et le rendu de contenu, tout cela étant moins sensible au débit maximal qu’à la latence et à la fiabilité de la connexion.

Le temps de démarrage vidéo introduit une inversion du classement : SFR se classe en tête à 1,3 secondes, suivi de Free à 1,4 secondes, Orange à 1,4 secondes et Bouygues Telecom à 1,6 secondes. Le fait que SFR et Free surpassent Orange au démarrage vidéo, malgré un retard de débit, pointe vers des différences potentielles dans les arrangements d’appairage CDN, la topologie du serveur cache en périphérie ou l’optimisation du lecteur vidéo qui sont distinctes de la performance radio brute. Le temps de démarrage vidéo est fortement influencé par la phase de buffering initiale, où la proximité du serveur et la surcharge pour l’établissement de connexion peuvent surpasser la bande passante soutenue.

Métriques de qualité d'expérience sur les voies ferrées françaises
Speedtest Intelligence® | mars 2025 – mars 2026

Les métriques de conférence vidéo révèlent un état largement similaire sur les quatre réseaux sur les voies ferrées, avec une gigue (jitter) médiane variant de seulement 4 ms (Bouygues Telecom) à 6 ms (Free) et une perte de paquets moyenne de 2,79 % (Orange) à 3,47 % (Bouygues Telecom). Ce ne sont pas des écarts dramatiques. La latence de conférence vidéo médiane tombe dans la même structure à deux niveaux que la latence multi-serveurs : Orange et SFR à 59 ms, Free à 68 ms et Bouygues Telecom à 77 ms.

Les latences CDN et jeux reflètent exactement ce modèle : Orange et SFR partagent une médiane de 59 ms, Free se situe à 68 ms et Bouygues Telecom à 77 ms. La cohérence de cette hiérarchisation sur plusieurs points de terminaison de latence suggère une différence d’architecture réseau central ou d’appairage plutôt qu’une variation d’accès radio.

Niveaux de latence des opérateurs français sur les voies ferrées
Speedtest Intelligence® | mars 2025 – mars 2026

Le cadre de couverture ferroviaire français : obligations, application et l’angle mort de la qualité

L’approche française de la couverture mobile sur les voies ferrées repose principalement sur le New Deal Mobile, l’accord majeur de 2018 entre le gouvernement, l’ARCEP et les quatre opérateurs, intégrant des engagements de couverture juridiquement contraignants dans les licences de fréquences des opérateurs. Pour les voies ferrées spécifiquement, le cadre mandate la couverture 4G le long de 90 % des services de trains quotidiens sur environ 23 000 km de voies ferrées régionales d’ici le 31 décembre 2025, avec des obligations échelonnées pour la couverture dans les wagons sur la bande 700 MHz s’étendant à 2030.

L’ARCEP applique ces obligations par une combinaison de cartes de couverture rapportées par les opérateurs, de campagnes de mesure sur le terrain dépassant un million de points de données annuels et de sa plateforme publique Mon Réseau Mobile. Ce dispositif a permis des avancées tangibles : les zones blanches, dépourvues de toute couverture mobile, sont passées de 11 % du territoire en 2017 à moins de 2 % (au T3 2023), et les taux de couverture 4G le long des voies ferrées dépassent désormais les 97 % pour l’ensemble des opérateurs.

Cependant, la campagne de qualité de service de l’ARCEP en 2024 a constaté que les chargements de pages Web n’ont réussi que dans environ 70 % des tentatives en moyenne sur les services TGV, Intercités et TER, avec des taux de réussite par opérateur variant d’environ 64 % à 79 %. La présence de couverture, en d’autres termes, ne garantit pas un service utilisable.

Dans les faits, faire respecter ces obligations s’avère complexe. Si la France a déjà prouvé sa volonté de sévir, l’exemple récent le plus marquant concerne le réseau fixe et non le mobile : en novembre 2023, l’ARCEP a infligé une amende de 26 millions d’euros (30 millions de dollars) à Orange pour le non-respect de ses engagements juridiquement contraignants de déploiement FTTH en zone AMII. Sur le front du mobile, l’ARCEP a également adressé de multiples mises en demeure dans le cadre du New Deal Mobile.

À l’avenir, la transition du GSM-R vers le FRMCS (Future Railway Mobile Communication System), la norme européenne basée sur 5G pour les communications opérationnelles ferroviaires, ajoutera une nouvelle dimension à la connectivité ferroviaire.

SNCF Réseau semble s’orienter vers un modèle FRMCS hybride : l’infrastructure ferroviaire dédiée resterait au cœur du réseau principal, tandis que les réseaux mobiles commerciaux pourraient être mis à contribution de façon ciblée pour étendre la couverture ou réduire les coûts de déploiement sur certains tronçons régionaux ou transfrontaliers. Pour la première fois, la qualité des réseaux commerciaux sur le domaine ferroviaire sera directement corrélée aux communications opérationnelles. Les enjeux liés à la connectivité mobile sur les rails s’en trouveront ainsi décuplés, dépassant largement le simple cadre de l’expérience voyageur.

Comment l’approche française se compare : leçons réglementaires d’Allemagne, du Royaume-Uni, d’Espagne et d’Italie

La France se situe au milieu d’un large spectre européen en matière de régulation mobile ferroviaire, une position qui devient plus claire lorsqu’elle est comparée à ses quatre plus grands marchés pairs.

L’Allemagne a avancé le plus loin vers la régulation de la qualité plutôt que seulement la couverture sur les voies ferrées. Selon les conditions attachées à son enchère de spectre 5G de 2019, BNetzA a fixé explicitement le minimum pour la bande passante : 100 Mbps le long des lignes ferroviaires majeures (Hauptschienenwege) et 50 Mbps le long des autres lignes ferroviaires. Les opérateurs ont équipé environ 400 tunnels ferroviaires avec une couverture mobile dans le cadre d’obligations plus larges de corridors de transport. Le programme GINT a alloué 6,4 millions d’euros pour tester la faisabilité de la 5G sur les voies ferrées, et les pilotes FRMCS sont attendus à partir de 2026. L’approche allemande représente une philosophie réglementaire fondamentalement différente de celle de la France : elle cible ce que le réseau fournit, pas simplement où il atteint.

Le Royaume-Uni se situe à l’autre extrémité du spectre. La dernière étude dédiée d’Ofcom sur la connectivité ferroviaire date de 2019, et le Parlement a appelé à plusieurs reprises à des rapports annuels qui ne se sont pas matérialisés. Le Royaume-Uni n’a pas d’obligations de spectre ferroviaire spécifiques, et la responsabilité de la connectivité ferroviaire est fragmentée entre plusieurs départements gouvernementaux. Le Shared Rural Network cible largement la couverture rurale mais ne s’adresse pas spécifiquement aux corridors ferroviaires. Un accord d’infrastructure entre Network Rail et Neos Networks signale un élan, mais un programme de connectivité ferroviaire coordonné n’est pas attendu pour fournir des résultats avant 2027 au plus tôt.

L’Espagne a adopté un modèle de partenariat public-privé. ADIF, le gestionnaire national des infrastructures ferroviaires, a signé un contrat de 25,5 millions d’euros avec Vodafone et SEMI pour le déploiement de 5G sur les routes AVE à grande vitesse, financé en partie par la Facilité pour la reprise et la résilience de l’UE. L’approche espagnole est basée sur des projets plutôt que sur des obligations, fournissant des améliorations ciblées sur les itinéraires phares sans établir un cadre universel.

L’Italie s’est concentrée sur les nœuds plutôt que sur les liens. Le groupe FS et TIM se sont associés sur la couverture des tunnels sur les corridors à grande vitesse, tandis qu’INWIT a déployé l’infrastructure 5G dans les principales gares incluant Roma Termini. Les études de faisabilité financées par le PNRR de l’Italie ont exploré la connectivité au niveau des corridors, mais l’AGCOM n’a pas imposé d’obligations de couverture ou de qualité ferroviaires. L’accent demeure sur l’assurance de la connectivité aux gares plutôt que le long des itinéraires qui les séparent.

Au niveau de l’UE, le programme Connecting Europe Facility (CEF) Digital alloue environ 300 millions d’euros pour les corridors 5G le long des routes du Réseau transeuropéen de transport (RTE-T) jusqu’à 2027. Plusieurs études d’amorçage pertinentes pour la France ont été approuvées, incluant des projets pour les corridors ferroviaires transfrontaliers Paris-Bruxelles et Fréjus. Le règlement révisé RTE-T (2024/1679) souligne la connectivité numérique comme composante de l’infrastructure de transport, mais renvoie les obligations spécifiques aux États membres.

La couverture est un plancher, pas un plafond, sur les voies ferrées

La France a construit l’un des cadres d’obligations de couverture mobile les plus progressifs d’Europe pour les voies ferrées, et elle a largement éliminé les zones mortes de couverture sur le réseau national grâce à une collaboration proactive avec l’industrie. Nos données révèlent que le défi a maintenant basculé vers une optimisation réseau plus profonde, qui nécessite d’aller au-delà des simples métriques de couverture de base pour comprendre ce que les passagers vivent réellement sur les trains quand ils ont un signal.

En l’absence d’autres mesures de soutien, il convient de prendre en compte les contraintes des obligations de couverture seules dans la stimulation de meilleurs résultats. Par exemple, la performance de débit dominante d’Orange est grâce à son portefeuille sub-1 GHz de 57,4 MHz et son avantage de spectre mi-bande de 10 MHz (et peut également refléter la concurrence entre opérateurs au-delà du mandat), des avantages qu’aucune obligation de couverture ne peut facilement reproduire pour ses rivaux.

À mesure que FRMCS approche et que les projets CEF Digital progressent des études initiales au déploiement, la question stratégique passe de savoir si les trains ont des signaux à ce que ce signal peut fournir. Le modèle allemand de régulation des planchers de bande passante sur les voies ferrées, plutôt que simplement l’existence de la couverture, offre un modèle avant-gardiste. Il pourrait être renforcé par des métriques supplémentaires pour la vidéo, la latence, la QoE, etc. Pour la France et le reste de l’Europe, la prochaine phase de la politique de connectivité ferroviaire devra s’attaquer non seulement à la couverture géographique des réseaux, mais aussi à la performance de ces derniers une fois sur place.

Ookla retains ownership of this article including all of the intellectual property rights, data, content graphs and analysis. This article may not be quoted, reproduced, distributed or published for any commercial purpose without prior consent. Members of the press and others using the findings in this article for non-commercial purposes are welcome to publicly share and link to report information with attribution to Ookla.

| February 17, 2026

A Global Reality Check on 5G Standalone and 5G Advanced in 2026

A year on from our inaugural report, the global 5G SA narrative in 2026 has shifted from a coverage race to a capability contest. The GCC now delivers median download speeds five times those in Europe, while the U.S. has completed its Tier-1 SA launches. Europe is accelerating, but from a low base, and the gap with global leaders risks widening as 5G Advanced scales elsewhere.

The second edition of Ookla and Omdia’s flagship report on the global state of 5G Standalone confirms that the technology has moved beyond launch announcements into an execution-driven phase. By the close of 2025, the “coverage gap” between major economic blocs had narrowed, but a more consequential “capability gap” has emerged, reflecting divergent spectrum strategies, investment depth, and the extent to which operators have moved beyond baseline SA deployment toward end-to-end network optimization.

Globally, 5G SA availability based on Speedtest® sample share reached 17.6% in Q4 2025, up modestly from 16.2% a year earlier, indicating that roughly one in six 5G Speedtests worldwide now occurs on a standalone network. The headline global median SA download speed of 269.51 Mbps represents a 52% premium over non-standalone networks, though this figure masks significant regional variation driven by spectrum allocation depth, carrier aggregation maturity, and user-plane engineering.

For governments and regulators, the stakes of the SA transition have intensified. National competitiveness, digital sovereignty, and AI readiness have converged to reshape investment priorities across major markets. The European Commission’s Digital Networks Act, the U.S.’ supply chain diversification program, and China’s integration of 5G Advanced into its 15th Five-Year Plan all signal that 5G SA is now treated as foundational national infrastructure central to AI ambitions, and not merely a connectivity upgrade.

This year’s report significantly expands the scope of the analysis. For the first time, our research examines 5G SA’s impact on end-user battery life and voice performance (VoNR), quality of experience (QoE) metrics to cloud and gaming infrastructure, and the first wave of commercial monetization strategies spanning consumer network slicing, enterprise SLAs, and 5G Advanced segmentation. We also provide an assessment of the geopolitical context now shaping SA’s evolution, from Europe’s Digital Networks Act to the GCC’s sovereign AI infrastructure strategies.


Key Takeaways:

The GCC has established itself as the global 5G SA performance leader, with the UAE setting the speed benchmark

Led by e& and du’s aggressive 5G Advanced deployments, the Gulf Cooperation Council (GCC) delivered the world’s fastest 5G SA median download speeds in Q4 2025 at 1.13 Gbps, nearly five times that of Europe. The UAE alone reached a median of 1.24 Gbps on SA networks, a speed that would be considered exceptional even for full-fiber broadband in developed markets. The deployment of four-carrier aggregation and enhanced MIMO technology, coupled with the strategic allocation of premium mid-band spectrum to the SA network, demonstrates the performance ceiling that a fully realized 5G SA architecture can achieve.

Spectrum Depth & Core Optimization Shape 5G SA
Speedtest Intelligence® | Q4 2025

South Korea followed at 767 Mbps, driven by wide 3.5 GHz channel bandwidth, with the U.S. at 404 Mbps following the completion of nationwide SA deployments by all three Tier-1 operators. Europe, at 205 Mbps, trails all developed regions, though the region’s SA networks still deliver a 45% download speed premium over NSA, confirming the performance value of the SA transition where material spectrum depth is allocated.

Europe’s 5G SA gap with global peers is narrowing, but the region still trails North America by 27 percentage points

Europe’s 5G SA sample share more than doubled from 1.1% to 2.8% between Q4 2024 and Q4 2025, driven by accelerated deployments in Austria (8.7%), Spain (8.3%), the United Kingdom (7.0%), and France (5.9%). These four markets now account for the vast majority of European SA connections. The United Kingdom and France registered the strongest year-on-year acceleration in Europe, each gaining 5.3 percentage points, reflecting the impact of investment-linked merger conditions and competition in the United Kingdom, as well as targeted R&D policy support in France.

U.S. Widens 5G SA Lead Over Europe & Gulf
Speedtest Intelligence® | Q1 2023 – Q4 2025

However, the region still trails North America by 27 percentage points and emerging Asia by 30. At the global level, the U.S. remains the largest accelerator in absolute terms over the last year, with SA sample share rising 8.2 percentage points to 31.6% year-on-year, driven by the sequential rollout of SA across all Tier-1 operators beyond T-Mobile. Firmware fragmentation, where handset OEMs gatekeep SA network access pending individual carrier certification, and tariff structures that fail to incentivize migration from NSA, remain the primary barriers to faster European adoption.

5G SA delivers measurable performance and quality of experience gains, but end-to-end optimization separates leaders from laggards

Globally, SA connections delivered a 52% download speed premium (mostly an artifact of rich spectrum allocation and lower network load) and improved median multi-server latency by over 6% compared to NSA. However, this year’s report finds that a standalone core migration alone does not guarantee a better end-user experience. Quality of experience analysis reveals a nuanced picture: SA improves video and cloud infrastructure latency in Europe versus NSA, but underperforms NSA for gaming latency within the same region. North America records the lowest absolute SA cloud and gaming latency, consistent with dense hyperscaler adjacency and mature interconnect ecosystems.

Among European markets, France (41 ms to cloud endpoints), Austria (48 ms), and Finland (50 ms) demonstrate what is achievable where backbone quality, peering density, and routing discipline are strong. These outcomes reflect an underappreciated end-to-end network stack optimization dividend, encompassing data-center proximity, fiber backhaul depth, and user-plane topology, rather than a pure “SA dividend” alone.

The report also presents early evidence of a tangible consumer benefit of SA: battery life. In the UK, devices on EE’s 5G SA network recorded median discharge times approximately 22% longer than those on NSA, with O2 showing an 11% advantage. These gains likely stem from features like SA’s unified control plane, which eliminates the dual-connectivity overhead of NSA configurations.

Core network investment is accelerating as monetization transitions from concept to selective execution

Omdia’s latest forecasts confirm the industry’s shift toward software-defined core capability as the primary driver of next-cycle investment. Global 5G core software spending is projected to grow at an 8.8% CAGR between 2025 and 2030, with EMEA leading at 16.7%, significantly outpacing North America (5.5%) and Asia & Oceania (4.2%). This reflects EMEA’s later position in the deployment cycle, as the region is entering its period of peak 5G core adoption, while North America’s core spending trajectory is expected to have peaked in 2025 following the commercial launches by AT&T and Verizon. By end of Q3 2025, 83 operators worldwide had deployed 5G core networks, with 5G core investment accounting for 63.6% of global core network function software spending.

5G Core Investment Accelerates Across Regions
Omdia | 2023-2030

On monetization, consumer strategies now span speed tiers (primarily Europe), network slicing (Singapore, France, and the U.S.), and 5G Advanced segmentation packages (China). Enterprise slicing presents the much larger long-term revenue opportunity, with T-Mobile’s SuperMobile representing the first nationwide commercial B2B slicing service in the U.S. Countries with coordinated regulatory frameworks, implementing clear coverage obligations, investment incentives, or infrastructure consolidation policies with deployment remedies, consistently outperform those with fragmented or reactive approaches, reinforcing the report’s finding that policy has emerged as a primary competitive differentiator in 5G SA outcomes globally.


Download the full report

For the comprehensive analysis of 5G SA and 5G Advanced deployment, performance, and monetization across global markets, including new research on battery life, voice performance, quality of experience, geopolitical context, and expanded policy case studies from the UK, France, Brazil, Japan, and the UAE, download the full report, 5G Standalone and 5G Advanced: A Global Reality Check on 5G SA and 5G Advanced in 2026.

Ookla retains ownership of this article including all of the intellectual property rights, data, content graphs and analysis. This article may not be quoted, reproduced, distributed or published for any commercial purpose without prior consent. Members of the press and others using the findings in this article for non-commercial purposes are welcome to publicly share and link to report information with attribution to Ookla.

| April 16, 2025

Mind the Gap: London's 5G Performance Lags Behind Other UK Cities

Londoners spend more time in mobile signal not-spots, or coverage gaps, and experience slower 5G speeds than residents of other UK cities—resulting in poorer performance in everyday tasks such as web browsing.

London is the sprawling metropolis at the heart of the UK economy, home to one of the world’s largest and most lucrative service hubs, supporting a vast network of finance and technology firms. Beyond its strategic time zone and English-language advantage for accessing both American and Asian markets, London’s prosperity has been founded on the availability of world-class infrastructure that facilitates doing business.

The city’s reputation for international competitiveness has not, however, been matched by the quality of its telecommunications infrastructure. In recent years, a flurry of media reports has highlighted the frustrations of Londoners—and visitors alike—that experience frequent issues using mobile devices indoors, underground, and in busy areas. These problems, reported as being more pronounced than in other UK and European cities, typically manifest as poor quality of experience in everyday tasks such as web browsing, video streaming, and gaming.

This article is the first and a high-level prelude to a series exploring the competitiveness of mobile networks in European towns and cities—starting in the UK with city-level comparisons to London, and followed by a deeper, more comprehensive analysis among international peers coming in research later this year. 

Key Takeaways:

  • London lags behind the UK’s largest cities across key 5G performance indicators, and the gap to top-performing Glasgow is widening. In Q1 2025, London trailed other UK cities in 5G network consistency—a key indicator of performance at the lower end of the user experience—as well as in median download and upload speeds. Mobile users in London and Belfast experienced the weakest outcomes among UK cities, with median 5G download speeds of approximately 115 Mbps in both cities, significantly behind Glasgow’s 185 Mbps. London’s marked underperformance makes the UK unique in Western European terms—not only are the disparities between its major cities wider, but it is also unusual for the capital to be the primary laggard.
  • Mobile users in London spend more time in signal not-spots with no service than residents of other UK cities, reflecting lingering coverage gaps indoors and across key transport routes. The proportion of Londoners spending the majority of their time in locations with no service (0.7%) remained higher than in other UK cities in Q1 2025, but has improved significantly from 3.7% in Q1 2023. This progress reflects operator investments in network densification through small cells and the ongoing rollout of mobile coverage across the London Underground—historically one of the city’s largest mobile not-spots—which have together enhanced overall network availability in the capital. Time spent on 2G networks increased, however, across several UK cities over the last year, including Birmingham and Manchester, as the advancement of the 3G sunset in the UK contributed to greater propensity for 2G fallback.
  • The gap in 5G availability between the UK’s major cities and the national average has significantly narrowed over the past year. In Q1 2024, Leeds led UK cities in 5G availability, with a 21 percentage point gap above the national average. By Q1 2025, London had taken the lead in 5G availability among major UK cities, and that gap above the national average had narrowed to 13 percentage points. This trend reflects progress in 5G network expansion in smaller UK towns and rural areas in recent months, which has moved at a faster pace than coverage improvements in larger cities. Overall, median 5G download speeds fell by more than 7% on average across major UK cities between Q1 2024 and Q1 2025, likely reflecting the impact of shifting network load from older technologies onto 5G, which contributed to broader improvements in overall mobile network performance in most UK cities in the same period.

A confluence of factors has created unique headwinds for mobile network deployments in UK cities in recent years, particularly in dense urban settings like London

The deployment of 5G networks in higher-frequency spectrum—most commonly the 3.5 GHz band—continues to present significant challenges for operators globally. Like their counterparts across Europe, UK mobile operators have had to invest heavily in network densification during the 5G cycle. The widespread deployment of small cells at street level across UK cities illustrates the scale of effort required to increase network capacity and overcome the more limited propagation attributes of mid-band spectrum.

Over time, the city environment itself has become increasingly hostile to the operation of high-performing mobile networks. Across developed markets, advancements in building design and stricter regulations have led to a proliferation of highly insulated, airtight structures. These developments often incorporate low-E glass, metal cladding, and reinforced concrete—materials that, collectively, turn new and retrofitted buildings into de facto Faraday cages. London, in particular, presents unique challenges among UK cities, with a high concentration of high-rise buildings featuring deep floorplates. 

Indoor Mobile Not-Spots Have Proliferated Across Central London, Particularly in Dense Settings with New and Retrofitted Builds (Image: Ookla Cell Analytics)

While the UK’s Part L Building Regulations are not unique or unusually stringent by European standards, they have evolved alongside a set of factors particular to the UK context that have significantly hindered mobile operators’ ability to deliver high-performing 5G networks in dense urban environments. The roots of these factors stem as far back as 2017, well before the commercialization of the country’s first 5G networks, when the UK government introduced changes to the Electronics Communications Code (ECC) in an effort to accelerate mobile network rollouts and reduce costs by streamlining access to land for telecommunications deployments. 

The Digital Economy Act, which reformed the ECC, granted mobile operators and tower companies greater rights to access land on more favorable financial terms in the UK. The intention was to curb inflated lease costs, particularly in cases where landowners appeared to demand “ransom rents.” However, rather than accelerating network rollouts, the reforms triggered widespread legal disputes, uncertainty in lease negotiations, and delays in site access and upgrades. 

The impact of these land access reforms has been especially acute in dense urban settings such as London, where rooftop deployments play a disproportionate role due to limited ground-level space for mobile equipment. In London, the sheer number of individual property owners—including private landlords, commercial building managers, and housing associations—results in highly fragmented land ownership, making rooftop sites significantly more complex to manage, both legally and logistically, than rural ground leases.

The Combination of Increasing Building Density, Use of New Insulation Materials, and Decline in Rooftop Site Availability Has Resulted in More Frequent Fallback to Less Capable Low-Band Spectrum in UK Cities like London (Image: Ookla Cell Analytics)

The EEC further compounded this complexity by disrupting long-standing rooftop leasing arrangements in cities like London, leading to thousands of disputes since 2017 over issues such as ransom rents, blocked site upgrades, and non-renewals. The regulation reduced potential rental income by as much as 80% to 90% for some landlords, significantly discouraging the availability of rooftop space for mobile network deployments. This effect was particularly pronounced in London, where building owners have seen greater commercial value in alternative uses for scarce rooftop space, such as bars, gardens, or solar panel installations, hindering the ability of operators to densify their networks. 

The UK is the only European country to have adopted such a unilateral price-cutting approach to site access during the 5G cycle. To ease tensions between operators and land owners, the UK government introduced further changes in the “2022 Product Security and Telecommunications Infrastructure Act.” These updates aimed to encourage alternative dispute resolution, simplify lease renewals, and extend the provisions from the EEC to agreements signed before 2017. However, the reforms retained the reduced rental model, meaning while procedural barriers were reduced, incentives for property owners to host rooftop sites remained weak, failing to stem the decline in rooftop site availability in cities like London in recent years.

Combined with the UK’s decision to impose stricter controls on the use of telecom equipment from non-European vendors than those seen elsewhere in Europe, which diverted time and resources toward network rebuilds rather than expansion and upgrades, UK operators have faced significant headwinds in deploying mobile network infrastructure during the 5G cycle.

Progress in the 5G rollout belies lingering performance disparities among the UK’s major cities

Despite significant progress countrywide in improving 5G networks with additional sites, more spectrum availability (some of it from the refarming of 3G), and an expanded 5G standalone (SA) footprint, disparities continue to exist among the UK’s cities. The gap between the best- and worst-performing major cities in median 5G download and upload speeds, for example, widened between Q1 2024 and Q1 2025, based on analysis of Speedtest Intelligence® data.

The Gap in 5G Download Speeds Between Glasgow and Other UK Cities Has Widened
Speedtest Intelligence® | Q1 2024 – Q1 2025


In Q1 2025, Glasgow led the UK with median 5G download speeds reaching 185 Mbps, which was as much as 47% higher than in London, the slowest major city, and 24% higher than in Birmingham, the next best performer. This ranking profile extended to 5G network consistency, which measures the proportion of Speedtest samples that meet a minimum download and upload speed threshold of 25 Mbps and 3 Mbps. While more than 85% of Speedtest samples met this threshold in Glasgow, fewer than 75% did in London, which exhibited the lowest consistency rate among major UK cities and was the only one aligned with the national average that includes both rural and urban areas.

London’s underperformance at the lower percentiles of measures like download speeds is particularly notable, as it strongly reflects the experience of mobile users in more challenging conditions—such as at the network edge, during peak hours, or in congested areas. The city’s lower consistency score and weaker 10th percentile download and upload speeds suggest that Londoners are more likely to encounter poor mobile performance compared to residents of other major UK cities.

Londoners Experience Less Consistent 5G Performance Than Residents of Other UK Cities
Speedtest Intelligence® | Q1 2025

The UK stands out in Western Europe for both the scale of the performance gap between its major cities and the unusual fact that its capital is the lagging city. Most regional peers more closely resemble the profile of neighboring France, where Paris ranks among the top three cities nationally for 5G network consistency, as well as median download and upload speeds. In France, the gap in 5G network consistency between the best- and worst-performing cities was as narrow as 5 percentage points in Q1 2025—a disparity that is half that of the UK.

The UK's Cities Exhibit a Greater Range in 5G Consistency Than Other Western European Countries
Speedtest Intelligence® | Q1 2025

In practical terms, London’s underperformance in metrics like 5G download speed and consistency translates into poorer QoE outcomes in everyday tasks like web browsing. In Q1 2025, for example, median web page load times to popular global websites were higher in London than in nine out of ten other major UK cities.

Londoners Spend More Time Waiting on Popular Websites to Load
Speedtest Intelligence® | Q1 2025

Mobile not-spots continue to be a fixture of everyday life in UK cities, particularly in London

The combination of factors outlined earlier, including the shift toward insulation materials that inhibit signal propagation, the collapse in rooftop rental fees reducing access to mobile sites, and the use of higher-frequency spectrum for 5G, has posed challenges for mobile operators across all UK cities seeking to reduce the prevalence of mobile not-spots. These challenges have been particularly pronounced in the cities with the highest levels of density, most notably London.

Deep indoor and underground spaces (e.g., transport systems like the London Underground network) remain the primary contributors to time spent with no mobile signal or fallback to 2G networks. These cell edge scenarios are highly disruptive for the end-user, resulting in limited access to basic telephony features like texting and calling and a substantial increase in device-side power consumption. 

Londoners Spend More Time in Mobile Not-Spots Than the UK Average
Speedtest Intelligence® | Q1 2024 – Q1 2025

The proportion of mobile users in London spending the majority of their time in locations with no network access at all (0.7%) was higher than in other major UK cities in Q1 2025 (an observation related to the capital city that again defies Western European norms). By contrast, less than 0.3% of mobile users in Belfast, Bristol and Sheffield spent the majority of their time in not-spots in the same period. Overall, time spent with no service accounted for as much as 2.6% of quarterly network usage in Q1 2025 in London, significantly higher than the national average.

Despite the disproportionate scale of mobile not-spots lingering in London, recent operator investments in network densification and progress in the ongoing rollout of 4G and 5G coverage throughout the London Underground network are driving dramatic improvements in outcomes. The proportion of Londoners spending the majority of their time in locations with no service has more than halved over the last two years, reflecting a much more pronounced pace of improvement than other UK cities and putting the capital on course to fall into line with other large cities like Birmingham and Manchester.

The Proportion of Mobile Users Spending the Majority of Their Time on 2G Has Increased in Several UK Cities
Speedtest Intelligence® | Q1 2024 – Q1 2025 (Including Roaming Samples)

The advancement of the UK’s 3G sunset, which is set to be substantially complete by the end of this year, is reflected in a sharp reduction in the proportion of mobile users spending the majority of their time on 3G networks. In London, for example, this proportion fell from over 4.5% in Q1 2023 to less than 0.7% in Q1 2025.

The 3G sunset has, however, contributed to an increase in 2G fallback in UK cities at the cell edge where 4G and 5G networks are unavailable. Time spent on 2G increased across several UK cities over the last year, including Liverpool, where this trend has resulted in a larger share of users spending the majority of their time on 2G than in areas with no service at all (a rarity among UK cities). 

The Decline in 3G Usage Has Been Similarly Rapid Across UK Cities
Speedtest Intelligence® | Q1 2023 – Q1 2025

Cities that take a proactive approach to telecoms feature the best 5G outcomes

Glasgow’s position as the leading UK city in key 5G performance indicators is unlikely to be an outcome achieved by mere chance. Beyond the contribution of inherent structural factors related to building composition, such as a lower prevalence of high-rise developments relative to other major UK cities, Glasgow’s 5G leadership is also likely rooted in its early and proactive approach to supporting telecoms infrastructure.

The city was among the first in Europe to establish a dedicated “Telecoms Unit”, which streamlined access to city-owned assets for telecom deployments, provided standardized agreements for rental fees, and consolidated telecoms functions within the local authority to reduce departmental siloes. This proactive approach facilitates inward investment in network infrastructure and better 5G outcomes. 

Ookla retains ownership of this article including all of the intellectual property rights, data, content graphs and analysis. This article may not be quoted, reproduced, distributed or published for any commercial purpose without prior consent. Members of the press and others using the findings in this article for non-commercial purposes are welcome to publicly share and link to report information with attribution to Ookla.

| June 30, 2025

Poland Races to Regain 5G Competitiveness in Europe with Mid-Band Rollout | Polska galopuje do odzyskania konkurencyjności 5G w Europie dzięki wdrożeniu średniego pasma częstotliwości

Polish/Polski

Poland’s operators are rapidly deploying mid-band 5G in an attempt to capture the growing premium market segment

Late to the game in staging a mid-band auction, Poland has lagged behind its European peers in 5G deployment in recent years. This delay has weighed on the country’s global competitiveness in mobile network performance and slowed its progress toward meeting the European Commission’s flagship 5G deployment targets, which require universal 5G coverage across every EU member state by the end of the decade.

This article examines the state of Poland’s mobile market and its broader regional 5G competitiveness in the context of ongoing mid-band deployments. A follow-up report will assess the longer-term impact of the commercialization of the recently awarded low-band spectrum and ongoing network sunsets on network coverage and availability.

Key Takeaways:

  • Intensive capital spending on mid-band deployment drives substantial uplift in 5G performance across Polish operators from Q1 2024, pushing the country ahead of regional peers over the last year. Median 5G download speeds in Poland jumped by over 50% to 160.30 Mbps between Q1 2024 and Q1 2025, based on Speedtest Intelligence® data, propelling the country ahead of Czechia, Romania, and Slovakia for the first time in 5G performance. Despite this progress, Poland continues to trail its regional peers in 5G network Consistency, a measure of how reliably a mobile connection remains “fast enough” for normal use.
  • T-Mobile and Orange surpass Play and Plus in speed and select Quality of Experience (QoE) measures. Differences in how quickly and extensively Polish operators have deployed their mid-band spectrum assets have led to a diverging market profile since Q1 2024, with T-Mobile and Orange significantly extending their speed lead over their rivals. Between Q1 2024 and Q1 2025, median 5G download speeds rose by as much as 72% on Play (to 122.64 Mbps), 86% on T-Mobile (to 201.76 Mbps), and 90% on Orange (to 222.10 Mbps)—while declining by over 10% on Plus (to 116.76 Mbps). 
  • Network investments have broadened 5G coverage in Poland, but significant regional disparities remain. Nationally, 5G availability rose from 28.5% in Q1 2024 to 43.1% in Q1 2025, driven by continued Dynamic Spectrum Sharing (DSS) rollouts and the activation of mid-band spectrum—placing the country ahead of regional peers Bulgaria, Romania, and Hungary in 5G availability. Nonetheless, by Q4 2024, a pronounced coverage gap persisted between the country’s best- and worst-served provinces, with 5G availability in the populous Masovian Voivodeship (47.2%) double that of the Lubusz Voivodeship (23.6%).

Over the last year, Polish operators have been locked in an intense four-way race to catch up with their regional peers in 5G deployment, driven by stringent coverage obligations imposed by the Polish telecoms regulator (UKE), a wave of funding support from Brussels, and a growing push to compete for a larger share of the country’s widening premium market segment, where network performance has emerged as a key competitive differentiator.

Poland’s mobile market is today awash with deployment activity, as operators ramp up capital spending to the highest levels in years to equip thousands of mobile sites with mid-band spectrum, accelerate the sunset of 3G networks, and lay the groundwork for launching 5G standalone (SA) in the coming years. This flurry of activity follows the completion of the 700/800 MHz auction at the end of March this year, where all Polish operators secured low-band 5G spectrum for the first time—paving the way for improved rural and deep in-building 5G coverage and rounding out the country’s 5G spectrum release plans.

While 5G capital spending has slowed across much of Europe, Poland sees different dynamics due to late spectrum auctions

Poland was notably late in releasing dedicated 5G spectrum in the ‘pioneer bands’ identified by the European Commission as critical to the timely commercialization and rollout of 5G across EU member states. The country’s mid-band (3.6 GHz) auction, initially planned for mid-2020, was repeatedly delayed—by more than three years—due to the pandemic and a protracted security legislation process. 

These delays in spectrum availability have contributed to Poland’s divergence from much of the rest of Europe in both the economic and technical dimensions of the 5G rollout. Until recently, Polish mobile operators exhibited lower capital intensity (they invested less of their revenue) compared to peers in other European countries. Most of their spending went into upgrading 4G sites and preparing for the 3G shutdown, instead of building a new 5G mid-band capacity layer or expanding 5G coverage using low-band (700 MHz) spectrum.

Orange's Rising Mobile Capex Reflects 5G Network Expansion
Analysis of Orange Poland accounts | 2020 – 2024

Analysis of financial data published by Orange, Poland’s largest mobile operator by subscriber count, confirms that the era of lower capital intensity (relative to elsewhere in Europe) is over. The recent spectrum auctions have triggered a new cycle of investment, with Orange doubling its mobile network spending in the past three years. Play has also rapidly increased its investment, as its French parent Iliad reported injecting record amounts into Play’s mobile infrastructure last year.

Play's Contribution to Capex in the Iliad Group Surges as 5G Buildout Ramps Up
Analysis of Iliad Group accounts | 2020 – 2024

On the technical side, meanwhile, Poland’s spectrum delay meant that three of the country’s four operators were forced to rely heavily on Dynamic Spectrum Sharing (DSS)—a technology that allows 4G and 5G to operate on the same band and adjust ‘dynamically’ to demand—in an effort to deliver early 5G coverage in the 2100 MHz band while awaiting spectrum auctions. This strategy resulted in Poland’s initial 5G performance more closely resembling those typical of 4G networks, as DSS deployments are typically based on a 10 MHz carrier where part of the capacity is still reserved for 4G signals, making 5G speeds with DSS around 15–25 % lower than if the band were dedicated solely to 5G.

The limitations of using DSS to deliver a “5G experience” were exemplified by the speed advantage maintained by Plus earlier in the 5G rollout. Importantly, Plus was the only Polish operator that did not rely on DSS and instead dedicated a full 40 MHz carrier in the 2600 MHz (TDD) band to 5G before mid-band spectrum became available at the start of last year. Prior to the 3.5 GHz band coming online, when the other operators were still wholly dependent on DSS for 5G coverage, Plus’s median 5G download speed of 133.34 Mbps was as much as 77 % higher than T-Mobile’s, 81 % higher than Orange’s, and 92 % higher than Play’s. 

Intense Mid-Band Deployment lifts Poland’s Regional 5G Competitiveness and Reshapes Operator Dynamics

Polish operators move from mid-band spectrum acquisition to mass commercial deployment in record time

The pent-up demand for mid-band spectrum in Poland was evident when mobile operators like Orange, T-Mobile, and Play launched commercial services just three months after acquiring mid-band spectrum, moving quickly from the auction in October 2023 to commercial launches by January 2024. T-Mobile reported that its mid-band 5G network already covered more than 25% of the Polish population by April 2024, with more than 2,100 sites active, while Orange announced it had reached 40% coverage by mid-June.

This rollout pace is exceptional by European standards and indicative of the increased pace of deployment possible later in the 5G technology cycle. It took Spain’s Telefónica (Movistar) about six months to reach its first 1,000 mid-band sites by comparison, and Germany’s operators needed around nine months to achieve the same milestone.

Plus's Spectrum Holdings in the 2600 MHz TDD Band Lend it a Decisive Capacity Lead

Each operator secured a contiguous 100 MHz block of spectrum in the 3.5 GHz band, which is widely regarded as optimal due to the large channel bandwidth this configuration affords. However, Plus has been notably slower to commercialise this allocation at scale. Plus’s earlier strategy of deploying 5G in the dedicated 2600 MHz band (rather than relying on DSS), alongside later using the 2100 MHz band as well, gave it more flexibility to delay a broad mid-band rollout as it previously enjoyed a significant 5G speed advantage over competitors while they were still heavily dependent on DSS deployments. 

Mid-band deployment shifts 5G performance rankings among Polish operators

Mass deployment of a new capacity layer by the other three operators has since decisively altered performance dynamics in the Polish market and eroded Plus’s lead. In the space of one year between Q1 2024 and Q1 2025, Plus has moved from market leader in median 5G download speed to laggard, becoming the only Polish operator to see a year-on-year decline in 5G speed, down 10%, indicating the increasing limitations of its 2600 MHz strategy. 

Orange and T-Mobile Pull Ahead in 5G Performance with Mid-Band Deployment
Speedtest Intelligence® | Q1 2023 – Q1 2025

By contrast, mid-band deployment has boosted performance across the rest of the market, with median 5G speeds rising by as much as 72% on Play, 86% on T-Mobile, and 90% on Orange between Q1 2024 and Q1 2025. While Orange led the Polish market in Q1 with a median 5G download speed of 222.11 Mbps, the operator’s lead has narrowed significantly as T-Mobile’s mid-band buildout has progressed, with T-Mobile now recording median 5G download speeds of 201.76 Mbps, well ahead of third- and fourth-placed Play (122.64 Mbps) and Plus (116.76 Mbps), respectively.

Plus's Lead in 5G Consistency Narrows as 2600 MHz Advantage Recedes with Mid-Band Deployment
Speedtest Intelligence® | Q1 2023 – Q1 2025

Despite losing its lead in median 5G download speed, Plus continues to lead at the 10th percentile (29.44 Mbps in Q1 2025), meaning subscribers in its lowest-performing areas still enjoy comparatively better speeds than those on rival networks. This advantage is likely linked to Plus’s lower dependence on DSS. However, T-Mobile (24.48 Mbps) and Orange (21.88 Mbps) are quickly closing the gap, with their 10th percentile 5G speeds now converging toward Plus. Plus’s 5G network consistency, measured as the proportion of Speedtest samples meeting a minimum download and upload threshold of 25/3 Mbps, has also declined over the past year, although it remains the market leader.

On upload performance, meanwhile, Play’s 5G network led the market in Q1 2025, recording median speeds of 19.33 Mbps, followed by Orange (18.99 Mbps), T-Mobile (17.32 Mbps), and Plus (14.96 Mbps). Unlike the substantial gains seen in download speeds, there is limited evidence so far that the mid-band rollout has materially improved upload performance, with median upload speeds about 6% lower in Q1 2025 compared to the same quarter last year. This discrepancy arises primarily because all four operators continue to deploy 5G in non-standalone (NSA) mode, requiring devices to transmit uplink traffic via existing 4G anchor bands. Consequently, the newly available 3.5 GHz spectrum enhances downlink capacity but leaves the congested 4G uplink path unchanged.

Play Develops Lead in 5G Upload Performance
Speedtest Intelligence® | Q1 2023 – Q1 2025

The operators’ investments in deploying a new 5G capacity layer have coincided with a broader RAN refresh effort, translating into improved quality of experience for users in key use cases such as video streaming and web browsing. Median web page load times on T-Mobile’s network, for instance, improved by around 4% between Q3 2024 and Q1 2025. Orange led in video metrics such as start time, resolution, and uninterrupted playback in the last quarter.

5G Drives QoE Improvements in Use Cases like Web Browsing
Speedtest Intelligence® | Q1 2025

Capital investment expands 5G coverage, but Poland’s rural-urban digital divide persists

While investments in DSS and the mid-band rollout have enabled Polish operators to make significant strides in 5G availability, which increased nationally from 28.5% in Q1 2024 to 43.1% in Q1 2025, regional coverage disparities continue to be a feature of the mobile network experience in Poland. Operators have prioritized 5G deployments in the richest and densest parts of Poland where fiber is heavily deployed, including the Masovian (Warsaw) and Pomeranian (Tri-City) provinces. In these provinces, 5G availability reached more than 40% by the end of last year and contributed to driving materially higher median download speeds than the national average. 

5G Availability Remains Highly Varied Across Poland Outside of Urbanized Areas
Speedtest Intelligence® | 5G Availability (%) in Q4 2024

By contrast, border provinces along the south and west of the country continue to experience much lower levels of 5G availability. Lubusz had the lowest availability (23.6% at the end of last year), where there is lower population density and lower subscriber spending, which reduces operators’ commercial incentives for widespread 5G investment. This trend has driven the development of a notable speed gap between provinces, with mobile subscribers in Lubusz also experiencing the lowest median download speeds (59.97 Mbps) in Poland, almost 33% below the leading Masovian province.

Mobile Download Speeds Are Lower in Less Urbanized Areas of Poland
Speedtest Intelligence® | Median Download Speed (Mbps) in Q4 2024

Mid-band deployment improves Poland’s mobile competitiveness, but 5G consistency continues to trail regional peers

From a regional competitiveness lens, intensive mid-band deployments have been successful in breaking Poland’s cycle of mobile network underperformance, with median 5G download speeds rising by over 50% on average to 160.30 Mbps between Q1 2024 and Q1 2025. This has propelled the country ahead of Czechia, Romania, and Slovakia for the first time in terms of 5G download speed performance.

Mid-Band Deployments Propel Poland's Regional Competitiveness
Speedtest Intelligence® | 2020 – 2025

Despite Poland’s  progress on its mid-band 5G rollout, the lingering effects of reliance on DSS and limited 5G spectrum diversity—up until the recent 700/800 MHz auction—mean that Poland continues to trail its regional peers in terms of 5G network consistency. In Q1 2025, 82% of Speedtest samples in Poland met the minimum 5G performance threshold for a consistent mobile experience, compared to 86% in Hungary, 89% in Romania, and 93% in Bulgaria.

Newfound spectrum diversity lends Polish operators potent tool to stimulate ARPU growth

Poland’s previous reliance on DSS, driven by limited 5G spectrum diversity, likely contributed to its slower average revenue per user (ARPU) growth compared to neighboring countries in recent years. Polish operators initially introduced tariffs with “5G at no extra cost” bolted onto existing 4G bundles, keeping prices flat to defend market share (and thereby maintaining depressed ARPU levels relative to regional peers). Combined with the external shock induced by markedly higher energy prices, stagnant ARPU levels created challenging operating conditions in the Polish market and weighed on operator profitability. 

Intense Priced-Based Competition Precipitated Revenue Erosion in Poland During the First Half of the 5G Cycle
Analysis of GSMA Intelligence Data | % Change in Mobile ARPU (Q1 2020 vs Q1 2023)

In neighboring markets, by contrast, operators were able to leverage mid-band spectrum deployments as both technical and marketing levers, shifting their strategies from price competition toward service-based differentiation. This enabled them to more effectively upsell premium speed tiers or monetize specific use cases, such as fixed wireless access (FWA), which dedicated mid-band 5G deployments uniquely support.

T-Mobile and Play Outpaced Rivals in Subscription Share Growth in Recent Years
Analysis of UKE Market Data | 2019 – 2023

Similarly, the delayed timing of Poland’s mid-band 5G auction likely dampened supply-side factors key for driving growth in mobile data traffic. Between Q1 2020 and Q4 2024, traffic volumes in neighboring Bulgaria converged with that in Poland for the first time, increasing by 4.8x vs. Poland’s 2.6x. Meanwhile, Bulgarian operators capitalized early on mid-band spectrum availability to aggressively promote competitive FWA solutions (a major driver of mobile traffic in developed markets) and to introduce cheap unlimited data tariffs with fewer usage restrictions.

Poland Maintains Regional Lead in Mobile Data Volumes, but Bulgaria is Catching Up
Analysis of GSMA Intelligence data | 2020 – 2024

Polish operators have since sought to replicate Bulgaria’s success by debuting distinct marketing for their mid-band 5G deployments to differentiate the newer mid-band 5G rollouts from earlier DSS-based 5G networks in terms of performance and user experience. T-Mobile has leaned on ‘5G More’ branding, while Plus has used ‘5G Ultra’ to indicate the additional performance gains unlocked by their new 5G networks in locations where dedicated mid-band spectrum is deployed. This strategy has formed part of a broader shift in the market, with all operators moving away from a hyper-focus on price competition and toward ‘more for more’ pricing strategies, supporting improved profitability and renewed ARPU growth in the market with inflation-linked tariffs.

Poland Has Led Regional ARPU Growth Since Mid-Band 5G Deployments Started
Analysis of GSMA Intelligence Data | % Change in Mobile ARPU (Q1 2023 vs Q1 2025)

Low-band activation and network sunset progress set to reinforce mid-band 5G gains

With Poland’s telecom regulator, UKE, having set among Europe’s most ambitious coverage obligations for recent mid- and low-band spectrum auctions, operators are unlikely to delay commercial deployments in the newly acquired 700 and 800 MHz bands. These deployments are expected to start next month and will be crucial for establishing a national 5G coverage layer that, for the first time, extends deep indoors and into rural areas. This expanded coverage will also support wider rollout of voice over LTE (VoLTE) services, accelerating the 3G sunset and freeing up additional spectrum in the 900 MHz band.

We will revisit shortly to assess how Polish operators are progressing with deploying their new low-band spectrum and how effectively it is complementing the ongoing 3G sunset.


Polska galopuje do odzyskania konkurencyjności 5G w Europie dzięki wdrożeniu średniego pasma częstotliwości

Polscy operatorzy przyśpieszyli z wdrażaniem 5G w średnim paśmie, próbując przejąć rosnący segment rynku premium.

Polska, która spóźniła się z przeprowadzeniem aukcji na średnie pasmo, w ostatnich latach pozostawała w tyle za swoimi europejskimi rówieśnikami w zakresie wdrażania 5G. Opóźnienie to odbiło się na globalnej konkurencyjności kraju pod względem wydajności sieci mobilnych i spowolniło postępy w realizacji sztandarowych celów Komisji Europejskiej w zakresie wdrażania 5G, które wymagają powszechnego zasięgu 5G w każdym państwie członkowskim UE do końca dekady.

Niniejszy artykuł analizuje stan polskiego rynku telefonii komórkowej i jego szerszą regionalną konkurencyjność 5G w kontekście trwających wdrożeń średniego pasma. Kolejny raport oceni długoterminowy wpływ komercjalizacji niedawno przyznanego niskiego pasma na potrzeby pokryciowe 5G.

Kluczowe wnioski:

  • Intensywne wydatki kapitałowe na wdrożenie średniego pasma napędzają znaczny wzrost wydajności 5G u polskich operatorów od pierwszego kwartału 2024 r., pozycjonując kraj przed regionalnych konkurentów w ciągu ostatniego roku. Mediana prędkości pobierania 5G w Polsce wzrosła o ponad 50% do 160,30 Mb/s w okresie od I kwartału 2024 r. do I kwartału 2025 r., w oparciu o dane Speedtest Intelligence®, dzięki czemu Polska po raz pierwszy wyprzedziła Czechy, Rumunię i Słowację pod względem wydajności 5G. Pomimo tego postępu, Polska nadal pozostaje w tyle za swoimi regionalnymi rówieśnikami pod względem spójności sieci 5G, która jest miarą tego, jak niezawodnie zestawione połączenie mobilne pozostaje “wystarczająco szybkie” do normalnego użytkowania.
  • T-Mobile i Orange przewyższają Play i Plus pod względem prędkości i wybranych wskaźników jakości doświadczenia usług (QoE). Różnice w strategiach, jak szybko i szeroko polscy operatorzy wdrożyli swoje aktywa widma w średnim paśmie, doprowadziły do rozbieżnego profilu rynku od pierwszego kwartału 2024 r., przy czym T-Mobile i Orange znacznie zwiększyły swoją przewagę w zakresie prędkości nad rywalami. Pomiędzy I kwartałem 2024 r. a I kwartałem 2025 r. mediana prędkości pobierania 5G wzrosła aż o 72% w Play (do 122,64 Mb/s), 86% w T-Mobile (do 201,76 Mb/s) i 90% w Orange (do 222,10 Mb/s) – przy jednoczesnym spadku o ponad 10% w Plusie (do 116,76 Mb/s).
  • Inwestycje sieciowe zwiększyły zasięg 5G w Polsce, ale nadal utrzymują się znaczne różnice regionalne. W ujęciu krajowym dostępność sieci 5G wzrosła z 28,5% w I kwartale 2024 r. do 43,1% w I kwartale 2025 r., co wynikało z dalszego wdrażania dynamicznego współdzielenia widma (DSS) i aktywacji widma w średnim paśmie, dzięki czemu Polska wyprzedziła pod względem dostępności sieci 5G regionalne kraje takie jak Bułgaria, Rumunia i Węgry. Niemniej jednak do IV kwartału 2024 r. utrzymywała się wyraźna luka w zasięgu między najlepiej i najgorzej obsługiwanymi województwami w kraju, przy czym dostępność 5G w zaludnionym województwie mazowieckim (47,2%) była dwukrotnie wyższa niż w województwie lubuskim (23,6%).
  • Wyłączenia sieci 3G (ang. “3G sunset”) powodują gwałtowny spadek czasu spędzonego na 3G w 2024 r., ponieważ polscy operatorzy reorganizują widmo dla 4G (ang. “refarming”), ale ma to ogromny wpływ na dostępność usług w miejscach mniej zurbanizowanych. Podczas gdy T-Mobile pozostał jedynym polskim operatorem, który w pełni zakończył proces wygaszania sieci 3G do pierwszego kwartału 2025 r., zarówno Orange, jak i Play czynią obecnie znaczne postępy w zakresie refarmingu widma 3G 900 MHz i 2100 MHz na potrzeby 4G. Czas spędzony na 3G spadł poniżej 3% dla obu operatorów do końca 2024 roku. Natomiast abonenci Plusa nadal spędzali znacznie więcej czasu w sieci 3G – 13,41% na koniec 2024 roku.

W ciągu ostatniego roku polscy operatorzy byli jednak zamknięci w intensywnym wyścigu, aby dogonić swoich regionalnych kolegów we wdrażaniu 5G, napędzanym przez rygorystyczne obowiązki w zakresie zasięgu nałożone przez polskiego regulatora telekomunikacyjnego (UKE), falę wsparcia finansowego z Brukseli i rosnące dążenie do konkurowania o większy udział w poszerzającym się segmencie rynku premium w kraju, w którym wydajność sieci stała się kluczowym wyróżnikiem konkurencyjnym.

Polski rynek telefonii komórkowej jest dziś zdominowany aktywnością wdrożeniową, stąd operatorzy zwiększają wydatki kapitałowe do najwyższych poziomów od lat, aby wyposażyć tysiące stacji bazowych w widmo średniego pasma, przyspieszyć wyłączanie sieci 3G i położyć podwaliny pod uruchomienie samodzielnej sieci 5G (SA) w nadchodzących latach. Taką falę aktywności można zwłaszcza zauważyć po zakończeniu aukcji 700/800 MHz pod koniec marca tego roku, w której wszyscy polscy operatorzy po raz pierwszy zabezpieczyli widmo 5G w niskim paśmie – torując sobie drogę do poprawy zasięgu 5G na obszarach wiejskich i głęboko wewnątrz budynków (ang. “deep in-building”) w miastach oraz uzupełniając krajowe plany udostępniania widma 5G.

Podczas gdy wydatki kapitałowe na 5G spowolniły w dużej części Europy, Polska doświadcza inną dynamikę ze względu na późne aukcje na częstotliwości

Polska znacznie spóźniła się z udostępnieniem dedykowanych częstotliwości 5G w “pionierskich” pasmach zidentyfikowanych przez Komisję Europejską jako krytyczne dla terminowej komercjalizacji i wdrożenia 5G w państwach członkowskich UE. Krajowa aukcja częstotliwości pasma środkowego (3,6 GHz), początkowo planowana na połowę 2020 r., była wielokrotnie opóźniona – o ponad trzy lata – z powodu pandemii i przedłużającego się procesu legislacyjnego w zakresie bezpieczeństwa.

Te opóźnienia w dostępności częstotliwości przyczyniły się do tego, że Polska odbiega od reszty Europy zarówno w wymiarze ekonomicznym, jak i technicznym wdrażania 5G. Do niedawna polscy operatorzy komórkowi wykazywali niższą kapitałochłonność (inwestowali mniejszą część swoich przychodów) w porównaniu do innych europejskich operatorów. Większość ich wydatków przeznaczono na modernizację 4G i przygotowanie do wyłączenia 3G, zamiast budować nową warstwę pojemności 5G w średnim paśmie lub rozszerzać zasięg 5G przy użyciu niskich częstotliwości (700 MHz).

Rosnące nakłady Orange na sieć mobilną odzwierciedlają rozwój sieci 5G
Analiza rachunków Orange Polska | 2020–2024

Analiza danych finansowych opublikowanych przez Orange, największego operatora komórkowego w Polsce pod względem liczby abonentów, potwierdza, że era niższej kapitałochłonności (w porównaniu z innymi krajami w Europie) dobiegła końca. Niedawne aukcje częstotliwości wywołały nowy cykl inwestycyjny, a Orange podwoił wydatki na sieć mobilną w ciągu ostatnich trzech lat. Play również gwałtownie zwiększył swoje inwestycje, jego francuska spółka dominująca Iliad poinformowała w zeszłym roku o zainwestowaniu rekordowych kwot w infrastrukturę mobilną Play.

Udział Play w nakładach inwestycyjnych Grupy Iliad gwałtownie rośnie wraz z przyspieszeniem rozbudowy sieci 5G
Analiza rachunków Grupy Iliad | 2020–2024

Tymczasem od strony technicznej opóźnienie aukcji częstotliwości 5G w Polsce oznaczało, że trzech z czterech operatorów w kraju było zmuszonych w dużym stopniu polegać na dynamicznym współdzieleniu widma (ang. “Dynamic Spectrum Sharing” – DSS) – technologii, która pozwala 4G i 5G działać w tym samym paśmie i “dynamicznie” dostosowywać się do zapotrzebowania na pojemność danej technologii – w celu zapewnienia wczesnego zasięgu 5G w paśmie 2100 MHz w oczekiwaniu na aukcje częstotliwości. Strategia ta spowodowała, że początkowa wydajność 5G w Polsce bardziej przypominała typową dla sieci 4G, ponieważ wdrożenia DSS są zwykle oparte na nośnej 10 MHz, w której część pojemności jest nadal zarezerwowana dla sygnałów 4G, co powoduje, że prędkości 5G z DSS są o około 15-25% niższe niż gdyby pasmo było przeznaczone wyłącznie dla 5G.

Ograniczenia wykorzystania DSS do zapewnienia “doświadczenia 5G” zostały zilustrowane przewagą prędkości utrzymywaną przez Plusa na wcześniejszym etapie wdrażania 5G. Co ważne, Plus był jedynym polskim operatorem, który nie polegał na DSS i zamiast tego przeznaczył pełną nośną 40 MHz w paśmie 2600 MHz (TDD) na 5G, zanim na początku ubiegłego roku częstotliwości średniego pasma stały się dostępne. Przed uruchomieniem pasma 3,5 GHz, gdy pozostali operatorzy byli nadal w pełni zależni od DSS w zakresie zasięgu 5G, średnia prędkość pobierania 5G Plusa wynosząca 133,34 Mb/s była aż o 77% wyższa niż w T-Mobile, 81% wyższa niż w Orange i 92% wyższa niż w Play.

Intensywne wdrażanie średniego pasma podnosi regionalną konkurencyjność Polski w zakresie 5G i zmienia dynamikę operatorów

Polscy operatorzy w rekordowym czasie przechodzą od zakupu częstotliwości w średnim paśmie do masowego wdrożenia komercyjnego

Stłumiony popyt na częstotliwości średniego pasma w Polsce był widoczny, gdy operatorzy komórkowi, tacy jak Orange, T-Mobile i Play, uruchomili usługi komercyjne zaledwie trzy miesiące po nabyciu częstotliwości średniego pasma, szybko przechodząc od aukcji w październiku 2023 r. do komercyjnego uruchomienia do stycznia 2024 roku. T-Mobile poinformował, że jego średniopasmowa sieć 5G obejmowała już ponad 25% populacji Polski do kwietnia 2024 r., z ponad 2100 aktywnymi stacjami bazowymi, podczas gdy Orange ogłosił, że osiągnął 40% zasięgu do połowy czerwca.

To tempo wdrażania jest wyjątkowe jak na standardy europejskie i wskazuje na zwiększone tempo wdrażania możliwe w późniejszym okresie cyklu technologicznego 5G. Dla porównania, hiszpańska Telefónica (Movistar) potrzebowała około sześciu miesięcy, aby osiągnąć pierwsze 1000 stacji bazowych w średnim paśmie, a niemieccy operatorzy potrzebowali około dziewięciu miesięcy, aby osiągnąć ten sam kamień milowy.

Zasoby częstotliwości Plus w paśmie 2600 MHz TDD zapewniają mu zdecydowaną przewagę przepustowości

Każdy z operatorów zabezpieczył ciągły blok częstotliwości o szerokości 100 MHz w paśmie 3,5 GHz, który jest powszechnie wykorzystywany. Jednak Plus był znacznie wolniejszy w komercjalizacji tej alokacji na dużą skalę. Wcześniejsza strategia Plusa polegająca na wdrażaniu 5G w dedykowanym paśmie 2600 MHz (zamiast polegać na DSS), a później także na wykorzystaniu pasma 2100 MHz, dała mu większą elastyczność w opóźnianiu szerokiego wdrożenia średniego pasma, ponieważ wcześniej cieszył się znaczną przewagą prędkości 5G nad konkurentami, podczas gdy byli oni nadal silnie uzależnieni od wdrożeń DSS.

Wdrożenie średniego pasma zmienia rankingi wydajności 5G wśród polskich operatorów

Masowe wdrożenie nowej warstwy pojemności przez pozostałych trzech operatorów zdecydowanie zmieniło dynamikę wydajności 5G na polskim rynku i zmniejszyło przewagę Plusa. W ciągu jednego roku, między pierwszym kwartałem 2024 r. a pierwszym kwartałem 2025 r., Plus przesunął się z lidera rynku pod względem mediany prędkości pobierania 5G do jednego z wolniejszych, stając się jedynym polskim operatorem, który odnotował spadek prędkości 5G rok do roku, o 10%, co wskazuje na rosnące ograniczenia jego strategii 2600 MHz.

Orange i T-Mobile zyskują przewagę w wydajności 5G dzięki wdrożeniu pasma średniego
Speedtest Intelligence® | I kwartał 2023 – I kwartał 2025

Z kolei wdrożenie średniego pasma zwiększyło wydajność na pozostałej części rynku, a mediana prędkości 5G wzrosła aż o 72% w Play, 86% w T-Mobile i 90% w Orange między 1. kwartałem 2024 r. a 1. kwartałem 2025 r. Podczas gdy Orange był liderem polskiego rynku w pierwszym kwartale ze średnią prędkością pobierania 5G wynoszącą 222,11 Mb/s, przewaga operatora znacznie się zmniejszyła wraz z postępem budowy średniego pasma T-Mobile, przy czym T-Mobile odnotowuje obecnie medianę prędkości pobierania 5G na poziomie 201,76 Mb/s, znacznie wyprzedzając odpowiednio trzeciego i czwartego Play (122,64 Mb/s) i Plusa (116,76 Mb/s).

Przewaga Plusa w spójności 5G maleje, gdy przewaga pasma 2600 MHz ustępuje wraz z wdrożeniem pasma średniego
Speedtest Intelligence® | I kwartał 2023 – I kwartał 2025

Pomimo utraty pozycji lidera pod względem mediany prędkości pobierania 5G, Plus nadal prowadzi w 10. percentylu (29,44 Mb/s w 1. kwartale 2025 r.), co oznacza, że abonenci w obszarach o najniższych wynikach nadal cieszą się stosunkowo lepszymi prędkościami niż abonenci konkurencyjnych sieci. Przewaga ta jest prawdopodobnie związana z mniejszą zależnością Plusa od DSS. Jednak T-Mobile (24,48 Mb/s) i Orange (21,88 Mb/s) szybko zmniejszają lukę, a ich 10-procentowe prędkości 5G zbliżają się teraz do Plusa. Spójność sieci 5G Plusa, mierzona jako odsetek próbek Speedtest spełniających minimalny próg pobierania i wysyłania 25/3 Mbps, również spadła w ciągu ostatniego roku, chociaż pozostaje liderem rynku.

Tymczasem pod względem wydajności wysyłania, sieć 5G Play była liderem na rynku w pierwszym kwartale 2025 r., odnotowując medianę prędkości 19,33 Mb/s, a następnie Orange (18,99 Mb/s), T-Mobile (17,32 Mb/s) i Plus (14,96 Mb/s).

W przeciwieństwie do znacznych wzrostów prędkości pobierania, jak dotąd istnieją ograniczone dowody na to, że wdrożenie średniego pasma znacznie poprawiło wydajność wysyłania, przy czym mediana prędkości wysyłania była o około 6% niższa w pierwszym kwartale 2025 r. w porównaniu z tym samym kwartałem ubiegłego roku. Rozbieżność ta wynika przede wszystkim z faktu, że wszyscy czterej operatorzy nadal wdrażają 5G w trybie non-standalone (NSA), nadal wymagają od urządzeń technologii 4G do obsługi ruchu wysyłania i warstwy sygnałowej. W związku z tym nowo dostępne widmo 3,5 GHz zwiększa przepustowość łącza w dół, ale pozostawia zatłoczoną ścieżkę łącza 4G w górę bez zmian.

Play zyskuje przewagę w wydajności wysyłania danych w sieci 5G
Speedtest Intelligence® | I kwartał 2023 – I kwartał 2025

Inwestycje operatorów we wdrażanie nowej warstwy przepustowości 5G zbiegły się w czasie z szerszymi działaniami w zakresie modernizacji sieci RAN, przekładając się na lepszą jakość usług doświadczanych przez użytkowników w kluczowych zastosowaniach, takich jak wideo streaming i przeglądanie stron internetowych. Na przykład mediana czasu ładowania strony internetowej w sieci T-Mobile poprawiła się o około 4% między 3. kwartałem 2024 r. a 1. kwartałem 2025 r., co stawia ją w czołówce pod tym względem. Tymczasem Orange był liderem pod względem wskaźników wideo, takich jak czas rozpoczęcia, rozdzielczość i nieprzerwane odtwarzanie w ostatnim kwartale.

5G napędza poprawę jakości doświadczeń (QoE) w zastosowaniach takich jak przeglądanie stron internetowych
Speedtest Intelligence® | I kwartał 2025

Inwestycje kapitałowe zwiększają zasięg 5G, ale przepaść cyfrowa między wsią a miastem w Polsce utrzymuje się

Podczas gdy inwestycje w DSS i wdrożenie średniego pasma umożliwiły polskim operatorom poczynienie znaczących postępów w zakresie dostępności 5G, która wzrosła w skali kraju z 28,5% w I kwartale 2024 r. do 43,1% w I kwartale 2025 r., regionalne różnice w zasięgu nadal są cechą charakterystyczną sieci mobilnej w Polsce.

Operatorzy nadali priorytet wdrożeniom 5G w najbogatszych i najbardziej zaludnionych częściach Polski, gdzie światłowody są mocno rozwinięte, w tym w województwach mazowieckim (Warszawa) i pomorskim (Trójmiasto). W tych województwach dostępność 5G osiągnęła ponad 40% pod koniec ubiegłego roku i przyczyniła się do osiągnięcia znacznie wyższych średnich prędkości pobierania niż średnia krajowa.

Dostępność 5G pozostaje wysoce zróżnicowana w Polsce poza obszarami zurbanizowanymi
Speedtest Intelligence® | Dostępność 5G (%) w IV kw. 2024

Natomiast województwa przygraniczne na południu i zachodzie kraju nadal doświadczają znacznie niższych poziomów dostępności 5G. Województwo lubuskie miało najniższą dostępność (23,6% na koniec ubiegłego roku), gdzie występuje mniejsza gęstość zaludnienia i niższe wydatki abonentów, co zmniejsza zachęty komercyjne operatorów do powszechnych inwestycji w 5G. Tendencja ta doprowadziła do powstania znacznej luki prędkości między województwami, a abonenci mobilni w Lubuskiem również doświadczają najniższej mediany prędkości pobierania (59,97 Mb/s) w Polsce, prawie 33% poniżej wiodącego województwa mazowieckiego.

Prędkości pobierania w sieciach mobilnych są niższe na mniej zurbanizowanych obszarach Polski
Speedtest Intelligence® | Mediana prędkości pobierania (Mbps) w IV kw. 2024

Wdrożenie średniego pasma poprawia konkurencyjność mobilną Polski, ale spójność 5G nadal ustępuje regionalnym konkurentom

Z punktu widzenia konkurencyjności regionalnej, intensywne wdrożenia średniego pasma skutecznie przełamały cykl słabej wydajności sieci mobilnej w Polsce, a mediana prędkości pobierania 5G wzrosła średnio o ponad 50% do 160,30 Mb/s między 1. kwartałem 2024 r. a 1. kwartałem 2025 r. Dzięki temu Polska po raz pierwszy wyprzedziła Czechy, Rumunię i Słowację pod względem prędkości pobierania 5G.

Wdrożenia pasma średniego napędzają regionalną konkurencyjność Polski
Speedtest Intelligence® | 2020–2025

Pomimo postępów Polski we wdrażaniu 5G w średnim paśmie, utrzymujące się skutki polegania na DSS i ograniczonej różnorodności widma 5G aż do niedawnej aukcji 700/800 MHz oznaczają, że Polska nadal pozostaje w tyle za swoimi regionalnymi rówieśnikami pod względem spójności sieci 5G. W pierwszym kwartale 2025 r. 82% próbek Speedtest w Polsce spełniło minimalny próg wydajności 5G dla spójnego doświadczenia mobilnego, w porównaniu do 86% na Węgrzech, 89% w Rumunii i 93% w Bułgarii.

Nowo pozyskana różnorodność częstotliwości 5G daje polskim operatorom potężne narzędzie do stymulowania wzrostu ARPU

Wcześniejsza zależność Polski od DSS, wynikająca z ograniczonej różnorodności widma 5G, prawdopodobnie przyczyniła się do wolniejszego wzrostu średniego przychodu na użytkownika (ARPU) w porównaniu z sąsiednimi krajami na przestrzeni ostatnich lat. Polscy operatorzy początkowo wprowadzili taryfy z “5G bez dodatkowych kosztów” dodane do istniejących pakietów 4G, utrzymując ceny na stałym poziomie w celu obrony udziału w rynku (a tym samym utrzymując obniżone poziomy ARPU w porównaniu do regionalnych konkurentów). W połączeniu z zewnętrznym szokiem makroekonomicznym wywołanym znacznie wyższymi cenami energii, stagnacja poziomów ARPU stworzyła trudne warunki operacyjne na polskim rynku i wpłynęła na rentowność operatorów.

Intensywna konkurencja cenowa spowodowała erozję przychodów w Polsce w pierwszej połowie cyklu 5G
Analiza danych GSMA Intelligence | Zmiana procentowa ARPU w usługach mobilnych (I kw. 2020 vs I kw. 2023)

Z kolei na sąsiednich rynkach operatorzy byli w stanie wykorzystać wdrożenie częstotliwości w średnim paśmie zarówno jako korzyści techniczne, jak i marketingowe, przenosząc swoje strategie z konkurencji cenowej na zróżnicowanie oparte na usługach. Pozwoliło im to skuteczniej sprzedawać wyższe poziomy prędkości lub zarabiać na konkretnych rozwiązaniach, takich jak stały dostęp bezprzewodowy (FWA), dla którego działania wdrożone 5G w średnim paśmie nadaje się idealnie.

T-Mobile i Play wyprzedziły konkurentów w tempie wzrostu udziału subskrypcji w ostatnich latach
Analiza danych rynkowych UKE | 2019–2023

Podobnie, opóźniony termin polskiej aukcji 5G dla średniego pasma prawdopodobnie osłabił czynniki po stronie podaży, będące kluczowymi dla napędzania wzrostu konsumpcji danych z sieci mobilnych. W okresie od I kwartału 2020 r. do IV kwartału 2024 r. wolumen ruchu w sąsiedniej Bułgarii po raz pierwszy zrównał się z wolumenem w Polsce, wzrastając 4,8-krotnie w porównaniu do 2,6-krotnego wzrostu w Polsce.

W międzyczasie bułgarscy operatorzy wcześnie wykorzystali dostępność widma w średnim paśmie, aby agresywnie promować konkurencyjne rozwiązania FWA (główny czynnik napędzający ruch mobilny na rynkach rozwiniętych) i wprowadzić tanie taryfy nieograniczonej transmisji danych z mniejszymi ograniczeniami użytkowania.

Polska utrzymuje regionalne prowadzenie w wolumenach danych mobilnych, ale Bułgaria szybko nadrabia
Analiza danych GSMA Intelligence | 2020–2024

Od tego czasu polscy operatorzy starali się powtórzyć sukces Bułgarii, wprowadzając odrębny marketing dla swoich wdrożeń 5G w średnim paśmie, aby odróżnić nowsze wdrożenia 5G w średnim paśmie od wcześniejszych. T-Mobile oparł się na marce “5G Bardziej”, podczas gdy Plus użył sloganu marketingowego “5G Ultra”, aby wskazać dodatkowy wzrost wydajności odblokowany przez ich nowe sieci 5G w lokalizacjach, w których wdrożono dedykowane częstotliwości średniego pasma. Strategia ta stała się częścią szerszej zmiany na rynku, w której wszyscy operatorzy odchodzą od hiper-koncentracji opierającej się na konkurencji cenowej w kierunku strategii cenowych “więcej za więcej”, wspierając poprawę rentowności i ponowny wzrost ARPU.

Polska przoduje w regionalnym wzroście ARPU od momentu rozpoczęcia wdrożeń średniego pasma 5G
Analiza danych GSMA Intelligence | Zmiana procentowa ARPU w usługach mobilnych (I kw. 2023 vs I kw. 2025)

Aktywacja niskiego pasma i postępy w budowie sieci mają na celu wzmocnienie zysków 5G w średnim paśmie

W związku z tym, że polski regulator telekomunikacyjny, UKE, ustanowił jeden z najbardziej ambitnych zobowiązań dotyczących zasięgu w Europie dla ostatnich aukcji częstotliwości średniego i niskiego pasma, operatorzy raczej nie opóźnią komercyjnych wdrożeń w nowo nabytych pasmach 700 i 800 MHz. Oczekuje się, że wdrożenia te rozpoczną się w przyszłym miesiącu i będą miały kluczowe znaczenie dla ustanowienia krajowej warstwy zasięgu 5G, która znacznie poprawi pokrycie ciężko dostępnych miejsc wewnątrz budynków w miastach i zdalnych obszarów wiejskich. Rozszerzony zasięg będzie również wspierał szersze wdrażanie usług głosowych przez LTE (VoLTE), przyspieszając schyłek 3G i uwalniając dodatkowe widmo w paśmie 900 MHz.

Wkrótce powrócimy do tego tematu, aby ocenić, jak polscy operatorzy radzą sobie z wdrażaniem nowych częstotliwości niskopasmowych i jak skutecznie uzupełniają trwający proces wygaszania 3G.

Ookla retains ownership of this article including all of the intellectual property rights, data, content graphs and analysis. This article may not be quoted, reproduced, distributed or published for any commercial purpose without prior consent. Members of the press and others using the findings in this article for non-commercial purposes are welcome to publicly share and link to report information with attribution to Ookla.

| November 17, 2025

WISP Report Card: Data Shows Most Fail FCC’s 100/20 Mbps Benchmark

Wireless ISPs face a growing threat from LEO satellite providers like Starlink that can reach rural users with faster download speeds.

There are around 2,000 U.S. wireless internet service providers (WISPs) and about nine million Americans get their internet service from these companies, according to the Wireless ISP Association (WISPA).  Many of these WISPs are very small and provide service to just a few hundred customers. 

WISPs have become more prevalent over the past few years largely due to the introduction of vendor equipment that makes it possible to more cost-effectively deliver better coverage using unlicensed spectrum and commercial off-the-shelf hardware.

WISPs deliver their services using fixed wireless access (FWA) but they tend to be smaller and focused on certain markets such as rural areas or apartment complexes than the large telcos like Verizon, T-Mobile or AT&T, which also use FWA technology to deliver broadband services across the country. However, unlike the WISPs, these operators don’t consider broadband to be their primary business. 

Using Ookla’s Speedtest Intelligence® data, we examined the performance of eight of the larger U.S. WISPs—Etheric Networks, GeoLinks, NextLink Internet, Resound Networks, Rise Broadband, Starry, Unwired Broadband, and Wisper Internet — from Q1 2021 through Q2 2025. For those providers that offer both FWA and fiber, we categorized users with upload speeds under 100 Mbps as FWA customers to distinguish them from fiber users. While all eight of the WISPs that we monitored improved their median download speeds during that time period, their performance varies greatly. 

Key Takeaways

  • Starry, which is being acquired by Verizon, delivered the highest median download speeds (202.25 Mbps in Q2 2025) of all eight U.S. WISPs that we studied. 
  • GeoLinks delivered the slowest median download speeds (22.74 Mbps in Q2 2025) of the WISPs we reviewed. Its users in the 75th percentile (those in the upper end of the typical speed range) experienced download speeds of 56.58 Mbps in Q2 2025.  We measured GeoLinks customers in its California markets where the company currently uses an older platform on 5 GHz spectrum.
  • Because of Starry’s faster speeds, the WISP was able to deliver the FCC’s minimum requirement for broadband speeds of 100/20 Mbps to 66.88% of Speedtest users in Q2 2025. 
  • WISPs face a growing threat from low-Earth orbit (LEO) satellite providers like Starlink, which can reach rural users with download speeds that are often faster than WISPs. 
  • To continue to compete  in the broadband space, WISPs need to find ways to secure more spectrum to avoid network congestion and interference.

The Many Flavors of WISPs

The performance of WISPs in the U.S. is under scrutiny right now because of recent changes that the National Telecommunications and Information Administration (NTIA) made to the Broadband Equity and Deployment (BEAD)  program. In June 2025 the NTIA revamped BEAD to provide a technology-neutral approach and prioritize cost-per-location.This means that instead of favoring fiber, other technologies such as low-Earth orbit (LEO) satellite and FWA can compete with fiber for BEAD funding. The revisions also include a rule to ensure that bids go to the lowest-cost bidders.

States revised their BEAD applications and re-submitted them using the new guidance. Early indications are that many states plan to use FWA for at least a portion of their BEAD eligible locations. Connected Nation, a non-profit that monitors the digital divide, found that states have awarded 11.7% of eligible locations to FWA providers, and many of those FWA providers are categorized as wireless ISPs (WISPs). 

We analyzed the performance of eight of the largest U.S. WISPs over several quarters from Q1 2021 until Q2 2025. However, it’s important to note that all of these companies vary greatly in terms of their spectrum holdings, their business models, their coverage areas, and their vendor equipment, which drives a large variance in performance outcomes. 

Nevertheless, it’s notable that all eight of the WISPs we monitored improved their median download speeds during that time period. They also improved their median upload speeds, but to a much lesser extent. 

Starry outpaced all the others and recorded the highest median download speeds. In Q2 2025 Starry’s median download speed was 202.25 Mbps, which is more than double that of the Resound Networks with a median download speed of 99.41 Mbps in Q2 2025. Starry also was nearly nine times higher in median download speeds than the slowest of the eight WISPs, GeoLinks, which had a median download speed of just 22.74 Mbps in Q2 2025. 

A Comparison of WISPs Median Download and Upload Speeds
Q1 2021 through Q2 2025
A comparison of WISPs median download and upload speed over time.

The eight WISPs and their coverage areas

NameStates where WISP operatesSpectrum used
Etheric NetworksCalifornia2.4 MHz, 5.8 GHz unlicensed and 28 GHz licensed
GeoLinksCalifornia, Arizona, and Nevadaunlicensed 5 GHz, LMDS 29-31 GHz spectrum, unlicensed 59-71 GHz spectrum
NextLinkTexas, Oklahoma, Illinois, Iowa, Kansas, and Nebraska2.4 MHz, 5 GHz, and 6 GHz
Resound Networks

Texas, New Mexico, Arizona, Colorado, Oklahoma, Arkansas, Kansas6 GHz unlicensed, 5 GHz unlicensed, and 3.65 GHz licensed
Rise Broadband16 states including Colorado, Nebraska, Illinois, Iowa, Texas and Southern Wisconsin unlicensed 5 GHz, unlicensed 3.65 GHz, licensed 2.5 GHz, and some TV white space spectrum at 470-698 MHz
Starry BroadbandMajor cities such as Boston, Denver, Los Angeles, New York City and Washington, DC37 GHz licensed, 24 GHz licensed, some 5 GHz unlicensed
Unwired BroadbandCalifornia unlicensed 6 GHz
Wisper WirelessOklahoma, Kansas, Indiana, and Illinois 3.5 GHz (CBRS), 5.1 GHz, and maybe 6 GHz

Most WISPs struggle to deliver the FCC’s minimum broadband speeds to their customers 

All of the eight WISPs use a different configuration of spectrum licenses. Most are reliant upon some combination of low-, mid-, or high-band licensed and unlicensed spectrum. In addition, many have deployed fiber either as an alternative to their FWA service or to use to carry backhaul or middle-mile traffic. 

While using unlicensed spectrum means that a WISP can launch services quickly without having to purchase costly spectrum licenses, it also means that congestion and interference can result in the WISP having to carefully manage demand for their services. 

Using Speedtest data collected in Q2 2025 we compared the median download and upload speeds of the eight WISPs to determine what percentage of their Speedtest users were receiving the FCC’s minimum standard for fixed broadband speeds (100 Mbps downstream/20 Mbps upstream).   

Starry, which has mmWave spectrum licenses and uses proprietary equipment, is able to provide the FCC’s minimum standard for broadband to the highest percentage of users at 66.9%.  In contrast Rise Broadband, which primarily operates with unlicensed spectrum in the 5 GHz band and in the 3.55 GHz to 3.7 GHz bands (CBRS), but also uses some licensed spectrum in the 2.5 GHz band, is able to provide the FCC’s minimum requirement for broadband to just 6.7% of its users. 

WISPs% of Speedtest users achieving wireless broadband speeds of 100/20 Mbps
Starry66.9%
Resound Networks41.5%
Wisper Internet 26.0%
NextLink 24.4%
Unwired 21.8%
GeoLinks8.7%
Etheric 8.4%
Rise Broadband 6.7%

mmWave’s bigger pipe doesn’t always equal faster speeds

Starry, GeoLinks and Etheric all use some combination of high-band spectrum to deliver their FWA services. The benefits of this spectrum is it can deliver faster speeds and carry bandwidth-intensive applications. But it also requires line-of-sight or near-line-of-sight to work because of potential interference from buildings, trees, and even rain. 

Among the three providers that use mmWave spectrum we saw dramatic differences with Starry significantly outperforming GeoLinks and Etheric, which suggest that Starry has a greater penetration of mmWave spectrum among its customer base that is benefitting the WISP. 

Starry

Starry uses a proprietary technology with base stations that cover a radius of about one mile and its system operates on shared spectrum licenses in the 37.1, 37.3 and 37.5 GHz mmWave bands. It also acquired 104 licenses in the 24 GHz band that cover 51 partial economic areas. 

The company targets large apartment buildings with its service. Its setup consists of a rooftop base station that broadcasts a signal to multiple building-mounted receivers, allowing a single base station to serve dozens of buildings. Although it uses proprietary equipment it’s based upon modified 802.11ac/ax standards that takes advantage of the Wi-Fi chipset ecosystem.

The company, which is currently being acquired by Verizon, offers service to about 100,000 subscribers in apartment buildings in five markets; Boston, Denver, Los Angeles, New York/New Jersey, and Washington, D.C./Virginia.

Starry offers a variety of rate plans: $30 per month for up to 200 Mbps; $55 per month for up to 500 Mbps; and $75 per month for up to 1 Gbps. 

Ookla’s Speedtest® data shows that Starry has nearly doubled its median download speeds in its markets from 102.74 Mbps in Q1 2022 to 202.25 Mbps in Q2 2025. The company’s upload speed also increased, but not as dramatically from 52.29 Mbps in Q1 2022 to 54.34 Mbps in Q2 2025.  The company saw the biggest increase in speeds from Q1 2024 to Q2 2025, which is likely due to some network upgrades, including the deployment of the 2.0 version of its Comet receiver.  Starry said the upgrades would expand its coverage range as well as provide better spectral efficiency.  

Starry's Median Download, 75th Percentile Download, and Median Upload Speeds
Q1 2021 through Q2 2025
Starry's median download, median upload and 75th percentile speeds over time.

GeoLinks uses local multipoint distribution services (LMDS) spectrum that it acquired from Verizon in 2021 as well as some unlicensed 5 GHz and unlicensed 59-61 GHz spectrum. Those 208 LMDS licenses are in the 29/31 GHz bands and cover several markets. However, GeoLinks currently offers service primarily in California and has a few deployments in Arizona and Nevada, but our Speedtest data samples were all collected from the company’s California deployment where it is currently using the unlicensed 5 GHz spectrum and an older platform.. 

The company recently tested Intracom Telecom’s point-to-multipoint equipment to demonstrate multi-gigabit FWA using its 29/31GHz mmWave spectrum. In addition, it has indicated that it is interested in leasing its spectrum to other enterprises and operators that can then use its spectrum holdings to develop their own FWA services. 

GeoLinks offers a variety of price plans: $25.99 per month for speeds of 10/10 Mbps; $38.99 per month for 25/10 Mbps; $45.99 per month for 30/30 Mbps; and $69.99 per month for speeds of 100/25 Mbps. The company’s web site indicates that the $45.99 per month plan that delivers 30/30 Mbps is the most popular plan with its customers. 

Speedtest data shows Geolinks delivering median download speeds of just 22.74 Mbps in Q2 2025 with 75th percentile download speeds of 56.58 Mbps. Its users experience median upload speeds of 19.82 Mbps in Q2 2025.  

GeoLink's Median Download, 75th Percentile Download, and Median Upload Speeds
Q1 2021 through Q2 2025
GeoLink's median download, median upload and 75th percentile speeds over time.

Etheric Networks

Etheric Networks provides FWA service to the California Bay Area. The company has a fiber ring stretching from San Francisco to Monterey, California that connects its FWA towers and eight data centers. Etheric uses a mix of spectrum including unlicensed 2.4 GHz and 5.8 GHz spectrum. However, in 2024 Etheric partnered with BroadbandOne to leverage BroadbandOne’s 28 GHz mmWave spectrum. The company said this partnership will allow it to enhance its connectivity and serve more rural and agricultural areas. 

The company offers three residential price plans: $79 per month for speeds up to 100 Mbps; $99 per month for speeds up to 250 Mbps and $169 per month for 1 Gbps speeds. 

Speedtest data shows Etheric has nearly doubled its median download speeds from 21.34 Mbps in Q1 2021 to 41.09 Mbps in Q2 2025. Its users in the 75th percentile (those in the upper end of the typical speed range) saw speeds of 65.45 Mbps in Q2 2025.The company’s median upload speeds also increased over time from 13.6 Mbps in Q1 2021 to 29.5 Mbps in Q2 2025. 

Etheric Networks' Median Download, 75th Percentile Download, and Median Upload Speeds
Q1 2021 through Q2 2025
Etheric Networks' median download, median upload and 75th percentile speeds over time.

WISPs make the most of mid-band with CBRS licenses

Many WISPs take advantage of the mid-band CBRS spectrum, which is a 150 MHz shared spectrum in the 3.5 GHz to 3.7 GHz band that allows for flexible use by three different groups that are managed by a Spectrum Access System (SAS). The SAS can dynamically grant access to different users. The band is shared by these three parties: incumbent users such as the U.S. Navy that have priority access to the band; licensed users with Priority Access Licenses (PAL) that have exclusive use of a portion of the band in a specific geographic location; and the General Authorized Access (GAA) group who can access the spectrum but have no protection from interference from the other two groups.  

Several of the WISPs we analyzed deploy their services in the CBRS spectrum and primarily use the GAA portion of the band. Others have acquired CBRS PAL and some use a combination of both. Some WISPS also use unlicensed bands such as 5 GHz. 

Nextlink spent $28.4 million in FCC’s Auction 105 to purchase over 1,100 CBRS PAL licenses covering 491 counties in eleven states including Texas, Oklahoma, Kansas, Nebraska, Iowa, Minnesota, Wisconsin, Indiana, Wyoming, and Missouri. The company uses that spectrum to deliver its FWA service to its more than 100,000 subscribers (as of August 2025).  NextLink also has deployed fiber to more than 100,000 locations and has 20,000 fiber customers. 

Nextlink secured Connect America Fund II funding and participated in the FCC’s Rural Digital Opportunity Fund so much of its FWA expansion has been driven by those commitments. In August Nextlink said it has completed five of the six states as part of its CAF II funding and is halfway through its RDOF buildout. 

The company offers a variety of FWA plans: The Next50, which offers up to 50 Mbps speeds for $30 per month; the Next100 that offers speeds up to 100 Mbps for $40 per month; The Next300 that offers speeds up to 300 Mbps for $60 per month; and the Next500 that offers speeds up to 500 Mbps for $75 per month. 

Speedtest data shows NextLink has more than tripled its median download speeds from 19.45 Mbps in Q1 2021 to 68.47 Mbps in Q2 2025.  The WISP also increased its median upload speeds significantly from 4.72 Mbps in Q1 2021 to 18.26 Mbps in Q2 2025. NextLink users in the 75th percentile (those in the upper end of the typical speed range) get much higher speeds of 122.88 Mbps in Q2 2025. 

NextLink's Median Download, 75th Percentile Download, and Median Upload Speeds
Q1 2021 through Q2 2025
NextLink's median download, median upload and 75th percentile speeds over time.

Resound Networks

Resound Networks provides FWA service in Texas, New Mexico, Arkansas, Arizona and Oklahoma and uses Tarana Wireless gear in the unlicensed 5 GHz and 6 GHz spectrum bands. It also offers fiber service in some locations and is planning to expand its fiber footprint. Like many WISPs, Resound is focused specifically on rural communities that have historically been overlooked by larger ISPs. In 2022 the company was awarded $303 million through the FCC’s RDOF program to deliver FWA and fiber to 214,000 rural locations. 

Resound offers both residential and enterprise rate plans. Its residential plans start at 75 Mbps for $55 per month and go up to 1 Gbps for $130 per month. 

The company’s customers experienced a steady increase in their download and upload speeds from mid-2023 until Q2 2025 from a median download speed of 38.94 Mbps in Q3 2023 to 99.41 Mbps in Q2 2025.  Its users in the 75th percentile (those in the upper end of the typical speed range) experienced an even greater climb in download speeds from 62.99 Mbps in Q3 2023 to 190.76 Mbps in Q2 2025.  During this time period Resound was expanding its network. 

Resound Network's Median Download, 75th Percentile Download, and Median Upload Speeds
Q1 2021 through Q2 2025
Resound's median download, median upload and 75th percentile speeds over time.

Rise Broadband

Rise Broadband claims to be the country’s largest WISP with around 200,000 customers. It may also be one of the longest living WISPs because it dates back to 2006 when it started as JAB Broadband and its goal was to consolidate many of the country’s smaller WISPs to create one big WISP with a large footprint. 

Today Rise offers FWA service in16 states, mostly in the Midwest. Rise offers service primarily in rural areas and it uses a mix of unlicensed spectrum in the 5 GHz band and in the 3.55 GHz to 3.7 GHz bands (CBRS), but also uses some licensed spectrum in the 2.5 GHz band, to deliver its service. 

Like NextLink, the company is actively deploying fiber in addition to FWA. The company’s strategy is to deploy FWA initially to capture market share and then roll out fiber to the densest FWA coverage areas. 

Rise’s price plans start as low as $30 per month for 50 Mbps and reach up to 400 Mbps for $55 per month. 

Rise users logged median download speeds of 42.58 Mbps in Q2 2025, which is a significant jump from Q1 2021 when users experienced median download speeds of just 16.01 Mbps. Rise’s users  in the 75th percentile (those in the upper end of the typical speed range) were able to achieve download speeds of 65.97 Mbps in Q2 2025.  The company’s median upload speeds also increased from 4.05 Mbps in Q1 2021 to 18.38 Mbps Q2 2025. Rise saw a big jump in median upload speeds between Q2 2022 when users logged median upload speeds of 5.86 Mbps and Q3 2022 when users experienced median upload speeds of 13.68 Mbps. 

Rise Broadband's Median Download, 75th Percentile Download, and Median Upload Speeds
Q1 2021 through Q2 2025
Rise Broadband's median download, median upload and 75th percentile speeds over time.

Wisper Internet

Wisper Internet offers FWA in six midwestern states including Illinois, Missouri, Kansas, Oklahoma, Arkansas and Indiana. The company uses unlicensed spectrum in the 5 GHz, and a mix of unlicensed and licensed spectrum in the 2.5 GHz and 3.65 GHz bands.  Like NextLink and Rise, the company also has deployed fiber in a few select areas. 

Wisper offers a variety of rate plans including 25 Mbps for $70 per month; 50 Mbps for $75 per month; 100 Mbps for $80 per month; 200 Mbps for $110 per month and 400 Mbps for $140 per month. 

Similar to the other WISPs, Wisper’s median download speeds increased over time but it increased dramatically from Q3 2023 to Q2 2025 when its median download speeds increased from 33.74 Mbps to 52.90 Mbps. Likewise, the download speeds for users in the 75th percentile also increased, climbing from 55.12 Mbps in Q3 2023 to 107.90 Mbps in Q2 2025. This jump in speeds was likely due to  Wisper’s deployment of additional FWA gear from Tarana Wireless on 180 more towers in its footprint. 

Wisper Internet's Median Download, 75th Percentile Download, and Median Upload Speeds
Q1 2021 through Q2 2025
Wisper Internet's median download, median upload and 75th percentile speeds over time.

Unwired

Unwired Broadband provides FWA coverage in rural and underserved areas in central and northern California. The company said it has a network of more than 200 towers and a coverage area of about 17,000 square miles. Besides FWA, Unwired also provides some fiber service but It’s early in its deployment process. 

Unwired uses a combination of licensed and unlicensed spectrum to deliver its FWA service, including the licensed 2.5 GHz band and the unlicensed 6 GHz band. 

The company offers both business and residential FWA service and its pricing starts at $59.99 per month for 100 Mbps. 

Unwired users experienced increases in download and upload speeds over time but between Q3 2024 and Q4 2024 the jump was more dramatic. Median download speeds jumped from 27.22 Mbps in Q3 to 44.25 Mbps in Q4. Similarly median upload speeds increased from 9.7 Mbps in Q3 2024 to 15.9 Mbps in Q4. 

Unwired's Median Download, 75th Percentile Download, and Median Upload Speeds
Q1 2021 through Q2 2025
Unwired's median download, median upload and 75th percentile speeds over time.

WISPs’ performance is improving but competitive threats lurk 

Although the WISPs we studied are improving their networks and delivering better performance for their customers, the broadband market is rapidly changing. In the past many WISPs, particularly those in rural areas, faced little or no competition. But that’s no longer the case. 

As LEO satellite constellations such as Starlink become more powerful and more prevalent (Amazon’s Kuiper now has 153 satellites in orbit and is expected to launch late this year), WISPs will face growing competition from these companies. 

A recent Ookla report on Starlink found that Starlink’s network saw its median download speeds nearly double from 53.95 Mbps in Q3 2022 to 104.71 Mbps in Q1 2025, making its median download speeds on par or better than seven of the eight WISPs we reviewed (Starry was the only exception). With Starlink residential price plans starting around $80 per month, the company’s introductory price plan is a bit more expensive than some introductory price plans from WISPs but Starlink is aggressively promoting its services and offering large discounts on its equipment to entice new customers. 

To continue to play in the broadband space, WISPs need to try to secure more spectrum–licensed or unlicensed— to avoid network congestion and interference and also  invest in network upgrades so their services remain competitive. 

 To find out more about Speedtest Intelligence® data and insights, visit our website.  

Ookla retains ownership of this article including all of the intellectual property rights, data, content graphs and analysis. This article may not be quoted, reproduced, distributed or published for any commercial purpose without prior consent. Members of the press and others using the findings in this article for non-commercial purposes are welcome to publicly share and link to report information with attribution to Ookla.

| February 13, 2023

mmWave Clocks Gigabit Speeds in the U.S. but Lacks Maturity Elsewhere

In this article, we will look at the real-life performance of mmWave in the United States, reflect on its progress so far across the globe, and discuss what the future holds.

Key takeaways

  • mmWave received additional spectrum as part of Release 17, in addition to the spectrum already allocated by Rel-15 and WRC-19. 5G connectivity using mmWave substantially improves 5G performance (increasing theoretical speeds to up to 5 Gbps). At the same time, it comes with a challenge because of its limited range, which can be easily blocked or obscured, necessitating a high degree of network densification, which comes with additional Capex. 
  • After initial enthusiasm, operators’ appetite for the mmWave band spectrum has been lackluster, with only two auctions taking place in 2022. However, we see a renewed interest, which could lead to more spectrum allocations and network launches. 
  • Due to the limited rollout of mmWave 5G networks, the device ecosystem has lagged behind other 5G spectrum bands. While support for mmWave spectrum bands across smartphones is skewed heavily towards the  U.S., an increase in spectrum launches and networks combined with a declining ASP should lead to a growing adoption worldwide. 
  • Ookla® Q4 2022 data from the U.S. shows mmWave is achieving mind blowing speeds — almost 1.6 Gbps median 5G download speed — 26 times faster than the median 5G speed on low-band, almost seven times faster than the C-band, and four times than mid-band. 
  • RootMetrics® tested mmWave performance simulating congested network environments and concluded that even in such conditions, mmWave spectrum could achieve four times faster throughput than mid- and low-band spectrum.

mmWave spectrum allocation and commercialization 

Oftentimes, consumers complain about 5G speeds, sold on the promise of ultra-fast mobile networks. Such speeds can only be delivered utilizing the mmWave spectrum band. Up until and including 4G LTE, operators have been deploying networks in the sub-6 GHz spectrum. It was only with Release 15 that the telecom standards body 3GPP extended the spectrum ranges available for mobile networks. Frequency bands for 5G New Radio (NR) are separated into two frequency ranges: 

  • Frequency Range 1 (FR1) refers to sub-6 GHz frequency bands, traditionally used by previous network generations, which have been further extended to cover potential new spectrum offerings from 410 MHz to 7125 MHz.
  • Frequency Range 2 (FR2) refers to frequencies above 24 GHz.

Chart of mmWave 5G frequency bands

Furthermore, in November 2019, delegates of the World Radiocommunication Conference (WRC-19) identified additional radio frequency bands for IMT-2020 (the name ITU uses for 5G standards). These frequency bands are 24.25-27.5 GHz, 37-43.5 GHz, 45.5-47 GHz, 47.2-48.2, and 66-71 GHz. 3GPP’s recently completed Release 17 has further expanded the mmWave spectrum frequency range from 24.25-52.6 GHz up to 71 GHz, including support for the global 60 GHz unlicensed band.

So far, mmWave spectrum allocation has been lackluster across Europe, following initial enthusiasm in the U.S., Japan, and South Korea. According to Global Mobile Suppliers Association (GSA), 26 countries have licensed mmWave worldwide. In 2022, only two auctions took place in India and Spain in the 26 GHz frequency band. The Indian auction itself was a subject of intense debate and lobbying against its allocation in the 28 GHz band by the satellite providers. The regulator auctioned the 26 GHz band to minimize overlaps and interference issues.

Map of mmWave spectrum auctions worldwide

However, the momentum for mmWave spectrum allocations is growing, especially in Europe. While 14 countries in Europe have licensed mmWave so far, more are planning to do so e.g., Hungary, Austria, and the United Kingdom, which should lead to more deployments and create economies of scale that the mmWave device ecosystem currently lacks. 

Beyond consumers, mmWave can address the needs of enterprise applications that require higher bandwidth and lower latency, such as factory robots or AGVs. For example, Italian manufacturer Exor International partnered with Intel, TIM, and JMA Wireless to build an end-to-end smart factory in Verona to showcase the benefits that Industry 4.0 brings to manufacturing utilizing sub-6 GHz and 26 GHz spectrum. It is worth noting that several regulators have created an encouraging environment for enterprises to deploy their own dedicated networks by allocating spectrum for vertical use across mid- and high-frequency bands. So far, ten countries have set aside mmWave spectrum for enterprises, including Australia, Denmark, Germany, Greece, Japan, Hong Kong, Finland, Sweden, South Korea, and the U.K. Japanese Fujitsu deployed a private 5G network combining 4.7 GHz SA and 28 GHz. 

The growing pains of the mmWave device ecosystem 

The South Korean example offers a cautionary tale regarding 5G mmWave readiness.

In 2018, three operators — SK, KT, and LG U+ — spent 620 billion Won ($435 million) on a five-year license for the 28 GHz spectrum. As part of the license conditions, operators had to deploy 15,000 base stations by the end of 2021. Following an audit by the Ministry of Science and IT (MSIT), KT and LGU+ had their licenses revoked, and SK Telecom was reduced by six months. One key challenge operators pointed to was the need for a mature mmWave devices ecosystem in the market.

Looking at the latest GSA data, this is indeed the case. Across the commercially available 5G devices that GSA has identified spectrum support information, most devices (85.7%) support the sub-6GHz band and only 8.9% mmWave spectrum.

Chart of number of announced 5G devices by spectrum band

However, mmWave device availability differs depending on the geography with smartphone availability heavily skewed to the U.S. For instance, all ‌iPhone 12‌-14 models in the U.S. support both mmWave and sub–6 GHz 5G connectivity; this was not the case in South Korea. Across Android-based smartphones, the story is similar. The Pixel 6 Pro includes mmWave 5G support only in the U.S., Australia, and Japan. There is also a price difference across devices that offer support for mmWave. For example, Google Pixel 6 is available in two versions in the U.S. — an unlocked version with sub-6 GHz 5G for $599 and another with mmWave 5G for $699. The latter is offered via operators such as Verizon and AT&T. The price difference is likely due to the mmWave requirement for specialized radio hardware and antennas. Yet, on average, the price delta between sub-6 GHz and mmWave smartphones is narrowing down to $10- $20, Counterpoint Research shows. 

Furthermore, Counterpoint sees consumer awareness and adoption growing in the U.S. According to its U.S. smartphone users survey, 60% of users checked before purchasing whether a 5G Smartphone has 5G mmWave capability, while 43% of users in the future plan to subscribe to 5G mmWave services and smartphones. Beyond the U.S., Counterpoint sees one billion cumulative 5G mmWave smartphone shipments between 2019 and 2026, with mmWave smartphone penetration reaching 26% by 2026, compared to 13% in 2022.

mmWave supports FWA 

Fixed Wireless Access (FWA) is often considered one of the most successful 5G use cases as we recently pointed out. Some operators leverage mmWave to offer FWA services, for example, in April 2022, US Cellular launched 5G Home Internet using mmWave spectrum (28 GHz and 39 GHz) in partnership with Qualcomm and Inseego across ten cities. In Italy, Fastweb collaborated with Qualcomm to commercialize 5G SA mmWave services in March 2022, following a partnership to deliver 5G FWA to 400 cities. Vendors are vying to address this opportunity too. Recently, Mavenir launched an FWA solution that supports massive MIMO and 5G mmWave for 4G, 5G NSA, and 5G SA deployments. This FWA platform has been deployed by several customers, such as 360 Communications, RINA Wireless, Triangle Communications in the U.S., and Quickline in the U.K. 

mmWave delivers on the promise of gigabit speeds 

The U.S. is a global leader in using mmWave spectrum, with AT&T, T-Mobile, and Verizon using mmWave to offer mobile service, while US Cellular deploys it for FWA. Speedtest Intelligence® data shows that 5G connectivity using mmWave can reach staggering speeds of up to 1.6 Gbps. Comparing 5G performance across spectrum bands across mobile operators in the U.S. used for 5G services low-, mid-, C-band, and high-band (mmWave) it is clear that mmWave delivers superior performance. Our data shows that users on 5G mmWave achieved speeds that are 4.29 times faster than mid-band, 6.86 times faster than C-band, and a staggering 26.1 times faster than a low band.

Chart of median 5G download speed by spectrum band in the US

Due to its high throughput, mmWave is particularly useful for streaming and gaming. For example, at CES 2023, Razer unveiled its new Razer Edge, the first Android handheld gaming tablet on the market. The device can play games locally on the device or stream them remotely via 5G. The Razer Edge 5G became available from Verizon on January 26. 

Mmwave also offers the advantage of lower latency — anything over 20 ms will give gamers a headache, according to Qualcomm

mmWave helps with network congestion too 

Speaking at the Citi 2023 Communications, Media & Entertainment conference, Kyle Malady — Verizon’s Executive VP, President of Global Networks & Technology, noted that the operator has deployed over 40,000 mmWave nodes, which support its 5G services in dense, urban environments. He also stated, “And now that millimeter wave technology turns into a tool for RF engineers to use in hotspots that they have and C-Band.” 

A RootMetrics study supports this, based on several tests conducted in December 2021 to simulate the performance of the 5G spectrum in a congested environment. While, unsurprisingly, the results showed speeds in congested environments were slower on all bands than when congestion wasn’t present, there was a difference when it came to bands in use: mmWave 5G delivered a median download speed of 231.40 Mbps, which was over four times faster than the speeds recorded on either mid-band or low-band 5G, both of which were below 50 Mbps (44.80 Mbps on mid-band and 49.50 Mbps on low-band). To put mmWave’s capacity boost in a different perspective, its speed of 231.40 Mbps with congestion was nearly as fast as the 256.80 Mbps recorded on mid-band 5G without congestion. RootMetrics’ study showed that mmWave provides speeds 4-5 times faster than those of mid- and low-band in congested circumstances, delivering on its promise of providing greater capacity and faster speeds under heavy network load. 

Chart of comparison of throughput by band

Millimeter wave also lends additional capacity in dense areas such as stadiums. Poor performance during events such as concerts stems from the networks needing to deal with extra demand and becoming congested. Constraints on the spectrum allocated to 5G today can impact performance more in places like stadiums than in other areas because many users are concentrated in a small space and share the same limited spectrum. To illustrate how mmWave enables better network performance, we can look to Ookla Wind® walk testing data, which can show the benefits of mmWave in terms of 5G bandwidth. Since each carrier is 100 MHz wide, a test showed that a stadium used four carriers aggregated 80% of the time, which resulted in 400 MHz of 5G bandwidth. In turn, this helped to achieve higher 5G capacity and lower latency. 

Illustration of 80% samples, four Carrier Aggregation is being used on mmWave

Another benefit of mmWave that the Wind test showed is that with the mmWave 5G NSA network, most of the user data traffic is carried by mmWave spectrum only (contrary to other 5G bands in NSA). This reduces the load on the LTE network. This, in turn, allows legacy users with non-5G capable devices to use an LTE network that is less congested because it doesn’t have to support 5G devices as well. 

We will examine the relationship between spectrum and 5G performance in future articles. Subscribe to Ookla Research to stay up to date on our analyses. 

Ookla retains ownership of this article including all of the intellectual property rights, data, content graphs and analysis. This article may not be quoted, reproduced, distributed or published for any commercial purpose without prior consent. Members of the press and others using the findings in this article for non-commercial purposes are welcome to publicly share and link to report information with attribution to Ookla.

| February 16, 2023

Spectrum: An Essential Ingredient to Ensure Good 5G Performance

We have recently written about 5G performance at length, ranked the countries, looked at operators’ 5G strategies, and even commented on consumers’ perception of 5G performance. Most recently, we commented on the state of the worldwide 5G in 2022 and the fastest 5G mobile devices. This article will examine the relationship between spectrum and 5G performance.

Key takeaways:

  • Based on Speedtest Intelligence® data, we can see a significant variance between countries in median 5G speed, with four broad clusters of 5G performance emerging: 5G Leaders, High Performers, Improvers, and 5G Outliers. 
  • 5G performance depends heavily on the operator’s 5G spectrum holding.
  • The larger the allocation of the C-band spectrum, the faster the 5G download speed, with the contiguous spectrum enhancing performance further. 
  • Operators with access to 100 MHz of contiguous spectrum, e.g., in the U.A.E. and South Korea, led the 5G global ranking in Q4 2022 with a median download speed of 516.15 Mbps and 511.70 Mbps, respectively.
  • Access to low-band spectrum is just one factor that impacts 5G Availability. 

Four tiers of 5G performance 

Looking at market-level Speedtest Intelligence data, we can see significant variance in median 5G download speeds between the 52 countries we analyzed. We identified four broad clusters of 5G performance as measured by median 5G download speed.

chart of 5g performance clusers basd on median 5g download speed across a sample of countries5G Leaders: > 300 Mbps

These markets are the 5G pioneers, being among the first to launch 5G services, and are continually pushing the boundaries of 5G performance with median download speeds typically greater than 300 Mbps. High-performant 5G markets have allocated substantial amounts of spectrum for 5G use, particularly with wide allocations in the coveted C-band, and have assigned and, in some cases, begun limited use of mmWave spectrum. In some cases, we see a trade-off between 5G performance and 5G Availability (the proportion of time users with 5G capable devices spend connected to 5G networks).

5G High Performers: 200 – 300 Mbps

These markets share many of the characteristics of 5G leaders, having made an adequate spectrum allocation for 5G use and fostered competition between operators, which has helped spur network investment. However, they lag behind 5G Leaders based on their level of network densification. They typically use Dynamic Spectrum Sharing (DSS), which allows operators to share spectrum between network generations, but it can weigh on performance. Median 5G download performance in these markets typically ranges from 200 Mbps to 300 Mbps. We don’t generally see as much of a trade-off between performance and 5G Availability in these markets. 

5G Improvers: < 200 Mbps

These markets typically have limited C-band availability or a regulatory environment promoting strong price competition, with operator investment constrained. As a result,  median 5G download speeds are between 100- 200 Mbps in these markets. In some cases — for example, in the U.S. and U.K., we see 5G spectrum allocations (based on spectrum currently in use) giving a significant advantage to one player in the market, which has then sought to capitalize on this through aggressive 5G network deployment. Furthermore, with the exception of the U.S., which had a 5G Availability of 56.0% in Q4 2022, 5G Improvers all have 5G Availability in the low double digits, ranging from 13.5% in Japan to 19.2% in Germany. 

5G Outliers

Only in a few markets did 5G performance drop below 100 Mbps. Polish performance can be explained by the lack of a dedicated 5G spectrum; Polkomtel trading under the Plus brand, utilizing 50 MHz of spectrum in the 2.6 GHz band, and all other operators deploying 5G using DSS in the 2.1 GHz spectrum band. Spain, on the other hand, has assigned spectrum across all three bands, with C-band blocks ranging from 80MHz (MasMovil) to 110 MHz (Orange), and most recently, awarded mmWave too. However, operators focus on meeting coverage obligations that rely heavily on the 700 MHz band. For example, Movistar’s 5G network reached a total of 1,719 municipalities at the end of 2022, equivalent to 83% of the population. 

Fast 5G and good 5G Availability don’t always go hand in hand  

chart of medan 5g and availability in select markets

Using Speedtest Intelligence data, we examined a relationship between the country’s 5G median download speed and 5G Availability. And for the most part, there isn’t one. Fast networks don’t immediately come with high 5G Availability. For example, the U.A.E. and South Korea have topped our ranking in terms of the fastest median download speed over 5G at 549.70 Mbps and 496.63 Mbps, respectively, during Q4 2022. Yet, when it comes to 5G Availability, the U.S. came first in the ranking at 56.0% in Q4 2022, South Korea’s 5G Availability stood at 35.1%, while the U.A.E recorded a 5G Availability of 7.7% in Q4 2022. 

All eyes on spectrum

The key to understanding 5G is understanding operators’ 5G spectrum holding. There are two key considerations to keep in mind when discussing the spectrum for 5G: speed performance and geographical coverage. Regulators assign 5G spectrum across three spectrum ranges: low, mid (lower mid-band and upper/C-band), and high (mmWave).

Low-band (sub-1GHz) spectrum can travel farther, cover a greater geographical region, and provide deeper penetration within buildings, given its good propagation characteristics. But, the low band spectrum cannot deliver “true” 5G speeds, peaking at 100 Mbps median download speed. Another challenge is that these frequency bands are in high demand and in low supply, and in some countries, still used for analog television. 

Mid-band spectrum (1-6 GHz spectrum) is the so-called “sweet spot” for 5G, especially the upper mid-band (C-band), which offers the best of both worlds in terms of coverage and capacity.

Existing networks such as 2G, 3G, and 4G already use the lower mid-band. This spectrum band has been the 4G data traffic capacity layer, often used in Frequency Division Duplex (FDD) mode. FDD is a technique that uses separate frequency bands at the transmitter and receiver sides. For example, the U.S. and China used the 2.6 GHz spectrum band in Time Division Duplex (TDD) mode to drive their 5G deployment. Most counties will use TDD for 5G network rollout. This means that the 5G base station and end-user device use the same channel to transmit simultaneously, potentially creating interference issues while allowing more flexibility. Furthermore, this spectrum band will grow in importance as legacy networks are retired and spectrum refarmed.

The upper mid-band, especially 3.3 GHz to 3.8 GHz (otherwise known as C-band), offers a good combination of propagation and capacity. 3GPP standards currently support a 100 MHz wide channel and a maximum bandwidth of 400 MHz in carrier aggregation mode.

The high band, also called the millimeter wave (mmWave), spectrum can deliver super-fast speeds (thinking gigabits) but has limited range. Recently we published an article looking at the mmWave performance and recent developments.

Using Speedtest Intelligence background data, we can gain insights into which spectrum bands operators use for 5G. 

chart of spectrum band distribution

  • High band (mmWave) accounted for less than 1% of the scans in four countries: Japan, U.S., Qatar, and Australia.
  • Most countries used the mid-band spectrum.
    • C-band spectrum is used by all countries that have allocated it (21 out of 23 countries), with a notable exception of the Netherlands and Poland, which will finally auction the 3.5 GHz spectrum, set to take place in the summer of 2023. 
    • All countries we have analyzed, bar South Korea, use lower mid-band partially due to operators switching off their legacy networks (2G/3G) and refarming their existing spectrum holdings to support 5G networks rollout.
  • Low band was used by 78% of analyzed countries (18 out of 23) across our sample. 

Addressing spectral challenges via DSS and CA comes at a cost

The ITU minimum technical requirements to meet 5G performance requirements identify at least 100 MHz channel per operator and up to 1 GHz per operator in mmWave bands. This, however, is only sometimes the case. We can see imbalances in terms of operators’ performance within a country, which can be partially explained by having larger spectral resources. For example, Three UK benefited from having the largest, dedicated 5G spectrum — 140 MHz of frequency across several 5G spectrum bands, including a 100 MHz block of continuous spectrum in the 3.3-3.8 GHz band, which positions it well in terms of median download speeds compared to other U.K. operators.

In the absence of a dedicated 5G spectrum or to supplement the existing spectrum, operators can use two technologies to aid their 5G deployment: Dynamic Spectrum Sharing (DSS) and Carrier Aggregation (CA). DSS enables operators to allocate spectrum flexibly across low-, mid-, and high-bands and switch between LTE and 5G New Radio depending on network demand. However, there is a downside to that in terms of 5G performance. For example, in Poland, apart from Plus, all other operators deployed 5G using DSS in the 2.1 GHz spectrum band, which can partially explain why they have lower speeds.

Conversely, CA enables operators to use two or more bands together, integrating them as one big block to deploy 5G. This allows for the aggregation of non-contiguous spectrum blocks, but it impacts performance by introducing latency and signaling overhead. 

Access to low-band spectrum has a positive impact on 5G Availability, but it is not the only factor at play

chart of 5g availability and the use of low-band spectrum

Ookla® data indicates that 5G coverage, which is often enabled by having access to a dedicated low-band spectrum (600 – 900 MHz), is just one part of the puzzle when it comes to 5G Availability. Low-band (700 MHz) spectrum, initially used for LTE, is now allocated to 5G because it allows extended coverage. According to the GSA, the 700 MHz spectrum band is particularly precious. GSA’s data shows that spectrum at 700 MHz has generated an average of $0.309/MHz/pop in assignments and auctions since 2015, significantly above the average price for C-band. For example, India’s highly anticipated 5G spectrum auction garnered $0.380MH/pop for 700 MHz compared to $0.031/MHz/pop for C-band. 

Qatar, Saudi Arabia, South Korea, and the U.A.E. don’t have any 5G devices using low-band spectrum simply because there has been no spectrum assigned in this band to 5G services. During the initial 5G auction in 2016, South Korea’s 700 MHz spectrum remained unsold. 

Other essential aspects driving 5G Availability are the affordability and availability of 5G-capable smartphones, 5G tariffs, and end-user demand. Case in point, despite the lack of low-band spectrum, South Korea reached a 5G Availability of 35.1% in Q4 2022, driven by customer adoption and 5G network densification. According to the Ministry of Science and ICT, in November 2022, there were 27.5 million 5G subscriptions in South Korea, equivalent to 36% of all mobile subscriptions. According to its Communication Agency, there are 215,000 5G base stations, which translates into 319 people per 5G base station, nearly seven times more than the EU and 13 times more than the U.S.

A country’s geography impacts 5G coverage too. For example, in addition to having access to low band spectrum, the Netherlands benefits from being flatter and more densely populated, resulting in a greater ability to expand 5G coverage. 

Another factor at play is the spectrum license conditions that stipulate coverage requirements, for instance, as part of the 700MHz licenses in the Netherlands, there is a minimum speed of 8 Mbps in 98% of the cases in each municipality of the country in 2022.

While the relationship between low-band spectrum and 5G Availability is not a direct one, we wanted to investigate whether there is a link between the median 5G download speed and the C-band spectrum. 

Larger the share of the C-Band spectrum, the faster the 5G download speed

chart of 5g download speed and the use of c-band spectrum

Our analysis found that access to C-band spectrum typically translates into a faster median 5G download speed. Unsurprisingly, operators are keen to deploy 5G services using C-band spectrum. According to GSA, since the end of 2015, 54 countries have auctioned, assigned, or renewed licenses for C-band spectrum. 

All eyes on 5G Leaders

Countries where operators solely rely on the mid-band spectrum for 5G, and where 5G services have been available for more than 13 quarters have achieved over 300 Mbps median download speed in Q4 2022. Bulgaria is an exception, having launched services just over two years ago. We can also conclude that operators’ overall spectrum holding and whether they have access to a contiguous spectrum matters, too. Contiguous spectrum helps achieve faster speeds, lower latency, and improved spectral efficiency. 

U.A.E.: Emirati operators – Etisalat and Du –  use two carrier spectrum in the 3.5 GHz and 2.5 GHz frequency range, each carrier at 100 MHz, to establish a 5G network. This results in speeds exceeding 500 Mbps. The U.A.E. had a median 5G download speed of 511.70 Mbps in Q4 2022. 

South Korea: KT and SKT bought a 100 MHz channel each in 2018. In July 2022, LG+ secured an additional 20 MHz C-band spectrum, bringing its total spectrum holding to 100 MHz. Alongside the 5G spectrum auction, the government outlined the rollout milestones for the operators’ 3.5 GHz rollout: 22,500 base stations by the end of 2021, 45,000 by the end of 2023, and 150,000 at completion. Thanks to that, South Korea has the most base stations per population. South Korea is one of the early adopters of 5G, having commercialized 5G in 2019 and over a third of all mobile subscriptions on 5G. One of the reasons behind South Korea’s fast-paced 5G adoption is the support from the government, which adopted the 2021 action plan for the “Digital New Deal” to support 5G development and a wider digital transformation. 

Qatar: Qatar, clocking a median 5G download speed of 462.15 Mbps and 5G Availability of 50.7% in Q4 2022, delivers the best of the worlds — good speeds and 5G Availability. In November 2022, Qatar’s Communications Regulatory Authority (CRA) amended the mobile licenses held by Vodafone Qatar and Ooredoo Qatar in early 2019, authorizing each operator to utilize 100 MHz of C-band spectrum and committing them to roll out commercial 5G networks before the end of 2020 in all densely populated areas. Operators’ heavy investment into their network to achieve near-universal service coverage and incentives to migrate users to 5G networks has paid off. We have closely monitored 5G performance during the recent World Cup. Not only did Qatari 5G networks manage to withstand the additional network load that World Cap brought, but it has also improved in performance, with the median 5G download performance hitting 472.13 Mbps in November 2022. 

Saudi Arabia: Operators in the KSA have access to more than 1000 MHz of licensed spectrum for IMT use in the low- and mid-band ranges. Saudi regulator – CST (Communication, Space and Technology Commission) – championed data-driven, evidence-based policy decisions to enable a 5G rollout by conducting analysis of spectrum usage, the performance of various bands, and existing network infrastructure to see where investments had been made within certain bands (e.g., extra capacity in specific bands in urban areas and coverage of rural areas using adequate bands). If you would like to find out more, read this case study

Bulgaria: In April 2021, Vivacom Bulgaria won 100 MHz in the 3.7-3.8 GHz band for BGN4.6 million (€2.35 million). Vivacom utilizes DSS, combining frequencies in 1.8, 2.1, and 3.6 GHz bands for 5G. A1 Bulgaria, on the other hand, uses a dedicated 100 MHz band.

We will continue to monitor 5G performance across the world and investigate the factors that impact 5G performance. If you want to learn more about 5G performance, head to Ookla ResearchTM and subscribe to our newsletter to stay up to date with our latest analyses. 

Ookla retains ownership of this article including all of the intellectual property rights, data, content graphs and analysis. This article may not be quoted, reproduced, distributed or published for any commercial purpose without prior consent. Members of the press and others using the findings in this article for non-commercial purposes are welcome to publicly share and link to report information with attribution to Ookla.