| February 19, 2020

Why Europe Needs a New Competition Paradigm for the 5G Era (co-published with GSMA Intelligence)

This article is being co-published with GSMA Intelligence. As the exclusive global network performance data provider to the intelligence unit of the mobile industry trade group GSMA, Ookla® supports their extensive efforts to provide data-driven insights and context on the state of the mobile industry around the world. Speedtest® data is leveraged by GSMA Intelligence analysts and experts on an ongoing basis, including within the recent "Mobile Market Structure and Performance in Europe" report.

The mobile market in Europe has come to the end of its main phase of investments in fourth generation (4G) mobile networks and operators are now turning their attention to 5G. Services have already been launched in Switzerland and the UK, and more markets expected to launch in 2020, for example Germany and France.

Despite these positive steps, industry analysts do not expect a rapid roll-out of 5G in Europe. On the contrary, most expect 5G deployments in European markets to lag behind countries such as the US, China, Korea and Japan. The reason is that delivering 5G services will require large additional investments, and these will be a lot harder to justify in European markets that have recently delivered lower profit margins than in other parts of the world.

With this largely subdued investment climate, what can be done so that Europe doesn’t lose out on the 5G opportunity? One thing that could change this is competition dynamics. More concentrated market structures (for example with less players) can deliver economies of scale, a more efficient utilization of assets (such as sites and spectrum), and also enable large investments in 5G networks. However, concentrated markets can also raise flags with regulatory and competition authorities that may be concerned about consumer prices being higher.

Understanding the relationship between market structure and the quality, innovation and prices that consumers can expect is therefore crucial. A strong debate exists about the competition dynamics that will deliver best value for consumers in the 5G era. As arguments can be made in both directions, it is important to look at data from the recent past to help draw some lessons that can inform decisions going forward.

This is precisely what GSMA Intelligence did. In a recent study, they evaluate how market structures impacted consumers during the 4G era in Europe. They looked at data covering the period from 2011 to 2018, for 29 European countries. They combined coverage and other publicly available data from operators with network-quality measurement data from Ookla®, a global leader in mobile and broadband network intelligence, testing applications and technology.

Overall, the 4G era was a positive and expansive one for European mobile consumers everywhere. Already by 2016, 90% of consumers were covered by 4G networks. Since then, operators have delivered greater speeds and lower latencies (signal delay), resulting in a far superior consumer experience today. Download speeds increased on average from 2 Mbps in 2011 to 37 Mbps in 2018. The average price per MB also dropped sharply as mobile data became cheaper and users consumed ever-increasing volumes of data, with average monthly data usage increasing more than twelve-fold.

But while all European consumers experienced improvements during the 4G era, the study shows that European mobile users in three-player markets benefited the most from higher quality and innovation.

By the end of 2018, three-player markets were outperforming four-player markets by 4.5 Mbps in download speeds, and over half of that difference (around 3.5 Mbps) can be attributed to the role of market structure in three-player markets. In particular, operators in more concentrated markets were able to utilize assets more efficiently (especially spectrum) and generate higher returns that allowed them to invest more in their networks. This is an important insight when considering the best ways to unlock the full potential of 5G networks, including advanced applications that require very low latencies, high speeds and plenty of network capacity.

Did this come at the expense of higher prices? On the basis of the pricing data that GSMA Intelligence was able to analyse, it did not. In addition to general improvements in performance, prices also decreased across Europe in the 4G era, indicating more efficiency and better value for consumers over time. Implicit unit prices (i.e. revenue per MB and revenue per user) decreased similarly in both three- and four-player markets.

In other words, during the 4G era, a European consumer in a three-player market experienced on average a better quality mobile broadband service while paying similar prices per MB of data to a consumer in a four-player market.

Does this therefore mean that more consolidation in European markets is the only solution to deliver the right investments for 5G? Not necessarily.
An option that is often touted as an alternative to full consolidation is increased network sharing. GSMA Intelligence’s analysis showed that in the 4G era, progressively deeper levels of network integration delivered improved performance, although they came short of full integration in terms of network quality. Network sharing could therefore also help promote faster deployments of high-performing 5G networks in Europe over the coming years.

Ultimately, every case and country needs to be considered on the basis of its own merits and situation. What works in one country does not necessarily work in another and operator incentives and consumer attitudes to products and services will differ from market to market.

But there is one key lesson from the 4G era that does apply to all countries equally: to support the delivery of high performing 5G networks, policymakers should fully consider all aspects of consumer welfare when assessing the relative advantages of more concentrated markets in merger control, antitrust policy and spectrum management.

Read the full report here.

Ookla retains ownership of this article including all of the intellectual property rights, data, content graphs and analysis. This article may not be quoted, reproduced, distributed or published for any commercial purpose without prior consent. Members of the press and others using the findings in this article for non-commercial purposes are welcome to publicly share and link to report information with attribution to Ookla.


| October 29, 2019

Introducing Speedtest® CLI

At Ookla’s core, we are a team of passionate technology enthusiasts who constantly push to improve the speed of the internet across the globe. For thirteen years, Speedtest.net has provided the leading tools for people around the world to measure the speed and latency of their internet connections. From our Adobe Flash roots to our modern HTML5 and native applications, we have constantly focused on providing a high fidelity and rich experience for all internet users.

We have seen and have connected with many others who have the same goal — teams who have built brilliant ideas that leverage internet performance metrics to drive speed and reliability advancements across global networks.

Ookla’s goal is to support these teams by providing the best benchmarking toolsets to drive internet performance improvements across the world. Speedtest CLI is the next step in providing developers and engineers low level access to programmatically measure internet performance.

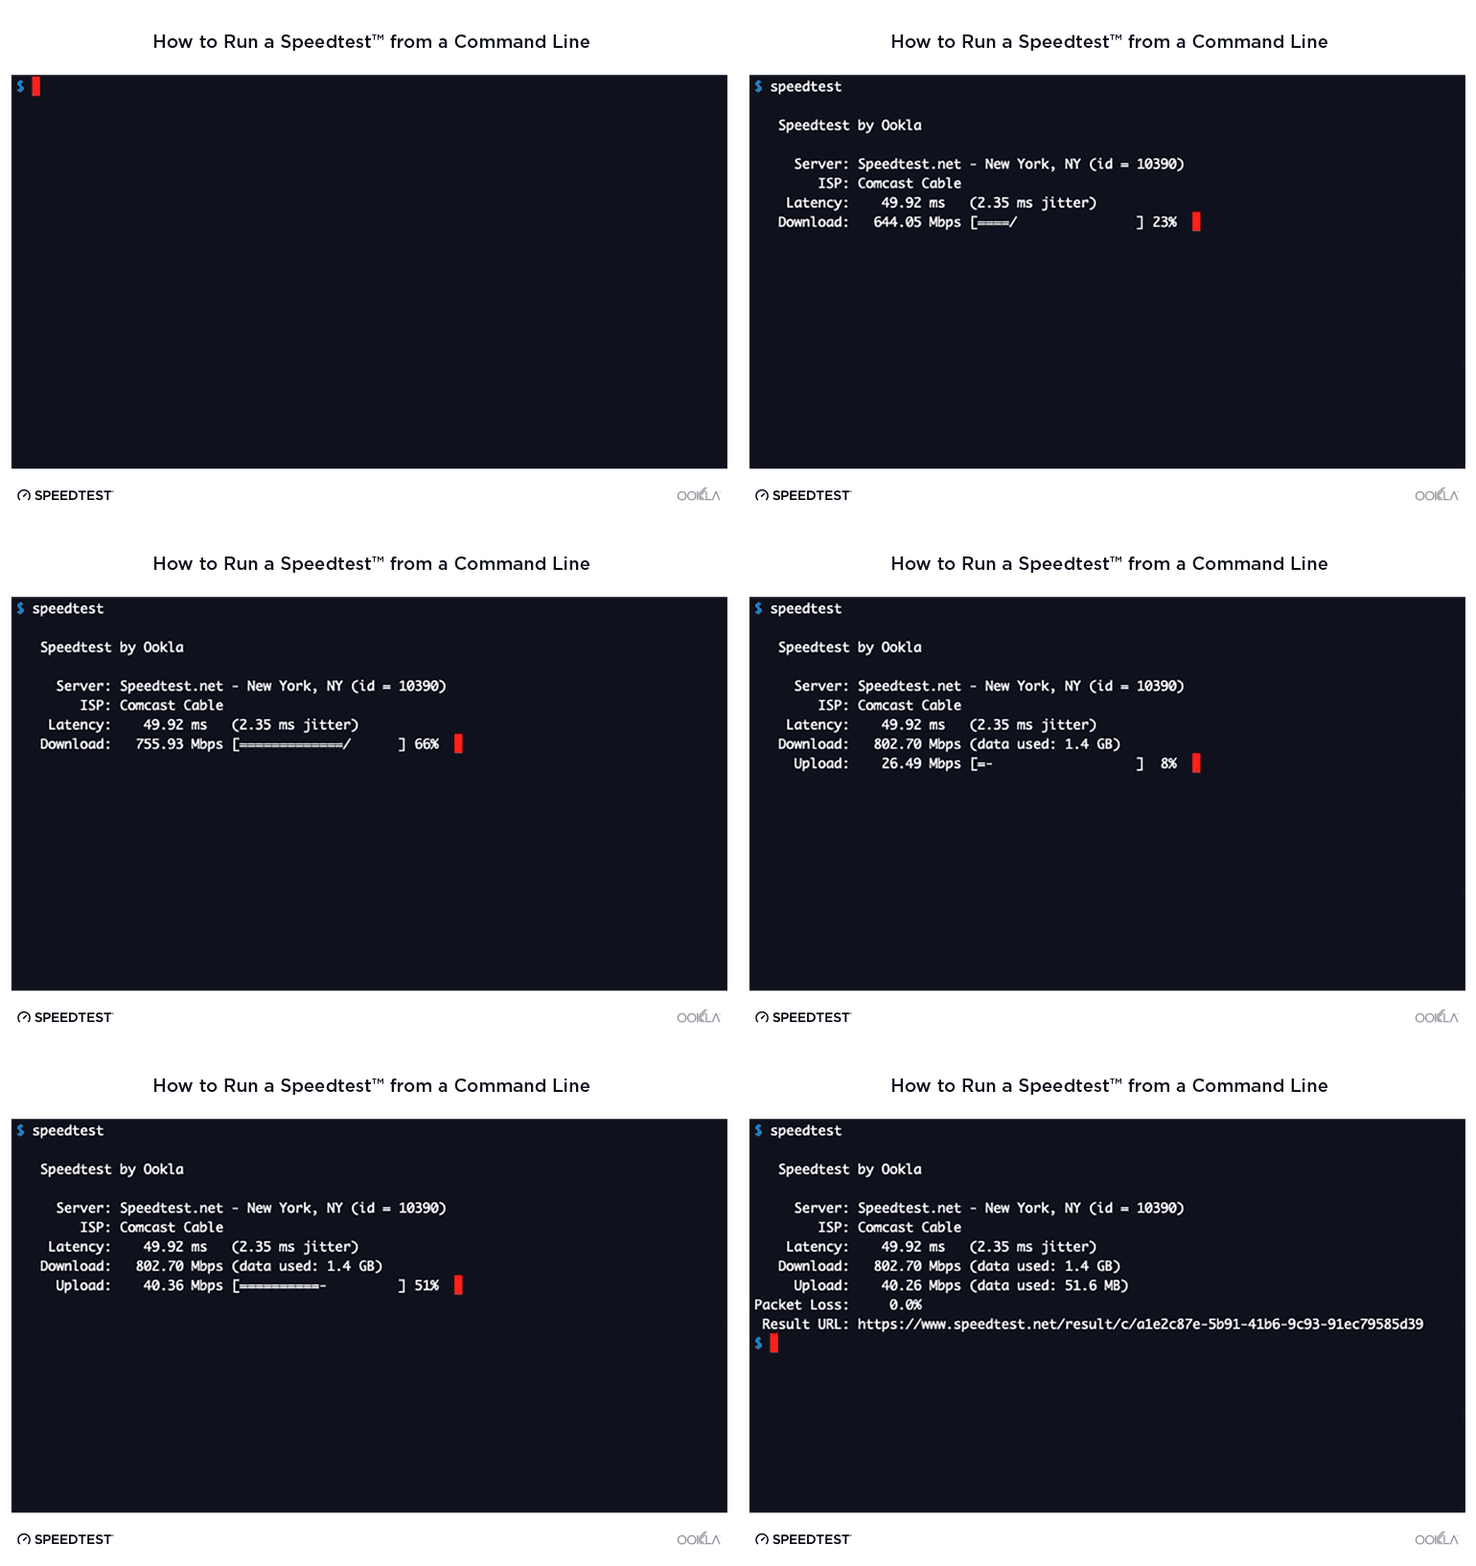
You can now run a Speedtest from your command line

We are proud to introduce our latest (and most visually minimal) application, Speedtest CLI. Speedtest CLI is a major departure from our existing applications — it is entirely text driven and does not have a traditional user interface. However, this minimalist interface is incredibly powerful — it provides the core of our Speedtest engines to software developers across the world.
speedtest-cli-Command_Line_Interface_1019L-1

This release marks the ability for any non-commercial individual to leverage over a decade of optimization and experience of network benchmarking within their own applications. Not only does Speedtest CLI provide best in class measurement techniques, but it also leverages our highly optimized C++ engine, custom Layer 7 protocols and the largest internet performance server network in the world to squeeze every bit per second out of a connection — even on embedded hardware. This is the same engine that powers our other native applications, and it is much more performant than existing solutions that rely on HTTP/S and traditional file transfer libraries.

For commercial entities, we offer Speedtest PoweredTM. Speedtest Powered further improves upon Speedtest CLI by providing deep network level customization, additional architectures, custom toolchain builds and enterprise support.

How you can use Speedtest CLI

We provide a number of different methods of working and communicating with Speedtest CLI. There is a basic user interface which provides the current stage and progress of the test for interactive use. However, the real power lies in the other output formats. We provide output in character delimited formats (CSV/TSV) and JSONL with a high sample rate — these can be consumed via the standard input of other applications to create live time progress meters and dynamic user interfaces.

Speedtest CLI can run on any platform

Speedtest is renowned for the ability to run on any platform, and Speedtest CLI is no exception. At launch, we will support Windows, MacOS, Linux and FreeBSD operating systems with statically compiled binaries. We are also excited to see what people will build within the IoT space on embedded devices — as a result, not only will we support the traditional i386 and AMD64 architectures, but we will also provide optimized builds for the ARM32 and ARM64 architectures on Linux.

Use cases for Speedtest CLI

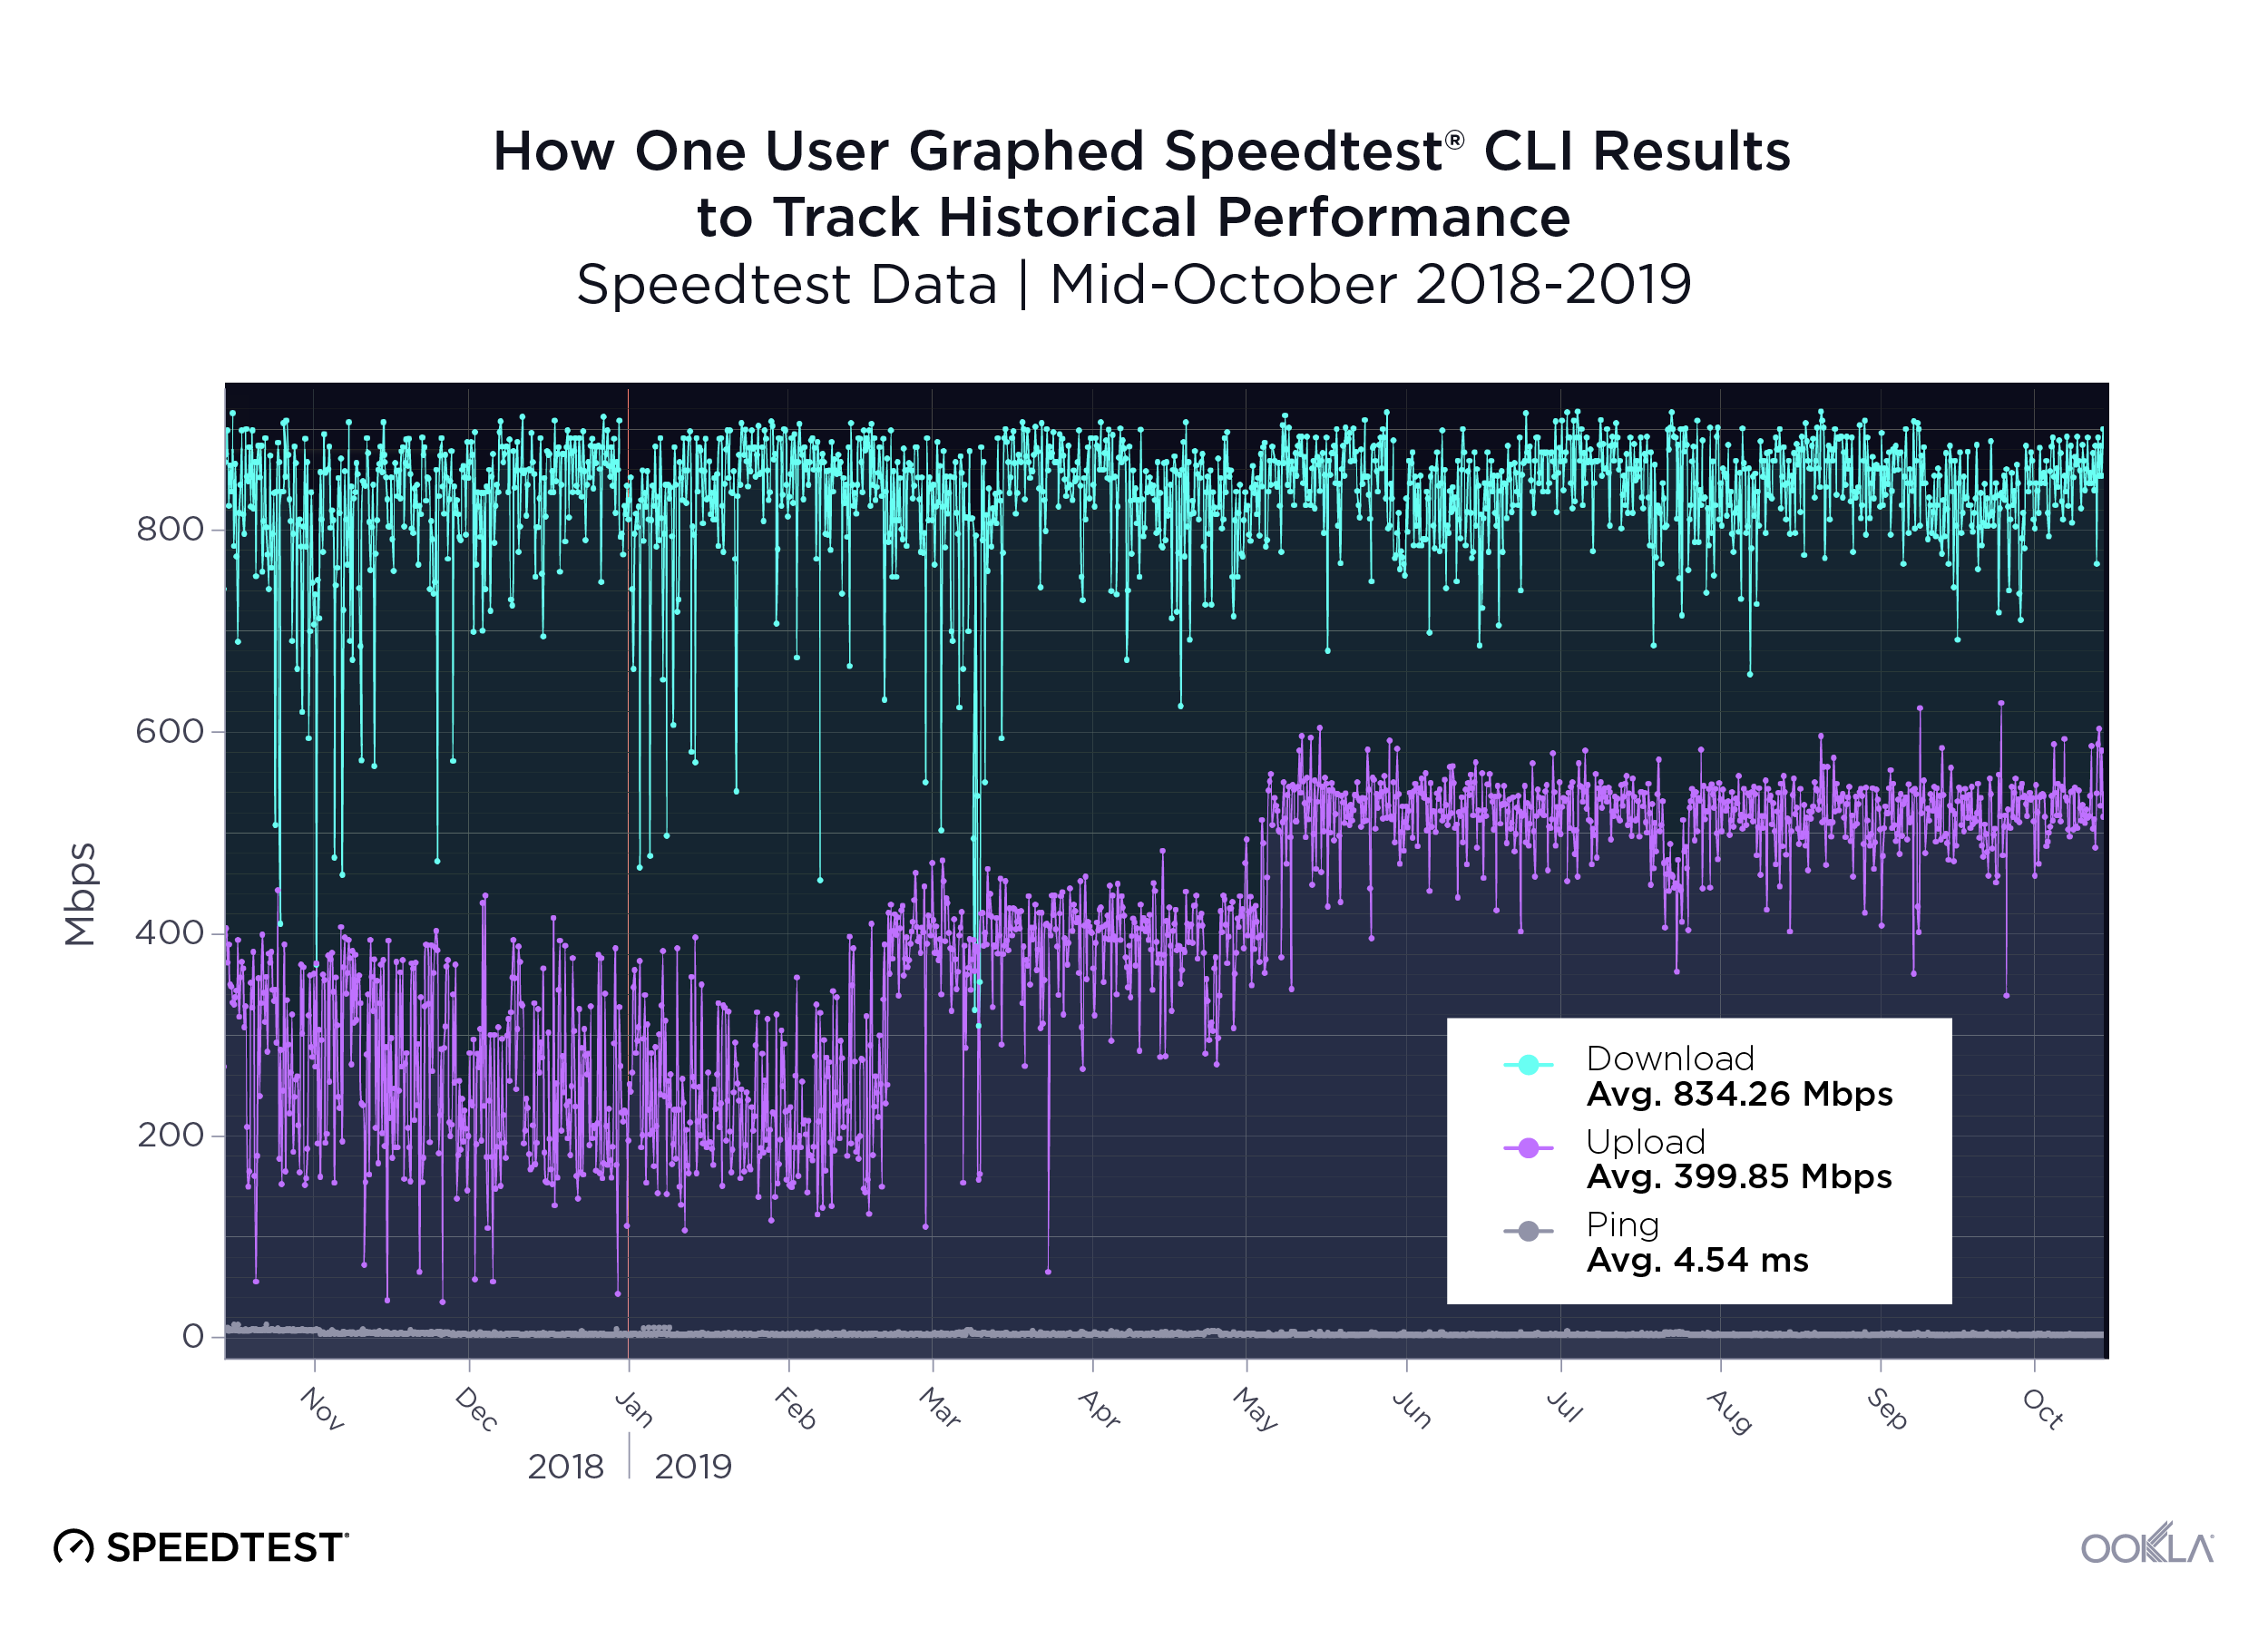
One example of how Speedtest CLI can be used is a historical network monitoring tool. In a previous post, How I Maximized The Speed Of My Non-gigabit Internet Connection, Brennen Smith showcased an open source application which has tracked the historical performance of his internet connection with an internal build of Speedtest CLI. Now that this tool has been running for over a year, we can see that there have been multiple improvements on the ISP’s network. We can see that his upstream provider improved latency on November 2nd, and that there were multiple improvements on upload bandwidth since November 2018. Despite these improvements, one can also observe that there was degradation of the network from March 7th – 9th.
Ookla_Graphed-Speedtest-CLI-to-track-historical-performance_1019-1

These are critical key performance indicators to track; with Speedtest CLI, anyone can build world-class applications to monitor and track network performance around the globe.

Tell us what you’re building with Speedtest CLI

The team at Ookla is incredibly excited to see what the community builds around Speedtest CLI. Please share your achievements and any tools you build with Speedtest CLI by tagging us on GitHub, Facebook or Twitter. We’re looking forward to seeing how you drive innovation and improvements to create a better internet for everyone across the world.

For more information about Speedtest CLI and documentation, please visit the Speedtest CLI page.

Ookla retains ownership of this article including all of the intellectual property rights, data, content graphs and analysis. This article may not be quoted, reproduced, distributed or published for any commercial purpose without prior consent. Members of the press and others using the findings in this article for non-commercial purposes are welcome to publicly share and link to report information with attribution to Ookla.

| October 15, 2019

FESIQ Software Suite Now Part of Ookla

Ookla FES Logos

Following a successful partnership with FES that began earlier this year, Ookla® now owns the complete FESIQ software suite. Formally uniting FESIQ with Ookla’s already unparalleled views into the performance and quality of worldwide networks further cements Ookla’s position as the de facto source for data-backed visualizations of network coverage, performance and usage density. FESIQ enables operators and infrastructure providers to rapidly analyze wireless networks down to the city block and individual building levels, reducing or eliminating traditional expenses associated with measuring and mapping networks.

As part of the transition, Ookla welcomes senior RF and software engineering team members who will focus on further developing the capabilities of the FESIQ software suite along with the broader Ookla team. FES and Ookla will continue their strategic partnership, providing FES with ongoing access to the FESIQ software suite and Ookla network performance data. FES is poised to continue offering superior RF engineering and network consulting services to mobile network operators.

To learn more or inquire about FESIQ and Speedtest Intelligence®, visit ookla.com/speedtest-intelligence. For more information about FES and the wireless design and optimization services they provide, visit furtherllc.com.

Ookla retains ownership of this article including all of the intellectual property rights, data, content graphs and analysis. This article may not be quoted, reproduced, distributed or published for any commercial purpose without prior consent. Members of the press and others using the findings in this article for non-commercial purposes are welcome to publicly share and link to report information with attribution to Ookla.
| March 19, 2019

Ookla Partners with FES to Power FESIQ Virtual Benchmarking Software

Ookla FES Logos

Ookla has partnered with FES, a leading provider of innovative software and services for the telecom industry, to power the FESIQ Virtual Benchmarking (VBM) software suite. Effective immediately, Ookla enterprise customers may leverage the FESIQ VBM analytics platform to view measured coverage in an unparalleled level of detail, including indoor and outdoor identification, all over the world.

This in-depth view into network coverage, performance and population density is a game changer for operators and infrastructure providers seeking to deliver dramatic improvements in network efficiency and performance, while simultaneously managing those costs. By rapidly assessing all networks and technologies down to the individual building level, FESIQ VBM cuts out the traditional expense and intense effort of measuring and mapping networks through methods like drive testing. Furthermore, a comprehensive view of competitive network coverage more fully informs capital and marketing spend.

FES assists a global clientele with the planning, implementation, optimization, and regulatory compliance of wireless networks. FES is a solutions pioneer in network design and performance, including live special event monitoring and rapid VoLTE improvement. The FESIQ software suite provides these insights via a blend of capacity and performance forecasting, crowdsourced measurement analytics, and network performance assurance functionality. Since inception, FESIQ has been used to plan and optimize tens of thousands of small cell, macro, and 5G cell sites.

To learn more or inquire about the benefits of FESIQ VBM powered by Ookla, visit Ookla.com/speedtest-intelligence.

Ookla retains ownership of this article including all of the intellectual property rights, data, content graphs and analysis. This article may not be quoted, reproduced, distributed or published for any commercial purpose without prior consent. Members of the press and others using the findings in this article for non-commercial purposes are welcome to publicly share and link to report information with attribution to Ookla.
| October 10, 2018

Ekahau is now part of Ookla

Ookla has acquired Ekahau, the market leader in enterprise Wi-Fi design, optimization and troubleshooting. Founded in 2000, Ekahau is universally trusted by IT professionals and Wi-Fi industry experts as the leading software and hardware technology for deploying the world’s highest performance and most robust Wi-Fi networks.

Whether a corporate office, hotel, hospital or university – if the Wi-Fi works well, it has likely been built using Ekahau’s Wi-Fi design solutions. Ekahau Site Survey is the ideal solution for designing and deploying Wi-Fi networks, while the Ekahau Sidekick is an all-in-one professional measurement device for fast and accurate Wi-Fi site surveys and spectrum analysis.

As part of Ookla, Ekahau will continue to operate as they always have and will enhance their products by leveraging the Speedtest platform. Ookla will also benefit from the expertise and technology that Ekahau brings to the measurement and optimization of Wi-Fi networks. We’re thrilled to welcome Ekahau to the Ookla family.

Ookla retains ownership of this article including all of the intellectual property rights, data, content graphs and analysis. This article may not be quoted, reproduced, distributed or published for any commercial purpose without prior consent. Members of the press and others using the findings in this article for non-commercial purposes are welcome to publicly share and link to report information with attribution to Ookla.

| August 28, 2018

The Network Efficiencies that make Telenor the World’s Fastest Carrier

Speedtest data recently revealed that Norwegian carrier Telenor was the world’s fastest carrier during Q2 2018 with a mean download speed of 72.05 Mbps on modern (LTE-capable) devices. Because Telenor is an enterprise client of ours, we had the unique opportunity to sit down with their network team to learn what goes into building a world-class LTE network.

Layering frequencies to improve capacity and coverage

Telenor always builds cell sites with multiple frequencies in order to provide the right mix of coverage and capacity that delivers the best possible user experience. To that end, Telenor’s LTE has been deployed across three frequency bands: 800 MHz provides the foundation for coverage, 1800 MHz acts as the mid-band layer and 2600 MHz is used as a capacity layer. In addition to layering the disparate frequency bands by the way of Carrier Aggregation, Telenor has implemented the complete Gigabit LTE feature set on selected sites, including the 256QAM and 4×4 MIMO which ensures the highest possible network efficiencies.

Telenor Norway takes pride in being one of the operators with the largest share of voice traffic over LTE in the world, and is aggressively working towards allocating all available frequency bands to LTE. This includes plans to sunset the 3G layer in 2019-2020 to allow Telenor to repurpose the 900 MHz and 2100 MHz spectrum bands for LTE, which will deliver even faster speeds to users. The company will continue offering 2G until 2025, mainly for machine-to-machine and legacy voice services.

Incentivizing customers to use modern devices

Perhaps Telenor’s secret sauce is their very close relationship with smartphone manufacturers. This allows them to make the most out of pre-launch field tests to ensure that their customers are getting equipment that meets Telenor’s standards.

Telenor is also assertive with marketing incentives designed to upgrade customers to modern devices. This is because the newest flagship phones are faster and more efficient in their use of network resources as a result of being equipped with the most advanced LTE modems, RF front-end and four LTE antennas. This completes Telenor’s network ecosystem filled with efficiencies, ensuring the best possible user experience, and the highest return of investment.

Covering a complex geography

Telenor currently has 99.4% of Norwegians covered with LTE, encompassing 81% of land mass, including remote rural areas. They extend service to Norway’s famous fjords by leveraging the existing cell sites built during the 2G days and continuing to add new ones.

What’s next for Telenor

Telenor is currently conducting 5G trials in preparation for commercial launch in 2020. Potential use cases for their 5G include: fixed wireless, enhanced mobile broadband and prioritization for mission critical services like healthcare, emergency services and supporting Norway’s large fish farming industry. While 5G is expected to make a big splash when it’s launched, Telenor believes that the LTE technology will continue as the main network pillar for several years to come.

Ookla retains ownership of this article including all of the intellectual property rights, data, content graphs and analysis. This article may not be quoted, reproduced, distributed or published for any commercial purpose without prior consent. Members of the press and others using the findings in this article for non-commercial purposes are welcome to publicly share and link to report information with attribution to Ookla.

| August 13, 2018

Downdetector is Now Part of Ookla

Ookla has acquired Downdetector, the leading source for real-time status and outage information for thousands of services and websites around the world. Downdetector’s commitment to providing open, transparent information about the state of online services echoes Ookla’s focus on illuminating the speed and performance of networks around the world for the benefit of those who use them.

As part of Ookla, Downdetector will continue to operate in full capacity as a resource for both consumers and enterprise businesses. We look forward to helping Downdetector in their mission to bring visibility to the availability and uptime of internet services.

Ookla retains ownership of this article including all of the intellectual property rights, data, content graphs and analysis. This article may not be quoted, reproduced, distributed or published for any commercial purpose without prior consent. Members of the press and others using the findings in this article for non-commercial purposes are welcome to publicly share and link to report information with attribution to Ookla.
| June 19, 2018

Mosaik is Joining Ookla

Ookla has acquired Mosaik, a pioneer in wireless network intelligence and mapping solutions. The combination of Ookla and Mosaik opens up exciting new data and visualization capabilities that enhance the product offerings to enterprise clients of both organizations and further strengthens Ookla’s position as the global leader in both fixed and mobile network analysis.

Ookla and Mosaik are highly complementary and share a commitment to providing the best network availability and performance insights to consumers and enterprises that rely on those networks to succeed.

Both teams will continue to focus on their existing offerings as they work together to provide vital industry research tools. In the near future, look forward to integrations between Ookla and Mosaik that advance market knowledge in an increasingly connected world. We’re excited to welcome Mosaik to the Ookla family.

Ookla retains ownership of this article including all of the intellectual property rights, data, content graphs and analysis. This article may not be quoted, reproduced, distributed or published for any commercial purpose without prior consent. Members of the press and others using the findings in this article for non-commercial purposes are welcome to publicly share and link to report information with attribution to Ookla.

| September 19, 2016

We Flew a Speedtest Banner Over a Football Game to See if Stadium Internet is Getting Faster…

…and it is

Anyone who has attended a football game in a packed stadium can attest to the fact that the internet there is slow. Not just moves a little sluggishly slow, but tweets won’t publish and mobile internet browsing is non-existent slow. This happens in part because when large groups of people try to access the internet from the same location at once, mobile networks get overcrowded and that causes speeds to decline.

Slow internet makes for a frustrating fan experience for those who want to check out the starting wide receiver’s stats, share their most recent selfie you would ever take one) or check in with friends watching the game at home. It also makes it harder for teams to interact with fans throughout the game. All in all, it’s a crummy experience for everyone.

As football fans and people who think a lot about internet speeds, the Speedtest team started wondering how fast stadium internet actually is and about the influencing factors. So we decided to dig deeper into the topic by taking a closer look at the stadium in our own backyard — CenturyLink Field, home of the Seattle Seahawks.

The Experiment

Over the years, we’ve noticed that people frequently test their internet at crowded events like football games. Having seen this in our data, and knowing that poor speeds in crowded places are a common complaint about mobile networks, we decided to run a little experiment.

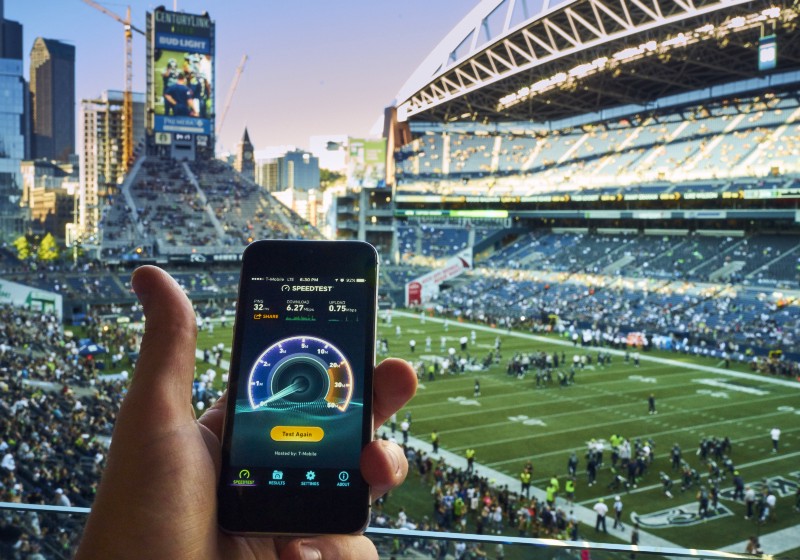
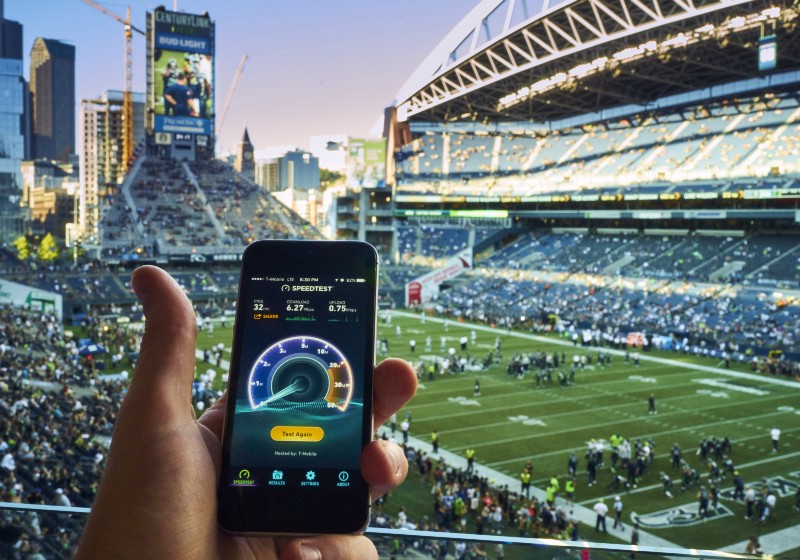
On August 25th, we hired a pilot to fly a 30×100 foot banner over CenturyLink Field for the Seattle Seahawks home preseason game against the Dallas Cowboys. The banner read “Take a Speedtest” to encourage tailgaters and game attendees to test their internet connection around and in the stadium using our Speedtest app.

stadium fireworks

After the game, we tallied up the Speedtest results from inside the stadium and the immediately surrounding area (e.g. stadium parking lots) and started analyzing.

What We Learned

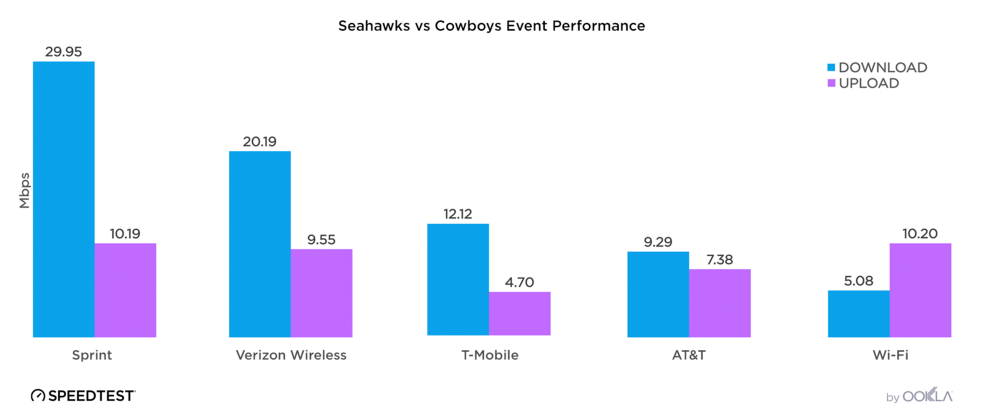
We collected results from all four major carriers — AT&T, Sprint, T-Mobile and Verizon Wireless — at the game. While Sprint walked away with the highest average download and upload speeds (29.95 Mbps and 10.19 Mbps respectively), the number of tests taken using Sprint did not reach a statistically significant number. This low test number makes it hard to say whether Sprint’s network truly was the fastest at this particular game, or just an outlier.

Verizon Wireless achieved the fastest average download and upload speeds (20.19 Mbps and 9.55 Mbps respectively) at the game with a significant number of tests. T-Mobile and AT&T were next with lower upload speeds and the highest latencies overall, meaning fans on those carriers likely had an even harder time sharing and receiving information.

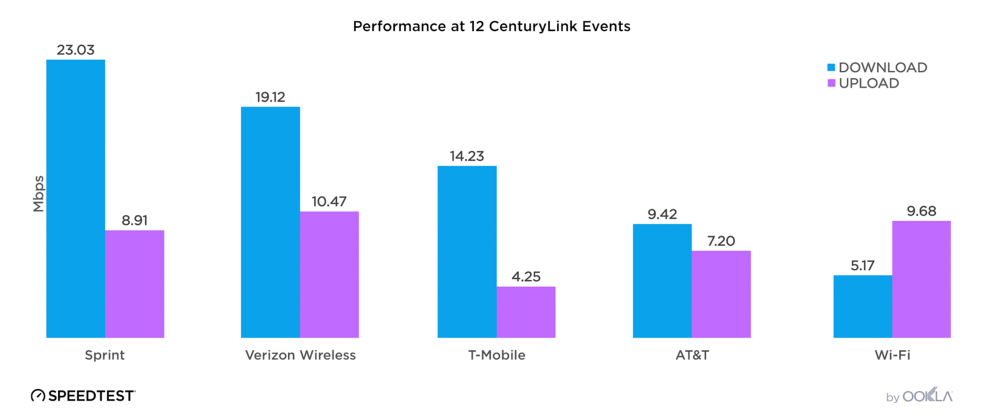
We looked at 12 other CenturyLink events over the previous months to expand our test pool, including several concerts and Seattle Sounders games. Again, all four major carriers were represented in the data. Across all 12 events, Sprint maintained the highest average download speed at 23.03 Mbps. Interestingly, Sprint also was the carrier with the most tests taken on their network during the 12 event period. This difference is likely because Sprint is a COPA America events sponsor around the US and runs a fan booth at CenturyLink Field where employees and customers are encouraged to take a Speedtest. Despite Sprint’s larger test volume, Verizon claimed highest average upload speed with 10.47 Mbps.

CenturyLink is an ISP themselves and their namesake stadium now provides free CenturyLink Wi-Fi to game attendees. Additionally, Verizon customers get exclusive access to Verizon’s free in-field Wi-Fi. In looking at Wi-Fi tests taken before and during the game, most were conducted over CenturyLink’s network. The network’s wireless performance was 5.14 Mbps download and 10.21 Mbps upload at the game. Looking again at the 12 events at CenturyLink Field, the Wi-Fi averaged 5.17 Mbps download and 9.68 Mbps upload. The top recorded download speed on CenturyLink’s Wi-Fi across all events was 17.54 Mbps.

The highest average download speeds took place outside CenturyLink Field. So if you want to download that Vuvuzela app, your best bet is to do it before you enter the stadium or somewhere else beforehand. More interested in uploading that picture of garlic fries to Instagram? Surprisingly, stay in your seat! Upload speeds tended to be higher within the stadium stands than outside.

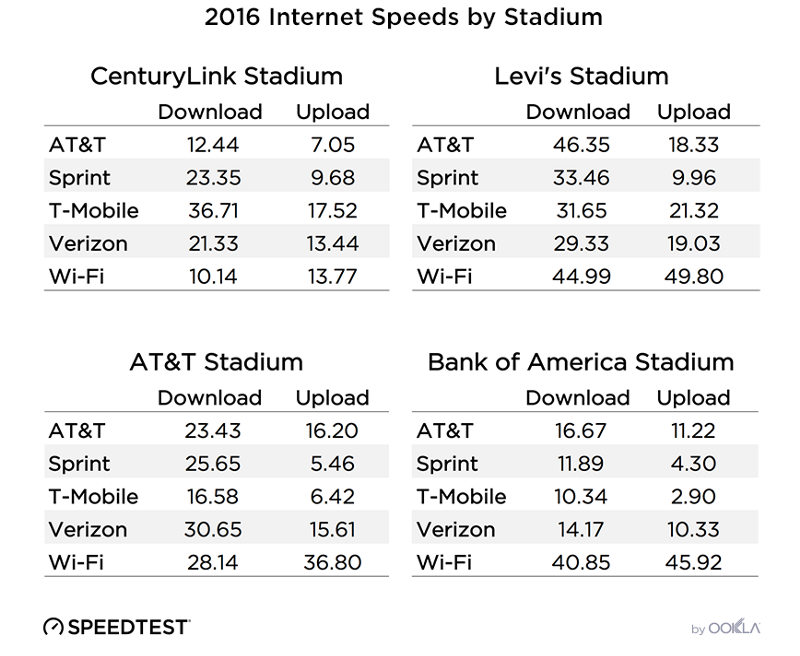
The internet in stadiums is getting faster. We looked at four notable US football stadiums — the Seattle Seahawks’ CenturyLink Stadium, the San Francisco 49ers’ Levi’s Stadium, the Dallas Cowboys’ AT&T Stadium, and the Carolina Panthers’ Bank of America Stadium — and saw that speeds are improving across the board.

Stadiums are getting faster for a couple reasons. First, they’re investing more heavily in technology infrastructure to enhance the in-stadium experience and engagement opportunities for fans. Take San Francisco’s Levi’s Stadium, which was built with 70 miles of Wi-Fi cabling (400 miles total) and 1 Wi-Fi access point for every 100 seats in the bowl for a total of 1,200 access points in the stadium. These infrastructure developments make it easier for fans to access mobile internet at the game from any carrier.

Mobile carriers are also investing in their networks around the stadiums. It wasn’t too long ago that carriers rolled up en masse to the stadium on game day with mobile antenna trucks to help enable mobile internet for their customers. Now, carriers are investing in embedded infrastructure at stadiums and sports arenas.

Verizon is fast at work getting Houston’s NRG Stadium ready to host the 2017 Super Bowl, citing the importance after fans at Super Bowl 50 used nearly 7 terabytes of data. On the college circuit, AT&T installed a Distributed Antenna System (DAS) at Oregon State University’s Reser Stadium to help fans get online. Carriers still have their ups and downs, but continued network investments such as these keep pushing general mobile internet speed trends in a positive direction.

This faster internet benefits everyone by increasing accessibility to existing content and communication mediums as well as opening up new avenues for connection. For instance, faster internet at Levi’s Stadium has led to a smartphone and tablet stadium app that provides digital content like instant replays and directions to bathrooms with the shortest lines. Stadium vendors can also sell concessions via the app and then deliver the items directly to a fan’s seat, helping merchants sell items at the game and decreasing the amount of time fans have to wait in line. As internet speeds continue to improve, it only stands to reason that more solutions to streamline experiences for fans and open up new opportunities for businesses will emerge.

#CrowdSpeed

Next time you’re at a game, concert, festival, or other event share your Speedtest results to social media with #CrowdSpeed. With your help, we are one step closer to better understanding — and improving — internet performance everywhere.

Ookla retains ownership of this article including all of the intellectual property rights, data, content graphs and analysis. This article may not be quoted, reproduced, distributed or published for any commercial purpose without prior consent. Members of the press and others using the findings in this article for non-commercial purposes are welcome to publicly share and link to report information with attribution to Ookla.