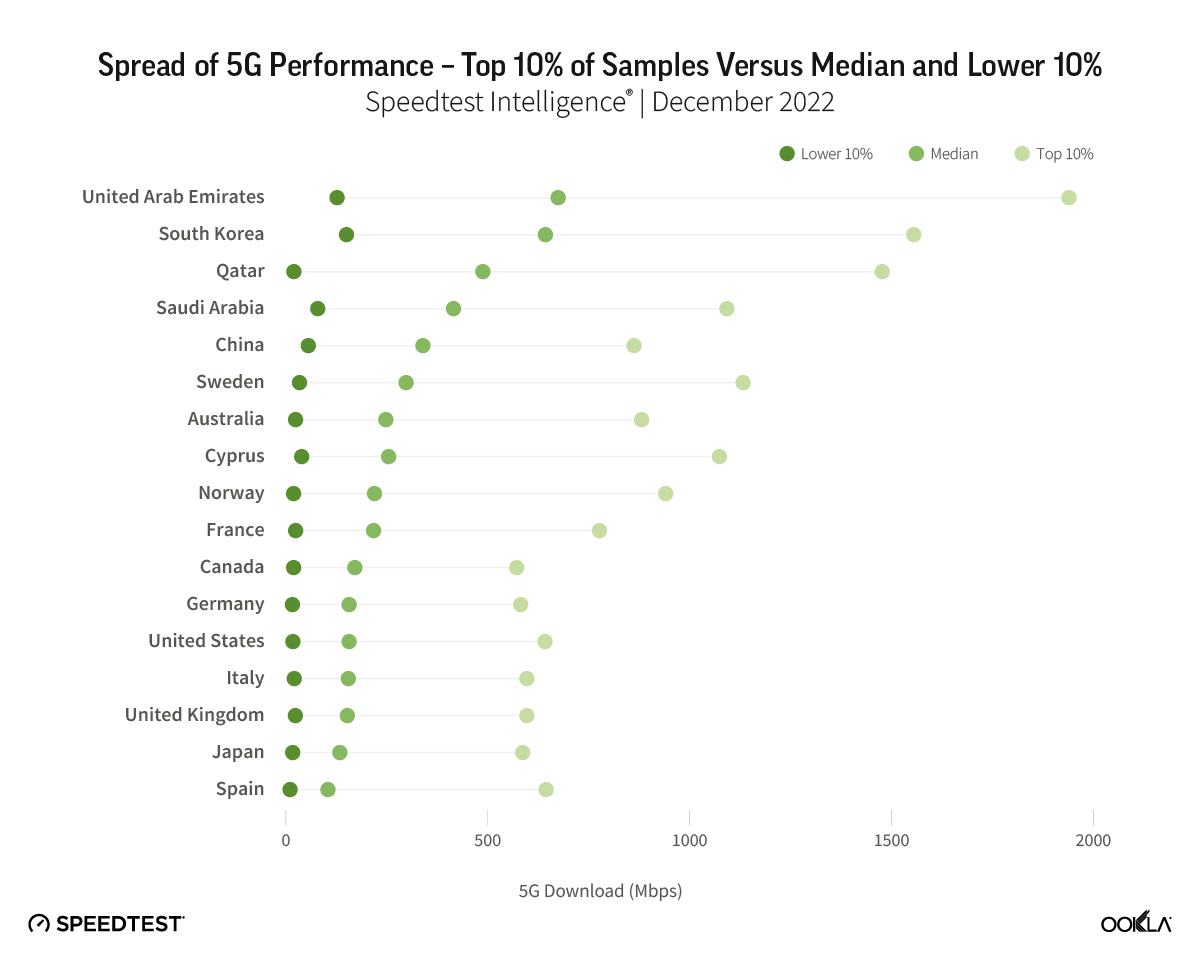
In-market 5G performance varies widely. Reviewing the top 10% and worst 10% of Ookla® Speedtest Intelligence® samples reveals significant variance in the consumer experience on today’s 5G networks, with 5G speeds peaking at over 1 Gbps for the top 10% of users in the U.A.E on average, but falling to below 20 Mbps for the lower 10% in Norway, the U.S., Japan, Germany, and Spain.
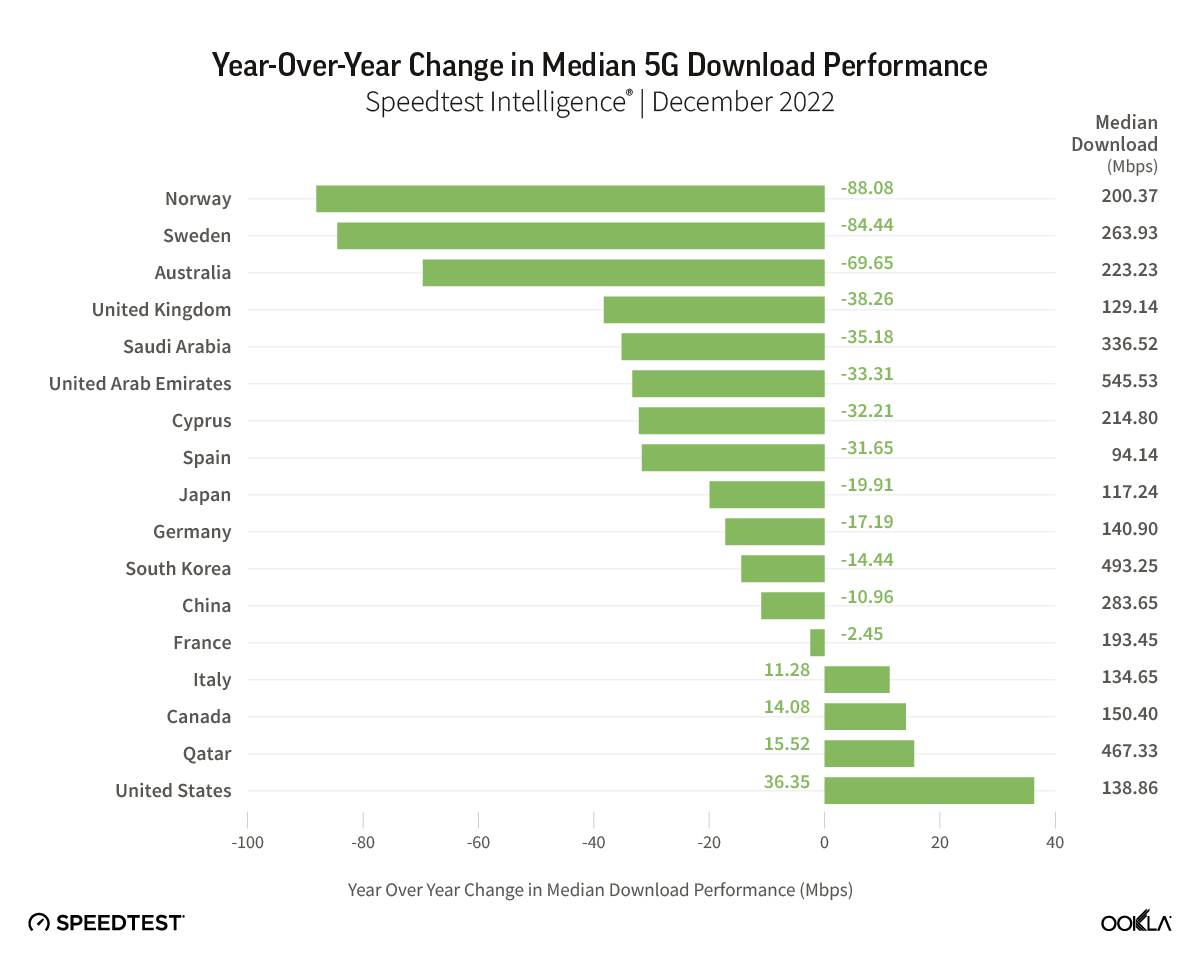
Median 5G performance is declining in many early launch 5G markets. While understandable as 5G adoption grows and users in more remote locations access 5G, declining median download speeds also point to investment and deployment challenges in some markets. At the same time, many of these markets are facing economic headwinds, placing more emphasis than ever on cost control. As a result, operators must carefully balance network investment priorities.
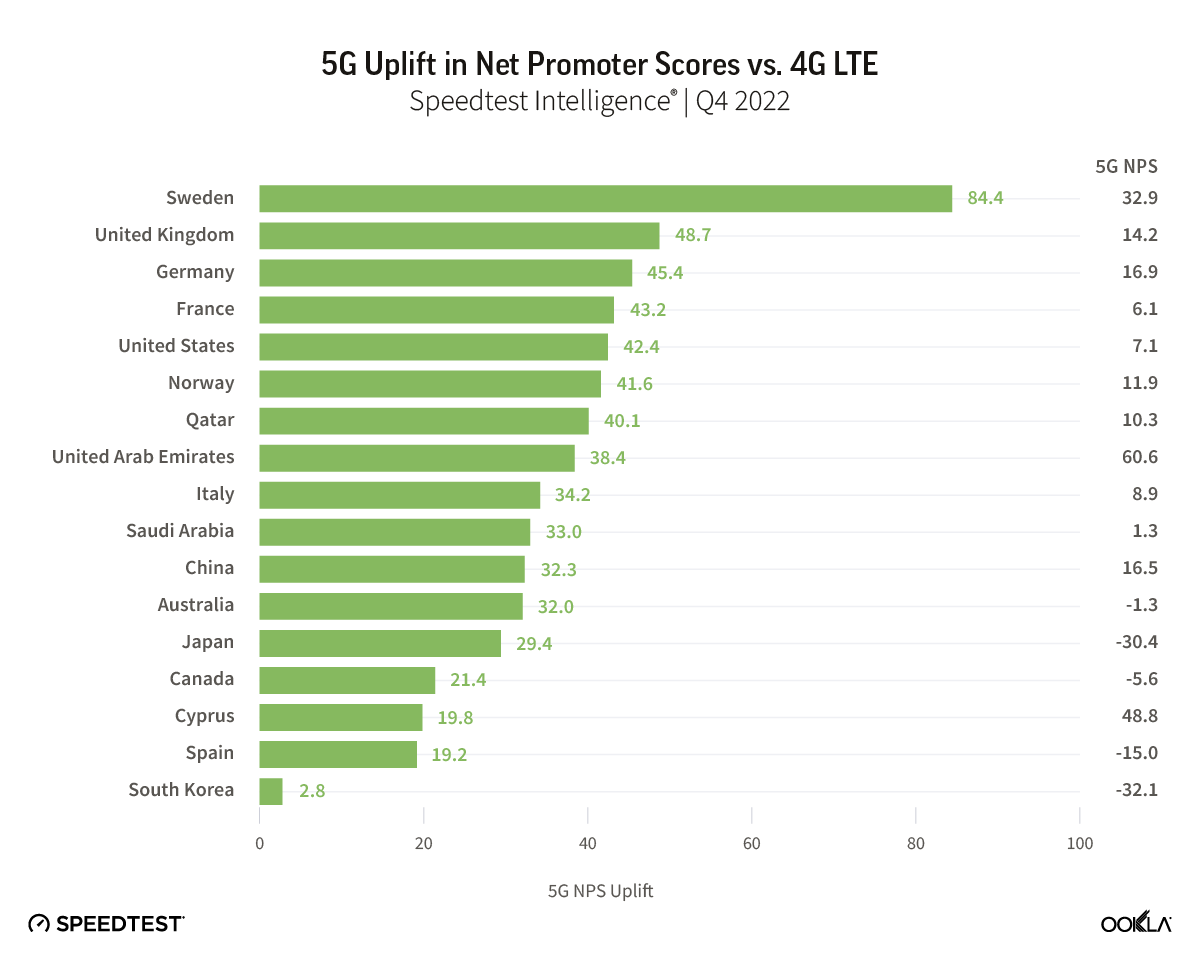
5G Net Promoter Scores (NPS) significantly higher than 4G LTE in most markets, but waning. With the exception of Sweden and Qatar, all the early launch 5G markets in our analysis saw 5G NPS fall year-over-year. Operators’ 5G NPS still trade at a premium compared to 4G, and while performance is just one part of the equation, operators should take care to build on the positive sentiment that 5G has brought to date.
Despite impressive headline speeds, 5G performance varies a lot
Median 5G performance allows us to gauge the midpoint of user experience on 5G networks, however it doesn’t paint the full picture. While headline 5G speeds impress, Speedtest Intelligence data lays bare the ups and downs of 5G performance for consumers, even in early launch, advanced 5G markets. We recently looked at 5G network performance over high frequency (mmW) bands, painting a view of the true potential of 5G networks. However, if we look at performance on today’s 5G networks, looking beyond the median at the range of performance between users in the top 10% and those in the lower 10%, Speedtest Intelligence data reveals huge variance in the performance users experience.
The U.A.E. was the fastest 5G market in our analysis, based on median download performance of 545.53 Mbps in December 2022, followed by South Korea and Qatar. However, the top 10% of users in the U.A.E. recorded speeds of at least 1,266.49 Mbps on average, while the lowest 10% of users experienced speeds of 127.52 Mbps or slower on average. At the other end of the scale, Spain recorded a median 5G speed of 94.14 Mbps, but also demonstrated wide variance between the top 10% of samples at 537.95 Mbps or faster and the lowest 10% with 10.67 Mbps or less.
Based on many of the marketing messages around 5G, consumers are led to expect a big bang change in performance. However, with 5G operating over a greater range of spectrum bands than previous generations, including high frequency spectrum which has relatively poorer propagation, it’s understandable that 5G performance will vary more than previous generations of mobile network technology.
5G markets set to face performance challenges during 2023
While globally 5G speeds have remained stable, for many of the markets in our analysis, median 5G download speeds have fallen over the past year. The U.S. was the main outlier, recording the strongest uplift in 5G performance as T-Mobile continued to drive home its performance advantage in the market, while Verizon’s performance improved early in 2022 through its deployment of 5G in C-band spectrum. This trend is likely to continue in 2023 in the U.S., as more C-band spectrum is made available. However, the picture remains concerning for a number of other 5G markets, particularly those where median 5G speeds are at the lower end of the spectrum.
In some markets, 5G was initially priced at a premium to 4G, with operators focused on driving incremental returns on the new network technology. However, operators have been increasingly opening up 5G access by removing incremental costs for consumers and adding prepaid plans too. As 5G adoption scales, it places more strain on the new networks. The challenge for many of these markets is that network performance is likely to degrade further unless network densification picks up.
For network operators, this investment imperative is occuring amidst macroeconomic headwinds, which are driving up operating costs and putting pressure on consumer and enterprise spend. In addition, there remain challenges in deploying additional 5G cell sites in dense urban areas where demand is strongest, while in some markets EMF limits and other regulations can limit the deployment of high-capacity 5G sites.
Net Promoter Score (NPS) from Speedtest Intelligence paints a largely positive picture of current 5G networks. NPS is a key performance indicator of customer experience, categorizing users into Detractors (score 0-6), Passives (score 7-8), and Promoters (score 9-10), with the NPS representing the percentage of Promoters minus the percent of Detractors, displayed in the range from -100 to 100. Across the markets we analyzed, 5G users on average rated their network operator with NPS scores that were universally higher than those for 4G LTE users. However, consumer sentiment for users on 5G networks is beginning to shift, with NPS scores falling, coinciding with lower median 5G performance in many of the markets we analyzed.
Declining performance levels will be a factor driving NPS down for some 5G users. It’s also important to remember that as 5G scales in many of these early launch markets, the profile of 5G users is also changing from predominantly urban-based users, to more of a mix of urban, suburban, and rural users, which brings additional coverage and performance challenges for network operators. We plan to examine the relationship between 5G performance and spectrum in an up-coming content piece. Please get in touch if you’d like to learn more about Speedtest Intelligence data.
Ookla retains ownership of this article including all of the intellectual property rights, data, content graphs and analysis. This article may not be quoted, reproduced, distributed or published for any commercial purpose without prior consent. Members of the press and others using the findings in this article for non-commercial purposes are welcome to publicly share and link to report information with attribution to Ookla.
5G continues to offer new and exciting ways of rethinking everything from streaming video to performing remote surgery. However, not everyone shares equally in these possibilities as many countries do not have access to 5G and even those that do, do not experience the same level of performance from their 5G connections. We examined Speedtest Intelligence® data from Q3 2021 Speedtest® results to see how 5G speeds have changed, where download speeds are the fastest at the country and capital level, where 5G deployments have increased and what worldwide 5G Availability looked like in Q3 2021. We also looked at countries that don’t yet have 5G to understand where consumers are seeing improvements in 4G access.
5G slowed down at the global level
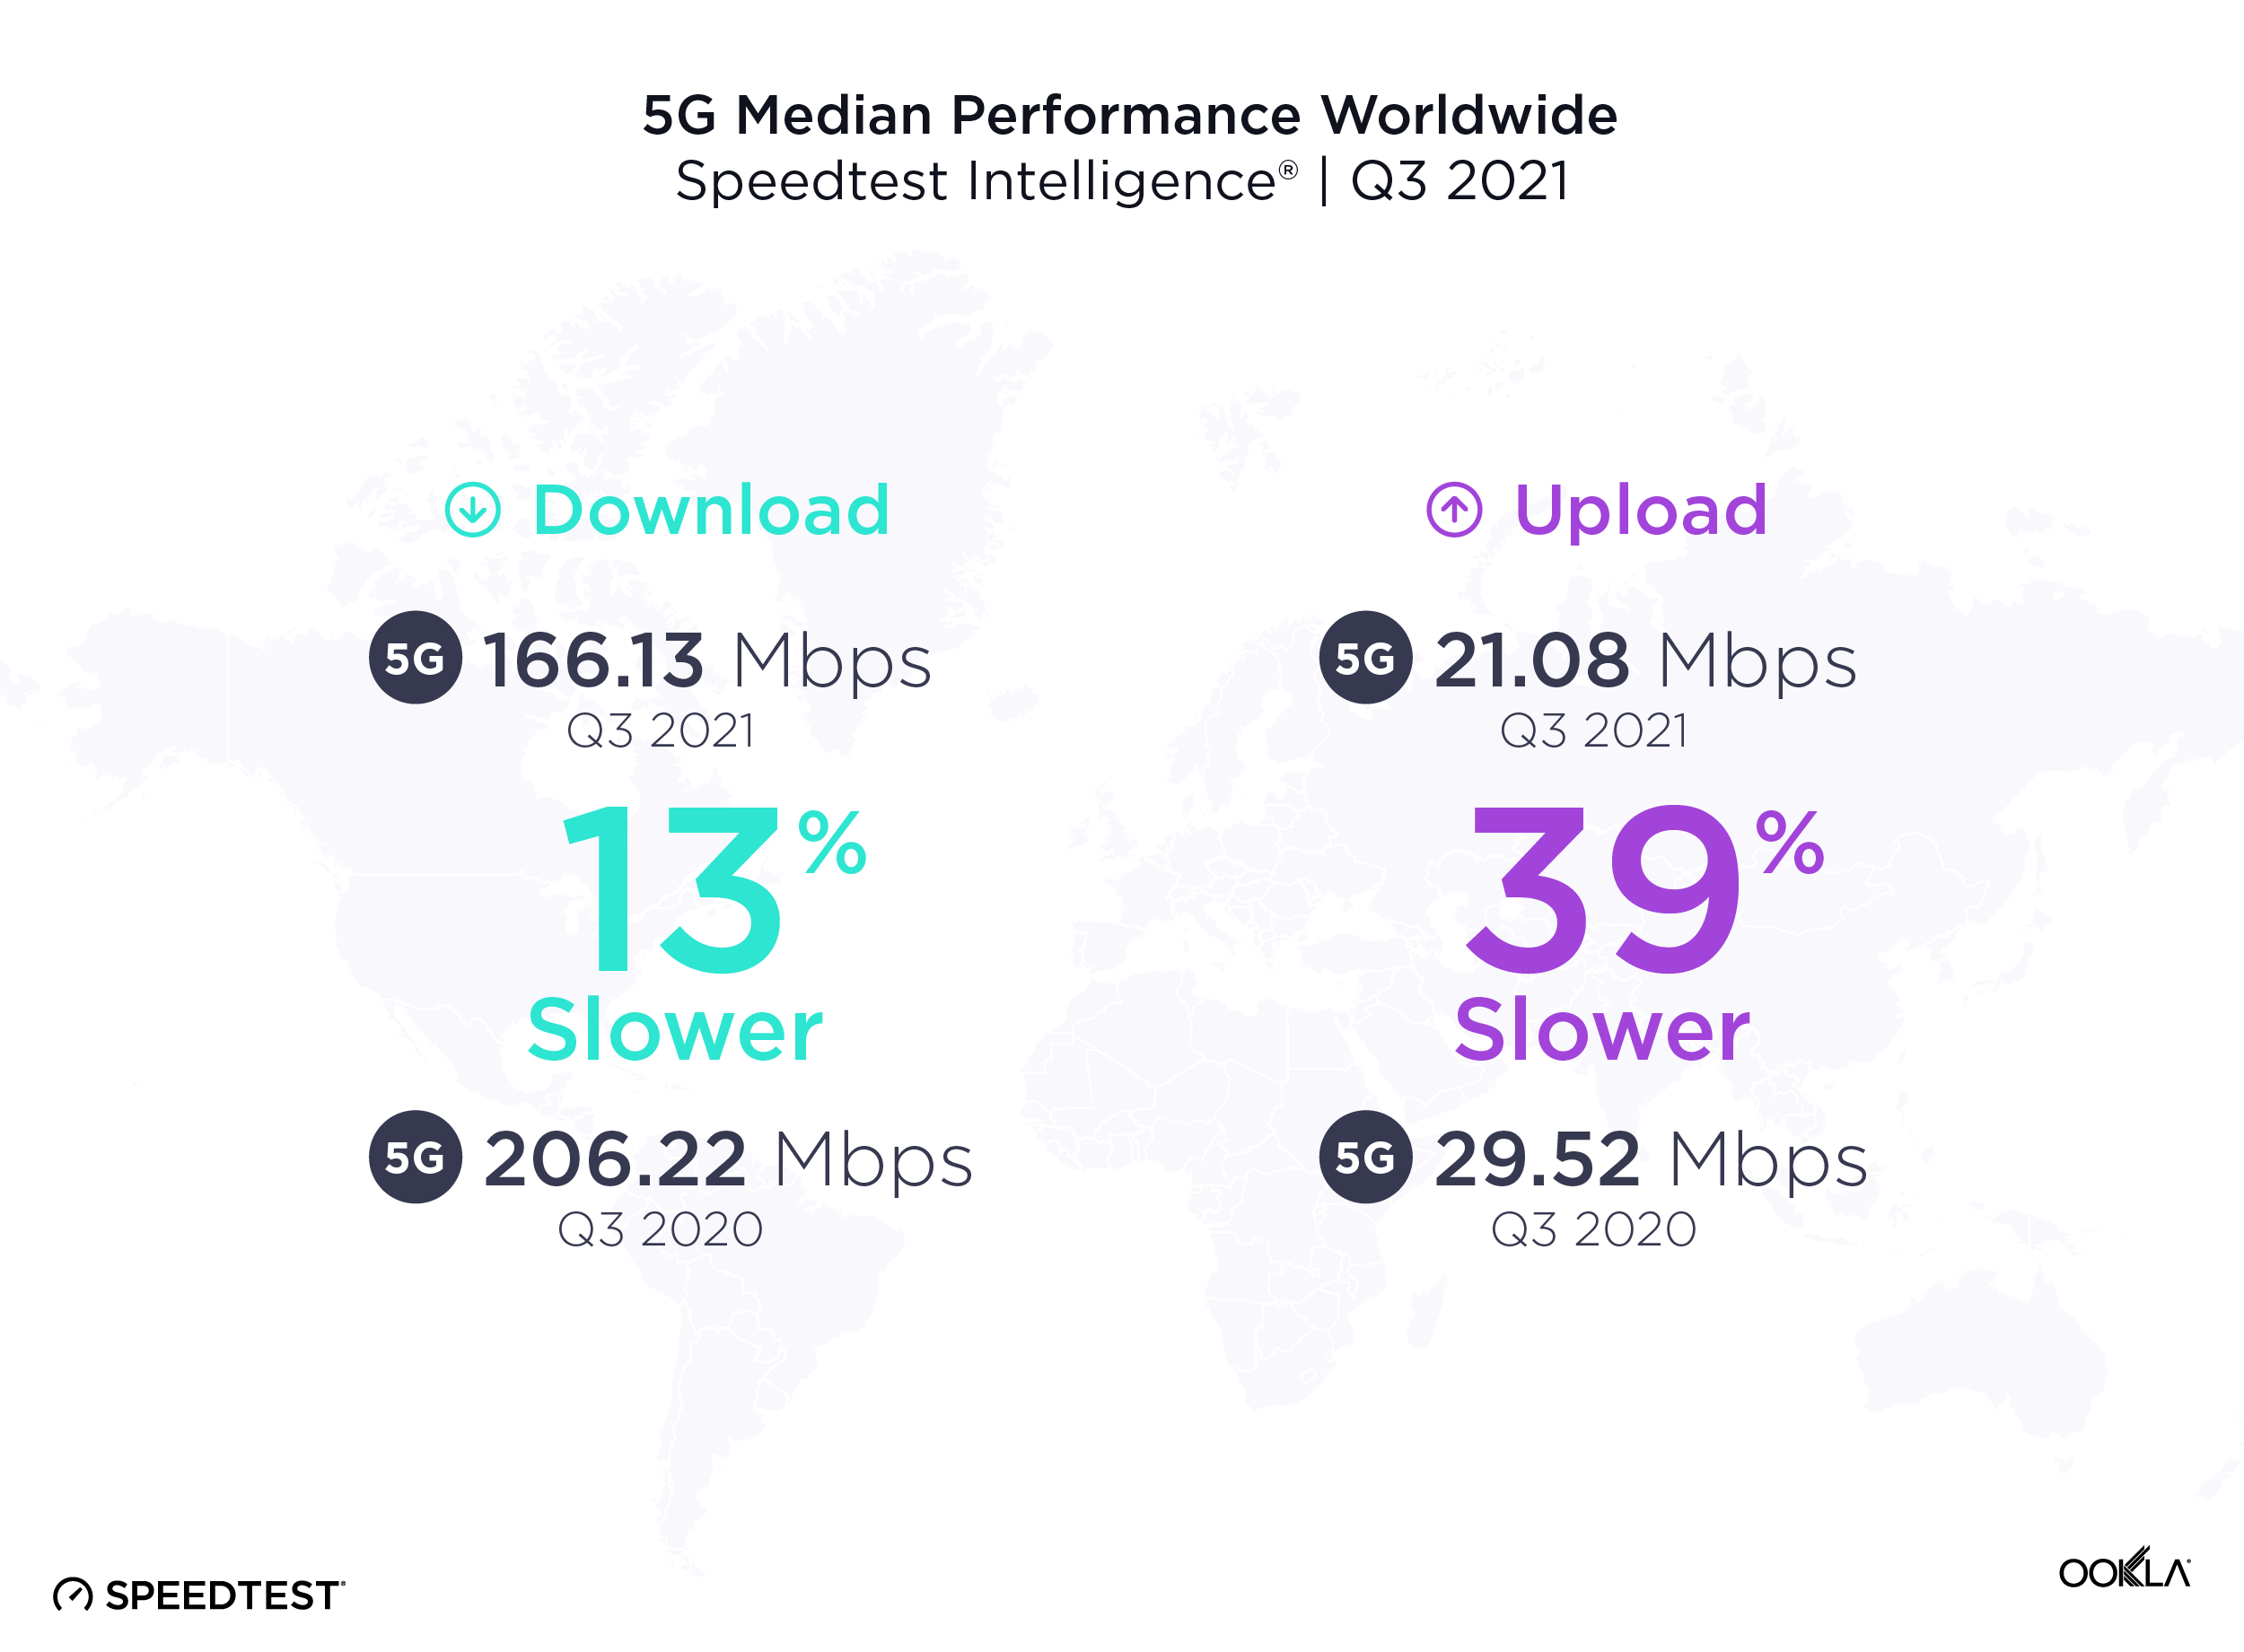
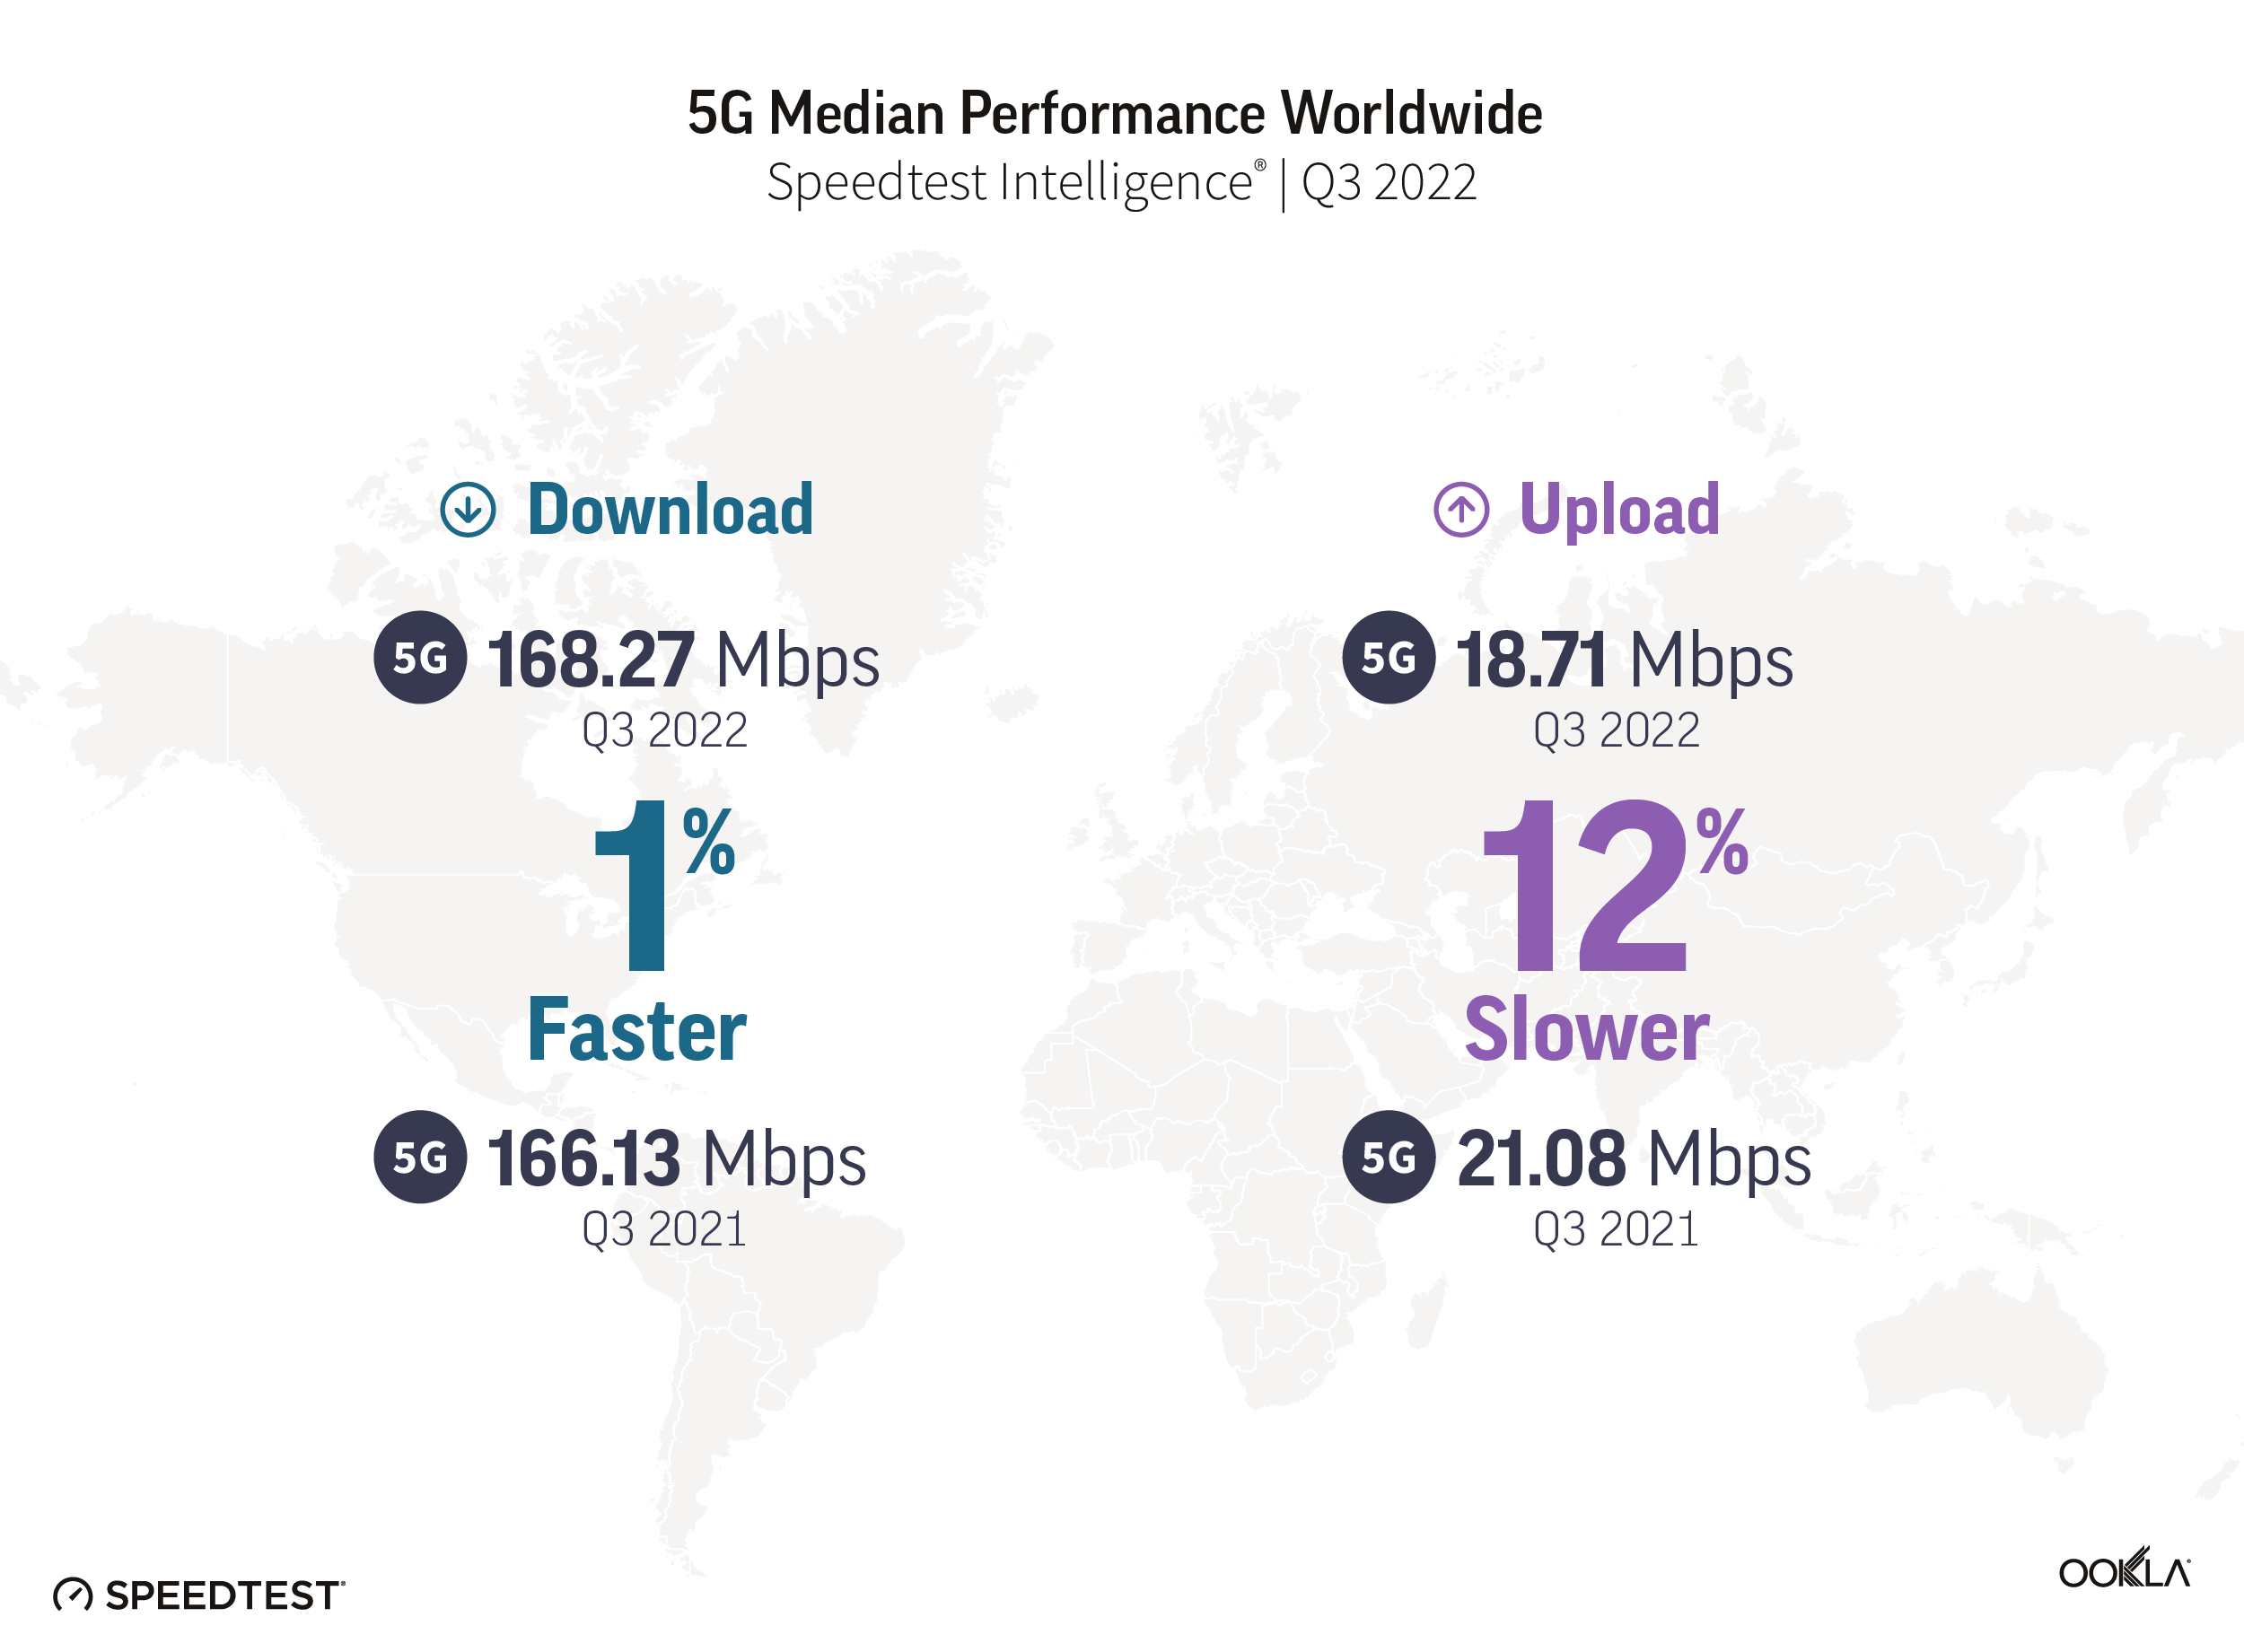
It’s common to see new mobile access technologies slow down as adoption scales, particularly early on in the tech cycle. Over the past year from Q3 2020 to Q3 2021, the median global 5G download speed fell to 166.13 Mbps, down from 206.22 Mbps in Q3 2020. Median upload speed over 5G also slowed to 21.08 Mbps (from 29.52 Mbps) during the same period.
More users are logging on to existing 5G networks, and we’re also at the stage in the evolution of 5G where countries that have historically had slower speeds are starting to offer 5G. In addition, the widespread use of dynamic spectrum sharing that has been used to boost early 5G coverage weighs on 5G download speeds. While the dip in speeds looks like a letdown, it’s more of a compromise to enable broader access. With additional spectrum and further deployments slated for 2022, we anticipate speeds will begin to pick up again.
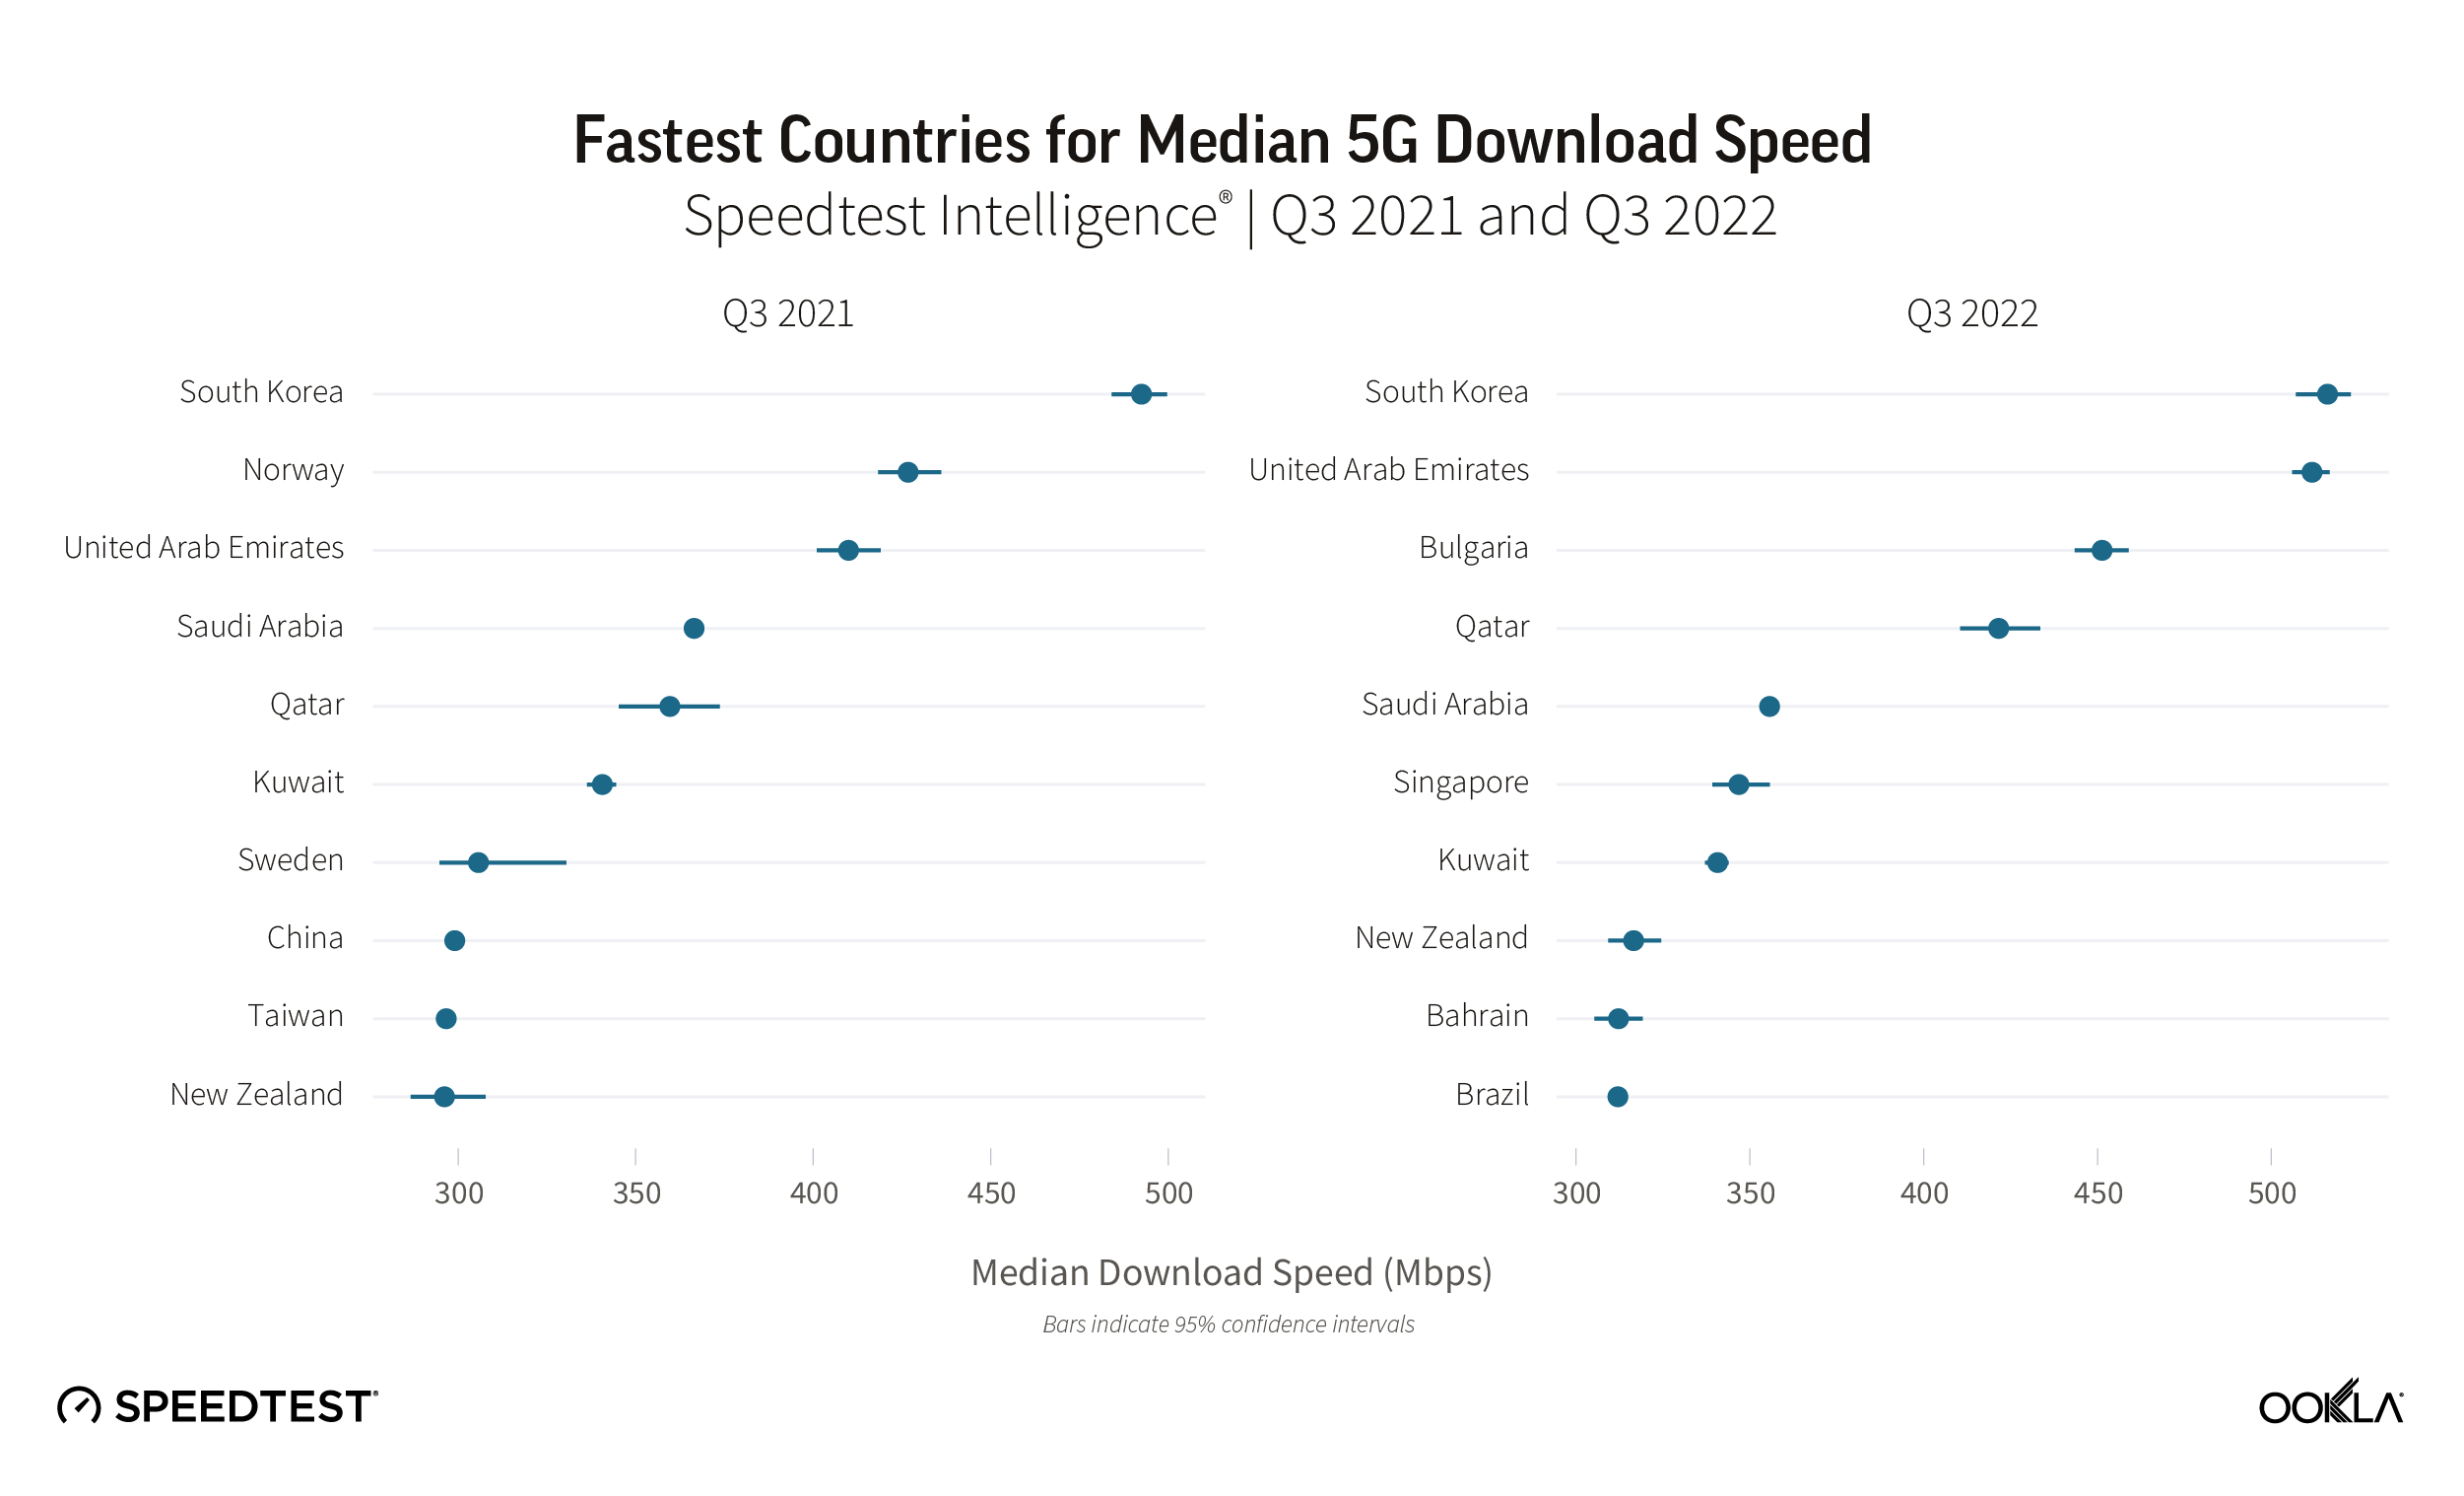
South Korea had the fastest 5G in the world
South Korea had the fastest median download speed over 5G during Q3 2021, leading a top 10 list that included Norway, United Arab Emirates, Saudi Arabia, Qatar, Kuwait, Sweden, China, Taiwan and New Zealand. Sweden, China, Taiwan and New Zealand were new to the top 10 in 2021 while South Africa (whose 5G was brand new last year), Spain and Hungary fell out of the top 10.
5G expanded to 13 additional countries
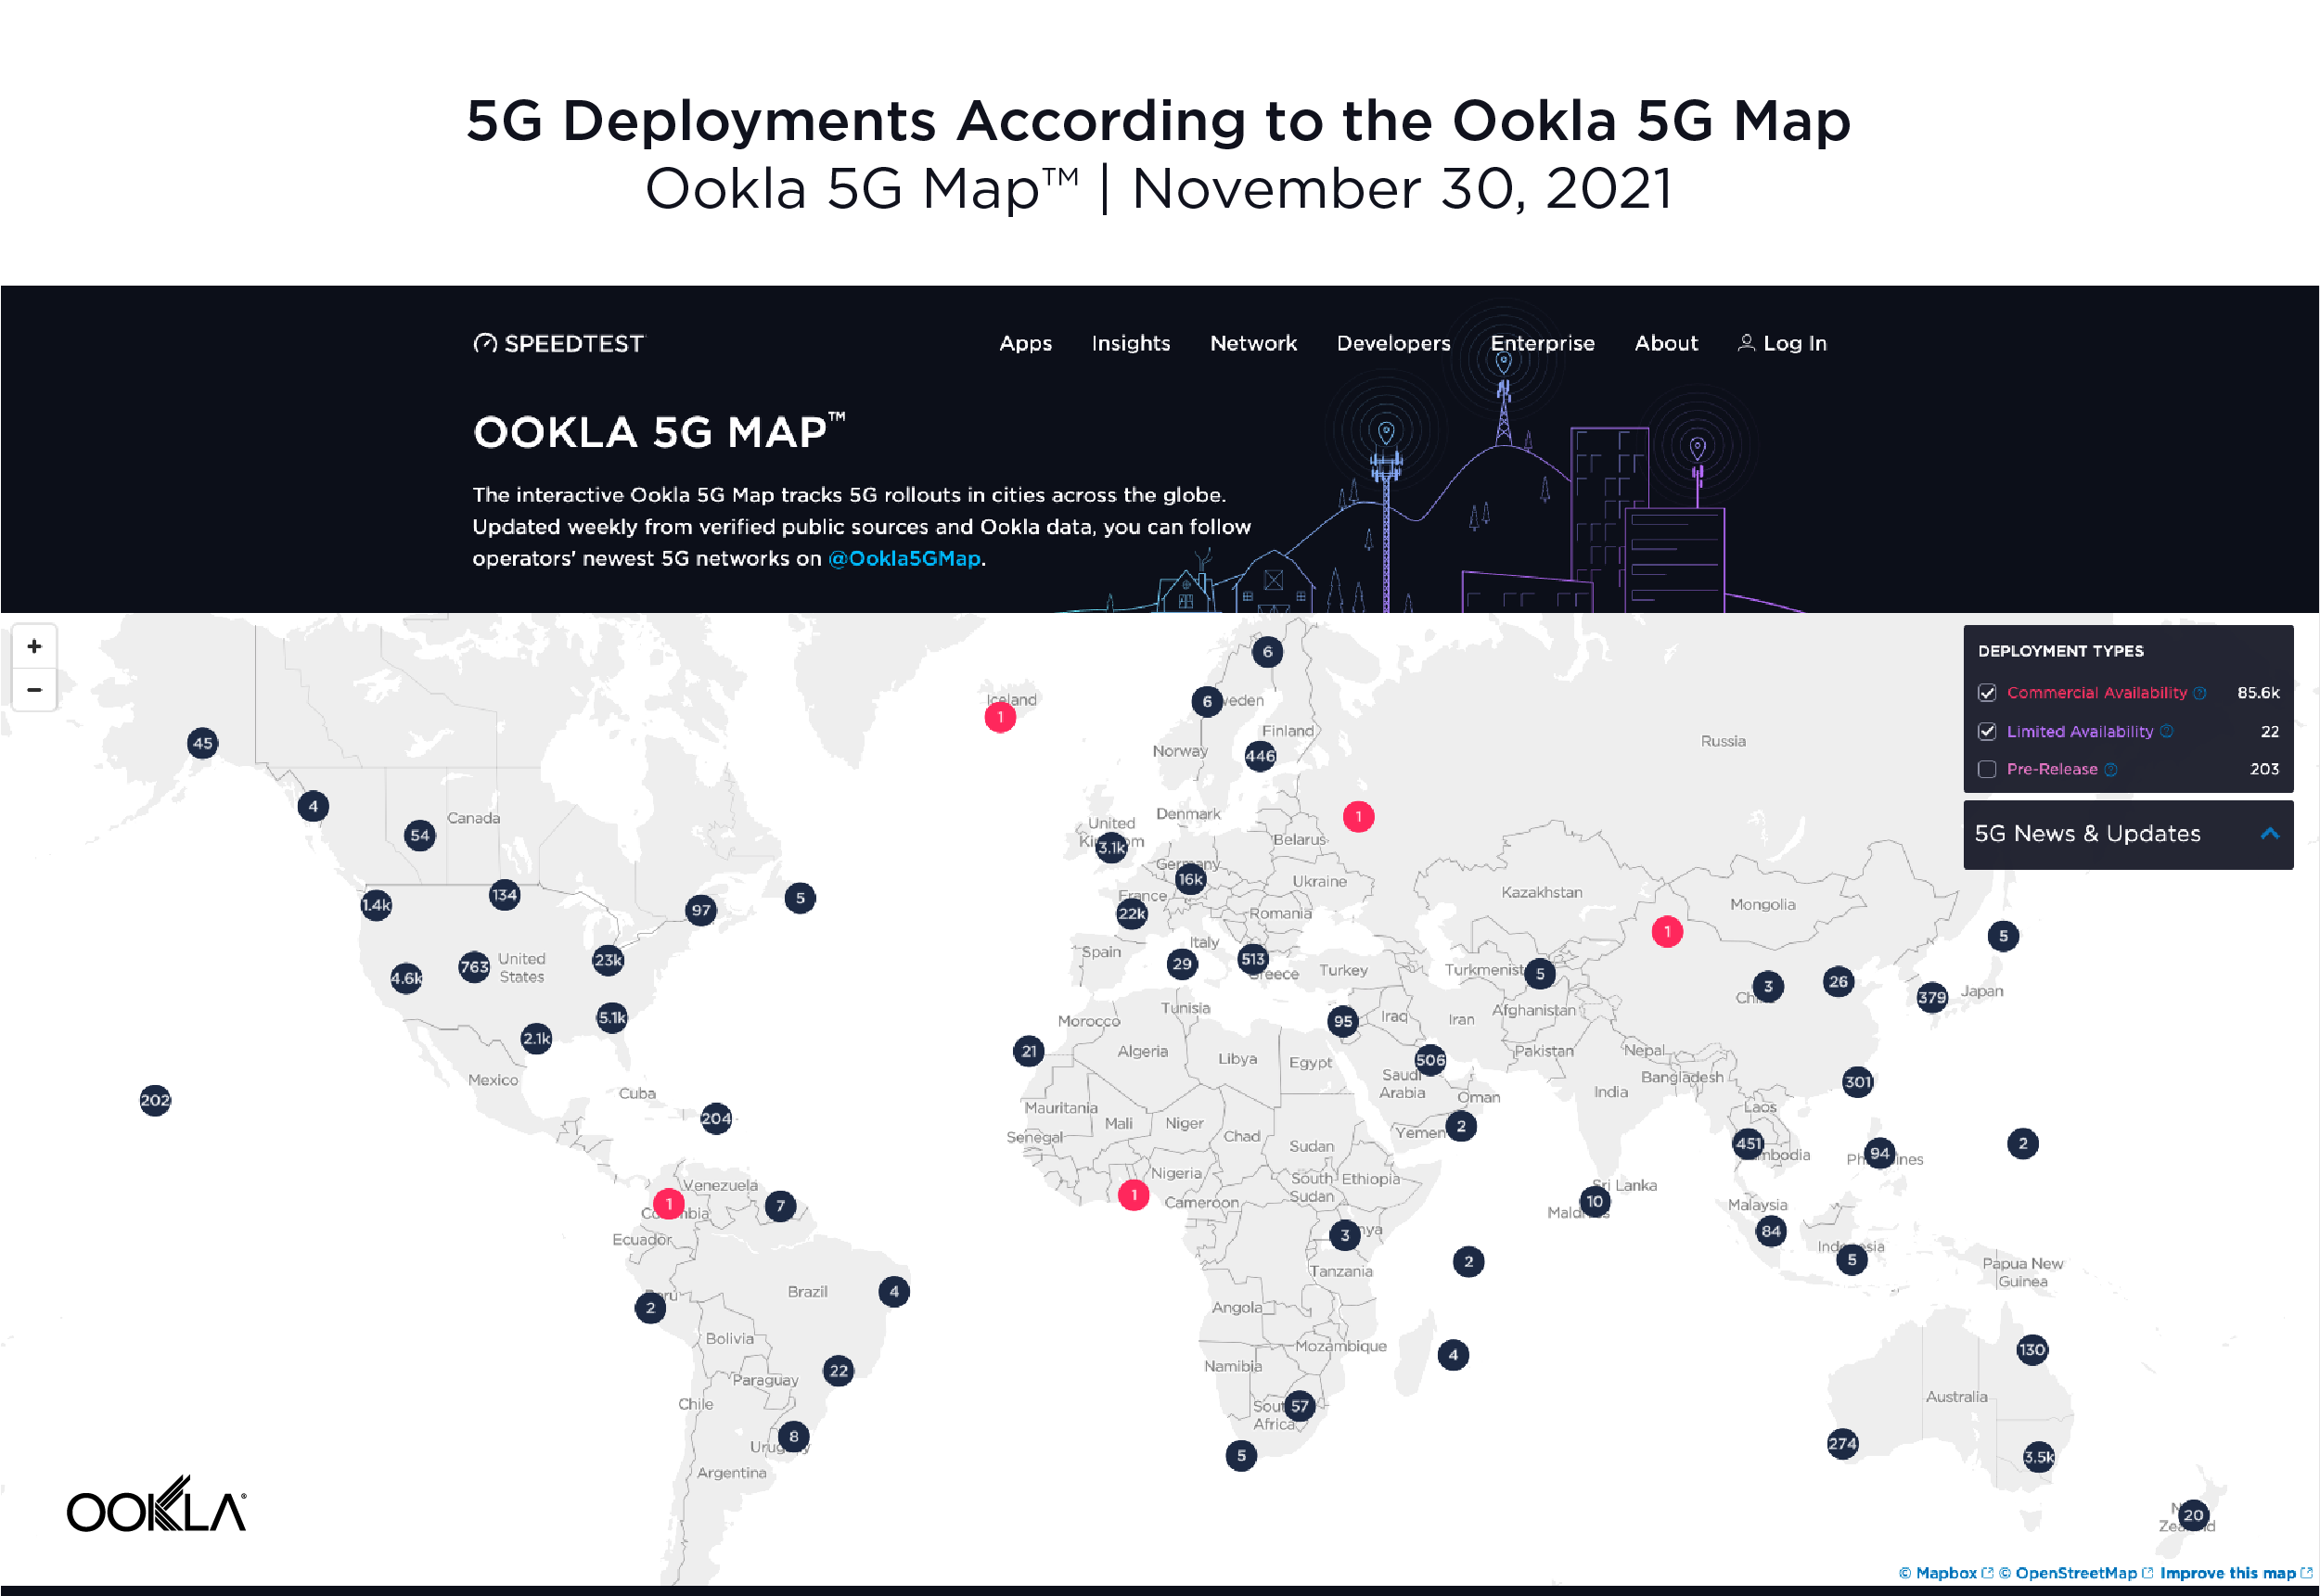
According to the Ookla® 5G Map™, there were 5G deployments in 112 countries as of November 30, 2021. That’s up from 99 countries on the same date a year ago. The total number of deployments increased dramatically during the same time period with 85,602 deployments on November 30, 2021 compared to 17,428 on November 30, 2020, highlighting the degree to which 5G networks scaled during the year. Note that there are often multiple deployments in a given city.
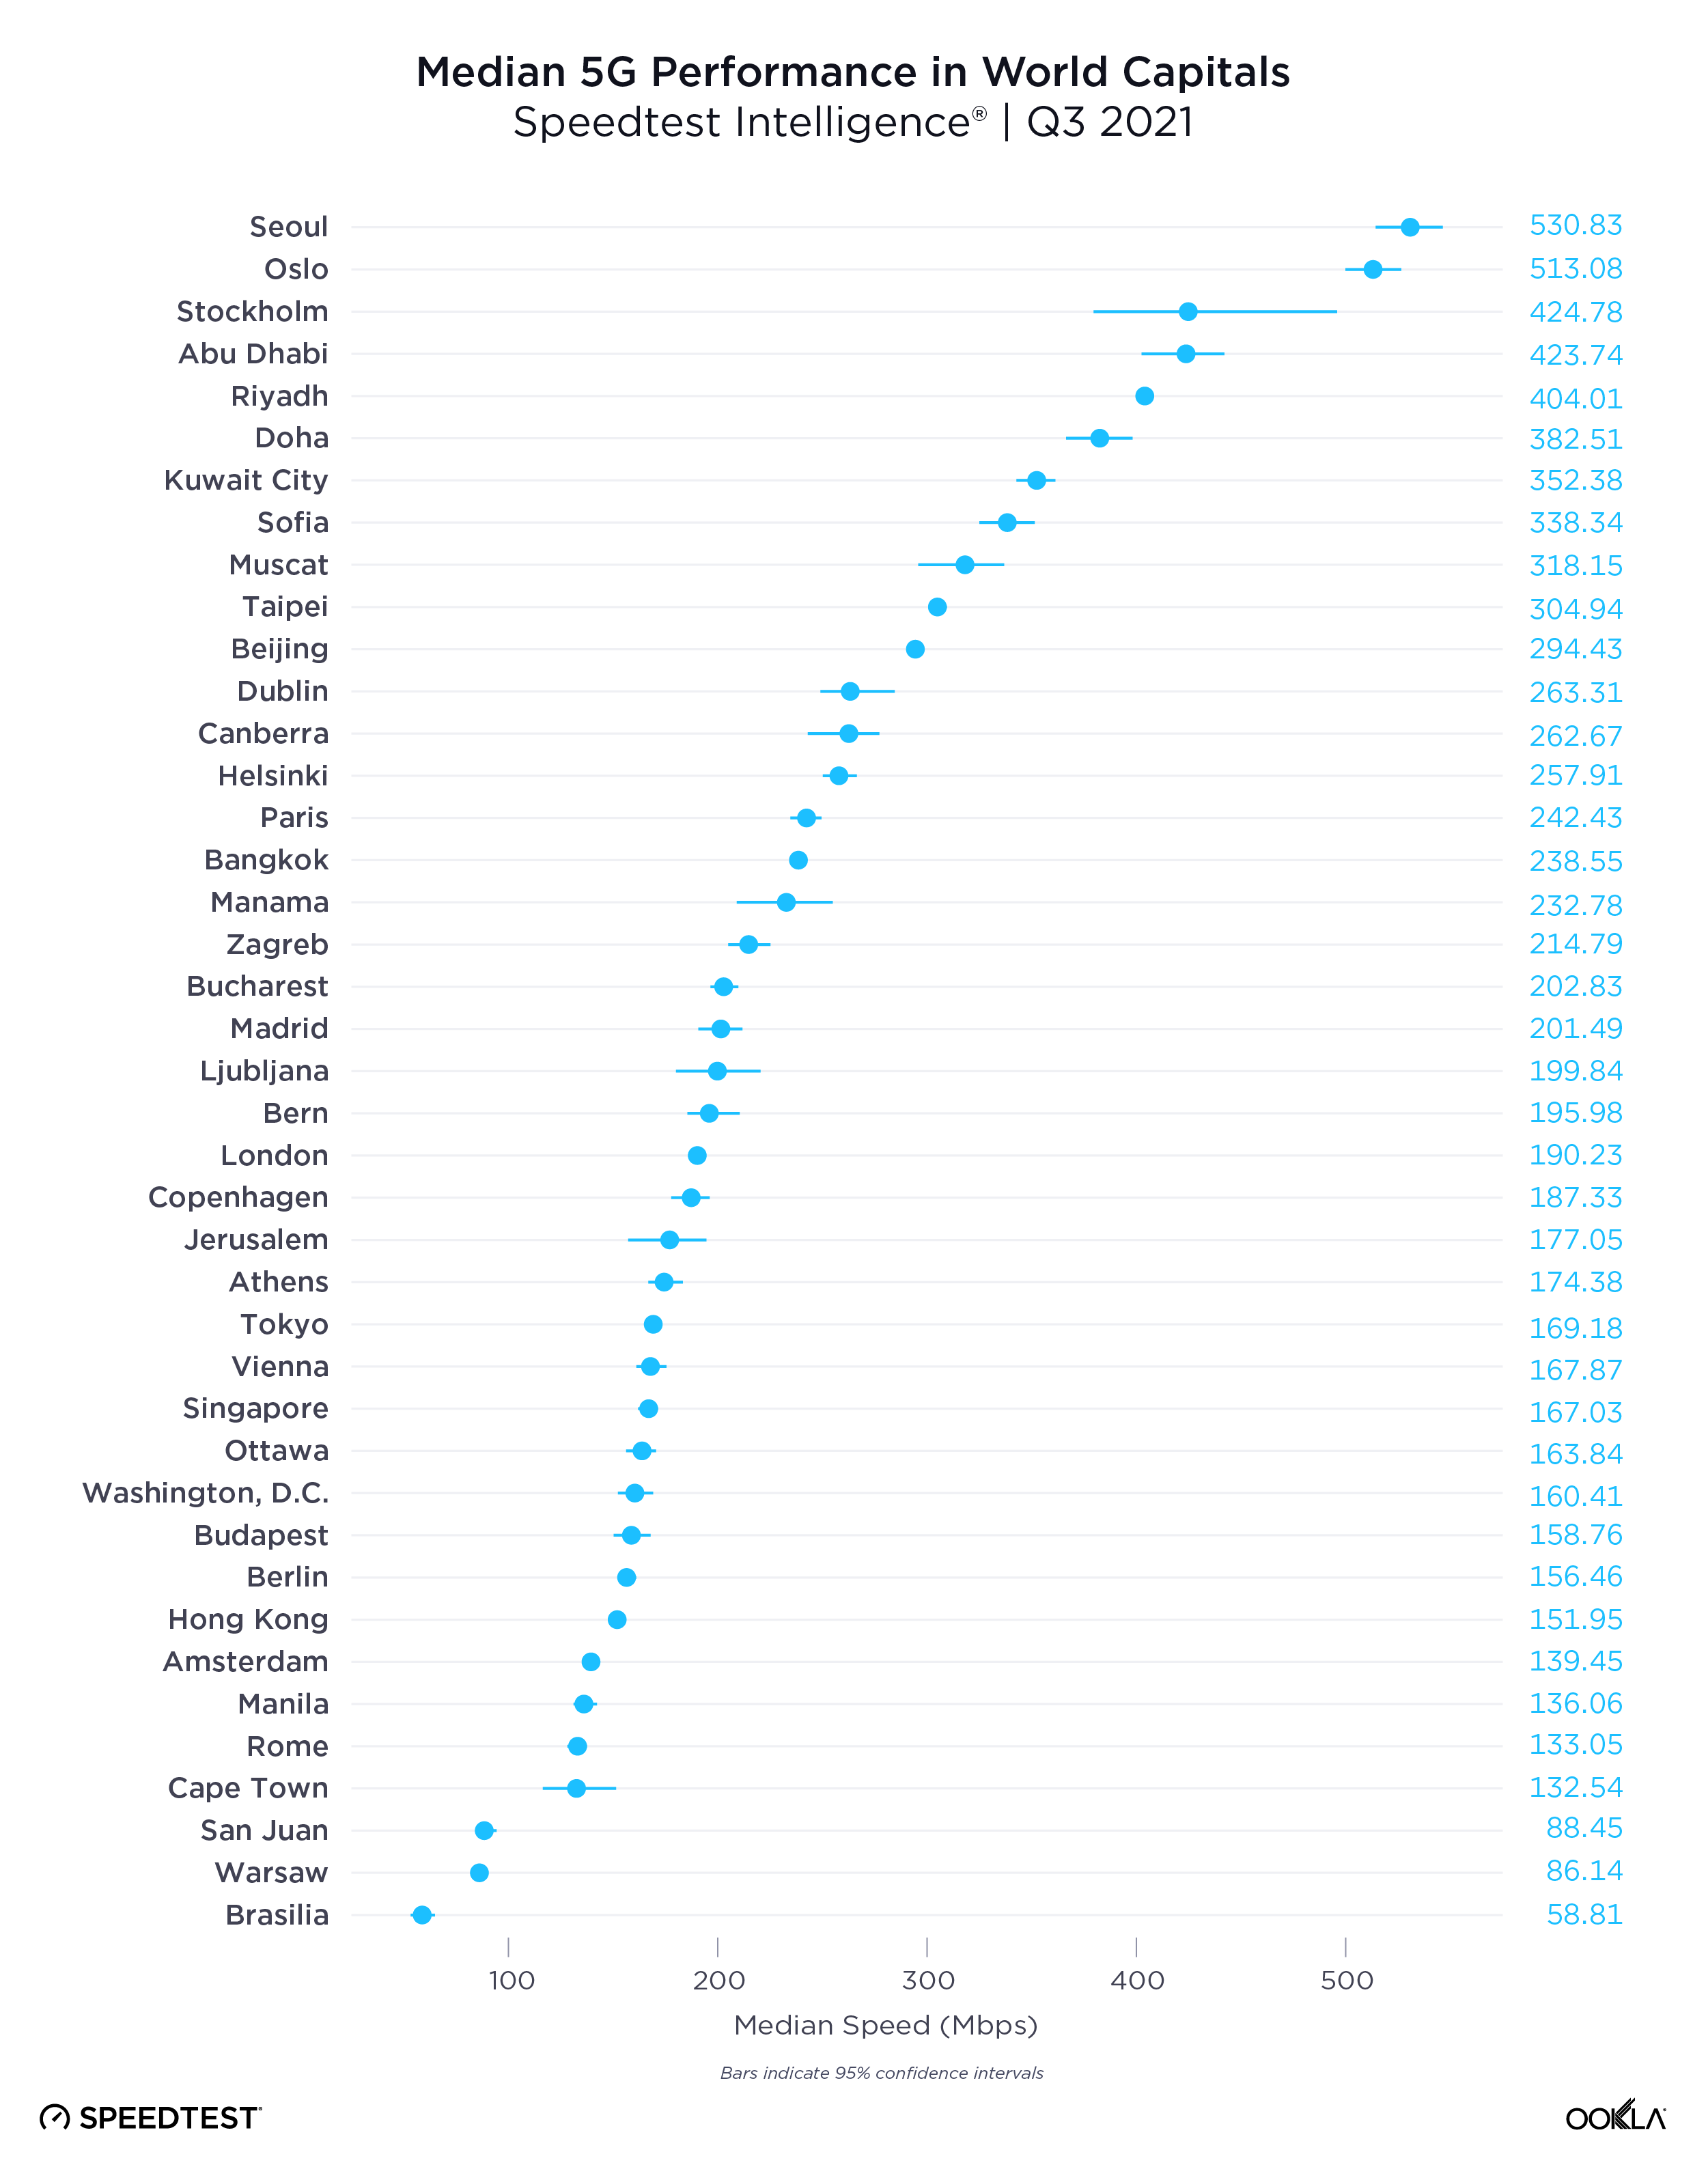
Seoul and Oslo lead world capitals for 5G
Speedtest Intelligence data from Q3 2021 shows a wide range of median 5G speeds among global capitals. Seoul, South Korea and Oslo, Norway were in the lead with 530.83 Mbps and 513.08 Mbps, respectively; Abu Dhabi, United Arab Emirates; Riyadh, Saudi Arabia and Doha Qatar followed. Brasilia, Brazil had the slowest median download speed over 5G on our list, followed by Warsaw, Poland; Cape Town, South Africa and Rome, Italy. Stockholm, Sweden and Oslo, Norway had some of the the fastest median upload speeds over 5G at 56.26 Mbps and 49.95 Mbps, respectively, while Cape Town had the slowest at 14.53 Mbps.
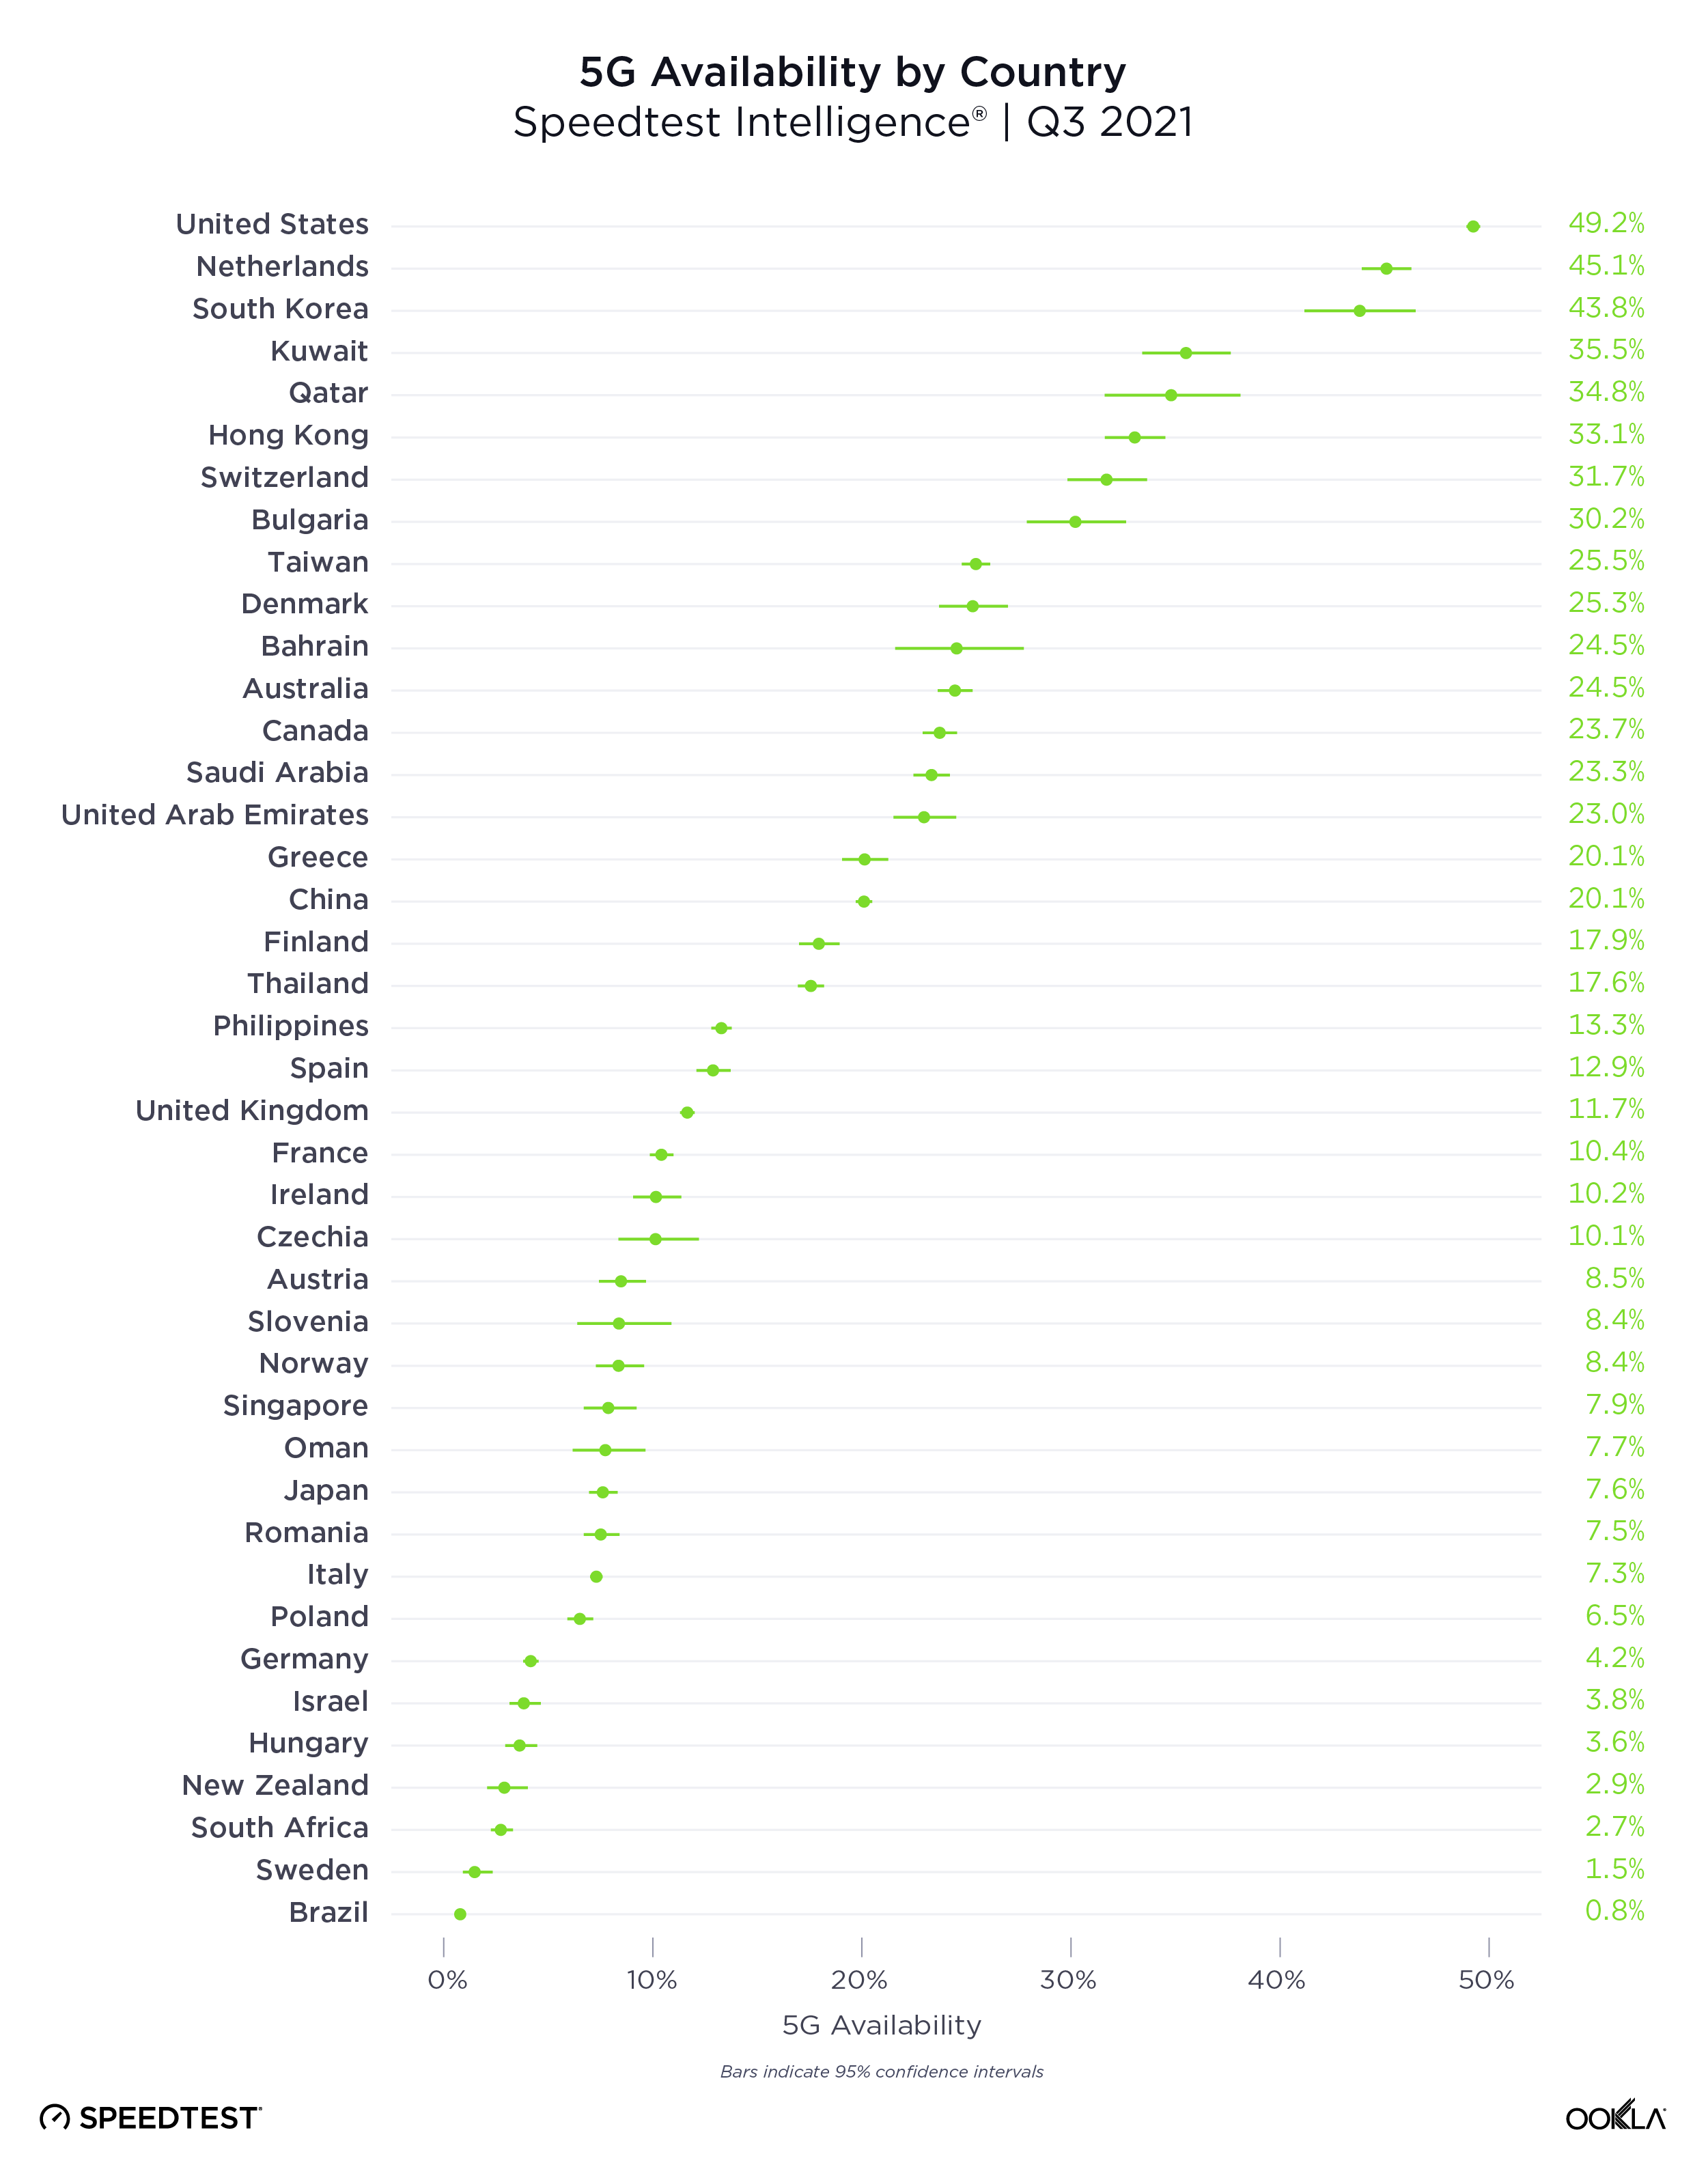
The U.S. had the highest 5G Availability
The presence of 5G is only one indicator in a market, because even in markets where 5G has launched, coverage and adoption can be pretty low. We analyzed 5G Availability to see what percent of users on 5G-capable devices spent the majority of their time on 5G, both roaming and on-network during Q3 2021.
The United States had the highest 5G Availability at 49.2%, followed by the Netherlands (45.1%), South Korea (43.8%), Kuwait (35.5%) and Qatar (34.8%). Brazil had the lowest 5G Availability on our list at 0.8%, followed by Sweden (1.5%), South Africa (2.7%), New Zealand (2.9%) and Hungary (3.6%).
Not all 5G networks are created equal
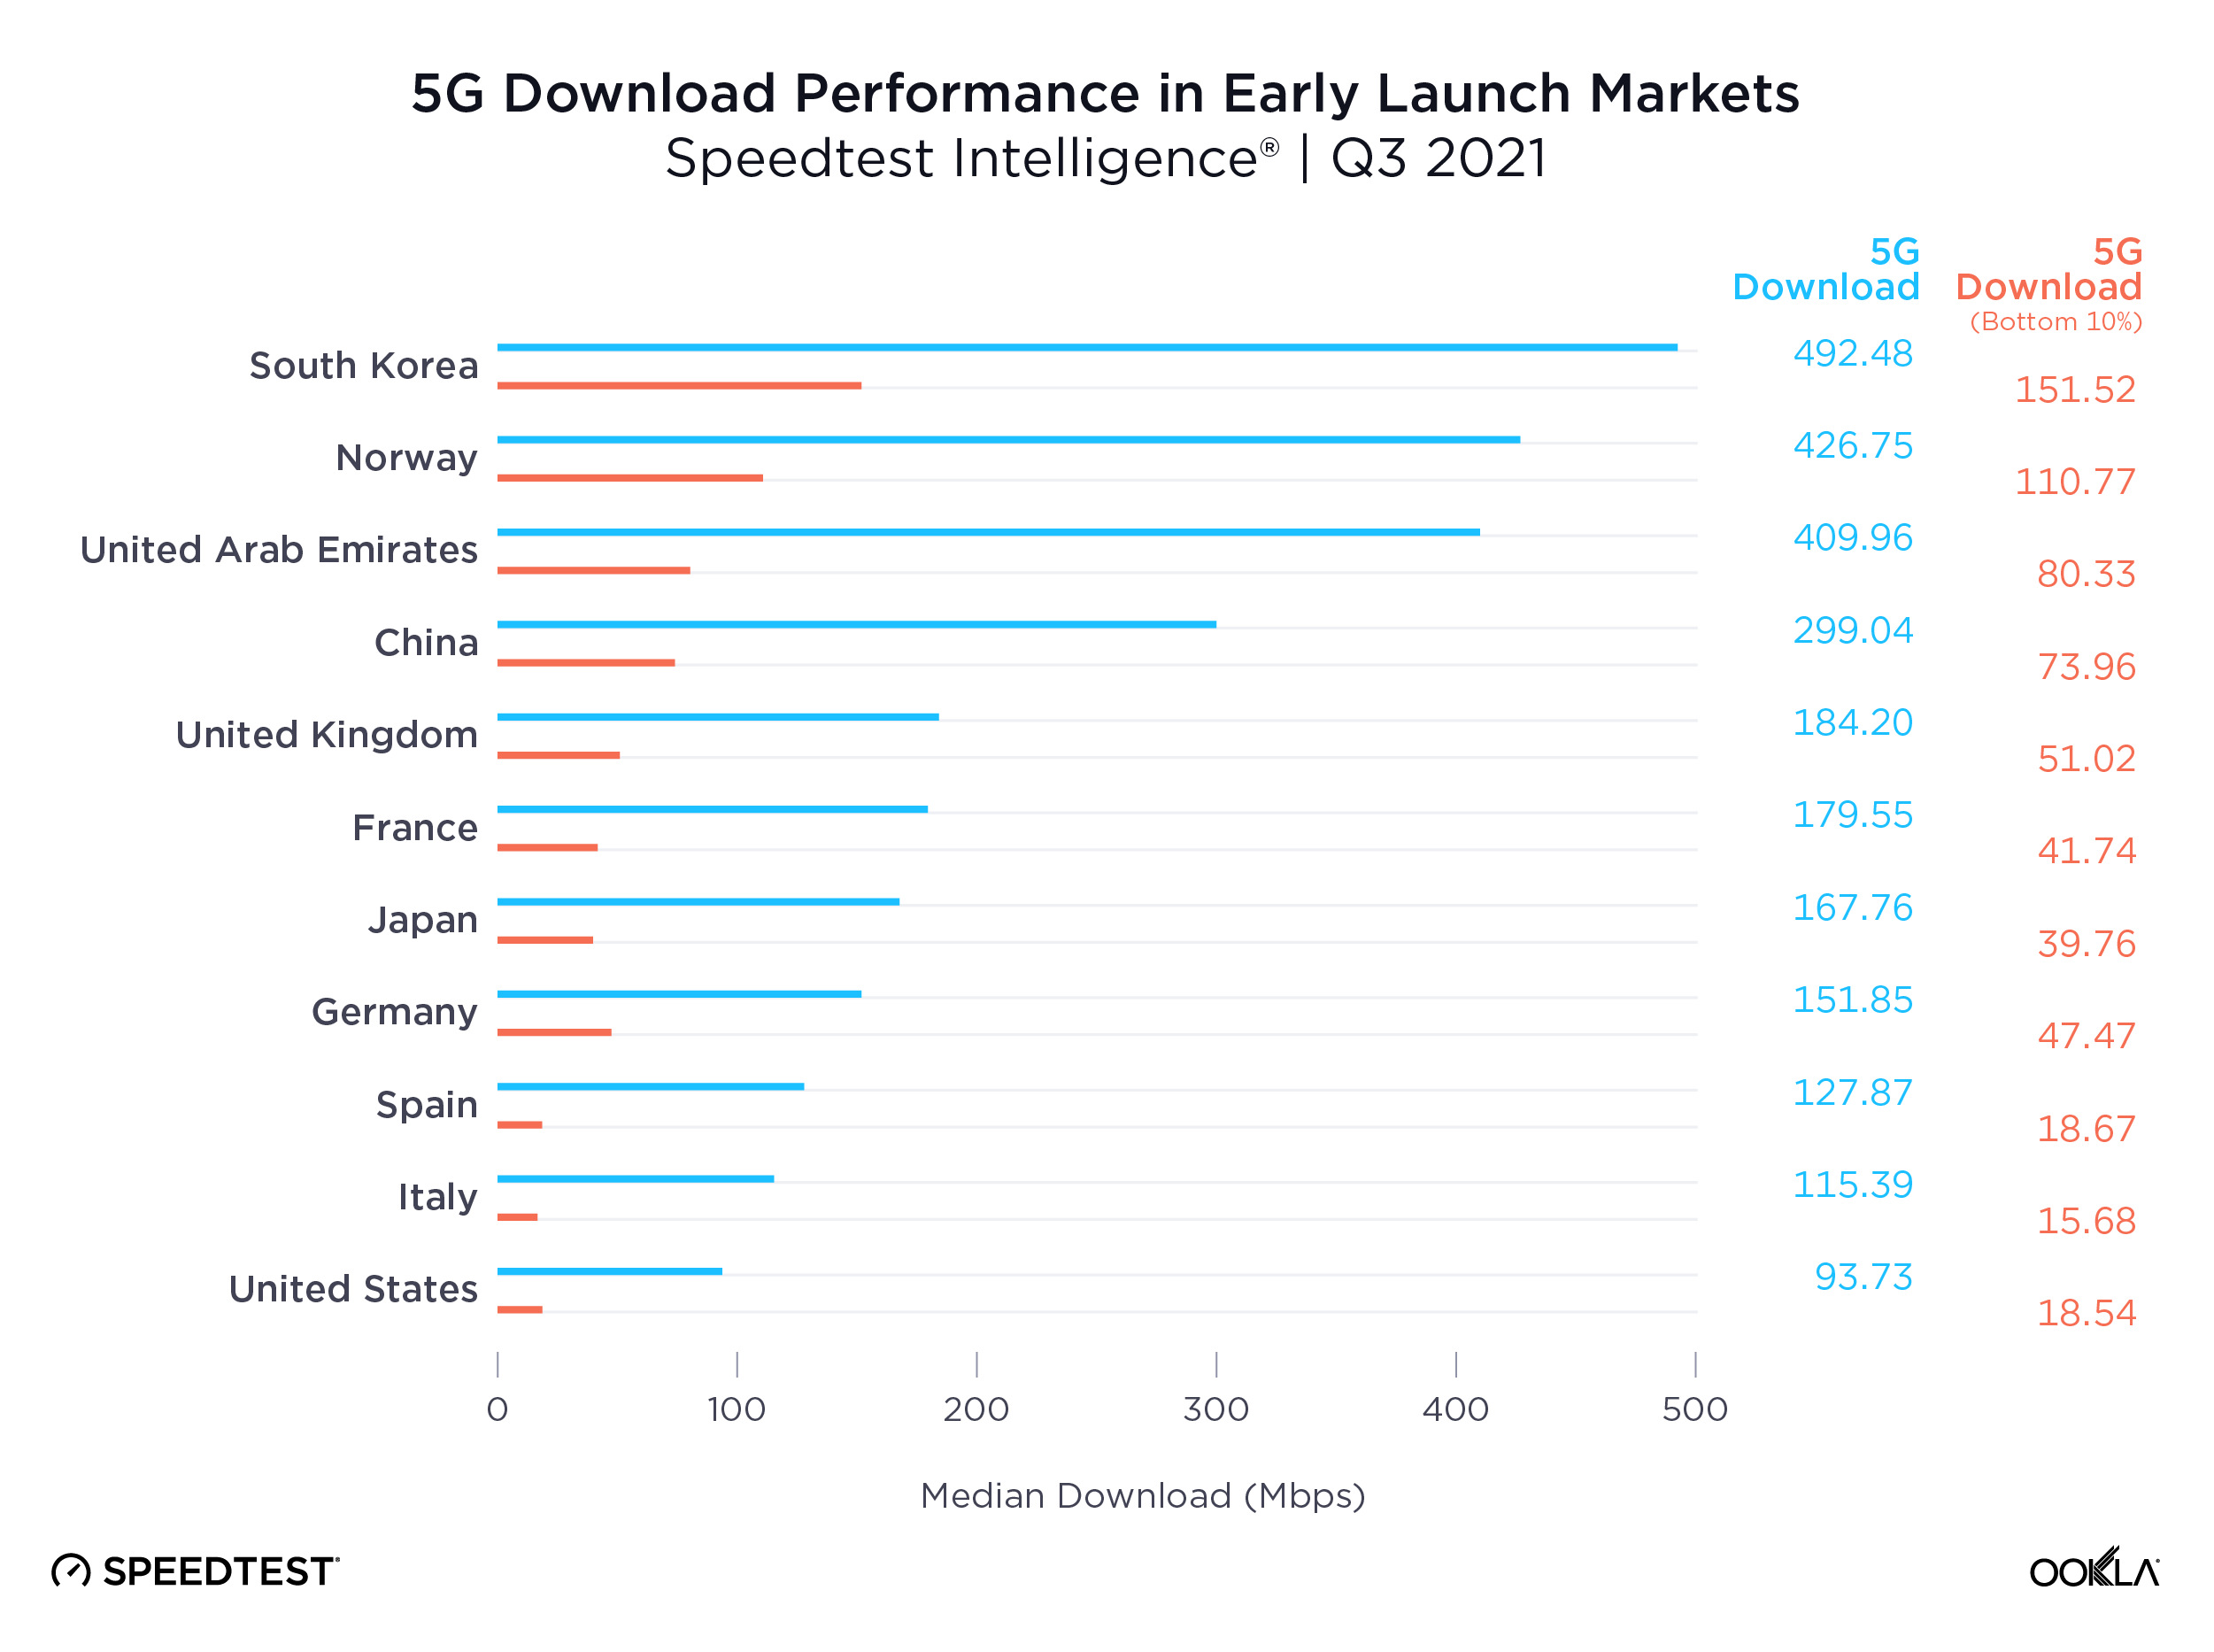
Ookla Speedtest Intelligence data shows a growing disparity in the performance of 5G networks worldwide, even among the pioneer markets who were among the first to launch the new technology. We see leading markets such as South Korea, Norway, the UAE and China pulling well ahead of key European markets, the U.S. and Japan on 5G download speeds, creating what increasingly looks like two tiers of 5G markets.
Part of the reason for this divergence is access to key 5G spectrum bands, with Verizon and AT&T in the U.S. for example, soon to deploy their C-band spectrum holdings for 5G use. However, what really seems to separate these markets is the level of 5G network densification. The number of people per 5G base station ranges from 319 in South Korea and 1,531 in China, to 4,224 in the EU and 6,590 in the US, according to the European 5G Observatory’s International Scoreboard during October 2021.
Despite the noise around 6G, 5G still has a long way to run
Median 5G mobile download speeds across these markets are respectable relative to the International Telecommunication Union’s (ITU) IMT-2020 target of 100 Mbps for user experienced download data rates. However, 5G Speedtest® results in each market demonstrate significant variability, with the bottom 10th percentile only recording speeds in excess of the IMT-2020 target in South Korea and Norway, and falling significantly short in many other markets, with Spain, Italy and the U.S. below 20 Mbps.
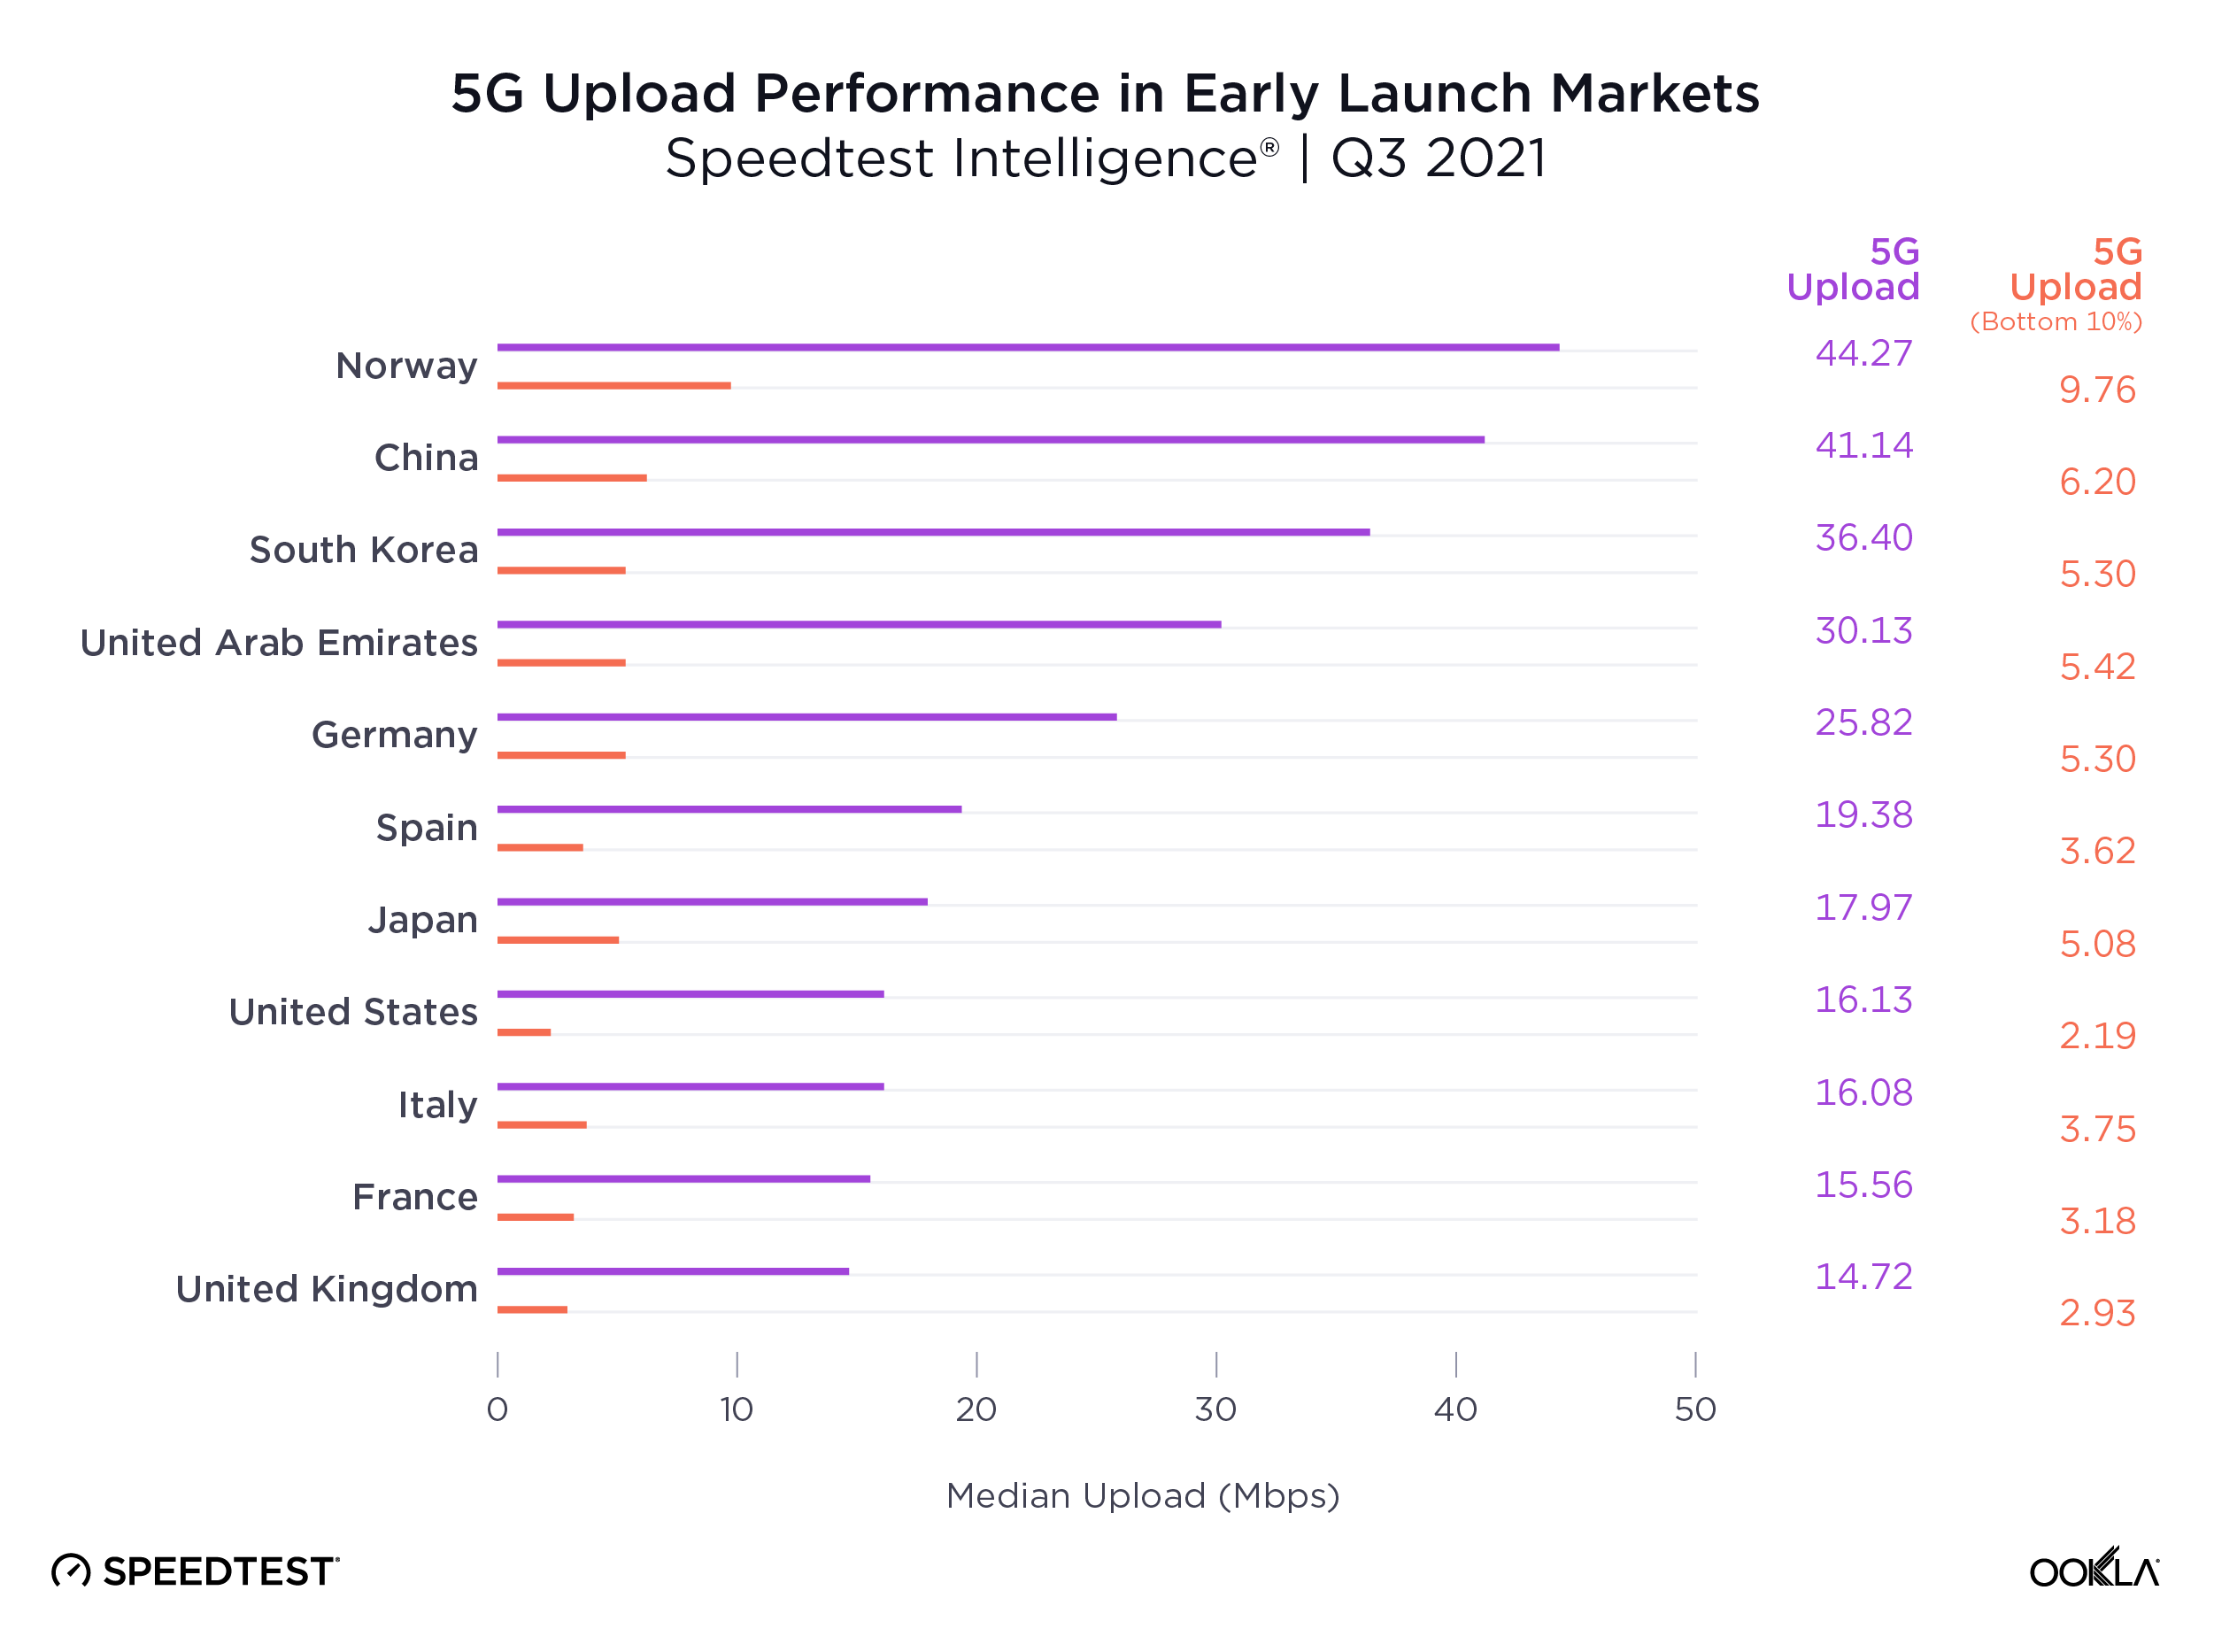
The story gets worse for upload speeds, where no market’s median speed broke the IMT-2020 recommended 50 Mbps, and where the bottom 10th percentile lay in single digits across the board. Operators are clearly prioritizing download speeds over upload, which makes sense given the asymmetric nature of demand, with most consumer applications requiring higher download speeds. However, as operators increasingly look to target the enterprise market with 5G connectivity and consumer demand for services such as video calling and mobile gaming continues to rise, operators will need to boost upload speeds.
Demand for mobile internet bandwidth continues to grow, up 43% year-on-year in Q3 2021 according to Ericsson’s latest mobility report. Looking ahead to 2022, operators will need to increase the capacity of their 5G networks to tackle this growing demand while driving network speeds to new heights. We’ve seen the impact the deployment of new spectrum can have on congested networks during 2021, with Reliance Jio witnessing a bump in 4G LTE performance and consumer sentiment following its acquisition of additional spectrum in India.
Where 5G still fails to reach
Speedtest Intelligence showed 70 countries in the world where more than 20% of samples were from 2G and 3G connections (combined) during Q3 2021 and met our statistical threshold to be included. These are mostly countries where 5G is still aspirational for a majority of the population. As excited as we are about the expansion of 5G, we do not want to see these countries left behind. Not only are 2G and 3G decades old, they are only sufficient for basic voice and texting, social media and navigation apps. To deliver rich media experiences or video calling, users need access to 4G or higher. Having so many consumers on 2G and 3G also prevents mobile operators from refarming that spectrum to make 4G and 5G networks more efficient.
Countries That Still Rely Heavily on 2G and 3G Connections
Speedtest IntelligenceⓇ | Q3 2021
Country
2G & 3G Samples
Central African Republic
89.9%
Palestine
84.7%
Yemen
72.4%
Turkmenistan
71.8%
Micronesia
56.3%
Madagascar
55.0%
Belarus
53.2%
Rwanda
51.7%
Kiribati
48.4%
Equatorial Guinea
47.6%
Afghanistan
44.4%
South Sudan
43.4%
Guyana
42.3%
Guinea
37.0%
Angola
36.8%
Cape Verde
35.9%
Tajikistan
35.6%
Zimbabwe
34.7%
Benin
34.4%
Togo
33.8%
Ghana
33.0%
Sierra Leone
31.7%
Antigua and Barbuda
30.2%
Vanuatu
30.1%
Lesotho
30.0%
Syria
29.6%
Moldova
29.4%
Saint Kitts and Nevis
28.9%
Mozambique
28.8%
Sudan
28.4%
Palau
28.3%
Grenada
28.1%
Tanzania
27.6%
Uganda
27.5%
Niger
27.5%
Gabon
27.5%
Haiti
27.4%
Suriname
27.4%
Tonga
27.3%
Liberia
27.0%
Namibia
26.7%
Swaziland
26.5%
The Gambia
26.3%
Saint Vincent and the Grenadines
26.3%
Dominica
26.3%
Somalia
26.1%
Cook Islands
26.0%
Zambia
25.9%
Barbados
25.7%
Armenia
25.5%
Algeria
25.4%
Papua New Guinea
25.2%
Jamaica
24.5%
Venezuela
24.2%
Ethiopia
24.1%
Uzbekistan
24.0%
El Salvador
23.5%
Honduras
23.1%
Nigeria
23.0%
Solomon Islands
22.8%
Caribbean Netherlands
22.7%
Botswana
22.3%
Anguilla
21.7%
Mauritania
20.6%
Saint Lucia
20.5%
Bosnia and Herzegovina
20.3%
Burundi
20.3%
Ecuador
20.2%
Ukraine
20.1%
Trinidad and Tobago
20.0%
We were pleased to see the following countries come off the list from last year, having dropped below the 20% threshold: Azerbaijan, Bangladesh, Belize, Burkina Faso, Cameroon, Costa Rica, Côte d’Ivoire, DR Congo, Iraq, Kenya, Laos, Libya, Maldives, Mali, Mauritius, Mongolia, Nicaragua, Paraguay and Tunisia. While countries like Palestine, Suriname, Ethiopia, Haiti and Antigua and Barbuda are still on this list, they have improved the percentage of their samples on these outmoded technologies when compared to last year (dropping 10-15 points, respectively), 2G and 3G samples in Belarus increased 6.7 points when comparing Q3 2021 to Q3 2020.
We’re excited to see how performance levels will normalize as 5G expands to more and more countries and access improves. Keep track of how well your country is performing on Ookla’s Speedtest Global Index™.
Ookla retains ownership of this article including all of the intellectual property rights, data, content graphs and analysis. This article may not be quoted, reproduced, distributed or published for any commercial purpose without prior consent. Members of the press and others using the findings in this article for non-commercial purposes are welcome to publicly share and link to report information with attribution to Ookla.
5G is no longer a new technology, however, consumers in many countries are still waiting to see the full benefits of 5G (or even to connect to 5G at all). We examined Speedtest Intelligence® data from Q3 2022 Speedtest® results to see how 5G performance has changed since last year, where download speeds are the fastest at the country level, and how satellite technologies are offering additional options to connect. We also looked at countries that don’t yet have 5G to understand where consumers are seeing improvements in 4G LTE access.
5G speeds were stable at the global level
In 2021, we discussed how an expansion of 5G access led to a decline in overall speed at the global level. This year showed a stabilization in overall speed, even as 5G access broadened, with a median global 5G download speed of 168.27 Mbps in Q3 2022 as compared to 166.13 Mbps in Q3 2021. Median upload speed over 5G slowed slightly to 18.71 Mbps (from 21.08 Mbps) during the same period. According to the Ookla® 5G Map™, there were 127,509 5G deployments in 128 countries as of November 30, 2022, compared to 85,602 in 112 countries the year prior.
South Korea and the United Arab Emirates led countries for 5G speeds
South Korea and the U.A.E. had the fastest median download speed over 5G at 516.15 Mbps and 511.70 Mbps, respectively, during Q3 2022, leading a top 10 list that included Bulgaria, Qatar, Saudi Arabia, Singapore, Kuwait, New Zealand, Bahrain, and Brazil. Bulgaria, Singapore, Bahrain, and Brazil were new to the top 10 in 2022, while Norway, Sweden, China, and Taiwan fell out of the top 10.
Satellite became more accessible but performance slowed
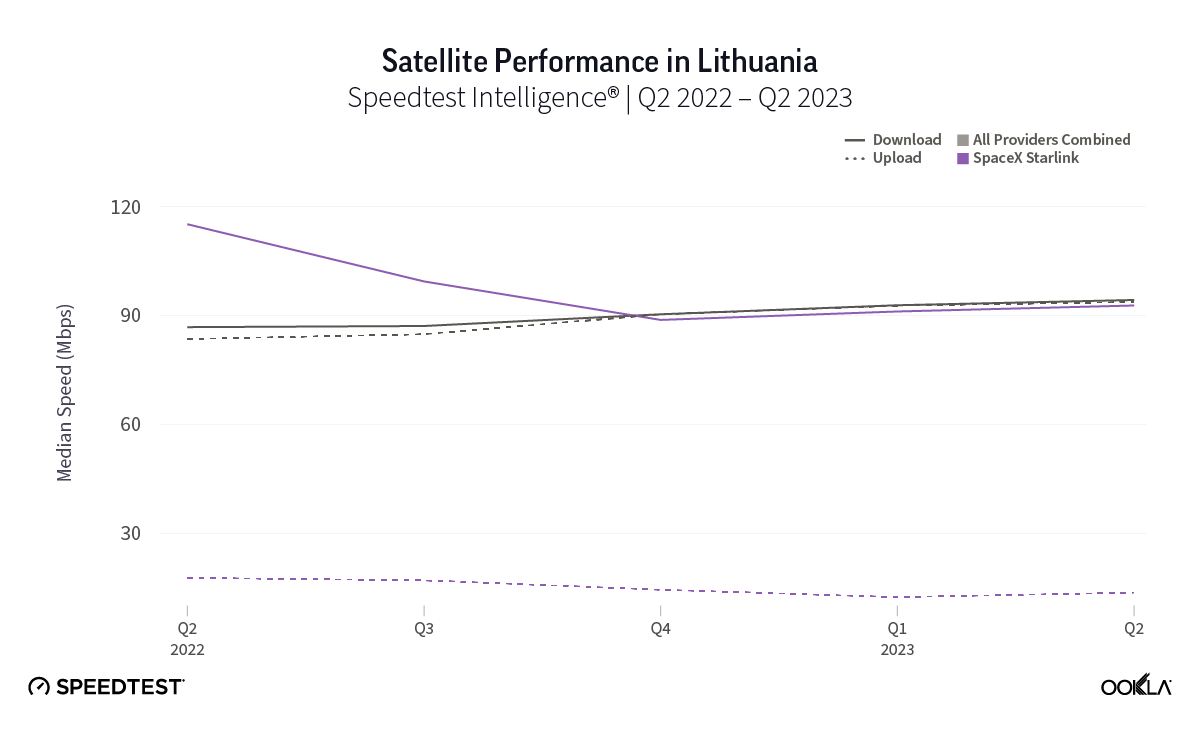
2022 saw a proliferation of fast, low-earth orbit (LEO) satellite internet from Starlink across the world. Q1 2022 saw Starlink speeds increase year over year in Canada and the U.S., with Starlink in Mexico having the fastest satellite internet in North America, Starlink in Lithuania the fastest in Europe, Starlink in Chile the fastest in South America, and Starlink in Australia the fastest in Oceania.
Q2 2022 saw Starlink speeds decrease in Canada, France, Germany, New Zealand, the U.K., and the U.S. from Q1 2022 as Starlink crossed the 400,000 user threshold across the world. Starlink in Puerto Rico debuted as the fastest satellite provider in North America. Starlink outperformed fixed broadband averages in 16 European countries. Starlink in Brazil had the fastest satellite speeds in South America. And Starlink in New Zealand was the fastest satellite provider in Oceania.
During Q3 2022, Starlink performance dipped once again from Q2 2022 in Canada and the U.S., while remaining about the same in Chile. Starlink in Puerto Rico and the U.S. Virgin Islands had the fastest satellite speeds in North America, while Starlink in Brazil again was the fastest satellite provider in South America.
With Viasat, HughesNet, and Project Kuiper set to launch huge LEO constellations in 2023, consumers around the world are poised to have more fast satellite internet options, particularly as the European Commission makes its own play for a constellation and Eutelsat and OneWeb potentially merging.
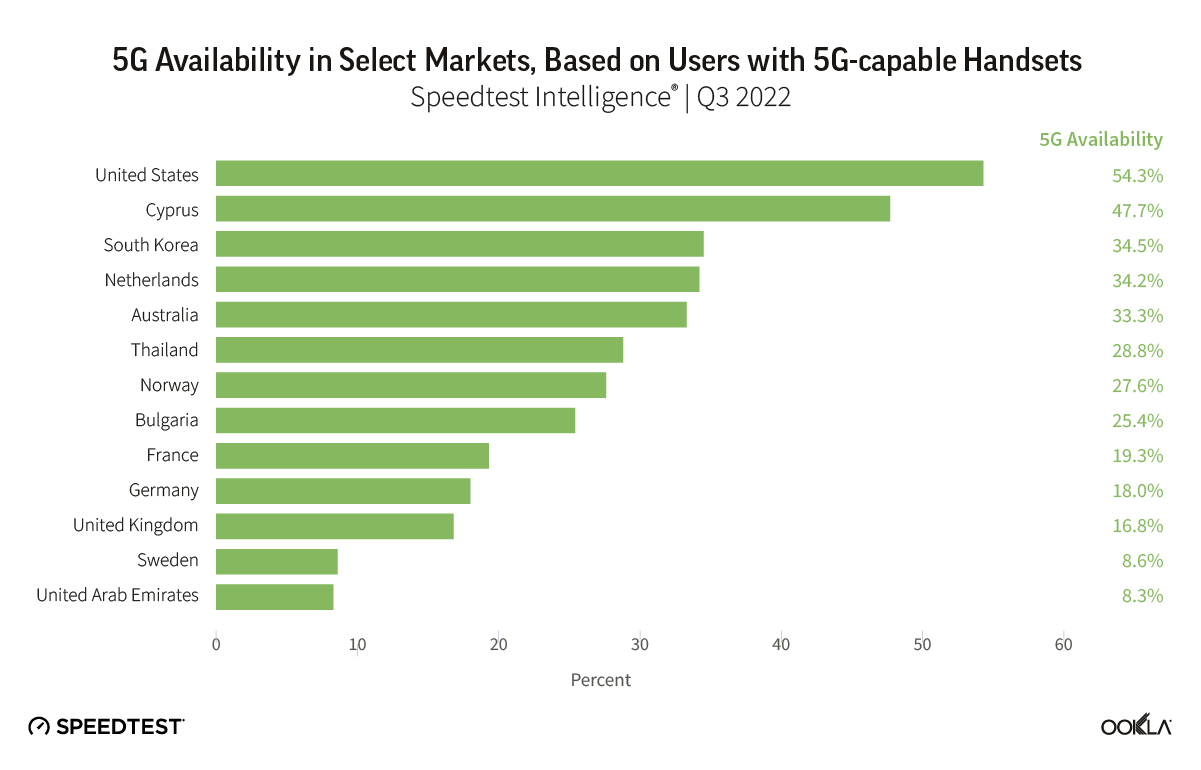
5G Availability points to on-going challenges
5G Availability measures the proportion of Speedtest users with 5G-capable handsets, who spend a majority of time connected to 5G networks. It’s therefore a function of 5G coverage and adoption. We see wide disparity in 5G Availability among markets worldwide, with for example the U.S. recording 54.3% in Q3 2022, well ahead of markets such as Sweden and the U.A.E., with 8.6% and 8.3% respectively.
Critical levers for mobile operators to increase 5G Availability include:
Increasing 5G coverage by deploying additional base stations
Obtaining access to, or refarming, sub-GHz spectrum, to help broaden 5G coverage, as sub-GHz spectrum has superior propagation properties than that of higher frequency spectrum bands.
Encouraging 5G adoption among users with 5G-capable handsets.
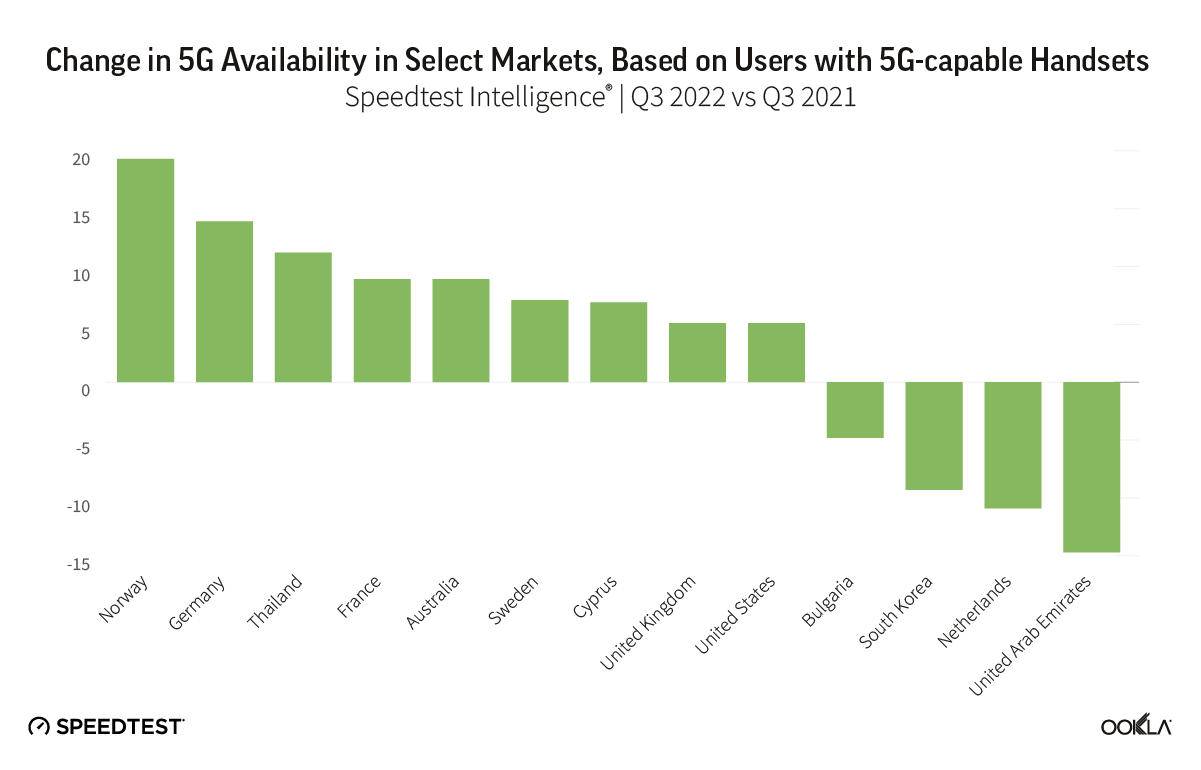
Speedtest Intelligence points to 5G adoption challenges in some markets, with 5G Availability dropping in Bulgaria, South Korea, the Netherlands, and the U.A.E. As more users acquire 5G-capable devices, operators need to balance their pricing models to ensure users have sufficient incentives to purchase a 5G tariff.
Where 5G continues to fail to reach
Speedtest Intelligence showed 29 countries in the world where more than 20% of samples were from 2G and 3G connections (combined) during Q3 2022 and met our statistical threshold to be included (down from 70 in Q3 2021). These are mostly countries where 5G is still aspirational for a majority of the population, which is being left behind technologically, having to rely on decades-old technologies that are only sufficient for basic voice and texting, social media, and navigation apps. We’re glad to see so many countries fall off this list, but having so many consumers on 2G and 3G also prevents mobile operators from making 4G and 5G networks more efficient. If operators and regulators are able to work to upgrade their users to 4G and higher, everyone will benefit.
Countries That Still Rely Heavily on 2G and 3G Connections
Speedtest IntelligenceⓇ | Q3 2021
Country
2G & 3G Samples
Central African Republic
76.2%
Turkmenistan
58.5%
Kiribati
51.6%
Micronesia
47.4%
Rwanda
41.1%
Belarus
39.7%
Equatorial Guinea
37.7%
Afghanistan
36.7%
Palestine
33.5%
Madagascar
27.5%
Sudan
27.4%
Lesotho
26.5%
South Sudan
26.3%
Benin
26.0%
Guinea
25.5%
Cape Verde
24.3%
Tonga
24.3%
Syria
23.4%
The Gambia
23.4%
Ghana
23.3%
Palau
22.9%
Niger
22.8%
Tajikistan
22.7%
Mozambique
22.4%
Guyana
21.8%
Togo
21.8%
Congo
21.1%
Moldova
20.8%
Saint Kitts and Nevis
20.0%
We were pleased to see the following countries come off the list from last year, having dropped below the 20% threshold: Algeria, Angola, Anguilla, Antigua and Barbuda, Armenia, Barbados, Bosnia and Herzegovina, Botswana, Burundi, Caribbean Netherlands, Cook Islands, Dominica, Ecuador, El Salvador, Ethiopia, Gabon, Grenada, Haiti, Honduras, Jamaica, Liberia, Mauritania, Namibia, Nigeria, Papua New Guinea, Saint Lucia, Saint Vincent and the Grenadines, Sierra Leone, Solomon Islands, Somalia, Suriname, Swaziland, Tanzania, Trinidad and Tobago, Uganda, Ukraine, Uzbekistan, Vanuatu, Venezuela, Yemen, Zambia, and Zimbabwe. While countries like Belarus, Cape Verde, Central African Republic, Guinea, Guyana, Madagascar, Palestine, Rwanda, South Sudan, Tajikistan, Togo, and Turkmenistan are still on this list, they have improved the percentage of their samples on these outmoded technologies when compared to last year by at least 10 points. Palestine improved by more than 50 points. 2G and 3G samples in Kiribati increased 3.2 points when comparing Q3 2022 to Q3 2021.
We’re glad to see performance levels normalize as 5G expands to more and more countries and access improves and we are optimistic that 2023 will bring further improvements. Keep track of how well your country is performing on Ookla’s Speedtest Global Index™ or track performance in thousands of cities worldwide with the Speedtest Performance Directory™.
Ookla retains ownership of this article including all of the intellectual property rights, data, content graphs and analysis. This article may not be quoted, reproduced, distributed or published for any commercial purpose without prior consent. Members of the press and others using the findings in this article for non-commercial purposes are welcome to publicly share and link to report information with attribution to Ookla.
This analysis includes Starlink Net Promoter Score (NPS) data for France, Germany, Italy, New Zealand, and the United Kingdom, year-over-year data for satellite providers in Europe and Oceania from Q2 2022 to Q2 2023, and new Q2 2023 data from Starlink in Africa.
Starlink users across different continents continue to love the service
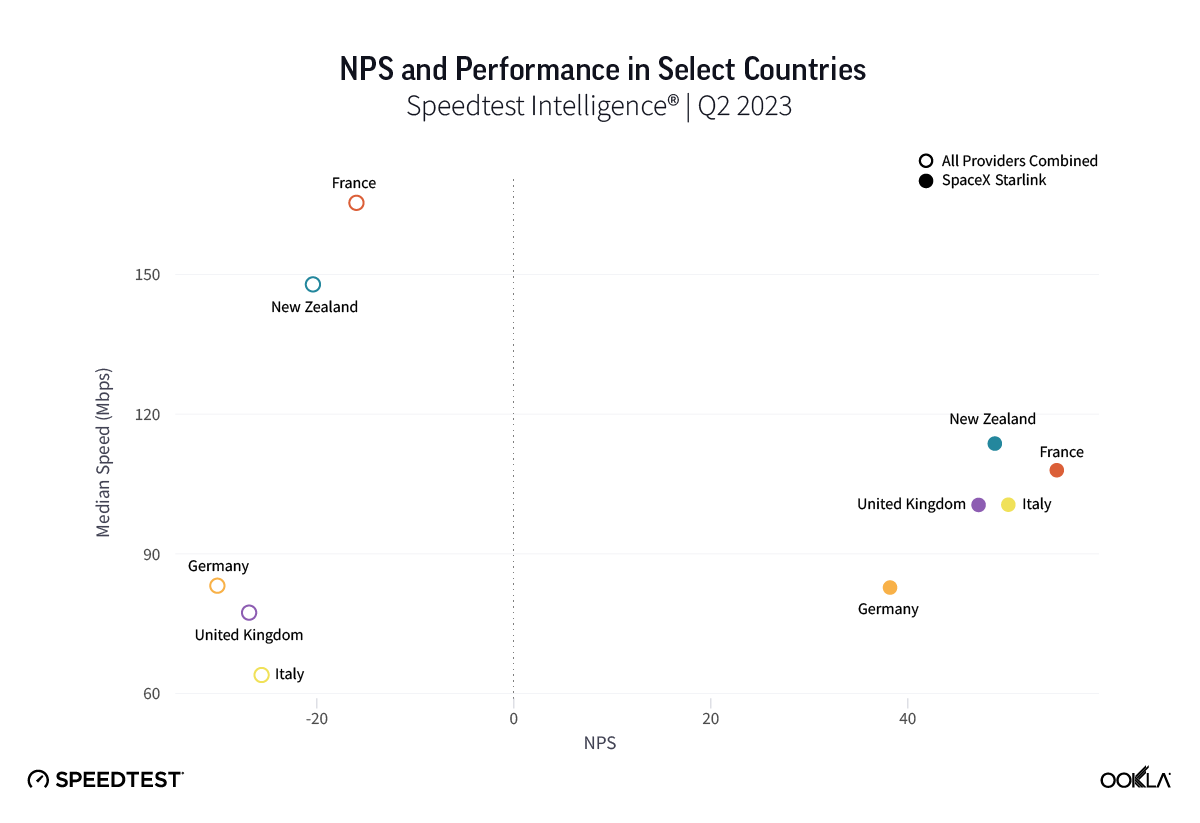
Using Speedtest Intelligence®, we examined NPS ratings data for Starlink users against an aggregate of all fixed broadband providers combined.
NPS is based on Speedtest® user responses after being asked how likely they are to recommend their provider to friends or family on a 0 to 10 scale. NPS ratings are categorized into Detractors (score 0-6), Passives (score 7-8), and Promoters (score 9-10), and is calculated as (% Promoters – % Detractors) x 100. Any NPS score above 0 indicates that a provider’s audience is more loyal than not.
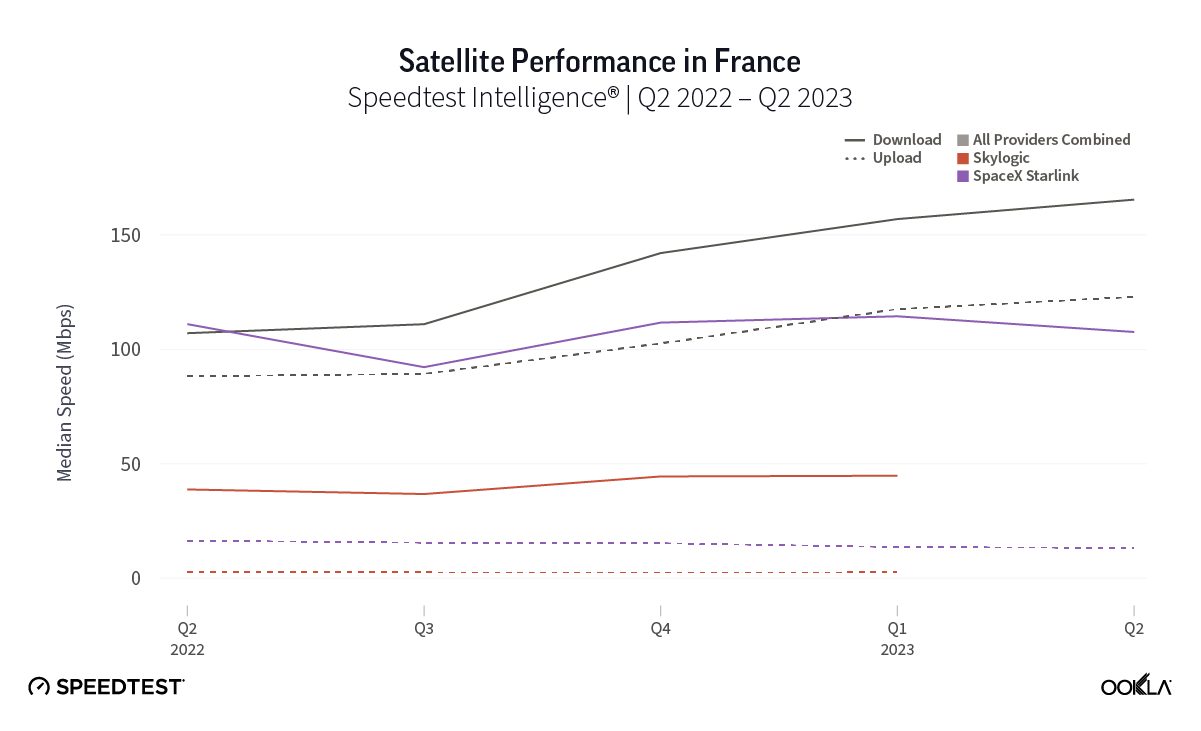
As you can see from the above image, Starlink users in France, Germany, Italy, New Zealand, and the U.K. had an NPS score much higher than the aggregate score for all fixed broadband providers combined during Q2 2023. France had the highest NPS among the aggregate of fixed broadband providers for the countries we surveyed at -15.98 and fixed broadband providers had a much faster median download speed at 165.37 Mbps to Starlink’s 107.56 Mbps. In New Zealand there was a similar story with the aggregate of fixed broadband providers having a -20.40 NPS to Starlink’s 48.83, while having a faster median download speed 147.86 Mbps to 113.78 Mbps during Q2 2023.
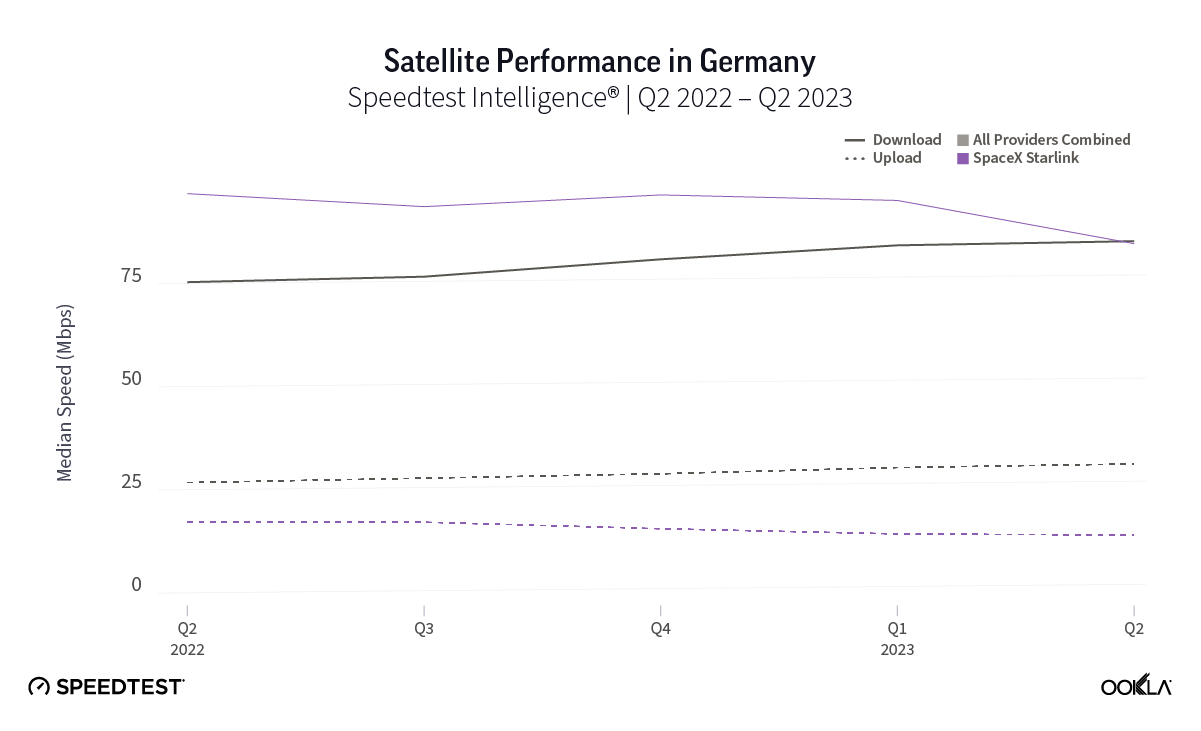
Germany, which had the lowest NPS rating of aggregate of fixed broadband providers in Europe at -30.10, also had the smallest difference in NPS with Starlink scoring 38.19. Interestingly, the aggregate of fixed broadband providers and Starlink both had similar median download speeds at 83.16 Mbps and 82.56 Mbps, respectively, during Q2 2023.
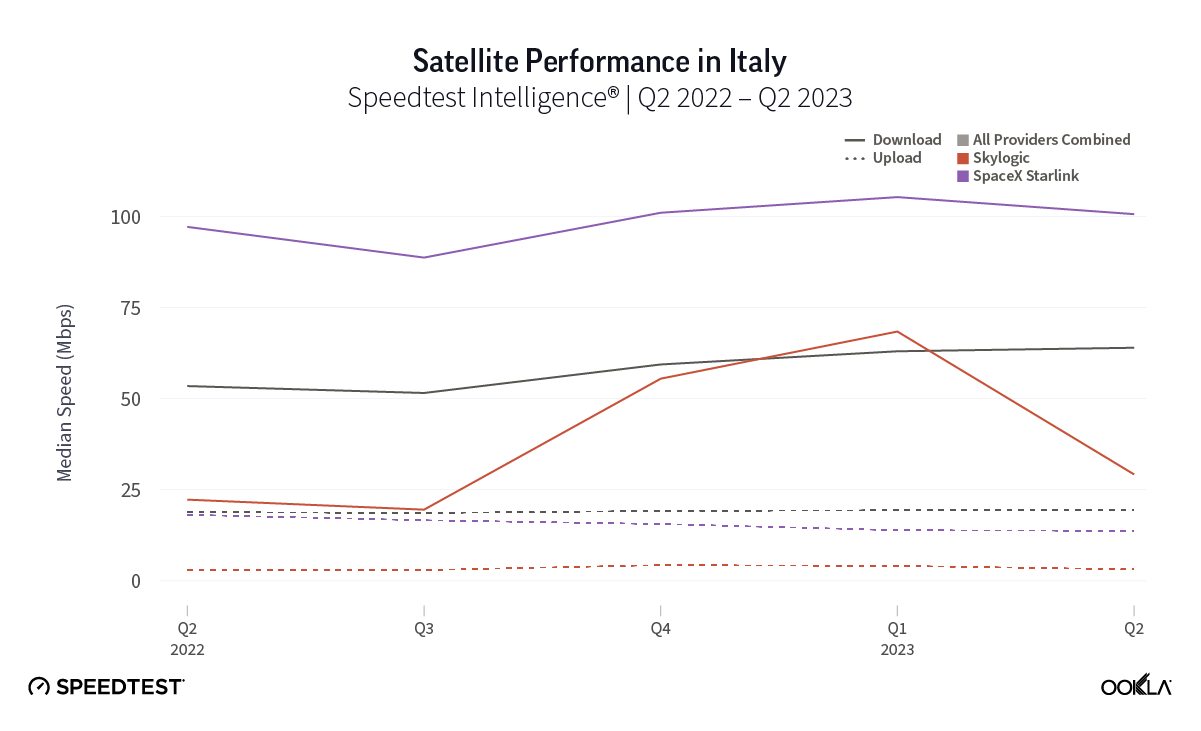
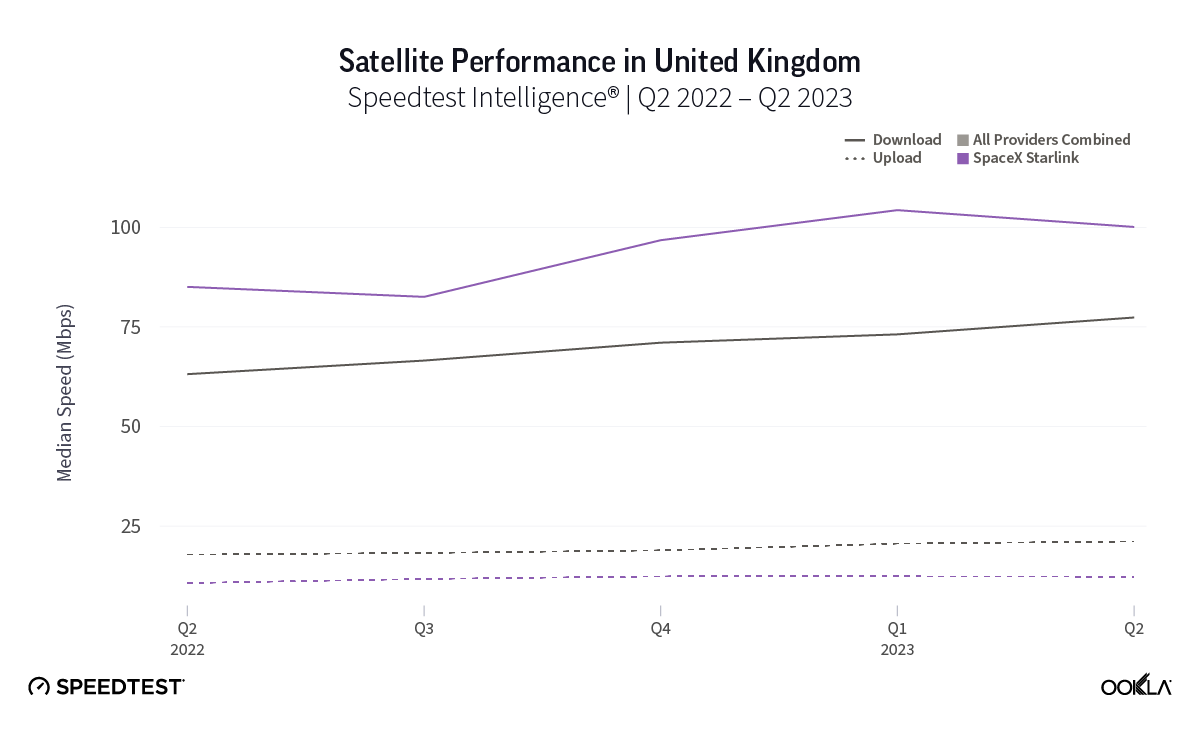
Of note, Starlink had much higher NPS ratings and median download speeds than the aggregate of all fixed providers combined in Italy and the U.K., respectively, during Q2 2023. Starlink’s NPS was 50.20 to -25.61 for the aggregate of all fixed broadband providers in Italy during Q2 2023, while the median download speeds were 100.68 Mbps to 63.99 Mbps. In the U.K., Starlink’s NPS was 47.18 to -26.88 for the aggregate of all fixed broadband providers combined, with the median download speeds a little closer, 100.11 Mbps to 77.38 Mbps, respectively.
In our last report, we found a wide NPS gap between U.S. rural Starlink users — who often have fewer options for fixed broadband access — and the corresponding aggregate of fixed broadband providers. Given that all five of these countries have rural or remote regions that are underserved or not served by traditional broadband offerings, it may be no surprise that Starlink users who reside in those areas may feel positive about having access to fast broadband internet.
Starlink speeds over 100 Mbps in 14 European countries during Q2 2023, speeds stabilizing across Europe
Key takeaways:
Starlink results were the fastest among satellite providers we surveyed.
Starlink quarter-to-quarter speeds improved or remained about the same (between 5% and -5%) in 23 countries, while decreasing in 4 countries.
Among the 27 European countries we surveyed, Starlink had median download speeds greater than 100 Mbps in 14 countries, greater than 90 Mbps in 20 countries, and greater than 80 in 24 countries, with only three countries failing to reach 70 Mbps.
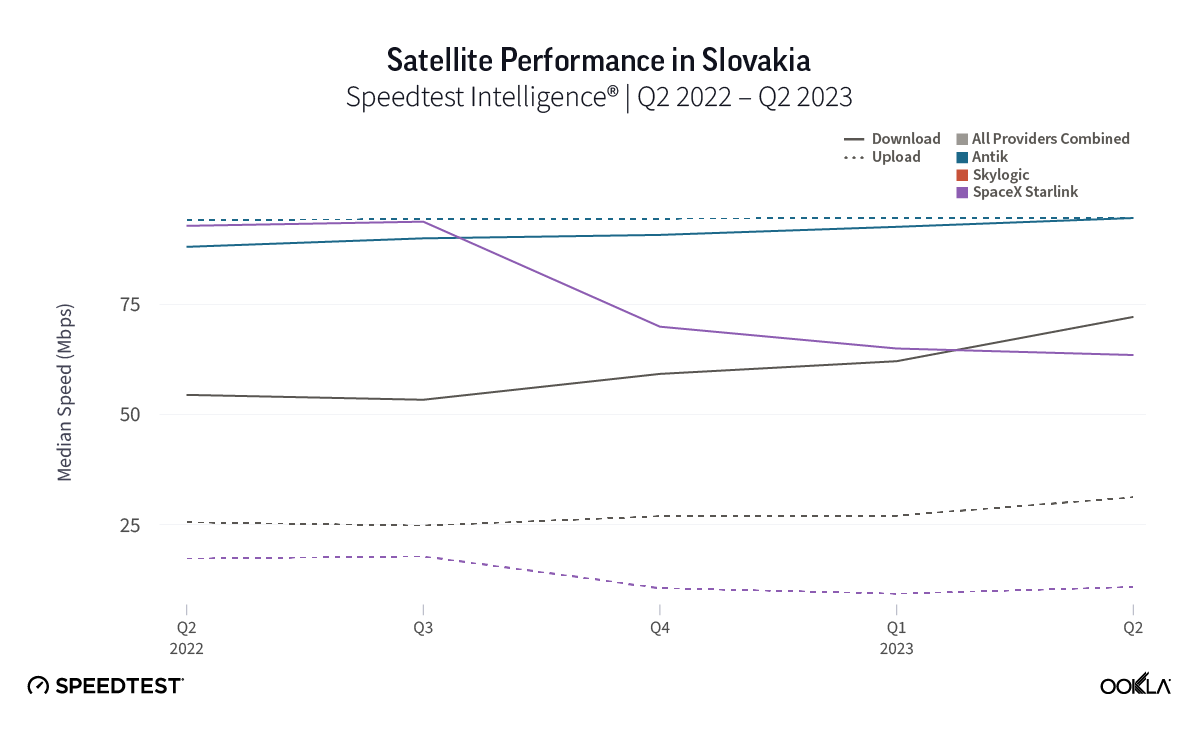
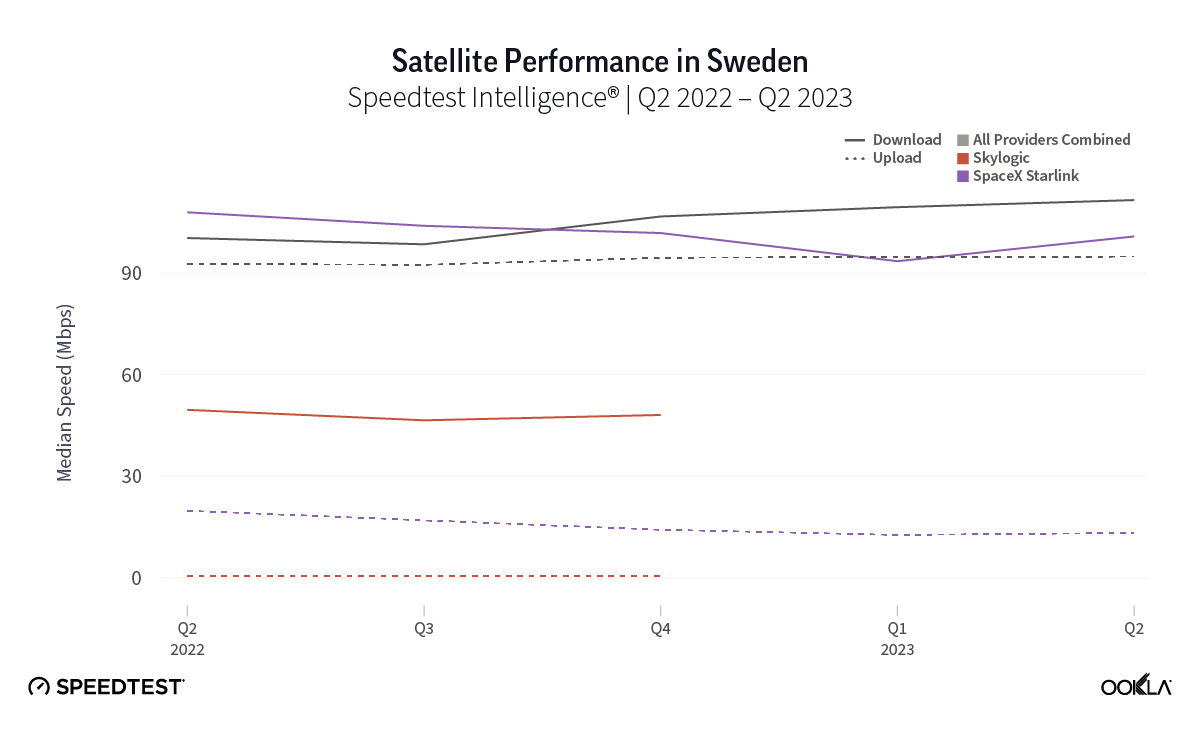
Skylogic, while delivering speeds slower than Starlink, showed stabilized broadband speeds over the past year for those seeking a Starlink alternative.
Over the past year, we’ve seen huge developments in the global satellite market, Europe notwithstanding, with Amazon’s Project Kuiper moving forward, the EU creating its own satellite constellation, and OneWeb and Eutelsat merging. While Starlink continues to lead for performance among satellite providers we surveyed, Starlink has experienced some major hurdles over the past year as users flock to the service and speeds have subsequently dipped — but of note those concerns seem to have started allaying in most of Europe during Q2 2023.
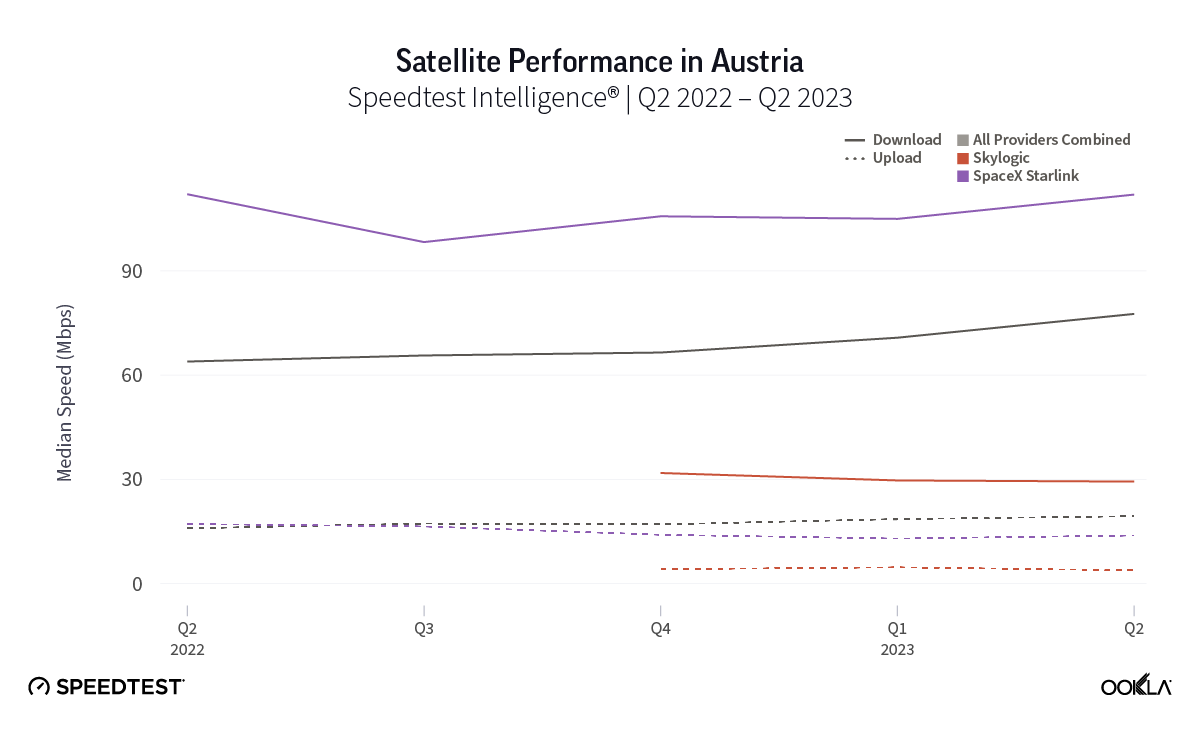
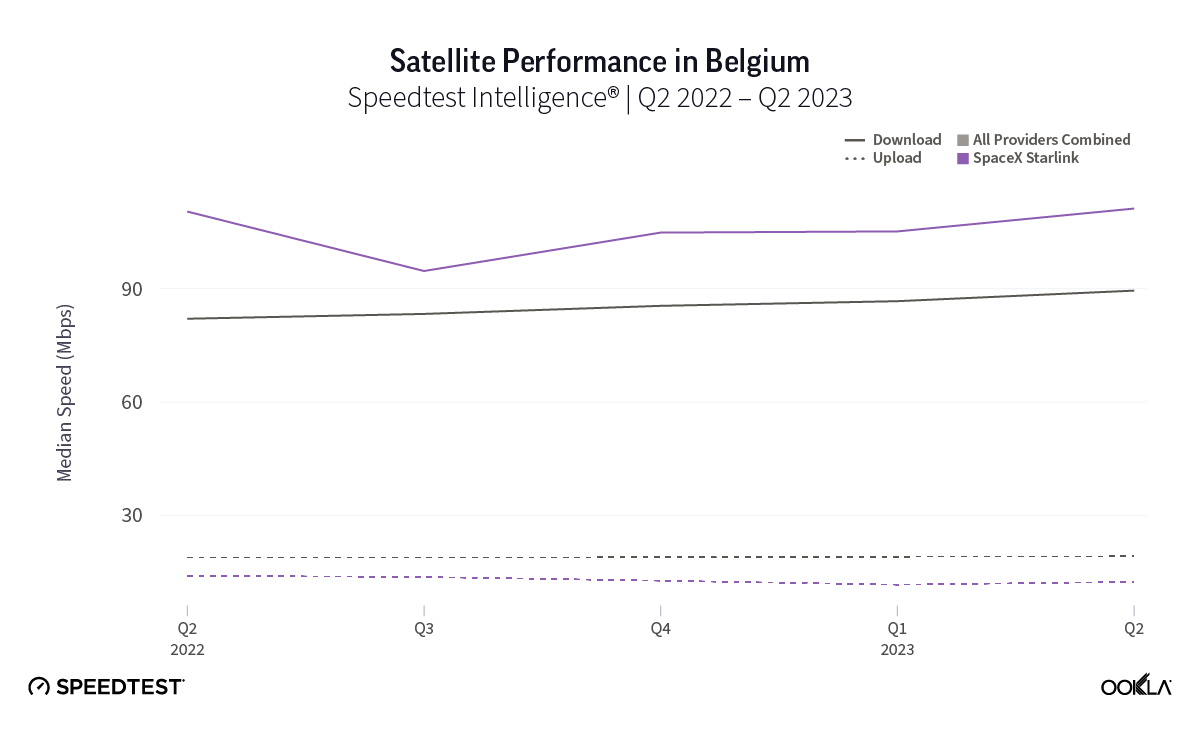
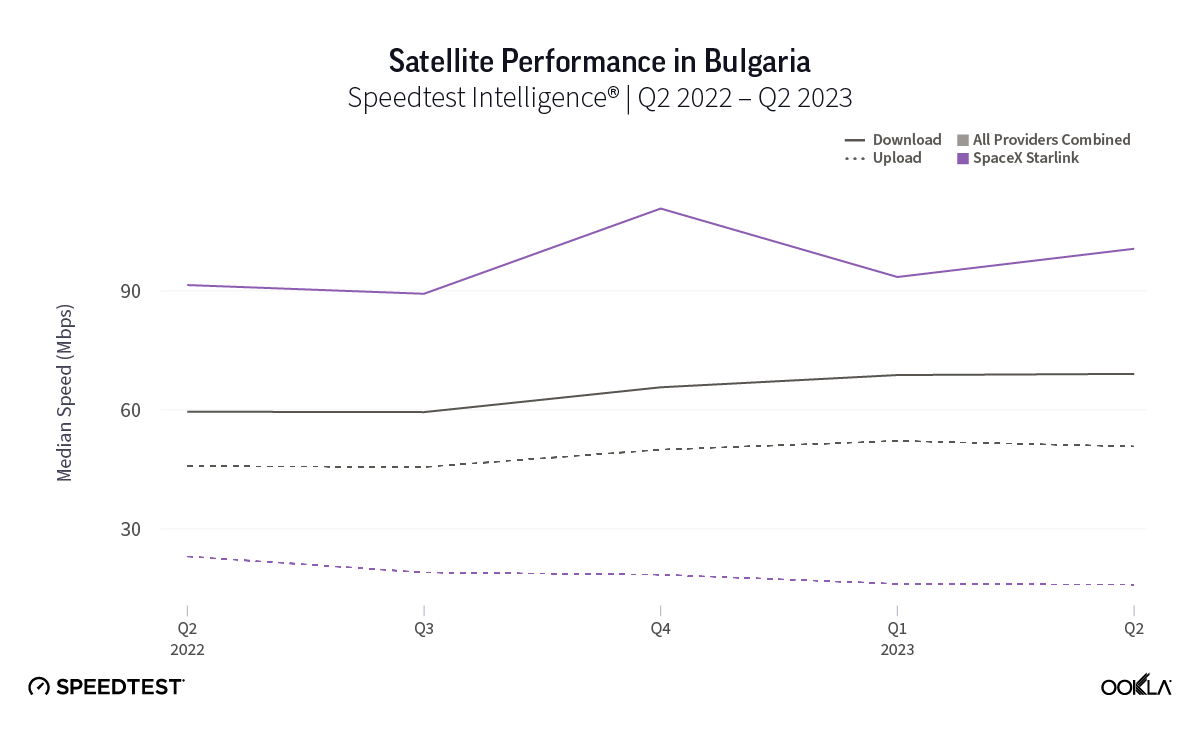
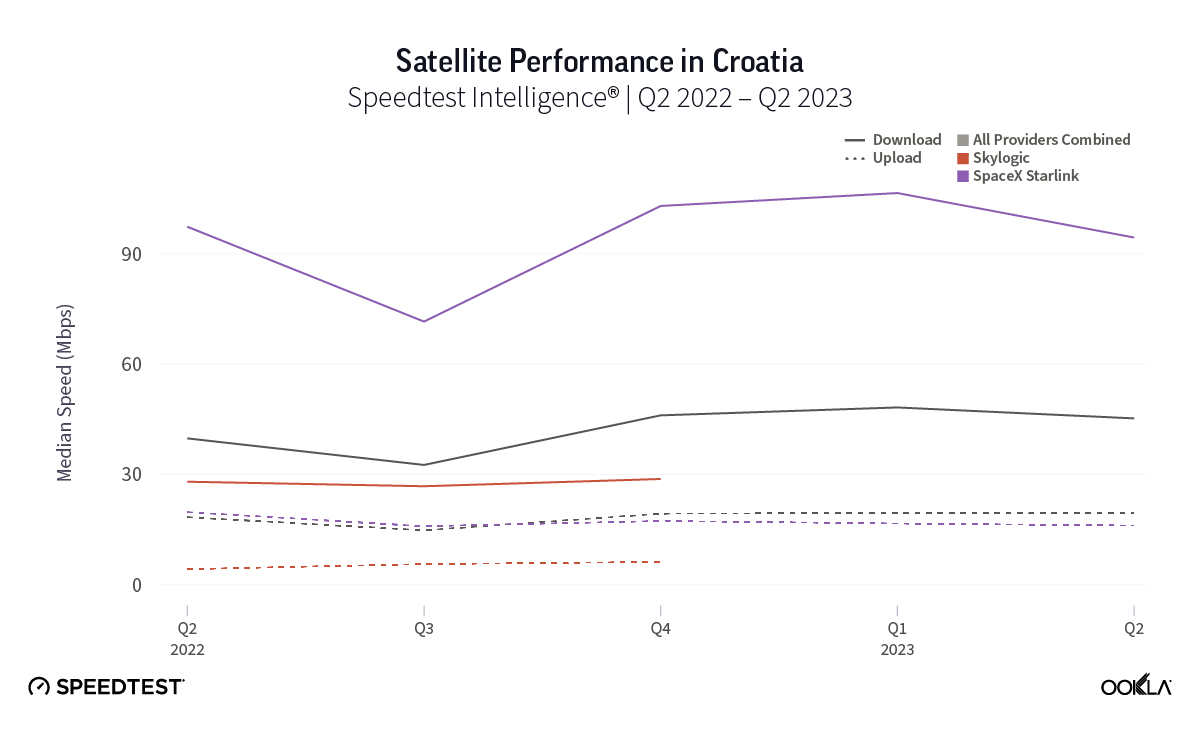
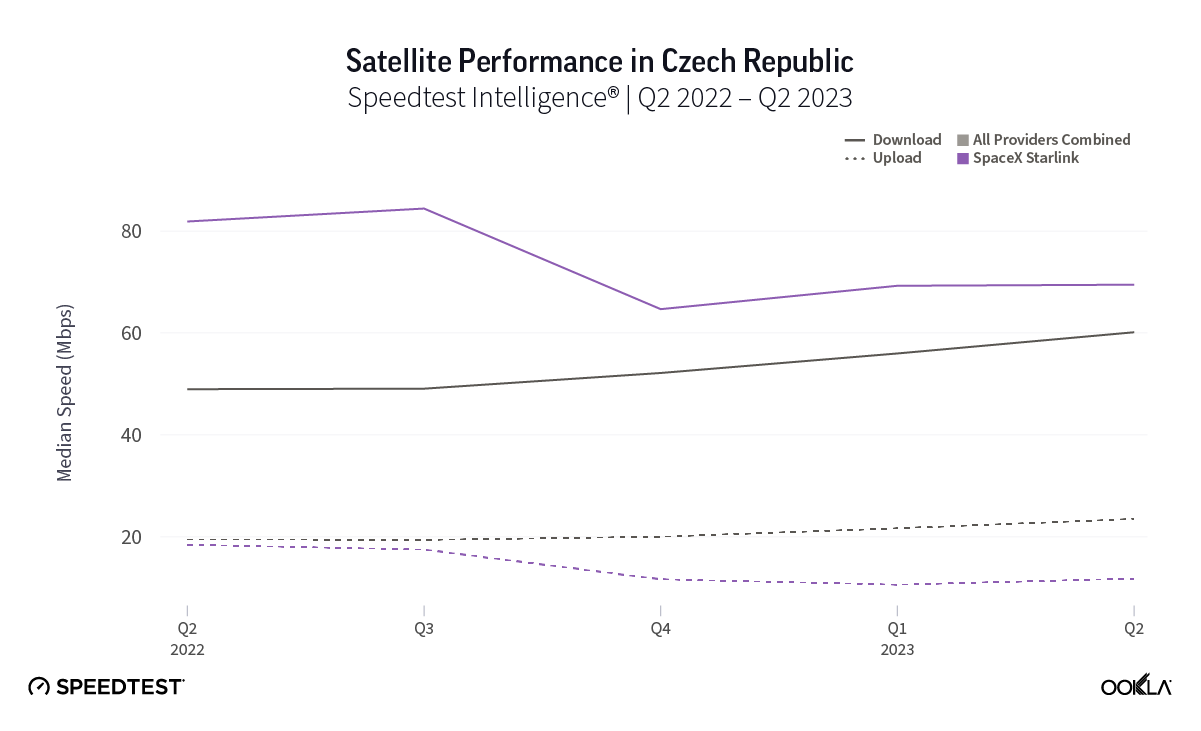
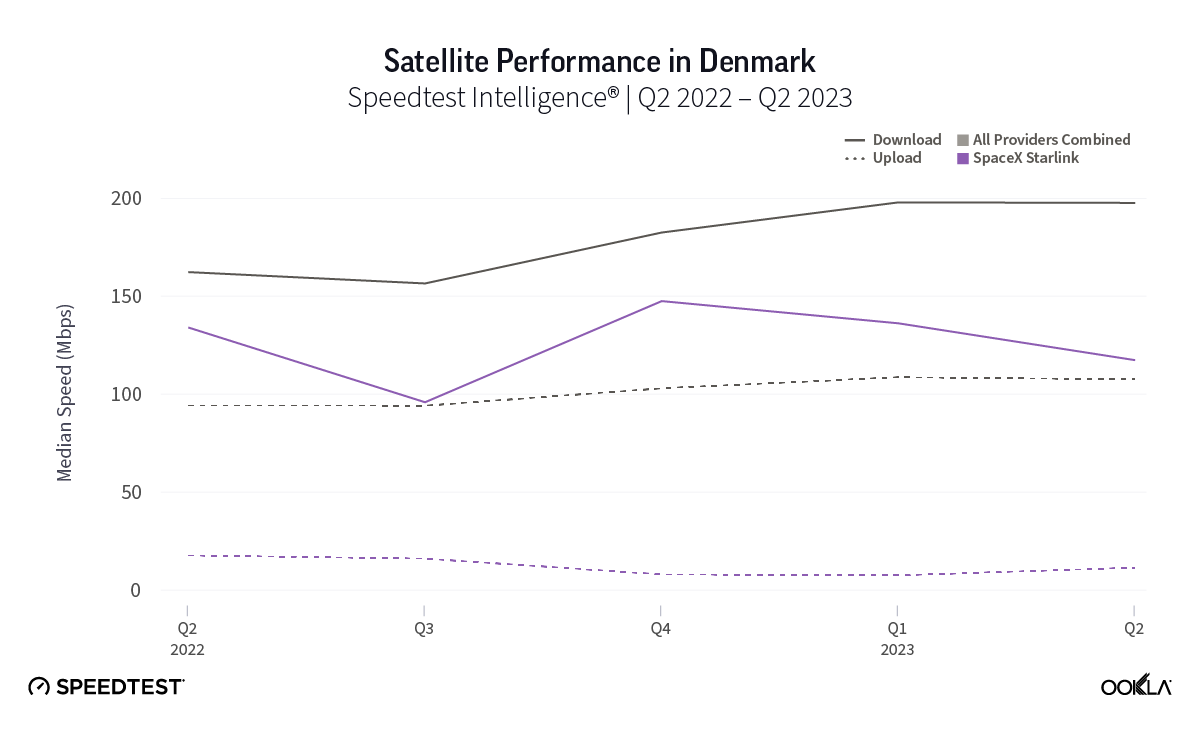
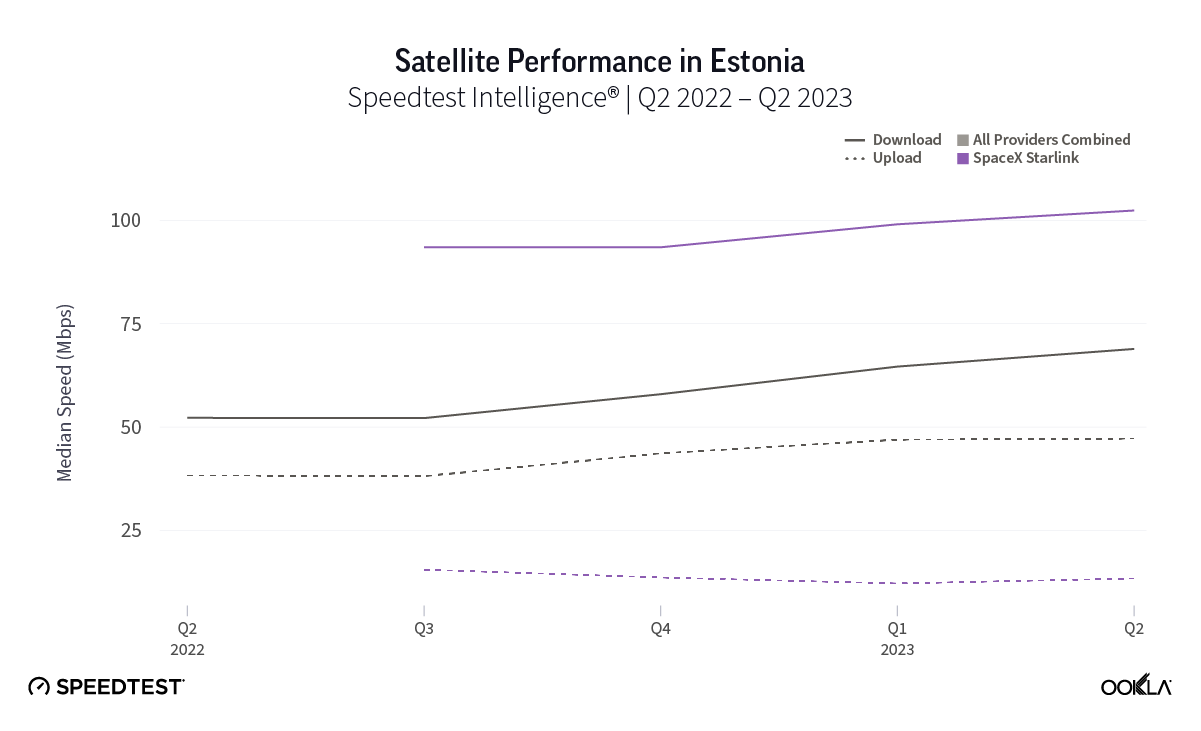
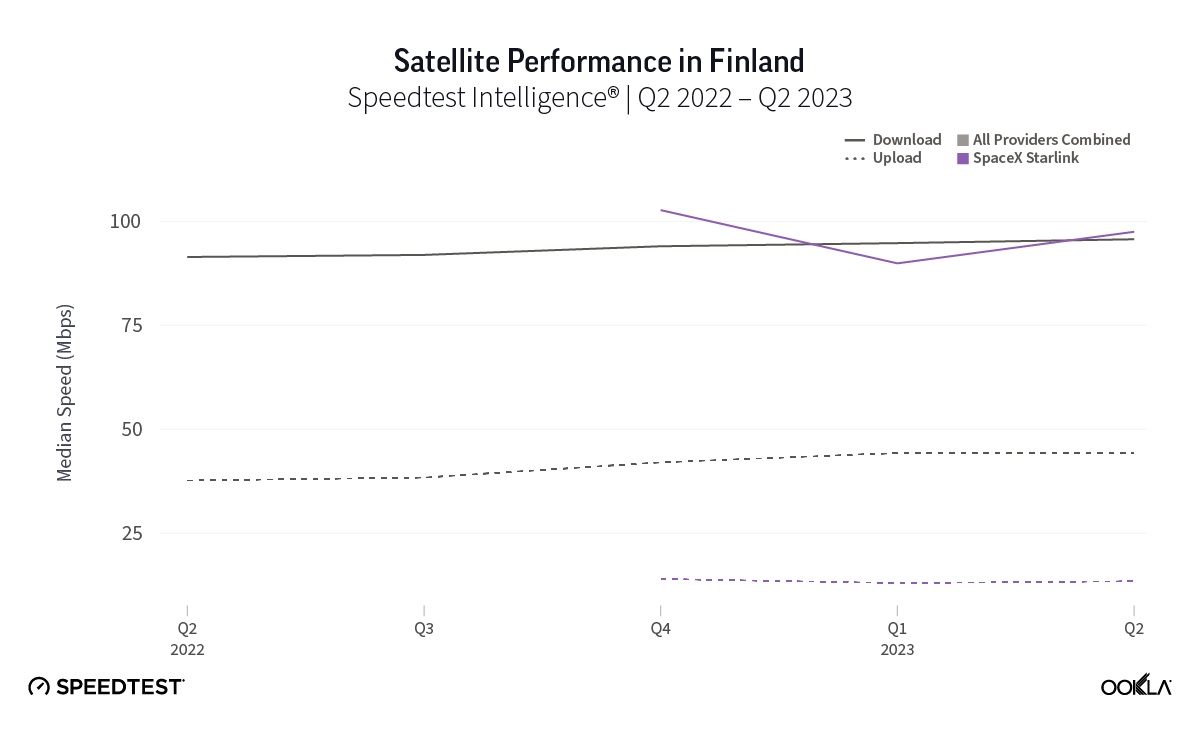
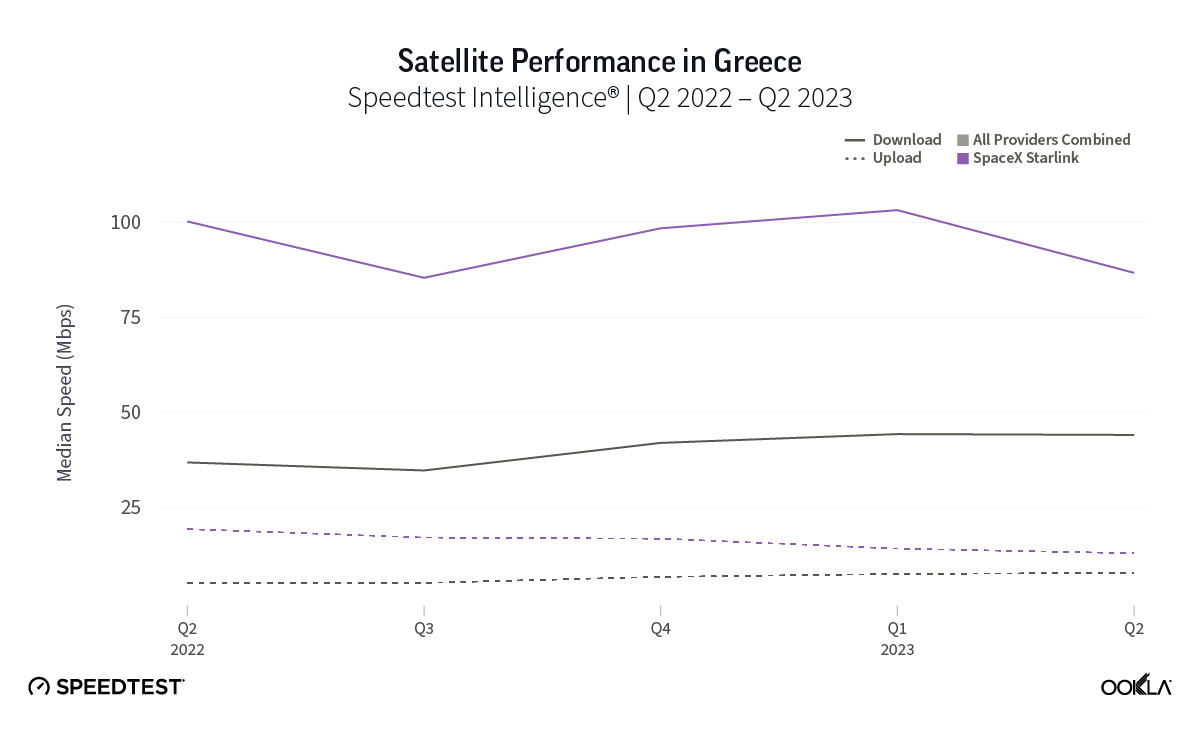
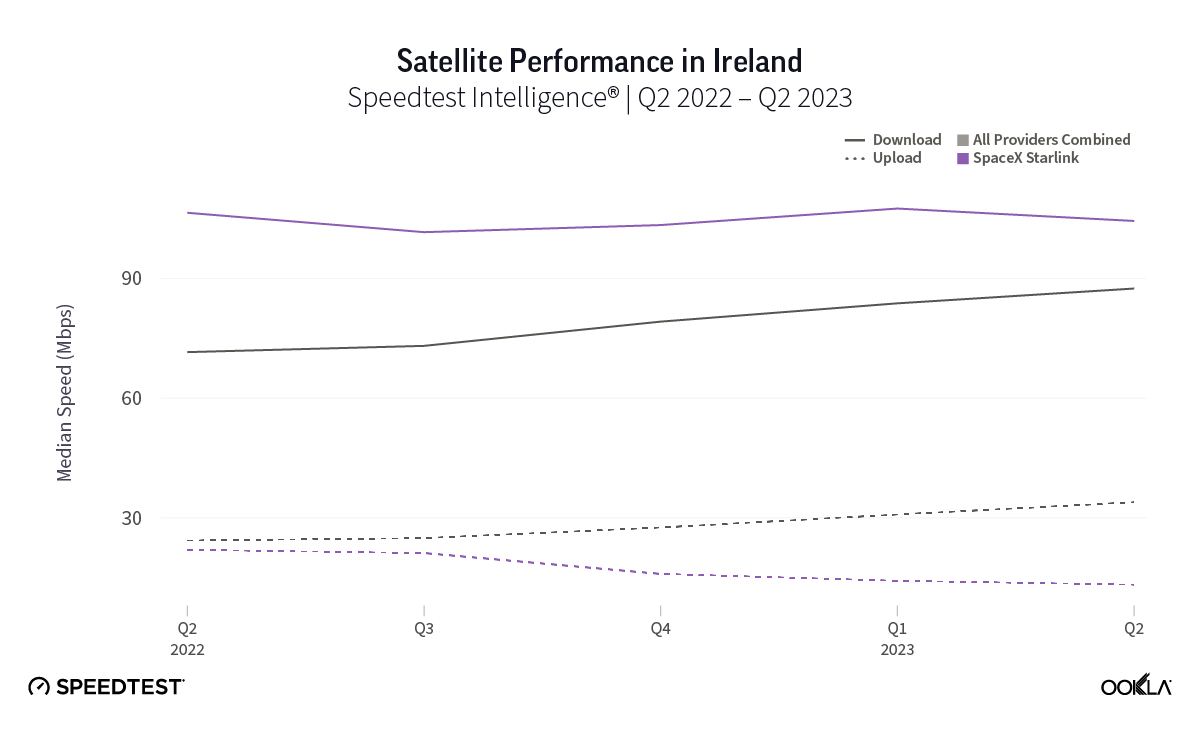
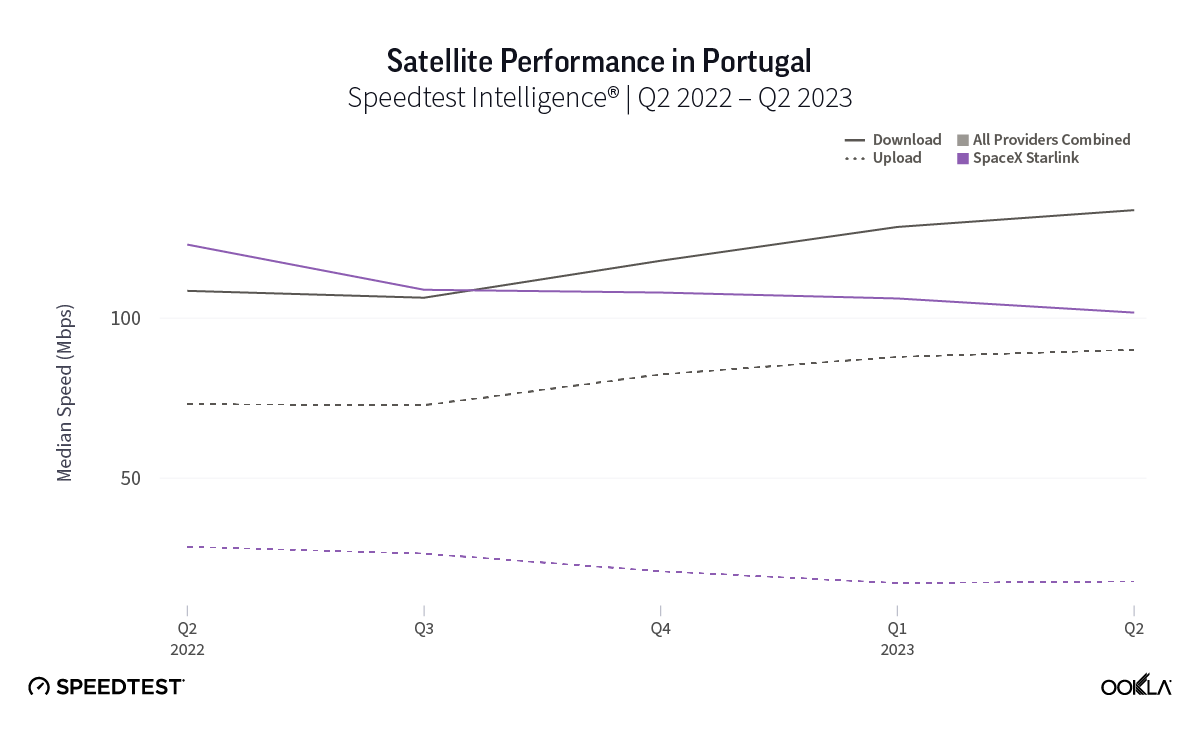
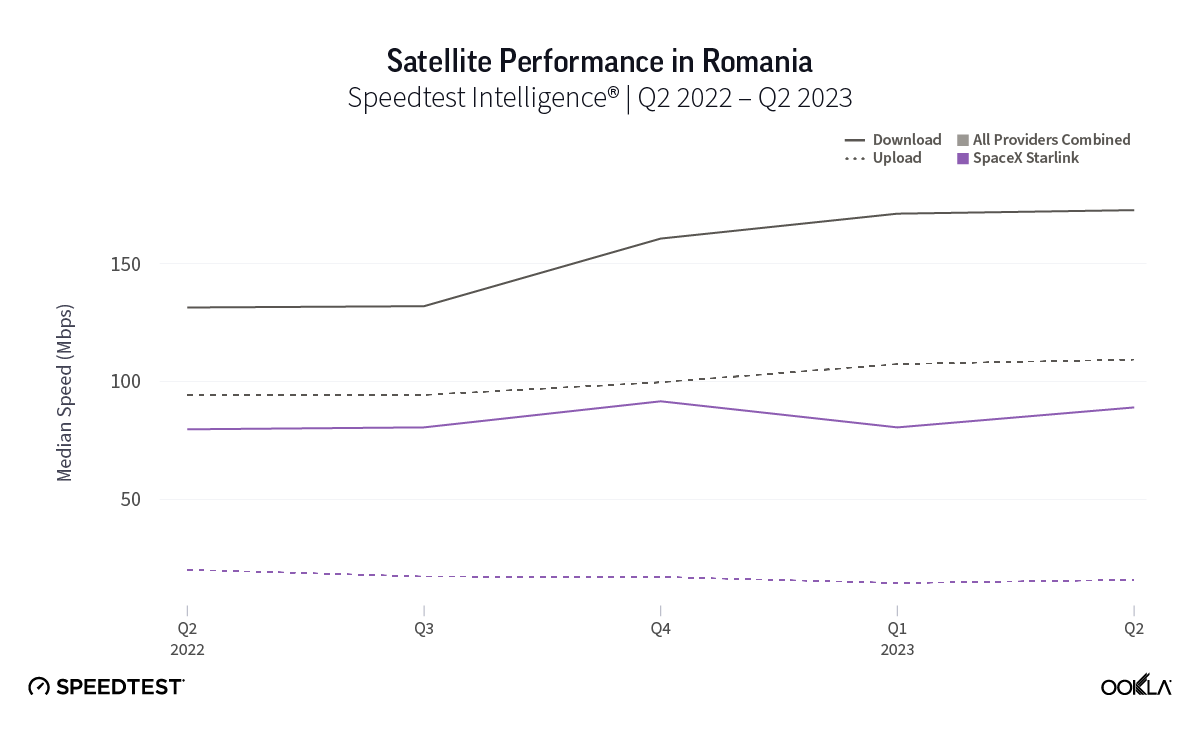
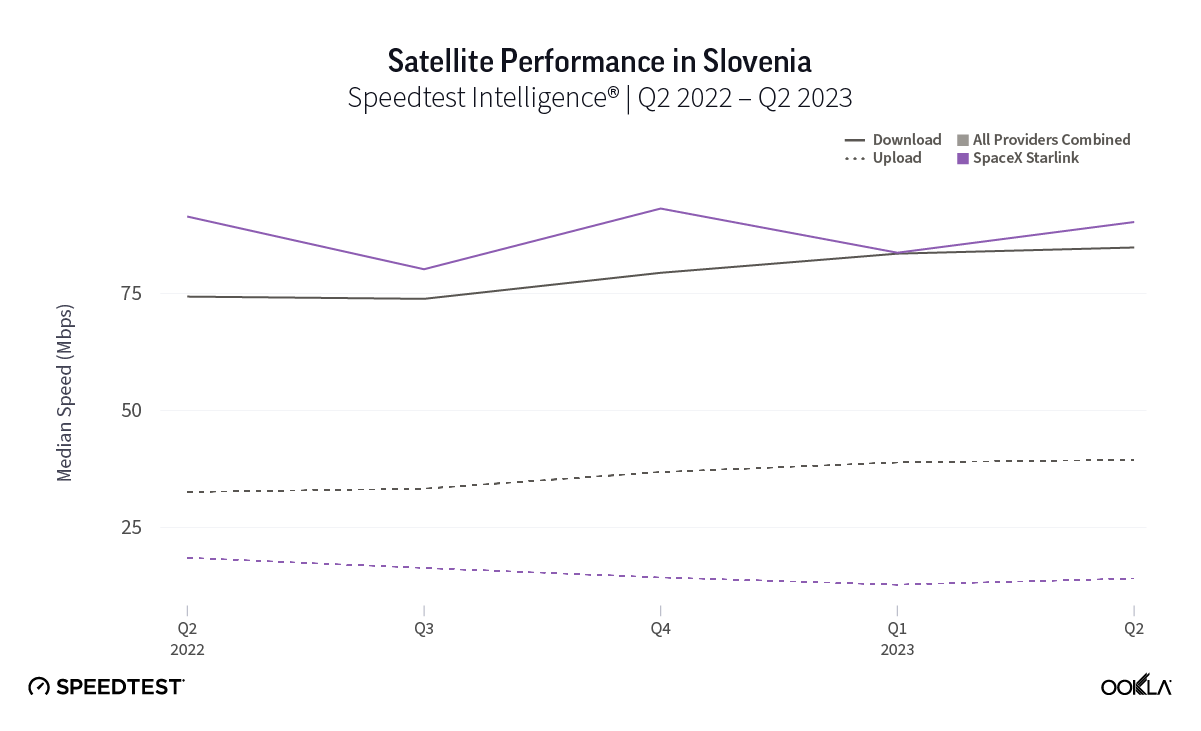
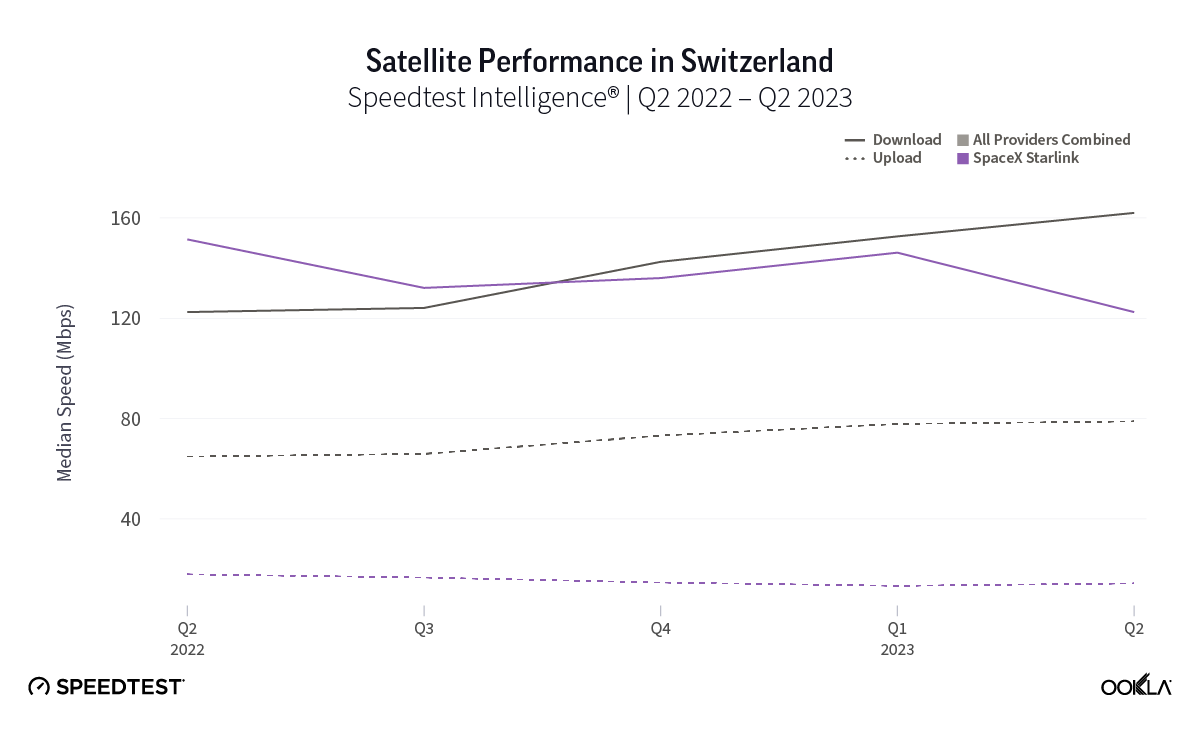
At first glance, year-over-year median download speeds for Starlink are about the same (-5% to 5%) or better (greater than 5%) from Q2 2022 to Q2 2023 in 15 countries and slower (decreasing more than 5%) in 8 countries. But among the 27 countries we surveyed during Q2 2023, Starlink had speeds faster than the aggregate of all fixed broadband providers combined in 11 countries (Austria, Belgium, Bulgaria, Croatia, Czechia, Estonia, Greece, Ireland, Italy, Latvia, and the U.K.) Those speeds were most notably faster in Croatia and Greece for Starlink at 94.41 Mbps to 45.24 Mbps and 108.97 to 44.09 Mbps, respectively, during Q2 2023. Speeds were about the same in four countries (Finland, Slovenia, Germany, and Lithuania), and speeds were slower than the aggregate of fixed broadband providers in 12 countries, most notably in Poland, Spain, Romania, Denmark, and France which saw between 50% and 105% faster aggregate fixed broadband speeds than Starlink.
Quarterly download speeds stabilizing or improving
Looking at results from Q1 2023 to Q2 2023, median download speeds for Starlink remained about the same (between 5% and -5%) in 23 countries, while decreasing in four countries. That’s a big deal, especially given Starlink had median download speeds greater than 100 Mbps in 14 countries, and greater than 90 Mbps in 20 countries, and greater than 80 in 24 countries — with only three countries failing to reach 70 Mbps.
While trailing Starlink speeds, Skylogic recorded median download speeds in Italy at 29.21 Mbps during Q2 2023, a roughly 27% statistical increase year-over-year from 22.28 Mbps during Q2 2022. Notably, Skylogic recorded a median download speed of 68.44 Mbps in Italy during Q1 2023. Among the various countries we recorded Skylogic data for during the past year, the range of median download speeds varied between 19.53 Mbps and 68.44 Mbps, with most speeds between 28 and 50 Mbps, all fast enough to stream 4K video online. Viasat, had relatively similar download speeds in Germany and Italy at 17.22 Mbps and 17.45 Mbps, respectively, during Q2 2023.
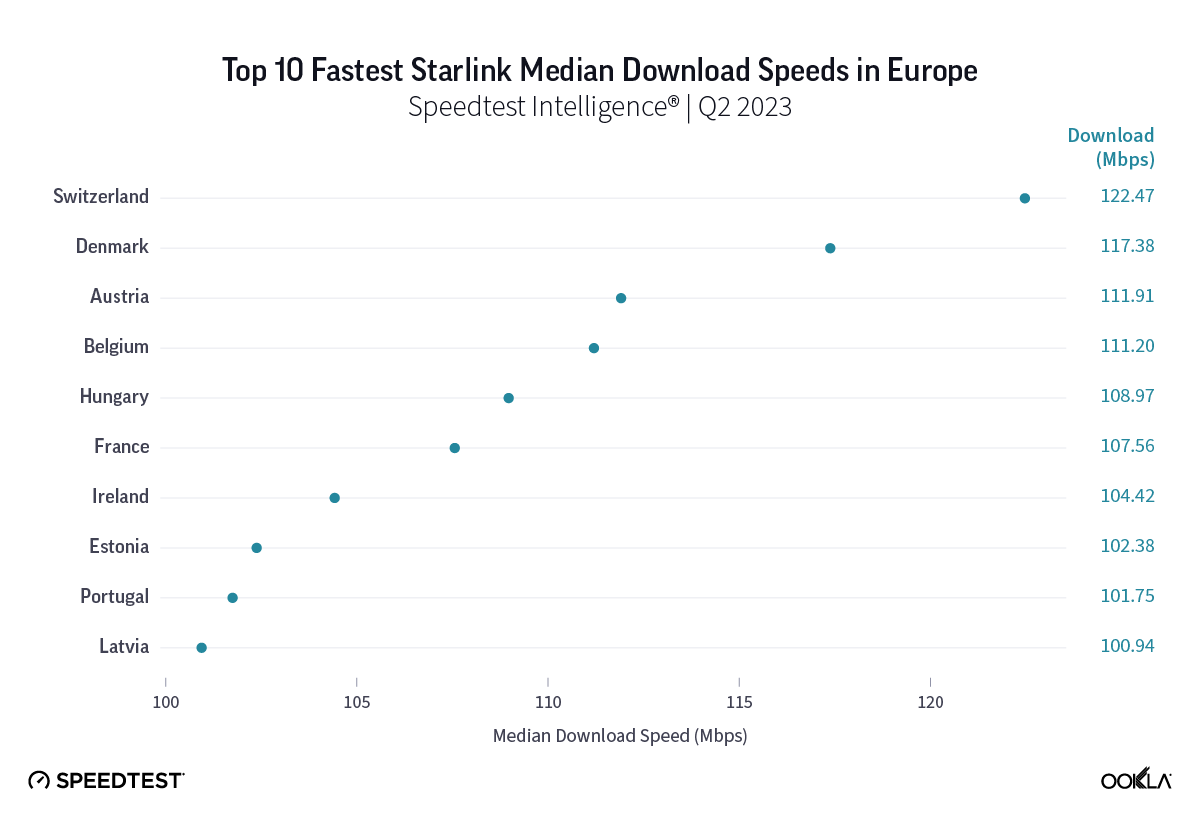
Top 10 fastest Starlink download speeds in European countries
Starlink in Switzerland had one of the fastest median download speed among countries with Starlink during Q2 2023 at 122.47 Mbps, followed by Denmark (117.38 Mbps), Austria (111.91 Mbps), Belgium (111.20 Mbps), Hungary (108.97 Mbps), France (107.56 Mbps), Ireland (104.42 Mbps), Estonia (102.38 Mbps), Portugal (101.75 Mbps), and Latvia (100.94 Mbps). Sweden, Italy, Bulgaria, and the U.K. all followed but had speeds greater than 100 Mbps.
Upload speeds for Starlink are down year over year, but quarterly speeds almost all improved or were about the same
Upload speeds for Starlink mostly decreased notably year over year, with only the U.K. showing an improved median upload speed in Q2 2023 out of 27 countries surveyed. However, looking quarter to quarter, Q2 2023 upload speeds for Starlink stayed about the same or improved in 25 out of 27 countries, with only Greece and Ireland showing declines. For upload speeds, Starlink all 27 countries we surveyed had upload speeds between 10 Mbps and 15 Mbps except Portugal (17.70 Mbps), Hungary (16.91 Mbps), Croatia (16.12 Mbps), Bulgaria (15.93 Mbps), Romania (15.82 Mbps), Spain (15.79 Mbps), and Poland (9.11 Mbps). Starlink in Greece was the only instance of a satellite provider in Europe having an upload speed greater than the aggregate of all fixed providers combined, 12.97 Mbps for Starlink to 7.85 Mbps for the aggregate of fixed broadband providers combined. Skylogic showed upload speeds lower than 4 Mbps in both Austria and Italy during Q2 2023. Viasat had upload speeds of 3.51 Mbps in Germany and 4.69 Mbps in Italy during Q2 2023.
Multi-server latency is stabilizing for Starlink users across Europe
As an low-earth orbiting (LEO) satellite internet provider, Starlink has a leg up on some satellite competitors who rely on further away geosynchronous-earth orbit (GEO) and medium-earth orbit (MEO) satellite constellations. However, once again, all the aggregates of all fixed broadband providers in Europe had much lower multi-server latencies than Starlink, Viasat (which had latencies over 600 ms) and Skylogic (which had latencies over 700 ms). That being said, Starlink still saw multi-server latencies under 60 ms in the U.K. (51.26 ms), Spain (53.37 ms), Portugal (55.84 ms), and Belgium (59.34 ms). Starlink saw most countries’ multi-server latencies between 60 and 90 ms.
Starlink speeds stabilize in Oceania
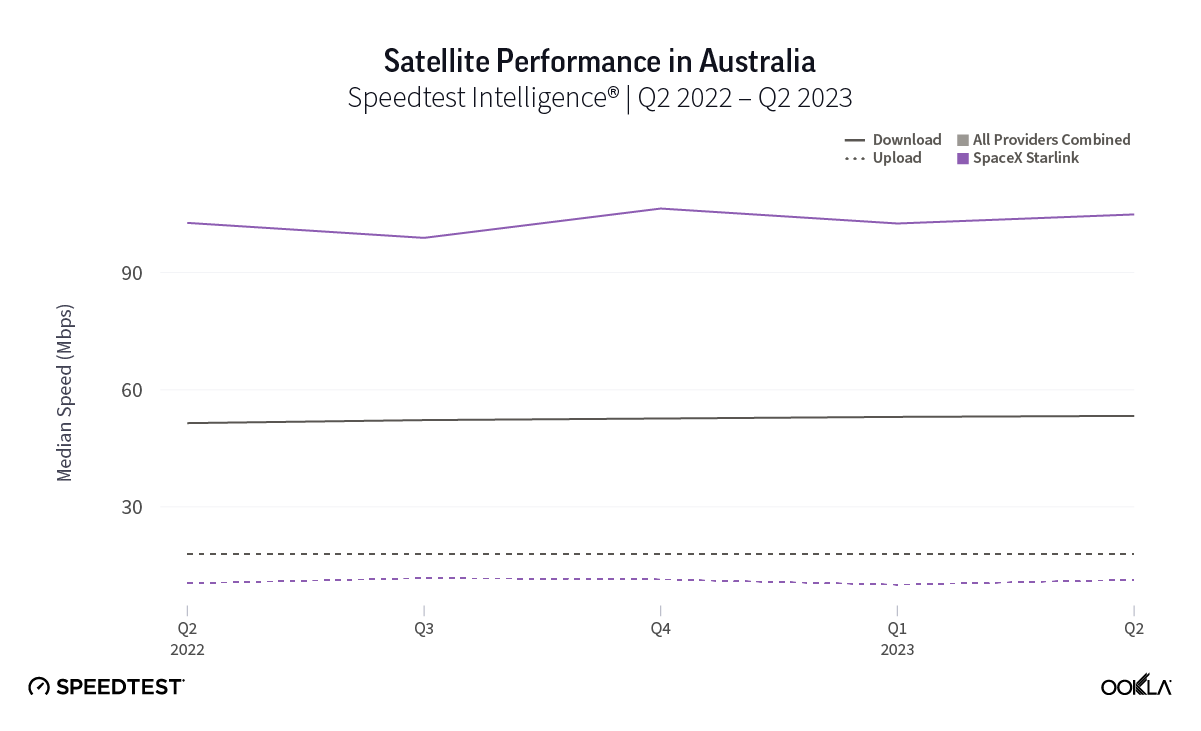
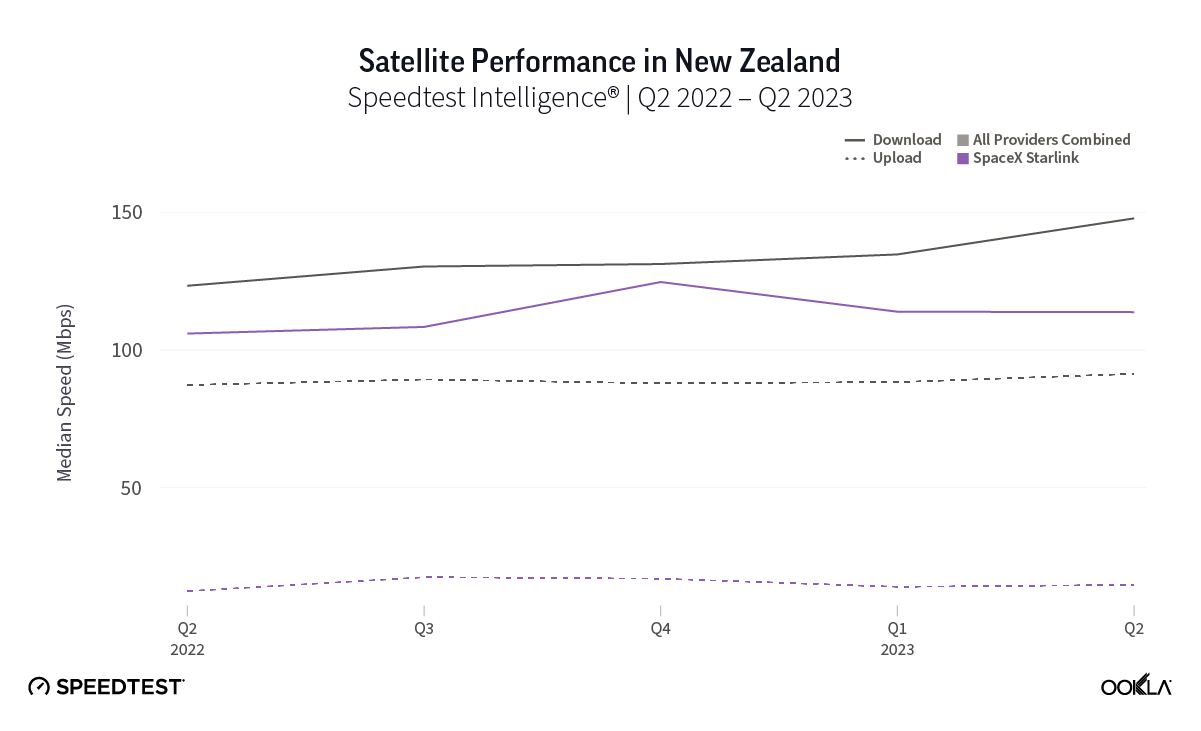
Oceania, the second least densely populated continent in the world to Antarctica, has rural and remote populations that benefit from (and even rely on) satellite internet connections. Luckily for rural and remote Starlink users, they’ve probably seen a good amount of stability over the past year with Q2 2023 median download speeds in New Zealand at 113.78 Mbps (105.99 Mbps in Q2 2022) and Australia at 104.92 Mbps (102.76 Mbps in Q2 2022). Tonga, which is very remote, saw download speeds drop from 45.25 Mbps in Q2 2022 to 37.95 Mbps in Q2 2023.
Upload speeds also showed some stability with Australia going from 10.45 Mbps in Q2 2022 to 11.33 Mbps during Q2 2023 and New Zealand going from 12.31 Mbps to 14.62 during the same time period. Tonga saw a notable drop in speeds year over year from 19.26 Mbps in Q2 2022 to 6.66 Mbps Q2 2023.
Multi-server latency, which usually will be higher for satellite internet options, showed promising results for Starlink in Oceania during Q2 2023. Multi-server latency dropped noticeably in New Zealand year over year, going from 89.38 ms in Q2 2022 to 46.42 ms in Q2 2023. Australia saw a more modest drop with multi-server latency going from 63.04 ms to 59.78 ms from Q2 2022 to Q2 2023. Tonga saw an increase in multi-server latency from 125.24 ms to 137.16 ms during the same time period.
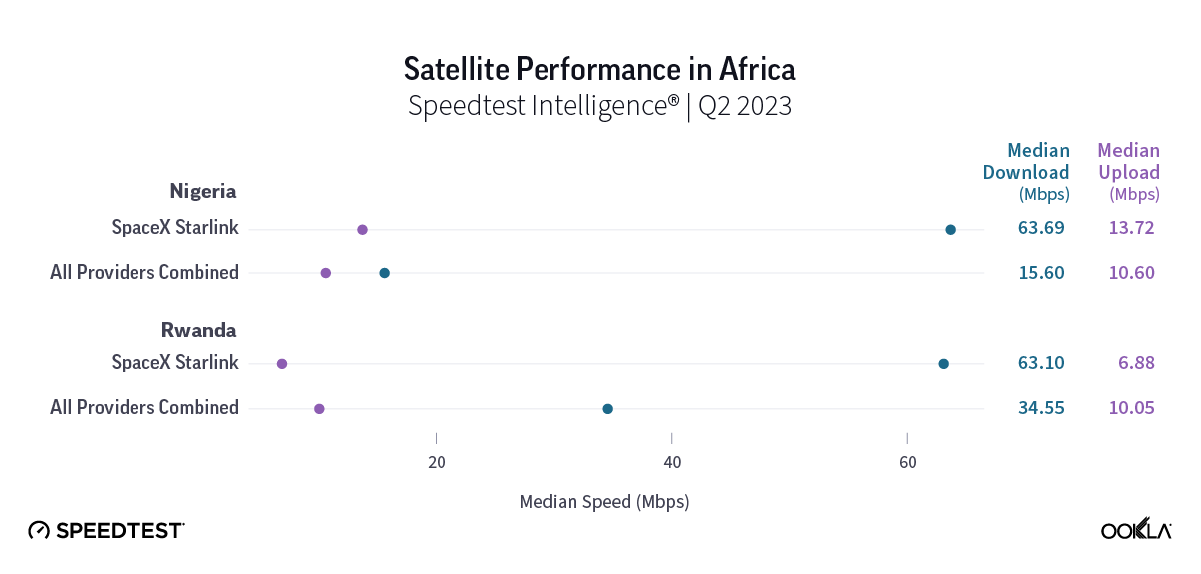
Starlink in Africa is off to a promising start
Starlink, which first launched on the African continent in Nigeria this past January, is showing intriguing early results. Speedtest Intelligence showed that Starlink in Nigeria had a faster median download speeds than all aggregate fixed broadband providers combined at 63.69 Mbps to 15.60 Mbps during Q2 2023. Upload speeds were more similar during the same time period with Starlink at 13.72 Mbps and the aggregate of all fixed broadband providers combined at 10.60 Mbps. Starlink did have a marginally higher multi-server latency at 55.88 ms to 50.26 ms during Q2 2023.
In Rwanda, median download speeds were a little closer with Starlink recording a median download speed at 63.10 Mbps in Q2 2023 compared to the aggregate of all fixed broadband providers combined at 34.55 Mbps. Starlink trailed behind for median upload speed at 6.88 Mbps to 10.05 Mbps for fixed broadband providers during Q2 2023. Multi-server latency for Starlink was much higher at 320.45 ms to 29.04 ms for fixed broadband providers during the same time period.
The 2023 space revolution is off to a huge start
Here are some major updates about what’s next for various different satellite competitors:
After delays, Amazon’s Project Kuiper aim to launch prototype satellites this fall
China’s grand ambitions to provide internet connectivity to over 362 million people
According to the Wall Street Journal, over 362 million people in China don’t have access to the internet — which is about 1 in every 4 people in China, a large portion of which live in rural or remote communities. In order to overcome that connectivity gap, China is looking to the sky to create its own satellite constellation with potentially over 12,000 satellites. China’s biggest gap seems to be with recreating the success of SpaceX’s reusable rockets — however, initial tests are far underway and a host of reusable rockets are slated for test launches in 2024.
SpaceX’s Starlink service offerings are about to rapidly expand
While Starlink continues to lead among satellite providers in most areas of the world, their expansion is only starting. Looking at the Starlink availability map, Starlink has an incredibly busy rest of 2023 and 2024 in Africa, Asia, and South America — and they’re marking their intent to expand into most of the world. That comes as Starlink marked launching over 5,000 satellites into space at the end of August. With some wiley entrepreneurs already renting out their Starlink “Dishy McFlatfaces” to vacationers and campers for $25-30 dollars a day, satellite connectivity is truly becoming a full-time gig.
Viasat’s bad luck might affect entire industry
Viasat launched the first of its three long-awaited Viasat-3 arrays — but then their first satellite suffered an antenna anomaly, which prevented a large reflector to deploy that affects whether or not the satellite can operate as intended. While Viasat is rushing to solve the issue, this could ultimately trigger a $420 million insure claim for the loss of the $700 million satellite. With such a high-value loss, this could send ripples through the satellite industry, causing insurance premiums to skyrocket for companies looking to mitigate potential losses through insurance. All of this comes on the heels of acquiring Inmarsat in May for $7.3 billion to expand its satellite arrays and spectrum holdings. We’ll be watching to see whether or not Viasat can find a solution.
Eutelsat and OneWeb merger imminent, big moves abound
The Eutelsat and OneWeb merger should make competitors take notice — combining satellite networks, expanding enterprise offerings, and competing in emerging markets has big revenue potential — with OneWeb having an already established LEO network of 630 satellites and Eutelsat offering 36 GEO satellites. Of note, OneWeb recently inked a deal with Telstra in Australia to provide satellite backhaul for locations “where satellite backhaul is a preferred or only viable option.” OneWeb is also partnering with the European Space Agency to develop a next-gen 5G beam-hopping satellite, which could quickly increase connectivity for people traveling or for disaster areas that need emergency connectivity. Shareholders are set to vote on approving the merger on Sept. 28.
European Union greenlights multi-orbit constellation
HughesNet aiming to launch Jupiter 3 array in Q2 2023
HughesNet successfully launched its Jupiter 3 array on July 29, which aims to provide U.S. and Latin America consumers with higher broadband download speeds. While the actual satellite will take some time to reach its geosynchronous orbit and deploy, this satellite adds 500 Gbps of Ka-band capacity for HughesNet, which could see consumers reaching download speeds between 50 Mbps and 100 Mbps. We’ll be eagerly awaiting Speedtest® results from HughesNet’s Jupiter 3 array.
Ookla will continue monitoring new satellite internet developments
2023 continues to be an important year for satellite internet providers. Satellite connectivity is something we’ll be watching closely and we’ll continue our series next quarter with Q3 2023 data from select continents including North America. In the meantime, be sure to download the Speedtest app for Windows and Mac computers or for iOS or Android for devices and see how your satellite internet stacks up to our results.
Ookla retains ownership of this article including all of the intellectual property rights, data, content graphs and analysis. This article may not be quoted, reproduced, distributed or published for any commercial purpose without prior consent. Members of the press and others using the findings in this article for non-commercial purposes are welcome to publicly share and link to report information with attribution to Ookla.
Ookla® has exciting, fresh data from Q3 2022 for SpaceX’s Starlink, HughesNet, and Viasat in North and South America, as well as new Starlink markets we haven’t yet featured in our ongoing series on satellite internet. With accelerating competition on the horizon for 2023, we’ve been eager to see how Starlink continues to perform, especially as building new fiber connections continues to be costly around the world.
This analysis includes results from five additional countries, two new providers, and expanded data for Starlink, HughesNet, and Viasat. We also examine how Starlink’s internet performance has changed over the past year in Canada, Chile, and the United States.
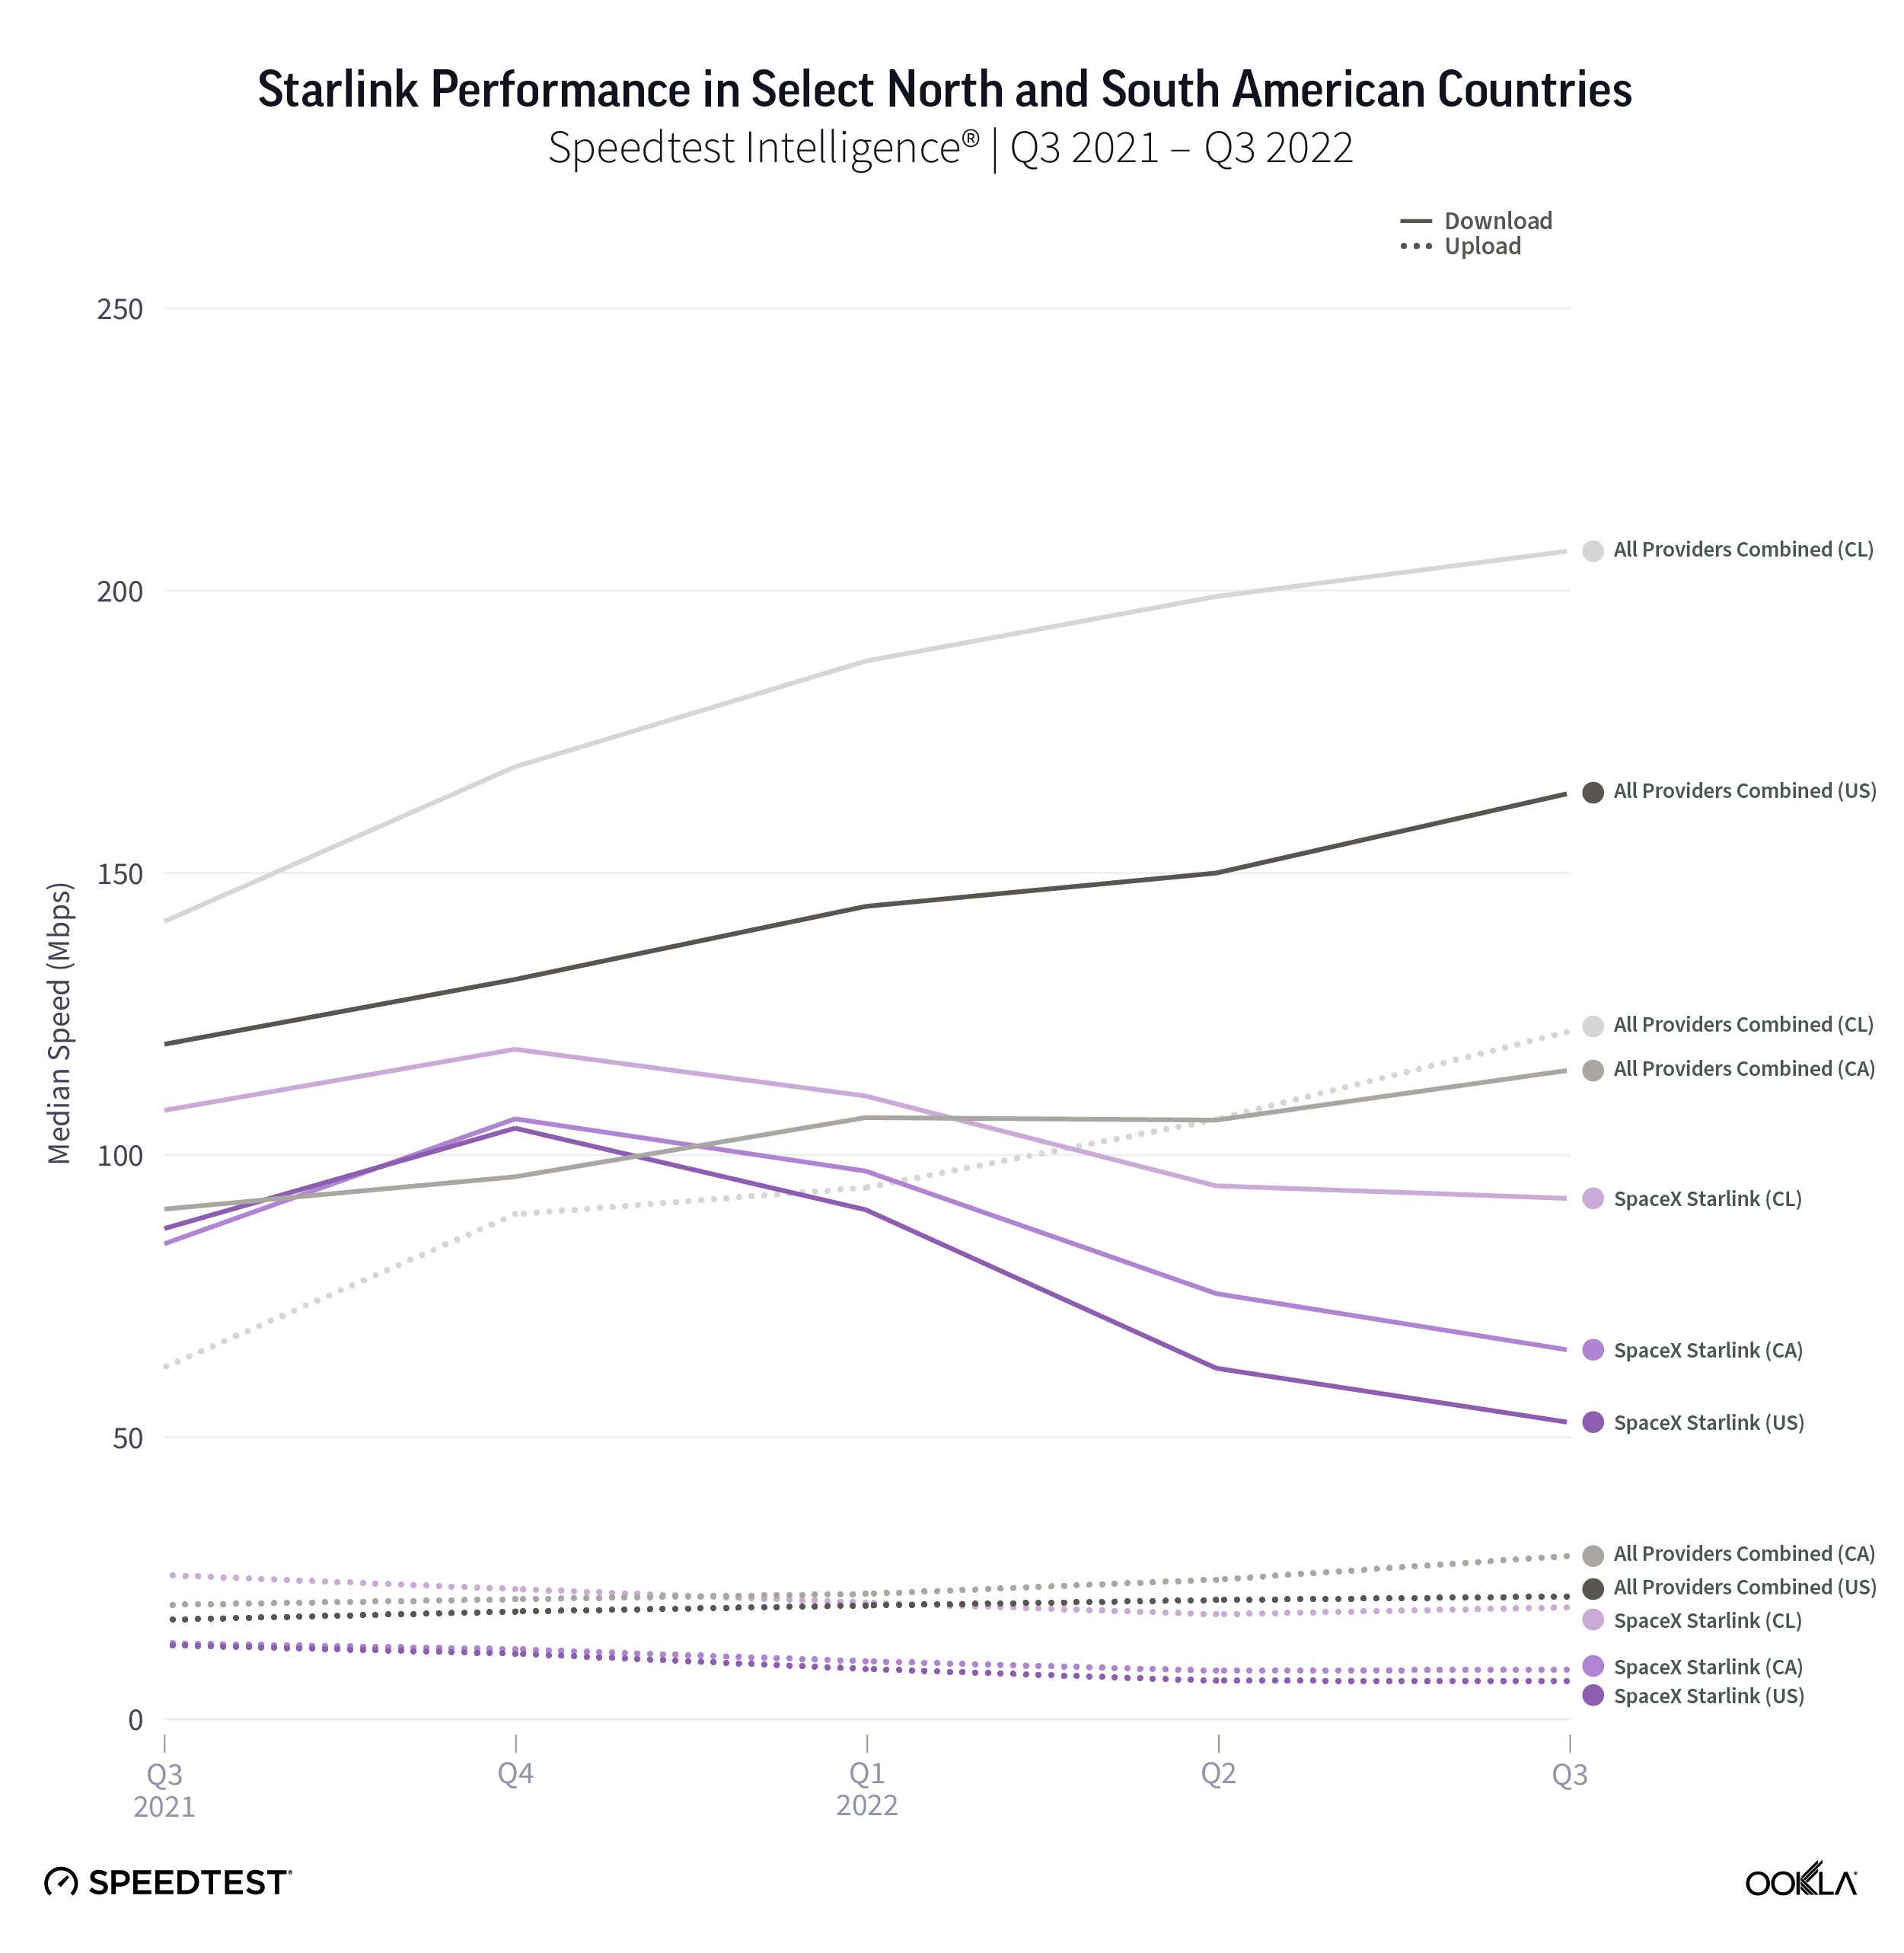
Starlink performance dipped once again during Q3 2022 (though only slightly)
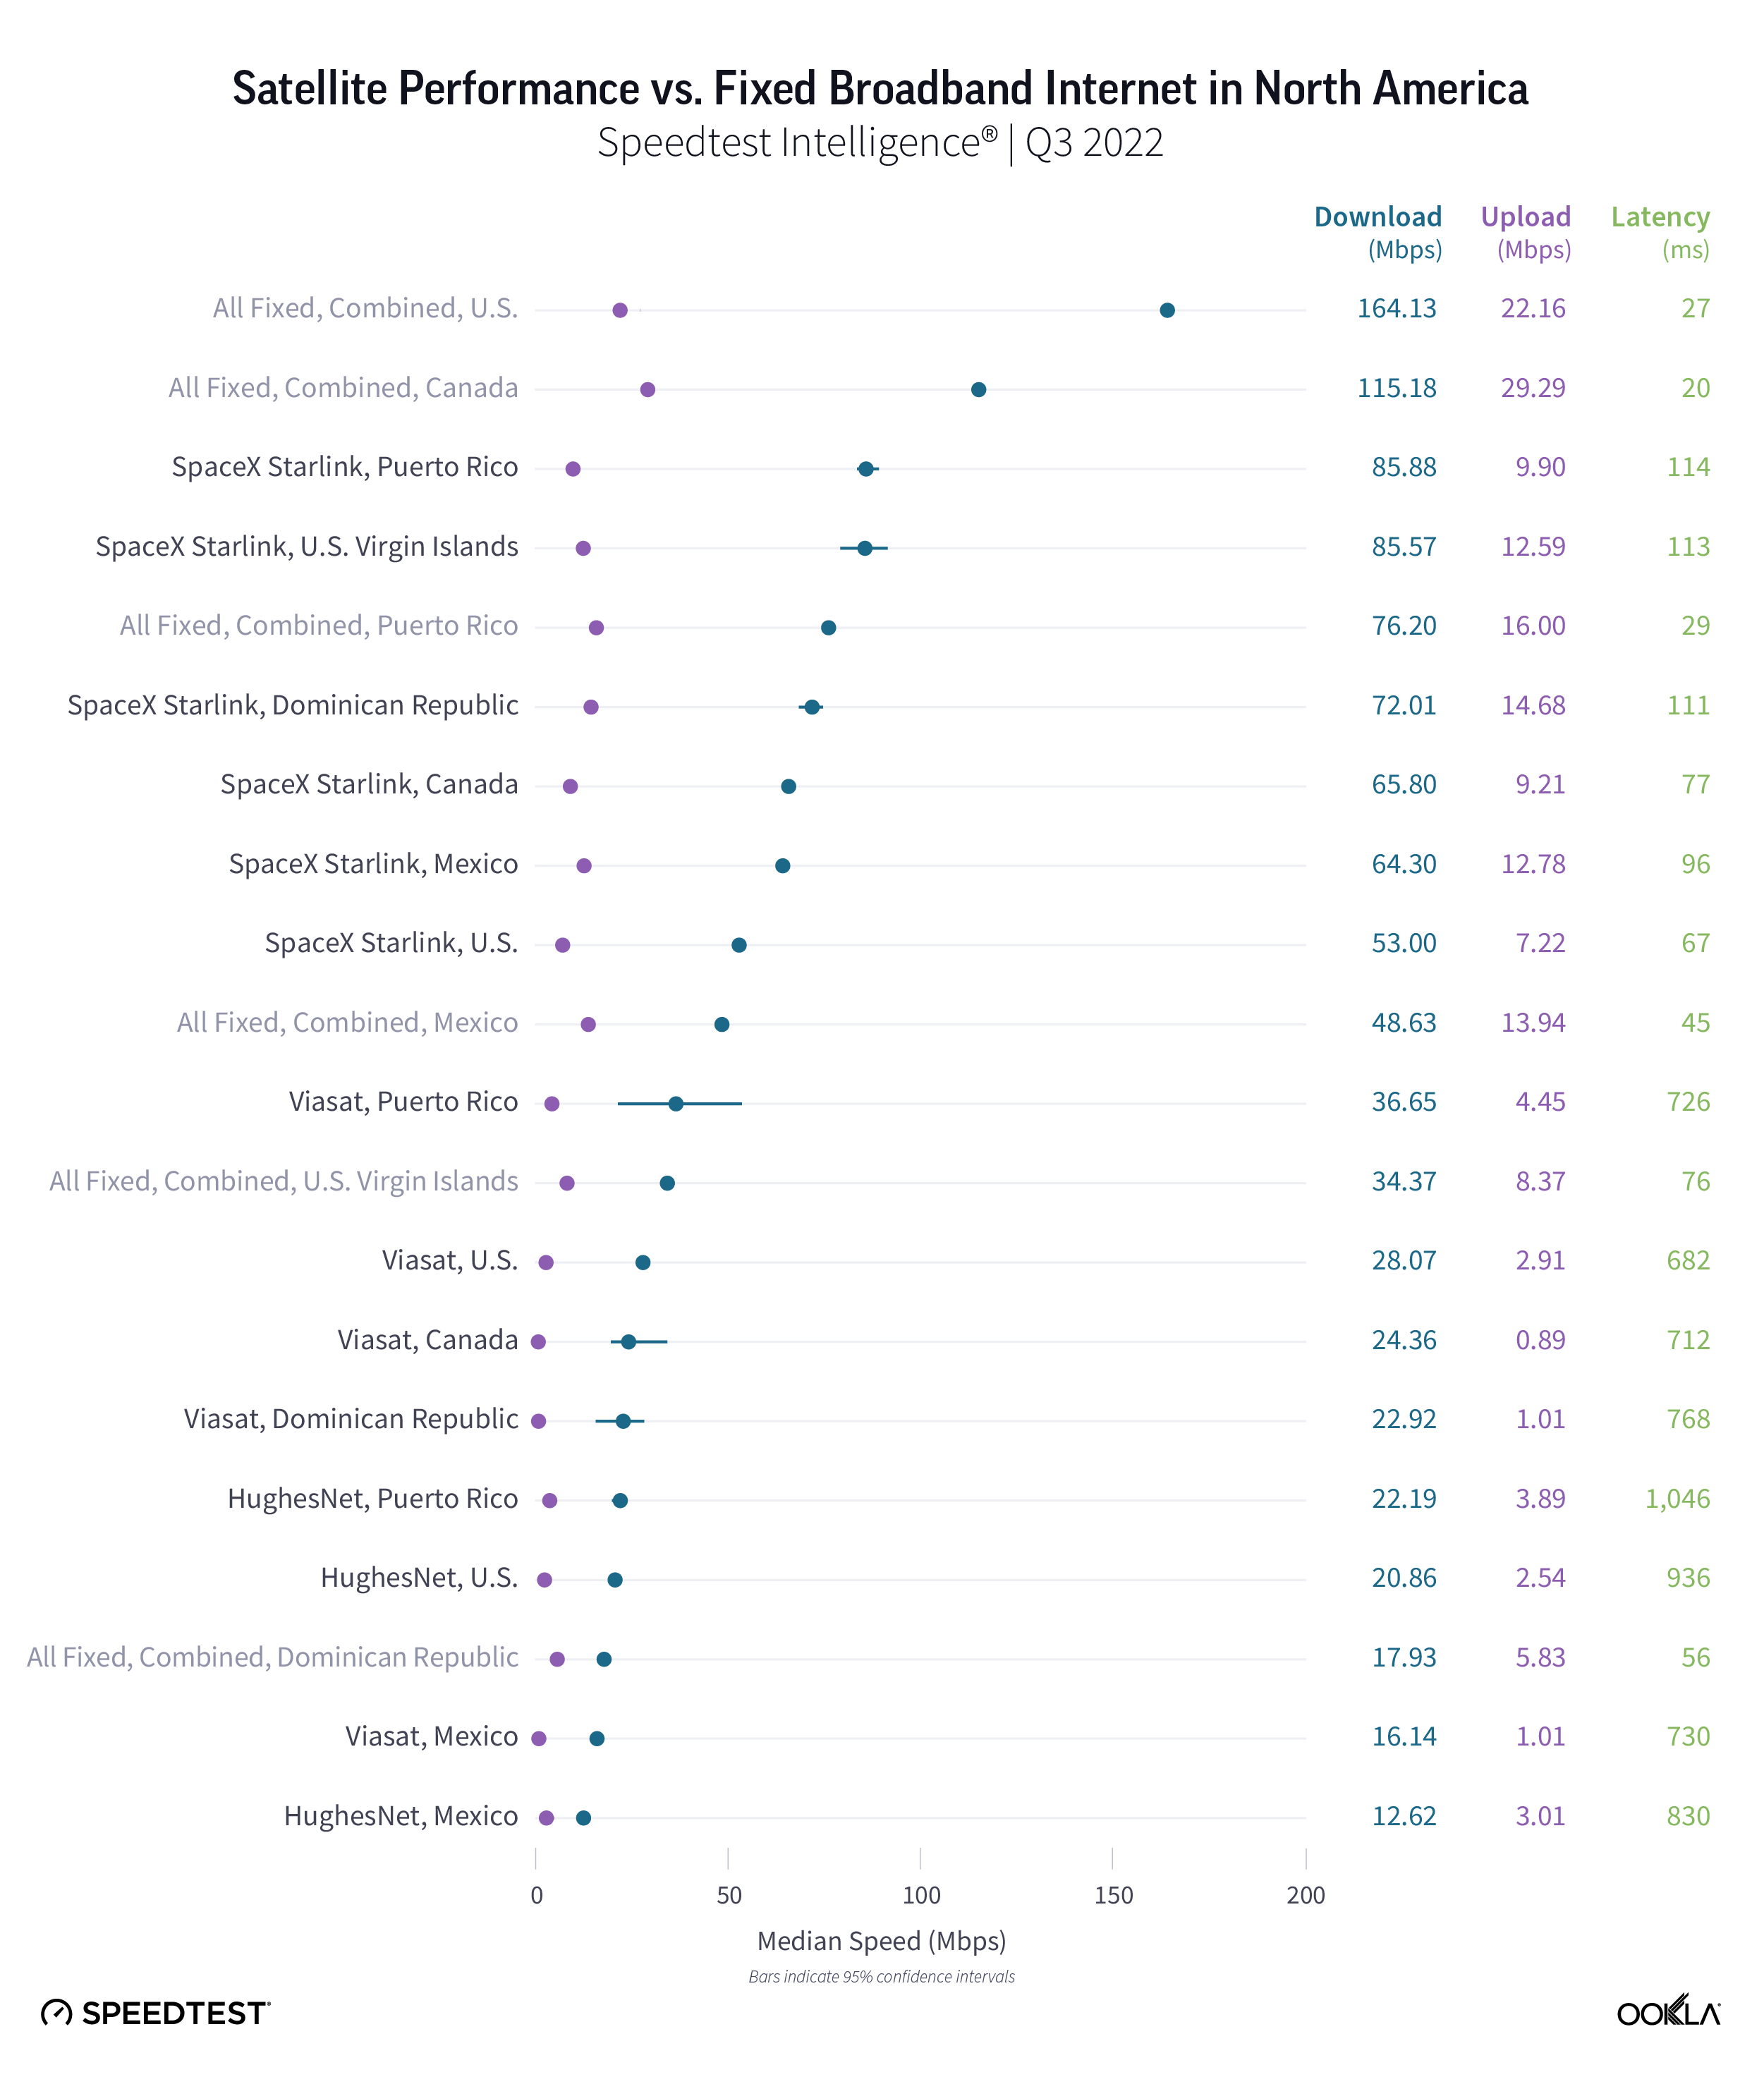
Perhaps a victim of their own success, Starlink download speeds dropped once again in Canada (at least 14%) and the U.S. (at least 17%) from Q2 to Q3 2022, while speeds remained roughly the same in Chile quarter over quarter. During the same period, fixed broadband performance raced ahead, improving at least 8% to 115.18 Mbps in Canada, at least 4% to 207.04 Mbps in Chile, and at least 8% to 164.13 Mbps in the U.S.
Over the past year, as we’ve seen more users flock to sign up for Starlink (reaching 400,000 users worldwide during Q2 2022), speeds have started to decrease. Without a doubt, Starlink often can be a life-changing service for consumers where connectivity is inadequate or nonexistent. Even as speeds slow, they still provide more than enough connectivity to do almost everything consumers normally need to do, including streaming 4K video and video messaging. The biggest thing you might have issues with is if you’re trying to play multiplayer online games — even being a low-earth orbit (LEO) satellite, latency still lags far behind low-latency fixed broadband connections.
Starlink upload speeds remained roughly unchanged in all three countries we surveyed during Q3 2022, improving marginally in Canada and Chile, and essentially staying the same in the U.S.
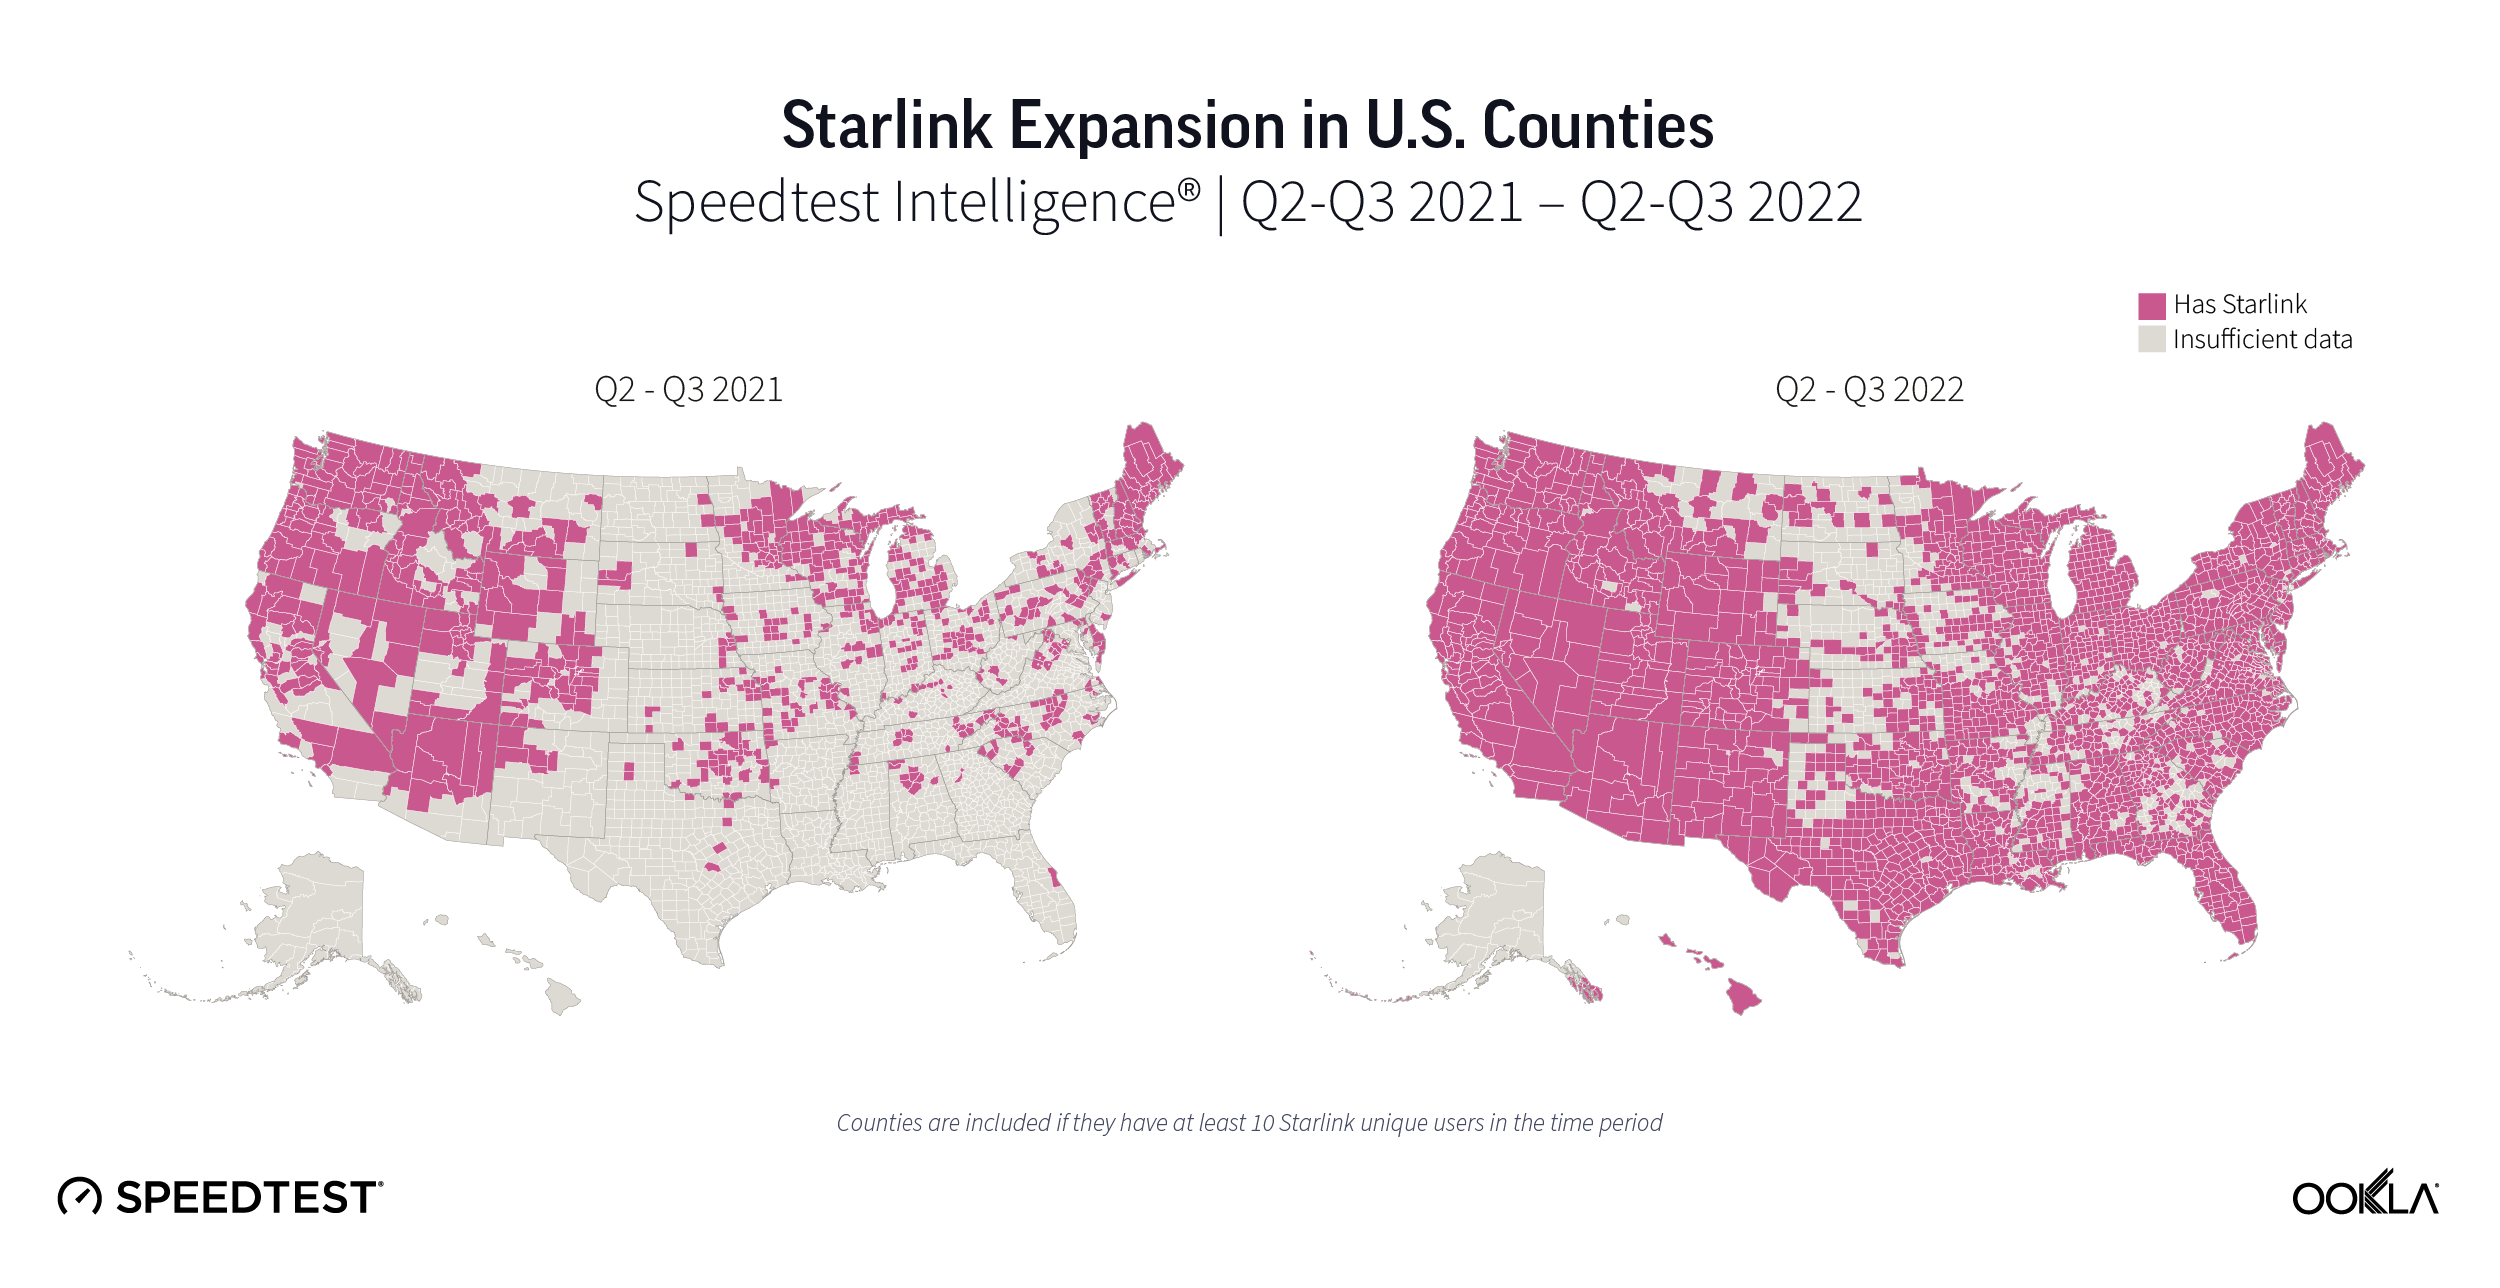
Starlink remains a boon for rural U.S. consumers who can afford it
Over the past year, Starlink has proliferated across the U.S., going from having at least 10 unique users in 776 U.S. counties, or roughly 25% of all counties during Q2-Q3 2021 to 2,399 counties in Q2-Q3 2022, or roughly 75% of counties. That marks about a 200% increase year over year, indicating consumer confidence in the provider.
Looking at only “nonmetro” counties as defined by the U.S. Office of Management and Budget, 336 counties showed at least 10 Starlink users in Q2-Q3 2021. That was about 17% of all nonmetro counties. In Q2-Q3 2022, that rose to 1359 counties, or about 69% of nonmetro counties, marking about a 300% increase year over year.
Starlink in Puerto Rico and the U.S. Virgin Islands had the fastest satellite internet in North America
Speedtest Intelligence® reveals that Starlink in Puerto Rico and the U.S. Virgin Islands had the fastest median download speed among satellite providers in North America at 85.88 Mbps and 85.57 Mbps during Q3 2022. Starlink in the Dominican Republic (72.01 Mbps), Canada (65.80 Mbps), Mexico (64.30 Mbps), and the U.S. (53.00 Mbps) followed. Starlink had faster median download speeds than all fixed broadband providers combined in all of these countries except Canada and the U.S., and Viasat outperformed fixed broadband in the Dominican Republic (22.92 Mbps).
Viasat and HughesNet recorded their fastest median download speeds in Puerto Rico at 36.65 Mbps and 22.19 Mbps, respectively. Almost every satellite provider on our list reached speeds fast enough to stream high-quality video at around 20 Mbps, though latency still was much higher than fixed broadband internet.
For upload speeds, Starlink outperformed fixed broadband providers combined in the Dominican Republic (14.68 Mbps to 5.83 Mbps) and the U.S. Virgin Islands (12.59 Mbps to 8.37 Mbps). Fixed broadband providers in Canada had the fastest upload on our list at 29.29 Mbps.
Multi-server latency showed satellite internet’s limits, with the huge distances between satellite and receivers adding up to long lags — and every satellite provider with higher latencies than fixed broadband providers. However, the Dominican Republic and U.S. Virgin Islands still had higher fixed broadband multi-server latencies at 55.45 ms and 76.15 ms, respectively. Starlink in the U.S. had the lowest multi-server latency at 67.16 ms, followed by Canada (77.32 ms), and Mexico (96.42 ms), which were the only satellite options that had a multi-server latency under 100 ms.
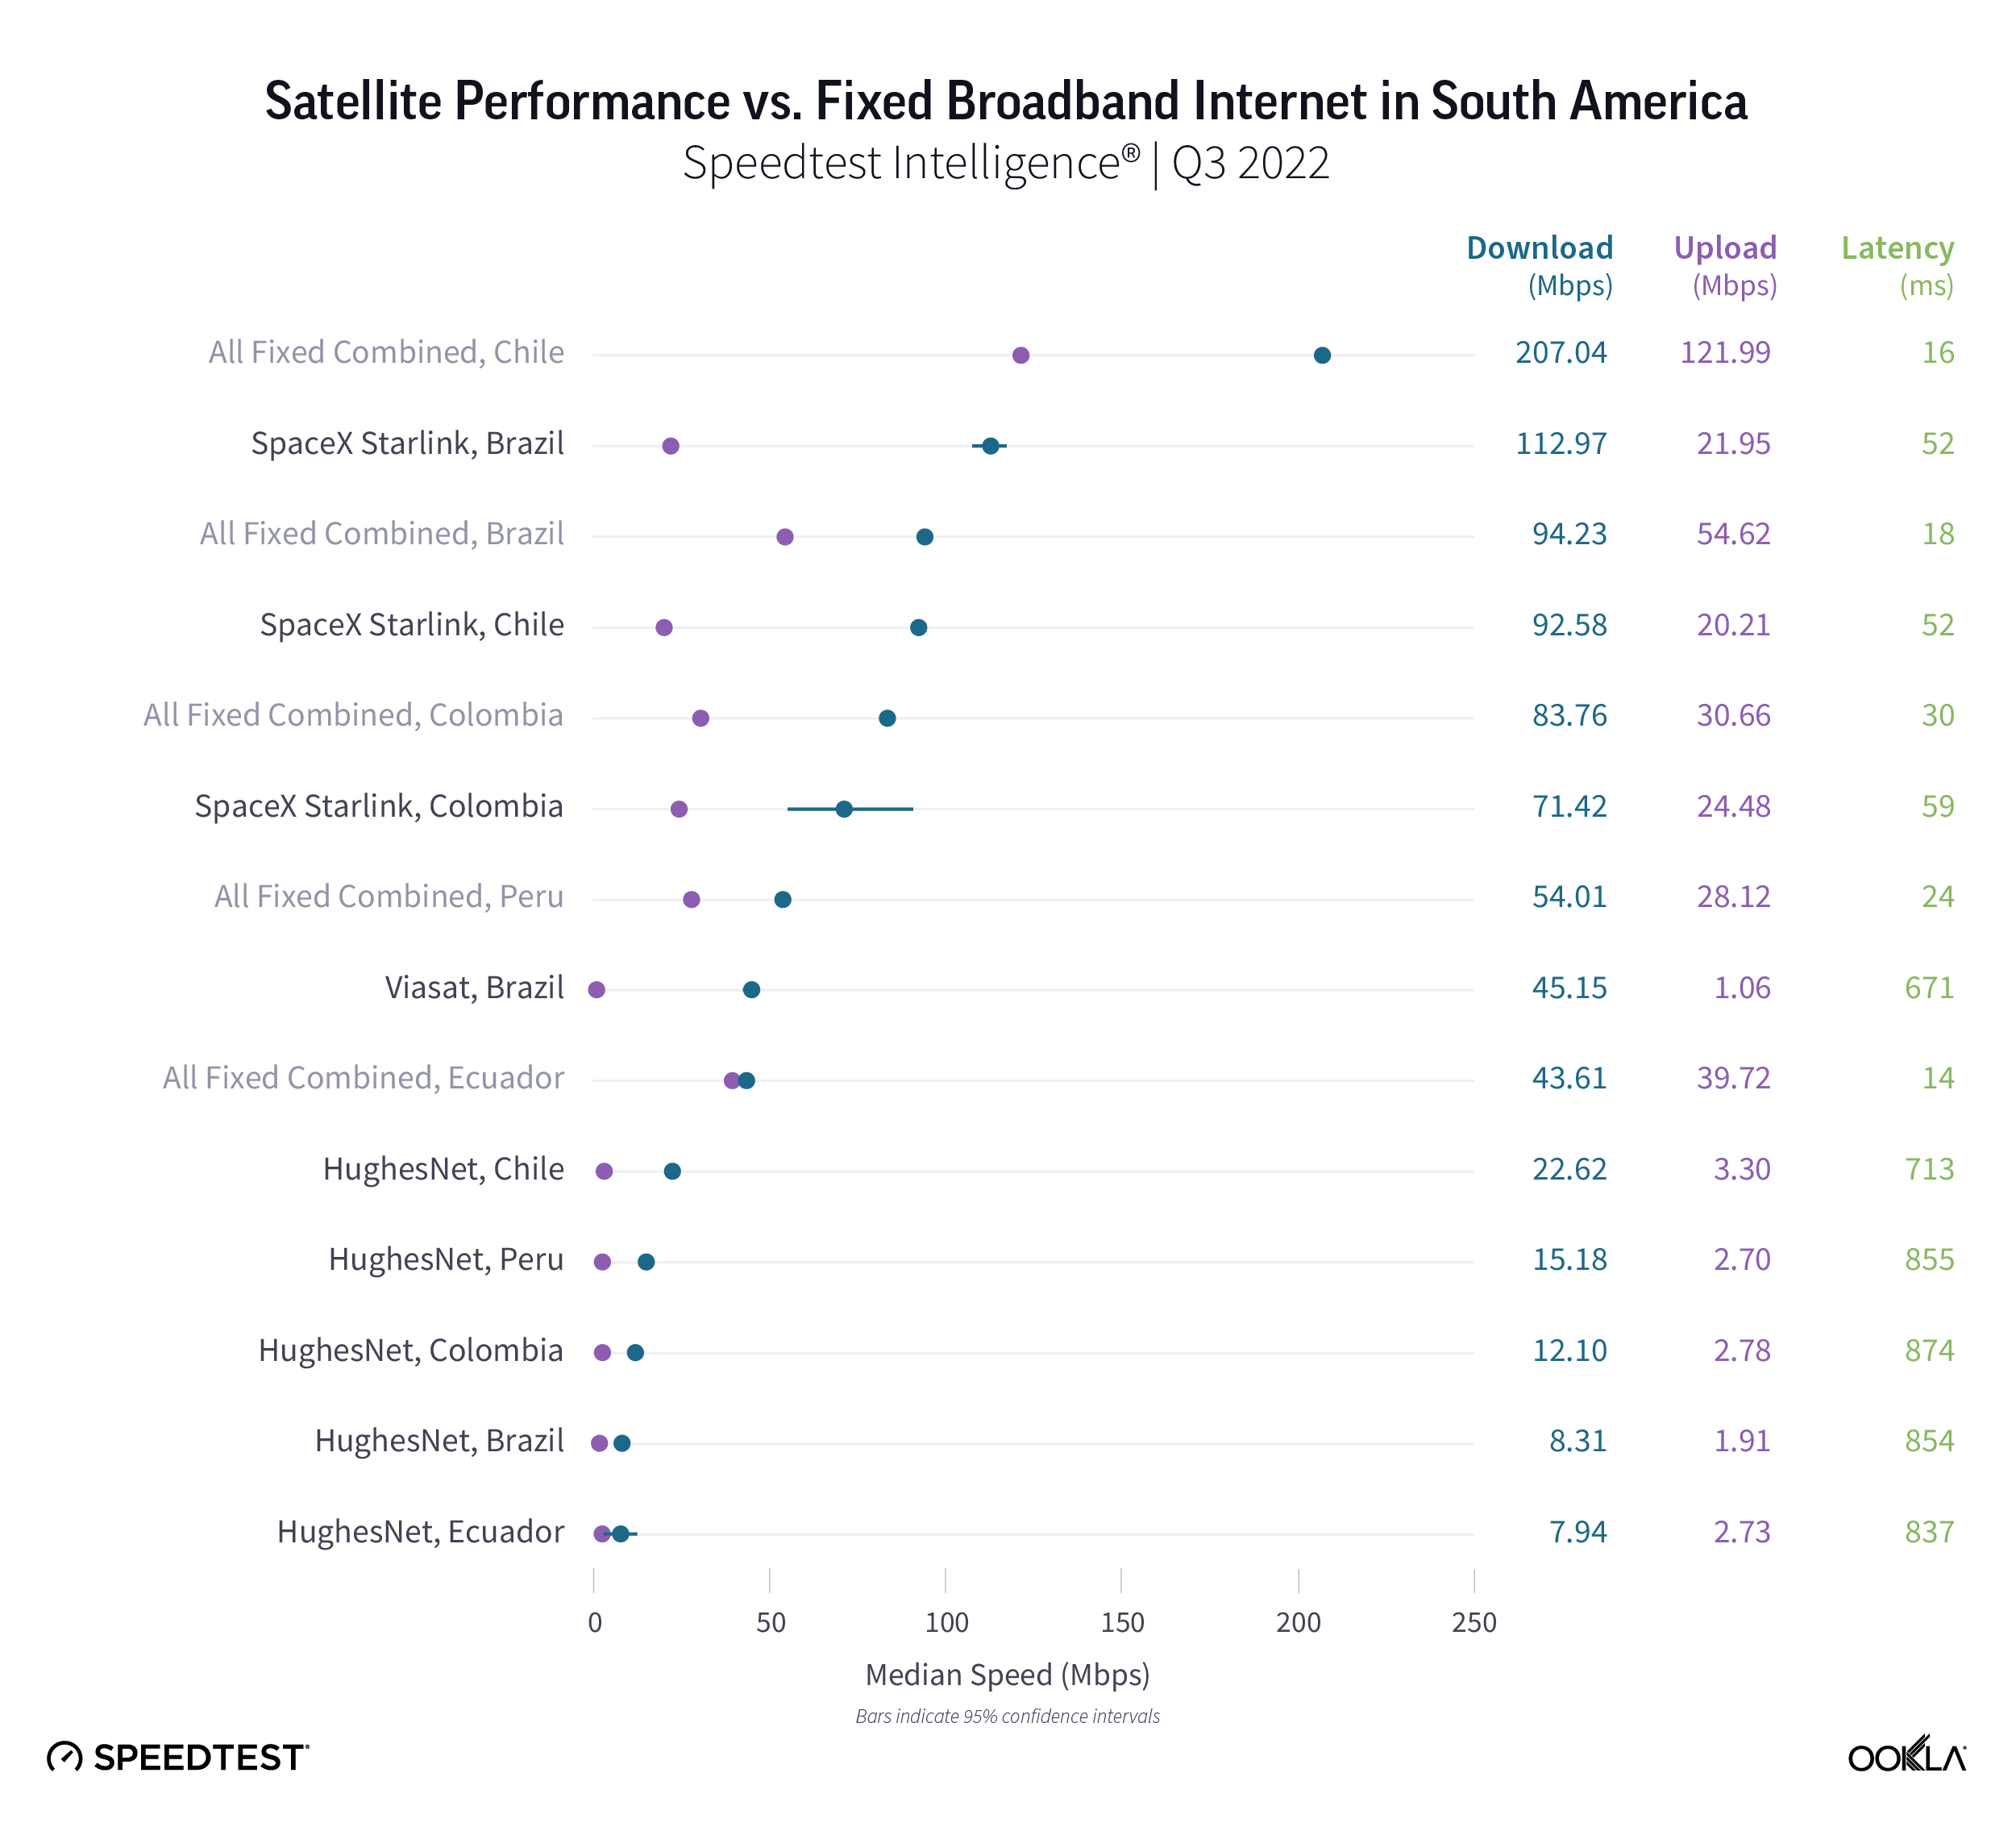
Starlink in Brazil was the fastest satellite provider in South America
Brazilian satellite consumers weren’t lacking for fast internet options during Q3 2022, with Starlink blazing ahead among satellite providers in South America at 112.97 Mbps. Even Viasat notched a respectable median download speed of 45.15 Mbps. Starlink in Brazil was also the only satellite provider to outperform its country’s fixed broadband speeds, with ultrafast fixed broadband in Chile pulling ahead of Starlink 207.04 Mbps to 92.58 Mbps. Colombia was statistically too close to call in Q3 2022 with Starlink at 71.42 Mbps and fixed broadband at 83.76 Mbps. HughesNet trailed far behind with its fastest speed in Chile at 22.62 Mbps during Q3 2022.
For upload speeds, fixed broadband providers in every country we surveyed were faster than their satellite counterparts during Q3 2022. Starlink in Colombia had the fastest upload speed among satellite providers at 24.48 Mbps.
Speedtest Intelligence reveals multi-server latency told a similar story, with every country’s fixed broadband providers having a lower multi-server latency than their satellite counterparts. However, Starlink in Brazil and Chile had the lowest satellite multi-server latencies at 52.21 ms and 52.32 ms, respectively, during Q3 2022. Viasat and HughesNet lowest latencies were far behind with Viasat in Brazil at 670.63 ms and HughesNet in Chile at 713.04 ms.
New Q3 2022 Starlink countries have mixed results
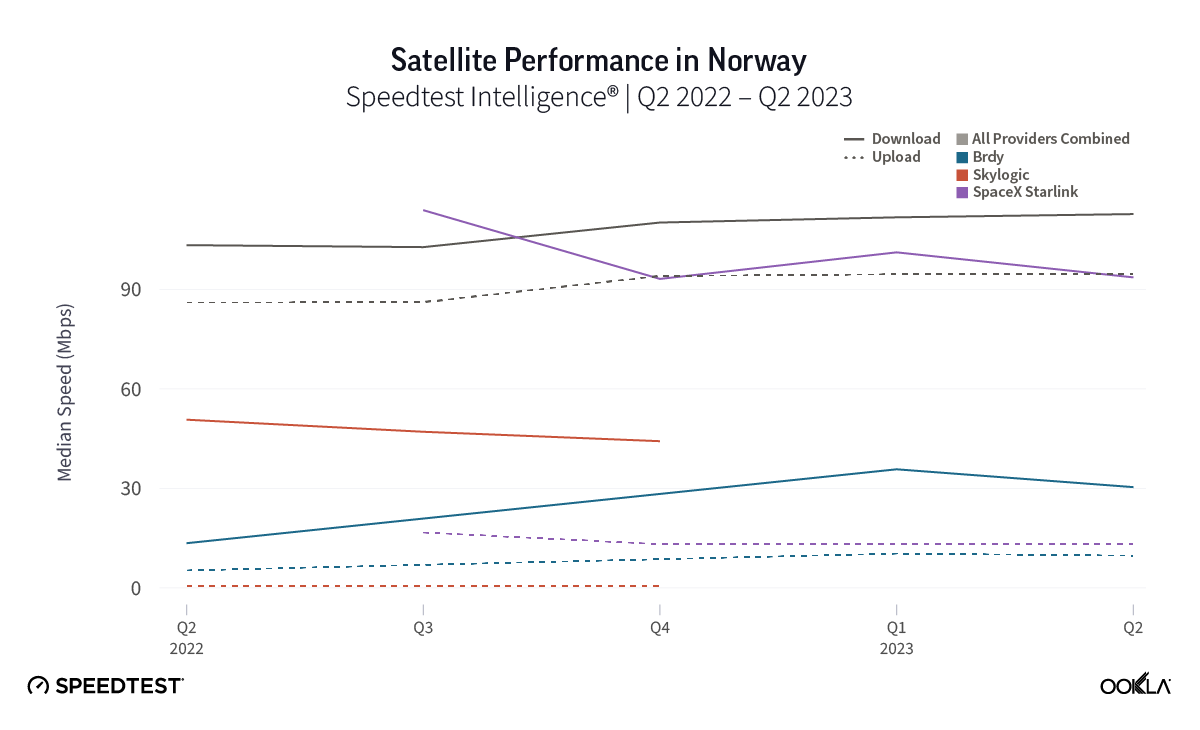
Speedtest Intelligence data shows Starlink data in six new countries during Q3 2022, including Colombia, the Dominican Republic, Estonia, Moldova, Norway, and the U.S. Virgin Islands. Starlink in Estonia (93.48 Mbps), the U.S. Virgin Islands (85.57 Mbps), and the Dominican Republic (72.01 Mbps) were much faster options than fixed broadband providers in their respective countries during Q3 2022. Starlink in Norway (113.86 Mbps) and Colombia (71.42 Mbps) were statistically in the same range as fixed broadband providers in their respective countries during the same time period. Starlink in Moldova (53.11 Mbps) was much slower than all fixed broadband providers combined (105.65 Mbps), though for rural folks with fewer options, still provides a speedy connection.
In all six countries, Starlink underperformed all fixed broadband providers combined for upload speed during Q3 2022, lagging behind from 12.59 Mbps to 24.48 Mbps, while median fixed broadband upload speeds ranged from 30.66 Mbps to 93.80 Mbps.
Multi-server latency was generally much higher than fixed broadband, with Starlink in Colombia showing the lowest multi-server latency at 58.65 ms, followed by Norway (73.00 ms), Estonia (85.37 ms), Moldova (105.26 ms), the Dominican Republic (110.62 ms), and the U.S. Virgin Islands (113.12 ms).
The great space race is on
There is no doubt a new space race for connectivity is being waged across the world. Competitors are pouring hundreds of millions and even billions into unlocking the celestial connectivity dilemma. Here are some major updates about what’s next for various different satellite competitors:
Eutelsat’s proposed merger with OneWeb, which seems to be making progress forward, has the potential to disrupt satellite connectivity and give consumers more internet options across the globe.
Starlink is entering into the RV and private jet markets.
The European Commission is still looking into creating their own LEO network.
With the competition for satellite connectivity heating up and Starlink facing potentially more competition in the coming months, we’ll be keeping our eyes to the sky to see how connectivity is performing. We’ll continue our series next quarter with Q3-Q4 2022 data from Europe and Oceania and any new countries where Starlink launches, and be back with North and South America data in Q2 2023. In the meantime, be sure to download the Speedtest app for Windows and Mac computers or for iOS or Android for devices and see how your satellite internet stacks up to our findings.
Ookla retains ownership of this article including all of the intellectual property rights, data, content graphs and analysis. This article may not be quoted, reproduced, distributed or published for any commercial purpose without prior consent. Members of the press and others using the findings in this article for non-commercial purposes are welcome to publicly share and link to report information with attribution to Ookla.
As mobile connectivity demand grows, particularly in urban areas, network performance has become a crucial indicator of a country’s development, competitiveness, and quality of life. This report focuses on the performance of mobile networks in small to mid-sized markets, which strike a balance between fostering competition and allowing operators to concentrate on urban connectivity. Based on the selected criteria, the top-performing operators identified in this analysis come from nine countries: Bulgaria, Denmark, Finland, Hungary, Kuwait, Norway, Singapore, Switzerland, and the U.A.E.
Key Takeaways
Operators from the U.A.E. and Kuwait dominate the top five positions.Speedtest Intelligence® 1H 2024 data showed that U.A.E.’s e& led with a median download speed of 351.73 Mbps, followed by du at 264.41 Mbps. Kuwait’s Ooredoo (234.45 Mbps), Zain (218.06 Mbps), and stc (190.42 Mbps) rounded out the top five.
Early 5G adoption has been a key factor in driving improved network performance, with operators like e& (U.A.E.), du (U.A.E.), Ooredoo (Kuwait), and Zain (Kuwait) achieving globally competitive median download speeds since launching 5G in 2019. Speedtest Intelligence data highlights consistent growth in 5G Availability and 5G Service metrics over the past two years. For instance, Ooredoo (Kuwait) increased 5G Availability from 67.0% to 73.7% and 5G Service from 78.3% to 83.9%, while Telenor Norway improved 5G Availability from 40.4% to 55.9%, and YouSee (Denmark) reached 84.0%, showcasing the significant impact of 5G expansion on network performance.
The top-performing operators predominantly came from a select group of highly urbanized and economically developed countries. Only nine countries accounted for the top 20 mobile operators in small to mid-size markets. Notably, all operators in the top ten were from countries with urbanization rates exceeding 87%, highlighting the correlation between high urban density and network performance.
Understanding mobile performance in advanced small to mid-size markets
Mobile network performance is shaped by multiple factors, each impacting speed, reliability, and user experience. Spectrum availability, infrastructure density, and advanced technologies like 5G are essential for meeting user demand effectively. Additionally, geographic, economic, and regulatory factors influence the level of investment and an operator’s ability to deploy and optimize services. Large markets spanning vast regions pose unique logistical and technical challenges for operators trying to serve both densely populated cities and remote rural areas. In contrast, operators in smaller markets, such as city-states, focus on compact urban areas, requiring a more targeted and agile approach to network deployment.
For the purpose of this analysis, we defined small-to-mid sized markets as having populations between 4 million and 10 million. The majority of the population is concentrated in high-density areas, allowing for a clearer examination of urban network strategies without the intricate infrastructure needs of large rural areas. There are 35 markets globally that fit this criteria, and of these, more than 65% occupy land areas smaller than 200,000 km². Using Speedtest Intelligence data, we examined the mobile performance in these markets during the first half of 2024, highlighting the top 20 ranked mobile providers based on median download speed.
Operators from the U.A.E. and Kuwait dominate the top ten rankings
Using Speedtest Intelligence® data collected in the first half of 2024, we ranked the top ten mobile operators in small to mid-size markets based on all mobile technologies combined. Operators from the United Arab Emirates and Kuwait dominate the top five positions, with a few operators from Denmark, Norway, and Singapore also making it into the top ten list. Notably, all operators in the top ten were from highly urbanized countries, with an urbanization rate exceeding 87%. These markets were also economically developed, having an average GDP per capita of just under USD 60,000.
Top 10 Ranked Operators Performance, Small to Medium Markets
Source: Speedtest Intelligence® | 1H 2024
U.A.E.’s e& (U.A.E) leads by a significant margin, achieving a median download speed of 351.73 Mbps for all technologies combined. This lead is indicative of the e&’s strong investment in telecommunication infrastructure and advanced network capabilities. Following e& is du, which has a median download speed of 264.41 Mbps. Both e& and du reported similar median upload speeds, with 26.58 Mbps and 26.25 Mbps respectively. The results underscore the U.A.E.’s robust telecommunications landscape, driven by strong competition among the leading operators.
Kuwait’s Ooredoo and Zain rank third and fourth with median download speeds of 234.45 Mbps and 218.06 Mbps, respectively. Another Kuwaiti operator, stc, completes the top five with a speed of 190.42 Mbps. The presence of three Kuwaiti operators in the top five highlights the country’s substantial progress in mobile network development, driven by a concentrated urban population and high levels of mobile broadband penetration.
The dominance of operators from the Middle East, particularly the U.A.E. and Kuwait, in overall network performance highlights the significant investments and advancements in 5G infrastructure within the region. Our previous report examined how the U.A.E. was the fastest 5G market globally in 1H 2024, with a median download speed of 660.08 Mbps, with e& UAE leading both domestically and globally at 749.63 Mbps. In Kuwait, Zain topped 5G median download speed in the market with a speed of 411.06 Mbps, surpassing Ooredoo at 379.04 Mbps during the same period. These achievements underscore the region’s strategic focus on enhancing connectivity and setting benchmarks for global 5G performance.
Northern Europe also has strong representation in the top ten, with Telenor (Norway) achieving 174.34 Mbps and three Danish operators (3, Telia, and YouSee) rounding out the list, all offering speeds above 148 Mbps. Singtel of Singapore is positioned in eighth place at 159.22 Mbps, indicative of Singapore’s efficient, urban-focused mobile deployment.
European operators were the most prominent beyond the top ten
11-20 Ranked Operators Performance, Small to Medium Markets
Source: Speedtest Intelligence® | 1H 2024
The next tier of mobile operators, ranked 11 to 20 by median download speed, offers a broader view of competitive performance across smaller European and Asian markets. Leading this group is A1 of Bulgaria, with a median download speed of 140.56 Mbps, placing it just below the top 10. Close behind Telenor (Denmark) and Telia (Norway), at 135.83 Mbps and 134.53 Mbps, respectively, highlight Northern Europe’s strong network performance capabilities, where dense urban populations and advanced network deployment have created solid foundations for high-speed connectivity.
Finnish operators make up a substantial part of this ranking, with DNA at 120.72 Mbps, Telia at 103.51 Mbps, and Elisa at 93.50 Mbps. The inclusion of the three Finnish operators in the list is notable, given the complex mix of population distribution and challenging coverage requirements of the market, which make consistently high speeds difficult across various geographies.
Other European operators, such as Swisscom in Switzerland, which had a speed of 117.29 Mbps, and Yettel in Hungary, with 94.58 Mbps, demonstrated that smaller, urbanized markets could still maintain competitive internet speeds. Singapore’s StarHub, with a speed of 100.46 Mbps, ranked 18th, highlighting the country’s strong mobile infrastructure.
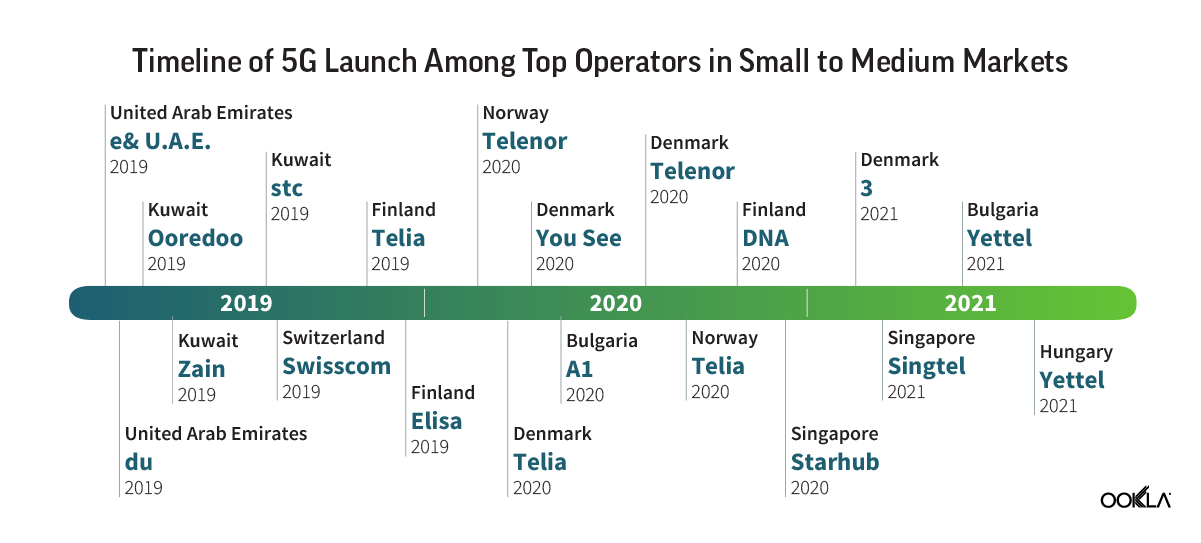
Proactive 5G strategies contributing to overall performance gains among top operators
The majority of the operators in the top 20 list were early adopters of 5G technology, with most launching 5G services as early as 2019 or 2020. This early adoption has proven to be a factor in enhancing their overall network performance, allowing them to deliver faster speeds, greater reliability, and a better overall user experience compared to markets that lagged in 5G rollout.
Operators such as e& (U.A.E.), du (U.A.E.), Ooredoo (Kuwait), and Zain (Kuwait) launched 5G services in 2019 and have consistently achieved higher median download speeds compared to other operators globally. In May 2019, etisalat by e& became the first operator in the Middle East and North Africa (MENA) region to introduce 5G Non-Standalone (NSA) technology to subscribers. The U.A.E. and Kuwait have regularly ranked as the fastest operators in Ookla’s Speedtest Global Index, alongside other early 5G adopters like Qatar and South Korea.
Government support and operator investments have played a crucial role in driving 5G success in these markets. In the U.A.E., the telecom regulator TDRA waived fees for 5G frequencies above 3 GHz for five years, giving operators access to extensive spectrum resources in the 2500-2600 MHz and 3300-3800 MHz ranges. Similarly, Kuwait’s CITRA allocated additional spectrum in the 2.3 GHz and 2.6 GHz bands, enabling operators to enhance their 5G networks and prepare for the rollout of 5G-Advanced technology.
European operators, including Telenor (Norway), 3 (Denmark), and A1 (Bulgaria), as well as Singtel and StarHub in Singapore, have also leveraged early 5G implementation to enhance service quality. GSMA’s 5G Connectivity Index highlights that markets with proactive 5G strategies tend to outperform in network performance metrics.
Leading operators demonstrate ongoing 5G adoption and coverage expansion
The overall performance gains are closely linked to the increased adoption of 5G services and the expansion of 5G coverage in key markets. As more users spend a larger share of their time on 5G networks, reliance on older technologies like 4G has steadily declined. This transition has contributed to faster speeds, lower latency, and overall improvements in mobile network performance for users across these top-performing operators.
Top operators have continued to expand their 5G networks across their respective markets. Over the past 24 months, quarterly data has shown a consistent upward trend in both 5G Availability—the percentage of time users with 5G-capable devices spend connected to 5G—and 5G Service, which measures the percentage of geographical areas with reported 5G coverage. This dual growth demonstrates the operators’ commitment to improving both user experience and network reach.
e& (U.A.E.) and du (U.A.E.) have shown steady increases in 5G Availability. e& rose from 13.9% in Q2 2023 to 25.6% in Q3 2024, while du increased from 16.5% to 20.9% over the same period. 5G Service also improved, with e& expanding from 41.5% in Q2 2023 to 52.9% in Q3 2024, and du growing from 56.4% to 67.2%.
Kuwaiti operators Ooredoo, Zain, and stc consistently maintained high levels of 5G Availability. Ooredoo increased from 67.0% in Q2 2023 to 73.7% in Q3 2024, while 5G Service also saw growth, with Ooredoo rising from 78.3% to 83.9% and Zain expanding from 81.1% to 90.6% during the same period.
European operators also showed notable progress. Telenor Norway achieved significant growth in 5G Availability, rising from 40.4% to 55.9%. Denmark’s YouSee maintained one of the highest levels, increasing from 72.8% to 84.0%. In Finland, DNA and Telia demonstrated consistent improvements, with DNA rising from 52.6% to 71.6% and Telia making steady advancements as well. These trends reflect the continued expansion of 5G in both urban and outskirts, supporting increased 5G connectivity across these markets.
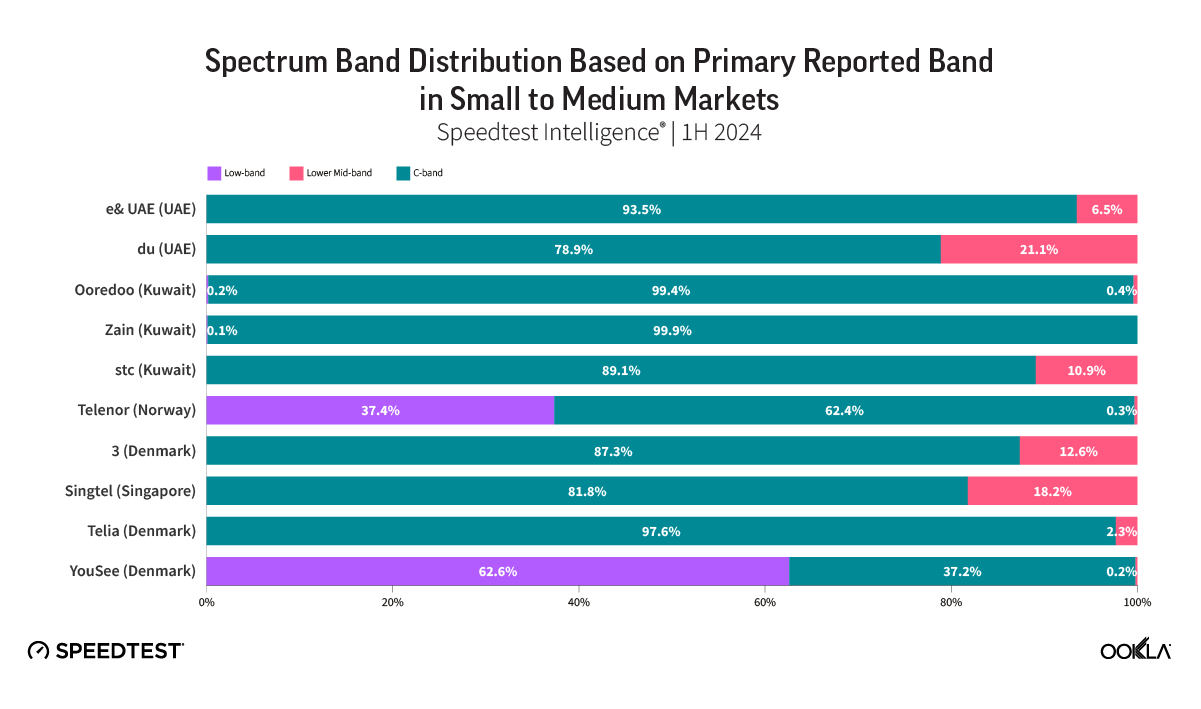
Majority of the top operators’ 5G networks are utilizing C-band spectrum
Spectrum availability plays an important part in network performance, impacting speed and coverage. In urbanized small to mid-size markets, operators must strategically manage and, where possible, the ability to access adequate spectrum resources is crucial for reducing network congestion and maintaining a consistent, high-quality experience for users.
We analyzed the distribution of Speedtest data samples based on the primary reported 5G spectrum bands used by the top ten performing operators to gain insights into the spectrum bands utilized by operators. It’s important to note that operators will employ differing strategies to optimize spectrum utilization and the user experience. Consumer-initiated tests will attempt to saturate a network connection, and operators will tend to serve this capacity demand through the spectrum bands with the highest capacity and, where required, supplement this capacity through carrier aggregation. This gives a better indication of the maximum throughput and state of the network, in contrast with background idle-state testing, which will often camp on lower frequency bands and, more specifically, on 4G-LTE.
The results show that upper mid-band spectrum, or C-Band (3.3-4.2 GHz), is the most widely utilized spectrum band among these operators, playing a critical role in balancing performance, availability, and coverage. The C-band offers an optimal balance between speed and coverage, making it suitable for urban and broader coverage areas.
Operators like e& (U.A.E.) and du (U.A.E.) rely heavily on the C-band, with 93.5% and 78.9% of test samples reported in this range, respectively. Similarly, operators in Kuwait, including Ooredoo, Zain, and stc, show a near-exclusive reliance on the C-band (ranging from 89.1% to 99.9%), enabling them to deliver widespread 5G availability and improved median download speeds.
In Nordic markets, operators like Telenor Norway and YouSee Denmark demonstrate more diverse spectrum strategies. Telenor Norway combines significant use of the C-band (62.4%) with a notable portion of low-band spectrum (37.4%), which enhances coverage in rural and less densely populated areas. This mixed approach allows these operators to ensure nationwide 5G rollout while maintaining urban performance.
Top performing operators came from a few highly urbanized countries.
Our data shows that operators from only nine countries made up the top 20 mobile operators with the best median download speed within small to mid-size markets. Denmark had the highest representation, contributing four operators to the top 20 list. Kuwait and Finland follow closely, each with three operators ranked among the best. Other countries with top-performing operators include the U.A.E., Singapore, Norway, Bulgaria, Switzerland, and Hungary, each featuring one or two operators.
Top 20 Operators Countries
Source: Speedtest Intelligence® | 1H 2024, World Population Review | 2023
These markets share several common characteristics that likely contribute to their high mobile network performance. Most are highly urbanized and economically developed, which facilitates the deployment of advanced telecommunications infrastructure. Additionally, these countries often have high levels of investment in digital connectivity, enabling operators to maintain robust, high-speed networks. Many of these markets, such as Singapore, Switzerland, and Norway, are relatively compact, allowing operators to concentrate network resources and deliver consistent performance across their territories.
In contrast, markets with lower urbanization levels, such as Austria (59.5% urbanization) and Ireland (64.5% urbanization), despite sharing similar characteristics with the high-performing markets—such as strong economies and investments in telecommunications infrastructure—reported lower median download speeds of 79.46 Mbps and 38.20 Mbps, respectively. This highlights the need for tailored strategies in less urbanized markets to enhance coverage and optimize performance.
Ookla will continue to monitor overall mobile performance and 5G deployments globally and benchmark countries and operators. For more information about Speedtest Intelligence data and insights, please get in touch.
Ookla retains ownership of this article including all of the intellectual property rights, data, content graphs and analysis. This article may not be quoted, reproduced, distributed or published for any commercial purpose without prior consent. Members of the press and others using the findings in this article for non-commercial purposes are welcome to publicly share and link to report information with attribution to Ookla.
Mobile operators are rapidly expanding 5G deployments across the globe, with 16,410 new 5G deployments across 109 countries added to the Ookla 5G Map™ in June 2021 alone. Huge investments in 5G are being made to increase performance, especially in major cities. We used Speedtest Intelligence® to see which world capitals have the best 5G speeds and availability, based on locations with commercially available 5G during Q1-Q2 2021.
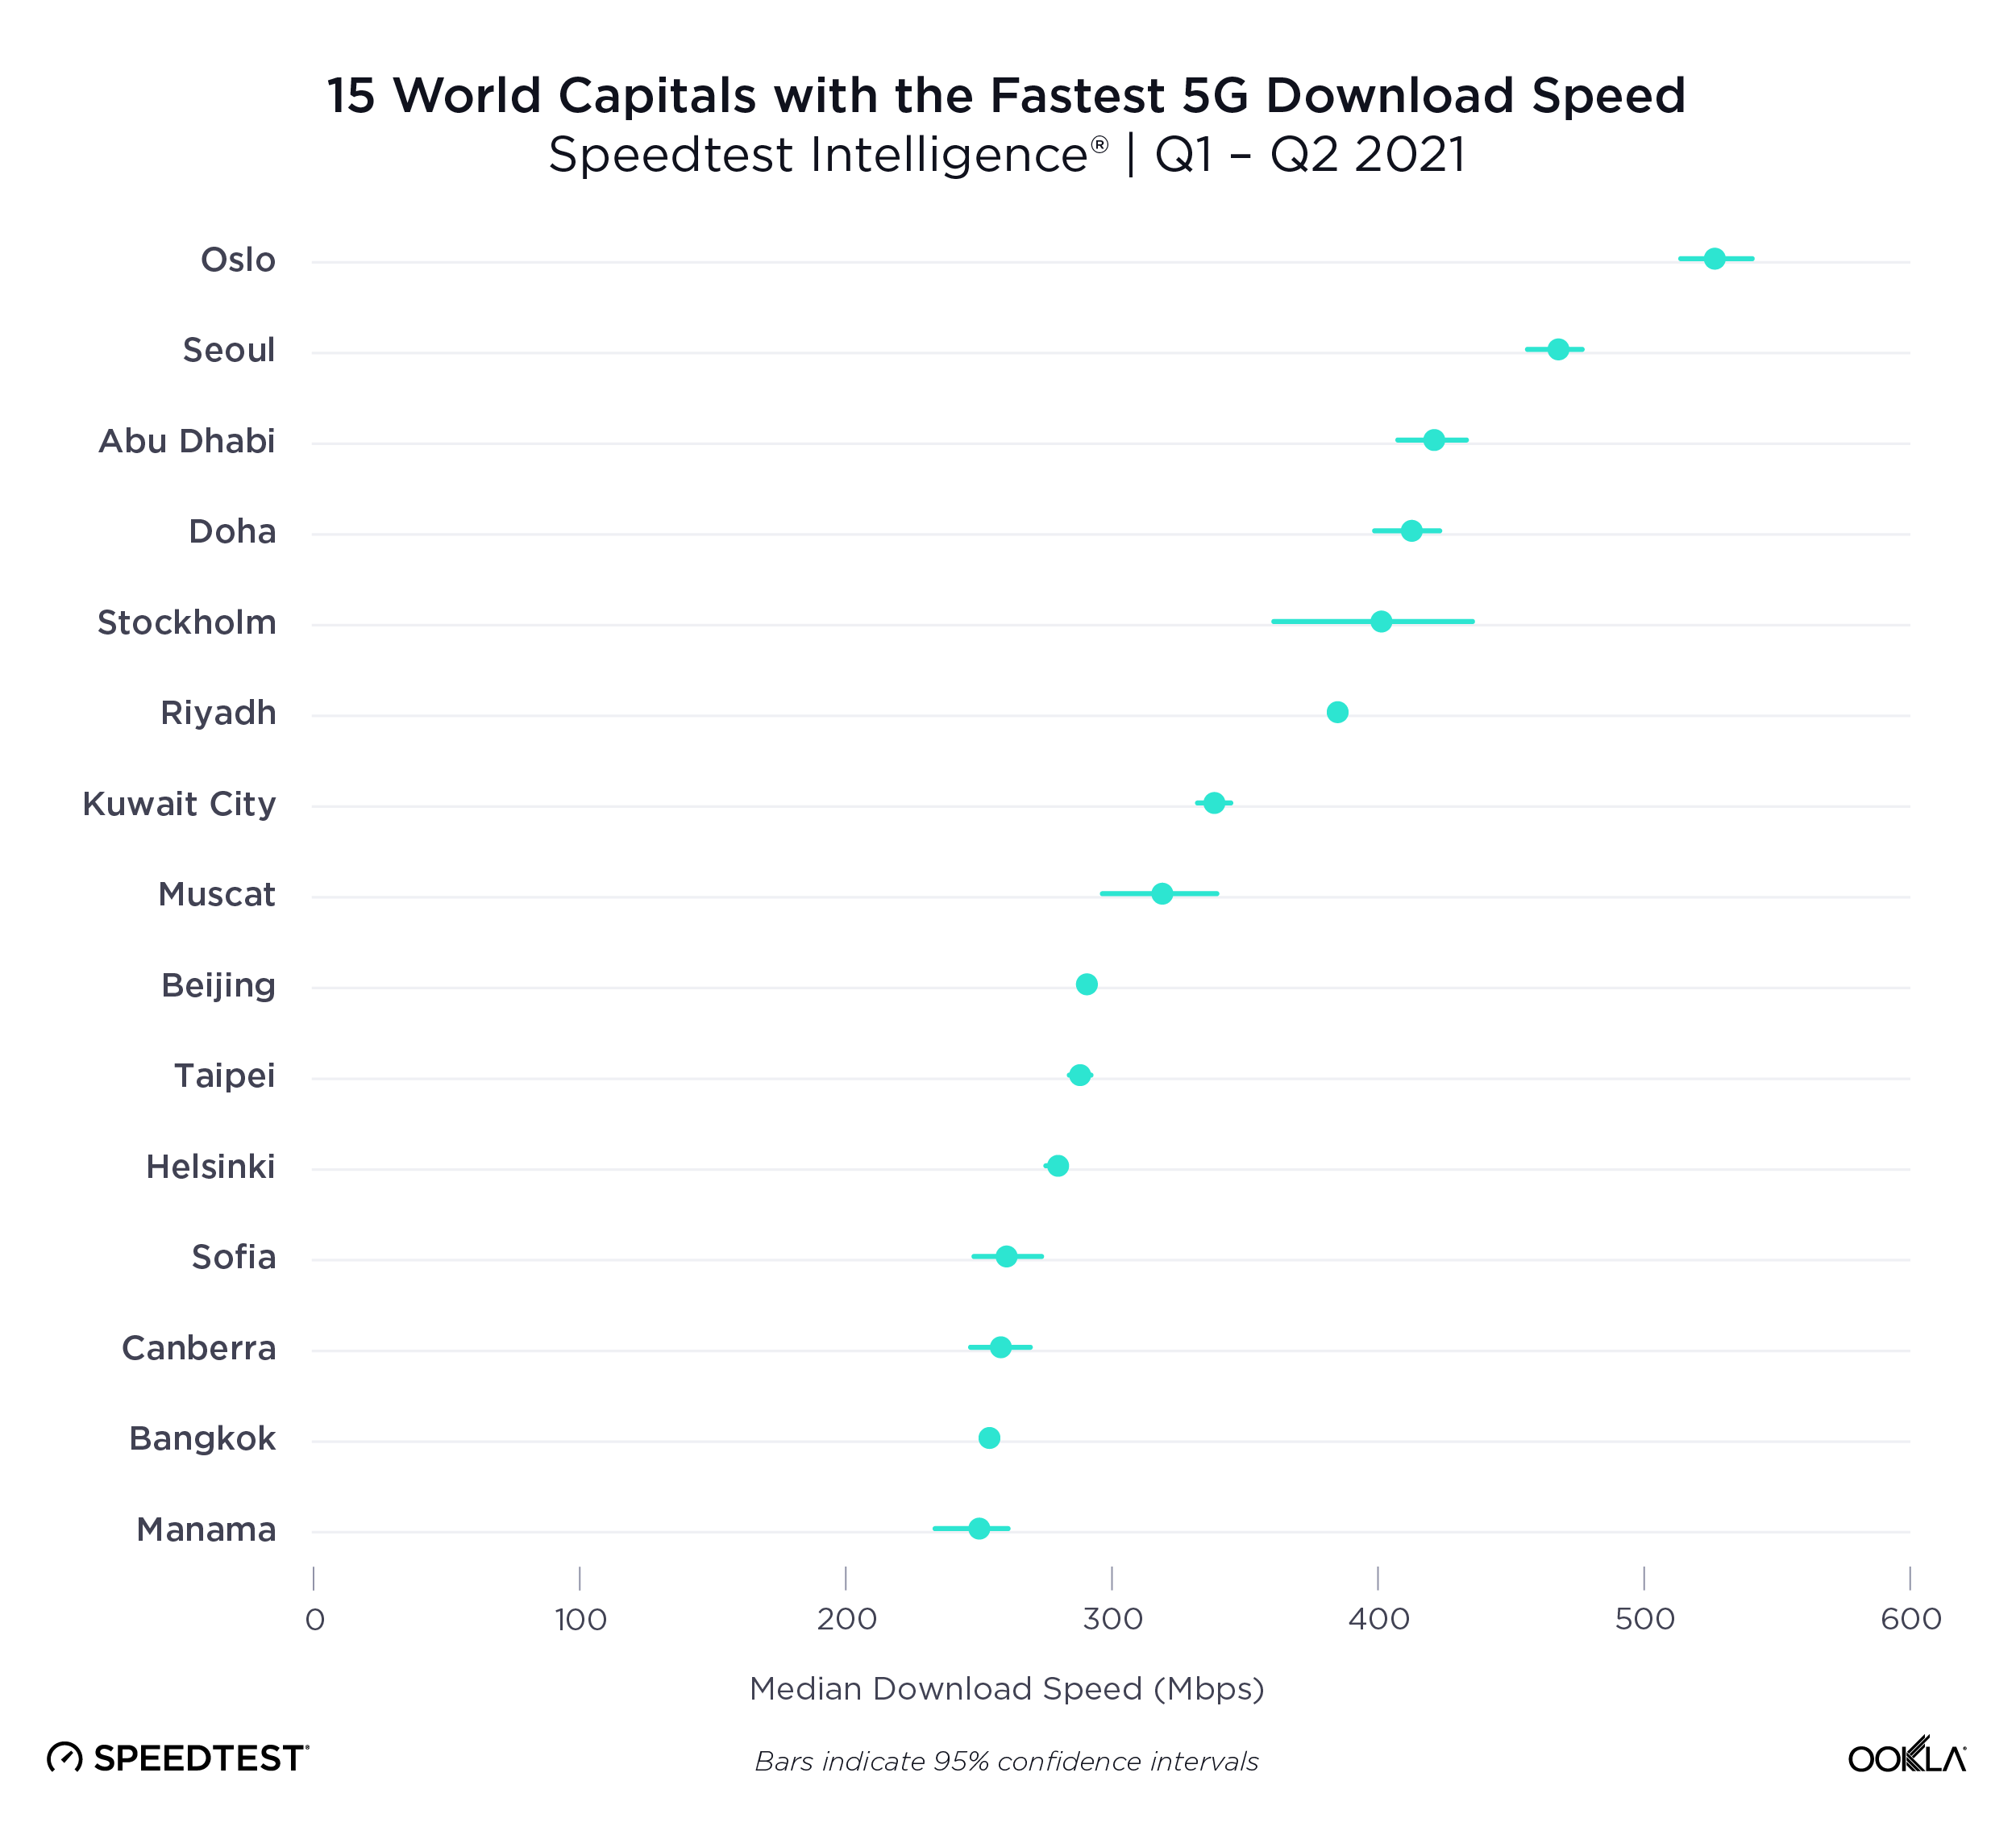
Oslo, Norway was the fastest world capital for 5G during Q1-Q2 2021
The race for fastest 5G performance among world capitals was extremely competitive during Q1-Q2 2021. Oslo, Norway had the fastest 5G of any world capital, clocking in with a median download speed of 526.74 Mbps. Seoul, South Korea had the second fastest median download speed over 5G at 467.84 Mbps; Abu Dhabi, United Arab Emirates was third (421.26 Mbps); Doha, Qatar fourth (413.40 Mbps) and Stockholm, Sweden fifth (401.30 Mbps). Riyadh, Saudi Arabia (384.66 Mbps); Kuwait City, Kuwait (338.97 Mbps), Muscat, Oman (318.95 Mbps); Beijing, China (291.19 Mbps); and Taipei, Taiwan (287.86 Mbps); rounded out the top 10. Helsinki, Finland showed a median 5G download speed of 279.59 Mbps; Sofia, Bulgaria 260.55 Mbps; Canberra, Australia 258.39 Mbps; Bangkok, Thailand 253.73 Mbps; Manama, Bahrain 249.71; Dublin, Ireland 223.01; Luxembourg City, Luxembourg 209.98 Mbps; Paris, France 208.48 Mbps and Bucharest, Romania 203.44 Mbps.
We saw median 5G download speeds between 150 Mbps and 200 Mbps in the following world capitals during Q1-Q2 2021: Ottawa, Canada (196.11 Mbps); Hanoi, Vietnam (195.99 Mbps); Bratislava, Slovakia (188.23 Mbps); Madrid, Spain (183.37 Mbps); Bern, Switzerland (175.69 Mbps); Rome, Italy (171.79 Mbps); London, United Kingdom (167.50 Mbps); Tokyo, Japan (167.02 Mbps); Athens, Greece (164.95 Mbps); Copenhagen, Denmark (162.75 Mbps); Ljubljana, Slovenia (158.50 Mbps); Hong Kong (153.78) and Washington, D.C., United States (151.80 Mbps).
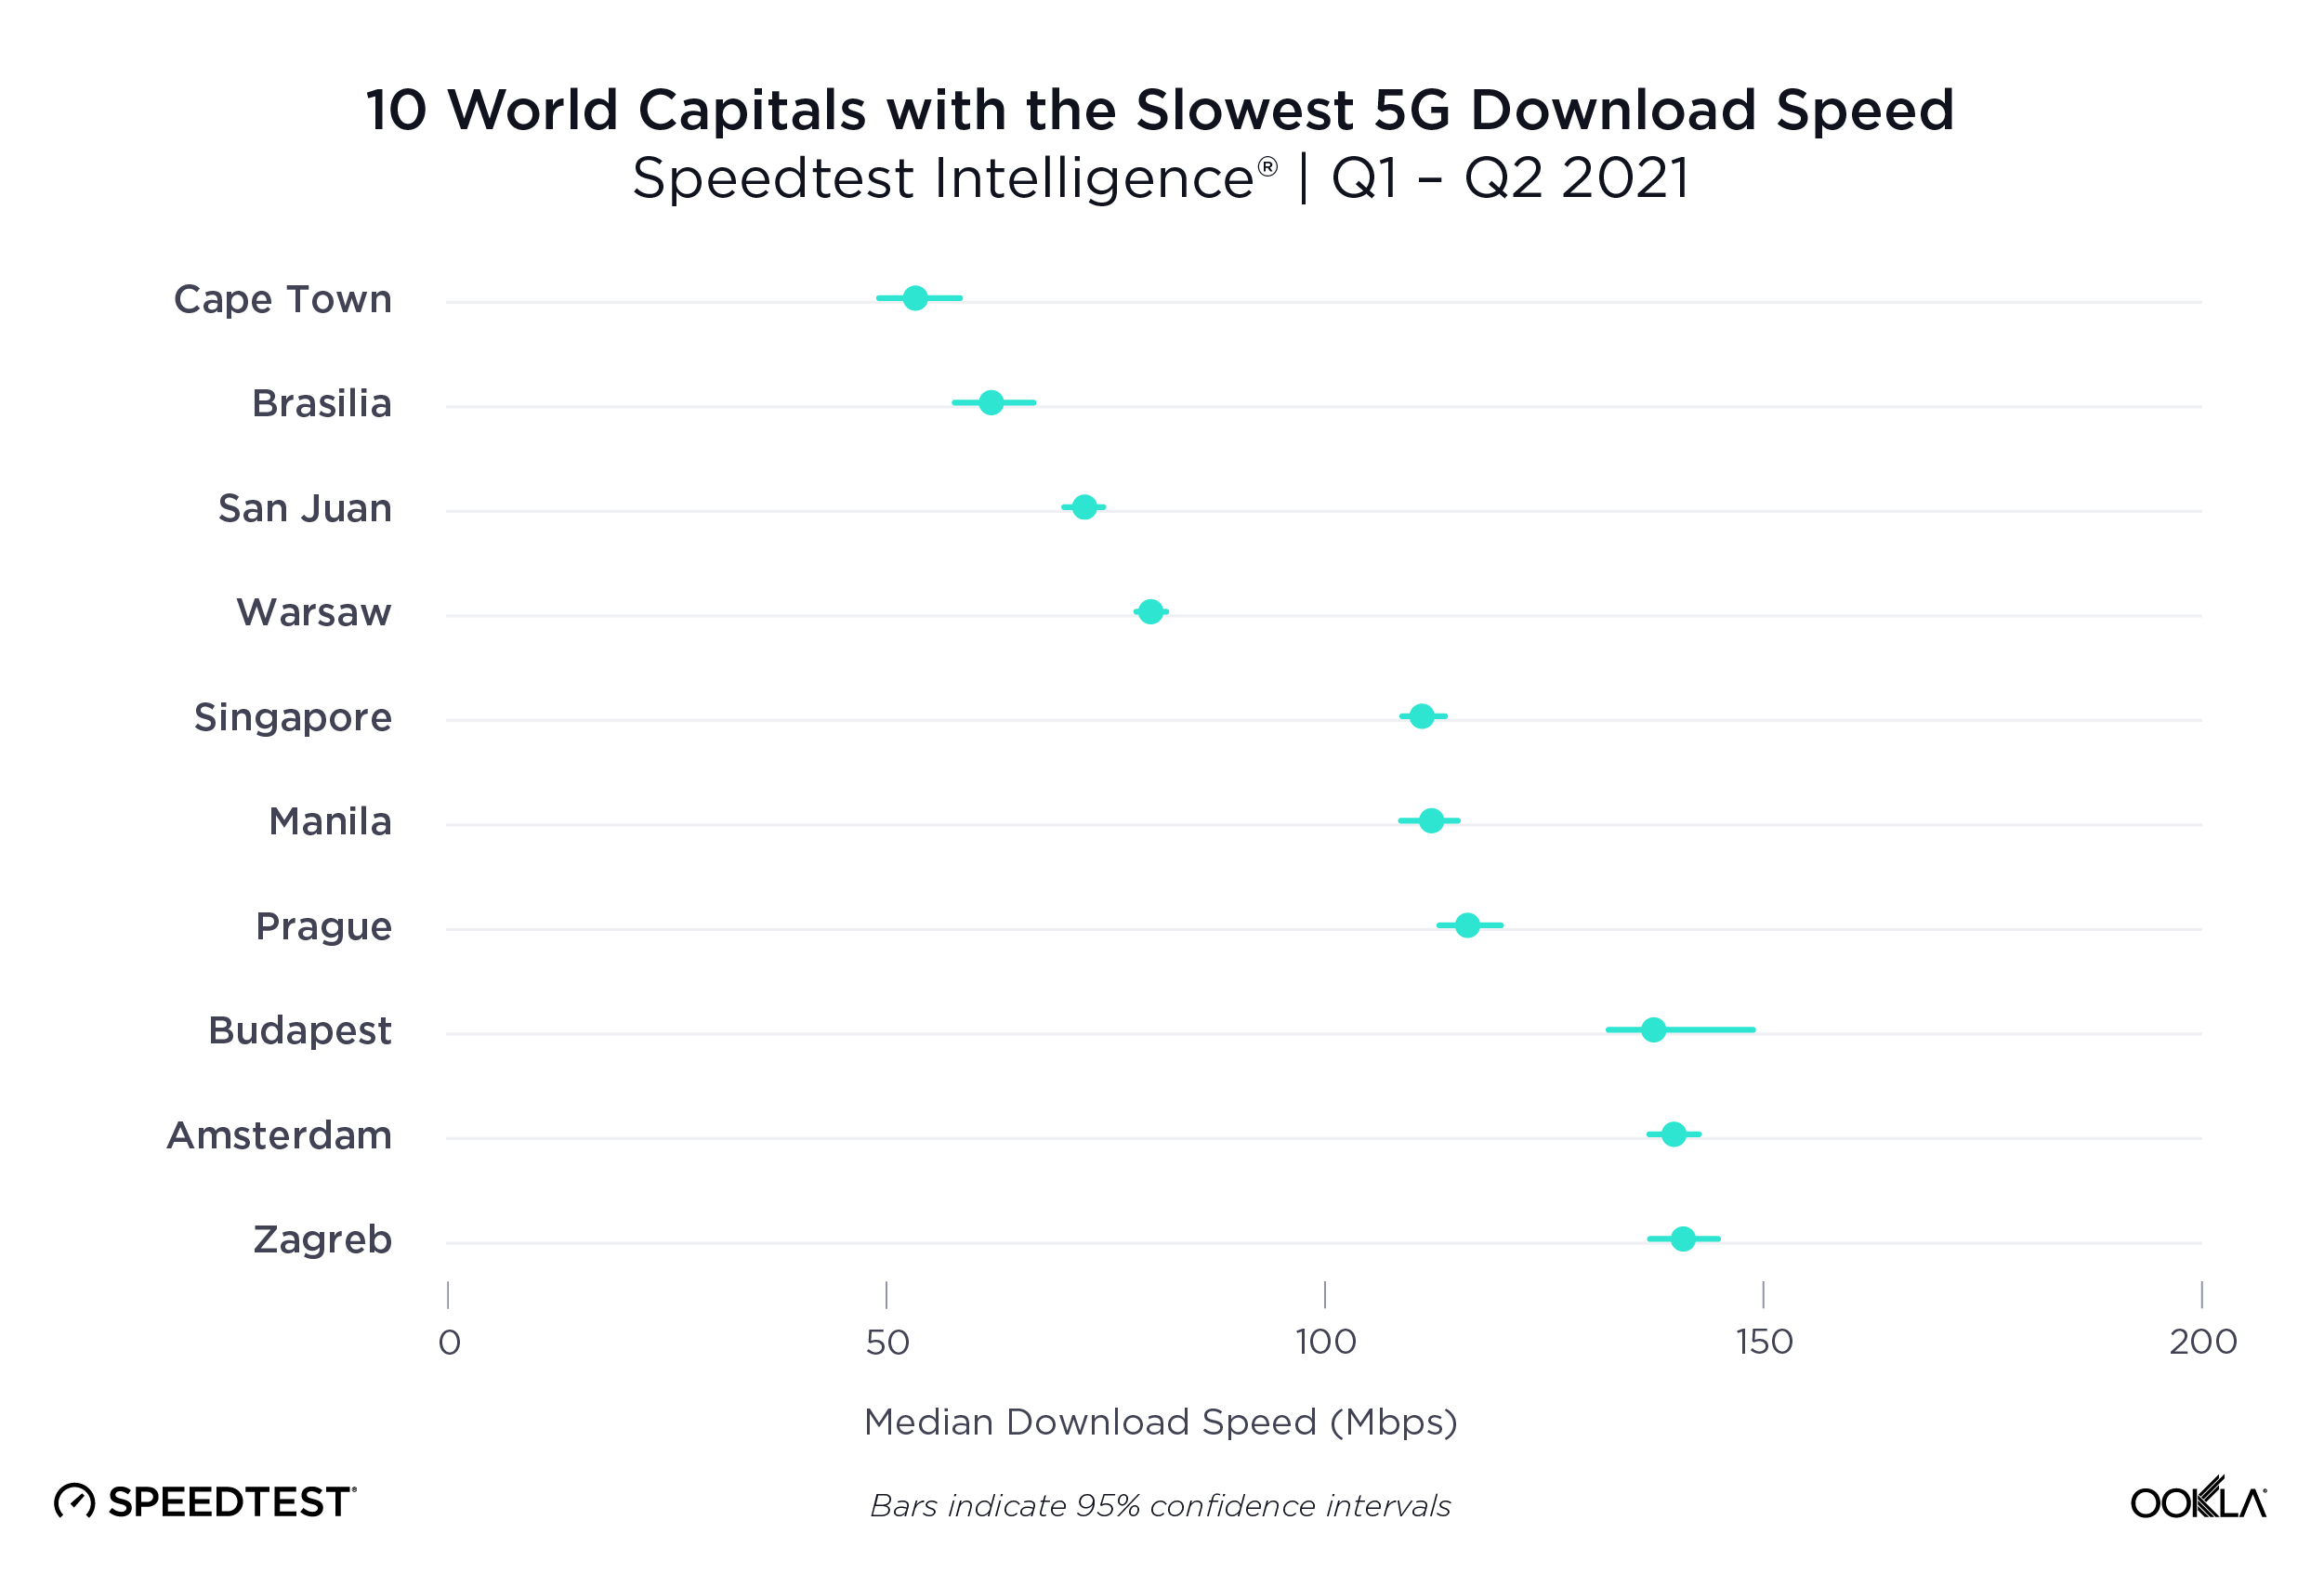
Cape Town, South Africa was the slowest world capital for 5G in Q1-Q2 2021
Speedtest Intelligence shows Capetown, South Africa had the slowest median download speed over 5G during Q1-Q2 2021 at 53.33 Mbps. Other world capitals with slower median 5G download speeds included: Brasilia, Brazil (62.18 Mbps); San Juan, Puerto Rico (72.59 Mbps); Warsaw, Poland (80.18 Mbps); Singapore (111.20 Mbps); Manila, Philippines (112.23 Mbps); Prague, Czechia (116.30 Mbps); Budapest, Hungary (137.54 Mbps); Amsterdam, Netherlands (139.75 Mbps); Zagreb, Croatia (140.92 Mbps); Vienna, Austria (144.93 Mbps); Jerusalem, Israel (145.17 Mbps); and Berlin, Germany (148.16 Mbps).
Capitals not mentioned on either of these lists did not have sufficient 5G samples during Q1-Q2 2021 to be included in this report.
The fastest 5G speeds are yet to come
5G is rapidly improving across the world and we’re eager to see how countries, cities and operators continue to perform during Q3 2021 and beyond. If you want to see how your 5G network performs against these benchmarks, please download the Android or iOS app, and take a Speedtest®. Learn more about 5G provider performance in select cities here, and visit the Ookla 5G MapTM to see which providers are offering 5G in your area.
Editor’s note: This article was updated on July 28 to reorganize the content for clarity.
Ookla retains ownership of this article including all of the intellectual property rights, data, content graphs and analysis. This article may not be quoted, reproduced, distributed or published for any commercial purpose without prior consent. Members of the press and others using the findings in this article for non-commercial purposes are welcome to publicly share and link to report information with attribution to Ookla.
Video is essential to today’s internet across the world. We use it to watch shows and movies, stream live events and even keep up to date on our favorite cats on social media. Ookla® launched video testing in the Speedtest® app for iOS and Android earlier this year so consumers can measure the quality of their video experience. Already, millions of video tests have been initiated by consumers. Today we’re sharing some of that data to provide insight into video experience around the world, specifically, we’ve analyzed adaptive start time and highest overall video resolution over all mobile technologies, 5G and fixed broadband in select countries during Q3 2021.
Switzerland had the fastest adaptive start time for all mobile technologies, South Africa fastest for 5G
Video streaming services use adaptive bitrate technology
All modern video streaming platforms use adaptive bitrate technology to automatically adjust video quality based on network conditions and device capabilities in order to display the highest quality video that a device can support, while minimizing buffering and slow video start time. Speedtest Video Analytics provides deep insights and competitive benchmarking for device and network video streaming capabilities.
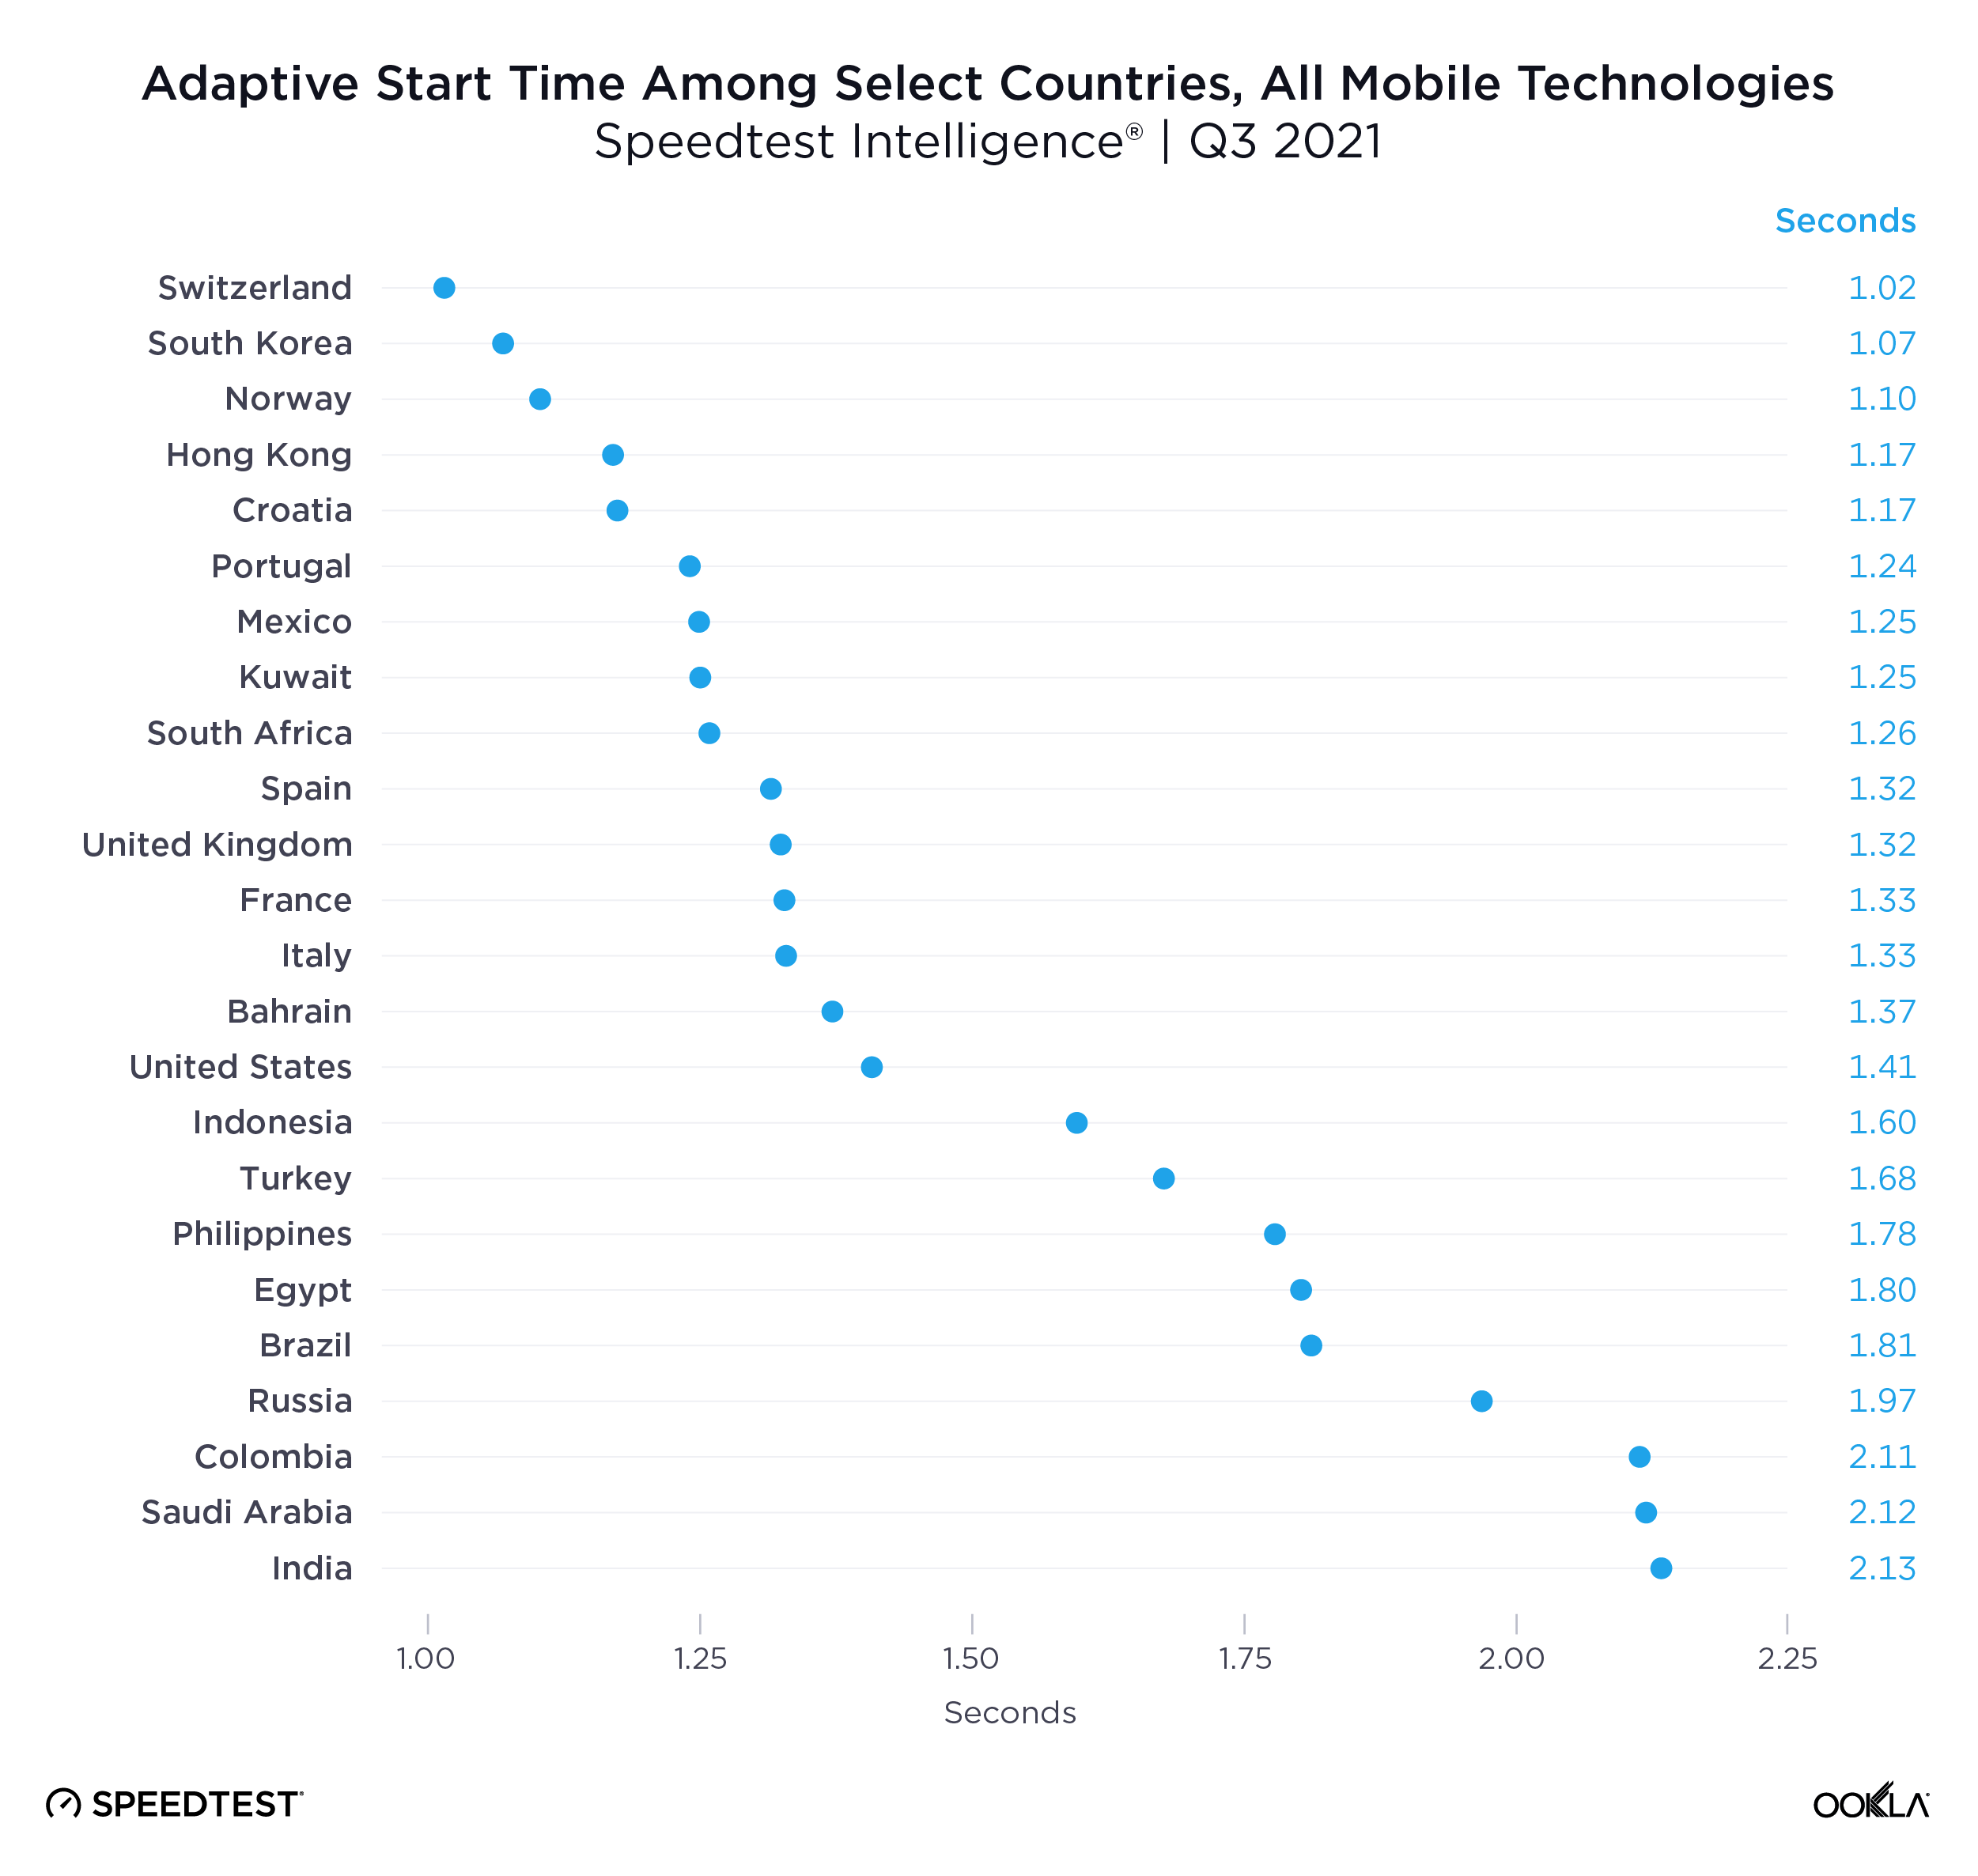
Adaptive start time — the time it takes for adaptive bitrate playback to initiate — allows us to see how quickly videos are loading. A 2012 study found that users will leave a video if it doesn’t begin playing within two seconds. We have to imagine in 2021, that timeframe is being squeezed even further. Our analysis shows how countries are performing against this important benchmark.
Speedtest Intelligence® reveals that Switzerland had the fastest median adaptive start time for all mobile technologies combined among the countries we analyzed at 1.02 seconds during Q3 2021. South Korea and Norway were close behind at 1.07 seconds and 1.10 seconds, respectively. Five more countries achieved a median adaptive start time at or under 1.25 seconds during Q3 2021, including Hong Kong (SAR) and Croatia (1.17 seconds), Portugal (1.24 seconds), and Kuwait and Mexico (1.25 seconds). All but three of the remaining countries we surveyed achieved a median adaptive start time between 1.25 seconds and 2.00 seconds during Q3 2021 except Colombia (2.11 seconds), Saudi Arabia (2.12 seconds) and India (2.13 seconds).
Most 5G-capable video tests showed blazing fast adaptive start times
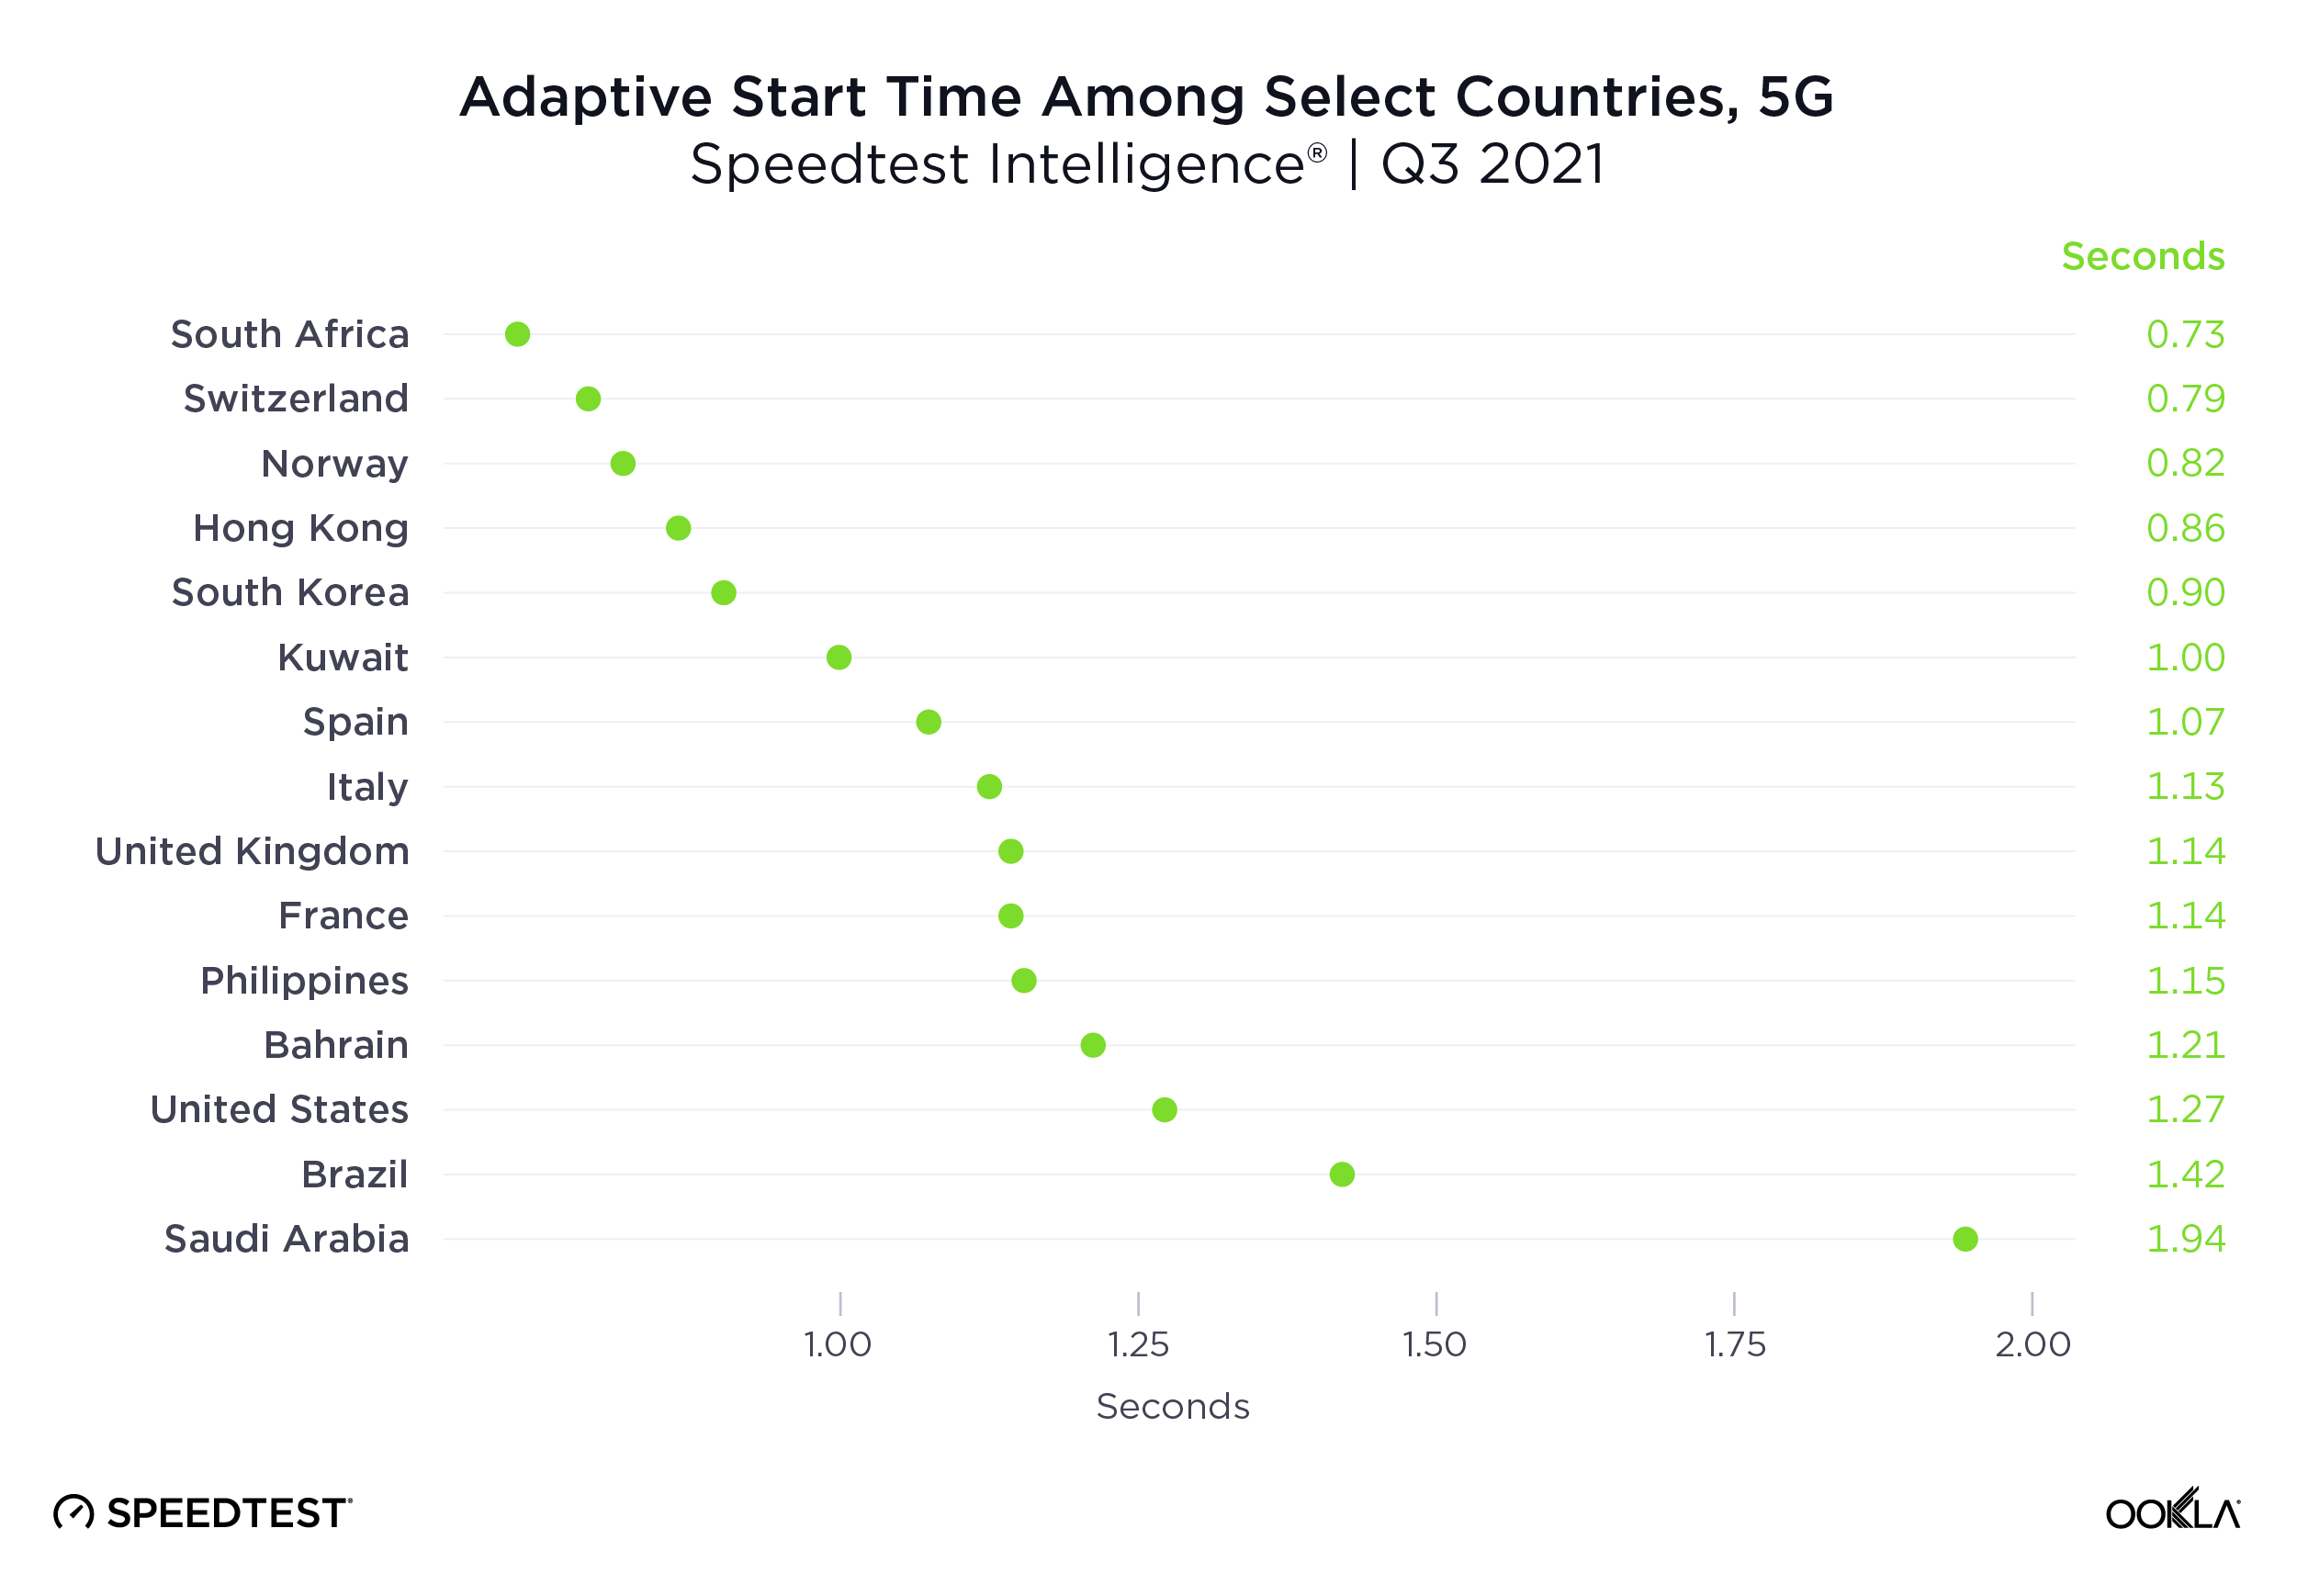
We’ve seen median 5G download speeds zoom ahead of traditional mobile technologies, even reaching median download speeds 10 times faster than on 4G LTE. It’s no surprise Video Analytics revealed adaptive start time was often much faster on 5G than on all mobile technologies combined. Five countries achieved median adaptive start times faster than 1.00 second during Q3 2021: South Africa (0.73 seconds), Switzerland (0.79 seconds), Norway (0.82 seconds), Hong Kong (0.86 seconds) and South Korea (0.90 seconds). Video Analytics shows the only countries with a median 5G adaptive start time slower than 1.25 seconds were the United States (1.27 seconds), Brazil (1.42 seconds) and Saudi Arabia (1.94 seconds).
Five countries’ adaptive start time improved more than 0.25 seconds on 5G compared to all technologies combined during Q3 2021: the Philippines (-0.62 seconds), South Africa (-0.53 seconds), Brazil (-0.39 seconds), Hong Kong (-0.31 seconds) and Norway (-0.29 seconds). However, several countries showed a less than 0.20 second improvement when comparing adaptive start rate on 5G to that on all technologies combined during Q3 2021: the U.S. (-0.14 seconds), Bahrain (-0.16 seconds), South Korea and Saudi Arabia (-0.17 seconds), and the United Kingdom (U.K.) and France (-0.18 seconds).
Adaptive start time is not always faster on fixed broadband
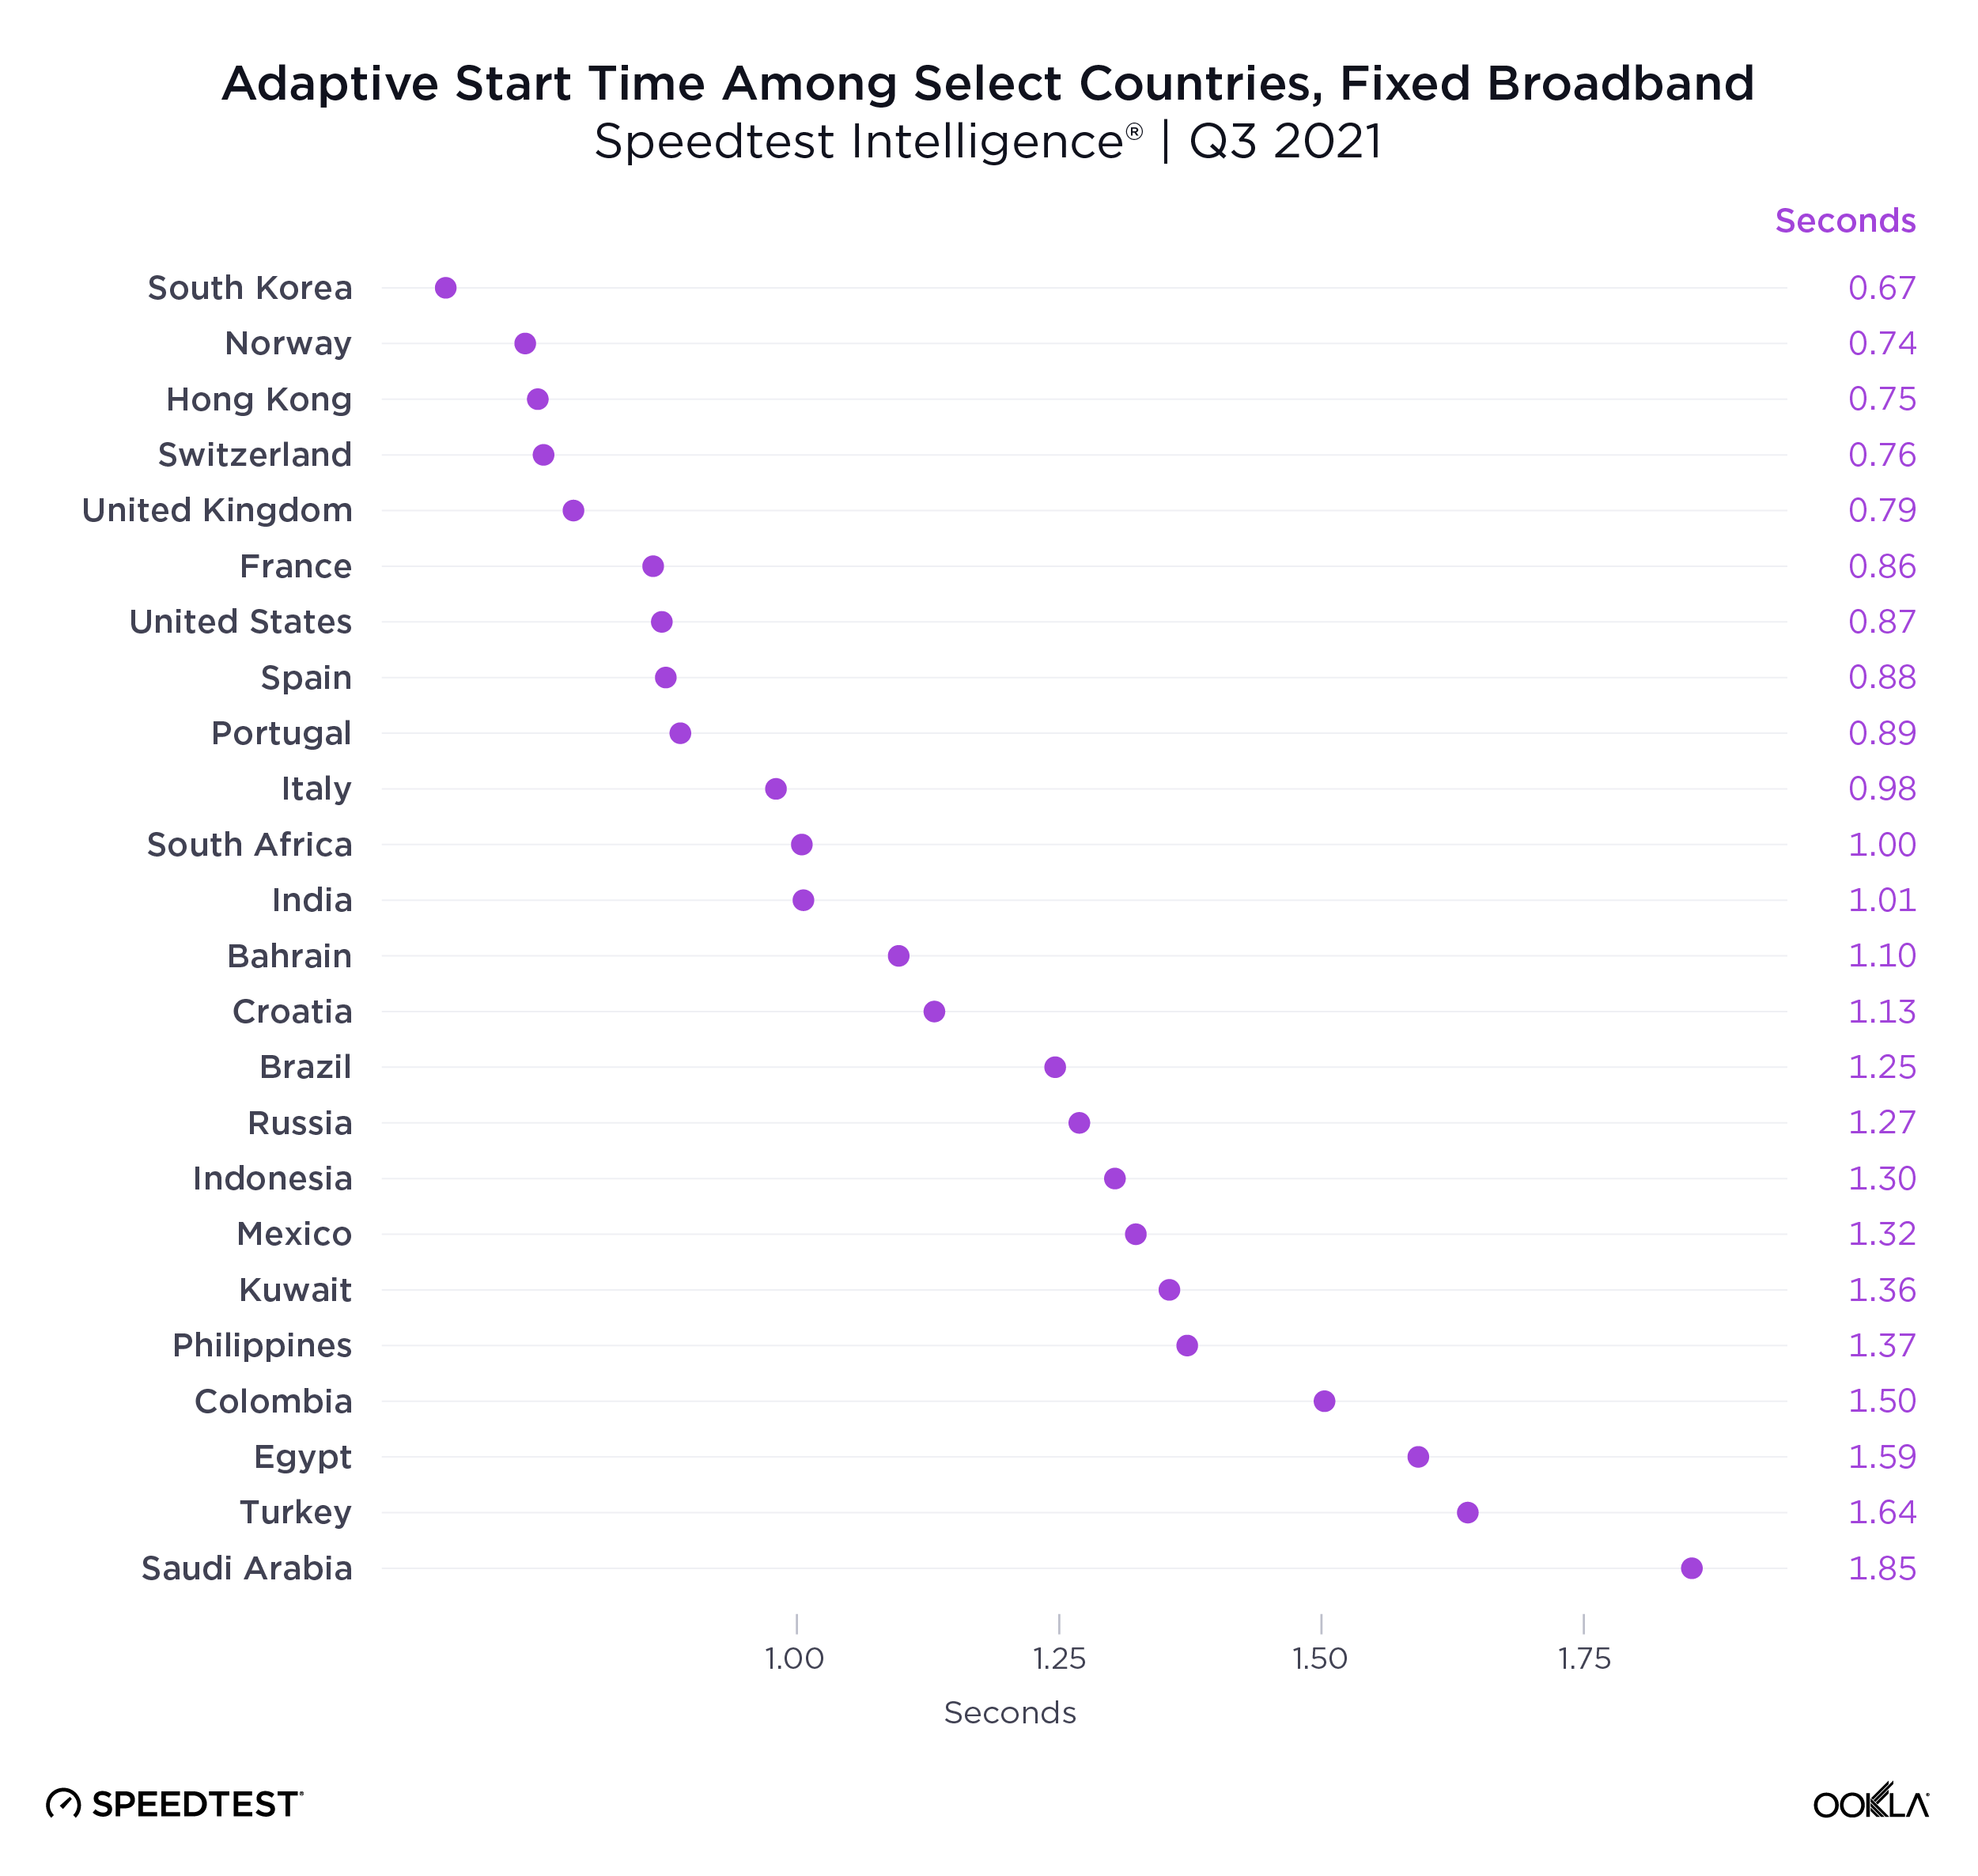
Speedtest Intelligence showed a narrower range for adaptive start time on fixed broadband than on 5G with every country on our list achieving between 0.67 and 1.85 seconds during Q3 2021. Ten countries on our list achieved a median adaptive start time faster than 1.00 second during Q3 2021: South Korea (0.67 seconds), Norway (0.74 seconds), Hong Kong (0.75 seconds), Switzerland (0.76 seconds), the U.K. (0.79 seconds), France (0.86 seconds), the U.S. (0.87 seconds), Spain (0.88 seconds), Portugal (0.89 seconds) and Italy (0.98 seconds).
Twenty out of the 24 countries we surveyed had a median fixed broadband adaptive start time faster than 1.50 seconds during Q3 2021. Colombia (1.50 seconds), Egypt (1.59 seconds), Turkey (1.64 seconds) and Saudi Arabia (1.85 seconds) were the only countries with a median adaptive start time slower than 1.50 seconds on fixed broadband during Q3 2021.
South Korea video tests reached 4K resolutions at the highest proportion on mobile and fixed broadband
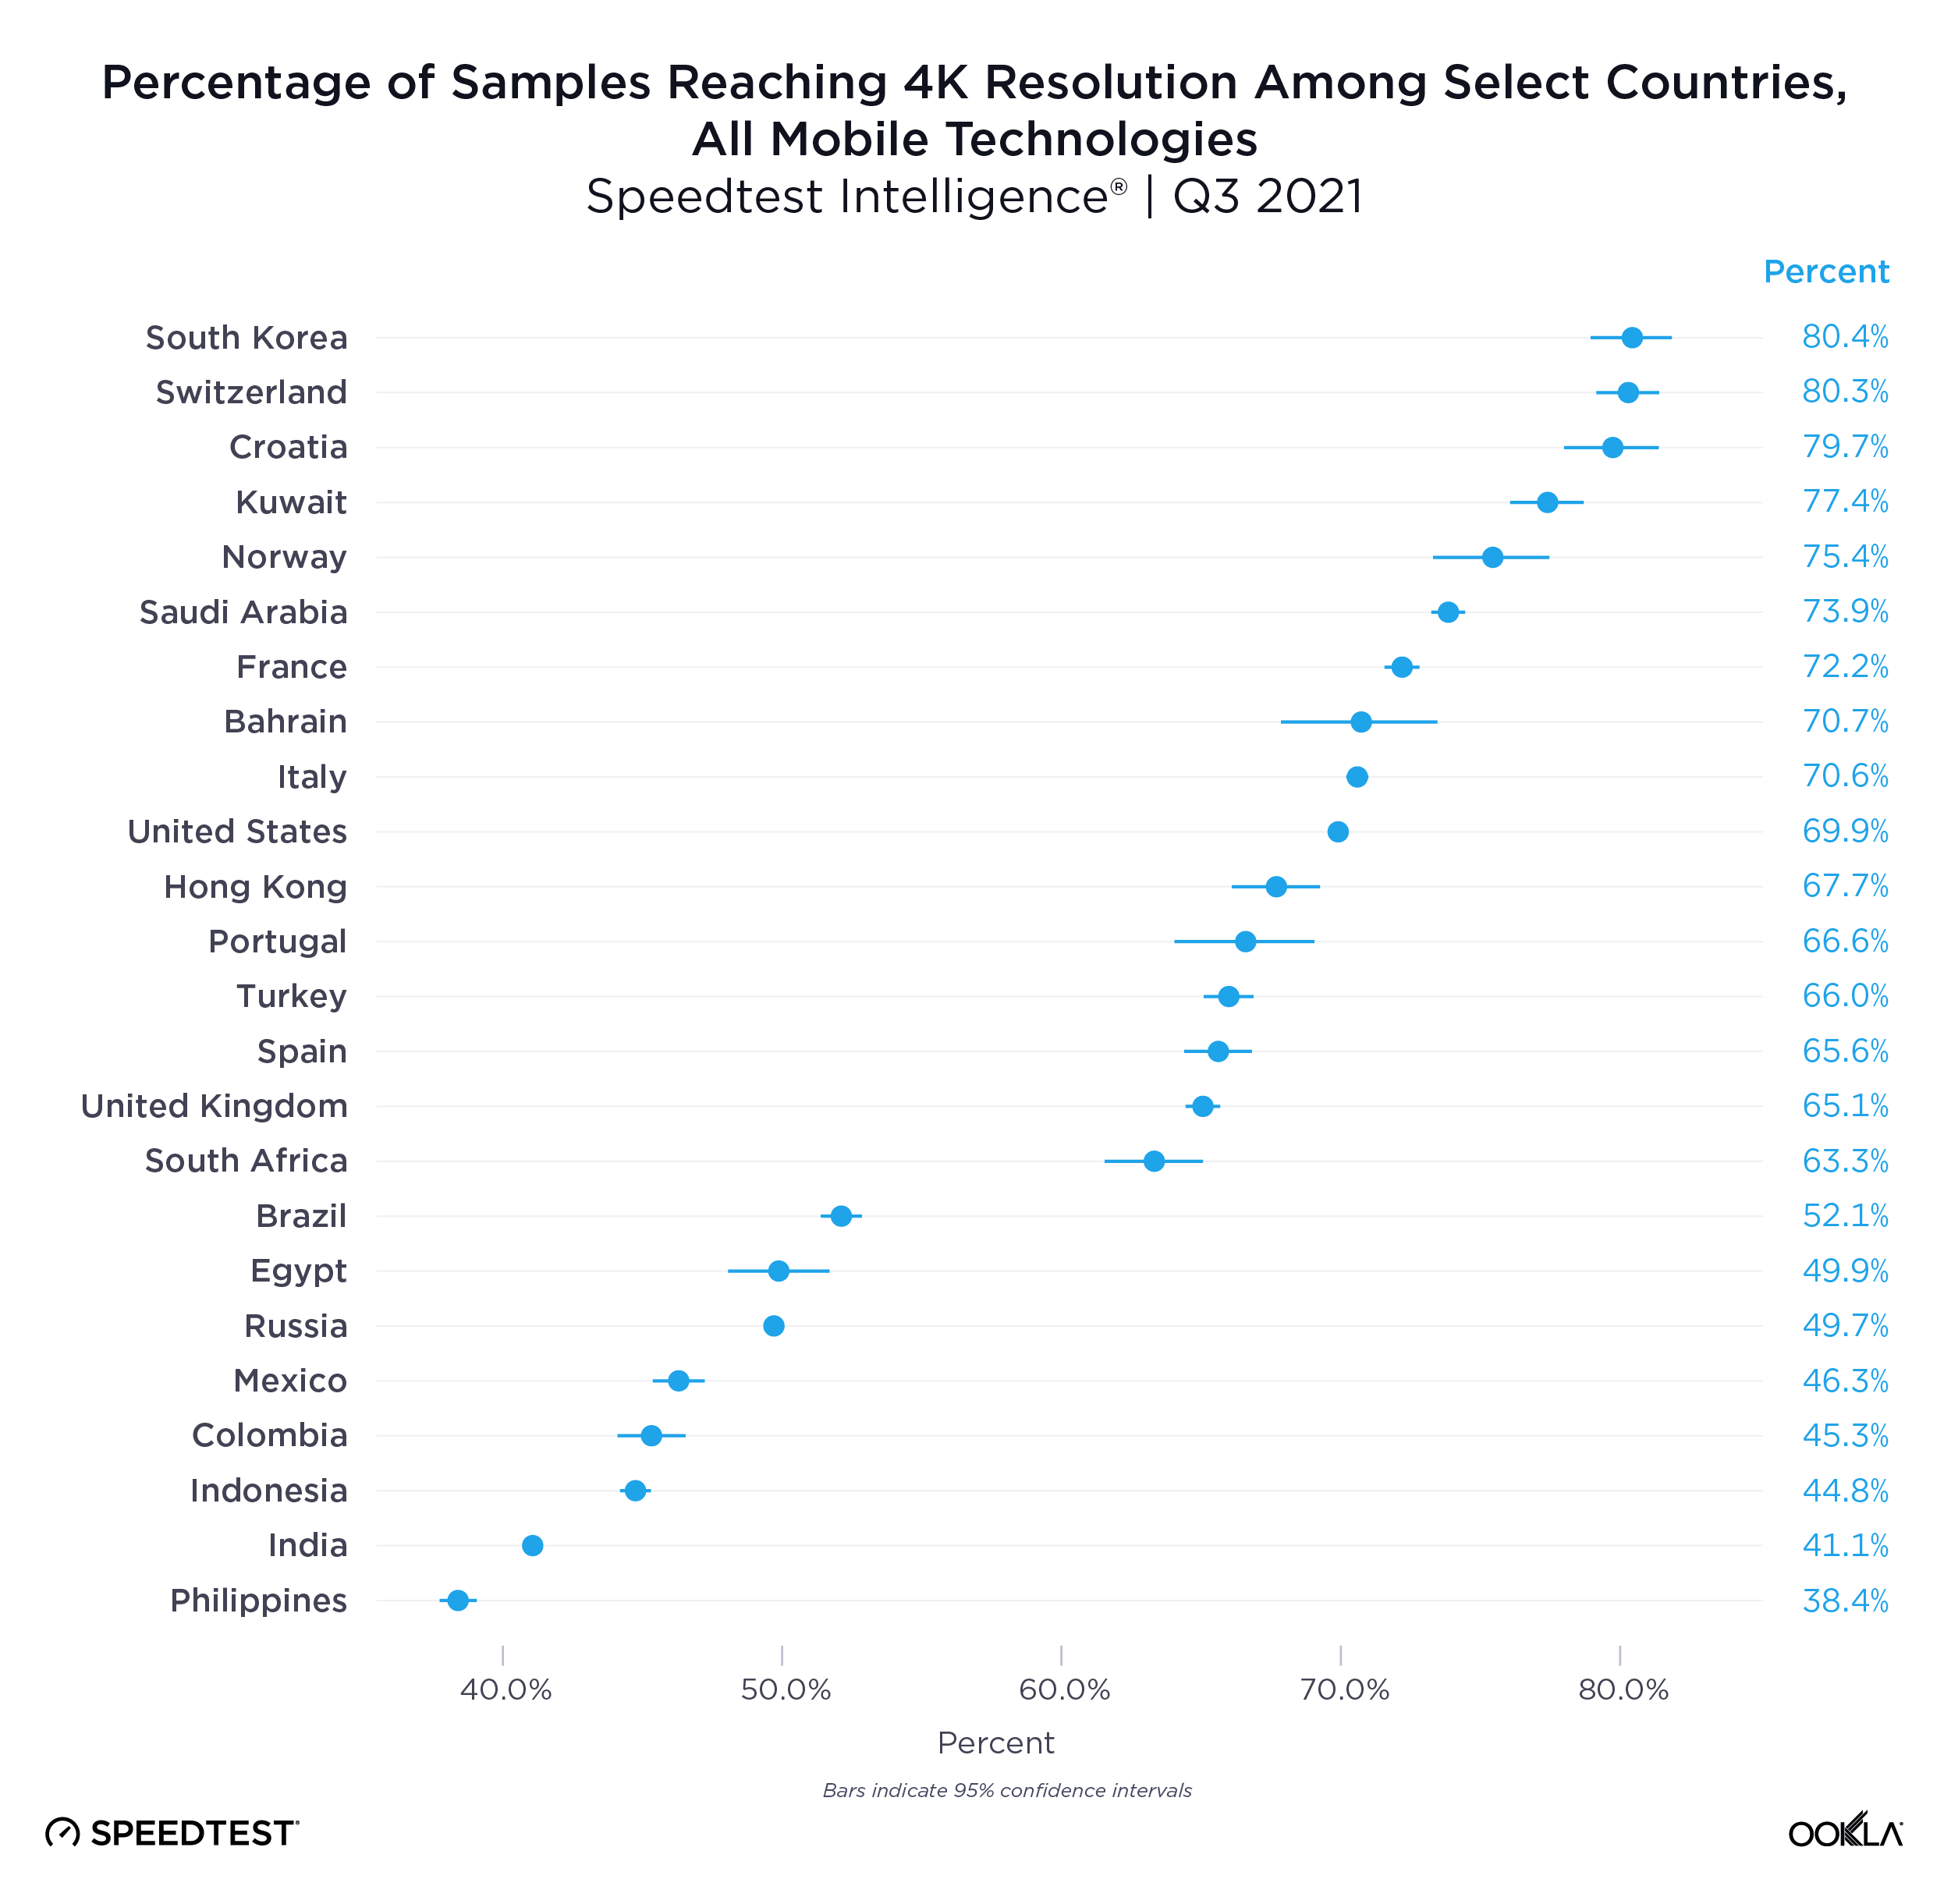
Video resolution is incredibly important in the experience of streaming video and the higher the resolution, the more definition and clarity we are able to see. These days, the difference between an SD and 4K experience is gigantic. Resolution is measured in the numbers of pixels in a 16:9 ratio, with 2160 pixel height representing a 4K picture. Video Analytics measures the resolution rates, which represent the portion of samples that reach a particular resolution. In this analysis, we evaluated the resolution rates for 4K, typically the highest resolution users will need.
Using Speedtest Intelligence, we found South Korea and Switzerland had the highest overall successful resolution rates for all mobile technologies combined during Q3 2021, reaching 4K resolutions 80.4% and 80.3% of the time, respectively. Croatia (79.7%), Kuwait (77.4%) and Norway (75.4%) were the only other countries on our list that achieved 4K video resolution more than 75.0% of the time. Only seven countries on our list did not reach a 4K resolution at least 50% of the time on all mobile technologies combined: the Philippines (38.4%), India (41.1%), Indonesia (44.8%), Colombia (45.3%), Mexico (46.3%), Russia (49.7%) and Egypt (49.9%).
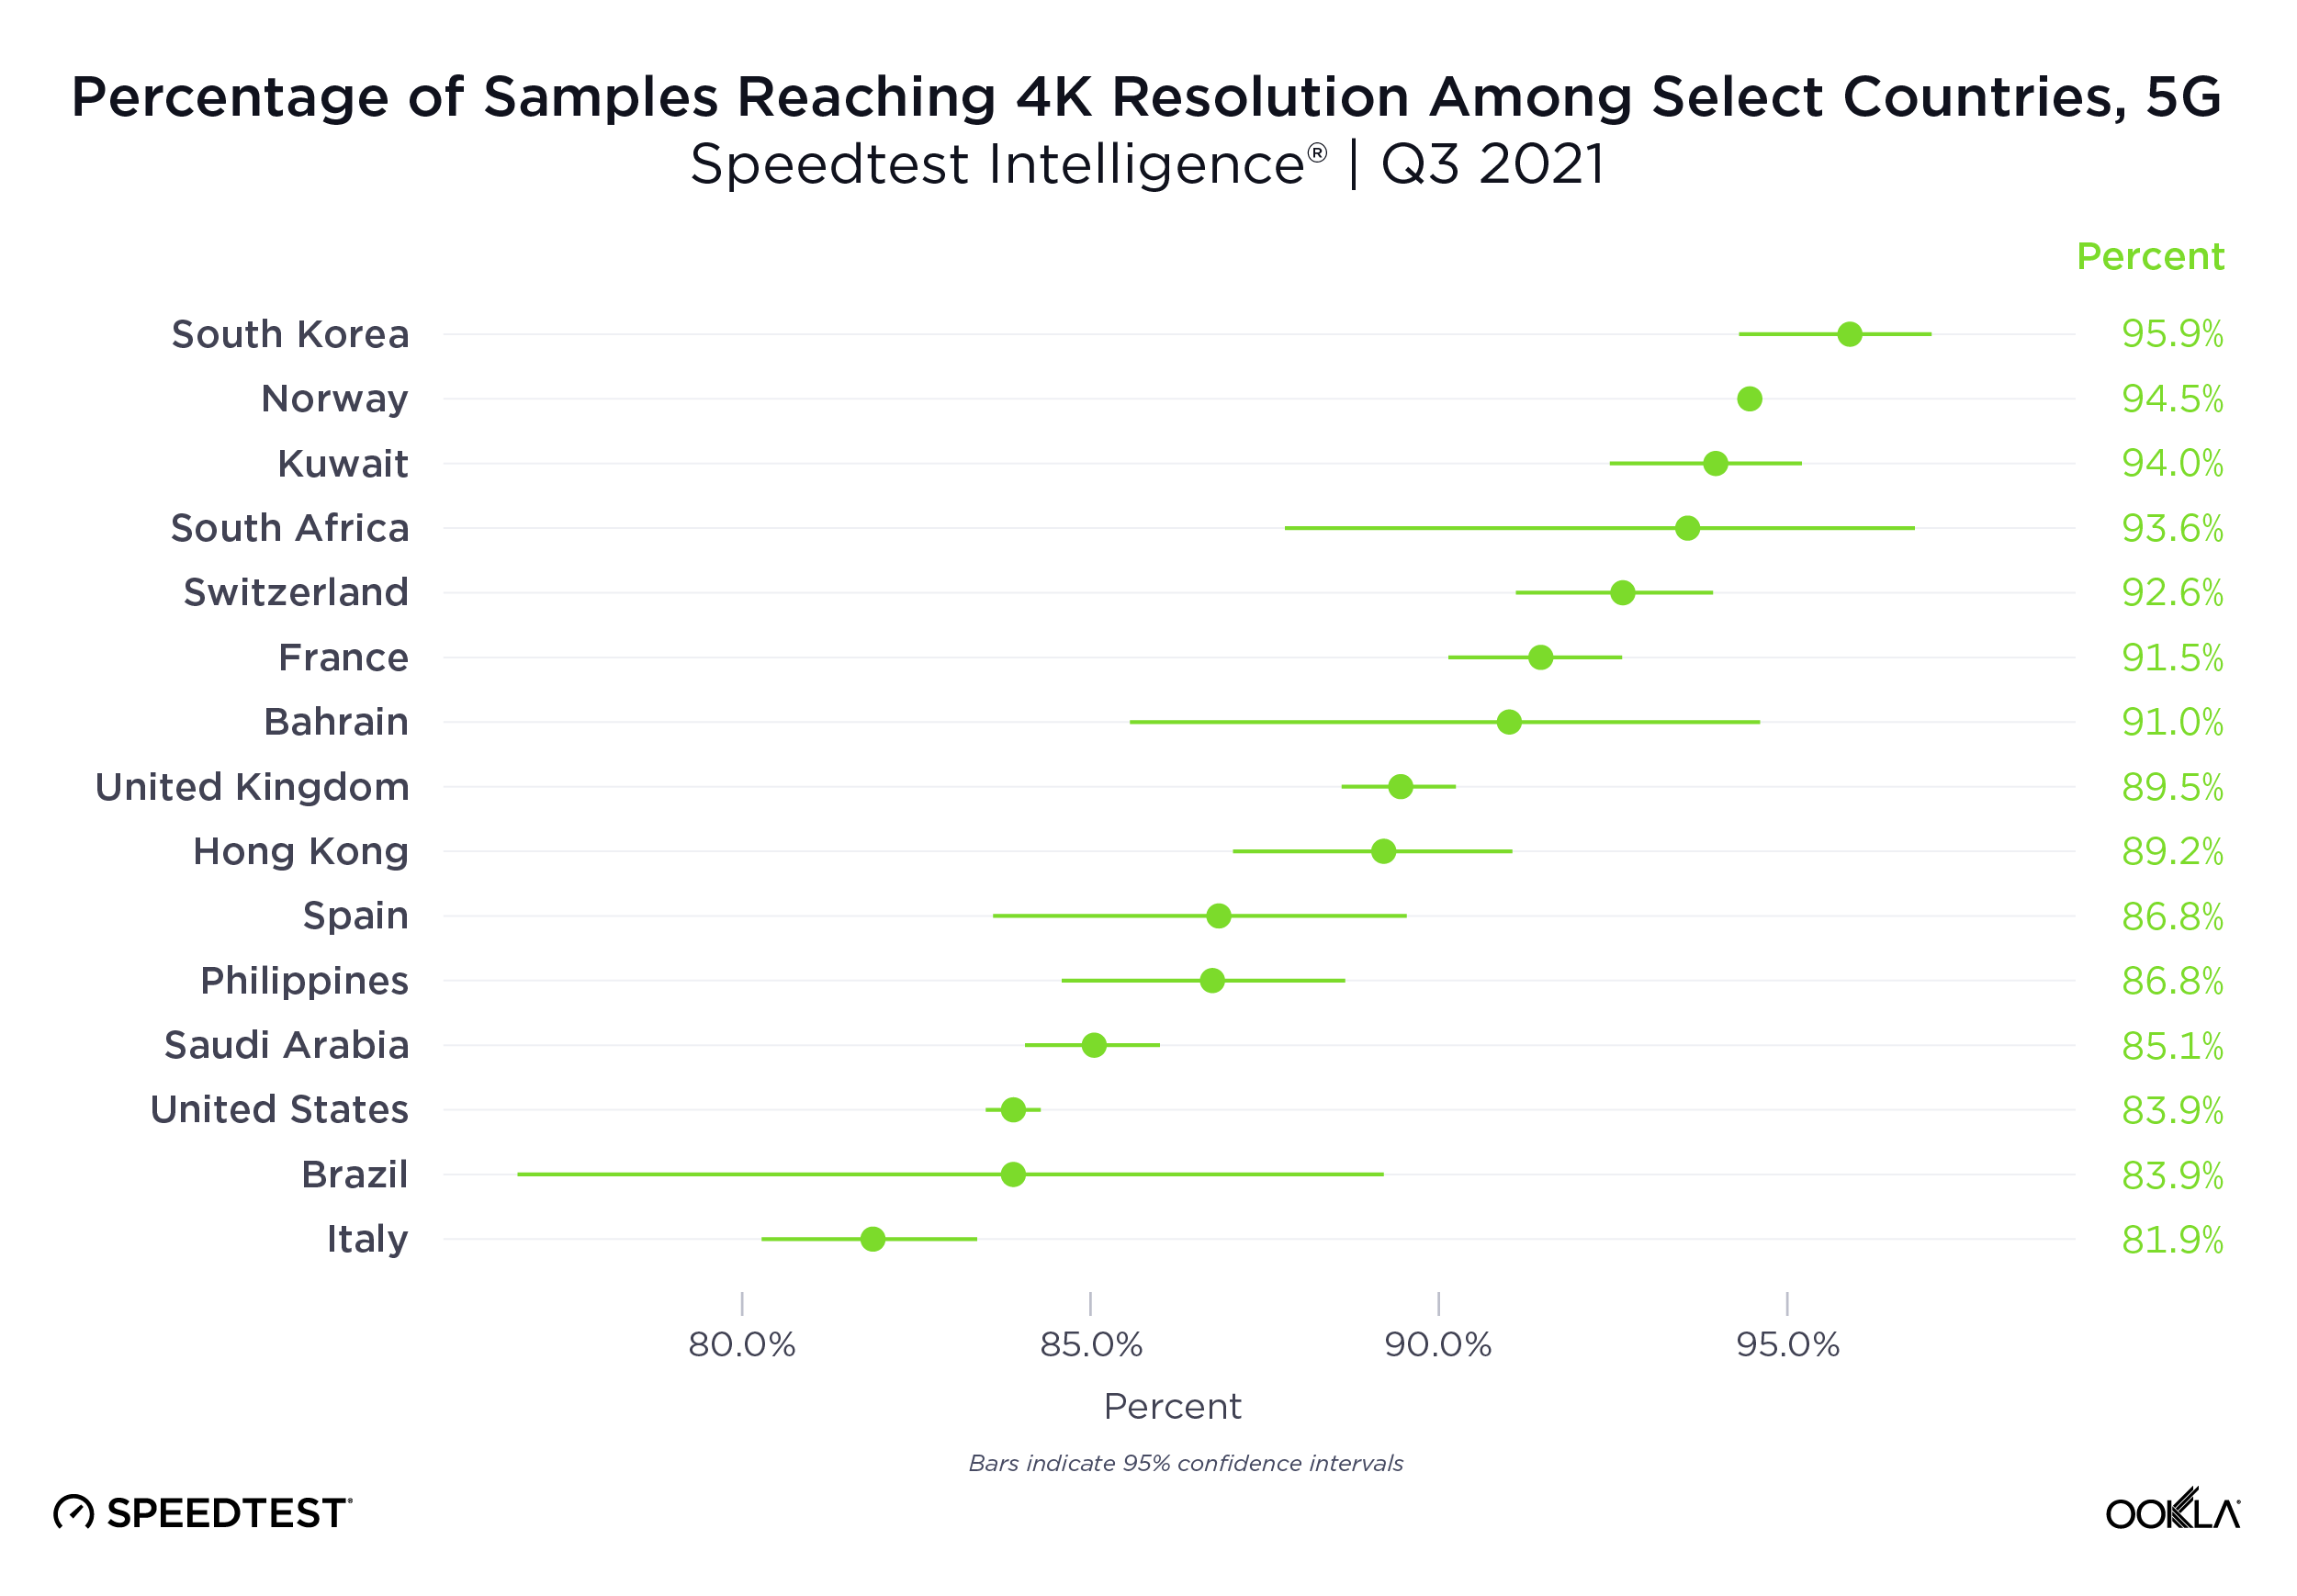
5G led to higher video resolution, but 4K mobile devices still remain rare
5G provided a higher resolution for mobile devices during Q3 2021 than all technologies combined. Every country we surveyed reached a 4K resolution over 80.0% of the time over 5G. In fact, six out of the 14 countries we surveyed for 5G achieved a 4K resolution more than 90.0% of the time, including South Korea (95.9%), Norway (94.5%), Kuwait (94.0%), South Africa (93.6%), Switzerland (92.6%) and France (91.5%). On the lower end of our list, only Italy (81.9%), Brazil (83.9%) and the U.S. (83.9%) achieved 4K resolutions less than 85.0% of the time.
While this is great news for the future of mobile devices, 4K resolutions in mobile devices still aren’t common: Sony is the only popular device manufacturer producing 4K mobile devices. In the meantime, users who can connect to 5G through either a hot spot or fixed wireless access (FWA) will reap the benefits of being able to stream on 4K devices like computers, televisions or tablets.
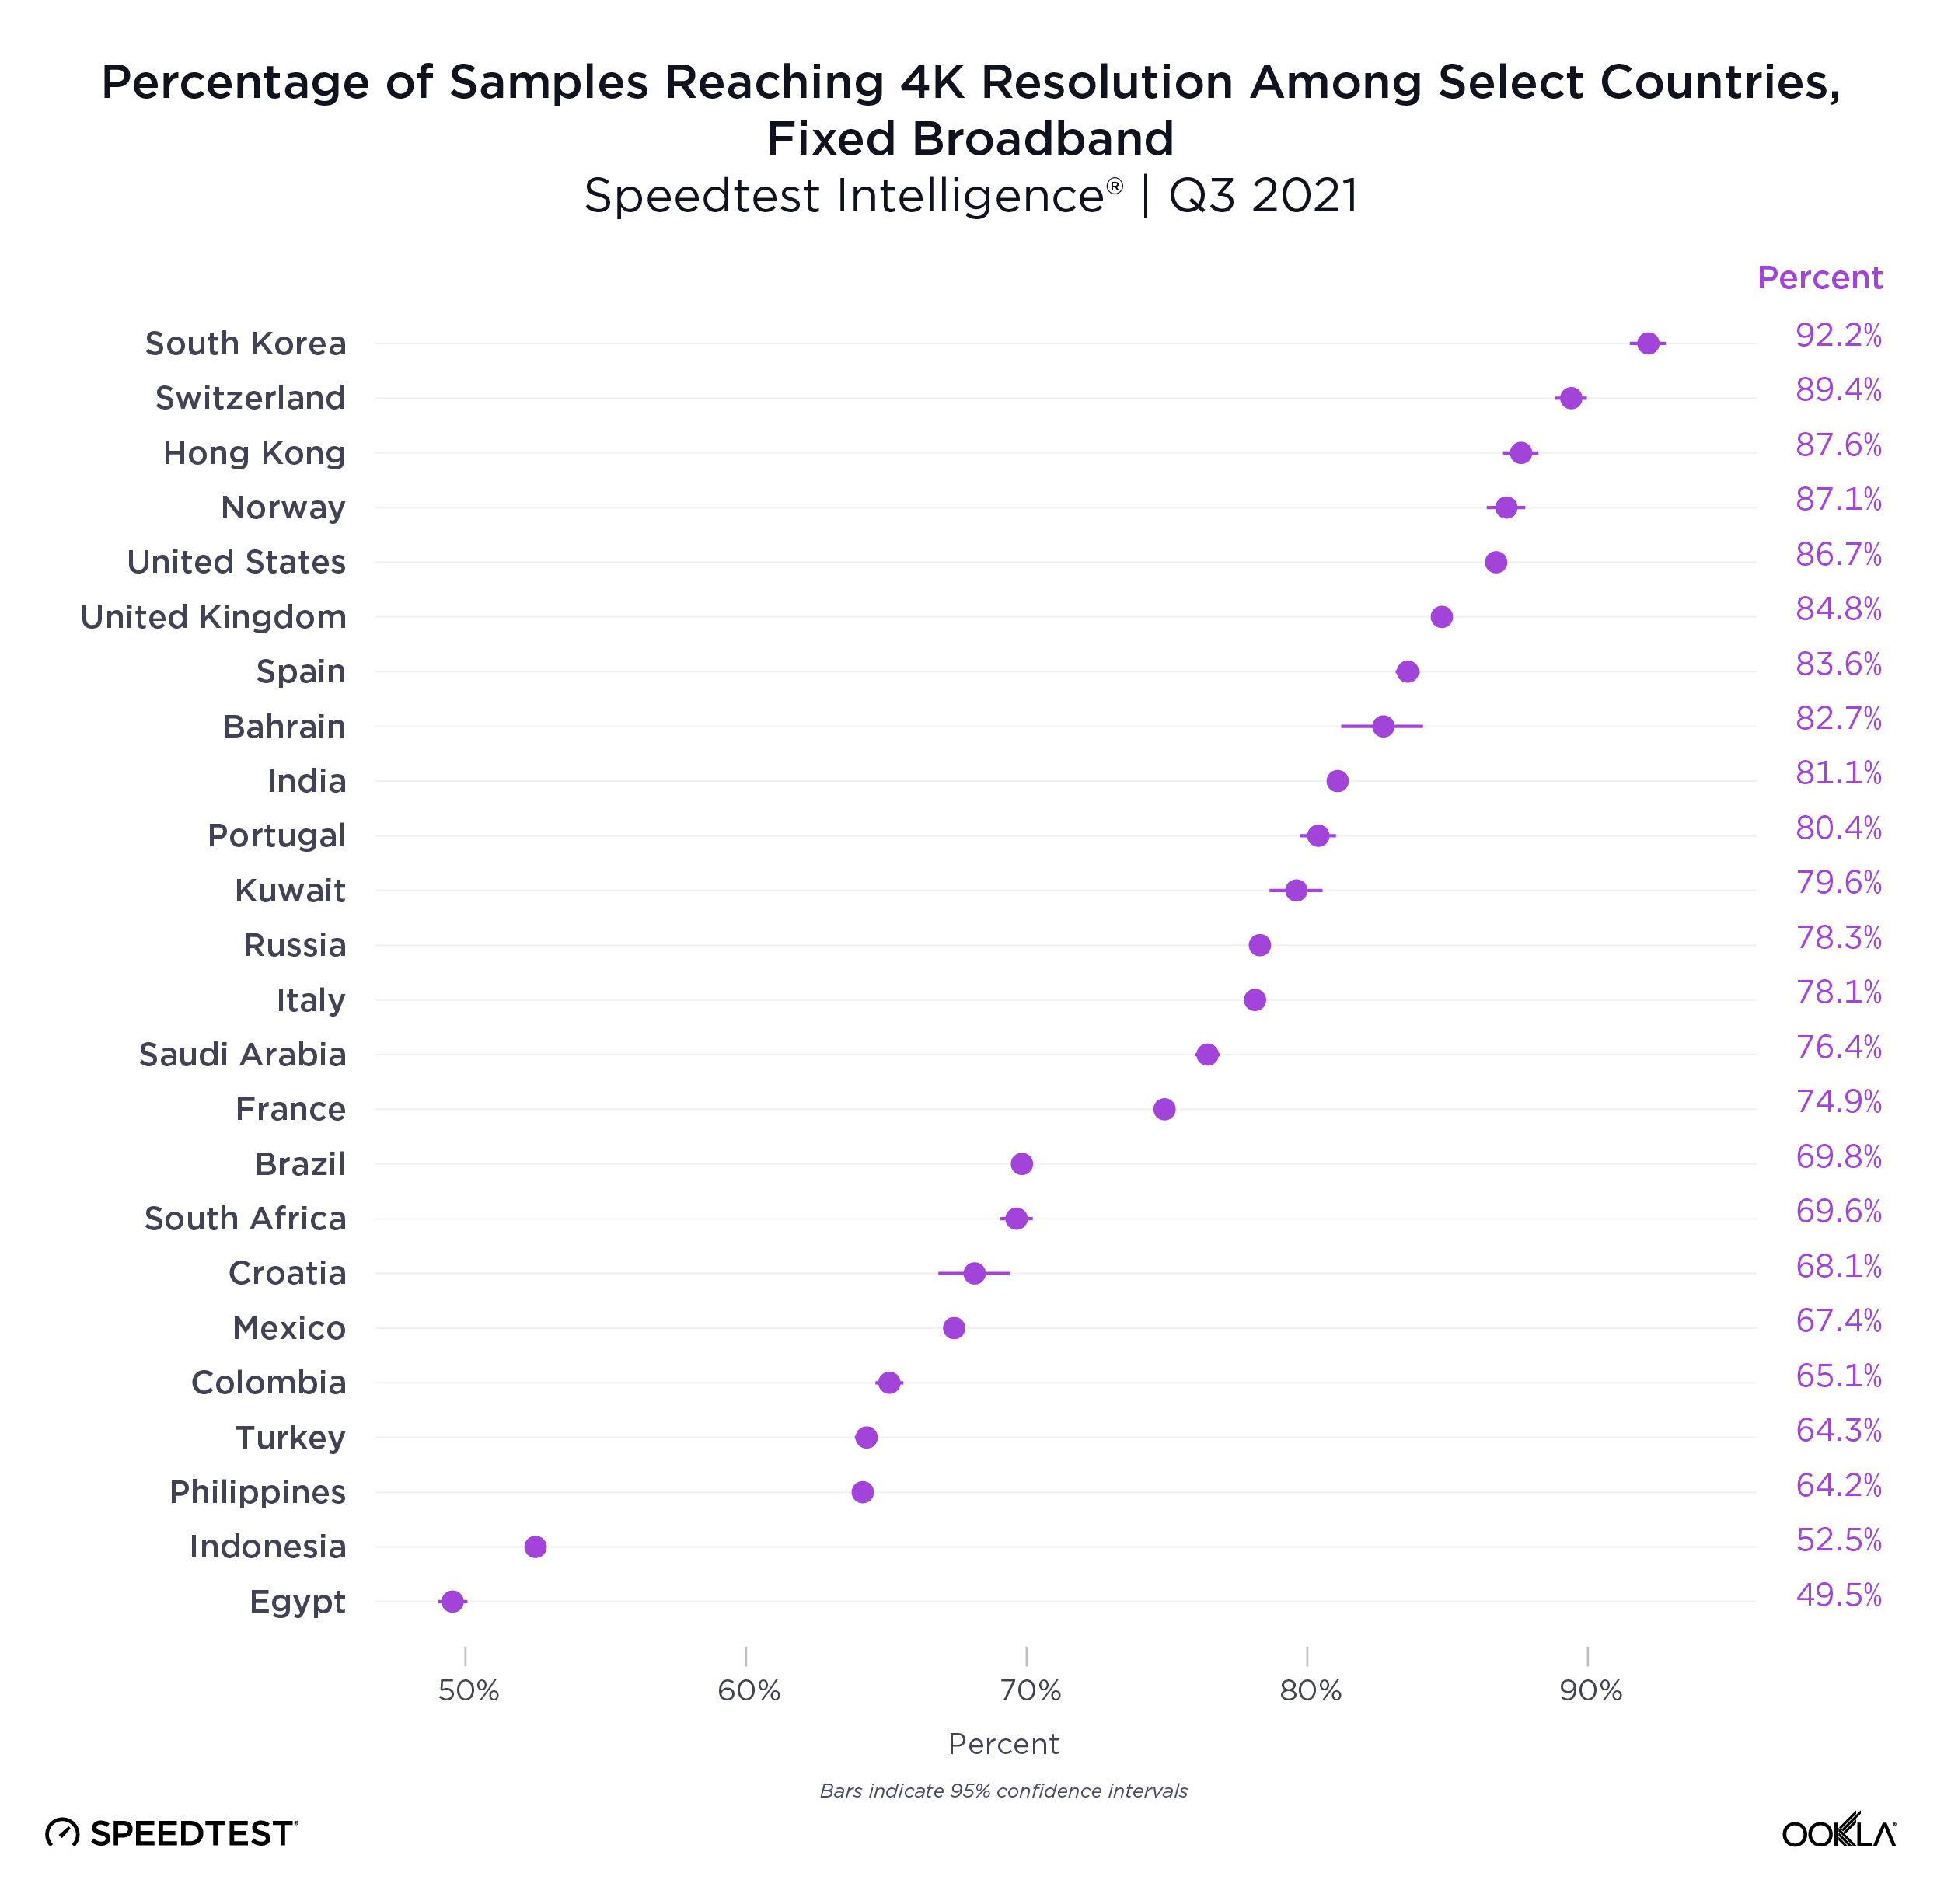
South Korean fixed broadband delivers ultra-high definition resolutions
Speedtest Intelligence reveals South Korea had the highest fixed broadband 4K resolution rate among countries surveyed at 92.2% during Q3 2021. Other countries that achieved 4K resolution rates above 85.0% on fixed broadband during Q3 2021 included: Switzerland (89.4%), Hong Kong (87.6%), Norway (87.1%) and the U.S. (86.7%). Every other country in our analysis achieved 4K resolution rates between 65.0% and 85.0%, except Egypt (49.5%), Indonesia (52.5%), the Philippines (64.2%) and Turkey (64.3%).
Video Analytics gives you the information you need about your video playback
We’re excited to share more about video performance and quality of experience using Video Analytics in the coming months. In the meantime, if you want to learn more about Video Analytics and how it can help you benchmark and improve your network, please join our upcoming webinar, December 9 by clicking here.
Ookla retains ownership of this article including all of the intellectual property rights, data, content graphs and analysis. This article may not be quoted, reproduced, distributed or published for any commercial purpose without prior consent. Members of the press and others using the findings in this article for non-commercial purposes are welcome to publicly share and link to report information with attribution to Ookla.
Internet connectivity continues to speed ahead for people around the world, especially as countries prioritize and improve mobile and fixed broadband networks. That’s nowhere more apparent than on the Speedtest Global Index™, which tracks countries’ internet speeds and the overall global median internet speeds. Last year, we took a look at the state of the internet speeds over the years, and today we’re back to see how most of 2022 fared from November 2021 to November 2022, and what countries made our top 10 fastest mobile and fixed broadband lists.
Mobile download speed jumped nearly 17% over the last year globally, fixed broadband up at least 28%
The improvement of global median download speeds has been somewhat asymmetrical over the past year on the Speedtest Global Index. Fixed broadband speeds made greater strides over the past year than mobile download speeds, with fixed broadband speeds becoming at least 28% faster and mobile becoming nearly 17% faster from November 2021 to November 2022. Gains in upload speed were even more pronounced with mobile becoming at least 9% faster and fixed broadband becoming at least 30% faster. Latency, which is becoming an increasingly important metric, decreased on mobile over the course of the year from 29 ms in 2021 to 28 ms in 2022, while fixed broadband latency remained the same at 10 ms.
Top 10 rankings remain relatively constant over the past year, U.A.E. joins fixed broadband list and Denmark, Macau (SAR), and Brunei race ahead for mobile during 2022
Chile raced ahead on fixed broadband
The competition for the fastest fixed broadband was neck-and-neck on the Speedtest Global Index during 2022, with Chile (216.23 Mbps) taking top honors and China (214.23 Mbps) and Singapore (214.23 Mbps) a hair behind. Over the course of the year, the top 10 countries for fastest fixed broadband remained relatively the same while each country jostled up and down the list for fixed broadband superiority. Only Spain was replaced from the top 10 with the U.A.E. taking its place. Notably, China jumped four places from sixth to second, improving its median download speed from 146.62 Mbps in 2021 to 214.58 Mbps in 2022. Romania’s tenth place finish in 2022 would have earned fourth place in 2021, showing how fast these countries are all prioritizing improved fixed broadband speeds.
Qatar soars to first for fastest mobile country
Ahead of hosting the FIFA World Cup 2022®, Qatar rocketed to first place on the Speedtest Global Index with a median download speed of 176.18 Mbps in November 2022 from 98.10 Mbps in November 2022. Next on the list was the U.A.E. at 139.41 Mbps, which had the fastest median download speed in November 2021. Notably, all 10 countries on our November 2022 list had median mobile download speeds greater than 100 Mbps. New to our 2022 list Denmark (113.44 Mbps), Macau (SAR) (106.38 Mbps), and Brunei (102.36 Mbps) replaced Saudi Arabia, Cyprus, and Kuwait from our 2021 list.
Most of the top 10 countries perform well for fixed and mobile
Out of the 17 countries appearing on either the fastest fixed broadband or mobile Speedtest Global Index top 10s during November 2021 — with China, Denmark, and the U.A.E. appearing on both lists — all but Monaco met the statistical threshold to be included to look at overall fixed and mobile performance. Looking at the remaining 16 countries, most every country on both lists performed relatively well against the global median for both fixed and mobile, which appear as gray lines in the image above. Three countries underperformed a global median: Brunei and Bulgaria for fixed, and Chile for mobile. Thailand performed at about roughly the global median for mobile, as did Romania.
We’re excited to see how global speeds and rankings change over the next year as individual countries and their providers choose to invest and expand different technologies, particularly in 5G and fiber. Be sure to track your country’s and check in on our monthly updates on the Speedtest Global Index. If you want more in-depth analyses and updates, subscribe to Ookla Research™.
Ookla retains ownership of this article including all of the intellectual property rights, data, content graphs and analysis. This article may not be quoted, reproduced, distributed or published for any commercial purpose without prior consent. Members of the press and others using the findings in this article for non-commercial purposes are welcome to publicly share and link to report information with attribution to Ookla.
Taking advantage of remote work in another country is the dream for many. Who hasn’t imagined themselves sipping fresh squeezed juice on a gorgeous tropical beach during a team call, cozying up next to a crackling fire in a European castle while pouring over a spreadsheet, or even just working anywhere that isn’t the office or our home couch? COVID-19 made working remotely more readily an option for some, and 51 countries have even gone so far as to create remote work or “digital nomad” visas. Today, Ookla® brings you fresh data on how these countries’ internet compares so you can start planning a long-term escape from your current reality.
Using Speedtest Intelligence®, we looked for remote work countries with the fastest internet, tropical countries with remote work visas and fast internet, fastest European countries for remote work, countries where you won’t lose your connection, and seven affordable remote work countries with good internet. Read on to start planning your next life adventure.
Digital nomad countries with seriously fast internet
Getting the fast download speeds you need to do your daily tasks should be the least of your worries when you work abroad. Thailand had the fastest fixed broadband speeds among countries that have remote work visas with a median download speed of 196.20 Mbps and a median upload speed of 164.85 Mbps during Q1 2023. With speeds like those, you’ll be able to eat your Guay Teow while gaming, streaming multiple 4K videos, and uploading videos of your adventures with no issues (and you should be able to work, too).
Spain (172.04 Mbps) and Romania (171.15 Mbps) were next on our list of fastest remote work destinations, followed by Hungary (134.43 Mbps), Portugal (128.50 Mbps), Taiwan (127.85 Mbps), Norway (111.44 Mbps), Panama (108.84 Mbps), and Brazil (100.38 Mbps), which all had median download speeds over 100 Mbps during Q1 2023. Rounding out our list of fastest remote work countries are Malta (97.55 Mbps) and Bermuda (97.20 Mbps). If speed is of the utmost importance to you while you work and live in another country, rest assured that these countries can handle the bandwidth you need.
Soak up the sun with fast internet in these beachy countries with remote work visas
If you dream of a remote work escape and prefer tropical, sunny beaches where you can sip piña coladas, we’ve got you covered (though don’t forget your sunblock when you venture outside!) Twenty-seven countries have digital nomad visas, average temperatures above 65° F (roughly 18° C), and beach access. Unsurprisingly, Thailand, again takes the top spot with a median download speed of 196.20 Mbps, followed by Taiwan (127.85 Mbps), Panama (108.84 Mbps), Brazil (100.38 Mbps), Malta (97.55 Mbps), Bermuda (97.20 Mbps), Malaysia (92.53 Mbps), Dominica (80.00 Mbps), Barbados (74.21 Mbps), and St. Lucia (71.40 Mbps). Grenada (65.25 Mbps), Costa Rica (65.07 Mbps), and Montserrat (63.22 Mbps) followed closely behind the top 10.
If you choose to work remotely from one of these countries, we’ll be jealously awaiting you sharing your Speedtest® results on Twitter as you work from the beach, take a dip in the ocean during your break, and relax with a cool ocean breeze as your biggest worry in the world.
These European countries with remote work visas had the fastest internet speeds
Maybe you’ve been watching all the Eurovision or have been dreaming of jetting off to European locations every weekend. Luckily for you, 16 European countries offer some version of a remote work visa. Speedtest Intelligence data reveals that Spain had the fastest median download speed at 172.04 Mbps during Q1 2023. Romania, Hungary, Portugal, and Norway followed with median download speeds above 100 Mbps. Malta (97.55 Mbps), Germany (82.05 Mbps), Latvia (77.76 Mbps), Estonia (64.80 Mbps), and Czechia (55.97 Mbps) rounded out the top 10, with Cyprus (53.71 Mbps) coming up just behind. Regardless of which European country you choose, you’ll be a few hours away from multiple countries with plenty to do and eat!
10 remote work countries where you won’t lose your connection
You shouldn’t have to stress about your internet connection while you’re working abroad — especially if you have to video chat often. So we used Speedtest Intelligence data to examine the Consistency — calculated by the percentage of results showing at least a 25 Mbps download speed and 3 Mbps upload speed over fixed broadband — in countries with remote work visas during Q1 2023. While there was no statistically highest Consistency, Thailand had a Consistency of 89.8%, Romania 89.7%, and Taiwan 89.5%. Norway followed at 87.3%, then Malaysia, Brazil, Portugal, Hungary, Spain, and Bermuda rounding out the top 10. Rest assured if you choose one of these countries, you should be able to stream and video chat while you work. Just remember to mute that movie during your team call.
Seven affordable places with good internet for digital nomads on a budget
Internet speed and consistency are important for remote work — but they’re not everything when you’re deciding where you want to spend your next adventure. If you’re looking for an affordable location to spend your time, save some money, and get good internet, we’ve got you covered.
We used thresholds of 50 Mbps download, 10 Mbps upload, and under 100 ms latency to designate a country of having “good” internet — these speed thresholds are minimums to what should allow you to stream in 4K, video chat, and do most work-related tasks. The latency threshold number is high, but cheap, fast internet with super low latency is not common enough. We compared that list against World Bank data for GDP per capita (PPP) from 2021 which adjusts for cost of living, and narrowed down countries that have less than the world average of $18,607. Seven countries qualified for inclusion on our list based on those criteria: Barbados, Brazil, Dominica, Ecuador, Grenada, Montserrat, and St. Lucia.
Brazil had the fastest download speed at 100.38 Mbps on our affordable countries for remote work list, followed by Dominica (80.00 Mbps), Barbados (74.21 Mbps), St. Lucia (71.40 Mbps), Grenada (65.25 Mbps), Montserrat (63.22 Mbps), and Ecuador, which eked out a place on this list at 50.55 Mbps. Every country on this list had a median upload speed above 20 Mbps. All of the countries had a Consistency higher than 70%, except St. Lucia, which was just under at 68.3%. If latency, which causes the kind of lag that can make video calls frustrating, is a major concern, only Ecuador (14 ms) and Brazil (18 ms) had latencies under 20 ms.
Regardless of where you choose to work remotely among these seven countries, you should have access to internet that can keep you on top of what you need to do at work, while you save some cash, live well, and hit the beach, since all of these countries have average temperatures above 70° F (21°C). You might just have to brush up on your Spanish, Creole, Patois, or Portuguese to really get an immersive experience, but you should sleep easy knowing that you can live well and continue to work online.
What do you need to know before applying for a remote work visa?
Currently, there are 51 countries that offer some form of a remote work visa. The requirements for these visas vary widely across each country, but generally there are a few key things you’ll need to know before you choose a country to apply to.
First, you need to decide where you are going! Besides checking internet performance, you’ll want to research how long a remote visa can last, how much money you are going to have to earn to qualify, what costs you’ll be looking at, options to renew the visa, and what kind of fees you’ll need to pay along the way. At a minimum, you’ll need a passport.
You often can’t just show up and start working remotely; for a long-term stay, you’ll need to apply for a visa (along with any family members you might want to bring along). Approval isn’t straightforward — you may need to prove your income, translate documents, get documents notarized, and even make a minimum amount of money each month. Once approved, you’ll typically pay a fee for each family member you are bringing, and you should make certain if you have any additional fees or taxes you’ll be liable to pay throughout your stay.
Once you have your visa in order, you’ll need to figure out your living situation — whether that is something longer term, or moving around a country, you’ll want to keep any requirements of your visa up to date. Do your due diligence while you apply so you don’t find yourself in an unpredictable situation you could have avoided.
Ookla has the resources you need to plan your remote work trip
We hope this short guide will help you choose the right remote work experience to help you feel fulfilled. If you want to learn more about the internet experience in any of the countries we mentioned, or even find city data or internet provider data for your remote work journey, check out the Speedtest Performance Directory™. If you’re struggling to find a decent internet provider in your area, check out our satellite internet series to see if there is a fast satellite internet connection available. And don’t forget to download the Speedtest app for Mac, Windows, or Linux to make sure you’re getting the speeds you need to continue working remotely!
Ookla retains ownership of this article including all of the intellectual property rights, data, content graphs and analysis. This article may not be quoted, reproduced, distributed or published for any commercial purpose without prior consent. Members of the press and others using the findings in this article for non-commercial purposes are welcome to publicly share and link to report information with attribution to Ookla.