Winning and sustaining a customer’s business is a top priority for every mobile network operator. You could have the fastest network available in your market or the widest coverage, but still lose customers to competitors that provide better digital engagement or a more seamless customer experience. We know your team works day and night to make sure your network is operating, optimized and providing an experience that meets your customers’ expectations. Your team looks for coverage gaps where it makes sense to expand LTE or add 5G services. Your team constantly benchmarks your network against competitors to make sure you provide the best performance in key locations.
But despite all of your hard work, customer satisfaction with many telecommunications companies remains notoriously low and customer satisfaction doesn’t always align with network performance, as shown in the chart below. Customers often don’t feel like their problems are being addressed, they aren’t receiving transparent communications from their providers or they can’t even log problems due to service outages. Over time, these factors can add up to a lot of lost revenue, sunk costs and time and resources spent on issues and improvements that may not even increase customer satisfaction.

For the past 15 years, Ookla® has provided you with the tools to improve your network, including Speedtest Intelligence®, Cell Analytics™ and Downdetector®. Now, with the addition of our innovative SpatialBuzz solution, we can help you engage directly with your customers to identify, prioritize and diagnose customer dissatisfaction areas in real time for speedy resolution. Most importantly, SpatialBuzz allows you to close the customer feedback loop with meaningful, timely communications so that customers can see how hard you are working to improve their network experience.
Ookla is excited to offer you tools to improve your network performance and create a better experience for your customers. Click here to learn how top-rated mobile network operators are utilizing SpatialBuzz or inquire directly about any of our products.
Ookla products help you improve your network
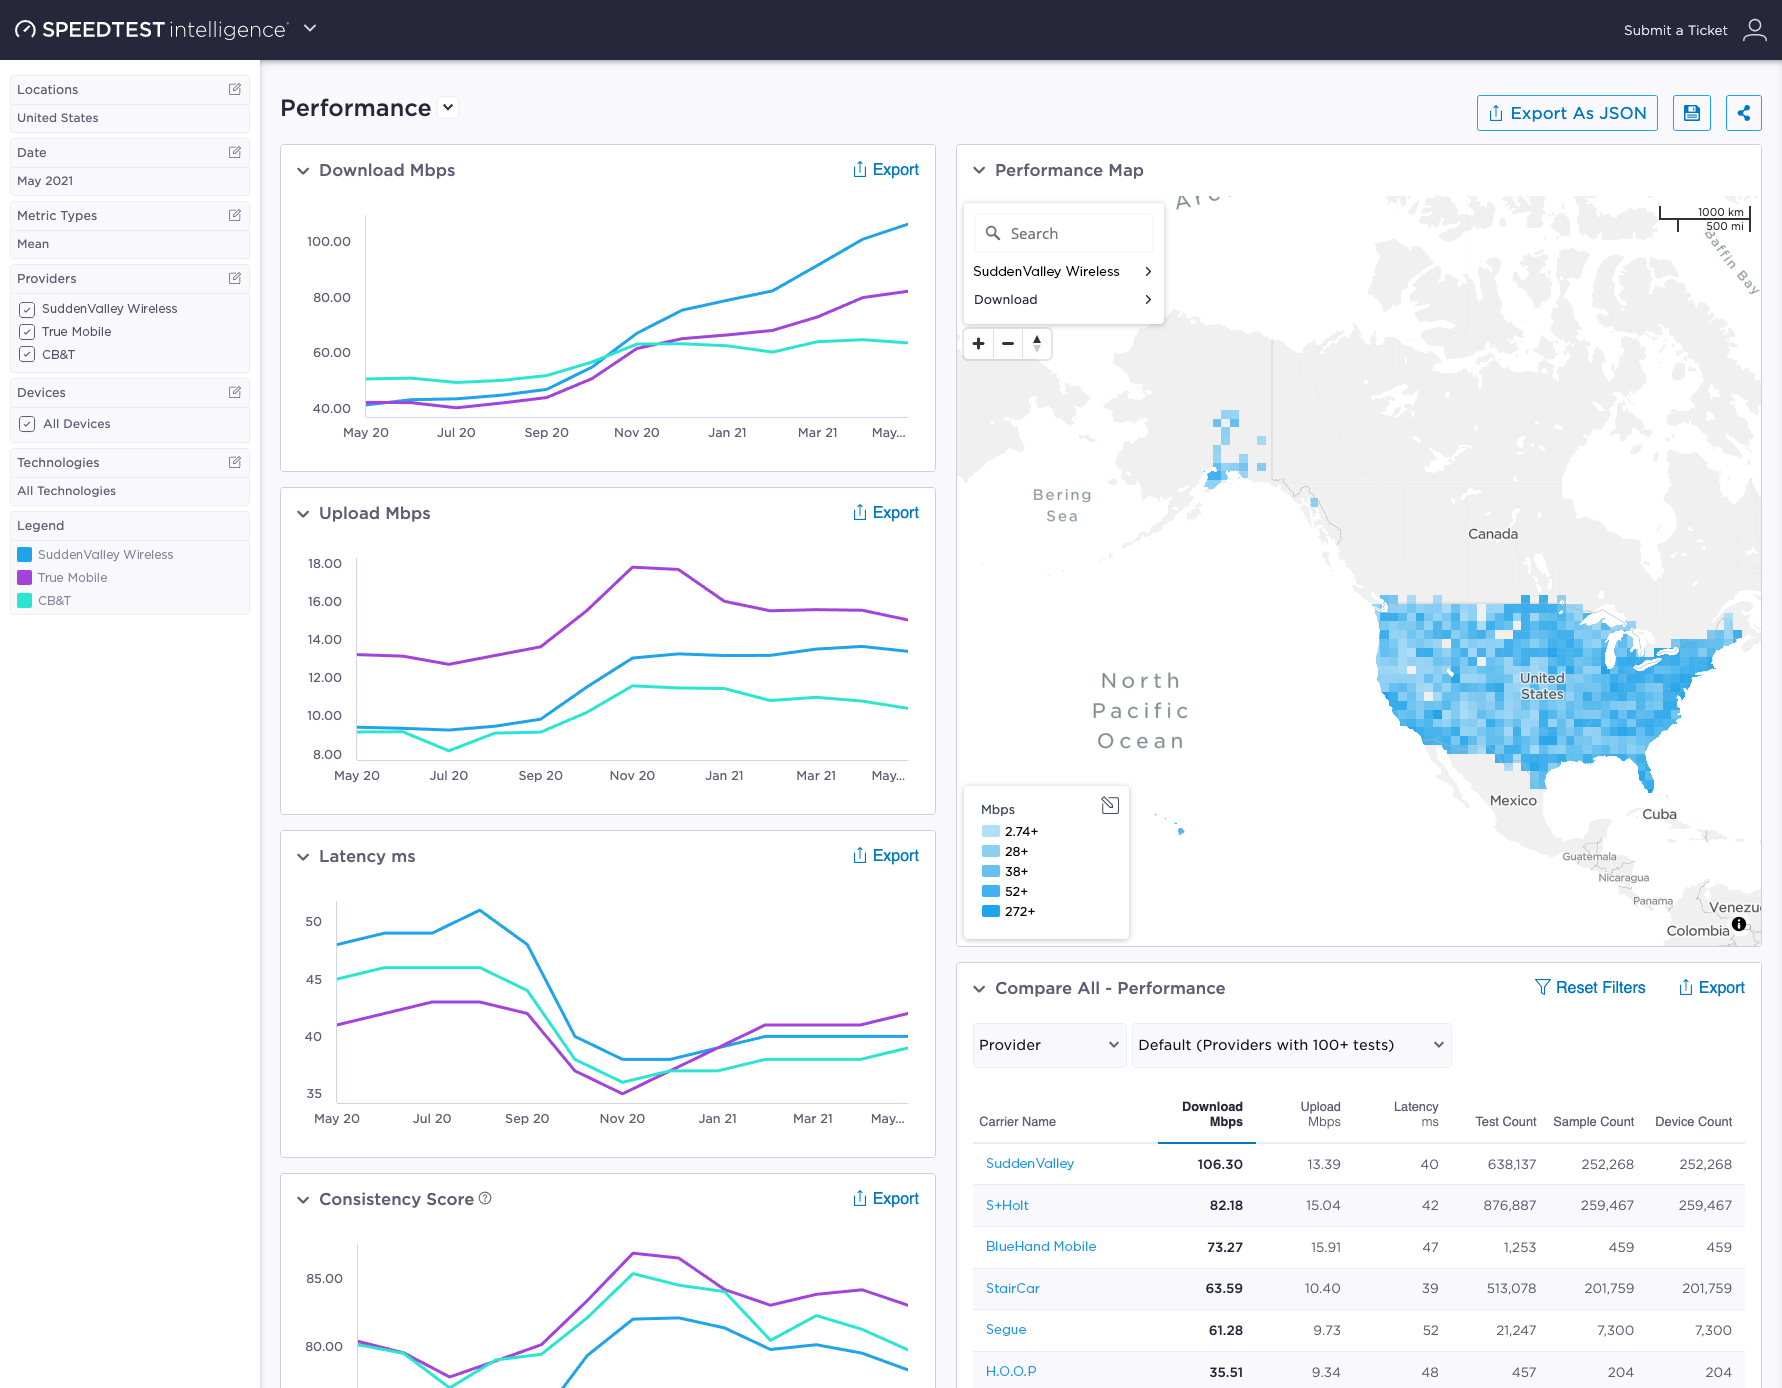
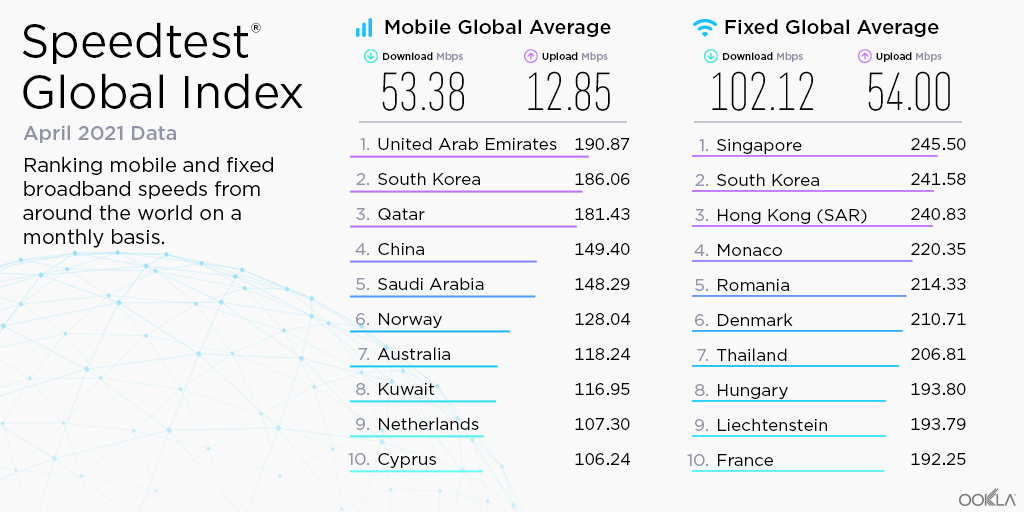
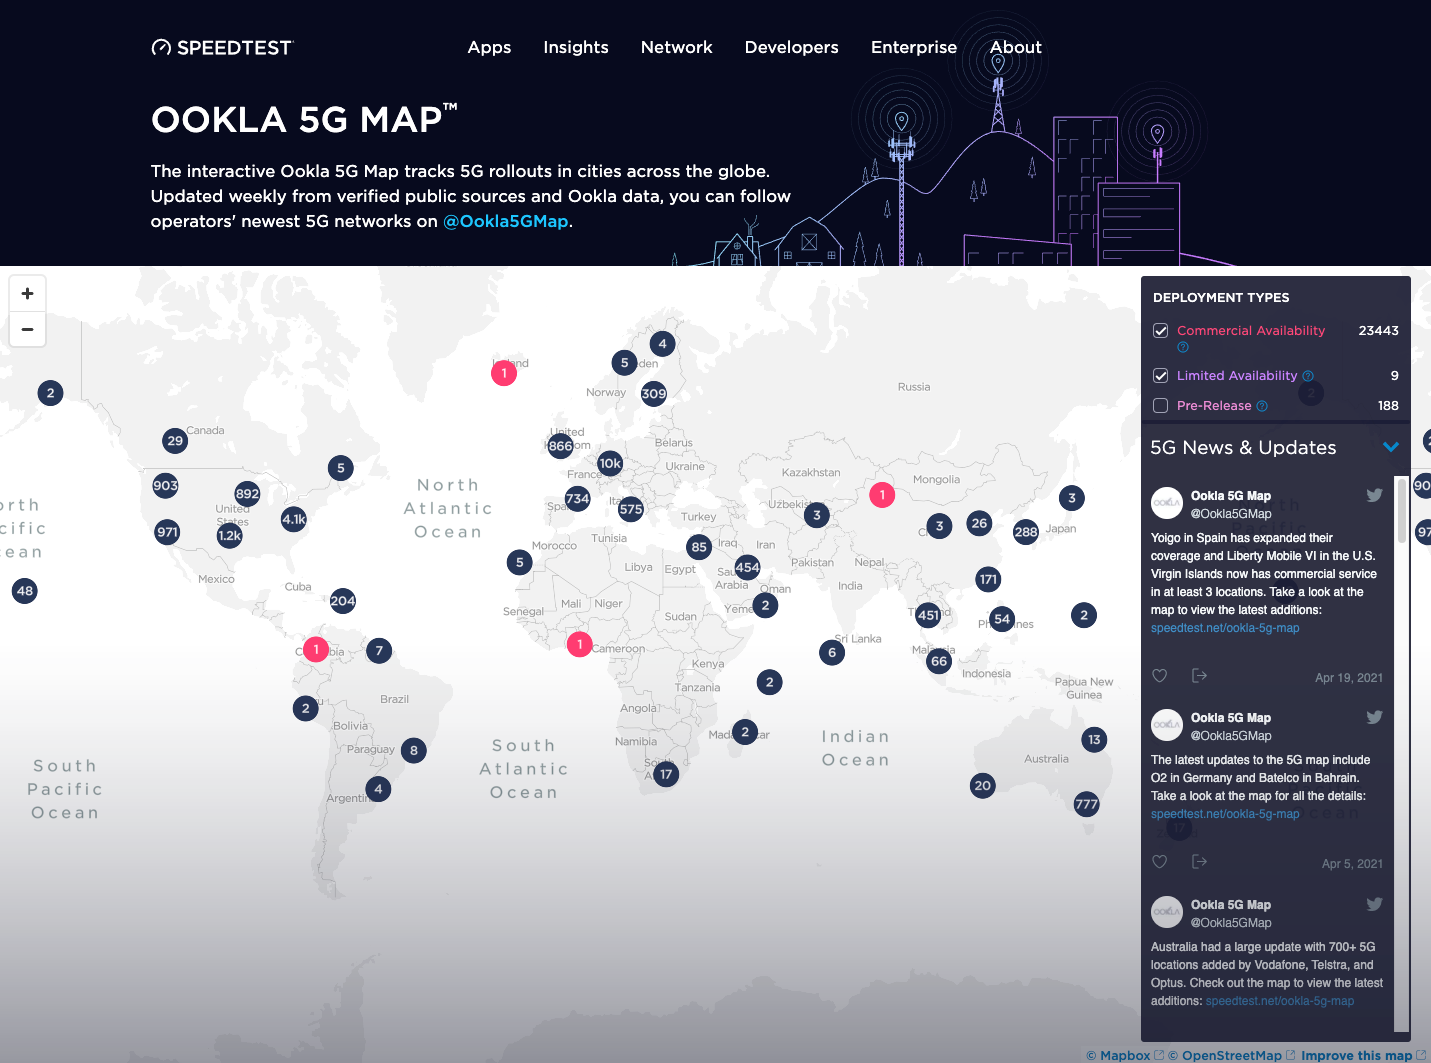
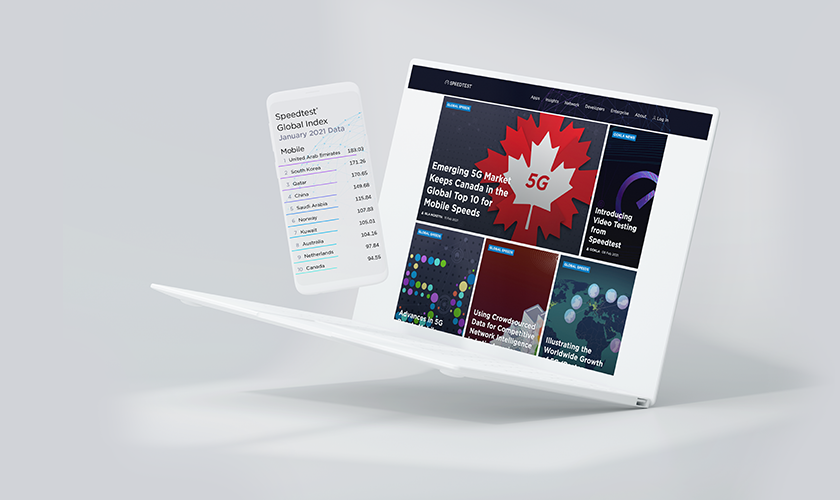
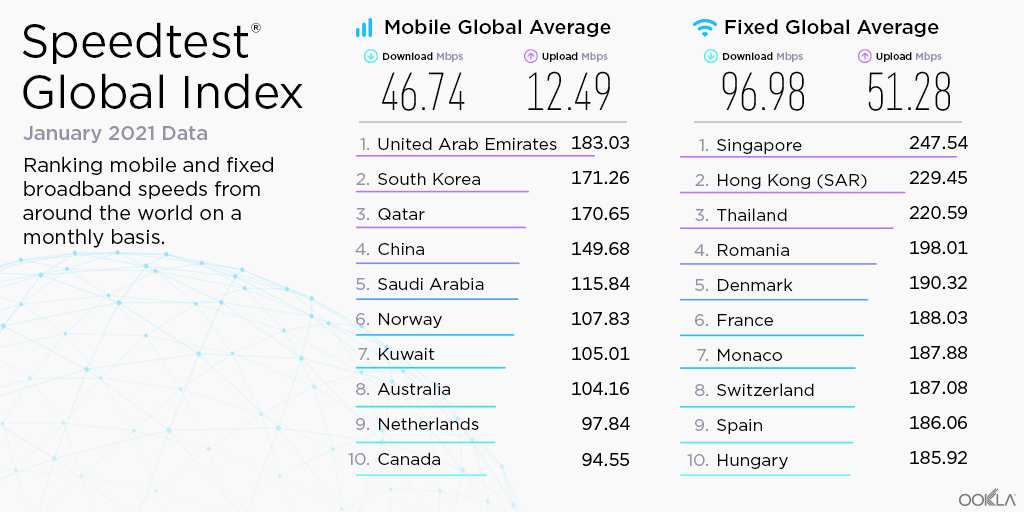
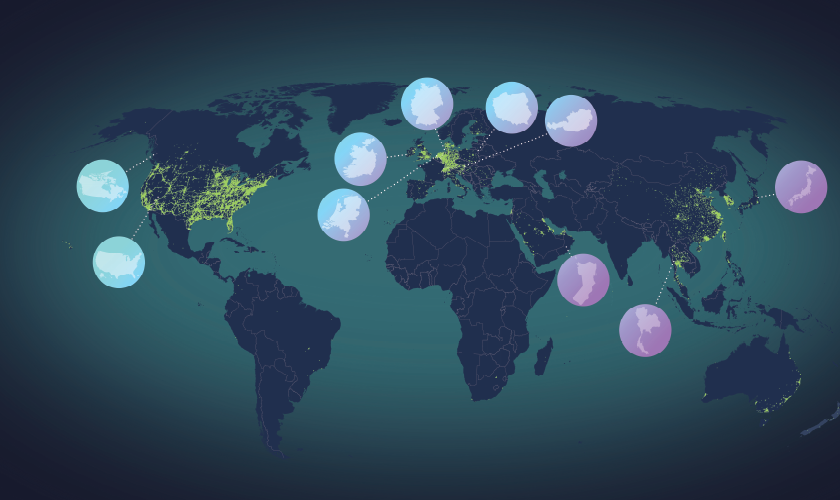
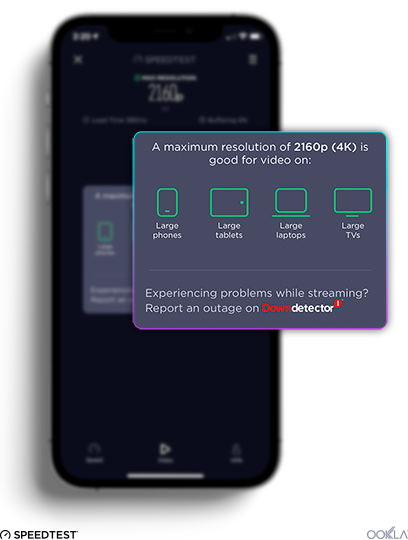
With over 200 data points on billions of consumer-initiated tests and coverage scans, ISPs, mobile operators, governments and regulatory bodies trust Speedtest Intelligence as an official source of record for the state of worldwide markets. Speedtest Intelligence offers up-to-date insights into global fixed broadband and mobile networks based on over 10 million consumer-initiated tests taken every day with Speedtest® and hundreds of millions of daily network coverage scans.
You may have used Speedtest Intelligence to benchmark your network against competitors, investigate your overall performance or pinpoint geographic trouble spots. With the addition of Consumer Sentiment data, you can now better understand the relationship between network performance and customer satisfaction.
Consumer Sentiment data in Speedtest Intelligence helps you better understand your customers’ experience on your network
You know that customer satisfaction plays a major role in retention, but custom research can be expensive. Consumer Sentiment data allows you to gauge customers’ overall satisfaction using the Speedtest Intelligence Portal. We aggregate one-question surveys presented at the end of a Speedtest experience, these responses are aggregated, analyzed and transformed into valuable insights.
Cell Analytics provides unparalleled intelligence about your network
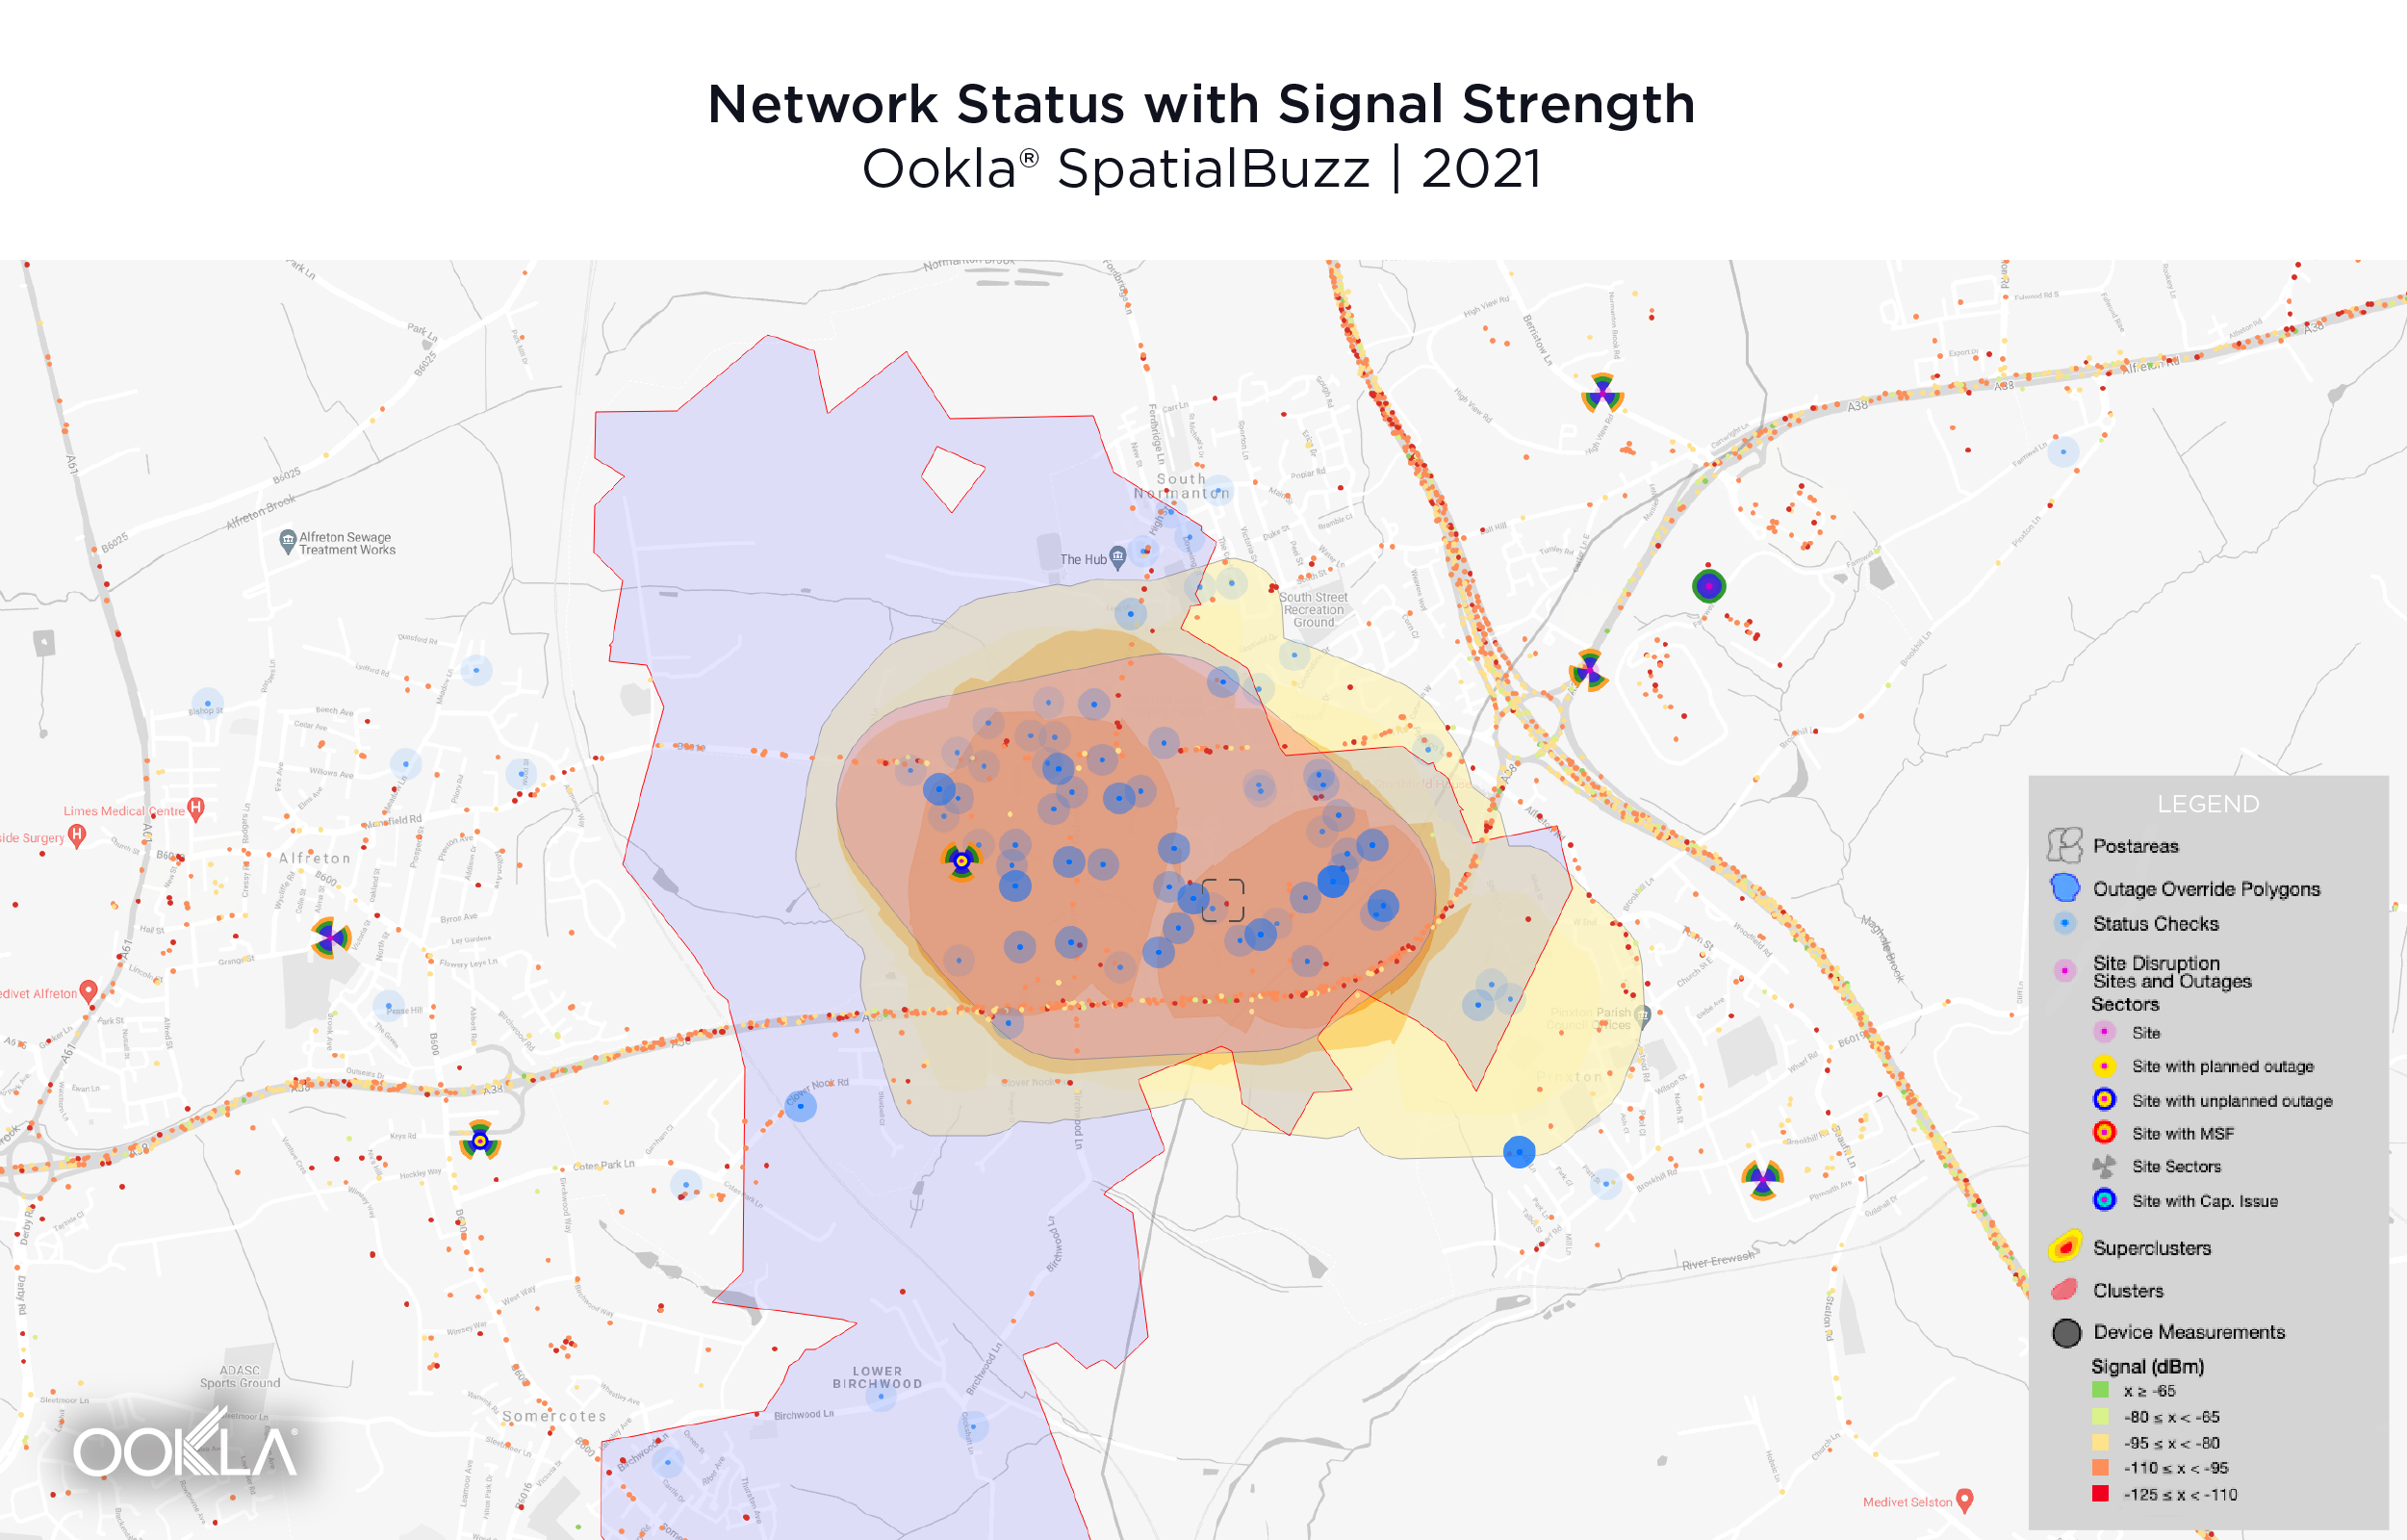
While benchmarking your overall network and customer experience is essential, knowing when and where exactly to invest more resources into your network is mission critical as you expand and improve your network. Cell Analytics provides unrivaled intelligence about wireless service quality, RF measurements, data usage, user density (both indoors and outdoors), cell site locations and much more, packaged in an easy-to-use interface. Cell Analytics uses the granularity of Speedtest network testing and gives you the performance, coverage and signal measurements you need to improve your network.
Unlike data collected by traditional methods such as drive testing and walk testing, Cell Analytics data is collected in real-world measurements where consumers are actually connected to networks — on streets, inside vehicles, at home, at work and other locations — with high location accuracy and 3D modeling. Combined with data on cell site locations, tools to prioritize optimization and deployment efforts, and competitor comparisons, Cell Analytics provides a comprehensive platform for mobile network operators to understand their networks and identify the areas that need improvement.
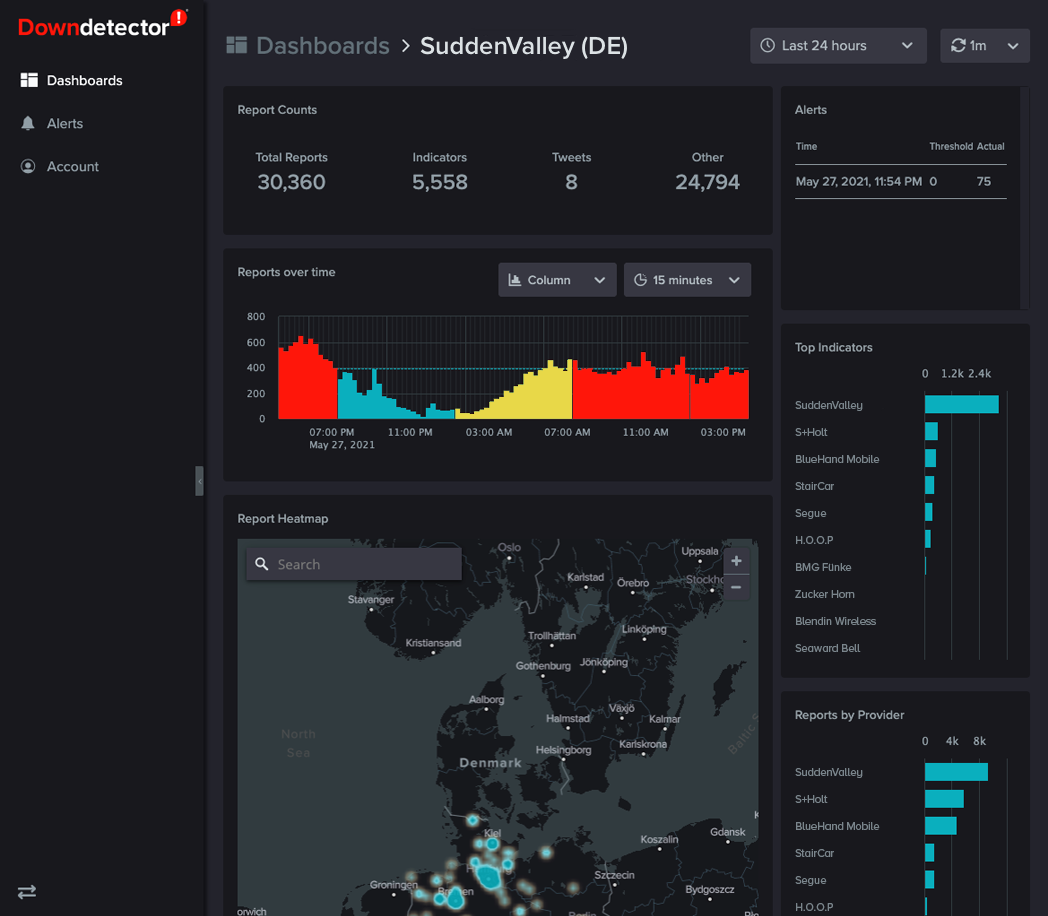
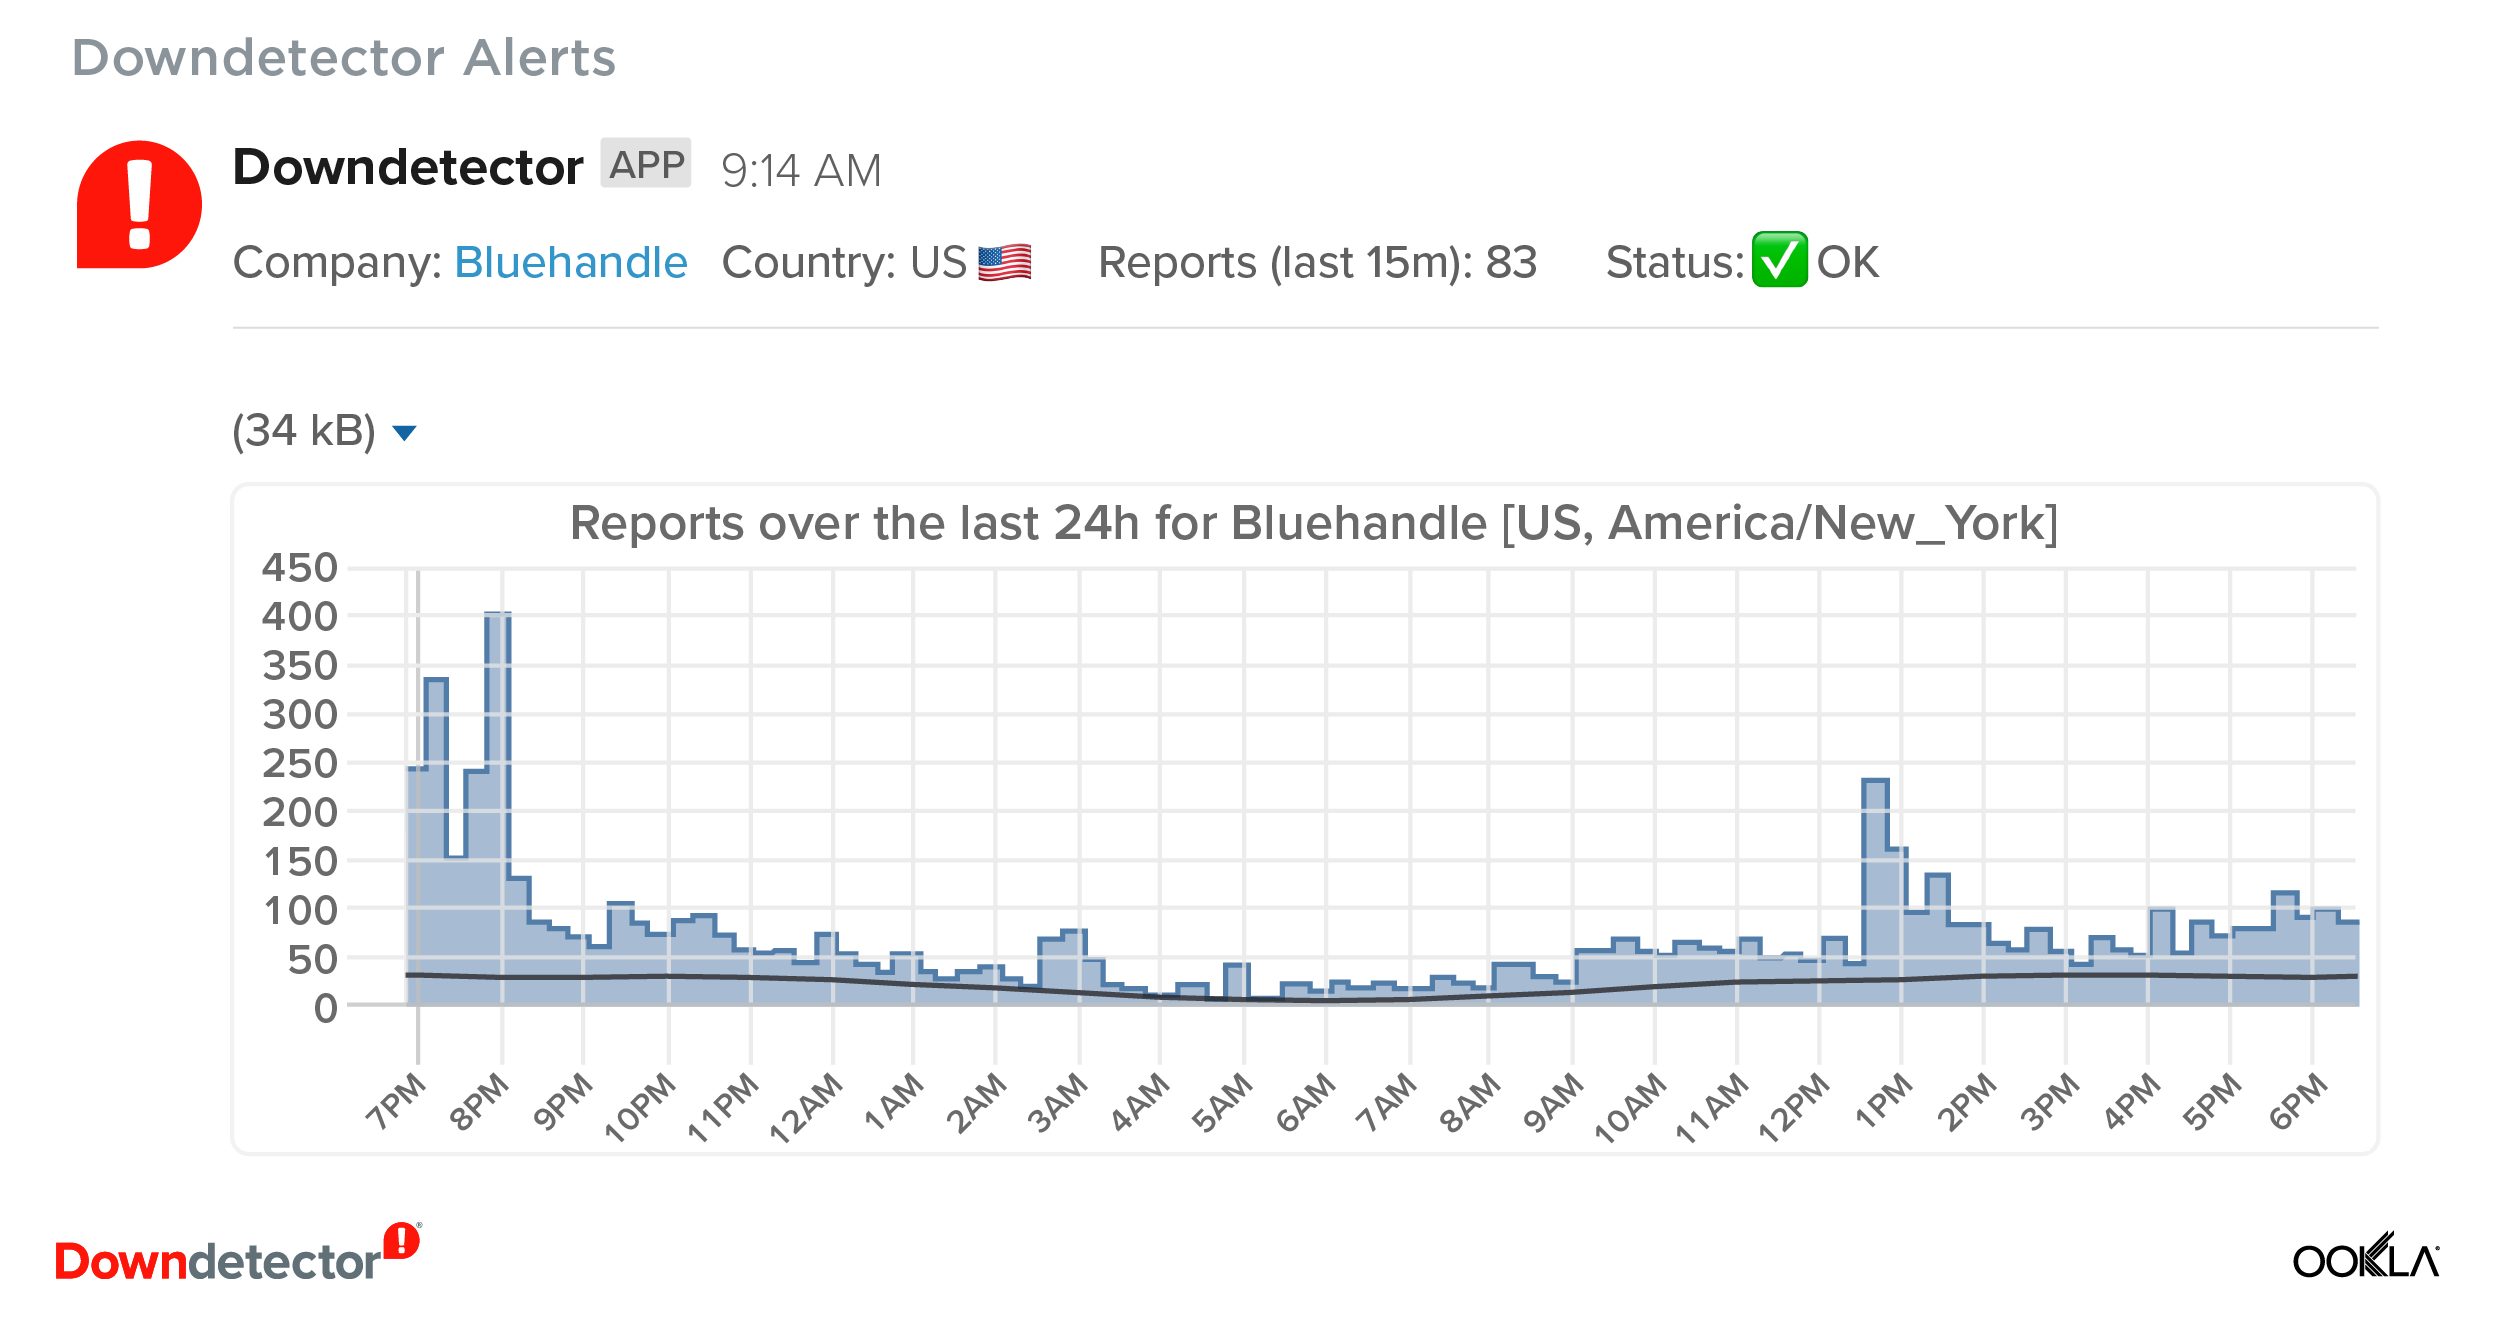
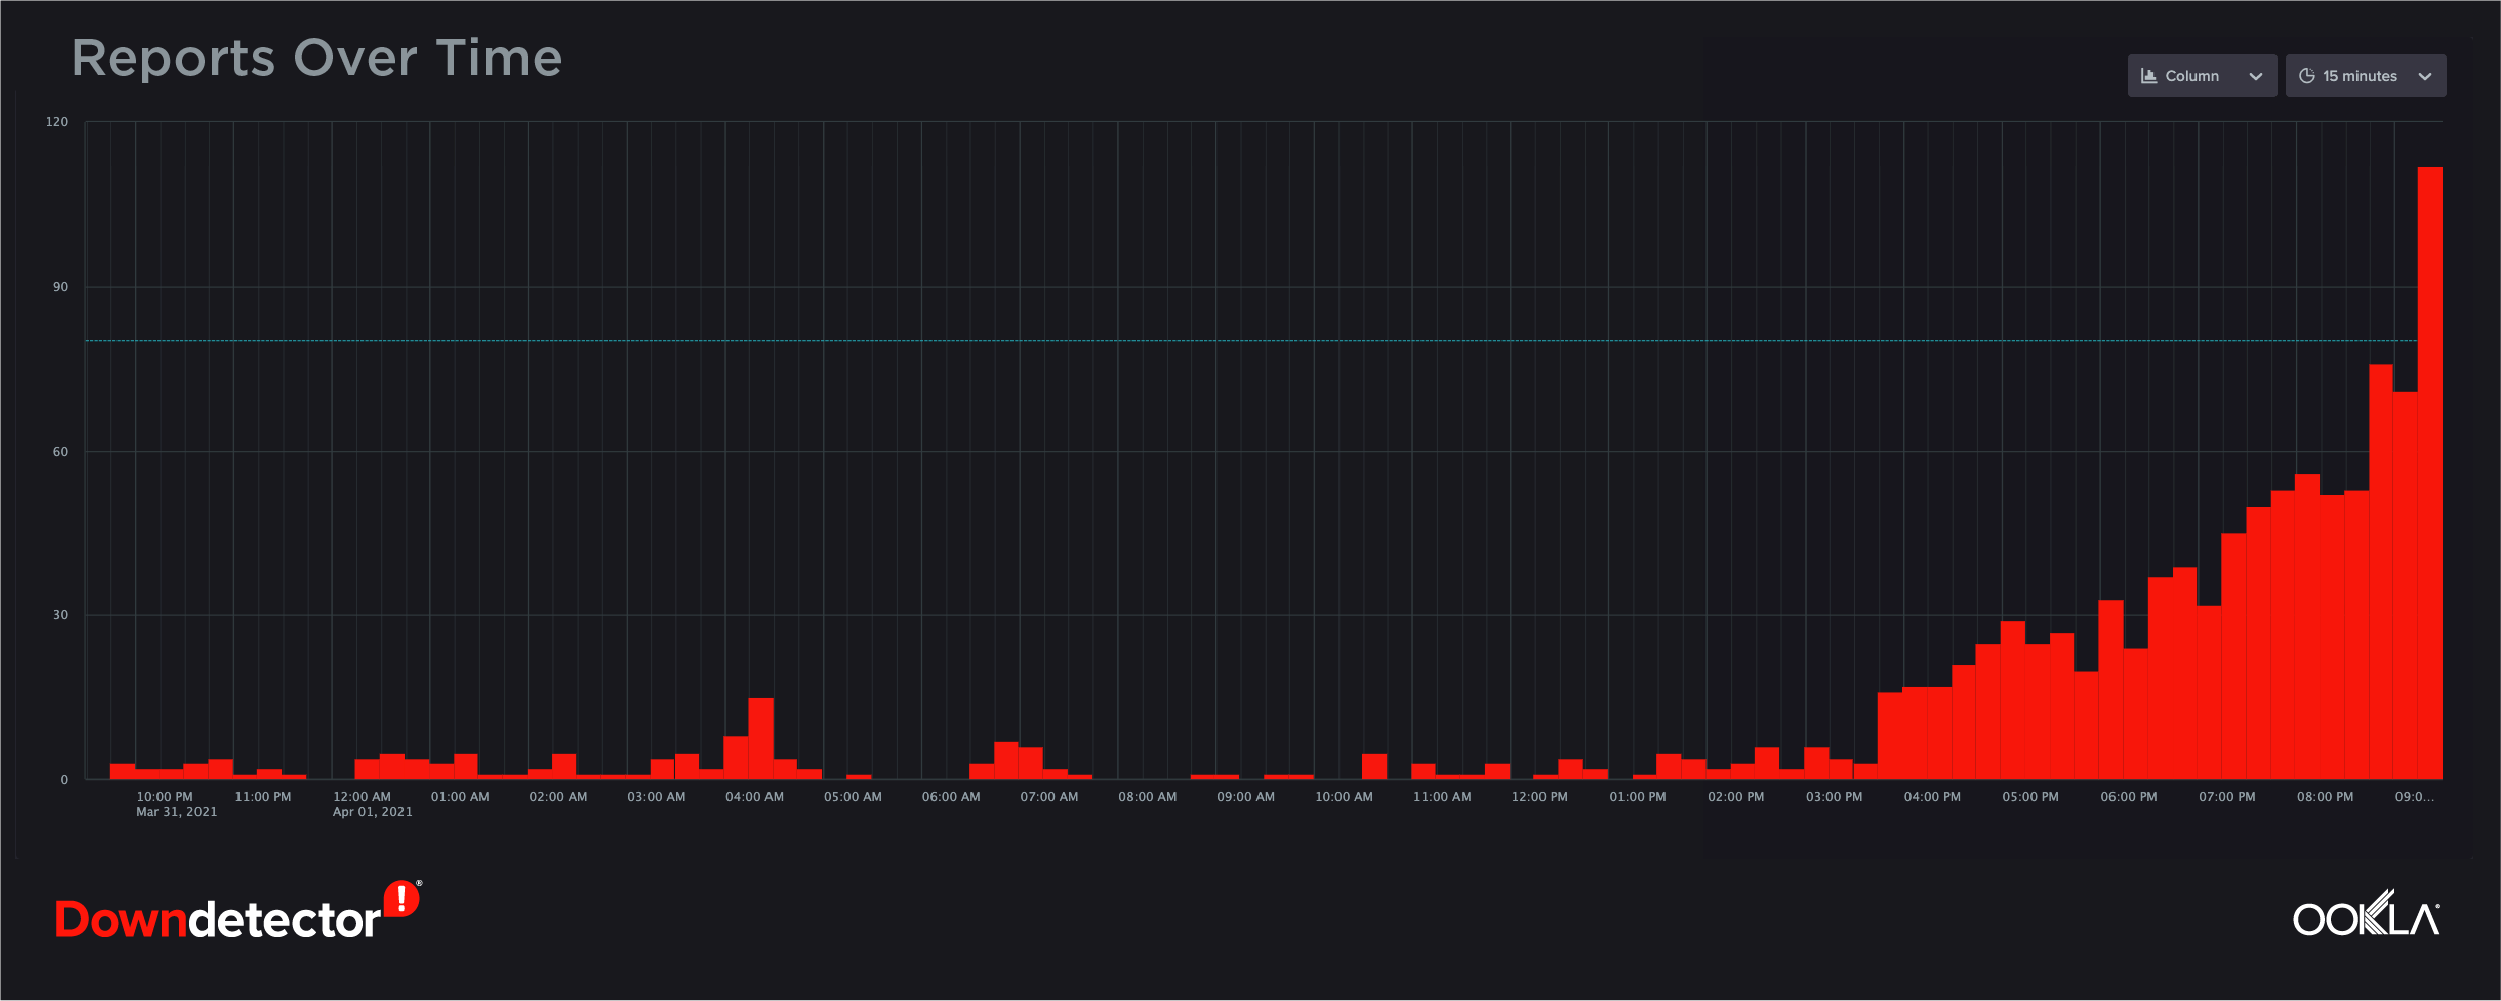
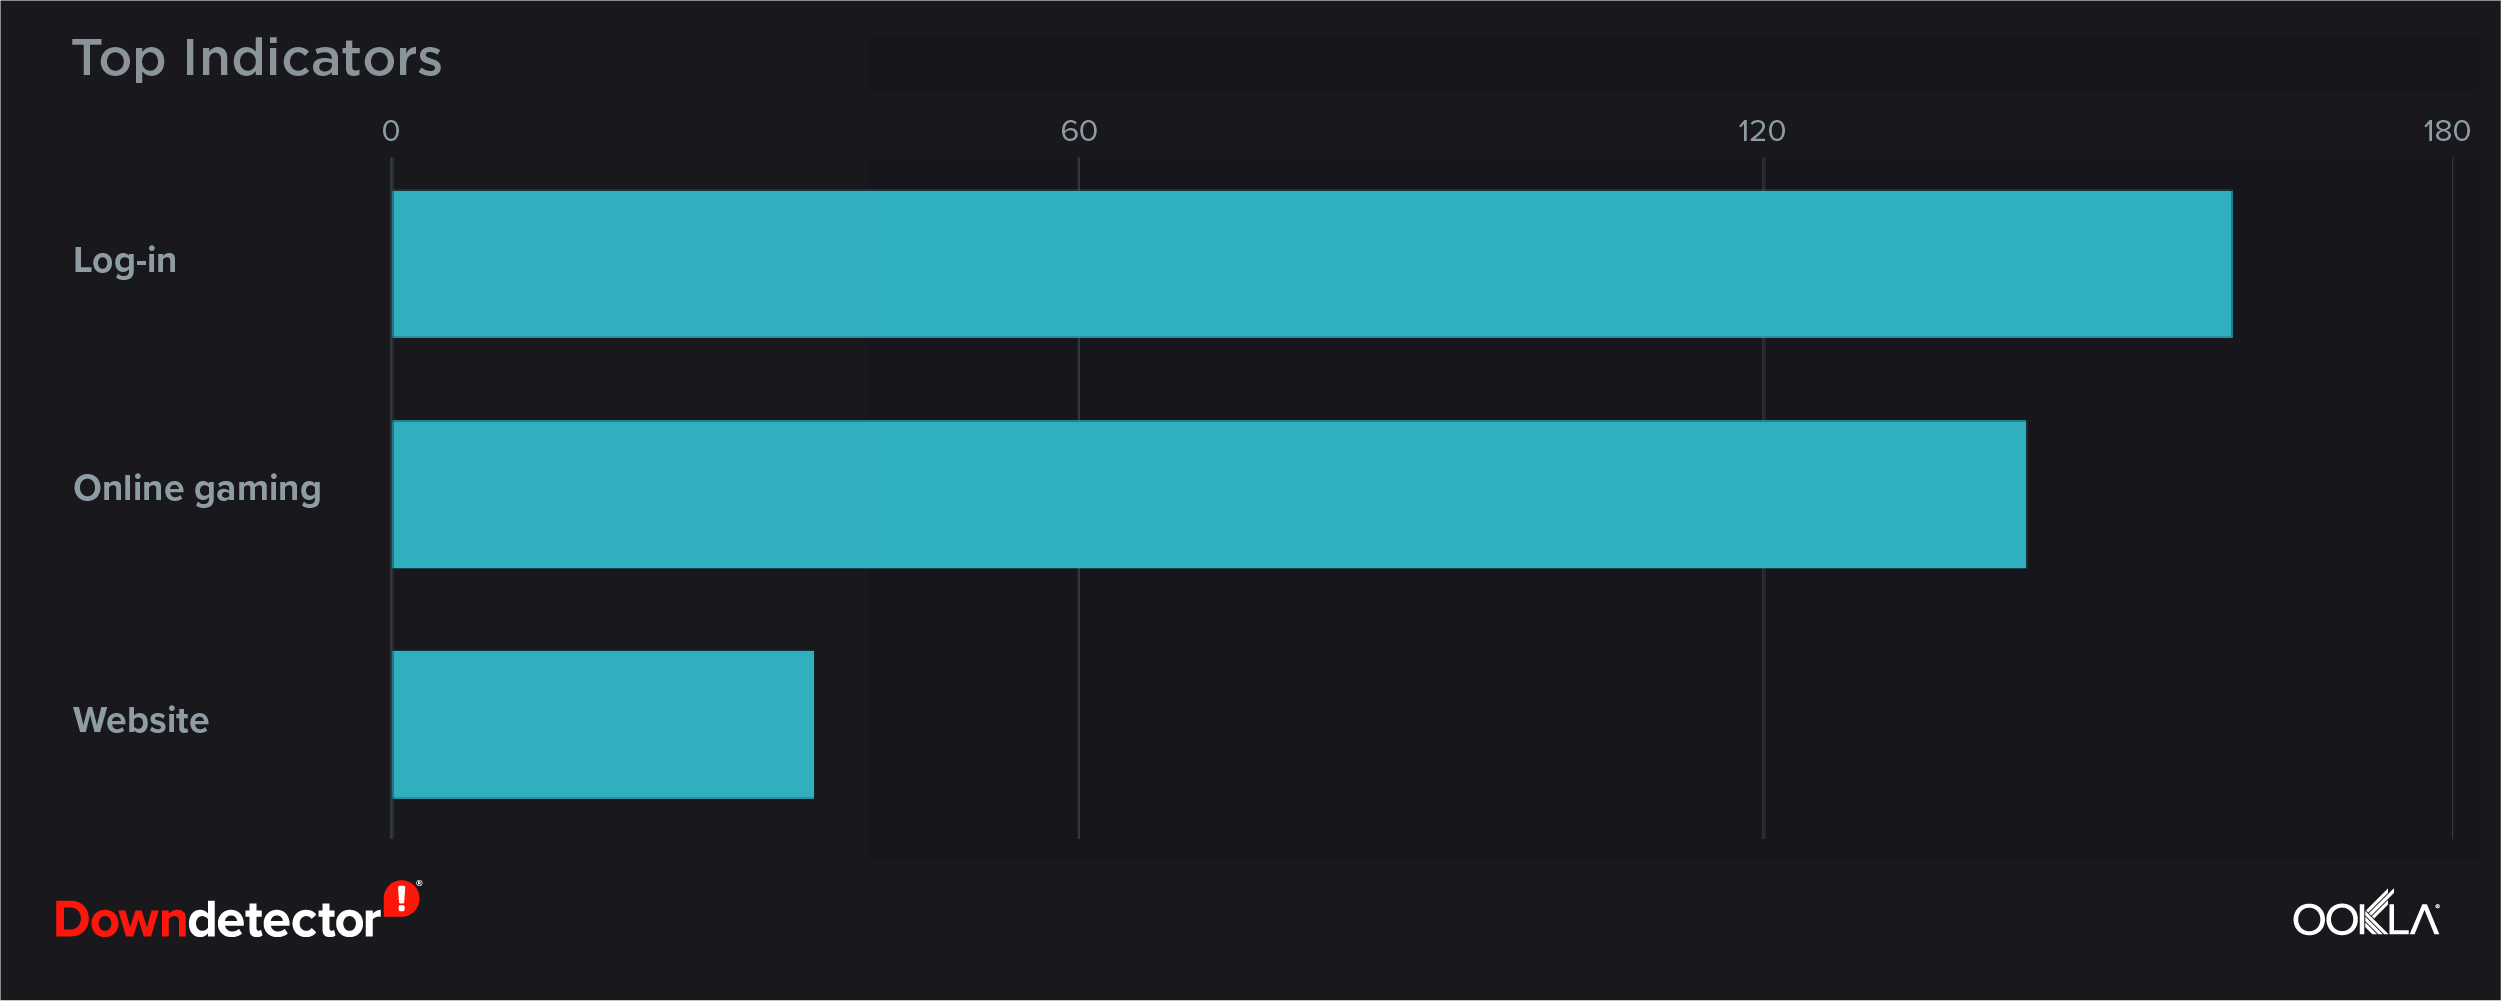
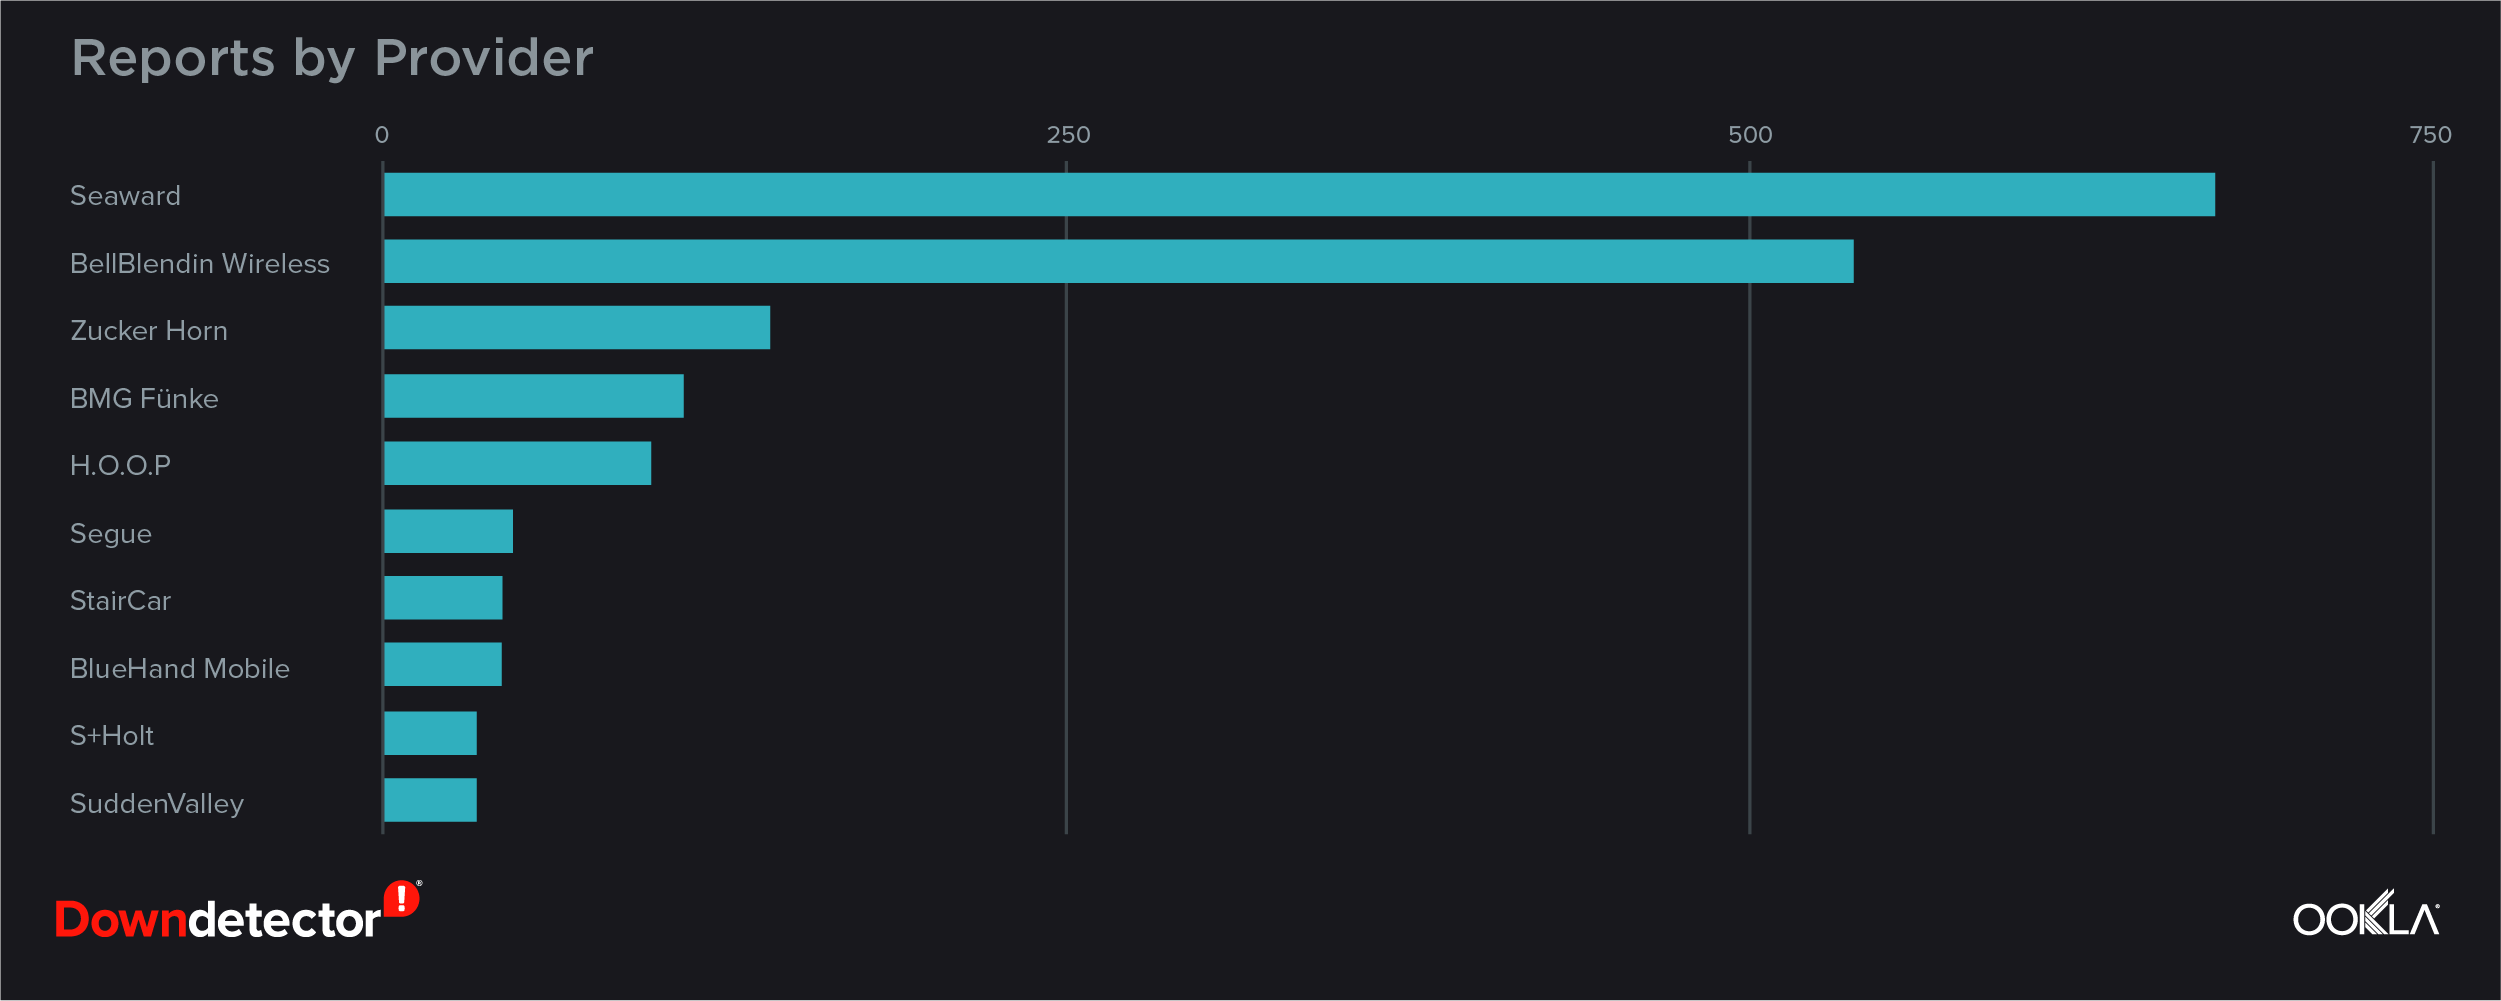
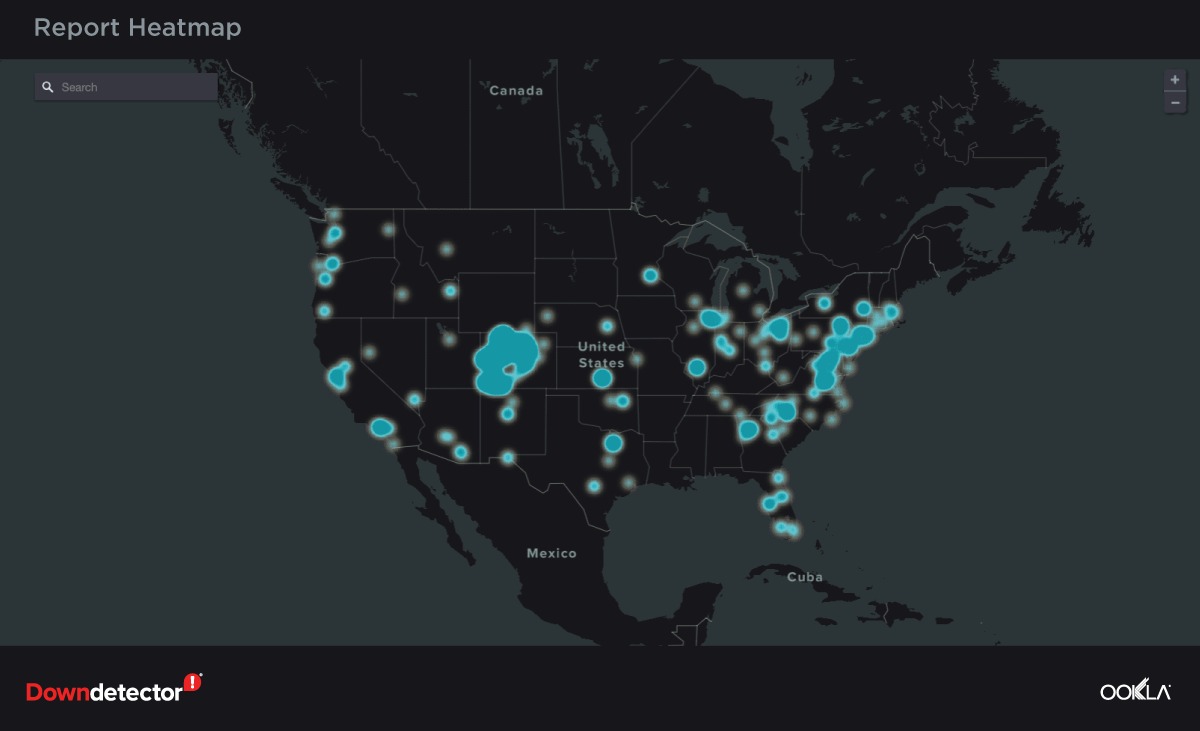
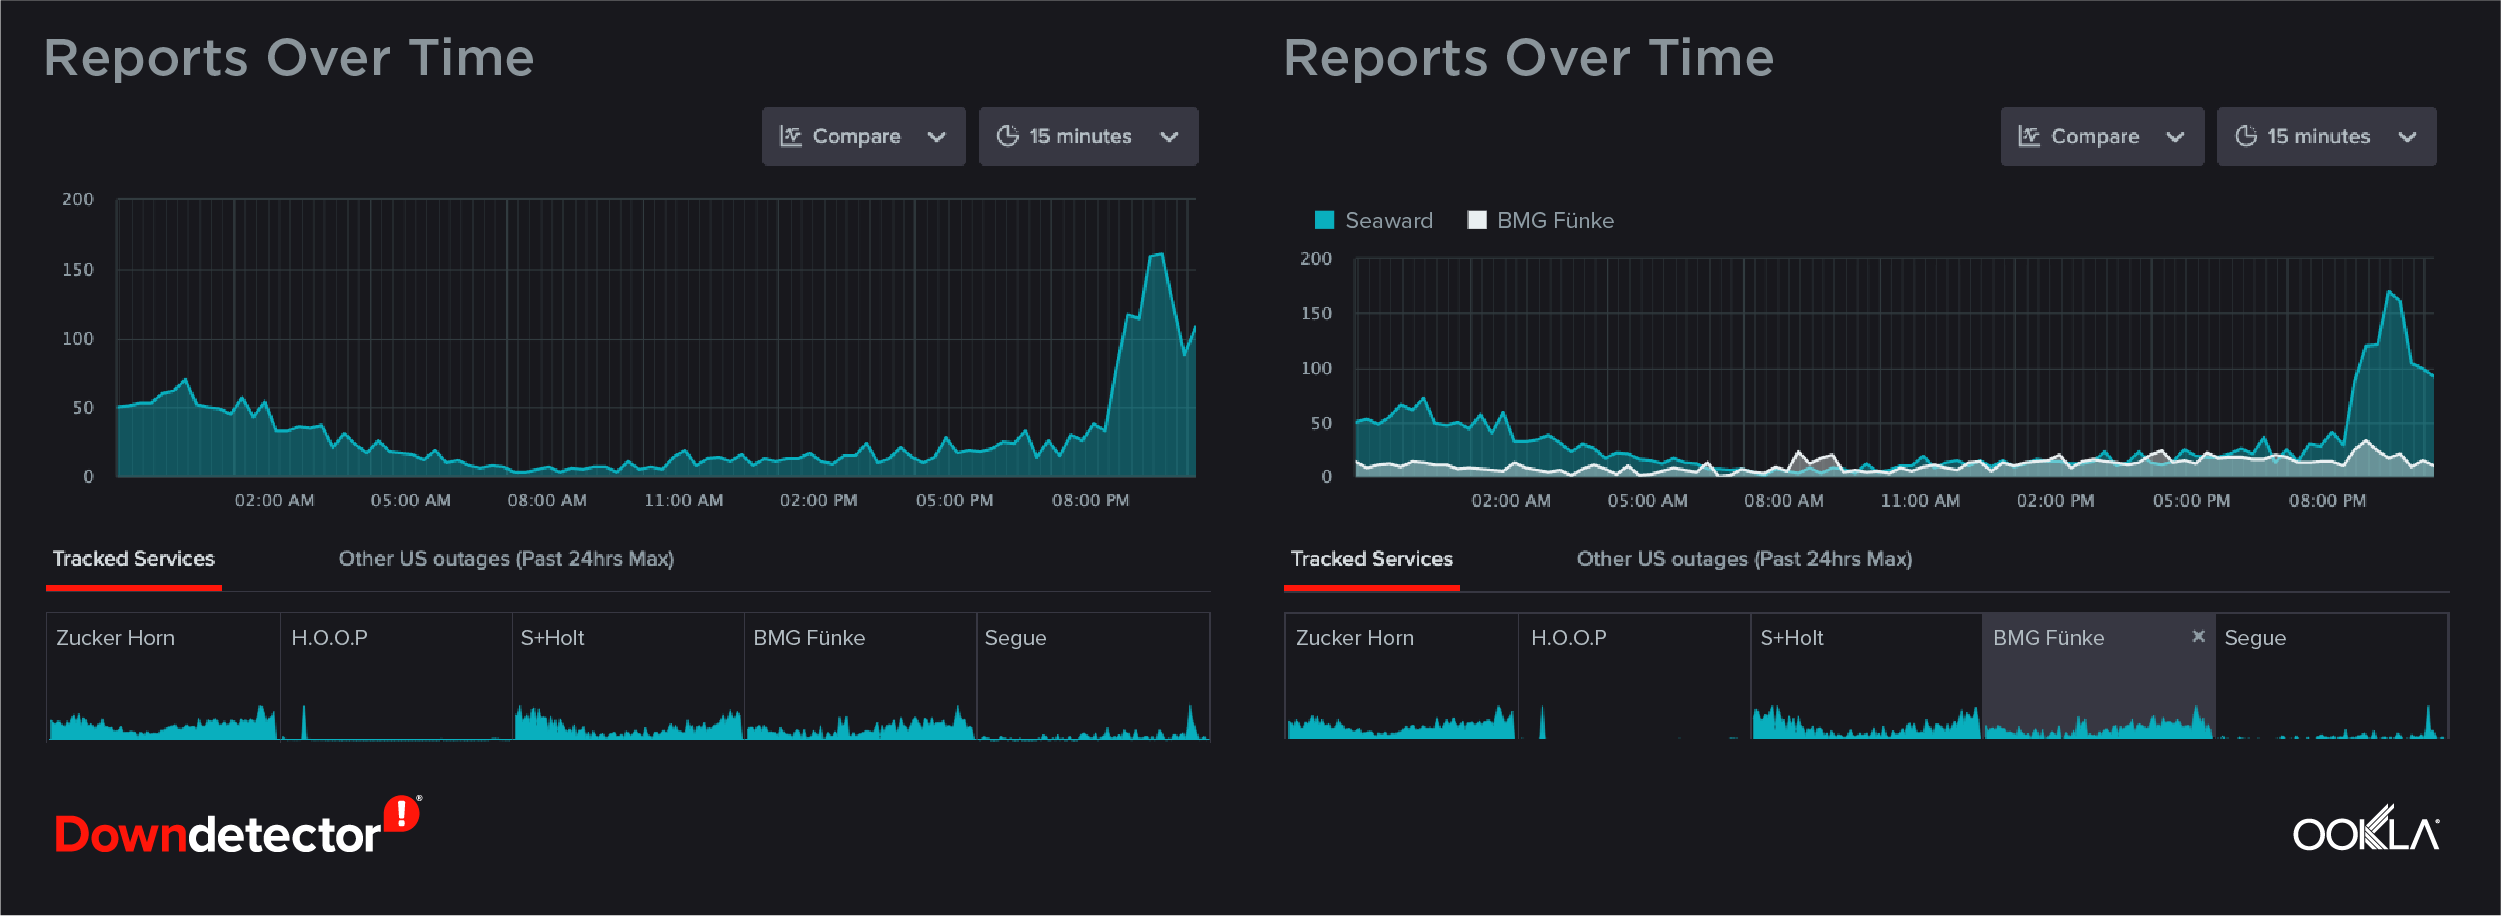
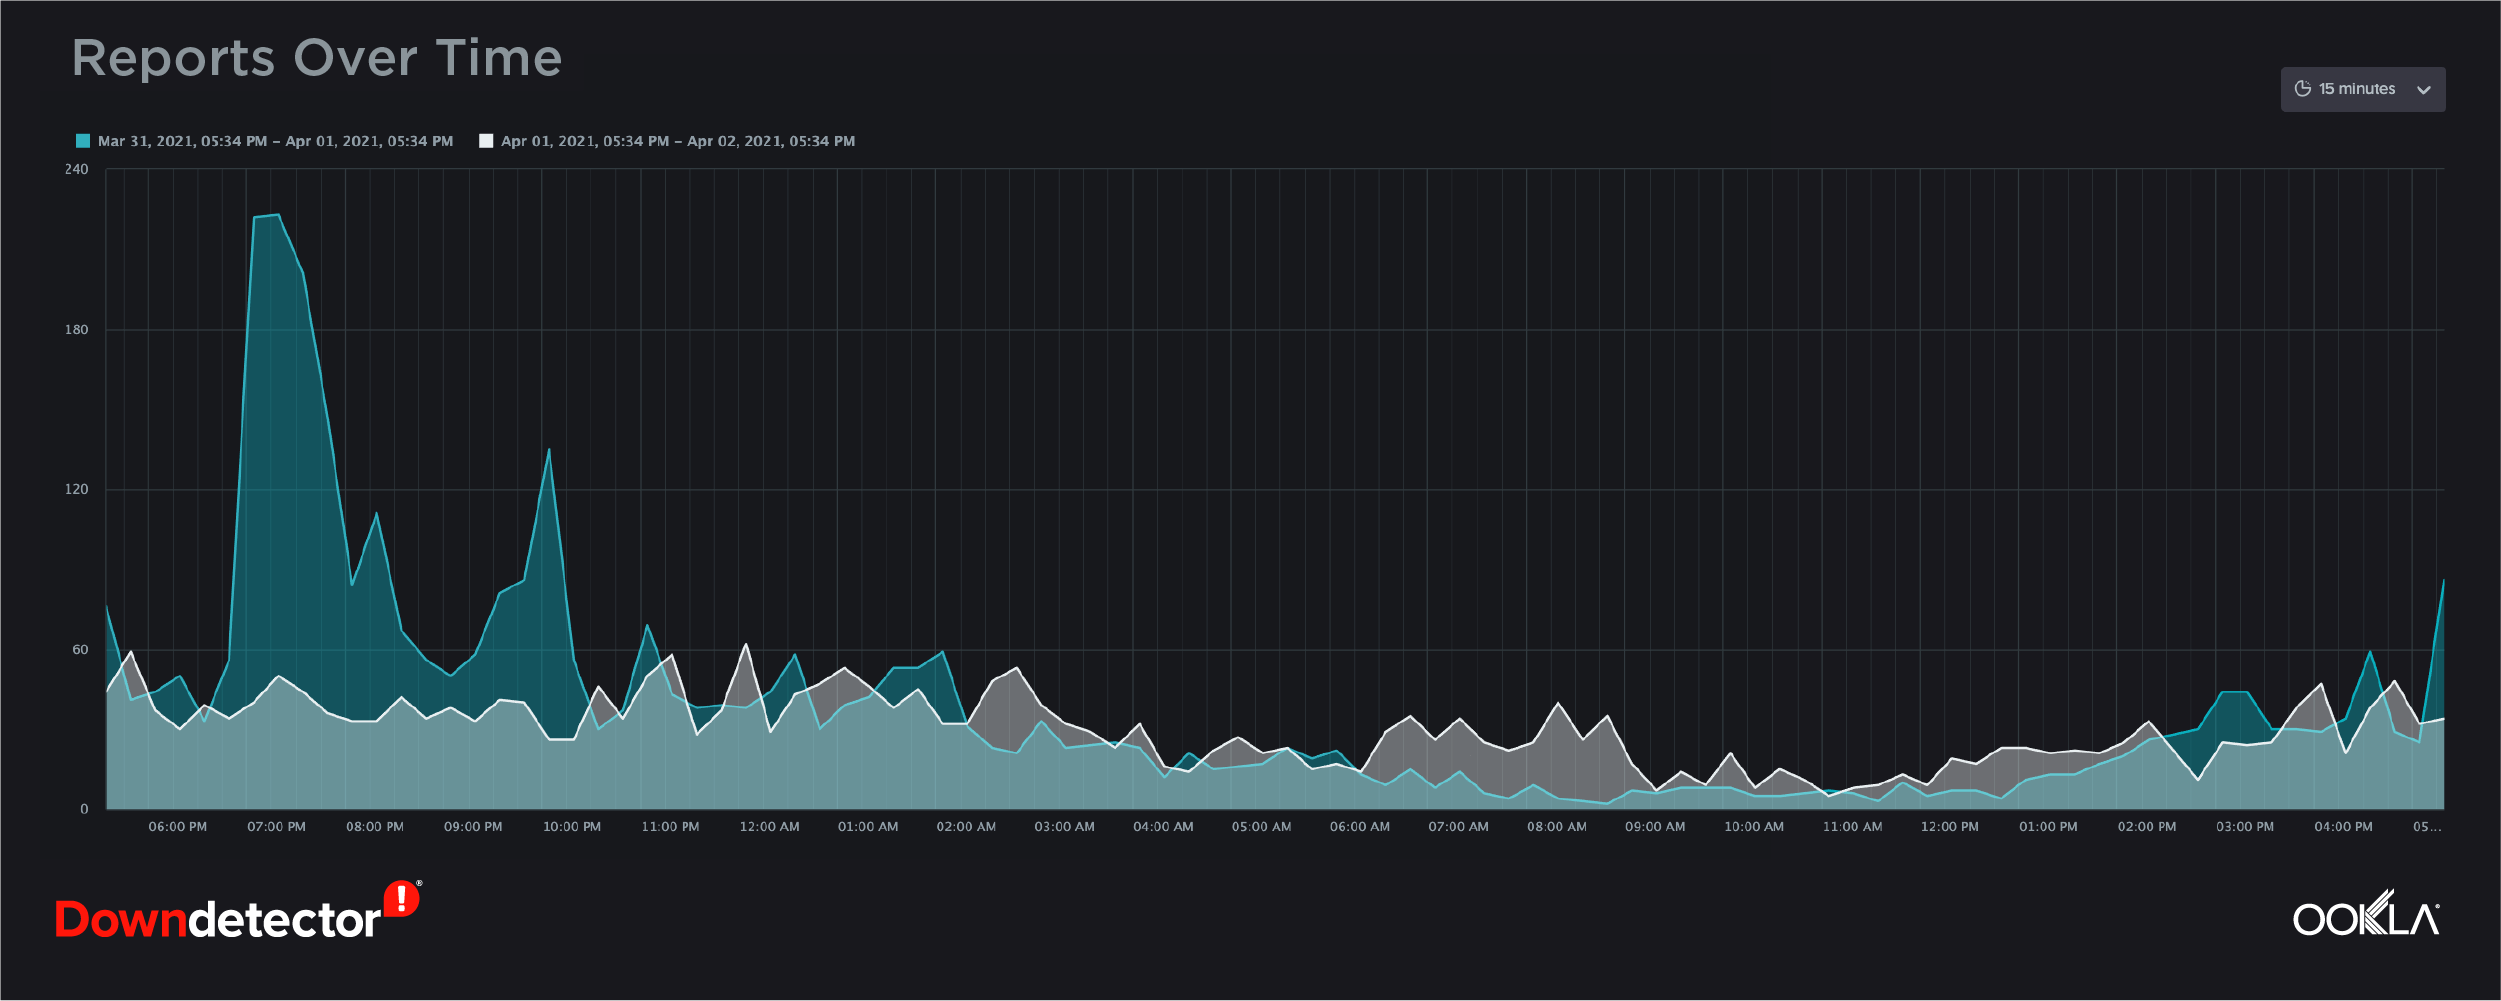
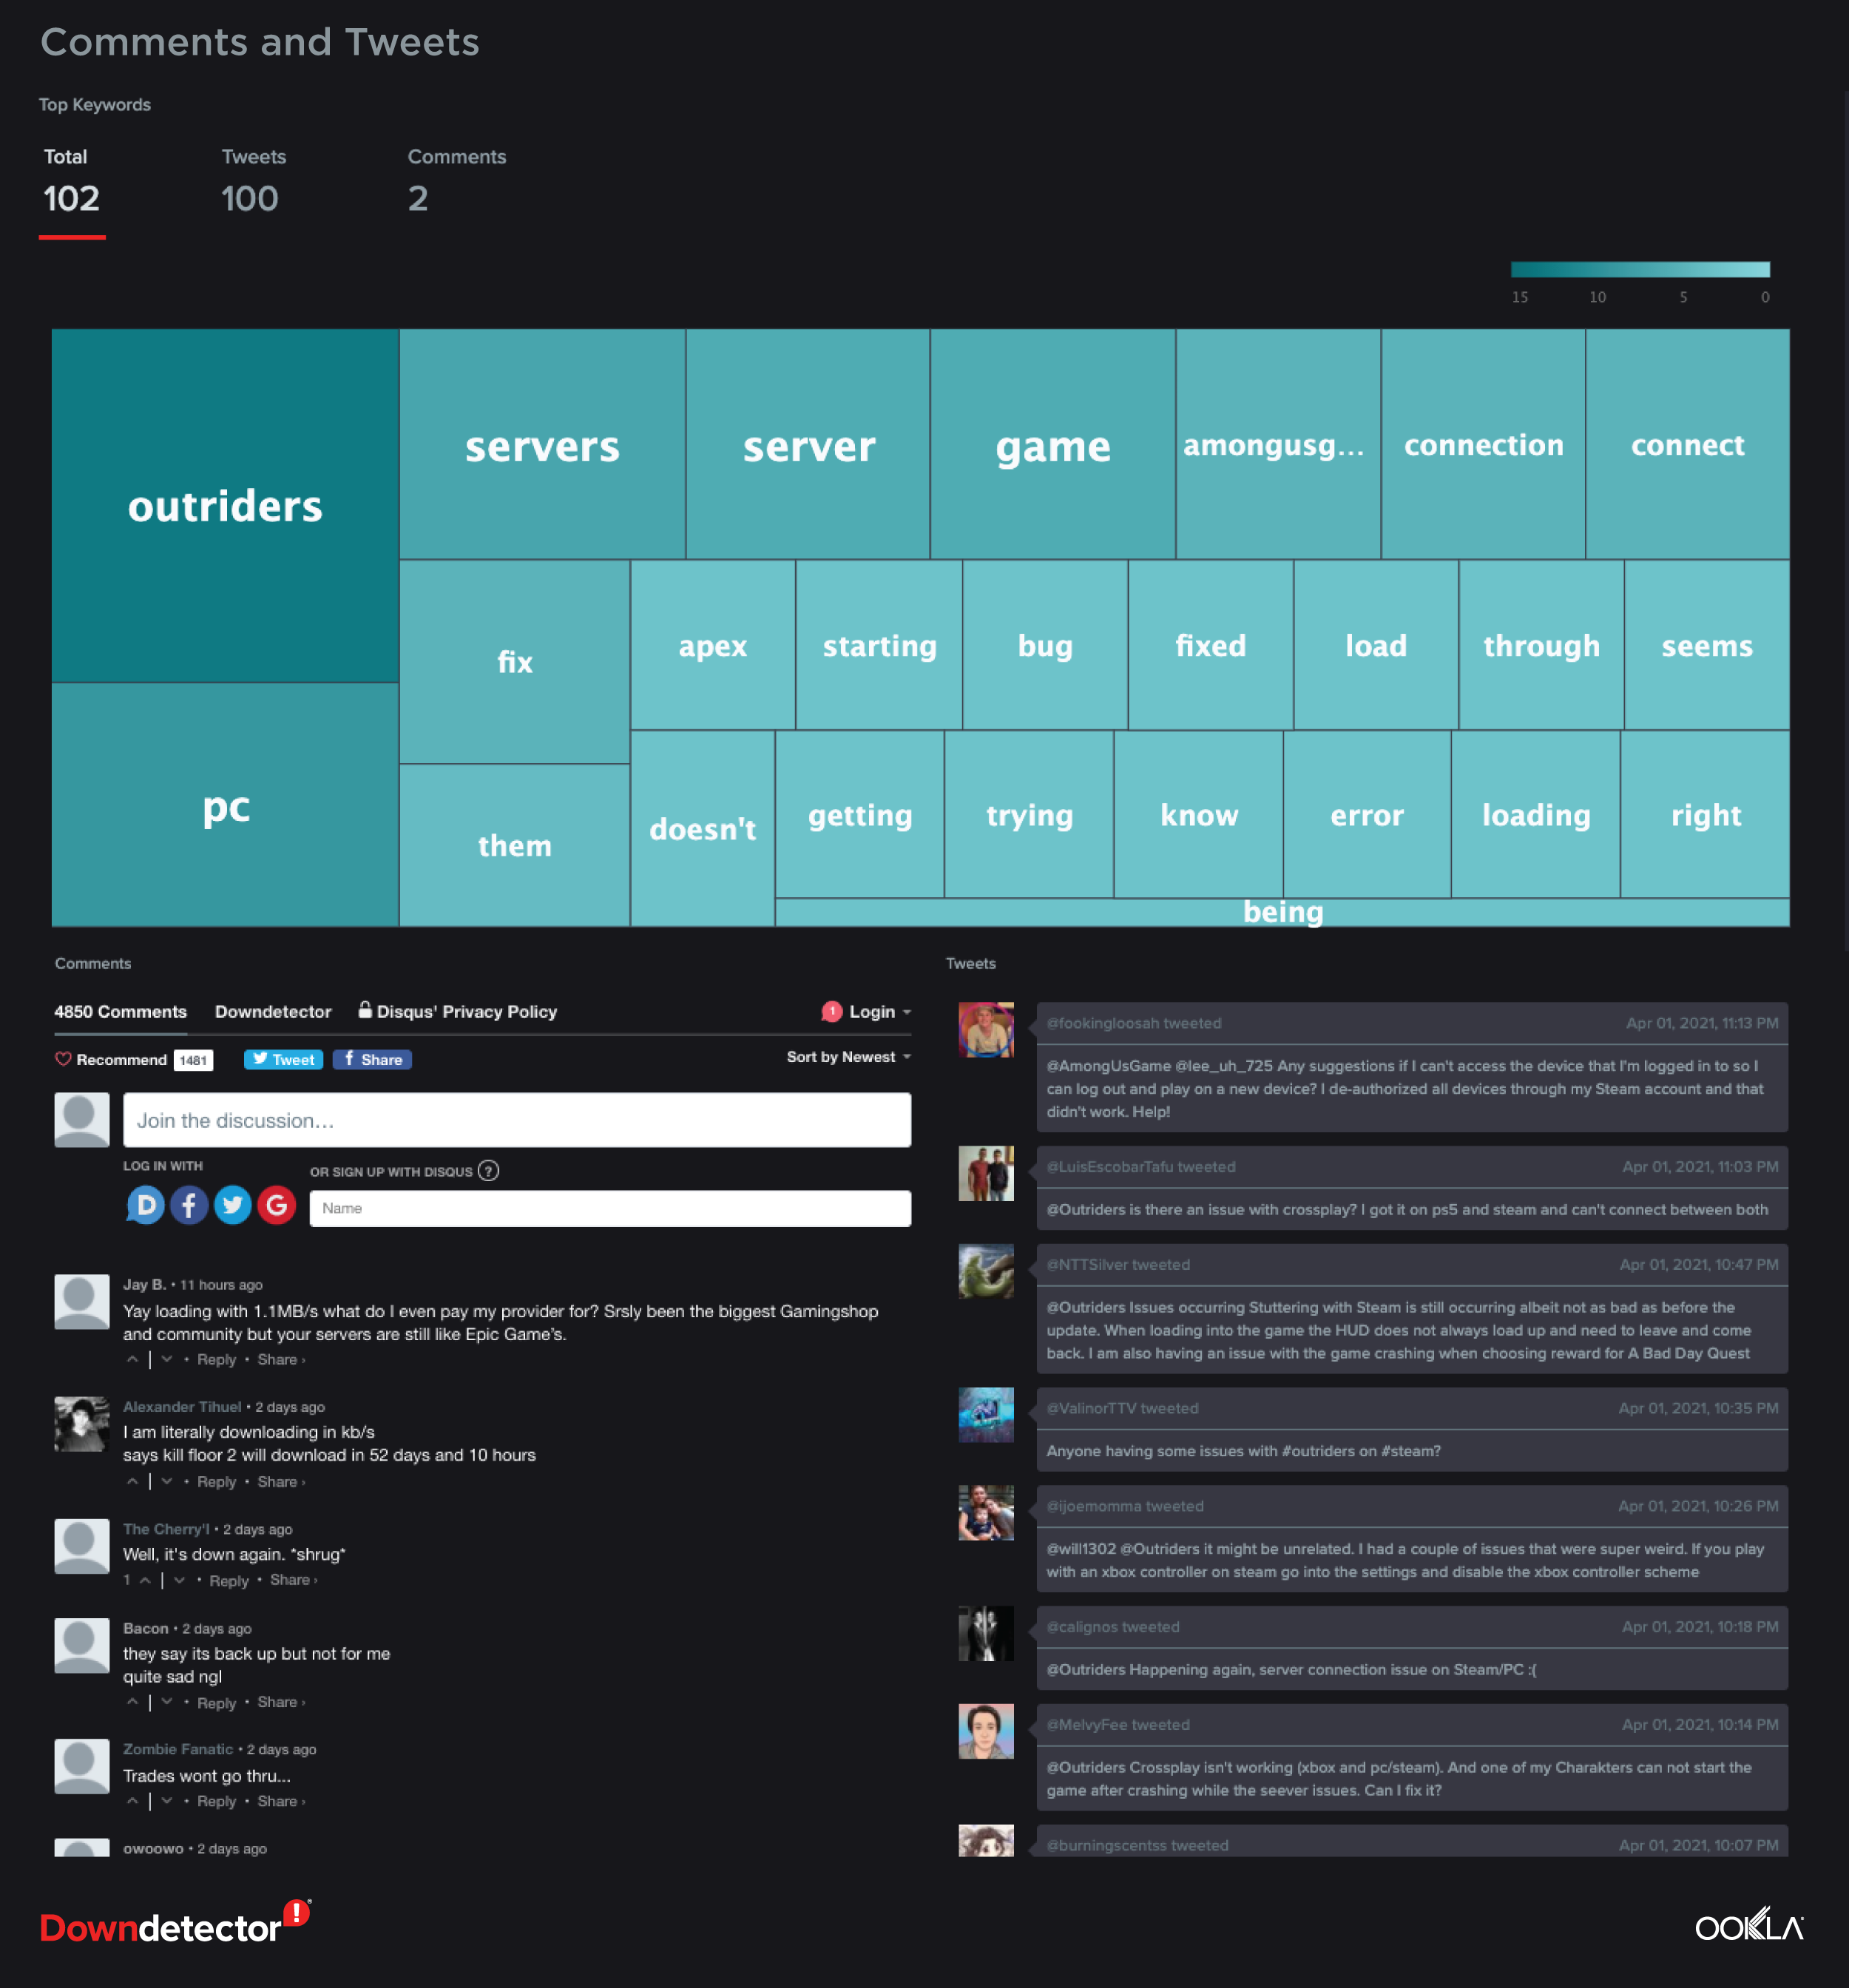
Network outages can be costly and time consuming to fix. Hundreds of millions of users worldwide use Downdetector to report issues with their mobile network operators, ISPs, communication apps and other online services. Downdetector Enterprise uses this consumer-reported information to provide early alerting on service issues — often before internal monitoring tools detect a problem is even happening. With customizable alerts for your NOC and SOC teams, Downdetector makes sure you get information about critical incidents as soon as customers start to report an issue. Geolocation information provides insights into exactly where customers are experiencing network problems, and problem indicators let you know which aspects of your service (e.g., voice calls, text messaging, mobile billing app) are causing issues.
Ookla has provided you with the tools to benchmark your network and customer satisfaction with Speedtest Intelligence, map and optimize your network with Cell Analytics and quickly identify network issues with Downdector. Now, we also offer a tool that marries the best of our offerings and directly connects you to your customers to deepen their network experience through more transparent, frictionless customer communication via existing web and mobile apps, AND provides the real-world data you need to prioritize network improvements by utilizing real-time customer experience data.
SpatialBuzz gives you the tools to engage directly with your customers, prioritize issues with your network using consumer-initiated data and increase your customer satisfaction by closing the loop on issues they encounter. SpatialBuzz is a one-stop solution that helps you deliver the best customer experience possible, even during outages or service issues.
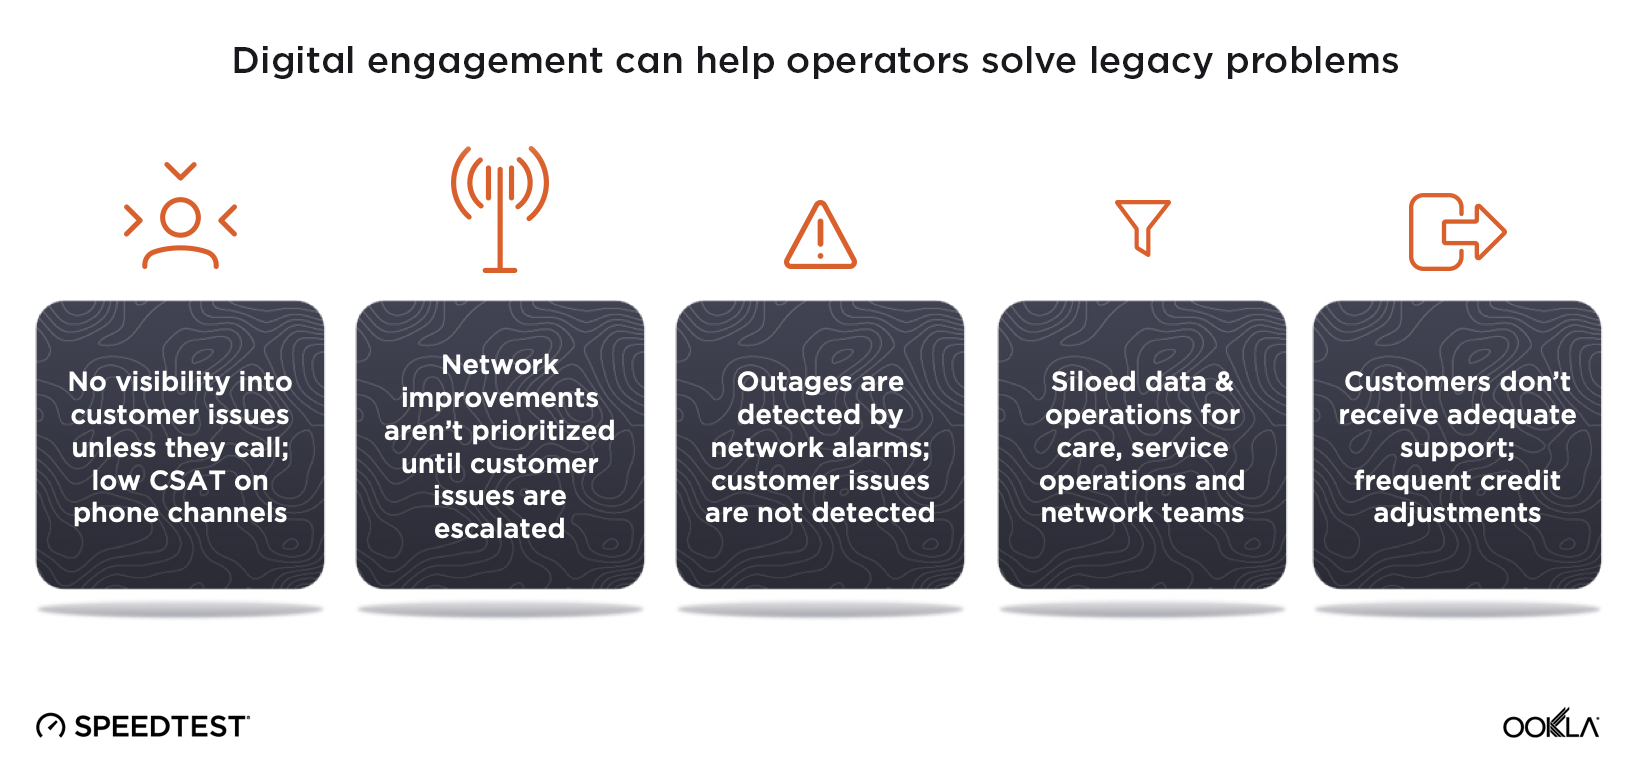
Think of your network like this: You wouldn’t invest millions opening a world-class restaurant with the best chefs making the best foods and not staff it with waiters to make sure diners have an incredible experience or correct issues with the food, right? Unfortunately, many network providers have overlooked meaningful customer engagement on their digital transformation journeys. SpatialBuzz gives customers a better channel to communicate back to your network team, which allows you to provide world-class service. Customers want to check their network, find out about improvements, report problems with minimum fuss and see you working for them. To love you, they have to love the network. That’s where SpatialBuzz comes in.
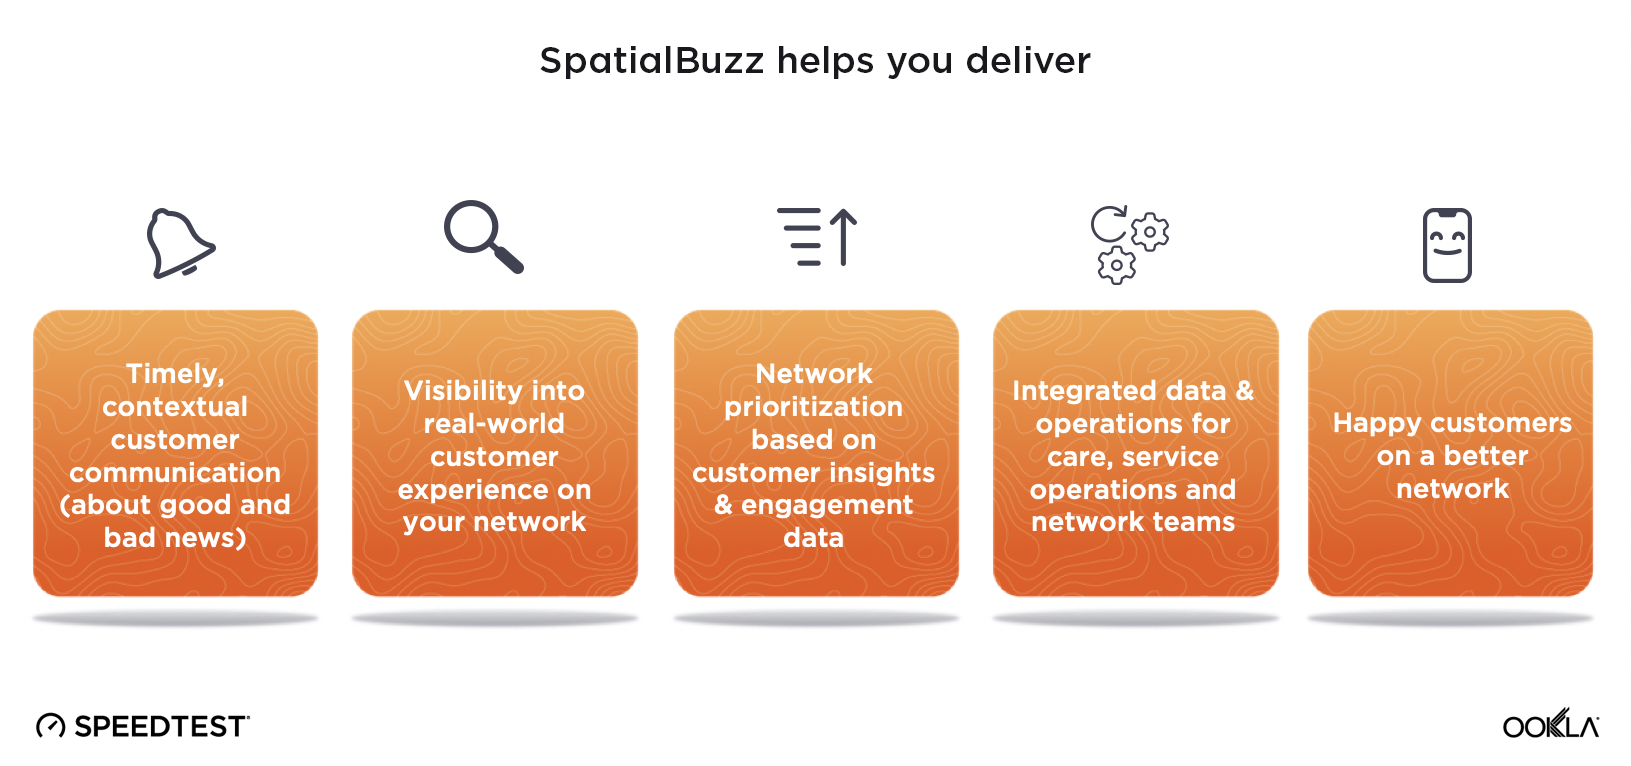
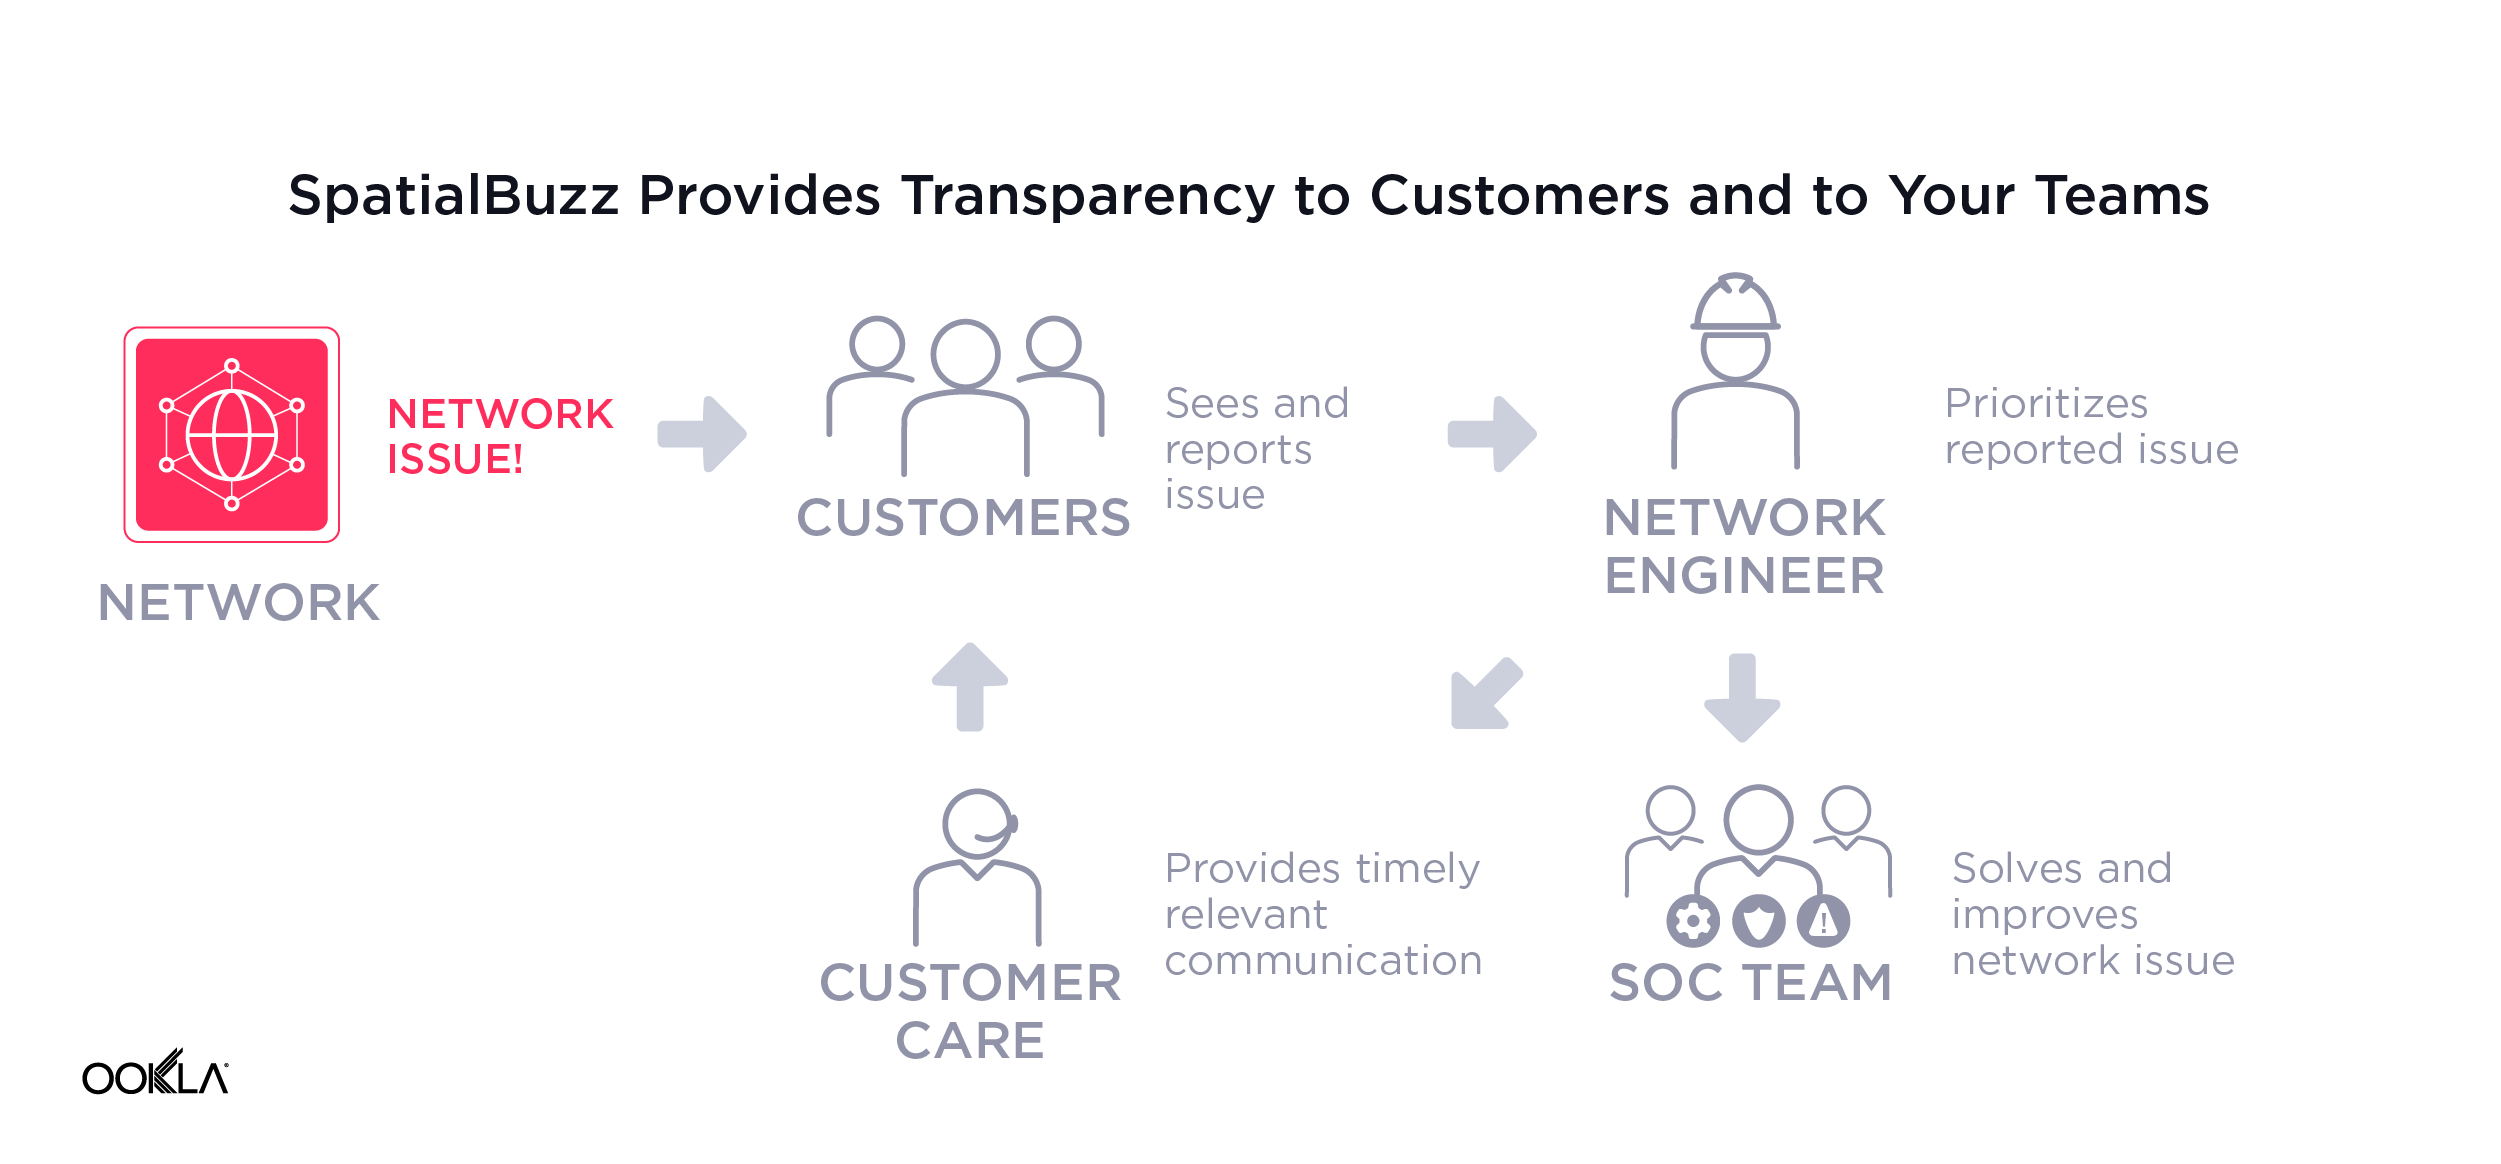
SpatialBuzz aligns Digital, Customer Care, Service Operations and Network Teams to deliver an excellent customer experience. SpatialBuzz also empowers customers to report issues and check network coverage and status — seamlessly integrated into existing iOS, Android or web apps. It connects agents with coverage maps and data about network statuses, and SpatialBuzz can even automate network messages about known problems in geospatial locations. SpatiaBuzz also helps network and operations teams prioritize issues by customer impact; data shows that 2-3% of network faults create 80% of significant customer dissatisfaction. SpatialBuzz lets you proactively respond to these customers, seamlessly engages them and their issues and prioritizes your network response which saves time and money you might otherwise be spending elsewhere.
Companies that have deployed SpatialBuzz have experienced, on average:
- 40% reductions in customer calls
- 15% faster call resolution
- 80% lift in digital engagement
- 1-9 hours earlier problem detection
- Millions of dollars in cost savings
- Improved customer loyalty with timely, proactive and transparent communications
- Better problem prioritization
- Bridged organizational gaps between customer care and network engineering teams
SpatialBuzz is the next frontier in creating a better network experience for your customers. When customers feel like they are being heard, seeing problems being fixed and are part of the closing the loop on issues, they will be more satisfied with your network offerings and they will help drive your company’s sustained revenue. SpatialBuzz is here to help you bolster your bottom line, so please don’t hesitate to reach out today and learn more.
Leading network operators are the ones that successfully engage their customers about their network
Ookla can provide you with all the tools you need to improve your network, pinpoint issues and increase customer satisfaction. We’re thrilled to offer you a suite of tools that holistically improves your network — and we’re thrilled to help you close the network–customer experience gap with SpatialBuzz.
If you’re interested in learning more about SpatialBuzz or any of Ookla’s enterprise offerings, reach out to us and inquire more about what we can do to help you improve your network.
Ookla retains ownership of this article including all of the intellectual property rights, data, content graphs and analysis. This article may not be quoted, reproduced, distributed or published for any commercial purpose without prior consent. Members of the press and others using the findings in this article for non-commercial purposes are welcome to publicly share and link to report information with attribution to Ookla.
About the author
Ookla® is a global leader in connectivity intelligence that provides consumers, businesses, and other organizations with data-driven insights to improve networks and connected experiences.