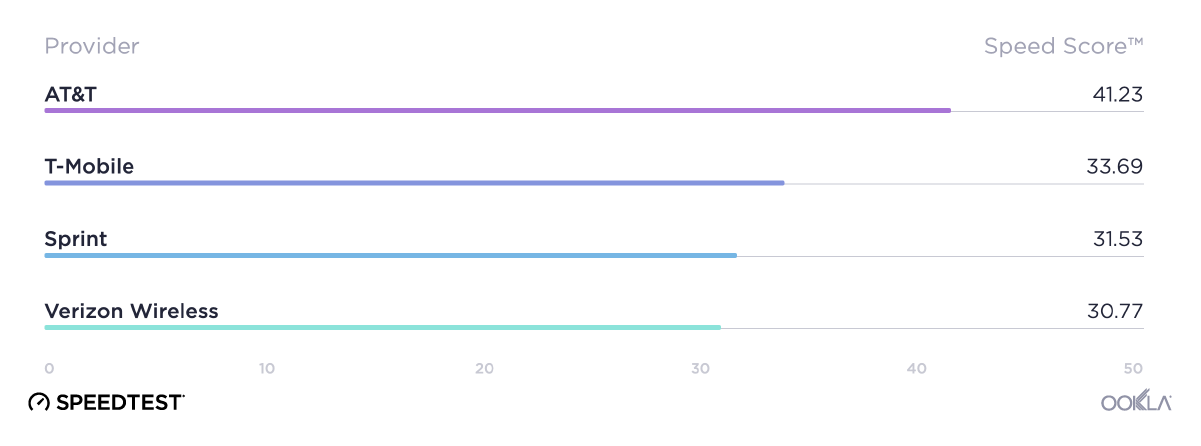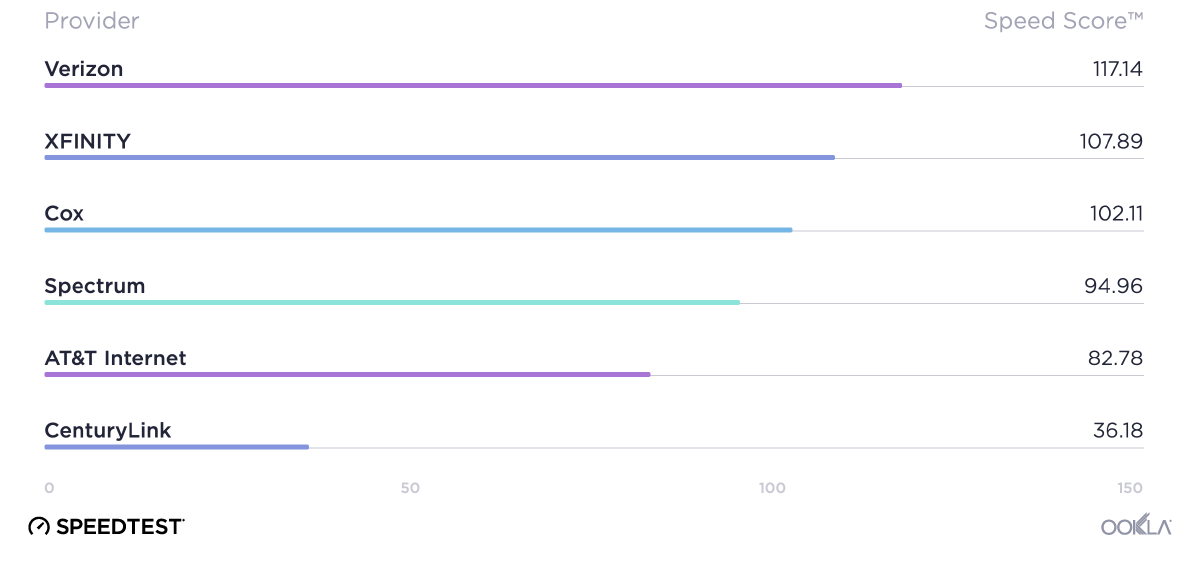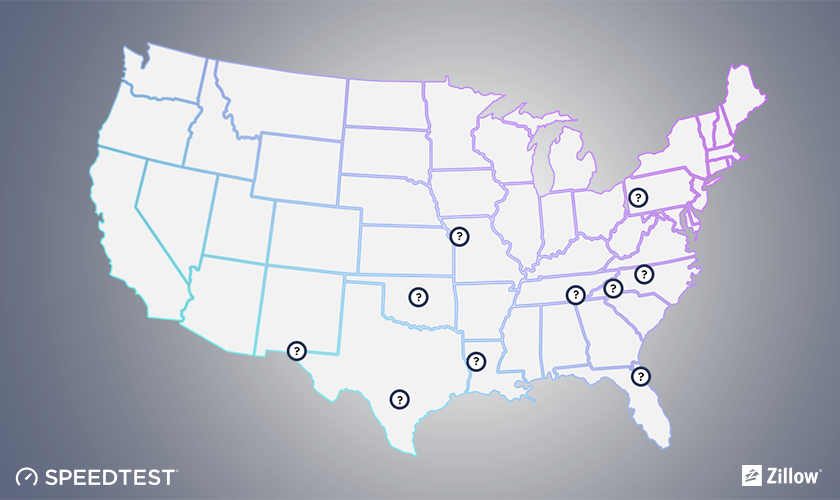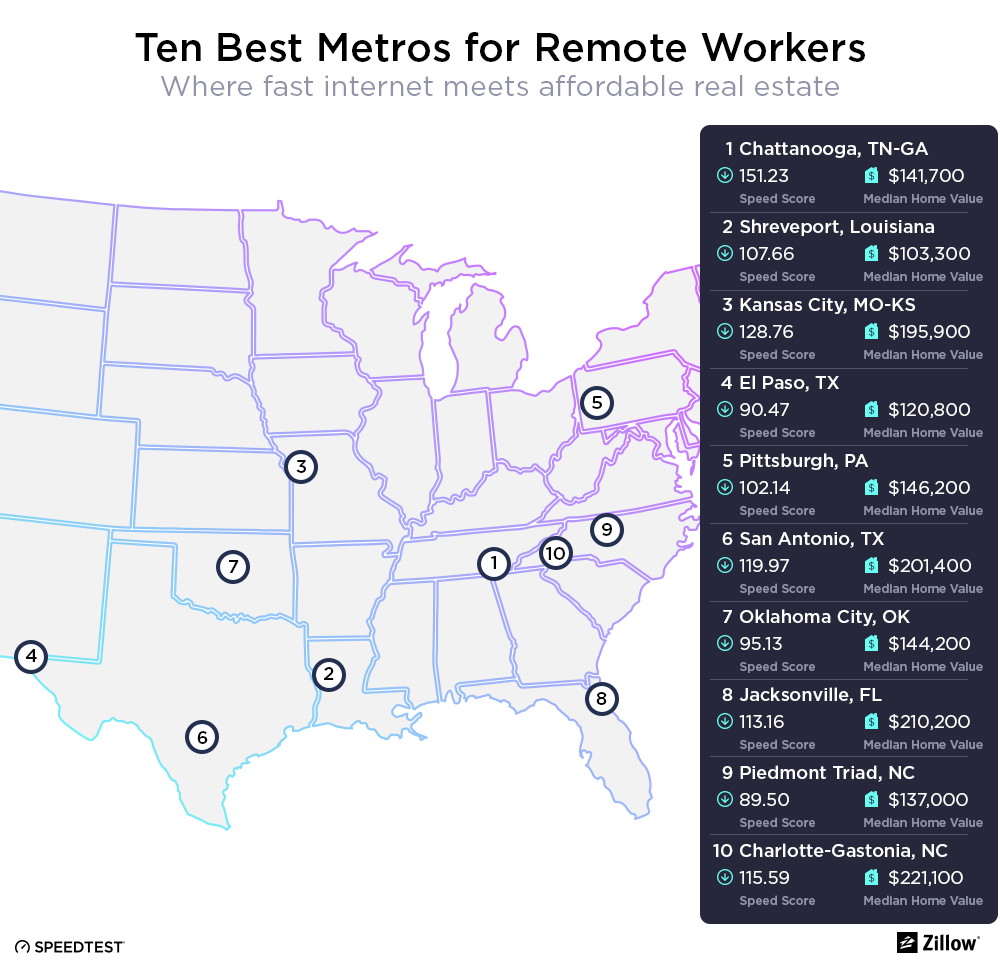

| August 21, 2018

Which College Campus Scores the Fastest Wi-Fi?

It’s back to school in the U.S., which can only mean it’s time for the college football season. We care about those long-standing rivalries as much as you do, and we couldn’t wait until game day to pit our favorite teams against each other. So we found a new angle for all that “my team is better than yours” energy: who has the fastest campus Wi-Fi speeds?

To get a pregame answer to “who’s the best?” we looked at download speed for all Wi-Fi Speedtest results. We limited data to those from the internet service provider (ISP) for each campus for the first half of 2018. For context, the average Wi-Fi download speed in the U.S. was 81.91 Mbps during Q1-Q2 2018.

Old Wagon Wheel (October 5, 2018)

Utah vs BYU

Utah is home to the first big grudge match of the year and it’s here that we find Utah State’s Wi-Fi is more than twice as fast as BYU’s. Sorry, Cougars! It’s worth noting that Utah State has the fastest Wi-Fi of any campus discussed in this article. Utah State’s Wi-Fi is even 36.8% faster than the average Wi-Fi download speed for the state of Utah in Q1-Q2 2018.

Florida State–Miami (October 6, 2018)

Florida vs Miami

Our next matchup pits the Florida State Seminoles against the Miami Hurricanes in a rivalry that’s often one of the most-watched football games. If you’re watching that game over Wi-Fi, though, you’ll want to do it from the Tallahassee campus because their Wi-Fi is 24.5% faster than what you’ll find at the University of Miami. Even though that’s 24.2% slower than the state of Florida’s average Wi-Fi speed of 75.96 Mbps during the same period.

Red River Showdown (October 6, 2018)

Texas Vs Oklahoma

For over 100 years, the Oklahoma Sooners have been battling the Texas Longhorns. We can’t say who will win the THREE trophies awarded to the winner of this year’s game, but we can say that on the Wi-Fi front it’s Texas for the win (though both schools have speeds worth bragging about).

Third Saturday in October (October 20, 2018)

Tennessee Vs Alabama

When Alabama’s Crimson Tide meets the Tennesseee Volunteers on the field in Knoxville this year, they will be coming from behind (at least when it comes to Wi-Fi speeds). That’s because the average download speed on the University of Tennessee campus network is 42.7% faster than at Alabama.

World’s Largest Outdoor Cocktail Party (October 27, 2018)

Georgia Vs Florida

What will the crowd be discussing as they tailgate in advance of the Florida-Georgia game? Georgia Bulldog fans might be bragging about their Wi-Fi speeds, which are 23.8% faster than those at the University of Florida. Don’t bring it up among the Florida Gators, though. Unless you want ‘em to get fighting mad.

Saban Bowl (November 3, 2018)

LSU Vs Alabama

We already know from the Third Saturday in October that Wi-Fi speeds are a sore subject for Alabama fans. Hopefully they’ll have won the game against the Tennessee Volunteers because their Wi-Fi matchup with the LSU Tigers is even more brutal. The average download speed over Wi-Fi on the Louisiana State University network is 137.4% faster than on Alabama’s.

Bedlam Series (November 10, 2018)

Oklahoma Vs Oklahoma State

The Oklahoma Sooners couldn’t beat the Texas Longhorns when it came to Wi-Fi download speed, but they’ve got the Oklahoma State Cowboys nicely handled with a 14.5% lead in this intrastate rivalry. Still, considering that the average Wi-Fi download speed for the state of Oklahoma was 67.58 Mbps during the same period, both these schools are doing well.

Big Game (November 17, 2018)

Cal Vs Standord
The California Golden Bears have met the Stanford Cardinal team on the field 120 times but we’re pretty sure this is the first time they’re face to face on Wi-Fi speeds. We were a little surprised to find how thoroughly California trounces Stanford with an 87.8% lead when it comes to download speed. For comparison, the state of California showed a mean Wi-Fi download speed of 87.71 Mbps in Q1-Q2 2018.

The Game (November 17, 2018)

Yale Vs Harvard

If Wi-Fi was football (and we admit it’s not), it would take a hail mary for Harvard to beat Yale with Wi-Fi speeds like these. We’re not going to rub in this defeat by calculating the percentage here.

The Crosstown Showdown (November 17, 2018)

UCLA Vs USC

Yes, we know no one actually calls it this, but it’s catchy, right? We love to see a close match-up like this when it comes to Wi-Fi speeds. If download was the only determinant, the Victory Bell would be painted blue (this year) to honor UCLA’s win. Both schools well outpace L.A.’s average Wi-Fi download speed of 86.17 Mbps during the same period.

Apple Cup (November 23, 2018)

As Ookla’s headquarters are located in Seattle, this one’s personal for us. All dirt roads may lead to Pullman, but the office Dawgs have to concede that Wazzu has the better Wi-Fi download speed. With an average download speed of 94.34 Mbps over Wi-Fi for Washington state as a whole, both schools have some room to make up.

Civil War (November 23, 2018)

Oregon Vs Oregon State
Oregon may lead this 124-year-old rivalry when it comes to football games, but the Oregon State Beavers have it when it comes to Wi-Fi download speed with a 66.6% lead over the Oregon Ducks. For comparison, the average Wi-Fi download speed in Oregon state was 82.25 Mbps during the same period.

Clean, Old-Fashioned Hate (November 24, 2018)

Georgia Vs Georgia Tech

Clean, old-fashioned hate indeed. The Wi-Fi contest between Georgia and Georgia Tech is technically too close to call. Well done Georgia Bulldogs and Georgia Tech Yellow Jackets! Both schools are relatively far behind the state of Georgia’s average of 80.02 Mbps for Wi-Fi downloads in Q1-Q2 2018.

Duel in the Desert (November 24, 2018)

If the Territorial Cup was awarded for fastest Wi-Fi, it would go to the Arizona Wildcats who have a 62.6% lead in download speed over the Arizona State Sun Devils (and the fourth fastest campus Wi-Fi of any school in this article). In case you’re wondering, the average Wi-Fi download speed in the state of Arizona was 83.71 during the same period.

Iron Bowl (November 24, 2018)

Auburn Vs Alabama

Poor Alabama, if you didn’t have so many rivalries… Auburn for the win here as the Tigers come in with a blazing fast Wi-Fi download speed on their campus network. At least Alabama’s Crimson Tide rocks football? The state of Alabama’s average download speed over Wi-Fi was 58.58 Mbps.

Notre Dame–USC (November 24, 2018)

Notre Dame Vs USC

We’re sorry to say that Notre Dame would not be awarded the Jeweled Shillelagh if this game was based on Wi-Fi speed, as the USC Trojans dominate with an 83.0% faster download speed on their campus network than the Fighting Irish.

Paul Bunyan’s Axe (November 24, 2018)

Minnesota Vs Wisconsin

No one was worried about Wi-Fi when the Minnesota Golden Gophers and the Wisconsin Badgers first met on the field back in 1890. Wisconsin should start worrying now, though, because the download speed on Minnesota’s campus network is less than half of what Wisconsin enjoys.

Backyard Brawl (September 3, 2022)

Pittsburgh Vs W. Virginia

You might have to wait until 2022 to watch the Pittsburgh Panthers kick off against the West Virginia Mountaineers, but we can tell you right now which of the two campuses has the fastest Wi-Fi: West Virginia University by 76.8%.

Texas–Texas A&M (in memoriam)

Texas Vs Texas

Unless there’s some conference rearrangement, we may never get to watch Texas A&M’s Aggies play the Texas Longhorns again. But this rivalry dies hard in Texas (and anywhere else fans bleed orange or maroon). If the campuses were to face off today using Wi-Fi download speed alone, the Longhorns would have it. Hook ‘em.

Both campuses do well to beat the state of Texas’s 88.85 Mbps average download speed over Wi-Fi.

A full look at the campus Wi-Fi standings

To understand where the campus Wi-Fi networks we examined rank overall, we compiled all the above results. Oregon State takes first place, Utah State second and Yale third. On the other end of the spectrum, the University of Alabama was in last place, Harvard was second to last and the University of Pittsburgh third to last.

Campus Wi-Fi Speeds
Speedtest Data | Q1-Q2 2018
Campus Mean Download (Mbps)
Oregon State University 128.90
Utah State University 125.46
Yale 124.74
University of Arizona 119.52
University of Texas, Austin 116.56
Auburn University 115.14
UCLA 114.09
Texas A&M 105.78
University of Minnesota 104.24
University of Southern California 102.83
University of Oklahoma 100.58
University of California, Berkeley 96.86
Oklahoma State University 87.86
Louisiana State University 87.56
University of Oregon 77.37
Washington State University 75.49
Arizona State University 73.50
West Virginia University 71.91
University of Washington 68.84
Brigham Young University 67.42
University of Georgia 66.51
Georgia Tech 66.31
Ohio State University 62.14
Florida State University 57.58
University of Notre Dame 56.18
University of Florida 53.08
University of Tennessee 52.63
Stanford 51.57
University of Wisconsin, Madison 50.13
University of Miami 46.25
University of Pittsburgh 40.67
Harvard 37.16
University of Alabama 36.88

Is your favorite team not listed here (ahem, Clemson, Michigan, Lehigh)? Take a Speedtest using the Wi-Fi on your campus network, and we’ll check back next year to see how the rivalries stack up.

Ookla retains ownership of this article including all of the intellectual property rights, data, content graphs and analysis. This article may not be quoted, reproduced, distributed or published for any commercial purpose without prior consent. Members of the press and others using the findings in this article for non-commercial purposes are welcome to publicly share and link to report information with attribution to Ookla.

| October 10, 2019

We Tested 8 VPNs and Hotspot Shield is Fastest

VPNs are a key component for today’s savvy web user whether you’re concerned about online privacy or streaming the latest episode of an overseas baking show. But VPNs also have a reputation for destroying download speeds. We tested eight popular VPNs to see which rises to the top by keeping your connection fast.

Methodology

vpn-diagram

We tested each VPN under two circumstances: local and international. A local result means we connected the VPN to our hometown (Seattle) and then ran several tests using Speedtest.net to the closest Speedtest server. This is similar to what you might expect to see if you simply turned on the VPN with automatic settings and started browsing. Your browsing would be private, but you wouldn’t enjoy any of the geographic benefits of a VPN.

To test international results, we connected each VPN to a London VPN server and ran a Speedtest to a London Speedtest server. This simulates the experience of accessing TV shows and other media outside of your home country.

The percent difference for both local and international tests is calculated against the mean of our baseline Speedtest results when no VPN was connected. Note that while you can choose between multi-connection and single-connection testing on most of our Speedtest platforms, the results outlined below used multi-connection.

All VPNs slowed our local connections

Ookla_Difference-in-Speed-When-Testing-VPN-to-Local-Server
The greater the percent difference from the baseline, the slower your connection will be. Hotspot Shield had the least impact to download speed in local testing with a decrease of 51.9%. IPVanish was second best — decreasing download speed by 66.7%. Private Internet Access was third at -70.9%, and TunnelBear had the slowest speeds with -98.3%. We should note that while IPVanish, Hotspot Shield and NordVPN have business relationships with Ookla, our results are independent of these relationships.

Hotspot Shield was actually faster than the baseline on our international tests

Ookla_Difference-in-Speed-When-Testing-VPN-to-Remote-Server-2
Our international VPN test showed Hotspot Shield in first place with a 26.2% increase in download speed when testing between Seattle and London. We spoke to our engineers to find out what allows Hotspot Shield’s technology to improve speeds internationally. Hotspot Shield funnels network TCP traffic through a transparent TCP proxy, from a location on the internet close to the device, to the remote destination. This proxy efficiently manages congestion that typically occurs at the last mile which allows for an increase in speeds versus standard routing.

All other VPNs showed the expected decrease in download speeds when testing internationally. ExpressVPN was the second fastest VPN for international connections with a 42.5% decrease in download speed. Avira was third with an 85.2% decrease. IPVanish and NordVPN followed closely behind, coming in within 1% of each other. TunnelBear, again, had the slowest speeds with a 95.3% decrease.

Now that you know which VPN is fastest, take a Speedtest next time you’re connected to a VPN to see how protecting your online privacy is impacting your speeds.

Ookla retains ownership of this article including all of the intellectual property rights, data, content graphs and analysis. This article may not be quoted, reproduced, distributed or published for any commercial purpose without prior consent. Members of the press and others using the findings in this article for non-commercial purposes are welcome to publicly share and link to report information with attribution to Ookla.

| January 31, 2018

Which Mobile Carrier Won Sunday’s Big Football Game?

Football’s biggest game is this weekend and we’re excited to hear if all the reported mobile and Wi-Fi investments at U.S. Bank Stadium are up to the challenge on Sunday. We’ll follow up on that next week, but in the meantime we’re limbering up by checking out mobile internet speeds at the Eagles’ and Patriots’ home stadiums over the season. We’re also offering a preview of the performance we’ve seen at U.S. Bank Stadium so far this season.

We looked at stadium speeds for August 1, 2017 through January 30, 2018 and compared speeds by carrier using Speed Score — a combined measure of each provider’s download and upload speed at the 10th, 50th and 90th percentiles — on modern devices (i.e. not your grandfather’s flip phone).

Lincoln Financial Field, home of the Eagles

If we were handicapping teams based on mobile speeds at their home fields, the Eagles would be in sore shape for Sunday. Although Verizon had the best speeds of the season, the carrier’s Speed Score at Lincoln Financial Field was 63.6% lower than it was at Gillette Stadium. Still, Verizon’s Speed Score was 59.2% higher than AT&T’s, 121.3% higher than Sprint’s and 220.7% higher than T-Mobile’s.


Speedtest Cellular Internet Results

Lincoln Financial Field | 2017 Season
Carrier speeds based on Speed Score for modern devices

Carrier Speed Score
Verizon Wireless 27.90
AT&T 17.52
Sprint 12.61
T-Mobile 8.70

Gillette Stadium, where the Patriots go to win

The Patriots won’t need to stage one of their famous comebacks to claim a win for mobile internet speeds on their home turf. Looking at speeds at Gillette Stadium, Verizon wins again with the fastest Speed Score of them all. Add to that every major carrier had faster speeds here than they did in Philadelphia. Verizon was 174.4% faster in Foxborough than in Philly, AT&T was 25.2% faster, Sprint jumped 143.9% and T-Mobile saw a 173.0% increase in Speed Score when comparing their performance at Gillette Stadium with that at Lincoln Financial Field.


Speedtest Cellular Internet Results

Gillette Stadium | 2017 Season
Carrier speeds based on Speed Score for modern devices

Carrier Speed Score
Verizon Wireless 76.56
Sprint 30.76
T-Mobile 23.75
AT&T 21.93

U.S. Bank Stadium, the place to be on Sunday

The U.S. Bank Stadium in Minneapolis was designed with big events like Sunday’s football game in mind from the capacity, to the readerboards to the app. But what we’re really interested in is the tech. With Wi-Fi access points literally built into the railings, U.S. Bank Stadium should be the ideal place to live-stream any game or event. As for cellular, there’s a distributed antenna system that should keep fans connected.

Season internet speeds play-by-play

Examining internet performance at U.S. Bank Stadium for all home games during the regular stadium, the impressive speeds bode well for the big day.

Team cellular vs. team Wi-Fi

Cellular speeds at U.S. Bank Stadium far exceeded the U.S. average throughout the 2017 football season. On the date with the slowest speeds, September 24, downloads were still 62.6% faster than the average for the U.S. during that month and 5.9% faster than Minneapolis’s average download speed for September 2017.


Speedtest Cellular and Mobile Wi-Fi Results

U.S. Bank Stadium | 2017 Season
Stadium speeds based on mean speeds for all results

Day Cell – Mean Download (Mbps) Cell – Mean Upload (Mbps) Wi-Fi – Mean Download (Mbps) Wi-Fi – Mean Upload (Mbps)
Sep 11, 2017 59.61 23.14 27.87 28.45
Sep 24, 2017 38.99 18.30 21.65 25.75
Oct 1, 2017 41.98 21.35 21.82 28.07
Oct 15, 2017 62.54 23.54 29.37 25.92
Oct 22, 2017 53.05 26.83 30.01 29.11
Nov 19, 2017 69.02 24.97 22.03 25.38
Dec 17, 2017 59.25 22.05 18.84 17.65
Dec 31, 2017 63.15 22.88 14.10 16.41

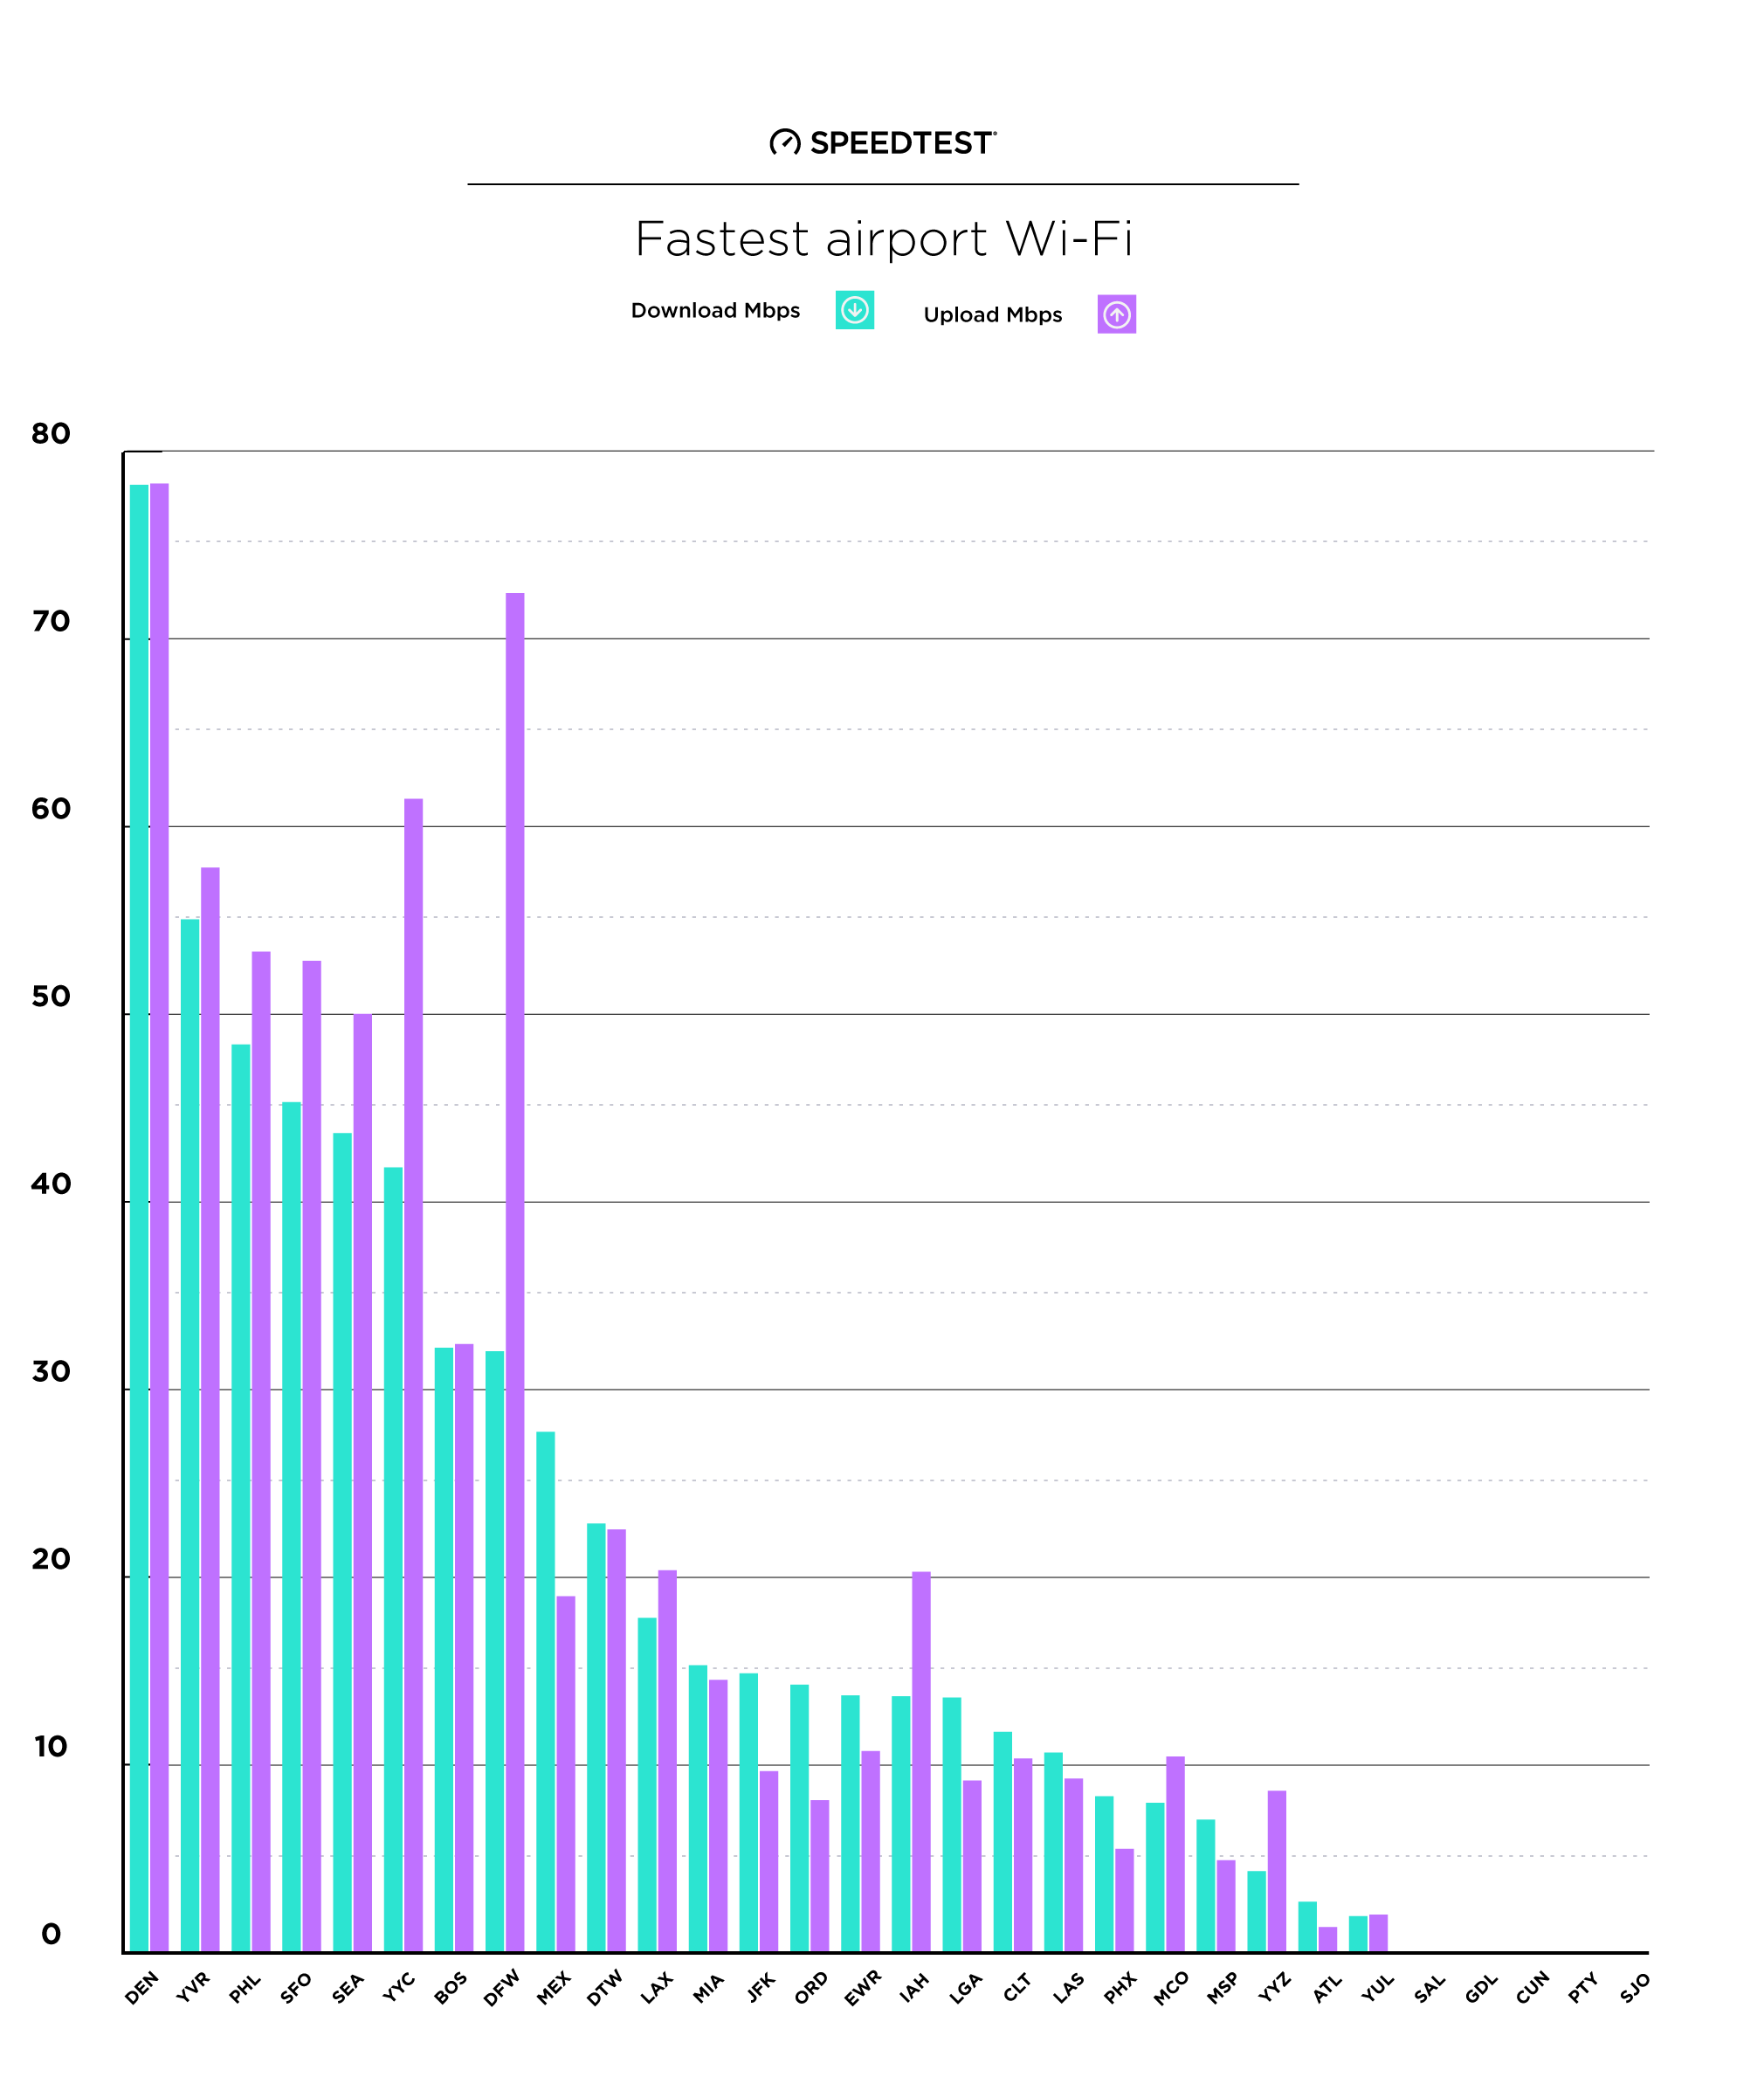
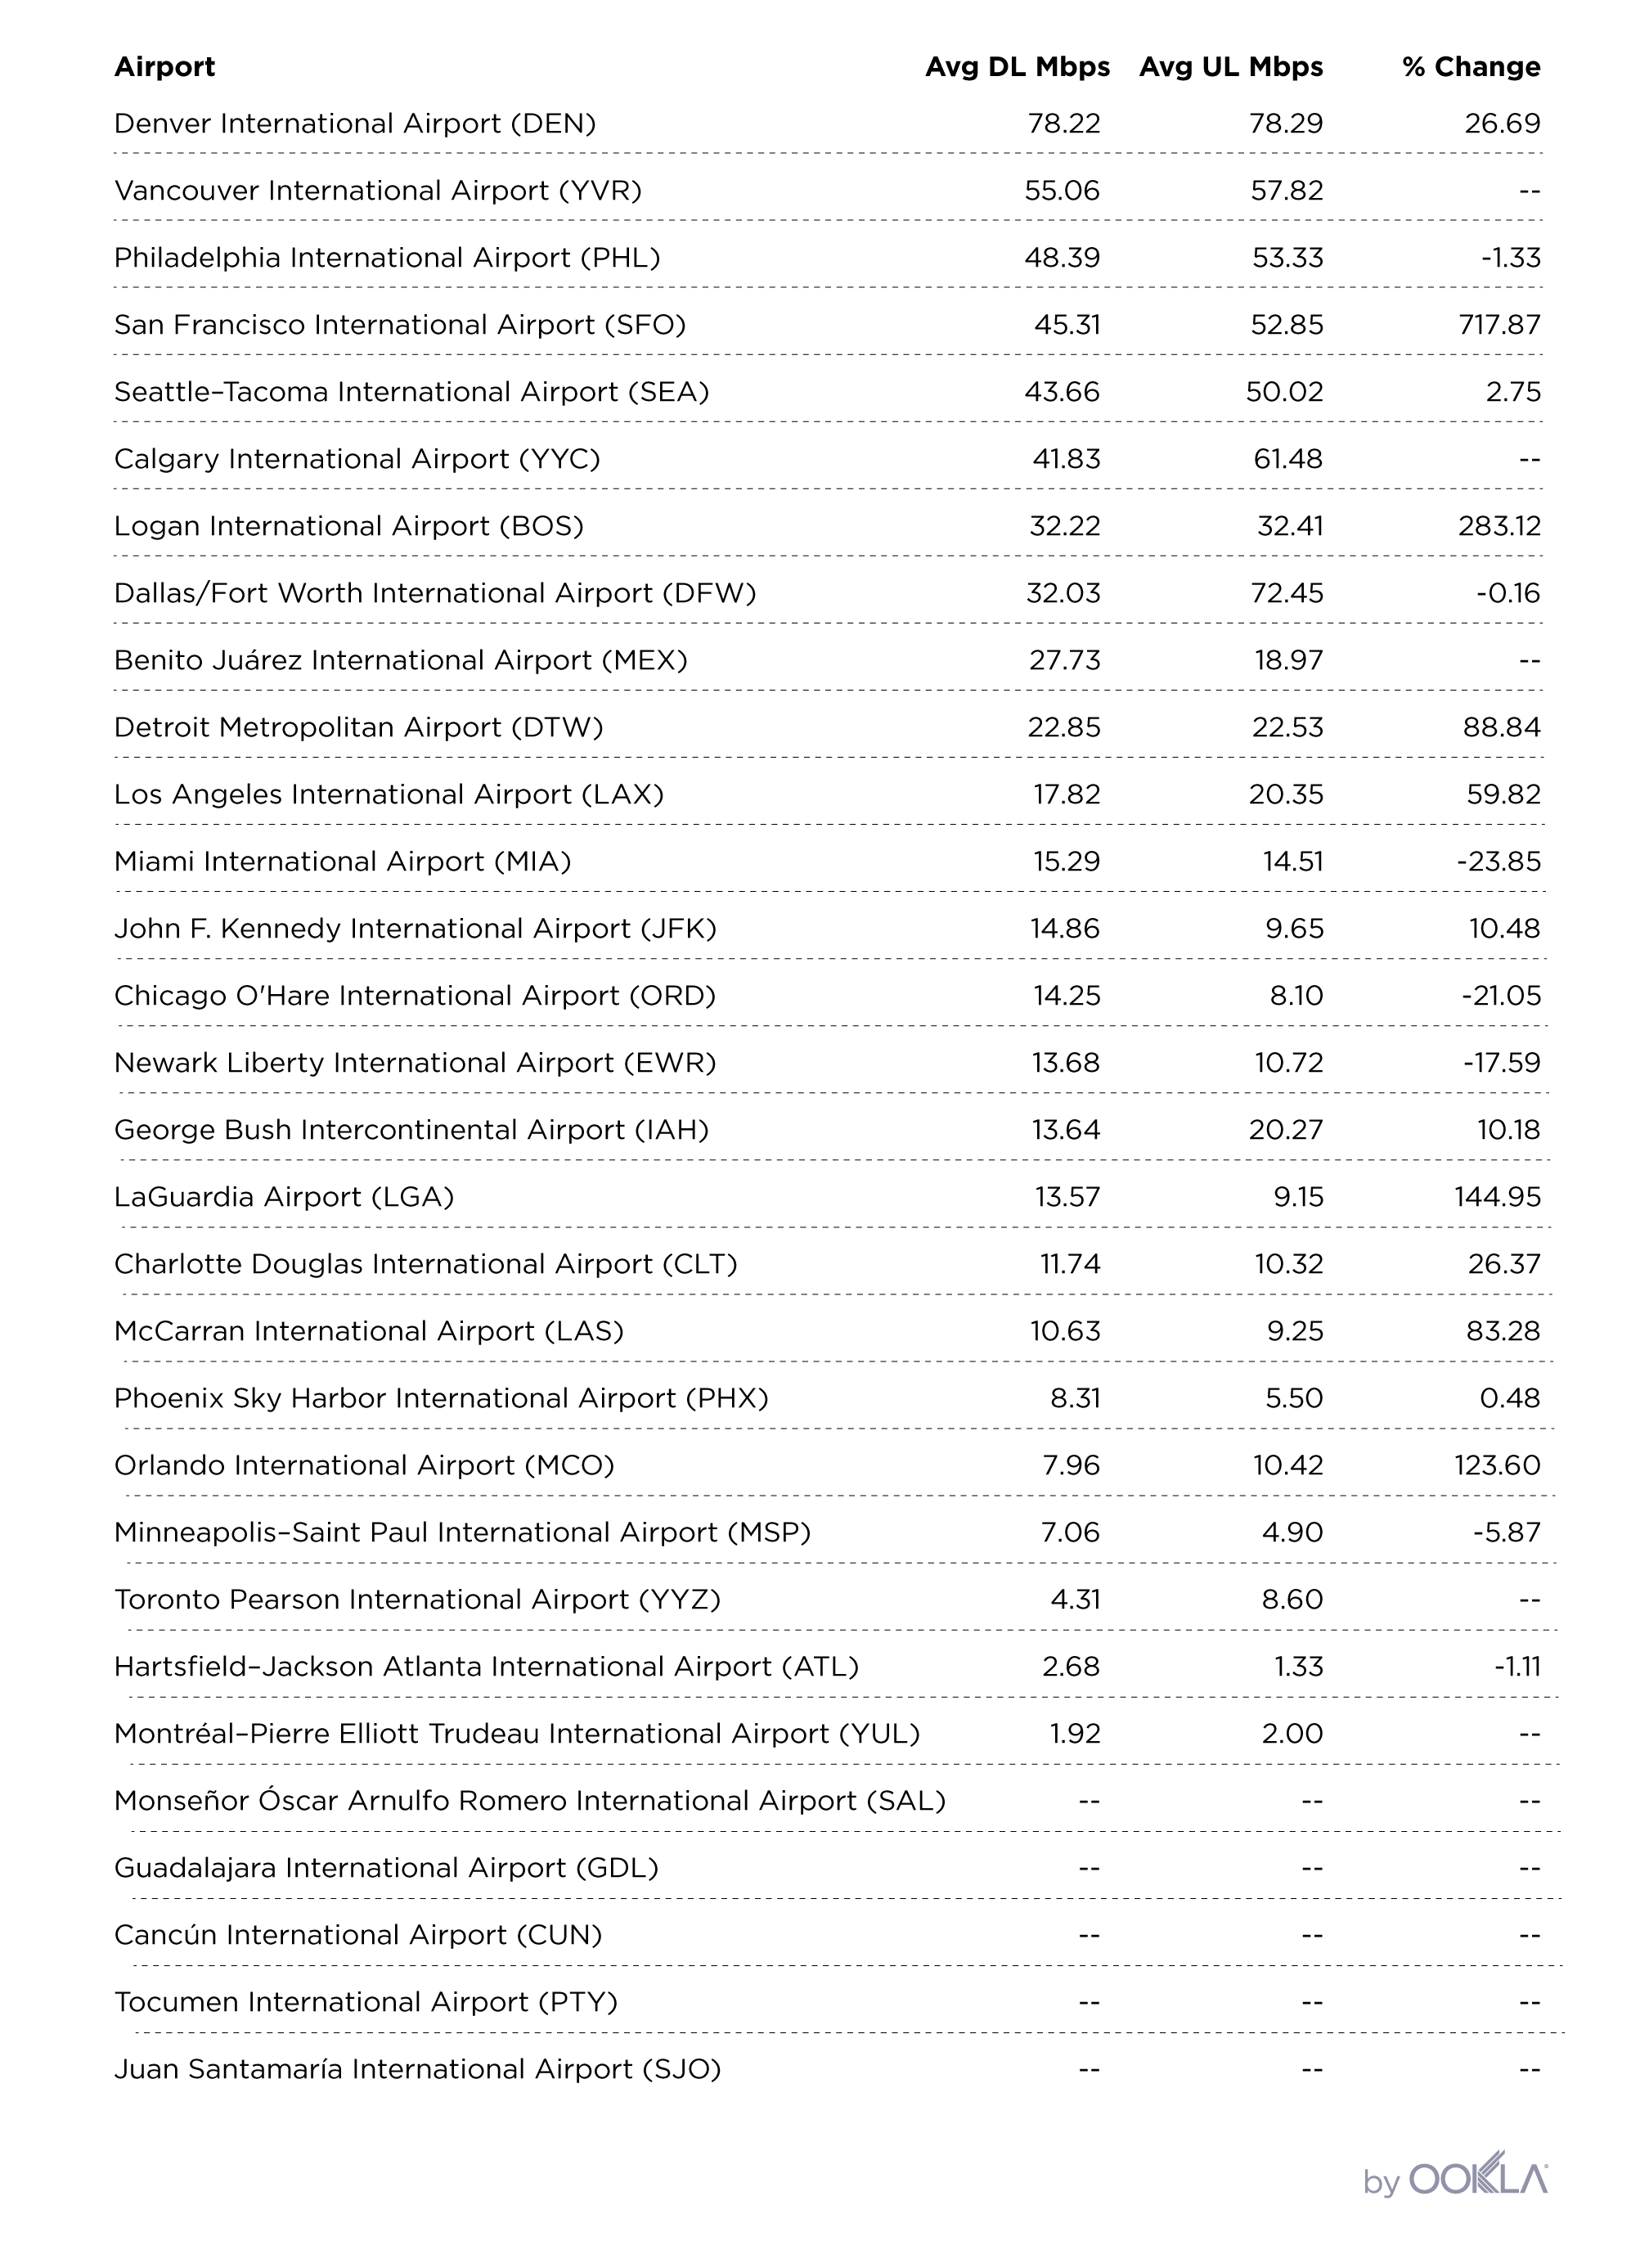
Meanwhile, the Wi-Fi might be free at U.S. Bank Stadium and the average speed does exceed that of the free Wi-Fi we’ve seen at many North American airports, including LAX and JFK, but it’s still not as fast as we’d hoped. Especially given all the hype. Free Wi-Fi is a great resource to have, but in most cases you’ll get faster speeds using your mobile carrier’s network on game day.

Carrier performance

T-Mobile had the fastest Speed Score at U.S. Bank Stadium. On average, T-Mobile was 18.6% faster than Verizon, 65.1% faster than AT&T and 107.4% faster than Sprint.


Speedtest Cellular Internet Results

U.S. Bank Stadium | 2017 Season
Carrier speeds based on Speed Score for modern devices

Carrier Speed Score
T-Mobile 87.44
Verizon Wireless 73.74
AT&T 52.96
Sprint 42.15

What to expect during the big game

Our technical evangelist, Milan Milanović, dug a little deeper into some upgrades mobile carriers have been working on to make sure their networks are game-ready. Here’s what he found:

  • AT&T’s upgrades include deploying over 800 antennas throughout the stadium, providing a more than 200% increase in capacity. Additional legacy spectrum assets have been refarmed (Band 5) and coupled with advanced LTE technologies. AT&T is expected to keep up with the increased traffic demand.
  • Verizon has added 48% more antenna nodes at the stadium, which are largely invisible (tucked under the seats, handrails, etc.). In addition to over 50 MHz of deployed capacity, Verizon is activating Higher Order MIMO and Higher Order Modulation together with three-channel carrier aggregation. You could say Verizon has their game face on.
  • Sprint’s network within the stadium also relies on 800 nodes and a distributed antenna system (DAS) powered by small cells. This will deliver 40 MHz of TDD capacity in the 2.5 GHz frequency band. Sprint will rely on two-channel carrier aggregation in the downlink to provide required downlink capacity. It will be interesting to see if this network configuration will be sufficient to support the inevitable spike in upload traffic, especially during halftime.
  • T-Mobile has increased the node capacity within the stadium by a factor of 30 in addition to the already deployed 4×4 MIMO, 256 QAM and three-channel carrier aggregation LTE techniques. They have also allocated additional spectrum assets to LTE in order to provide 45 MHz of downlink capacity, upgraded backhaul at and around the event and centralized radio access technology by the way of uplink CoMP (Coordinated Multipoint). This centralized radio access technology is designed to improve uplink data rates and network efficiency, with the added benefit of extending a smartphone’s battery life.

His assessment for fans on the big day? Bring your best devices for the best performance (for you and others). Users with smartphones equipped with four receive antennas will be able to experience the fastest speeds possible. In the process, they’ll also contribute to higher network efficiency by virtue of more quickly completing tasks that improve spectrum resource utilization and therefore the overall capacity of the network. Sunday’s event will also be a test of which operator has most aggressively seeded these highly efficient handsets into the hands of consumers.

Game day stats

You’ve probably seen the wide swing in reported speeds from the big game, and, now that Eagles fans have almost recovered from Sunday’s celebration, we’re here to set the record straight.

Cellular speeds

Looking at speeds at U.S. Bank Stadium between 3:30 p.m. and 8 p.m. on Sunday, we found that the mean cellular download speed at the stadium was faster than we’d seen at any game, all season long. Not a lot faster, but, given the 7.2 terabytes of data used during Sunday’s game, we’re impressed.


Speedtest Cellular Internet Results

U.S. Bank Stadium | During the Big Game
Stadium speeds based on mean speeds for all results

Day Cell – Mean Download (Mbps) Cell – Mean Upload (Mbps)
Feb 4, 2018 69.09 15.93

Which carrier won?


Speedtest Cellular Internet Results

U.S. Bank Stadium | During the Big Game
Carrier speeds based on Speed Score for modern devices

Carrier Speed Score
T-Mobile 114.72
AT&T 58.54
Verizon Wireless 50.66
Sprint 33.24

Comparing carriers based on Speed Score between 3:30 p.m. and 8 p.m. on Sunday, T-Mobile not only came out on top, but they trounced their season average, with a 31.2% jump in speeds. T-Mobile’s game-winning Speed Score was also 96.0% faster than runner-up AT&T who came in second and saw a 10.5% increase in speeds on game day.

Despite significant efforts on the technology side, the other two major carriers saw declines in Speed Scores on the big day. Verizon Wireless came in third and saw a 31.3% decrease from their season average while Sprint’s fourth-place finish was 21.1% slower than their all-season number.

How ‘bout that Wi-Fi?

We could not find any Speedtest results on “#USBANKSTADIUM”, the stadium’s reported Wi-Fi SSID, which leads us to believe that the powers that be switched the SSID to “#SBFAN” for the big event. If this is the case, the game day Wi-Fi download speed at U.S. Bank Stadium was in the low to mid range of what we saw during the rest of the season.


Speedtest Mobile Wi-Fi Results

U.S. Bank Stadium | During the Big Game
Stadium speeds based on mean speeds for all results

Day Wi-Fi – Mean Download (Mbps) Wi-Fi – Mean Upload (Mbps)
Feb 4, 2018 20.71 23.36

Was the big game worth the big investment? Likely. Huge crowds hungry to share the experience on social media can clog up networks and destroy cellular speeds. We’ll be interested to see how this year’s performance changes carriers’ playbooks for 2019.!

Ookla retains ownership of this article including all of the intellectual property rights, data, content graphs and analysis. This article may not be quoted, reproduced, distributed or published for any commercial purpose without prior consent. Members of the press and others using the findings in this article for non-commercial purposes are welcome to publicly share and link to report information with attribution to Ookla.

| February 3, 2020

Verizon Rocks Mobile Speeds at the Big Game in Miami

More than 65,000 people watched the Kansas City Chiefs beat the San Francisco 49ers live at the Hard Rock Stadium in Miami yesterday. All those fans on their phones sharing the halftime experience with folks back home used massive amounts of data as they livestreamed and posted to social media. Every year this event presents a major challenge to mobile operators who this year added 5G to the mix. We’re here to report on which operator had the fastest speeds and the lowest latency on game day and what indoor coverage looked like in the Miami area.

Stadium-Heatmap

Mobile operators had their game face on

This is no ordinary sporting event, and operators have been working for many months on their playbooks for providing the best possible performance at Hard Rock Stadium. Highlights include:

Verizon Wireless’s download speeds beat out competitors’

We compared the big four U.S. mobile operators from two hours prior to kick-off to 30 minutes after the game ended to see who won. Here’s what we saw:

Overall Cellular Performance at Hard Rock Stadium
Speedtest® Data | February 2, 2020
Operator Mean Download Speed (Mbps) Mean Upload Speed (Mbps) Latency (ms)
Verizon Wireless 297.18 9.81 59
T-Mobile 121.93 30.34 34
Sprint 114.93 6.20 51
AT&T 103.68 8.38 46

Sprint’s home team might have won the game, but Verizon triumphed when it came to mobile download speeds, coming in 143.7% faster than second-place T-Mobile when considering Speedtest® results over all technologies. Sprint had the third fastest mean download speed in this category and AT&T came in fourth.

Focusing on their 5G game really helped Verizon take the day when considering overall speeds as T-Mobile had the fastest mean download speed (66.35 Mbps) on LTE. Sprint was second on LTE with a mean download speed of 56.16 Mbps, AT&T third at 39.18 Mbps and Verizon fourth at 30.67 Mbps. We break out 5G speeds for each operator below.

T-Mobile’s mean upload speed over all technologies was far better than competitors’. Upload speed is especially important at big events like this as fans try to share their game day experience with those not in the stadium.

T-Mobile also had the lowest latency, coming in 26.0% faster than second-place AT&T. Sprint was third for latency and Verizon fourth.

For comparison, the mean download speed over mobile in the U.S. in January 2020 was 41.23 Mbps, upload was 10.55 Mbps and latency was 46 ms.

5G for the win

5G is the biggest story in mobile these days, and all four operators came prepared to deliver their best game to customers with 5G-capable phones and compete for bragging rights during this high profile event.

5G Performance at Hard Rock Stadium
Speedtest® Data | February 2, 2020
Operator 5G Download Speed (Mbps) 5G Upload Speed (Mbps) 5G Latency (ms)
Verizon Wireless 646.17 9.86 91
T-Mobile 348.33 28.89 32
Sprint 225.78 15.39 15

Verizon easily beat T-Mobile and Sprint when it came to mean download speed over 5G during the big game. Verizon came in last, however, for both mean upload speed over 5G and latency. T-Mobile showed the fastest mean upload speed over 5G and Sprint had the best latency on 5G. While we did see 5G Speedtest results for AT&T during the game, there were fewer than 10, the minimum threshold we set for this event.

Hard Rock Stadium Wi-Fi was a viable option

In 2019, fans at Mercedes-Benz Stadium in Atlanta used over 24 TB of data on the stadium Wi-Fi network on game day with an average Wi-Fi download speed of 30.98 Mbps. To get a baseline on the Miami experience, we looked at Wi-Fi performance during the Bengals v. Dolphins matchup on December 22, 2019.

Wi-Fi Performance at Hard Rock Stadium
Speedtest® Data | February 2, 2020
Mean Download Speed (Mbps)Mean Upload Speed (Mbps)Mean Latency (ms)

Stadium Wi-Fi – December 22, 2019 56.48 62.64 7
Stadium Wi-Fi – Big Game 37.43 46.55 9
Verizon Wi-Fi – Big Game 36.81 40.91 7

Wi-Fi at the stadium did show some game day stresses yesterday, with a mean download speed 33.7% slower than the December 22 game. Mean upload speed dropped 25.7% and latency was up 28.6%.

Verizon also provided Wi-Fi for their customers during the big game yesterday, and the mean download speed was comparable to that on the stadium’s SSID. Mean upload speed on Verizon’s SSID was 12.1% slower than on the stadium’s, but Verizon’s Wi-Fi latency was also lower, showing a 22.2% improvement over stadium Wi-Fi.

It’s worth noting that mean upload speed in all cases was faster than that on download. This is impressive and helpful to fans trying to livestream their experience for friends back home.

Indoor mobile coverage in Miami

Stadium speed is very important, however most attendees will spend the bulk of their time in hotels and at tourist attractions in and around Miami. We used Cell Analytics to assess indoor coverage at 9,128 buildings in the Miami metro area during Q3-Q4 2019 to see who had good indoor coverage (signal strength of greater than -115 dBm) in the most buildings.

Indoor Mobile Coverage in Miami Metro Area
Cell AnalyticsTM Data | Q3-Q4 2019
Operator % of Buildings with Good Coverage % of Buildings with Best Coverage
Verizon 97.7% 29.1%
T-Mobile 97.2% 36.9%
AT&T 94.2% 22.7%
Sprint 92.5% 11.2%

Verizon showed good coverage in more buildings than any other operator at 97.7%, followed by T-Mobile at 97.2%, AT&T at 94.2% and Sprint at 92.5%.

We also examined who had the best coverage in each building and found that T-Mobile provided the strongest coverage in 36.9% of buildings analyzed. Verizon had the strongest coverage in 29.1% of buildings analyzed, AT&T was strongest in 22.7%, and finally Sprint was strongest in 11.2%.

Learn how Ookla® can help you determine if your network is prepared for the massive crowds that accompany a marquee event and analyze how your network performs both indoors and out, down to the building level.

Ookla retains ownership of this article including all of the intellectual property rights, data, content graphs and analysis. This article may not be quoted, reproduced, distributed or published for any commercial purpose without prior consent. Members of the press and others using the findings in this article for non-commercial purposes are welcome to publicly share and link to report information with attribution to Ookla.

| March 14, 2019

Ditch the Lag: Cities with Great Gaming Culture and Low Ping

Yes, you can game from anywhere with an internet connection. But if you’re at all competitive, it’s nice to play from somewhere with low ping and fast internet speeds. Plus when you need to leave the house, it’s extra nice to know you’re also surrounded by gamer culture. We’ve examined February 2019 Speedtest results in 35 cities that are known for their esports events, gaming conferences, game companies and more to find out who has the advantage and ranked them based on their ping.

The top contenders

Eleven_Gaming_Cities_0219

First place Bucharest, Romania is home to super-low ping, a lightning fast download speed and a thriving gaming culture. From Bucharest Gaming Week (which includes the CS:GO Southeast Europe Championship and the FIFA National Tournament) to their numerous local game studios, Bucharest is a great place to be a gamer whether you’re online or out and about.

The next five gaming cities with the lowest pings are all in Asia. Hangzhou, China comes in second overall with a fast ping and world-class download speeds. This city is so devoted to its gamers that it opened a $280 million gaming “city” in 2018 and plans 14 new esports arenas before 2022. Coming in third, Chengdu, China has an equally low ping to our first two contenders and serves as one of two host locations in China for the Global Mobile Game Confederation (GMGC). Both Hangzhou and Chengdu are also franchise holders in the Overwatch League, giving local gaming fans something to cheer about. Fourth place Singapore, host of the 5th Annual GameStart Convention in October 2018, had only a slightly slower ping than the first four cities and the fastest download speed of any of the cities we considered.

South Korea is home to the fifth and sixth best cities for gamers. A satellite city of Seoul, Seongnam-si boasts the Pangyo Techno Valley (a.k.a. the Silicon Valley of Korea) and numerous game development companies. Perfect for a city with a 9 ms ping. Though Incheon’s ping was a little slower at 12 ms, gamers there can console themselves with the city’s gamer cred — the 2018 League of Legends World Championship was held in Incheon’s Munhak Stadium.

Coming in at number seven, Budapest, Hungary is an emerging game city, having hosted its first big esports event (the V4 Future Sports Festival) in 2018, but a 12 ms ping makes them a strong contender. More established Malmö, Sweden is number eight with a slightly slower average download speed but the city is headquarters to Massive Entertainment, creators of Tom Clancy’s The Division series, Far Cry 3, Assassin’s Creed: Revelations and many more.

Vancouver, Canada, North America’s only qualifier for the top gaming cities list, comes in at number nine with a 12 ms ping and many gaming companies including the Canadian arms of Nintendo of Canada and EA (Electronic Arts). We included both Shanghai, China and Moscow, Russia on the top gamer cities list as both had a 12 ms ping as well, though the internet speeds in Shanghai are superior. Shanghai will also host the International Dota 2 in 2019 while Moscow is known for Epicenter.

The rest of the pack

Notably absent from the list above is most of the western hemisphere. Cities in North America were held back by their high pings. Cities in South America suffered from high pings and also slow internet speeds — something that esports leagues have complained is a barrier to investment.

Our full list of gaming cities provides wider geographical representation, even if the internet performance is not always as stellar. You’ll find Los Angeles in 27th place, behind Seattle, Boston and Las Vegas. And São Paulo, Brazil has the best showing in Latin America at 23rd.

Internet Performance in 35 Cities with a Gaming Culture
Speedtest Results | February 2019
City Ping (ms) Mean Download (Mbps) Mean Upload (Mbps)
Bucharest, Romania 8 172.13 126.57
Hangzhou, China 8 125.93 29.54
Chengdu, China 8 101.92 33.80
Singapore 9 196.43 200.08
Seongnam-si, South Korea 9 155.25 114.83
Incheon, South Korea 12 139.84 102.91
Budapest, Hungary 12 132.72 54.46
Malmö, Sweden 12 126.28 105.67
Vancouver, Canada 12 117.55 50.23
Shanghai, China 12 75.14 30.06
Moscow, Russia 12 64.56 63.59
Oslo, Norway 13 115.46 69.03
Hong Kong, Hong Kong (SAR) 14 167.59 161.14
Zürich, Switzerland 14 144.36 109.39
Seattle, United States 15 138.50 79.88
Stockholm, Sweden 15 134.16 93.83
Auckland, New Zealand 15 92.05 53.30
Toronto, Canada 16 134.75 67.42
Boston, United States 17 152.42 60.87
Las Vegas, United States 17 141.69 41.22
Chennai, India 17 48.40 42.93
Cologne, Germany 18 63.77 18.36
São Paulo, Brazil 18 46.43 21.57
Jakarta, Indonesia 18 17.88 10.21
Mumbai, India 19 23.40 19.26
Paris, France 20 161.04 93.68
Los Angeles, United States 20 121.00 23.57
London, United Kingdom 20 63.58 23.18
Rio de Janeiro, Brazil 20 36.50 13.33
Buenos Aires, Argentina 21 34.31 6.40
Katowice, Poland 22 83.99 20.91
Mexico City, Mexico 25 37.66 15.39
Sydney, Australia 25 34.20 9.61
Santiago, Chile 26 56.13 18.49
Tokyo, Japan 28 99.24 101.90

Of course, die-hard gamers will know that a low ping in your city won’t necessarily save you if you’re playing on a distant server.

What’s the ping like in your city? Take a Speedtest and see if your connection is hurting your gameplay.

Ookla retains ownership of this article including all of the intellectual property rights, data, content graphs and analysis. This article may not be quoted, reproduced, distributed or published for any commercial purpose without prior consent. Members of the press and others using the findings in this article for non-commercial purposes are welcome to publicly share and link to report information with attribution to Ookla.

| March 11, 2020

Three Ways to Improve Your Network Strategy with Crowdsourced Data (White Paper)

Both wireless network operators and infrastructure companies face challenges when determining where to make investments or improvements. Wireless network operators must properly configure cell sites to minimize interference, determine where networks are performing poorly and rapidly identify what network changes to implement to improve service in those locations. Similarly, infrastructure companies, such as tower and distributed antenna system (DAS) builders, must be able to determine areas and buildings with lots of users and poor service on multiple networks, then use this information to identify the best places to build new towers or “neutral host” indoor systems to lease to as many operators as possible.

To make these decisions, most providers currently rely on expensive drive testing, performance counter data that doesn’t offer location accuracy and outdated information on population density. In this new white paper, we share how providers can use real-world network performance and quality measurements from Ookla® to inform their network strategy. Download the full white paper here.

A better way to collect network performance, coverage and signal data

Recent advances in collecting and analyzing crowdsourced measurements can help inform network optimization decisions. Ookla Cell Analytics™ surfaces real-world data on wireless service quality, RF measurements, data usage, user density and other key metrics. Cell Analytics uses the results from 10+ million daily consumer-initiated tests taken on Speedtest® and hundreds of millions of coverage scans on Speedtest Android every day to provide accurate location information, both indoors and out, down to the individual building level.

Performance-Counter_Crowdsourced-RSRP-Measurement-Views-1

The above image compares typical performance counter metrics to the detailed view in Cell Analytics of LTE signal level (RSRP) for one network operator in Philadelphia.

Locating competitor cell sites and opportunities for new cell site deployment

Using the Site Finder feature in Cell Analytics, mobile network operators and infrastructure providers can accurately estimate the locations of cell sites for all operators. In addition to competitive benchmarking, this also allows providers to discover areas with poor coverage or quality — and no existing cell sites — to identify deployment opportunities.

Houston_Poor-Coverage_High-User-Density
The above image shows individual buildings that are scored on the count of indoor users and indoor service quality on all networks. Buildings with a high score (indicated in red) may be good opportunities for network operators to increase capacity and for infrastructure providers to build new rooftop assets or neutral host systems.

In this white paper, we share how network engineering teams can use Cell Analytics data to discover the locations that need easy-to-make network improvements, find opportunities to add new cell sites and prioritize optimization efforts based on user density and coverage data from multiple networks.

Looking at real-world data from Italy, Brazil and the United States, download the full white paper to discover how operators can make immediate, data-driven improvements to their networks — without the overhead and limitations of drive testing.

Ookla retains ownership of this article including all of the intellectual property rights, data, content graphs and analysis. This article may not be quoted, reproduced, distributed or published for any commercial purpose without prior consent. Members of the press and others using the findings in this article for non-commercial purposes are welcome to publicly share and link to report information with attribution to Ookla.

| October 8, 2019

Investigating Internet Speeds on Tribal Lands in the U.S. and Canada

Ookla is headquartered in Seattle, traditional home of the Duwamish and Coast Salish people, where the mean download speed over fixed broadband is 142.67 Mbps. Thirty-six miles to the south on the Muckleshoot Reservation, it’s 101.85 Mbps. Meanwhile, the Makah Indian Reservation, located on the remote Washington coast, sees an average download speed of 5.91 Mbps.

Who gets fast internet speeds and who doesn’t involves a blend of factors (including geography, population density and economics) that is unique for every location, including individual Native American reservations and First Nations reserves. As Indigenous People’s Day nears, we are interested in how those factors combine to affect mobile and fixed broadband speeds on tribal lands across the U.S. and Canada. Because we are experts in internet speeds, not tribal policy, we are also offering our full tribal data set at the end of this article for anyone who would like to do further analyses.
Mobile speeds vary widely between tribal lands

Fastest-Mobile-Speeds-1

The Capilano Indian Reserve has the fastest mean download over mobile speed of all the reservations and reserves we examined. Also called X̱wemelch’stn, this community near Vancouver, B.C. is the most densely populated reserve of the Squamish Nation and its mean download speed on mobile is 27.8% faster than nearby Vancouver, B.C.

The Rumsey Indian Rancheria of the Yocha Dehe Wintun Nation virtually ties for the second fastest mean download speed over mobile. Located in California’s Coast Range, this reservation contains a casino and resort and experiences a 93.7% faster average than the state of California. With a nearly identical mean download speed, the Pala Reservation of the Pala Band of Mission Indians also houses a casino and resort and an average download speed 93.6% faster than California as a whole.

Except for Kahnawake, which has a 3.8% slower average mobile download speed than nearby Montreal, Quebec, all of the reservations and reserves on this fastest mobile list have download speeds at least 26% faster than the nearby non-tribal areas (adjacent large cities or encompassing states or provinces) we compared them with. Muckleshoot is 71.2% faster than Washington. Compared to California, Rincon is 49.9% faster, Morongo 37.1%, Twenty-Nine Palms 31.3% and Viejas 27.6%. The Mashantucket Pequot Reservation was 26.3% faster than Connecticut.

All ten of the reservations and reserves with the fastest mobile download speeds are home to large commercial enterprises including shopping centers, casinos, resorts and even a data center. Six are in California. Three are located in or adjacent to large cities.

Slowest-Mobile-Speeds-1

Our list of reservations with the slowest mobile download speeds contains some of the largest (by area) reservations in the U.S. A few have tribal enterprises including mining, casinos and tourism; most do not. All are located relatively far from large cities.

The Navajo Nation Reservation has the slowest mean download speeds over mobile of all the reservations and reserves we examined. This largest reservation in the U.S. shows an average mobile download speed that’s 80.8% slower than Arizona as a whole. Santa Clara Pueblo, located north of Santa Fe, New Mexico, has the second slowest mobile download speed on our list and is 68.5% slower than the state of New Mexico. White Earth Reservation is the third slowest on mobile, coming in 71.1% slower than the state of Minnesota.

The reservations and reserves with the slowest average mobile download speeds are at least 43.5% slower than neighboring non-tribal lands. The Allegany Reservation is 63.8% slower than New York. The Lummi and Colville Reservations are 63.3% and 63.0% slower, respectively, than Washington. In Idaho, the Nez Perce and Coeur d’Alene Reservations are 52.8% and 45.1% slower, respectively, than the state average. The Blackfeet Indian Reservation is 46.6% slower than Montana, and Pueblo Taos is 43.5% slower than New Mexico.

Fixed broadband speeds show even more variation

The ten reservations and reserves with the fastest fixed broadband download speeds are mostly in or directly adjacent to large, urban areas. All of the six reserves or reservations with the fastest fixed broadband download speed are in Canada with an additional seventh Canadian reserve in the top ten.

Fastest-Fixed-Broadband-Speeds-1

Cole Harbour 30, a Mi’kmaq reserve, has a very fast mean download speed over fixed broadband. It is located in the municipality of Halifax, Nova Scotia, a city we’ve previously found to have some of the fastest fixed broadband speeds in Canada. Cole Harbour beats Halifax’s speed by 213.1%.

Second-place Wendake is located within Quebec City, Quebec and has a fixed broadband mean download speed that’s 26.2% faster than the capital city. The Squamish Nation reserve of Seymour Creek 2 has the third fastest download speed among reserves and reservations. Located near North Vancouver, the reserve’s download speed is 24.0% faster than that of their neighboring city.

Most of these reservations and reserves show faster average download speeds over fixed broadband than comparable geographies — large cities when nearby and states or provinces when not. Cowichan 1 and Tsinstikeptum 10 are 19.7% and 16.8% faster than British Columbia, respectively. Burrard Inlet 3 is 11.2% faster than North Vancouver. The Hollywood Reservation is 5.5% faster than Hollywood, Florida, and New Songhees 1A is 1.7% faster than British Columbia. However, Salt River Reservation is 16.0% slower than neighboring Scottsdale, Arizona and the Puyallup Reservation is 4.5% slower than nearby Tacoma, Washington.

Slowest-Fixed-Broadband-Speeds-1

The slower list is evenly split between Canada and the U.S. and is mostly made up of rural and/or isolated reserves and reservations.

The Munsee-Delaware Nation No. 1 has the slowest mean download speed over fixed broadband of all the reserves and reservations we analyzed. Located in southwest Ontario, the reserve’s download speed is 99.4% slower than the provincial average. Close to Redwoods National Park in California, the Yurok Reservation is the second slowest for fixed broadband. It also has a mean download speed 96.9% slower than the state of California. Eskasoni 3 has the third slowest download speed over fixed broadband and was 95.6% slower than the surrounding province of Nova Scotia.

Fixed broadband download speeds on the rest of the tribal lands on this list are similarly slower than their comparable geographies: from the Chippewas of Georgina Island First Nation (96.1% slower than Toronto, Ontario) to the Cheyenne River Reservation (92.2% slower than South Dakota). Whitefish Bay 32A and Peguis 1B are 94.5% and 93.5% slower, respectively, than Ontario as a whole. In Washington, the Makah Reservation and the Quinault Reservation are 95.1% and 94.5% slower, respectively, than the state average. Annette Island Reserve is 93.6% slower than the state of Alaska.

There are so many reservations and reserves that we could not cover them all here. However, we are making our full CSV available for download if you’d like details on mobile and fixed broadband speeds on other tribal lands. This file includes June-August 2019 data for all locations that have 30 or more samples.

Ookla’s mission is to help make the internet better, faster and more accessible for everyone. We hope that by sharing this data we can contribute to conversation about internet equity for tribal lands. If you publish anything based on this data, please credit Speedtest IntelligenceTM as the source.

Editor’s note: The CSV was updated on December 10, 2019 to correct a sorting error that resulted in the misattribution of states.

Ookla retains ownership of this article including all of the intellectual property rights, data, content graphs and analysis. This article may not be quoted, reproduced, distributed or published for any commercial purpose without prior consent. Members of the press and others using the findings in this article for non-commercial purposes are welcome to publicly share and link to report information with attribution to Ookla.

| October 31, 2017

LinkNYC Proves Public Wi-Fi Can be Free, Fast and Far-reaching

Two years ago, LinkNYC set out to provide New Yorkers with free Wi-Fi using a network of Links that offer “superfast, free public Wi-Fi, phone calls, device charging and a tablet for access to city services, maps and direction.” The experiment worked, and we’re here to report on how fast the network really is, whether it holds up to heavy use and which parts of the city are seeing the most benefit.

What is LinkNYC?

LinkNYC uses kiosks (“Links”) to provide internet connectivity to the five boroughs (Manhattan, Brooklyn, Queens, the Bronx, and Staten Island). The project resulted from a competition initiated by the New York City government to find a new use for the City’s payphones. Service at the first 500 Links was available by the end of 2015. One thousand, one hundred and sixty-four are active as of this writing with another 215 installed and awaiting final connection. The project aims to have 7,500 Links online by the end of 2023. Each link is connected to the LinkNYC fiber network and is capable of speeds up to 1 Gbps. The Links use 802.11ac Wave 2 access points with support for 4×4:4 MU-MIMO.

LinkNYC was created by CityBridge, a consortium of companies including Intersection (a portfolio company of Alphabet Inc.’s Sidewalk Labs), Qualcomm and CIVIQ Smartscapes. Beyond a $300 million capital investment from CityBridge, LinkNYC is funded through advertising revenues from ads shown on screens on the Links themselves and is projected to create more than $500 million in revenue for the City of New York.

How fast is fast?

Speedtest data reveals LinkNYC offered up a mean download speed of 158.98 Mbps and a mean upload of 123.01 Mbps in September 2017. This free network is faster by 74% and 165%, respectively, than New York City’s average download and upload speeds over mobile Wi-Fi. New York’s mobile Wi-Fi download and upload speeds for all networks combined are respectively 249% and 312% faster than those over cellular networks. That means LinkNYC users are seeing download speeds 511% faster than they would be if they were connecting on cellular networks. LinkNYC’s mean upload speed was 996% faster than cellular.

New York City Speedtest Results
September 2017
Connection Type Mean Download (Mbps) Mean Upload (Mbps)
LinkNYC Mobile Wi-Fi 158.98 123.01
Mobile Wi-Fi 90.89 46.27
Cellular 25.98 11.22

Even better, we can see that the speeds available on LinkNYC are improving rapidly. Though the Speedtest results fluctuate somewhat on a day-by-day basis, on January 1, 2017, the average download speed was 95.70 Mbps and the upload was 81.50 Mbps. On September 30, the daily average download speed peaked at 201.00 Mbps and the upload speed was 177.10 Mbps.

Sample Speeds by Day

These daily speeds likely reflect limitations of mobile devices, not those of the LinkNYC network.

One thing to note is that while the LinkNYC network is reportedly capable of 1 Gbps speeds, most mobile devices are not. The Speedtest results graphed above are likely limited by a world where the peak achievable speed for an iPhone 5 maxes out at around 100 Mbps and an iPhone 7 at around 560 Mbps.

To top it off, LinkNYC’s daily speeds are faster still than the averages for the U.S. as a whole. In September, we saw a mean download speed over mobile Wi-Fi of 66.25 Mbps in the U.S., while cellular came in at 23.98 Mbps. Mean upload speed over mobile Wi-Fi for the U.S. was 23.59 Mbps, while cellular was 8.38 Mbps.

Is it secure?

LinkNYC actually has two networks — one called “LinkNYC Free Wi-Fi” that’s open and available to all and “LinkNYC Private.” Hotspot 2.0-compatible devices are automatically prompted to join this second network which is protected using WPA2 encryption and Hotspot 2.0 technology which facilitates cellular-like roaming on capable devices. That means that once a phone joins the “LinkNYC Private” network, the phone’s connection to the network is handed off from access point to access point as a user moves throughout the city. Most carriers have offered Hotspot 2.0-capable phones since 2014 (T-Mobile has for much longer).

We can’t say for certain that the private network is secure, but the fact that it is encrypted likely makes it more secure than your average coffee shop connection. In light of the recently discovered global WPA2 vulnerability, we asked LinkNYC how vulnerable their network was. The response was: “The Link private network is not at risk. The combination of access point firmware and the network configuration assure the integrity of encrypted WPA2.”

Speeds over the two networks are similar with downloads over “LinkNYC Private” Hotspot 2.0 network just 9.4% faster than those on “LinkNYC Free Wi-Fi”. This could be due to the fact that newer phones are both more likely to offer faster speeds and to be Hotspot 2.0-ready as well as the fact that fewer users are accessing this second network.

LinkNYC Speedtest Results
January 1 – October 11, 2017
Connection Type Mean Download (Mbps) Mean Upload (Mbps)
LinkNYC Free Wi-Fi 131.84 100.97
LinkNYC Private 144.21 106.98

Do speeds hold up during peak periods?

Yes, yes they do. The graph below shows that even during periods with the highest volume of tests (from 3-4 p.m.), the LinkNYC network maintains peak download speeds. The slowest download speeds, seen from 5-6 a.m. and 8-9 a.m., still maintain an average download speed over 120 Mbps.

NUMBER OF TESTS BY DAY GRAPH

The far-reaching impact of LinkNYC

How many people are using it?

According to LinkNYC, the network sees 300,000 users per day. We saw 19,289 Speedtest tests taken with Speedtest over the LinkNYC network from 7,594 unique users from January 1, 2017 through October 11, 2017. This compares with the 2,436,040 Speedtest results from 322,851 users on all mobile Wi-Fi networks in New York City during the same period.

Where can you get it?

As described above, Links are rolling out rapidly. You can see the current map of available Links here, but we found that the map at today’s writing corresponds closely with the map of Speedtest results we’ve seen over the past year.

SPEEDTEST RESULTS ON AVAILABLE LINKS

Much of Manhattan is covered by Links, with the exception of Washington Heights north of the George Washington Bridge and lower Manhattan below Worth St. Links are sparser in the Bronx with nothing north of West Kingsbridge Road or east of Webster Ave. (north of 161st) and Third Ave. (south of 161st).

The alignment of Links along major thoroughfares becomes more obvious in Queens and Brooklyn. In this area, we see a large gap around Bushwick and Ridgewood with nothing south of 39th St. and Clarendon Rd. A whole swath of northeast Queens (bordered by Grand Central Parkway) also exists in a Link-free zone.

Meanwhile, in Staten Island you’ll find Links on sections of Hylan Blvd. and Richmond Rd. with a few scattered in between.

Links are required to have a range of at least 150 feet, although a spokesperson for LinkNYC reported a Speedtest result as fast as 80 Mbps at 400 feet. At either distance, people living in neighborhoods with a more sparse Link distribution may not have access near home.

PERFORMANCE MAP

The map above shows that speeds vary not by neighborhood but by distance from a Link.

Can I use it at home?

If you’re lucky enough to live near a Link, you actually can use it for your home internet; there’s nothing in the terms of service to say otherwise. But, unless you’re sitting within the unassisted range of a Link, we wouldn’t recommend it.

We were able to identify Speedtest results that were using extenders and/or repeaters to rebroadcast the service farther into a building, and those tests showed speeds 57% slower than New York’s 90.89 Mbps average for downloads over mobile Wi-Fi.

LinkNYC Speedtest Results
January 1–October 11, 2017
Connection Type Mean Download (Mbps) Mean Upload (Mbps)
Unsampled Results from Extenders and Repeaters 38.87 30.71
Overall LinkNYC Results 158.98 123.01

Approaches to municipal Wi-Fi

LinkNYC’s ad-based, public-private partnership is only one approach to municipal Wi-Fi. In Leiden, Netherlands, a non-profit organization set up an independent, community-based network run by volunteers. Venice offers free Wi-Fi to all residents and Longmont, Colorado offers free municipal Wi-Fi in several locations, mostly parks, as part of their Gig City initiative.

LinkNYC isn’t the first free Wi-Fi network, but it’s one of the largest. And, despite some bumps along the way, it’s successfully bringing fast, free public Wi-Fi to the masses. The project is so successful that CityBridge has just extended the same model to London as InLinkUK.

Are you enjoying free mobile Wi-Fi on either LinkNYC or InLinkUK? Take a Speedtest on Android or iOS so we can share details about the performance of these networks over the long haul. Select the CityBridge server when taking your test to get the most accurate results.

Ookla retains ownership of this article including all of the intellectual property rights, data, content graphs and analysis. This article may not be quoted, reproduced, distributed or published for any commercial purpose without prior consent. Members of the press and others using the findings in this article for non-commercial purposes are welcome to publicly share and link to report information with attribution to Ookla.

| December 6, 2017

Mapping Gigabit: Where in the World We’ve Seen Gigabit-speed Results

Gigabit-speed internet is all over the map, literally. With the exception of Antarctica, we found Speedtest results on fixed broadband gigabit speeds (download speeds of 750 Mbps or faster) on every continent. While some continents were better represented than others, we were heartened to see just how far gigabit internet has spread across the globe.

Using data from Speedtest Intelligence during the period August 1, 2017 – November 28, 2017, we defined gigabit tests as any result with a download speed in excess of 750 Mbps for the purposes of this article. While gigabit technically means 1,000 Mbps (or 1 Gbps), that’s the available speed and device limitations and throughput overhead often limit the actual performance of a connection. We’ve also calculated a gigabit user penetration (GUP) figure that represents the number of users who have gigabit results divided by the total population of the country.

Note that gigabit service is often highly localized, so just because your country (or even city) is represented does not mean that you can get gigabit at your house.

Continents with the Most Gigabit Speedtest Results
August 1, 2017 – November 28, 2017
Region Number of Tests Number of Users Mean Download (Mbps) Mean Upload (Mbps)
North America 256,210 163,260 866.54 555.09
Europe 210,638 146,062 868.80 418.17
Asia 141,674 70,544 852.28 570.79
Australasia 11,792 7,188 879.70 520.43
South America 1,093 831 845.04 672.86
Africa 723 525 844.85 559.65

What might not be obvious is that North America has the largest number of gigabit tests. Europe is close behind and Asia takes third. Gigabit-speed results fall off dramatically in Australasia, South America and Africa.

Cities with the most tests are likewise spread across the globe from Hong Kong and Singapore to Austin, Texas.

Global Cities with the Most Gigabit Speedtest Results
August 1, 2017 – November 28, 2017
City Country/Region Number of Tests Number of Users Mean Download (Mbps) Mean Upload (Mbps)
Hong Kong Hong Kong (SAR) 58,051 15,037 872.99 637.09
Singapore Singapore 42,469 26,421 886.77 677.34
Paris France 17,211 11,891 860.71 672.39
New York United States 14,509 8,637 854.58 667.06
Bucharest Romania 13,977 8,615 842.61 707.09
San Francisco United States 8,525 3,899 859.41 733.37
Toronto Canada 7,320 4,319 839.01 627.89
Milan Italy 7,184 4,447 855.95 476.41
Budapest Hungary 6,958 4,319 848.34 571.25
Austin United States 6,045 3,960 859.49 744.89

North America

When looking at the top ten locations for gigabit tests in North America, the U.S. dominates with nearly ten times the number of tests as second-place Canada. Mexico comes in a distant third.

North American Countries with the Most Gigabit Speedtest Results
August 1, 2017 – November 28, 2017
Country/Region Number of Tests Number of Users Mean Download (Mbps) Mean Upload (Mbps) GUP
United States 228,475 145,551 866.54 555.09 0.04%
Canada 26,616 16,897 871.46 319.00 0.05%
Mexico 638 520 839.13 754.97 0.00%
Puerto Rico 344 189 828.09 640.15 0.01%
Dominican Republic 36 26 835.04 520.70 0.00%
Guadeloupe 21 15 899.16 239.94 0.00%
Panama 15 7 823.69 72.70 0.00%
Trinidad and Tobago 14 14 827.42 735.84 0.00%
Barbados 12 7 883.45 220.43 0.00%
Martinique 10 7 944.56 238.61 0.00%

Digging deeper into the data, Canada is first place for gigabit user penetration (GUP) in North America with 0.05% of people having received a gigabit speed result. The U.S. has a GUP of 0.04%, Puerto Rico 0.01% and Mexico 0.00%. Gigabit tests pop up elsewhere on the continent, but the numbers are low enough that the service appears to be either prohibitively expensive or available to a very small segment of the population.

Canada, Guadeloupe, Barbados and Martinique have much slower upload speeds than downloads. Asynchronous speeds, when download speed is radically different from upload, like this frequently occur when gigabit is delivered over cable rather than fiber. Panama’s upload speed is especially slow for gigabit service.

Nine ISPs in the U.S. showed more than 1,000 gigabit-level results with AT&T Internet coming out on top. Canada had two ISPs that met the 1,000 test threshold with Rogers having the most.

North American Cities with the Most Gigabit Speedtest Results
August 1, 2017 – November 28, 2017
City Country/Region Number of Tests Number of Users Mean Download (Mbps) Mean Upload (Mbps)
New York United States 14,509 8,637 854.58 667.06
San Francisco United States 8,525 3,899 859.41 733.37
Toronto Canada 7,320 4,319 839.01 627.89
Austin United States 6,045 3,960 859.49 744.89
Houston United States 3,518 2,061 853.92 647.13
Kansas City, MO United States 3,135 2,229 871.52 628.74
Seattle United States 3,040 1,961 822.84 578.96
Charlotte United States 2,934 1,773 856.05 769.20
San Antonio United States 2,901 1,780 861.50 681.93
Dallas United States 2,433 1,499 841.77 729.27

At the city level, all but one of the ten North American cities with the largest number of gigabit tests are in the U.S. This isn’t surprising given the volume of tests in the U.S. versus the rest of the continent. Several of these cities were ranked among the fastest in the U.S. in our recent market snapshot.

Europe

Among the ten European countries with the most gigabit tests, France comes out on top with nearly four times as many tests as second-place Romania.

European Countries with the Most Gigabit Speedtest Results
August 1, 2017 – November 28, 2017
Country/Region Number of Tests Number of Users Mean Download (Mbps) Mean Upload (Mbps) GUP
France 94,269 65,437 877.68 254.05 0.10%
Romania 23,552 14,997 856.94 470.48 0.08%
Hungary 20,487 15,093 867.51 241.52 0.15%
Italy 15,822 9,896 871.29 236.80 0.02%
Switzerland 7,947 6,073 850.61 771.78 0.07%
Ukraine 5,852 4,051 873.57 677.24 0.01%
Netherlands 4,225 3,285 872.46 730.00 0.02%
Denmark 4,223 3,191 860.26 716.82 0.06%
Iceland 3,604 2,446 884.64 860.23 0.71%
Sweden 3,532 2,439 864.62 639.76 0.02%

Gigabit test penetration is another matter entirely with Iceland, the continent’s least populated country, coming first in the world for GUP with 0.71%. Hungary and Monaco are second and third with 0.15% and France is fourth. Lithuania, Jersey, Romania, Switzerland, Luxembourg and Denmark all have GUPs that are higher than any seen in North America.

Italy has a much slower mean upload speed than download for gigabit results. This asynchronicity usually means that gigabit is delivered over cable rather than fiber.

France has the most ISPs with 1,000 or more gigabit test results with four. Orange slightly edges out Bouygues for number of tests. Hungary, Italy and Lithuania have two ISPs apiece that meet the threshold with DIGI having the most in Hungary and Vodafone in Italy. Skynet and Telia are virtually tied in Lithuania. In Romania only Digi showed more than 1,000 gigabit tests during the period. In Ukraine and the U.K. we only saw Lanet and Hyperoptic, respectively, meeting the criteria.

European Cities with the Most Gigabit Speedtest Results
August 1, 2017 – November 28, 2017
City Country/Region Number of Tests Number of Users Mean Download (Mbps) Mean Upload (Mbps)
Paris France 17,211 11,891 860.71 672.39
Bucharest Romania 13,977 8,615 842.61 707.09
Milan Italy 7,184 4,447 855.95 476.41
Budapest Hungary 6,958 4,319 848.34 571.25
Lyon France 4,379 2,962 880.79 219.38
Kiev Ukraine 4,254 2,921 842.36 745.55
Vilnius Lithuania 2,414 1,945 869.76 717.92
Marseille France 2,320 1,530 868.89 400.53
Turin Italy 2,299 1,275 873.64 175.66
Reykjavík Iceland 2,166 1,413 884.52 778.67

The ten European cities with the largest number of gigabit tests are well distributed throughout the continent. France holds three spots with Paris, Lyon and Marseille, while Italy holds two with Milan and Turin. Not surprisingly, most of the remaining cities are capitals of the countries they represent.

Asia

As the city with the most gigabit tests in the world, Hong Kong also tops Asia. Singapore is second, Russia third, and Japan a close fourth.

Asian Countries with the Most Gigabit Speedtest Results
August 1, 2017 – November 28, 2017
Country/Region Number of Tests Number of Users Mean Download (Mbps) Mean Upload (Mbps) GUP
Hong Kong 58,051 15,037 872.99 637.09 0.20%
Singapore 42,469 26,421 886.77 677.34 0.47%
Russia 9,923 7,666 889.75 571.38 0.01%
Japan 9,128 6,600 808.31 645.69 0.01%
South Korea 5,761 4,640 827.78 724.92 0.01%
India 2,760 1,547 874.98 692.43 0.00%
China 2,354 1,524 848.91 435.53 0.00%
Thailand 2,111 1,242 848.46 369.85 0.00%
Israel 1,920 1,137 878.52 488.73 0.01%
Philippines 1,535 980 856.26 569.88 0.00%

Gigabit user penetration (GUP) shows that Singapore has the largest percentage of users with gigabit tests per capita in Asia and the second largest in the world. Hong Kong comes in second in Asia and Macau third. All three beat the GUPs of any country in North America and are competitive with what’s seen in Europe.

Upload speeds in the ten Asian countries with the most gigabit tests are much more consistent with gigabit expectations than they are in North America or Europe which likely means that fiber is prevalent.

Singapore had five ISPs with more than 1,000 gigabit tests with SingTel coming in first for volume. Hong Kong had three with NETVIGATOR showing by far the most tests. India, Russia and South Korea each only showed one ISP that met the 1,000 gigabit test threshold. Those ISPs were ACT, Rostelecom and KT, respectively.

Asian Cities with the Most Gigabit Speedtest Results
August 1, 2017 – November 28, 2017
City Country/Region Number of Tests Number of Users Mean Download (Mbps) Mean Upload (Mbps)
Hong Kong Hong Kong (SAR) 58,051 15,037 872.99 637.09
Singapore Singapore 42,469 26,421 886.77 677.34
Seoul South Korea 3,688 2,971 838.86 661.27
Saint Petersburg Russia 2,021 1,411 853.75 660.11
Hyderabad India 1,416 859 884.32 662.62
Chiyoda Japan 1,336 967 840.09 543.03
Moscow Russia 1,185 896 838.54 690.63
Perm Russia 1,113 883 942.74 327.28
Macau Macau (SAR) 966 384 831.81 845.07
Petah Tikva Israel 813 383 865.03 580.17

As Hong Kong and Singapore top the list of cities with the highest gigabit test volume in the world, they also win Asia. Russia has three cities on the list.

Australasia

New Zealand has ten times as many gigabit speed tests as Australia. No other country in Australasia showed gigabit tests during the period we studied.

Australasian Countries with the Most Gigabit Speedtest Results
August 1, 2017 – November 28, 2017
Country/Region Number of Tests Number of Users Mean Download (Mbps) Mean Upload (Mbps) GUP
New Zealand 10,832 6,458 866.91 464.42 0.13%
Australia 956 726 903.62 621.10 0.00%

New Zealand’s gigabit user penetration (GUP) was a globally competitive 0.13% while Australia’s barely registered.

Mean upload speed on gigabit tests in Australia are faster than those in New Zealand, though both countries show competitive speeds which likely means that gigabit service is delivered over fiber.

In New Zealand we saw two ISPs that topped the 1,000 gigabit test threshold we set with MyRepublic slightly edging out Spark in gigabit test volume. No ISP in Australia showed 1,000 or more gigabit results in the period we studied.

Australasian Cities with the Most Gigabit Speedtest Results
August 1, 2017 – November 28, 2017
City Country/Region Number of Tests Number of Users Mean Download (Mbps) Mean Upload (Mbps)
Auckland New Zealand 4,842 2,681 861.30 498.28
Christchurch New Zealand 1,402 706 865.43 452.40
Wellington New Zealand 763 465 830.37 400.74
Lower Hutt New Zealand 551 361 846.45 384.60
Dunedin New Zealand 386 242 850.17 378.93
Hamilton New Zealand 385 188 871.34 506.14
Sydney Australia 172 101 907.97 678.12
Porirua New Zealand 122 86 834.68 349.24
Tauranga New Zealand 113 69 861.28 484.67
Tamahere New Zealand 61 48 873.57 477.33

All but one of the cities with the highest volume of gigabit tests in Australasia were in New Zealand with Auckland coming in first, Christchurch second and Wellington third. Sydney represents for Australia at seventh.

South America

South America has about one tenth the number of gigabit results compared to Australasia. Brazil has the most, while Peru, Argentina, Chile and Colombia show enough tests to indicate that gigabit service is available but not at all common. We saw a scattering of tests in Paraguay, Bolivia and Ecuador, but they were sparse enough that we’re not prepared to say gigabit internet is truly available in those countries.
South American Countries with the Most Gigabit Speedtest Results
August 1, 2017 – November 28, 2017
Country/Region Number of Tests Number of Users Mean Download (Mbps) Mean Upload (Mbps) GUP
Brazil 643 466 844.87 683.65 0.00%
Peru 139 121 842.75 657.95 0.00%
Argentina 98 88 852.33 549.25 0.00%
Chile 95 70 842.88 751.91 0.00%
Colombia 89 63 844.74 655.26 0.00%

No country in South America showed a gigabit user penetration (GUP) that rounded higher than 0.00%, but mean upload speeds on gigabit tests were more consistently strong in all countries than on any other continent which we would expect to be true if gigabit was delivered over fiber.

Similarly, because of the overall volume of tests, we saw no ISP with more than 1,000 tests.
South American Cities with the Most Gigabit Speedtest Results
August 1, 2017 – November 28, 2017
City Country/Region Number of Tests Number of Users Mean Download (Mbps) Mean Upload (Mbps)
Rio de Janeiro Brazil 76 62 825.36 810.89
Buenos Aires Argentina 62 53 863.71 604.84
Santiago Chile 61 54 841.49 745.66
Bogotá Colombia 58 37 826.31 684.34
San Miguel Peru 52 48 836.41 561.17
Salvador Brazil 46 41 787.51 735.29
San Borja Peru 32 32 857.22 847.14
São Paulo Brazil 30 26 819.34 626.76
Santana de Parnaíba Brazil 26 10 880.58 840.19
Santiago de Surco Peru 23 23 858.76 805.75

While the number of tests in all cities in South America is low, Brazil boasts not only the city with the largest number of gigabit tests (Rio), but three other cities on the above list. Buenos Aires, Argentina and Santiago, Chile are neck and neck for second in test volume. Peru has three cities on the list.

Africa

For the most part, gigabit-speed internet does not seem to have come to Africa. South Africa is the main exception as the only country with more than 100 gigabit results during the period we studied. Kenya, Algeria, Namibia and Reunion show enough results to suggest that an elite few have access to gigabit speeds. We can’t say whether that’s for reasons of infrastructure or price. We also spotted Gigabit results in Botswana, Egypt, Ghana, Mauritius and Nigeria, but those were very rare and not necessarily indicative that gigabit service is available.

African Countries with the Most Gigabit Speedtest Results
August 1, 2017 – November 28, 2017
Country/Region Number of Tests Number of Users Mean Download (Mbps) Mean Upload (Mbps) GUP
South Africa 560 383 859.06 556.61 0.00%
Kenya 46 39 803.20 581.40 0.00%
Algeria 34 32 799.76 575.62 0.00%
Namibia 21 16 833.33 622.48 0.00%
Reunion 18 13 823.89 357.91 0.00%

No country in Africa showed a gigabit user penetration (GUP) that rounded higher than 0.00% and the test volume was low enough that no ISP had more than 1,000 gigabit results.

African Cities with the Most Gigabit Speedtest Results
August 1, 2017 – November 28, 2017
City Country/Region Number of Tests Number of Users Mean Download (Mbps) Mean Upload (Mbps)
Cape Town South Africa 153 120 864.69 723.17
Johannesburg South South Africa 136 103 856.19 484.43
Sandton South Africa 65 32 817.85 499.56
Randburg South Africa 52 30 854.43 385.01
Nairobi Kenya 45 38 801.11 590.09
Pretoria South Africa 34 21 859.63 463.39
Windhoek Namibia 21 16 833.33 622.48
Johannesburg South Africa 18 11 796.53 214.87
Krugersdorp South Africa 15 7 834.64 99.52
Midrand South Africa 14 10 918.12 738.05

All but two of the African cities with the largest volume of gigabit tests are in South Africa. Cape Town comes in first for test volume with Johannesburg South second and Sandton third. Nairobi represents for Kenya and Windhoek for Namibia.

Are you seeing gigabit-level service that we missed? Take a Speedtest on our desktop app for MacOS or Windows so we can count you in when we update our data.

Ookla retains ownership of this article including all of the intellectual property rights, data, content graphs and analysis. This article may not be quoted, reproduced, distributed or published for any commercial purpose without prior consent. Members of the press and others using the findings in this article for non-commercial purposes are welcome to publicly share and link to report information with attribution to Ookla.

| May 14, 2019

Ookla’s New 5G Map Tracks 5G Rollouts across the Globe

After years of preparation, 5G is finally rolling out in city after city around the world. Also known as “Fifth Generation” Wireless Technology, 5G is the biggest thing to come to mobile after nearly a decade of 4G LTE, offering theoretical speeds up to 5 times faster. Not every city currently benefits, however, as 5G availability depends on a variety of factors including government regulation and technological improvements by mobile operators. If you’re as eager as we are to see which cities are 5G ready, you’ll love the Ookla 5G Map™.

Introducing the Ookla 5G Map™

The interactive Ookla 5G Map tracks 5G rollouts in cities across the globe. We update the map weekly with the information available to us about 5G deployments as they occur.

5g-map-global-5

Click on an individual pin to see more detailed information including city name, a list of operators who have rolled out 5G, and the status of the 5G network in the area. The status is divided into two types of availability: limited and commercial. Limited availability is when a 5G network is present but devices are limited to select users, usually in a testing environment. Commercial availability refers to a 5G network where any consumer can purchase a device for use on this network.

5g-map-pin-3

At this point all of the deployments we’ve mapped are 5G New Radio (NR). To learn more about the types of 5G and other network intricacies, visit our comprehensive 5G guide. As different types of networks launch we’ll continue to expand this map to provide you with accurate, in-depth information.

Currently, the majority of identified deployments are based on corporate press releases and other publicly available communications. As deployments continue to become commercially available and tests taken with Speedtest use a 5G connection, identified deployments will also be based on Ookla data.

Get regular updates on the progress of 5G by following @Ookla5GMap on Twitter where we will share network rollouts as they are added. You can also find this Twitter feed directly to the right of the interactive 5G map where the ten most recent updates will be displayed.

Where we’ve seen 5G so far

5g-pull-quote

At time of launch, we’ve identified 20 operators that have deployed 5G networks in 294 locations across the globe. As certain locations benefit from multiple rollouts, the total number of deployments comes to 303. Swiss operators Swisscom and Sunrise are leading the 5G charge by providing 5G network accessibility in a combined total of 217 cities, each with commercial availability. Across the ocean, 21 cities in the United States have 5G availability. All but two of these rollouts being launched by AT&T with limited availability. Verizon launched their 5G network with commercial availability in two Midwest cities: Chicago and Minneapolis.

Switzerland-Map-3

In South Korea we are tracking 16 cities with limited availability and two with commercial availability for 18 total 5G rollouts. The country’s capital city of Seoul benefits from 5G accessibility served by all three major operators: SK Telecom, LG Uplus and KT Telecom.

south-korea-map-3

Telstra and Optus in Australia operate limited availability 5G networks in 10 cities, many of these in the more populated coastal regions. We’re also tracking 5G rollouts in a number of European countries (Estonia, Finland, Spain and Italy) as well as in Qatar, South Africa and United Arab Emirates.

australia-map-1

If you’re a consumer who is already on 5G, share your Speedtest results by tweeting to @Speedtest.

If you are an operator planning to release your 5G network, we welcome your feedback. Tweet details of your release @Ookla5GMap or e-mail press@ookla.com and we will add your location to the map when it’s live. In the meantime, our researchers will be hard at work tracking global 5G announcements as they happen.

Editor’s note: This article was updated on May 14, 2019 to clarify the number of deployments in Switzerland and Australia versus the number of cities served. We’ve also since updated the map to include a new “Pre-Release” status. Check the Ookla 5G Map for the latest information.

Ookla retains ownership of this article including all of the intellectual property rights, data, content graphs and analysis. This article may not be quoted, reproduced, distributed or published for any commercial purpose without prior consent. Members of the press and others using the findings in this article for non-commercial purposes are welcome to publicly share and link to report information with attribution to Ookla.