
It’s back to school in the U.S., which can only mean it’s time for the college football season. We care about those long-standing rivalries as much as you do, and we couldn’t wait until game day to pit our favorite teams against each other. So we found a new angle for all that “my team is better than yours” energy: who has the fastest campus Wi-Fi speeds?
To get a pregame answer to “who’s the best?” we looked at download speed for all Wi-Fi Speedtest results. We limited data to those from the internet service provider (ISP) for each campus for the first half of 2018. For context, the average Wi-Fi download speed in the U.S. was 81.91 Mbps during Q1-Q2 2018.
Old Wagon Wheel (October 5, 2018)

Utah is home to the first big grudge match of the year and it’s here that we find Utah State’s Wi-Fi is more than twice as fast as BYU’s. Sorry, Cougars! It’s worth noting that Utah State has the fastest Wi-Fi of any campus discussed in this article. Utah State’s Wi-Fi is even 36.8% faster than the average Wi-Fi download speed for the state of Utah in Q1-Q2 2018.
Florida State–Miami (October 6, 2018)
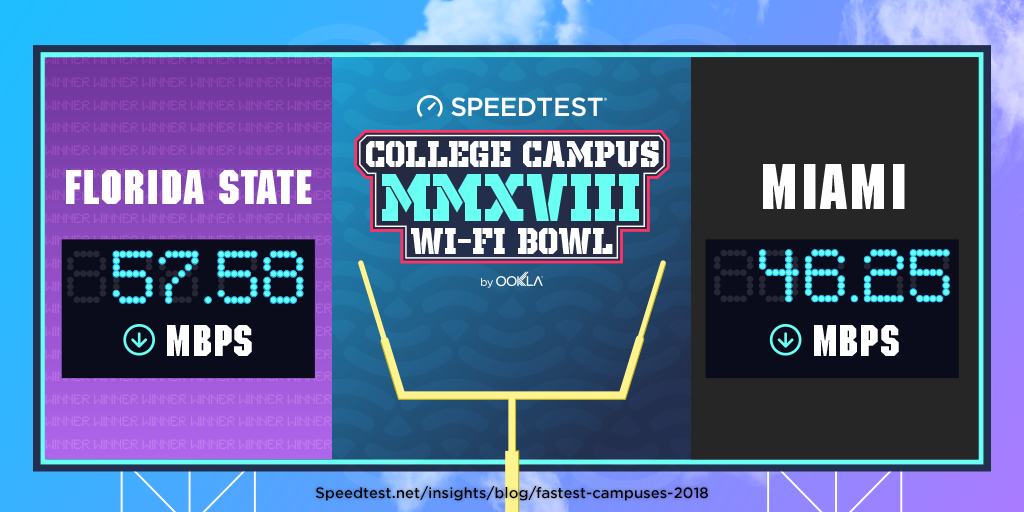
Our next matchup pits the Florida State Seminoles against the Miami Hurricanes in a rivalry that’s often one of the most-watched football games. If you’re watching that game over Wi-Fi, though, you’ll want to do it from the Tallahassee campus because their Wi-Fi is 24.5% faster than what you’ll find at the University of Miami. Even though that’s 24.2% slower than the state of Florida’s average Wi-Fi speed of 75.96 Mbps during the same period.
Red River Showdown (October 6, 2018)
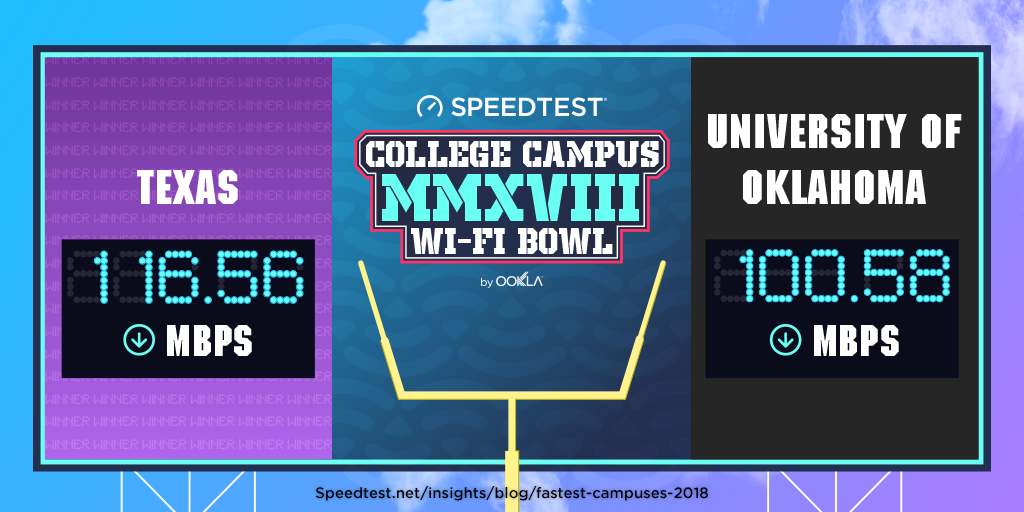
For over 100 years, the Oklahoma Sooners have been battling the Texas Longhorns. We can’t say who will win the THREE trophies awarded to the winner of this year’s game, but we can say that on the Wi-Fi front it’s Texas for the win (though both schools have speeds worth bragging about).
Third Saturday in October (October 20, 2018)
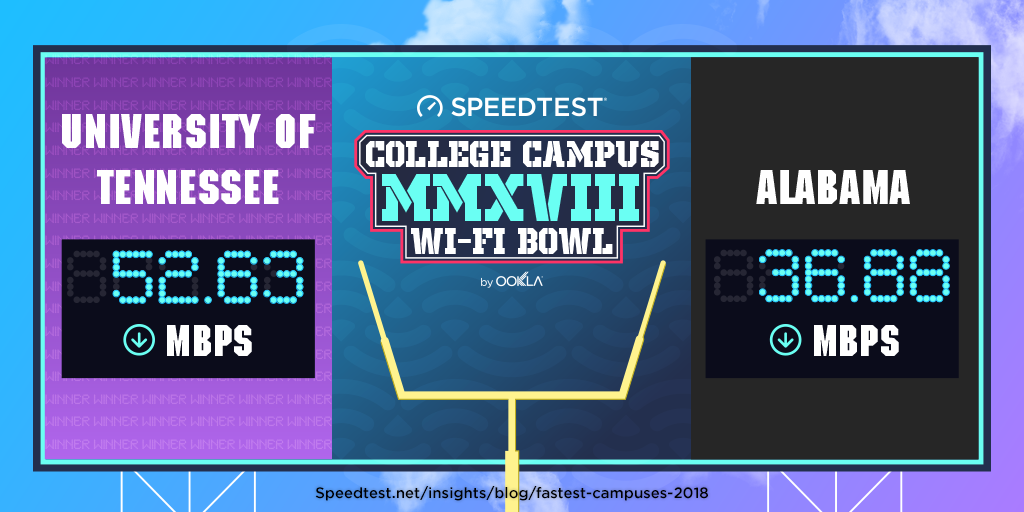
When Alabama’s Crimson Tide meets the Tennesseee Volunteers on the field in Knoxville this year, they will be coming from behind (at least when it comes to Wi-Fi speeds). That’s because the average download speed on the University of Tennessee campus network is 42.7% faster than at Alabama.
World’s Largest Outdoor Cocktail Party (October 27, 2018)
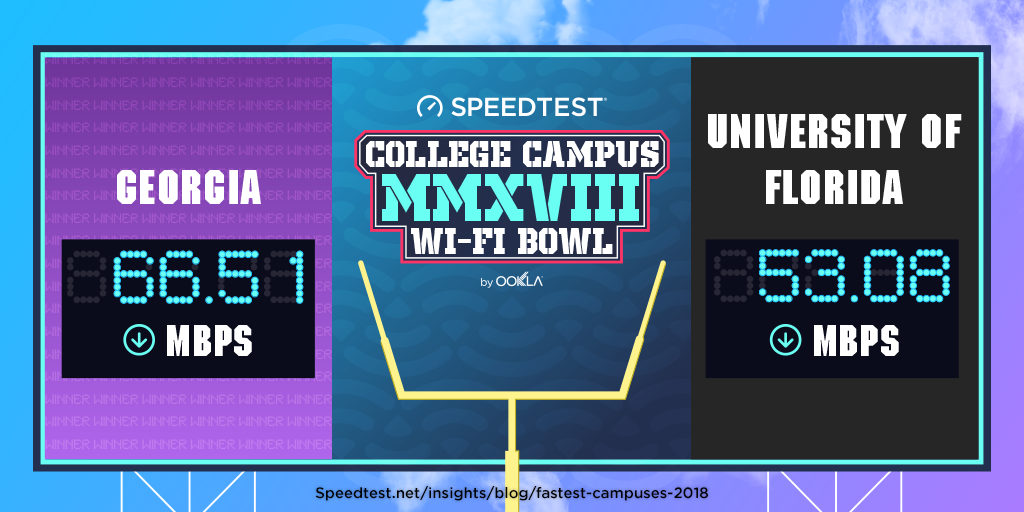
What will the crowd be discussing as they tailgate in advance of the Florida-Georgia game? Georgia Bulldog fans might be bragging about their Wi-Fi speeds, which are 23.8% faster than those at the University of Florida. Don’t bring it up among the Florida Gators, though. Unless you want ‘em to get fighting mad.
Saban Bowl (November 3, 2018)
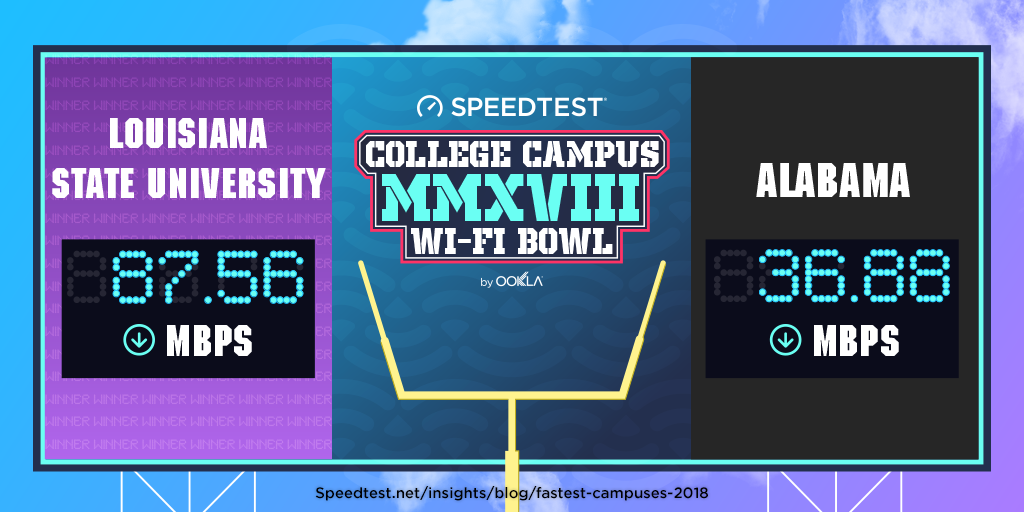
We already know from the Third Saturday in October that Wi-Fi speeds are a sore subject for Alabama fans. Hopefully they’ll have won the game against the Tennessee Volunteers because their Wi-Fi matchup with the LSU Tigers is even more brutal. The average download speed over Wi-Fi on the Louisiana State University network is 137.4% faster than on Alabama’s.
Bedlam Series (November 10, 2018)

The Oklahoma Sooners couldn’t beat the Texas Longhorns when it came to Wi-Fi download speed, but they’ve got the Oklahoma State Cowboys nicely handled with a 14.5% lead in this intrastate rivalry. Still, considering that the average Wi-Fi download speed for the state of Oklahoma was 67.58 Mbps during the same period, both these schools are doing well.
Big Game (November 17, 2018)
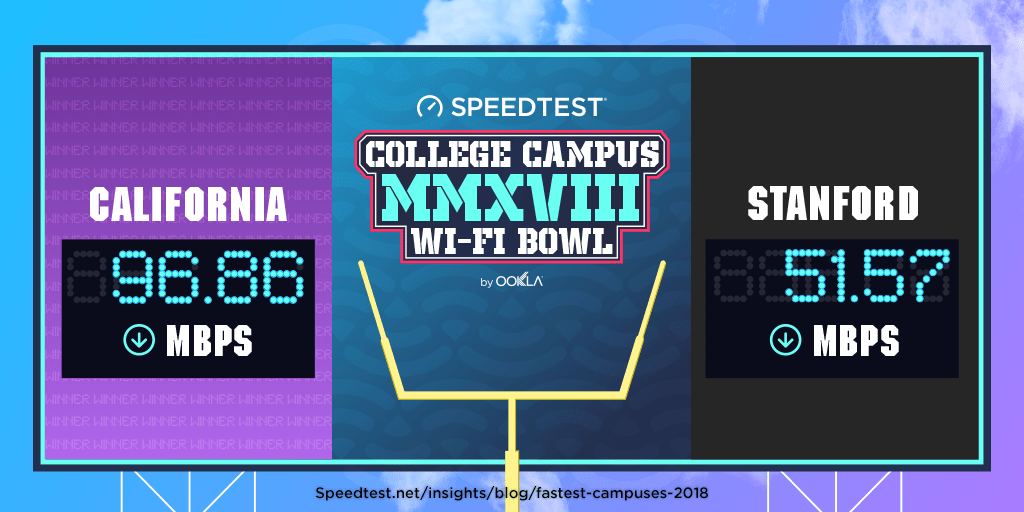
The California Golden Bears have met the Stanford Cardinal team on the field 120 times but we’re pretty sure this is the first time they’re face to face on Wi-Fi speeds. We were a little surprised to find how thoroughly California trounces Stanford with an 87.8% lead when it comes to download speed. For comparison, the state of California showed a mean Wi-Fi download speed of 87.71 Mbps in Q1-Q2 2018.
The Game (November 17, 2018)
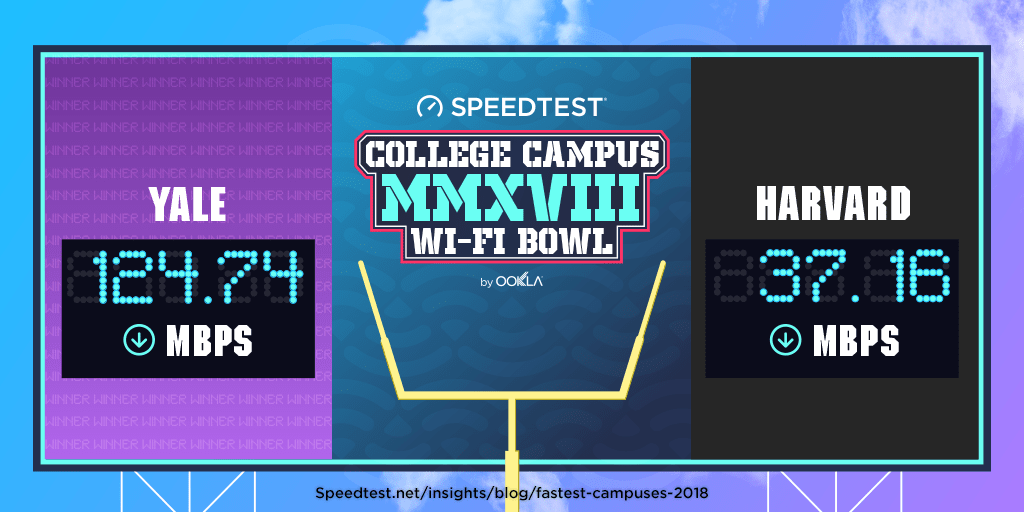
If Wi-Fi was football (and we admit it’s not), it would take a hail mary for Harvard to beat Yale with Wi-Fi speeds like these. We’re not going to rub in this defeat by calculating the percentage here.
The Crosstown Showdown (November 17, 2018)
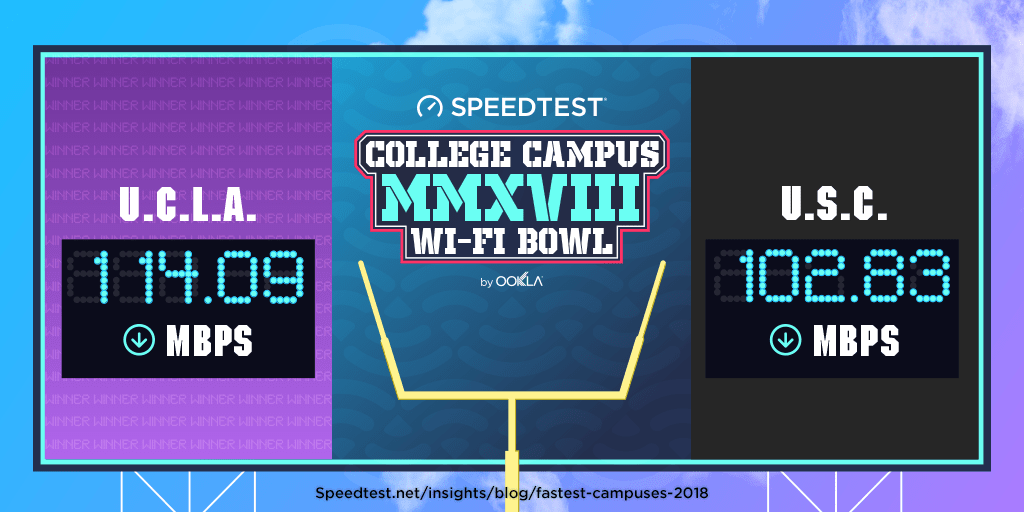
Yes, we know no one actually calls it this, but it’s catchy, right? We love to see a close match-up like this when it comes to Wi-Fi speeds. If download was the only determinant, the Victory Bell would be painted blue (this year) to honor UCLA’s win. Both schools well outpace L.A.’s average Wi-Fi download speed of 86.17 Mbps during the same period.
Apple Cup (November 23, 2018)
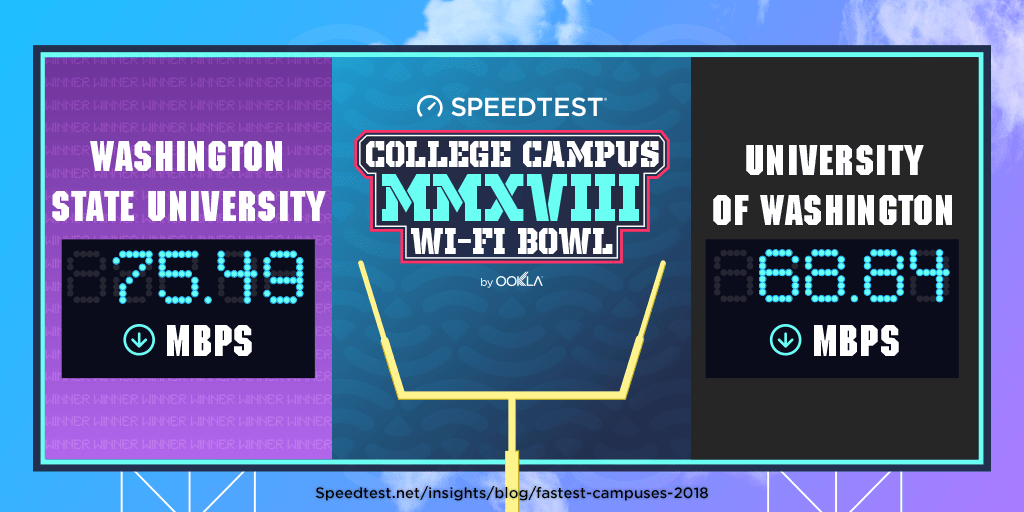
As Ookla’s headquarters are located in Seattle, this one’s personal for us. All dirt roads may lead to Pullman, but the office Dawgs have to concede that Wazzu has the better Wi-Fi download speed. With an average download speed of 94.34 Mbps over Wi-Fi for Washington state as a whole, both schools have some room to make up.
Civil War (November 23, 2018)

Oregon may lead this 124-year-old rivalry when it comes to football games, but the Oregon State Beavers have it when it comes to Wi-Fi download speed with a 66.6% lead over the Oregon Ducks. For comparison, the average Wi-Fi download speed in Oregon state was 82.25 Mbps during the same period.
Clean, Old-Fashioned Hate (November 24, 2018)
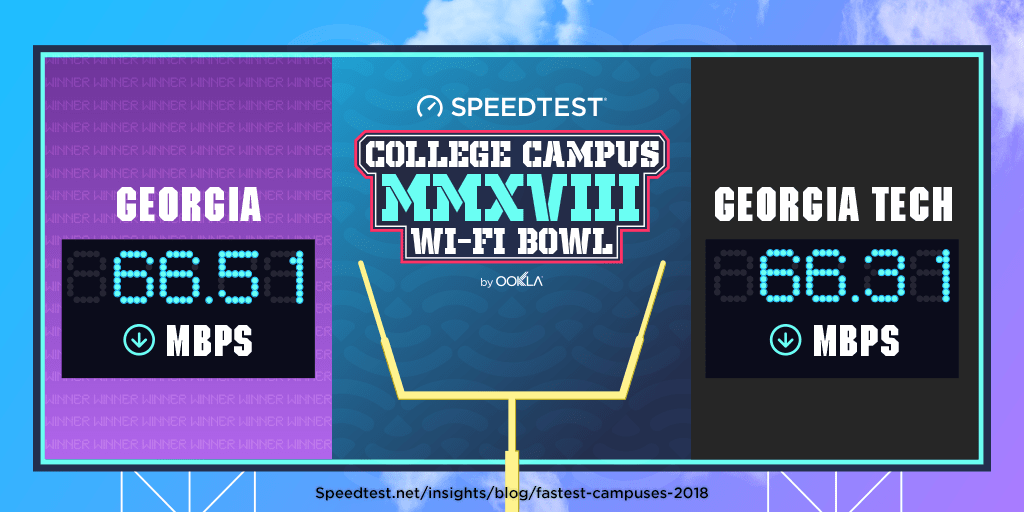
Clean, old-fashioned hate indeed. The Wi-Fi contest between Georgia and Georgia Tech is technically too close to call. Well done Georgia Bulldogs and Georgia Tech Yellow Jackets! Both schools are relatively far behind the state of Georgia’s average of 80.02 Mbps for Wi-Fi downloads in Q1-Q2 2018.
Duel in the Desert (November 24, 2018)
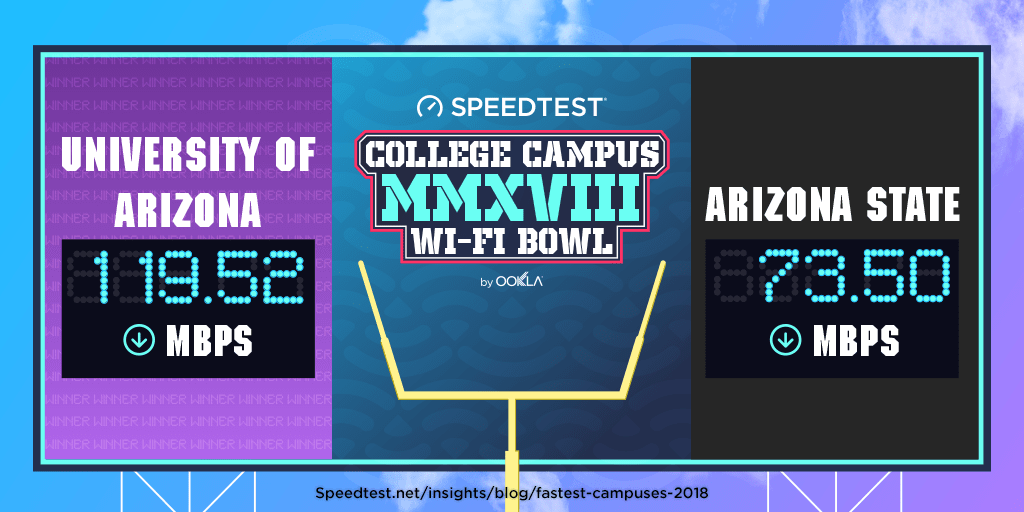
If the Territorial Cup was awarded for fastest Wi-Fi, it would go to the Arizona Wildcats who have a 62.6% lead in download speed over the Arizona State Sun Devils (and the fourth fastest campus Wi-Fi of any school in this article). In case you’re wondering, the average Wi-Fi download speed in the state of Arizona was 83.71 during the same period.
Iron Bowl (November 24, 2018)
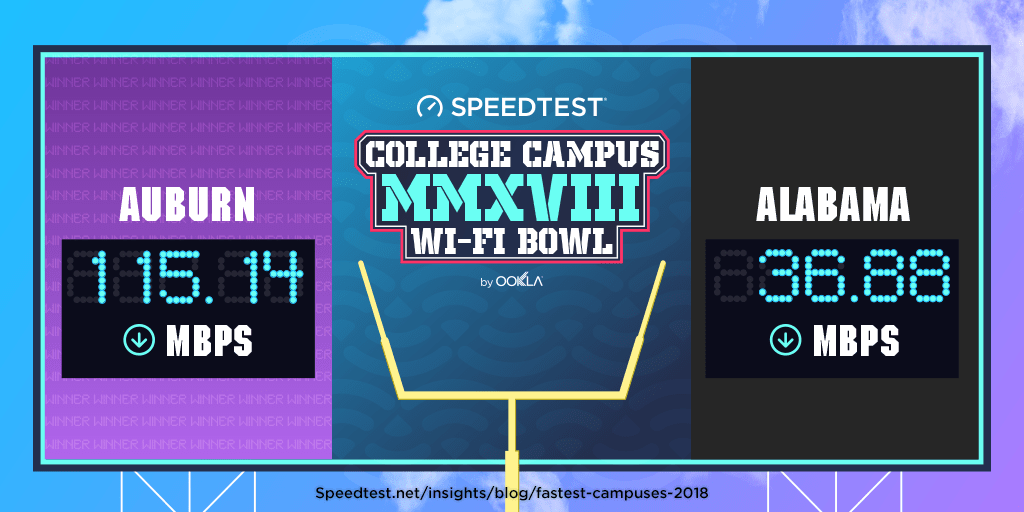
Poor Alabama, if you didn’t have so many rivalries… Auburn for the win here as the Tigers come in with a blazing fast Wi-Fi download speed on their campus network. At least Alabama’s Crimson Tide rocks football? The state of Alabama’s average download speed over Wi-Fi was 58.58 Mbps.
Notre Dame–USC (November 24, 2018)
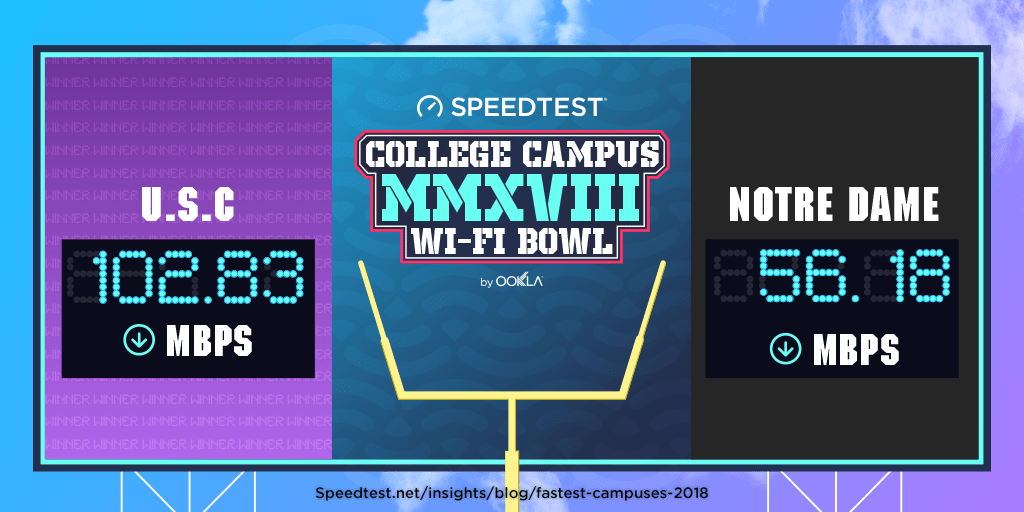
We’re sorry to say that Notre Dame would not be awarded the Jeweled Shillelagh if this game was based on Wi-Fi speed, as the USC Trojans dominate with an 83.0% faster download speed on their campus network than the Fighting Irish.
Paul Bunyan’s Axe (November 24, 2018)
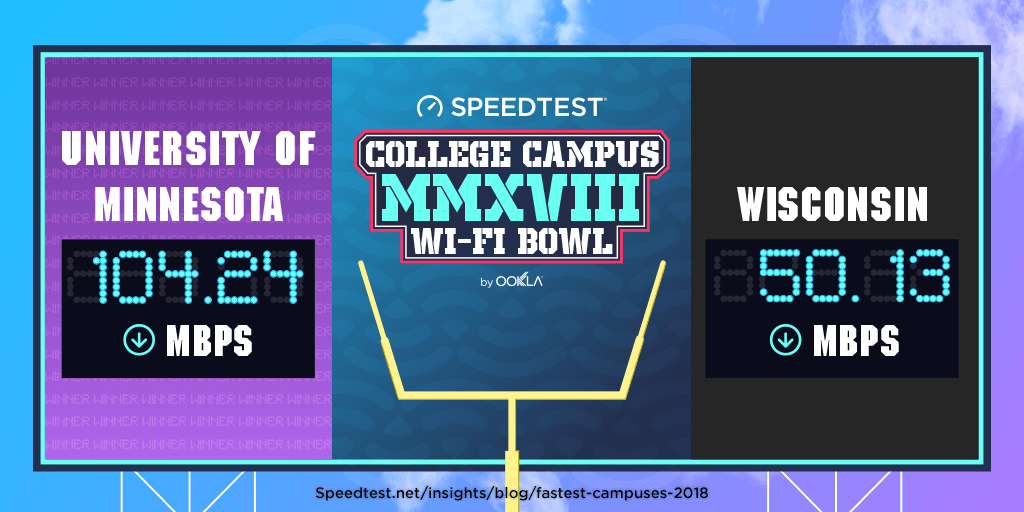
No one was worried about Wi-Fi when the Minnesota Golden Gophers and the Wisconsin Badgers first met on the field back in 1890. Wisconsin should start worrying now, though, because the download speed on Minnesota’s campus network is less than half of what Wisconsin enjoys.
Backyard Brawl (September 3, 2022)
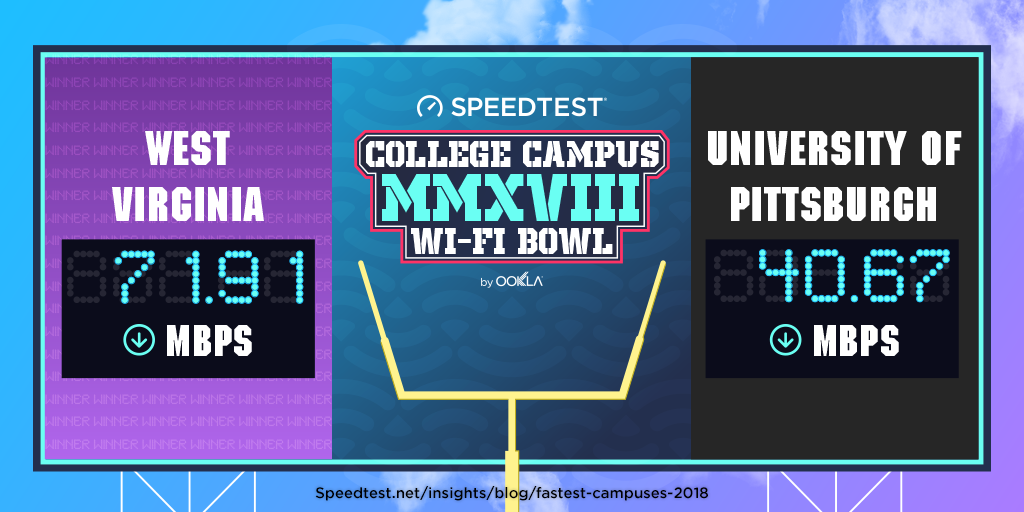
You might have to wait until 2022 to watch the Pittsburgh Panthers kick off against the West Virginia Mountaineers, but we can tell you right now which of the two campuses has the fastest Wi-Fi: West Virginia University by 76.8%.
Texas–Texas A&M (in memoriam)
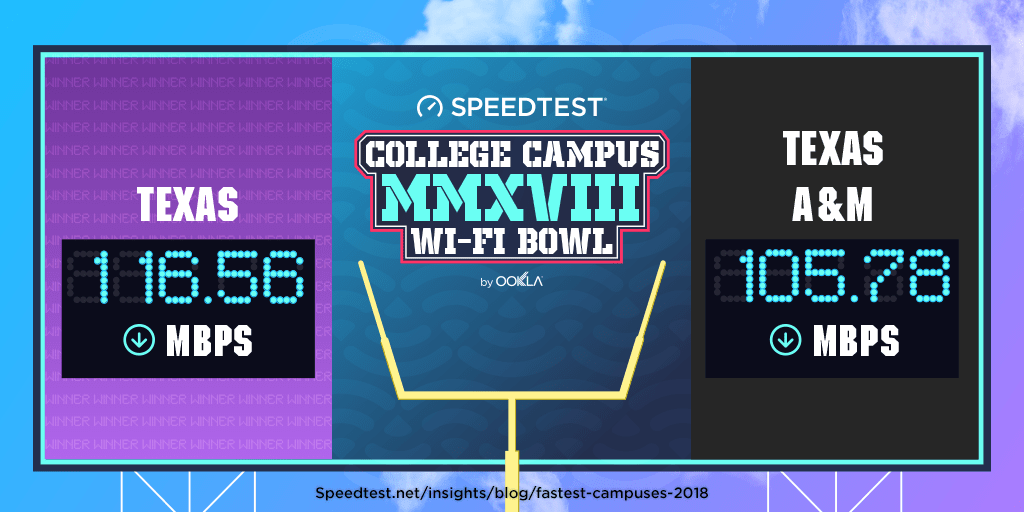
Unless there’s some conference rearrangement, we may never get to watch Texas A&M’s Aggies play the Texas Longhorns again. But this rivalry dies hard in Texas (and anywhere else fans bleed orange or maroon). If the campuses were to face off today using Wi-Fi download speed alone, the Longhorns would have it. Hook ‘em.
Both campuses do well to beat the state of Texas’s 88.85 Mbps average download speed over Wi-Fi.
A full look at the campus Wi-Fi standings
To understand where the campus Wi-Fi networks we examined rank overall, we compiled all the above results. Oregon State takes first place, Utah State second and Yale third. On the other end of the spectrum, the University of Alabama was in last place, Harvard was second to last and the University of Pittsburgh third to last.
| Campus | Mean Download (Mbps) |
|---|---|
| Oregon State University | 128.90 |
| Utah State University | 125.46 |
| Yale | 124.74 |
| University of Arizona | 119.52 |
| University of Texas, Austin | 116.56 |
| Auburn University | 115.14 |
| UCLA | 114.09 |
| Texas A&M | 105.78 |
| University of Minnesota | 104.24 |
| University of Southern California | 102.83 |
| University of Oklahoma | 100.58 |
| University of California, Berkeley | 96.86 |
| Oklahoma State University | 87.86 |
| Louisiana State University | 87.56 |
| University of Oregon | 77.37 |
| Washington State University | 75.49 |
| Arizona State University | 73.50 |
| West Virginia University | 71.91 |
| University of Washington | 68.84 |
| Brigham Young University | 67.42 |
| University of Georgia | 66.51 |
| Georgia Tech | 66.31 |
| Ohio State University | 62.14 |
| Florida State University | 57.58 |
| University of Notre Dame | 56.18 |
| University of Florida | 53.08 |
| University of Tennessee | 52.63 |
| Stanford | 51.57 |
| University of Wisconsin, Madison | 50.13 |
| University of Miami | 46.25 |
| University of Pittsburgh | 40.67 |
| Harvard | 37.16 |
| University of Alabama | 36.88 |
Is your favorite team not listed here (ahem, Clemson, Michigan, Lehigh)? Take a Speedtest using the Wi-Fi on your campus network, and we’ll check back next year to see how the rivalries stack up.
Ookla retains ownership of this article including all of the intellectual property rights, data, content graphs and analysis. This article may not be quoted, reproduced, distributed or published for any commercial purpose without prior consent. Members of the press and others using the findings in this article for non-commercial purposes are welcome to publicly share and link to report information with attribution to Ookla.