| July 17, 2020

Cloudflare Outage Takes Out the Internet

Users in the United States and Europe experienced what appeared to be an internet outage on Friday afternoon, Pacific Daylight Time. What turned out to be an issue at Cloudflare took down a large number of websites and online services across the internet. Downdetector® was also briefly impacted by Cloudfare’s outage, during which time users in the U.S. and Europe were unable to reach the site. Users reported having issues with the following:

  • 4chan
  • Amazon
  • Amazon Web Services
  • Arlo
  • AT&T
  • Bandwidth
  • Canva
  • Cash App
  • CenturyLink
  • Chime
  • Cloudflare
  • Coinbase
  • Comcast
  • Cox
  • Crunchyroll
  • Destiny
  • Discord
  • Doordash
  • Escape from Tarkov
  • Facebook
  • Frontier
  • Gmail
  • Google
  • Google Cloud
  • Grindr
  • Grubhub
  • League of Legends
  • Minecraft
  • Optimum / Cablevision
  • Path of Exile
  • Patreon
  • Peloton
  • Playstation Network
  • PlentyOfFish
  • Plex
  • Postmates
  • Quizlet
  • RCN
  • Reddit
  • Roblox
  • Shopify
  • Sling
  • Spectrum
  • Spotify
  • Sprint
  • Steam
  • Streamlabs
  • Suddenlink
  • T-Mobile
  • Twitch
  • Twitter
  • Uber Eats
  • Udemy
  • Valorant
  • Venmo
  • Verizon
  • Wattpad
  • Wave Broadband
  • Webs
  • WOW
  • WP Engine
  • Xbox Live
  • Youtube
  • Zendesk
  • Zoom

Cloudflare is a content delivery network (CDN) that is relied upon by many industry leaders to deliver portions of their websites. That means when Cloudflare goes down, even briefly as we saw today, large sections of the internet are affected.

Ookla retains ownership of this article including all of the intellectual property rights, data, content graphs and analysis. This article may not be quoted, reproduced, distributed or published for any commercial purpose without prior consent. Members of the press and others using the findings in this article for non-commercial purposes are welcome to publicly share and link to report information with attribution to Ookla.

| July 8, 2020

U.S. Internet Speeds Increase 15.8% on Mobile and 19.6% on Fixed Broadband

The Q2 2020 Speedtest® United States Market Report by Ookla® is based on Speedtest Intelligence® data from over 1.6 million unique mobile user devices and 18.9 million fixed broadband devices performing more than 85.1 million consumer-initiated tests on Speedtest apps in the U.S. during the period.

Data from Speedtest Intelligence reveals median download speed over mobile in the U.S. increased 15.8% between Q2 2019 and Q2 2020 to 29.00 Mbps. The median upload speed for mobile was 5.74 Mbps, down 15.2% from Q2 2019.

Median download speed over fixed broadband increased 19.6% during the last year to 86.04 Mbps in Q2 2020, and median upload speed increased 1.5% to 11.86 Mbps in Q2 2020.

We saw a decline in mobile and fixed broadband download speeds in early March as consumer behavior shifted in response to the pandemic. Speeds have since rebounded on both mobile and fixed broadband. Read our week-by-week view of COVID-19’s impact on internet performance.

AT&T is fastest and most consistent

US_Report_Fastest_Mobile_Provider_June_2020

With a Speed Score of 41.23, AT&T was the fastest operator in competitive geographies in the U.S. during Q2 2020. AT&T also had the highest Consistency Score with 79.7% of Speedtest® results meeting or exceeding speed thresholds of 5 Mbps for download and 1 Mbps for upload.

To learn more about how operators performed for 4G Availability and latency, read the full report.

Mobile operators doubled down on 5G

All major U.S. operators were focused on implementing 5G over the past year.
AT&T continued to roll out its millimeter wave “5G+” network in parts of major cities. In addition, AT&T repurposed its 850 MHz low-band spectrum, previously used for 3G service, in parts of 30 states to offer improved 5G coverage.

Verizon launched new 5G markets and expanded its millimeter wave “Ultra Wideband” 5G footprint in parts of 35 cities. Verizon recently completed Dynamic Spectrum Sharing (DSS) field trials, and is expected to start leveraging its sub-6GHz spectrum for 5G by the end of the year.

In June 2019, T-Mobile launched their millimeter wave 5G in parts of six markets, followed by the nationwide rollout of 5G in the 600 MHz band to cover more than 200 million users. With the successful completion of the Sprint merger, T-Mobile accelerated the rollout of 5G in the 2.5 GHz band, which became commercially available in Philadelphia and New York City.

For specific information about how flagship phones performed and how speeds compare by manufacturer, read the full report.

Verizon has the fastest fixed broadband

US_Fastest_Fixed_Providers_June_2020
With a Speed Score of 117.14, Verizon had the fastest fixed broadband in the U.S. during Q2 2020. Verizon also had the lowest median latency at 9 ms. Spectrum provided the most consistent internet experience with a Consistency Score of 84.4%.

D.C. fastest for mobile, New Jersey for fixed

Analyzing performance at the state level, the District of Columbia showed the fastest median download speed on mobile during Q2 2020, while New Jersey showed the fastest median download speed over fixed broadband during the same period.

Pittsburgh, Pennsylvania was the fastest city in the U.S. for mobile during Q2 2020 while Kansas City, Missouri was the fastest city for fixed broadband.

Read our full report for full rankings in all fifty states and the 100 most populous cities in the country. We also include data on providers’ performance in states and major cities.

Ookla retains ownership of this article including all of the intellectual property rights, data, content graphs and analysis. This article may not be quoted, reproduced, distributed or published for any commercial purpose without prior consent. Members of the press and others using the findings in this article for non-commercial purposes are welcome to publicly share and link to report information with attribution to Ookla.

| June 16, 2020

June is Already a Tough Month for International Mobile Operators

On June 15, Downdetector® received numerous reports that T-Mobile was down in the United States. The peak of the outage reports on that day came in around 12:00 pm, PST. There were 113,980 reports during that peak. Soon after, users began reporting issues with AT&T and Verizon (and other smaller operators) as well, though in much smaller numbers (3,861 and 8,619 reports, respectively, at around 1:30 pm, PST).
Downdetector_Outage_T-mobile_effects_0620-2

The relative volume of reports by other operators shown in this chart suggests that, while the major outage was on T-Mobile’s network, customers of other operators may also have been impacted when they tried to contact T-Mobile customers and encountered errors. While we cannot definitively identify the root causes of yesterday’s issues reported by customers of all major U.S. mobile operators, it is valuable for operators to know when their customers are experiencing connectivity difficulties so they can respond appropriately. Even if the root issue does not exist within their network. Access to detailed information about all the outages in a particular ecosystem, as provided on Downdetector, can help consumers and customer support providers focus on where the actual problem lies.

We saw a similar effect in the United Kingdom on June 9 when Vodafone suffered an outage. Downdetector data indicated 9,686 reports from users during the peak at 4:45 GMT. At around the same time, EE users submitted 411 reports to Downdetector while we saw 519 reports from O2 customers and 322 reports from customers of Three in separate spikes throughout the same day.
Downdetector_Outage_Vodafone_effects_0620-1

This is a good reminder that if you’re encountering difficulty in connecting with your mobile operator, it’s worth checking Downdetector as well as trying other online services and apps to see where the real outage lies.

Ookla retains ownership of this article including all of the intellectual property rights, data, content graphs and analysis. This article may not be quoted, reproduced, distributed or published for any commercial purpose without prior consent. Members of the press and others using the findings in this article for non-commercial purposes are welcome to publicly share and link to report information with attribution to Ookla.

| March 2, 2020

Major Outages Seen in Financial Services Companies

The financial markets have had a very challenging week with various news headlines driving major drops to stock exchanges across the globe. Consumers who manage their own investments faced an additional frustration today as financial sites including TD Ameritrade, Robinhood and E*Trade showed major outages according to Downdetector.

Downdetector_Outage_E-trade_TD-Ameritrade_Robinhood_march1-2

TD Ameritrade had an initial spike on March 1 and a recurrence of outage reports early in the day on March 2 when all three companies showed problems right around the time of the NYSE’s opening bell. Robinhood showed the largest number of outages by far and the most consistent duration of reports. E*Trade showed a spike in problems early with a decline in reports as the morning wore on. TD Ameritrade had two peaks in outage reports very close together early on March 2 then appeared to recover partially just before a third spike. At this writing, Robinhood is continuing to show major outage reports.

Downdetector data can help your team resolve service issues faster and improve customer experience when an outage occurs, which becomes all the more important during periods of high usage. Contact us here to learn how your network operations center can get faster outage detection.

Ookla retains ownership of this article including all of the intellectual property rights, data, content graphs and analysis. This article may not be quoted, reproduced, distributed or published for any commercial purpose without prior consent. Members of the press and others using the findings in this article for non-commercial purposes are welcome to publicly share and link to report information with attribution to Ookla.

| February 27, 2020

Illustrating a Year of Mobile and Fixed Broadband Improvements Around the World (Poster Download)

Mobile and fixed broadband networks change so rapidly it’s easy to overlook how much providers around the world are improving performance and connectivity every year. In celebration of your efforts, we’ve created a downloadable poster that highlights some major industry achievements during 2019.

Mobile operators rolled out more than 6,600 5G deployments

Ookla_Mobile-Speeds-Poster_2020
5G was a key effort for many providers around the globe, with 6,629 deployments in 2019. We also saw download speeds increase in most countries. The poster highlights some specific achievements, like Bosnia and Herzegovina’s 359% increase in speed. Visit the Speedtest Global IndexTM to learn even more and to watch worldwide mobile performance continue to improve throughout 2020.

Global fixed broadband download speed increased 31.7%

Ookla_Fixed-Broadband-Speeds-Poster_2020
We saw gigabit-speed Speedtest® results increase exponentially in 2019, which helped drive a global jump in mean download speed over fixed broadband. Singapore was the country with the fastest mean download speed and Kuwait showed the most improvement last year. To stay up to date on performance in specific countries, refer to the Speedtest Global Index for monthly comparisons of internet speeds.

Download Ookla’s Year in Mobile and Fixed Broadband Speeds poster here to see the full picture of network performance, availability and quality around the world. It works as a desktop background or you can hang it on your wall. Congratulations on a banner year in mobile performance, and cheers to even more improvements in 2020!

We want to know what you think. Our team is interested in better understanding who you are and why you use Speedtest. Take this very brief survey to help us improve upcoming product features. Thank you!

Ookla retains ownership of this article including all of the intellectual property rights, data, content graphs and analysis. This article may not be quoted, reproduced, distributed or published for any commercial purpose without prior consent. Members of the press and others using the findings in this article for non-commercial purposes are welcome to publicly share and link to report information with attribution to Ookla.

| February 11, 2020

New Consumer Sentiment Data Reveals Relationship Between Network Performance and Customer Satisfaction

At Ookla® we believe speeds are a foundational measure of customer experience. But what happens when a customer is getting great speeds and still isn’t happy with their provider? Would that provider even know? This is why we ask Speedtest® users to rate their provider on a five-star scale at the end of a test. The resulting data forms the core of Consumer SentimentTM, a new dashboard in Speedtest Intelligence®. With Consumer Sentiment, we can gauge customer satisfaction and pair that information with performance data to get a full picture of customer experience.

We analyzed Consumer Sentiment data on ratings from the United States in Q4 2019 to gauge some of the nuances of customer satisfaction.

Overall customer satisfaction varies widely by location and operator

Ookla’s five-star rating system gauges a customer’s overall satisfaction with a provider’s service and brand. Comparing ratings data across the home states of the top four mobile operators in the U.S., we saw that customers’ perception of their operators varies between the states.

chart-mobile-ops-ratings-us

Speedtest Intelligence shows T-Mobile consistently had among the best ratings with their highest average rating (3.7) in Kansas and their lowest (3.5) in both Texas and Washington. Average customer ratings for AT&T ranged between a low of 2.9 in their home state of Texas to a high of 3.5 in Washington State. Sprint’s highest average rating (3.8) was in their home state of Kansas, while their lowest rating (2.7) was in Texas. Verizon’s highest rating (3.4) was in Kansas and New York, while their lowest (2.9) was in Washington.

Kansas showed the highest ratings for almost all operators, with the exception of AT&T which was 0.1 higher in Washington than in Kansas. Texas showed the lowest. This Consumer Sentiment data from Speedtest Intelligence forms a jumping off point for providers to investigate what else might be going on in those locations, whether it’s infrastructure that needs improvement or a perception challenge.

Performance data plus Consumer Sentiment tells a broader story

We paired Speedtest Intelligence data on mean download speed in each of the states considered with Consumer Sentiment ratings to see how speed might affect customer satisfaction.
Ookla_Download_Speeds_Customer_Ratings_Mobile_Operators_US_0220
We found that having the fastest mean download speed in a location does not necessarily indicate that an operator will have the highest Consumer Sentiment ratings. In two states, Kansas and Washington, the operator with the fastest speed also had (or tied for) the highest rating. In New York, however, Verizon had the fastest speed, while T-Mobile had the highest rating. In Texas, Sprint had the fastest speed and the lowest rating.

Analyzing performance at different ratings tiers

To better understand the relationship between network performance and customer satisfaction, we broke out performance results by star ratings. Looking more deeply at mean performance data at each ratings tier, we can see that consumers with higher speeds and lower latency generally gave higher ratings.

chart-mean-fixed-download

chart-mean-fixed-upload-1

chart-mean-fixed-latency-5

Location alone does not account for satisfaction

Based on the “happy Kansas, unhappy Texas” data above, it might be easy to assume that satisfaction is regional. However, such an assumption could cause a provider to overlook important nuances of customer contentment. For example, an examination of Consumer Sentiment ratings data from the five boroughs of New York City reveals that satisfaction varied among the boroughs and between ratings by mobile and fixed customers.

chart-mobile-ops-ratings-nyc

A fixed broadband provider might think Manhattan was the unhappiest borough of all, when in fact they had the highest Consumer Sentiment ratings among mobile customers. The story in Queens was the opposite, with that borough showing the highest overall satisfaction for fixed broadband we saw in all of New York City. Meanwhile, their overall satisfaction on mobile was among the lowest reported.
Ookla_Mobile_Fixed_Speeds_Ratings_NYC_0220
As we saw above with the state data, the locations with the fastest speeds were not necessarily the locations with the highest Consumer Sentiment ratings.

There is much more to explore here, and Consumer Sentiment in Speedtest Intelligence gives providers a new layer of data to understand how consumers’ real-life experience impacts their satisfaction. Consumer Sentiment can be tracked over time and benchmarked against competitors, without the overhead of custom market research. Curious how satisfied your customers are with their overall network performance? Request a demo of the new Consumer Sentiment dashboard in Speedtest Intelligence.

Ookla retains ownership of this article including all of the intellectual property rights, data, content graphs and analysis. This article may not be quoted, reproduced, distributed or published for any commercial purpose without prior consent. Members of the press and others using the findings in this article for non-commercial purposes are welcome to publicly share and link to report information with attribution to Ookla.

| February 3, 2020

Verizon Rocks Mobile Speeds at the Big Game in Miami

More than 65,000 people watched the Kansas City Chiefs beat the San Francisco 49ers live at the Hard Rock Stadium in Miami yesterday. All those fans on their phones sharing the halftime experience with folks back home used massive amounts of data as they livestreamed and posted to social media. Every year this event presents a major challenge to mobile operators who this year added 5G to the mix. We’re here to report on which operator had the fastest speeds and the lowest latency on game day and what indoor coverage looked like in the Miami area.

Stadium-Heatmap

Mobile operators had their game face on

This is no ordinary sporting event, and operators have been working for many months on their playbooks for providing the best possible performance at Hard Rock Stadium. Highlights include:

Verizon Wireless’s download speeds beat out competitors’

We compared the big four U.S. mobile operators from two hours prior to kick-off to 30 minutes after the game ended to see who won. Here’s what we saw:

Overall Cellular Performance at Hard Rock Stadium
Speedtest® Data | February 2, 2020
Operator Mean Download Speed (Mbps) Mean Upload Speed (Mbps) Latency (ms)
Verizon Wireless 297.18 9.81 59
T-Mobile 121.93 30.34 34
Sprint 114.93 6.20 51
AT&T 103.68 8.38 46

Sprint’s home team might have won the game, but Verizon triumphed when it came to mobile download speeds, coming in 143.7% faster than second-place T-Mobile when considering Speedtest® results over all technologies. Sprint had the third fastest mean download speed in this category and AT&T came in fourth.

Focusing on their 5G game really helped Verizon take the day when considering overall speeds as T-Mobile had the fastest mean download speed (66.35 Mbps) on LTE. Sprint was second on LTE with a mean download speed of 56.16 Mbps, AT&T third at 39.18 Mbps and Verizon fourth at 30.67 Mbps. We break out 5G speeds for each operator below.

T-Mobile’s mean upload speed over all technologies was far better than competitors’. Upload speed is especially important at big events like this as fans try to share their game day experience with those not in the stadium.

T-Mobile also had the lowest latency, coming in 26.0% faster than second-place AT&T. Sprint was third for latency and Verizon fourth.

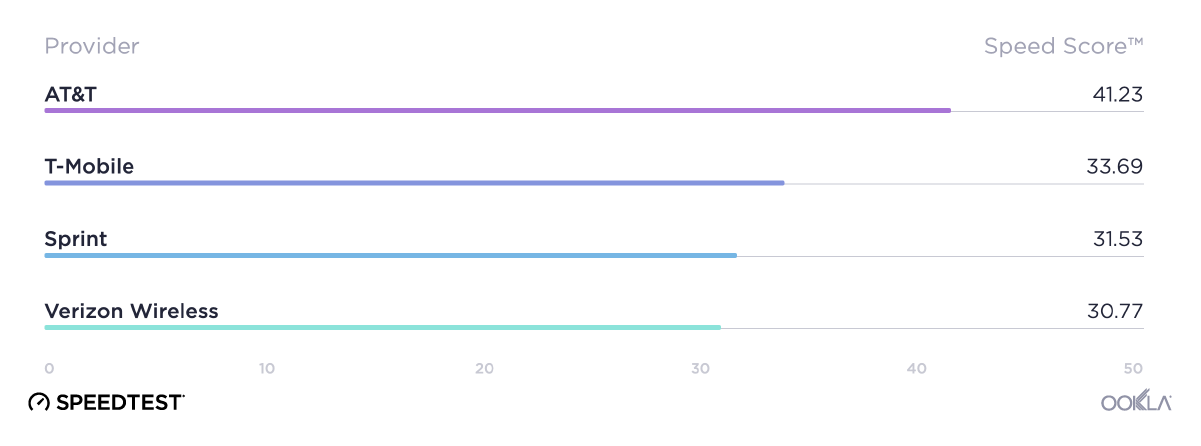
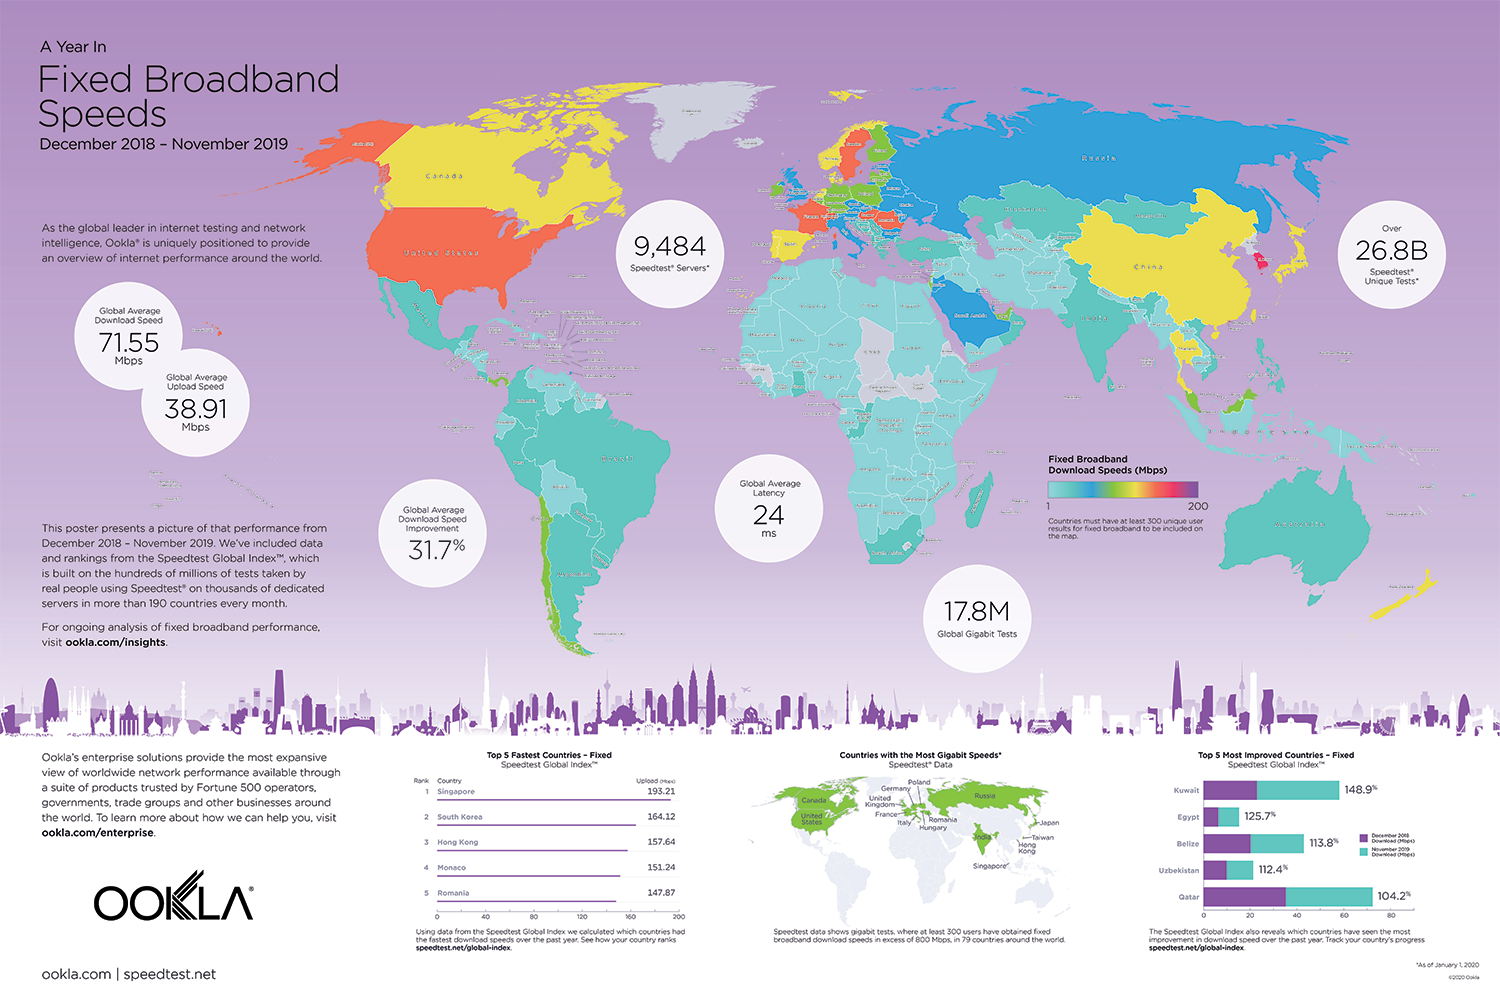
For comparison, the mean download speed over mobile in the U.S. in January 2020 was 41.23 Mbps, upload was 10.55 Mbps and latency was 46 ms.

5G for the win

5G is the biggest story in mobile these days, and all four operators came prepared to deliver their best game to customers with 5G-capable phones and compete for bragging rights during this high profile event.

5G Performance at Hard Rock Stadium
Speedtest® Data | February 2, 2020
Operator 5G Download Speed (Mbps) 5G Upload Speed (Mbps) 5G Latency (ms)
Verizon Wireless 646.17 9.86 91
T-Mobile 348.33 28.89 32
Sprint 225.78 15.39 15

Verizon easily beat T-Mobile and Sprint when it came to mean download speed over 5G during the big game. Verizon came in last, however, for both mean upload speed over 5G and latency. T-Mobile showed the fastest mean upload speed over 5G and Sprint had the best latency on 5G. While we did see 5G Speedtest results for AT&T during the game, there were fewer than 10, the minimum threshold we set for this event.

Hard Rock Stadium Wi-Fi was a viable option

In 2019, fans at Mercedes-Benz Stadium in Atlanta used over 24 TB of data on the stadium Wi-Fi network on game day with an average Wi-Fi download speed of 30.98 Mbps. To get a baseline on the Miami experience, we looked at Wi-Fi performance during the Bengals v. Dolphins matchup on December 22, 2019.

Wi-Fi Performance at Hard Rock Stadium
Speedtest® Data | February 2, 2020
Mean Download Speed (Mbps)Mean Upload Speed (Mbps)Mean Latency (ms)

Stadium Wi-Fi – December 22, 2019 56.48 62.64 7
Stadium Wi-Fi – Big Game 37.43 46.55 9
Verizon Wi-Fi – Big Game 36.81 40.91 7

Wi-Fi at the stadium did show some game day stresses yesterday, with a mean download speed 33.7% slower than the December 22 game. Mean upload speed dropped 25.7% and latency was up 28.6%.

Verizon also provided Wi-Fi for their customers during the big game yesterday, and the mean download speed was comparable to that on the stadium’s SSID. Mean upload speed on Verizon’s SSID was 12.1% slower than on the stadium’s, but Verizon’s Wi-Fi latency was also lower, showing a 22.2% improvement over stadium Wi-Fi.

It’s worth noting that mean upload speed in all cases was faster than that on download. This is impressive and helpful to fans trying to livestream their experience for friends back home.

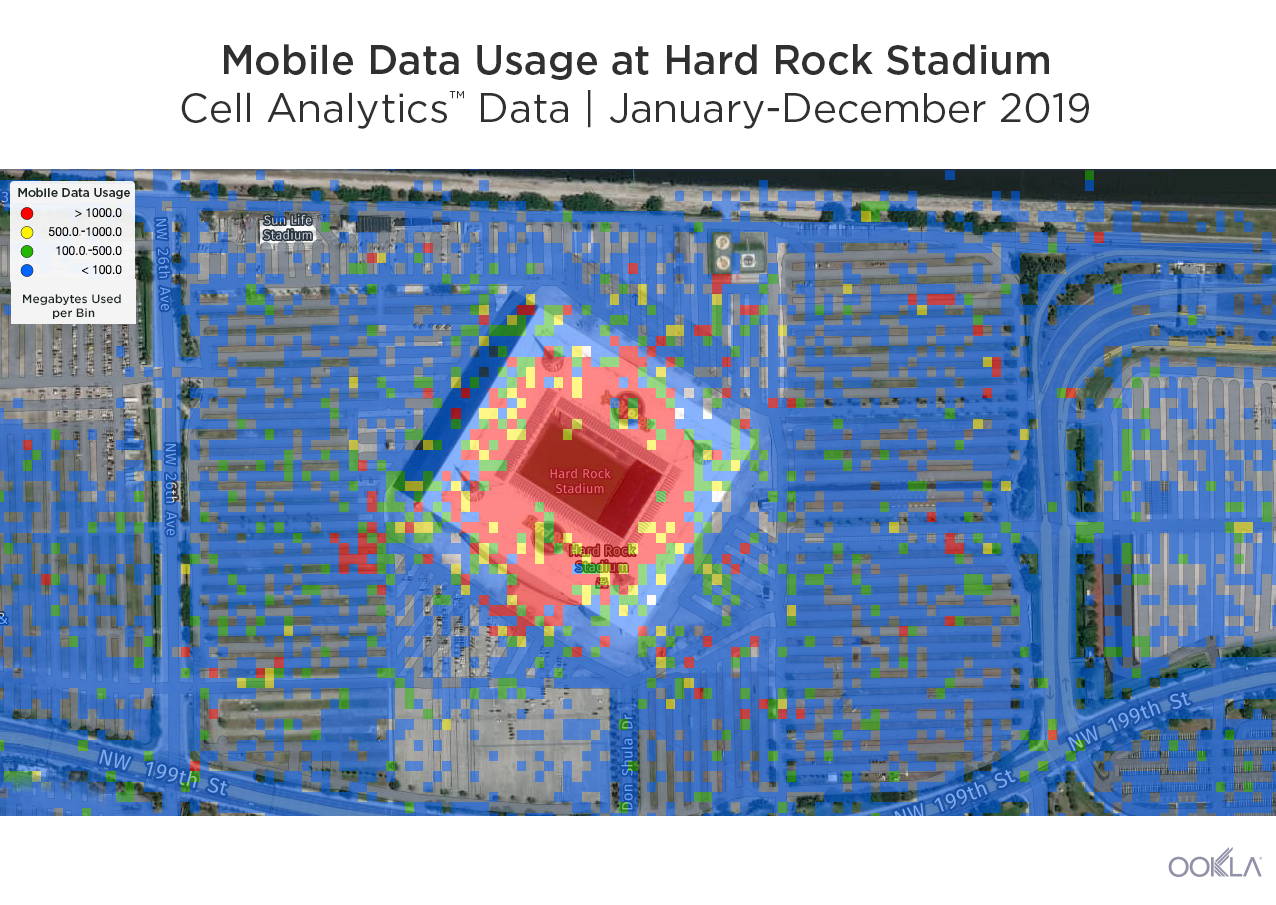
Indoor mobile coverage in Miami

Stadium speed is very important, however most attendees will spend the bulk of their time in hotels and at tourist attractions in and around Miami. We used Cell Analytics to assess indoor coverage at 9,128 buildings in the Miami metro area during Q3-Q4 2019 to see who had good indoor coverage (signal strength of greater than -115 dBm) in the most buildings.

Indoor Mobile Coverage in Miami Metro Area
Cell AnalyticsTM Data | Q3-Q4 2019
Operator % of Buildings with Good Coverage % of Buildings with Best Coverage
Verizon 97.7% 29.1%
T-Mobile 97.2% 36.9%
AT&T 94.2% 22.7%
Sprint 92.5% 11.2%

Verizon showed good coverage in more buildings than any other operator at 97.7%, followed by T-Mobile at 97.2%, AT&T at 94.2% and Sprint at 92.5%.

We also examined who had the best coverage in each building and found that T-Mobile provided the strongest coverage in 36.9% of buildings analyzed. Verizon had the strongest coverage in 29.1% of buildings analyzed, AT&T was strongest in 22.7%, and finally Sprint was strongest in 11.2%.

Learn how Ookla® can help you determine if your network is prepared for the massive crowds that accompany a marquee event and analyze how your network performs both indoors and out, down to the building level.

Ookla retains ownership of this article including all of the intellectual property rights, data, content graphs and analysis. This article may not be quoted, reproduced, distributed or published for any commercial purpose without prior consent. Members of the press and others using the findings in this article for non-commercial purposes are welcome to publicly share and link to report information with attribution to Ookla.

| January 28, 2020

Mobile Experience in the Caribbean: Where Roaming Doesn’t Sink Speeds


Winter’s on in the northern hemisphere, and travelers from all over are booking cruises to the Caribbean for a little sun. If a phone figures into that fabulous vacation, it’s important to know where mobile roaming speeds will slow down the fun. We examined Speedtest® data from Q4 2019 for five popular Caribbean destinations to see which country has the best roaming speed, how roaming affects latency and how country of origin affects results.

Roaming speeds excel in the French Antilles

Roaming agreements are complex arrangements negotiated between individual mobile operators on a country-by-country basis. For travelers this means that mobile speeds can be very unpredictable abroad. Speedtest data showed Guadeloupe and Martinique had the fastest mean inbound roaming download speeds of all the countries on our list during Q4 2019.
Ookla-Inbound-Roaming-Speeds-Caribbean_0120
On the other hand, visitors to Cuba and The Bahamas saw the slowest mean download speeds while roaming during Q4 2019.

Local speed does not predict roaming speed

We expect to see slow roaming speeds in countries with slow mobile speeds overall, because roaming relies on in-country networks. However, when we look only at the percent difference between roaming and local speeds, we see that local speed was not the only indicator of roaming speed.

Comparing Inbound Roaming Speeds to Local Speeds in the Caribbean
Speedtest® Data | Q4 2019
Country Local Download (Mbps) % Decrease Download When Roaming Local Upload (Mbps) % Decrease Upload When Roaming
Cuba 28.45 82.9% 12.98 19.4%
Antigua and Barbuda 41.66 75.5% 13.18 56.4%
The Bahamas 23.21 68.8% 11.99 49.0%
Guadeloupe 46.33 31.6% 12.52 45.8%
Puerto Rico 27.46 31.3% 10.83 37.4%
Dominican Republic 26.58 21.8% 10.49 37.9%
Martinique 32.59 4.2% 10.37 4.1%

For example, Antigua and Barbuda’s mean local download speed was the second fastest on our list during Q4 2019, but that figure represents a 75.5% decrease in mean roaming download speed. The result is that Antigua and Barbuda ranked third to last for mean roaming download speed during Q4 2019. Cuba showed the largest decrease in mean download speed between roaming and local at 82.9%. Martinique showed the smallest decrease at 4.2%.

Roaming’s effect on latency

Latency is a major pain point for consumers who are roaming outside of their home country. Roaming signals are routed from the country a consumer is visiting to their country of origin and then back to where they physically are with their phones.

Comparing Inbound Roaming to Local Latency in Caribbean Countries
Speedtest® Data | Q4 2019
Country Roaming Latency (ms) Local Latency (ms) % Increase Latency When Roaming
Cuba 472 100 372.0%
Guadeloupe 289 80 261.3%
Martinique 289 99 191.9%
Dominican Republic 216 35 517.1%
Puerto Rico 174 52 234.6%
Antigua and Barbuda 149 28 432.1%
The Bahamas 149 32 365.6%

Latency while roaming was highest by far in Cuba during Q4 2019. Roaming latency represented a 372.0% increase over local latency, which was also higher in Cuba than any other country on this list. The high roaming latency in both Guadeloupe and Martinique is likely both because local latency is higher there and because the majority of samples we saw in those locations were roamers from France, so the signals for roamers had to cross an ocean, twice.

Antigua and Barbuda and The Bahamas were tied for the lowest latency we saw for consumers roaming in the Caribbean during Q4 2019. These two countries also had the lowest local latencies during this period.

Performance varies widely by roamer’s origin and destination

Mobile Roaming Speeds and Latency for U.S. Consumers in Three Caribbean Markets
Speedtest® Data | Q4 2019
Country Roaming Download (Mbps) % Decrease Download When Roaming Roaming Upload (Mbps) % Decrease Upload When Roaming Roaming Latency (ms) % Increase Latency When Roaming
Dominican Republic 21.43 19.4% 5.98 43.0% 144 311.4%
Puerto Rico 19.74 28.1% 6.43 40.6% 172 230.8%
The Bahamas 7.20 69.0% 6.20 48.3% 143 346.9%

Although Puerto Rico is a U.S. territory, visitors from the 50 states of the union had a faster mean download speed roaming in the Dominican Republic than they did in Puerto Rico during Q4 2019. Both were slower than the U.S. average download of 38.74 Mbps during that period.

Roaming download speed for U.S. visitors to The Bahamas were much slower than those seen in the other two locations and 19.4% slower than the mean download speed for residents of The Bahamas. Latency for U.S. roamers was also much higher in Puerto Rico than it was in either The Bahamas or the Dominican Republic. For comparison, mean latency in the U.S. was 47 ms during the same period.

Roaming upload speeds for U.S. visitors were much more similar between the three destinations than we saw on the download side. All were much slower than the mean upload speed in the U.S. of 11.19 Mbps during Q4 2019.

Mobile Roaming Speeds and Latency for French Consumers in Two Caribbean Markets
Speedtest® Data | Q4 2019
Country Roaming Download (Mbps) % Decrease Download When Roaming Roaming Upload (Mbps) % Decrease Upload When Roaming Roaming Latency (ms) % Increase Latency When Roaming
Guadeloupe 35.65 23.1% 7.53 39.9% 285 256.3%
Martinique 31.22 4.2% 9.94 4.1% 289 191.9%

French visitors to Guadeloupe and Martinique experienced similar speeds and latency roaming in both locations, despite the sharp difference in local speeds. Considering the mean download speed in France was 44.19 Mbps and upload was 10.94 Mbps during the same period, these roaming speeds require a bit of an adjustment, but not painfully so. Latency, on the other hand, will require users to pack their patience, as mean latency in France during this same period was 41 ms.

Guadeloupe, Martinique, the Dominican Republic and Puerto Rico are among the best Caribbean destinations if roaming performance is a factor in choosing a cruise. Either way, multi-island travelers should be prepared for a variety of mobile roaming experiences in a variety of countries and aboard ships where roaming uses the ship’s cellular or Wi-Fi network.

If you’re a mobile operator interested in improving roaming performance to make your country even more attractive to foreign visitors, learn more about how Speedtest IntelligenceTM can help you.

Ookla retains ownership of this article including all of the intellectual property rights, data, content graphs and analysis. This article may not be quoted, reproduced, distributed or published for any commercial purpose without prior consent. Members of the press and others using the findings in this article for non-commercial purposes are welcome to publicly share and link to report information with attribution to Ookla.

| January 15, 2020

Power is Key to Mobile Network Recovery After Earthquakes in Puerto Rico

Mobile connectivity is crucial in the wake of a natural disaster as consumers seek to connect with loved ones and vital services. This is made all the more difficult by the fact that natural disasters can also wreak havoc on the infrastructure that supports that connectivity, including electrical power. In order to support recovery efforts, we used Speedtest® data from before and after the major recent earthquakes in Puerto Rico to see how mobile users were affected and where network connectivity currently stands.

While it was reported that power plants automatically shut off for safety following the quake on Monday, January 6 at 6:32 a.m. local time, we do not see the same effect to mobile networks during that time as we did when power plants were then reportedly damaged in the Tuesday, January 7 quake that struck at 4:24 a.m. local time. Not all power plants were yet fully online by the time of the quake on Saturday, January 11 at 8:54 a.m. Electricity is essential to power cellular networks and not all cell sites have on-site power generators. We explore the various impacts of these power outages below.

Signal measurements and test volumes dropped after Tuesday’s quake

An hourly timelapse from the time before the first major earthquake on Monday, January 6, through the second (Tuesday, January 7) and third (Saturday, January 11) show the number of passive signal measurements from Android devices on the island of Puerto Rico.

Coverage scans timelapse

We see a similar pattern of scans throughout the period, but the volume of samples declines following each of the three quakes.

PR-Embedded-Volumes-Devices-Tests-4

Embedded tests also dropped off after the Tuesday, January 7 earthquake. These come from devices (including: routers, gateways, modems, test and measurement devices and IoT Devices) that use Speedtest PoweredTM to monitor connectivity by running a Speedtest, usually on a regular schedule. Except when the power is out.

No service status jumped after Tuesday’s quake

PR-No-Service-Scans-Devices

The proportion of scans and devices with no service in Puerto Rico show a large jump after the earthquake on Tuesday, January 7 compared with the time period following the Monday, January 6 quake. This shows that the real impact to mobile networks was a result of the quake on Tuesday, January 7, likely because of power outages, and that networks were slowly recovering in the days after.

It looks as though scans and devices with no service were trending upward following the quake on Saturday, January 11 as well, though full data was still trickling in as this article was being written.

Battery level fell when devices were disconnected from power

For signal to matter, a device needs to have battery or the ability to charge. We used Speedtest data to analyze the proportion of devices that were connected to power during a coverage scan during the month of January.
Proportion-of-Devices-Connected-Puerto-Rico_0120-4
Before and after the earthquake on Monday, January 6, we see a fairly consistent daily pattern where between 30% and 85% of devices are connected to power during a scan. Immediately following the quake on Tuesday, January 7, there is a sharp drop in devices connected to power. The pattern had still not fully recovered when the third major quake hit on the morning of Saturday, January 11. There also appeared to be a longer than average dip in devices connected to power immediately following Saturday’s quake, but the pattern looks to be normalizing in the days since.

The disruption in devices connected to power after the January 7 quake then affected average battery life of unplugged devices. This drop in average battery level reflects devices that had been charging when the power went out. We can also see that the average battery level didn’t return to a normal cycle until Friday, January 10.

Average-Battery-Level-of-Devices-Puerto-Rico_0120-2

While these battery observations may appear straight-forward, they are important to highlight because they illuminate the cascading connectivity challenges that communities face in times of crisis.

Natural disasters can happen anywhere. In places like Puerto Rico, where the power grid is still suffering from the effects of Hurricane Maria, the effects of additional natural disasters on critical mobile networks can be especially challenging. Full power was expected to have been restored to the island on Sunday.

At Ookla, we share data pro bono in times of need that can help assist recovery in a number of ways. If you are an operator or regulator assisting with rebuild efforts in Puerto Rico that could use Ookla data to aid your immediate efforts, please inquire for more information.

Ookla retains ownership of this article including all of the intellectual property rights, data, content graphs and analysis. This article may not be quoted, reproduced, distributed or published for any commercial purpose without prior consent. Members of the press and others using the findings in this article for non-commercial purposes are welcome to publicly share and link to report information with attribution to Ookla.

| January 6, 2020

Football Playoffs Take Out Sports Betting Site FanDuel

The NFL playoffs are an inopportune time for a fantasy sports and betting site like FanDuel to be down, but a period of increased usage is exactly what can take a website out of commission. Downdetector® reports that FanDuel crashed on January 4, 2020 and January 5, 2020, just when football fans were reaching near peak excitement for the season. We have data on when FanDuel went down, how severe those outages were and where frustrated users were located.

How the outages played out

FanDuel Outages During Playoffs per Downdetector®
January 4-5, 2020
Date Reports Approx. Duration of Reports (Hours)
January 4, 2020 (outage 1) 1140 1.25
January 4, 2020 (outage 2) 5757 3.50
January 5, 2020 2248 7.00

January 4 (outages 1 and 2)

The Texans had barely started playing the Bills on Saturday, January 4 when reports of FanDuel being down started rolling in, primarily from Chicago, Brooklyn and Pittsburgh. This outage was relatively short, but then so was the reprieve.

New outage reports spiked right about kickoff time for the Titans v. Patriots. This outage was both more severe, showing 5 times as many reports, and lasted longer. Sports fans in Philadelphia, Pittsburgh and Indianapolis provided the highest number of outage reports.

Pennsylvania and Indiana are two states where FanDuel users can legally bet online.

January 5

On Sunday, January 5, it was the Seahawks v. Eagles that gave FanDuel the most trouble with an outage that started right before kickoff and petered along for about 7 hours. The highest concentration of reports came from Pennsylvania, home territory of the Eagles.

Will FanDuel be ready for The Big Game?

Outages are not isolated incidents, and previous outages on November 28 and December 29 could have been warning signals for FanDuel site managers. We hope these issues don’t pop up again when fans around the world tune into the Big Game on February 2, but we can’t say for certain.

If you’re concerned about outages on your site, Downdetector can help. Downdetector helps reduce downtime by providing data on regions and services affected that can point to a root cause. Learn more about how Downdetector can help you.

Ookla retains ownership of this article including all of the intellectual property rights, data, content graphs and analysis. This article may not be quoted, reproduced, distributed or published for any commercial purpose without prior consent. Members of the press and others using the findings in this article for non-commercial purposes are welcome to publicly share and link to report information with attribution to Ookla.