| December 18, 2019

A Global Look at Mobile Modem Market Share and Device Performance

Analysts discuss the latest devices all the time, but rarely is enough attention paid to the phone’s real powerhouse — the modem. We were interested to see how market share for modem manufacturers divides up on a global level, so we investigated device data from Speedtest IntelligenceTM during Q3 2019. We also looked at how popular phones performed in different markets, including a look at 5G phones in 5G countries.

Global modem market share

Ookla_Global-Modem-Market-Share_1219-2

Speedtest data showed Qualcomm was the most common modem manufacturer in 133 countries during Q3 2019 — the highest market share was in Hong Kong with 73.6% of the devices analyzed showing Qualcomm modems. Qualcomm’s slimmest majority was in Botswana with 25.6% of devices analyzed showing Qualcomm modems.

This is not surprising as Qualcomm chipsets power many flagship devices sold around the world. In the U.S., virtually all Android OEMs use Qualcomm-powered chipsets. The latest Qualcomm Snapdragon 855+ mobile platform with Snapdragon X24 integrated LTE modem (up to 2Gbps) powers popular devices from Samsung, LG and OnePlus. It’s worth noting that Qualcomm has multi-year licensing deals with multiple OEMs based in China, namely Vivo, OPPO, Lenovo, Xiaomi and OnePlus, providing their complete modem-to-antenna solutions for optimal RF performance. This includes valuable RF Front End (RFFE) components such as power amplifiers, envelope trackers, RF switches, filters and antenna tuners.

These OEMs also have access to Qualcomm’s first and second generation 5G modems. As of right now, Qualcomm is also the only chipset manufacturer providing modem-to-antenna solutions for 5G millimeter wave (mmWave) deployments, providing all-in-one mmWave antenna modules that contain radio transceiver, RFFE and phased array antenna.

Intel was the most common modem manufacturer in 32 counties during Q3 2019. The highest percentage of devices with Intel modems was seen in Greenland at 55.6%. Intel’s slimmest majority was in South Africa with 28.6% of devices analyzed showing Intel modems. Intel’s main customer in the smartphone space is Apple. Starting in 2016, Apple began powering some iPhone devices with Intel’s flagship LTE chipsets, and since 2018, all iPhones have Intel’s cellular chipsets.

Samsung was the most common modem manufacturer in 16 countries during Q3 2019. South Korea had the highest percentage of devices with Samsung modems at 53.8%. Samsung’s slimmest majority was in Mozambique with 29.1% of devices analyzed powered by Samsung modems. Samsung’s Exynos LTE modem is seen in variants of Samsung’s Galaxy S and Note devices. Except in the Americas and China, most of Samsung’s flagship S10 and Note 10 devices around the world are powered by Samsung’s own Exynos 982x SoC (system on a chip), with an integrated LTE Category 20 modem capable of download speeds of up to 2 Gbps.

Speedtest data showed HiSilicon as the most common modem manufacturer in two countries during Q3 2019. In Costa Rica, 32.4% of devices analyzed showed HiSilicon modems, and in Namibia that number was 27.6%. HiSilicon is a semiconductor company based in Shenzhen and fully owned by Huawei. Huawei integrates its own flagship modem into its flagship P and Mate series devices. These devices have a large user base in Europe, the Middle East and Asia.

Device performance is affected by market factors

A phone’s performance is always going to depend on the conditions within its specific market. Factors affecting network performance can include: geography, cell site and population density, the amount of wireless spectrum deployed and the overall capabilities of user equipment seeded to market. Multiple factors can impact the performance of a device, including: varying degrees of RF transparency in the materials used for device chassis, variations in RF front-end and antenna design complexity and whether the baseband processor is more or less capable of handling network tasks. We used Speedtest data to analyze how three popular phones — the Apple iPhone Xs, the Huawei Mate 20 Pro and the Samsung Galaxy S10 — performed in specific markets around the world during Q3 2019. We excluded data from devices with fewer than 100 samples in a market during the period.

Mean-DL-Speeds-on-Flagship-Phones

The Samsung Galaxy S10 was the fastest of these three devices in all but five markets during Q3 2019. However, the mean download speed on the Galaxy S10 varied between 18.06 Mbps in India and 95.91 Mbps in Canada. The Huawei Mate 20 Pro showed the fastest mean download speed of these three devices in France and the U.K. during Q3 2019 and often placed second in the remaining markets on the list. Mean download speed on the Mate 20 Pro during Q3 2019 ranged from 14.57 Mbps in India to 93.66 Mbps in Canada.

Apple’s iPhone Xs was at a slight disadvantage in this comparison, as it came out in 2018 where the other devices debuted in 2019. Because the iPhone 11 was not fully seeded to markets in Q3 2019, we considered its predecessor, the iPhone Xs, in this analysis. The iPhone Xs showed the fastest mean download speed in Germany, Japan and Nigeria during Q3 2019. Mean download speeds on the iPhone Xs varied from 15.92 Mbps in India to 71.72 Mbps in Canada.

Device performance in 5G markets

5G currently offers the pinnacle of mobile performance. We looked at 5G-capable devices in markets where 5G exists to see how download speeds compare. These results include Speedtest results on all technologies, not just 5G, which means averages also reflect consumers using 5G phones with a 4G connection.

Mean-DL-Speeds-on-5G-Phones

Both the Samsung Galaxy S10 5G and the Huawei Mate 20 X 5G showed mean download speeds in excess of 200 Mbps in some markets during Q3 2019. However, there’s clearly some difference in which devices are supported by which operators, as not all operators in 5G markets are offering 5G equally (if at all). Related, the Samsung Galaxy S10 5G models sold in the U.S. and China are powered by Qualcomm’s first-generation Snapdragon X50 5G modem, while other 5G markets receive the variant powered by Samsung’s in-house Exynos 5100 5G modem.

Mobile operators continue to incentivize consumers to upgrade to newer and more capable devices to ensure a more efficient use of spectrum assets for network operators. This leads to an improved utilization of shared resources, faster overall speeds and better quality of experience.

We’re looking forward to updating these analyses as more markets adopt 5G and as newer and even faster phones are released. For more information about how our device data can help you, contact us.

Ookla retains ownership of this article including all of the intellectual property rights, data, content graphs and analysis. This article may not be quoted, reproduced, distributed or published for any commercial purpose without prior consent. Members of the press and others using the findings in this article for non-commercial purposes are welcome to publicly share and link to report information with attribution to Ookla.

| December 3, 2019

An Analysis of Internet Speeds and 4G in North Africa

Lire en français read in arabic

Mobile and fixed broadband speeds in North Africa currently lag behind much of the world, though that may soon change. To better understand the current and future states of the internet in North Africa, we examined Speedtest® data from Q2-Q3 2019 in Algeria, Egypt, Libya, Morocco and Tunisia. Our analysis includes data on download speeds, 4G Availability and Time Spent on various mobile technologies. We’ve also included data on internet speeds in some of the largest cities in the region.

Internet-Speeds-in-North-Africa-ENG-1

Morocco leads fixed broadband download speeds, Egypt most improved

As of October 2019, countries in North Africa ranked no higher than 123rd in the world for fixed broadband speeds on the Speedtest Global IndexTM. Morocco had the fastest mean download speed over fixed broadband in North Africa during Q2-Q3 2019 at 15.38 Mbps, 69.0% faster than second-place Egypt’s 9.10 Mbps. Libya was third fastest at 8.92 Mbps, Tunisia fourth at 8.64 Mbps and Algeria fifth at 4.55 Mbps.

However, Egypt saw the most improvement in fixed broadband download speed with a remarkable 55.5% increase during Q2-Q3 2019. All four of the major ISPs in Egypt saw increased speeds during this period with mean download speeds rising 59.2% for WE Internet, 55.4% for Orange, 21.7% for Etisalat and 17.1% for Vodafone.

Libya showed the second highest improvement in fixed broadband download speed in North Africa during this period with a 29.9% gain. Morocco’s download speed went up 27.2% and Tunisia 10.8%. Mean download speed over fixed broadband declined 6.2% during Q2-Q3 2019 in Algeria.

Morocco has the fastest mean download speed on mobile and it’s improving rapidly

North Africa’s fastest country, Morocco, ranked 54th on the Speedtest Global Index in October 2019. Morocco’s mean download speed over mobile during Q2-Q3 2019 was 27.01 Mbps. Tunisia was second at 24.50 Mbps, Egypt third at 16.86 Mbps, and Algeria and Libya virtually tied at 9.63 Mbps and 9.62 Mbps, respectively.

Morocco showed the greatest improvement in mean mobile download speed among countries in North Africa during Q2-Q3 2019 with a 24.5% increase. All three of the major providers saw advances in speed during this period with Maroc Telecom seeing a 40.1% rise in mean download speed, inwi gained 11.9% and Orange 5.5%. Algeria had the second highest gain in mean download speed at 20.5%, Tunisia third at 12.1% and Libya fourth at 8.6%. Mean download speed over mobile decreased 3.4% in Egypt during Q2-Q3 2019.

4G Availability varies widely among countries in North Africa

4G Availability in North Africa
Speedtest® Data | Q2-Q3 2019
Country 4G Availability
Morocco 83.3%
Tunisia 64.4%
Egypt 60.9%
Algeria 45.5%
Libya 15.6%

Morocco had the highest 4G Availability in North Africa during Q2-Q3 2019, with consumers able to access 4G LTE in 83.3% of surveyed locations. Tunisia had the second highest 4G Availability at 64.4%, Egypt third at 60.9%, Algeria fourth at 45.5% and Libya fifth at 15.6%.

Only two countries show majority of Time Spent on 4G

Time-Spent-Per-Mobile-Technology-in-North-Africa-ENG

We used Speedtest data on Time Spent to measure how often, on average, consumers were able to connect to various technologies in North Africa during Q2-Q3 2019. Morocco had the highest Time Spent on 4G at 59.7%, followed by Tunisia (53.4%), Egypt (41.1%), Algeria (39.8%) and Libya (13.3%). Libya had the highest Time Spent on 3G at 40.2%, followed by Algeria (35.5%), Egypt (27.0%), Tunisia (26.1%) and Morocco (21.1%). Libya had the highest Time Spent on 2G at 25.1%, distantly followed by Algeria (8.8%), Egypt (6.0%), Tunisia (4.3%) and Morocco (3.7%).

Libya had the highest Time Spent with no coverage at 17.6%, followed closely by Egypt (17.5%), Morocco (13.9%), Tunisia (13.5%) and Algeria (13.2%).

Rabat shows fastest mean fixed broadband and mobile download speeds

-revised-2--Ookla_North-Africa_Internet-Speeds_1219_en

Looking at some of the largest cities in North Africa we found that the Moroccan cities of Rabat and Casablanca had the fastest mean download speeds over fixed broadband during Q2-Q3 2019. Tripoli, Libya was third. On the other end of the spectrum, Oran, Algeria had the slowest mean download over fixed broadband during Q2-Q3 2019. Data for the province of Algiers, Algeria revealed that to be the second slowest location on the list for download speed over fixed broadband. Sfax, Tunisia was the third slowest.

On the mobile side, Rabat and Casablanca again ranked first and second for mean download speed during Q2-Q3 2019. Sfax was third. Oran and Algiers showed the slowest and second slowest, respectively, mean download speeds over mobile during Q2-Q3 2019 of all the locations on this list. Tripoli was the third slowest.

The rollouts of fiber and 5G have the potential to radically improve internet speeds and availability across North Africa. The gains in speeds we saw in many North African countries during Q2-Q3 2019 could revolutionize consumers’ internet experience if they continue. If you’re an internet provider or mobile operator who would like more information on how our data can help you improve your network, contact us.


Analyse des débits Internet et de la 4G en Afrique du Nord

Actuellement, la vitesse des connexions haut débit fixes et mobiles en Afrique du Nord est bien en deçà de celle enregistrée dans une grande partie du monde, même si cela devrait bientôt changer. Pour mieux comprendre la situation actuelle et future d’Internet en Afrique du Nord, nous avons étudié les données Speedtest® entre le 2e et le 3e trimestre 2019 en Algérie, en Égypte, en Libye, au Maroc et en Tunisie. Notre analyse inclut des informations sur les vitesses de téléchargement, la disponibilité de la 4G et le temps passé sur diverses technologies mobiles. Nous avons également ajouté des données sur les débits Internet de quelques-unes des plus grandes villes de la région.

Internet-Speeds-in-North-Africa-FR

Le Maroc est premier en matière de vitesse de téléchargement haut débit fixe, et l’Égypte enregistre la plus importante progression

En octobre 2019, les pays d’Afrique du Nord atteignaient seulement la 123e place mondiale du classement Speedtest Global IndexTM s’intéressant aux vitesses de téléchargement haut débit fixe. Dans la région Afrique du Nord et entre le 2e et le 3e trimestre 2019, c’est le Maroc qui affichait la vitesse de téléchargement moyenne la plus rapide pour le haut débit fixe avec une valeur de 15,38 Mbits/s. L’Internet du pays est donc 69,0 % plus rapide qu’en Égypte, qui occupait la 2e place avec une vitesse de 9,10 Mbits/s. La Libye se classait 3e avec une vitesse de 8,92 Mbits/s, suivie par la Tunisie et l’Algérie avec une vitesse de 8,64 Mbits/s et 4,55 Mbits/s, respectivement.

Toutefois, c’est l’Égypte qui a le plus progressé en matière de vitesse de téléchargement haut débit fixe avec une augmentation incroyable de 55,5 % entre le 2e et le 3e trimestre 2019. Les quatre principaux fournisseurs d’accès à Internet en Égypte ont enregistré des débits plus élevés au cours de cette période avec des vitesses de téléchargement moyennes augmentant de 59,2 % pour WE Internet, 55,4 % pour Orange, 21,7 % pour Etisalat et 17,1 % pour Vodafone.

La Libye est le deuxième pays en Afrique du Nord dont la vitesse de téléchargement haut débit fixe s’est nettement améliorée avec une hausse de 29,9 %. La vitesse de téléchargement a augmenté de 27,2 % pour le Maroc et de 10,8 % pour la Tunisie. Pour le 2e et le 3e trimestre 2019, la vitesse de téléchargement moyenne pour le haut débit fixe a diminué de 6,2 % en Algérie.

Le Maroc affiche la vitesse de téléchargement moyenne sur mobile la plus rapide et progresse vite

Le Maroc, pays avec le débit Internet le plus rapide d’Afrique du Nord, était classé 54e du Speedtest Global Index en octobre 2019. La vitesse de téléchargement moyenne sur mobile du Maroc entre le 2e et le 3e trimestre 2019 était de 27,01 Mbits/s. Après le Maroc, la Tunisie était 2e avec une vitesse de 24,50 Mbits/s, l’Égypte 3e avec une vitesse de 16,86 Mbits/s, tandis que l’Algérie et la Libye étaient pratiquement ex aequo avec une vitesse de 9,63 Mbits/s et 9,62 Mbits/s respectivement.

Entre le 2e et le 3e trimestre 2019, le Maroc a enregistré la progression la plus importante en termes de vitesse de téléchargement moyenne sur mobile par rapport aux autres pays d’Afrique du Nord, avec une hausse de 24,5 %. Les trois principaux fournisseurs ont constaté des progrès en termes de vitesse pendant cette période : Maroc Telecom a rapporté une augmentation de 40,1 % pour la vitesse de téléchargement moyenne, tandis qu’inwi et Orange ont fait part d’une hausse de 11,9 % et 5,5 %, respectivement. La deuxième augmentation la plus importante en matière de vitesse de téléchargement moyenne a été enregistrée en Algérie avec une valeur de 20,5 %, suivie par la Tunisie (12,1 %) et la Libye (8,6 %). La vitesse de téléchargement moyenne sur mobile a diminué de 3,4 % en Égypte au cours de la même période.

La disponibilité de la 4G est très variable entre les pays d’Afrique du Nord

Disponibilité de la 4G en Afrique du Nord
Données Speedtest® | 2e et 3e trimestres 2019
Pays Disponibilité de la 4G
Maroc 83,3%
Tunisie 64,4%
Égypte 60,9%
Algérie 45,5%
Libye 15,6%

Entre le 2e et le 3e trimestre 2019, c’est au Maroc que la 4G était la plus disponible : les utilisateurs pouvaient accéder à la 4G LTE dans 83,3 % des emplacements étudiés. La Tunisie se classait 2e avec une disponibilité de la 4G égale à 64,4 %, l’Égypte était 3e avec 60,9 %, l’Algérie 4e avec 45,5 % et la Libye 5e avec 15,6 %.

Seuls deux pays affichent une majorité de temps passé sur la 4G

Time-Spent-Per-Mobile-Technology-in-North-Africa-FR

Nous avons exploité les données Speedtest relatives au temps passé pour mesurer la fréquence moyenne à laquelle les utilisateurs pouvaient se connecter à diverses technologies en Afrique du Nord entre le 2e et le 3e trimestre 2019. Le temps passé sur la 4G était plus important au Maroc avec 59,7 %, suivi par la Tunisie (53,4 %), l’Égypte (41,1 %), l’Algérie (39,8 %) et la Libye (13,3 %). Le temps passé sur la 3G était plus important en Libye avec 40,2 %, suivie par l’Algérie (35,5 %), l’Égypte (27,0 %), la Tunisie (26,1 %) et le Maroc (21,1 %). Le temps passé sur la 2G était plus important en Libye avec 25,1 %, suivie de très loin par l’Algérie (8,8 %), l’Égypte (6,0 %), la Tunisie (4,3 %) et le Maroc (3,7 %).

Le temps passé sans couverture était plus important en Libye avec 17,6 %, suivie par l’Égypte (17,5 %), le Maroc (13,9 %), la Tunisie (13,5 %) et l’Algérie (13,2 %).

Rabat enregistre les vitesses de téléchargement haut débit fixe et mobile moyennes les plus rapides

-revised-2--Ookla_North-Africa_Internet-Speeds_1219_fr

En étudiant certaines des plus grandes villes d’Afrique du Nord, nous avons constaté que Rabat et Casablanca (Maroc) présentaient les vitesses de téléchargement haut débit fixe moyennes les plus rapides entre le 2e et le 3e trimestre 2019. Tripoli (Libye) arrivait en 3e place. Si l’on s’intéresse aux autres extrêmes, c’est Oran (Algérie) qui présentait la vitesse de téléchargement haut débit fixe moyenne la plus lente pour la même période. Les données de la province d’Alger (Algérie) ont révélé que celle-ci était la deuxième ville avec la vitesse de téléchargement haut débit fixe la plus lente. Sfax (Tunisie) était la 3e ville avec la vitesse la plus lente.

Côté mobile, les villes de Rabat et de Casablanca se classaient encore 1re et 2e, respectivement, pour la vitesse de téléchargement moyenne la plus rapide entre le 2e et 3e trimestre 2019. Sfax atteignait la 3e place. Oran et Alger occupaient respectivement la 1re et la 2e place de la liste en matière de vitesses de téléchargement sur mobile moyennes les plus lentes pendant cette période. Tripoli était la 3e ville avec la vitesse la plus lente.

Les déploiements de la fibre et de la 5G ont le potentiel d’améliorer de façon notable la disponibilité et les débits Internet dans toute l’Afrique du Nord. Les augmentations de débits que nous avons constatées dans de nombreux pays de cette région entre le 2e et le 3e trimestre 2019 peuvent, si elles continuent, révolutionner l’expérience Internet des utilisateurs. Si vous êtes un fournisseur d’accès à Internet ou un opérateur mobile et que vous souhaitez plus d’informations sur comment nos données peuvent améliorer votre réseau, contactez-nous.

Ookla retains ownership of this article including all of the intellectual property rights, data, content graphs and analysis. This article may not be quoted, reproduced, distributed or published for any commercial purpose without prior consent. Members of the press and others using the findings in this article for non-commercial purposes are welcome to publicly share and link to report information with attribution to Ookla.

| November 25, 2019

A Global Look at Russia’s Internet Speeds and 4G Availability


Читать отчет на русском

With one of the largest economies in the world and also the largest landmass, Russia makes for an interesting case study of internet speeds. We examined Speedtest® data on mobile and fixed broadband speeds as well as 4G Availability during Q2-Q3 2019 to see how Russia compares to the ten largest economies in the world. We also analyzed data from Russia’s oblasts and most populous cities to determine how speeds and availability vary across Russia’s vast geography.

Russia ranked ninth for fixed broadband download speed among the world’s largest economies

Fixed-Download-Speeds

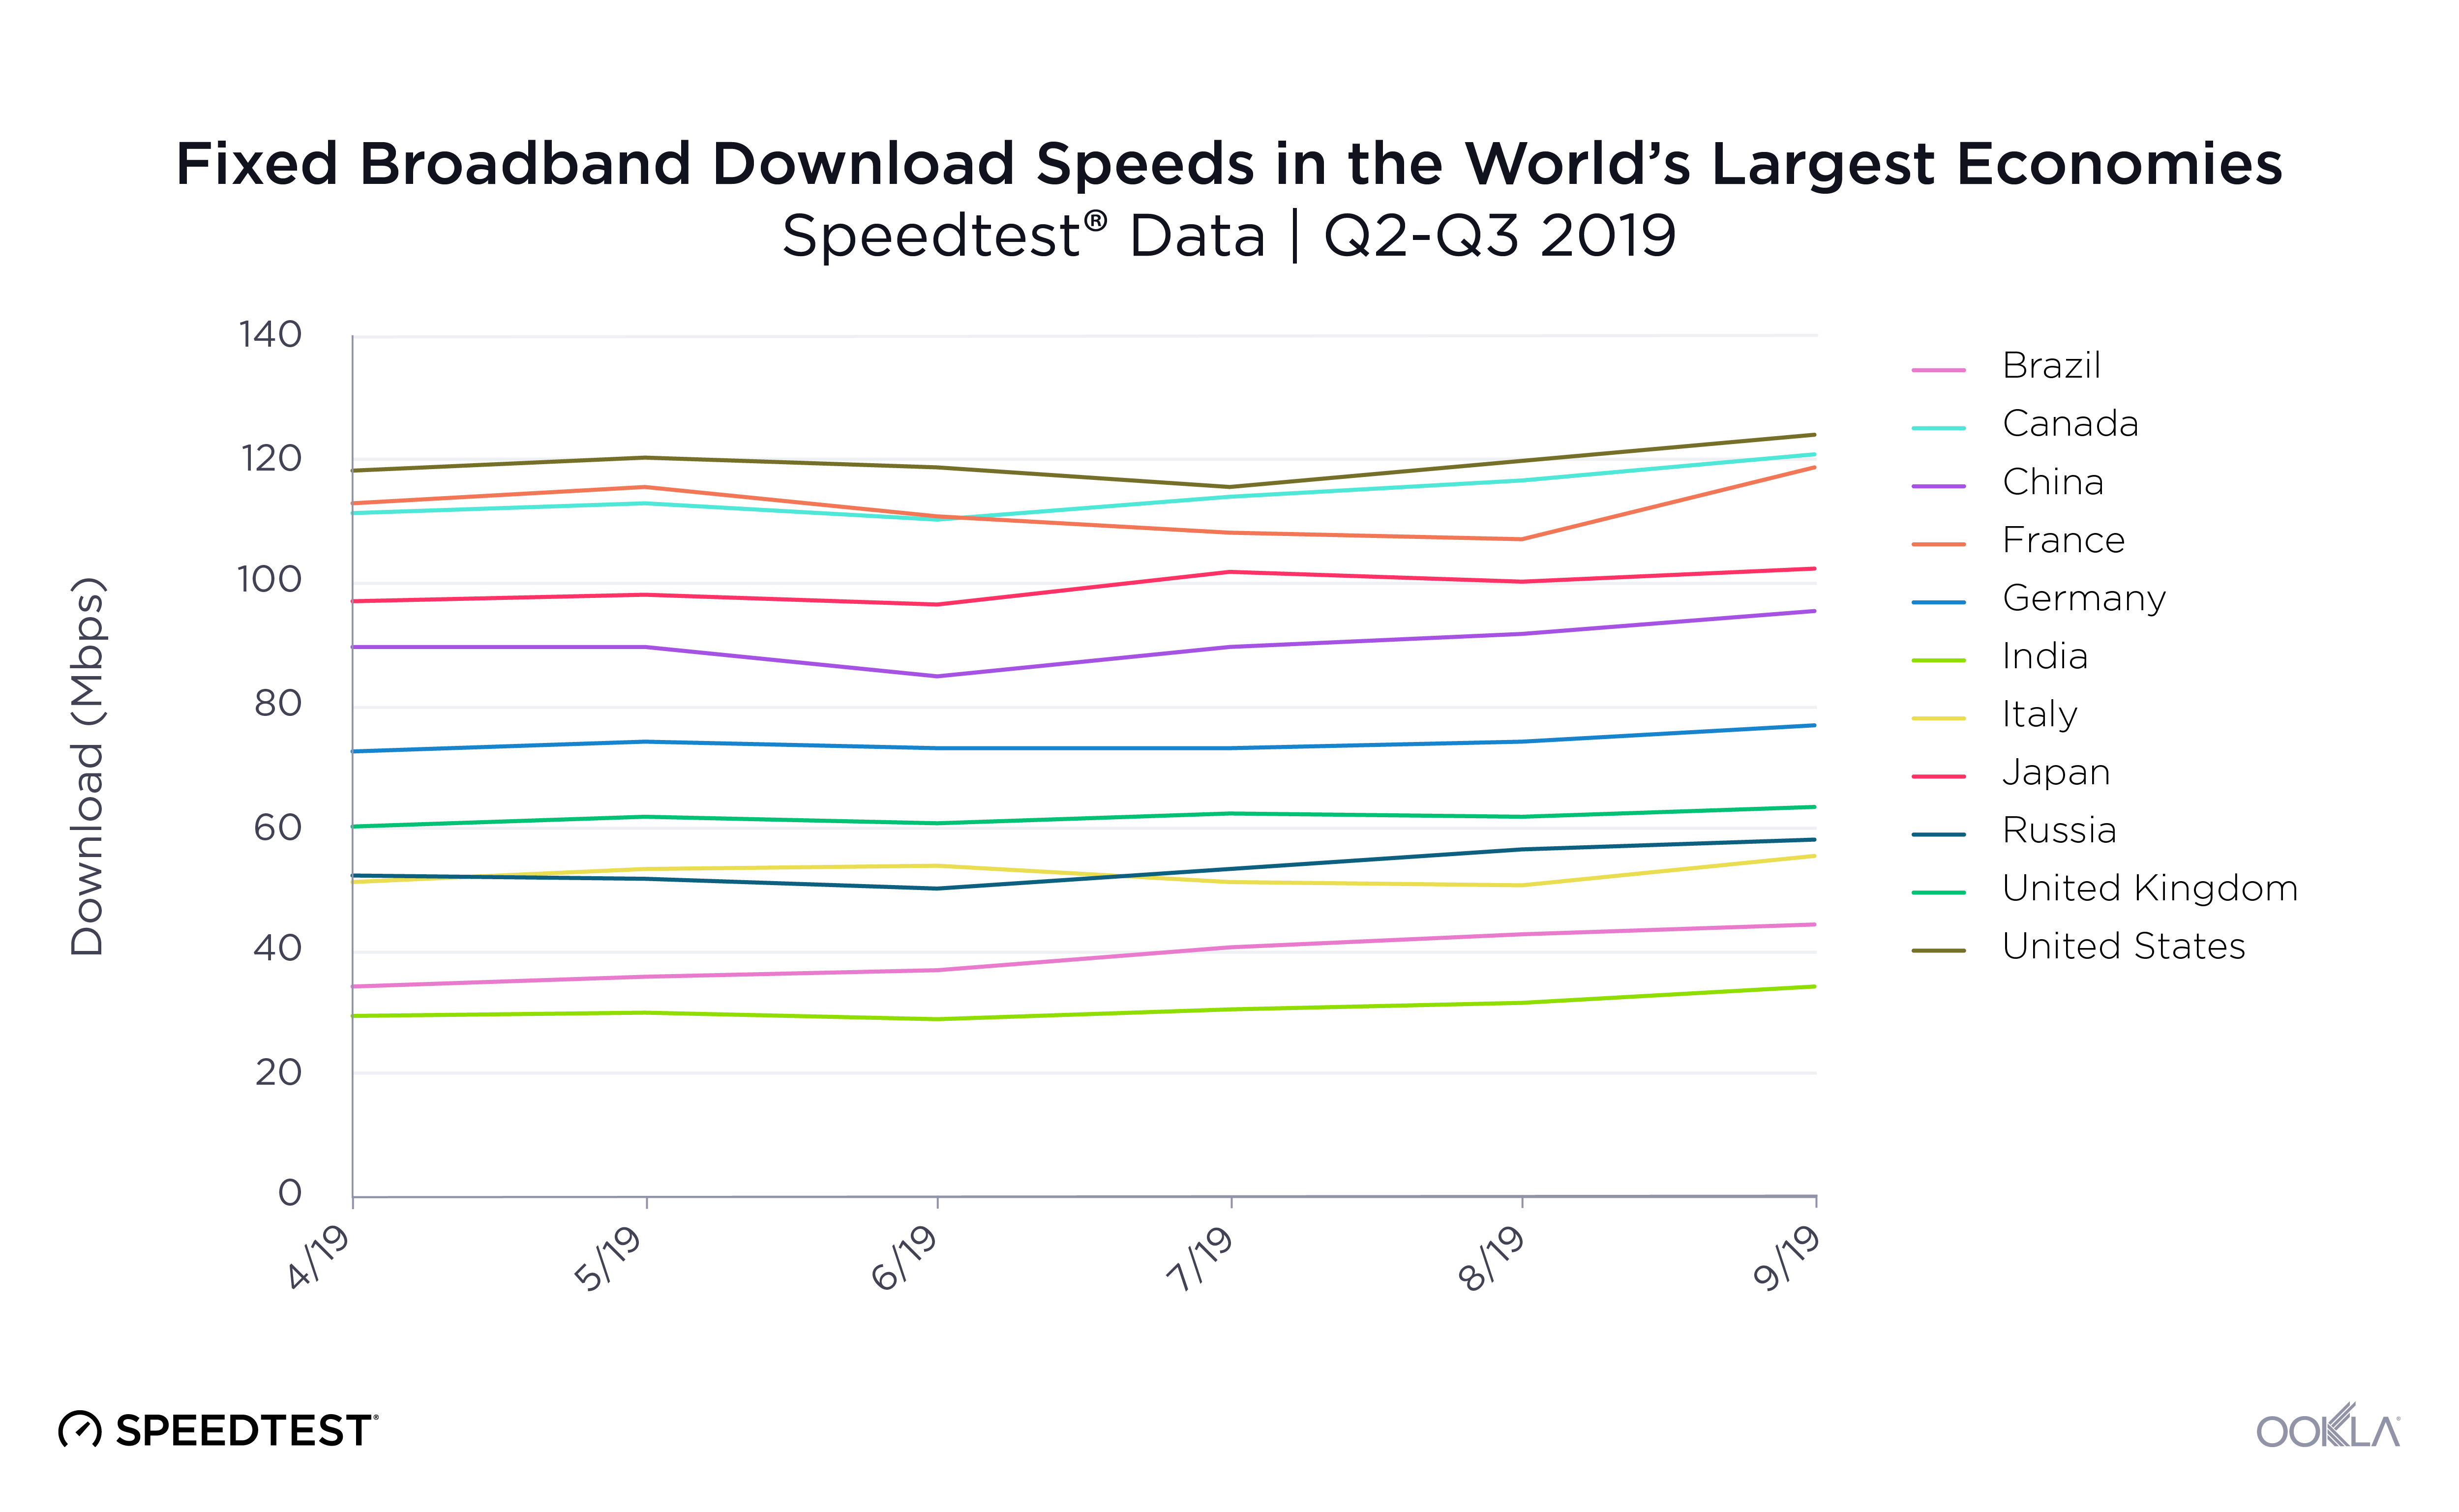
Russia’s mean download speed over fixed broadband trailed behind most of the world’s largest economies during Q2-Q3 2019. Russia placed ninth out of the 11 countries with a mean download speed of 53.46 Mbps during this period. Two other BRIC countries, Brazil and India, were slower than Russia with mean download speeds of 38.41 Mbps and 30.58 Mbps, respectively. The fourth BRIC country, China, placed fifth with a mean download over fixed broadband of 91.60 Mbps.

The United States secured the top spot among countries with the highest GDP with a mean download speed of 122.25 Mbps, 128.7% faster than Russia and 299.8% faster than India. Canada and France, ranked second and third, respectively, had almost identical mean download speeds of 112.86 Mbps and 112.84 Mbps, respectively.

On a month by month level, it’s interesting to note that most of the countries’ rankings did not change during this period — the exceptions were Russia and Italy which vied for eighth and ninth place and Canada which overtook France.

Brazil had the most significant gain during Q2-Q3 2019, with an increase in mean download speed of 29.5% (from 34.23 Mbps in April to 44.34 Mbps in September). India and Russia also experienced notable increases in their speeds. India’s mean download speed increased by 16.5%, while Russia experienced an 11.0% increase in mean download speed in the span of six months. These improvements open the door to the possibility of higher rankings for all three countries in the future.

Rankings on upload speed over fixed broadband did not match those for download speeds. Russia ranked well at third place (with a mean upload speed of 55.78 Mbps) during Q2-Q3 2019 when comparing upload speeds among countries with the highest GDP. Upload speeds on the top three spots showed a significant gap between Japan’s first place 105.83 Mbps and Russia’s 55.78 Mbps, a drop of 47.3%. Brazil, Germany and the U.K. fell to the last three spots in this category with upload speeds ranging from 15.62 Mbps to 19.21 Mbps. First-place Japan’s mean upload speed was a remarkable 577.5% faster than that of the U.K. during Q2-Q3 2019.

Russia ranked 10th for mobile download speed

Mobile-Download-Speeds

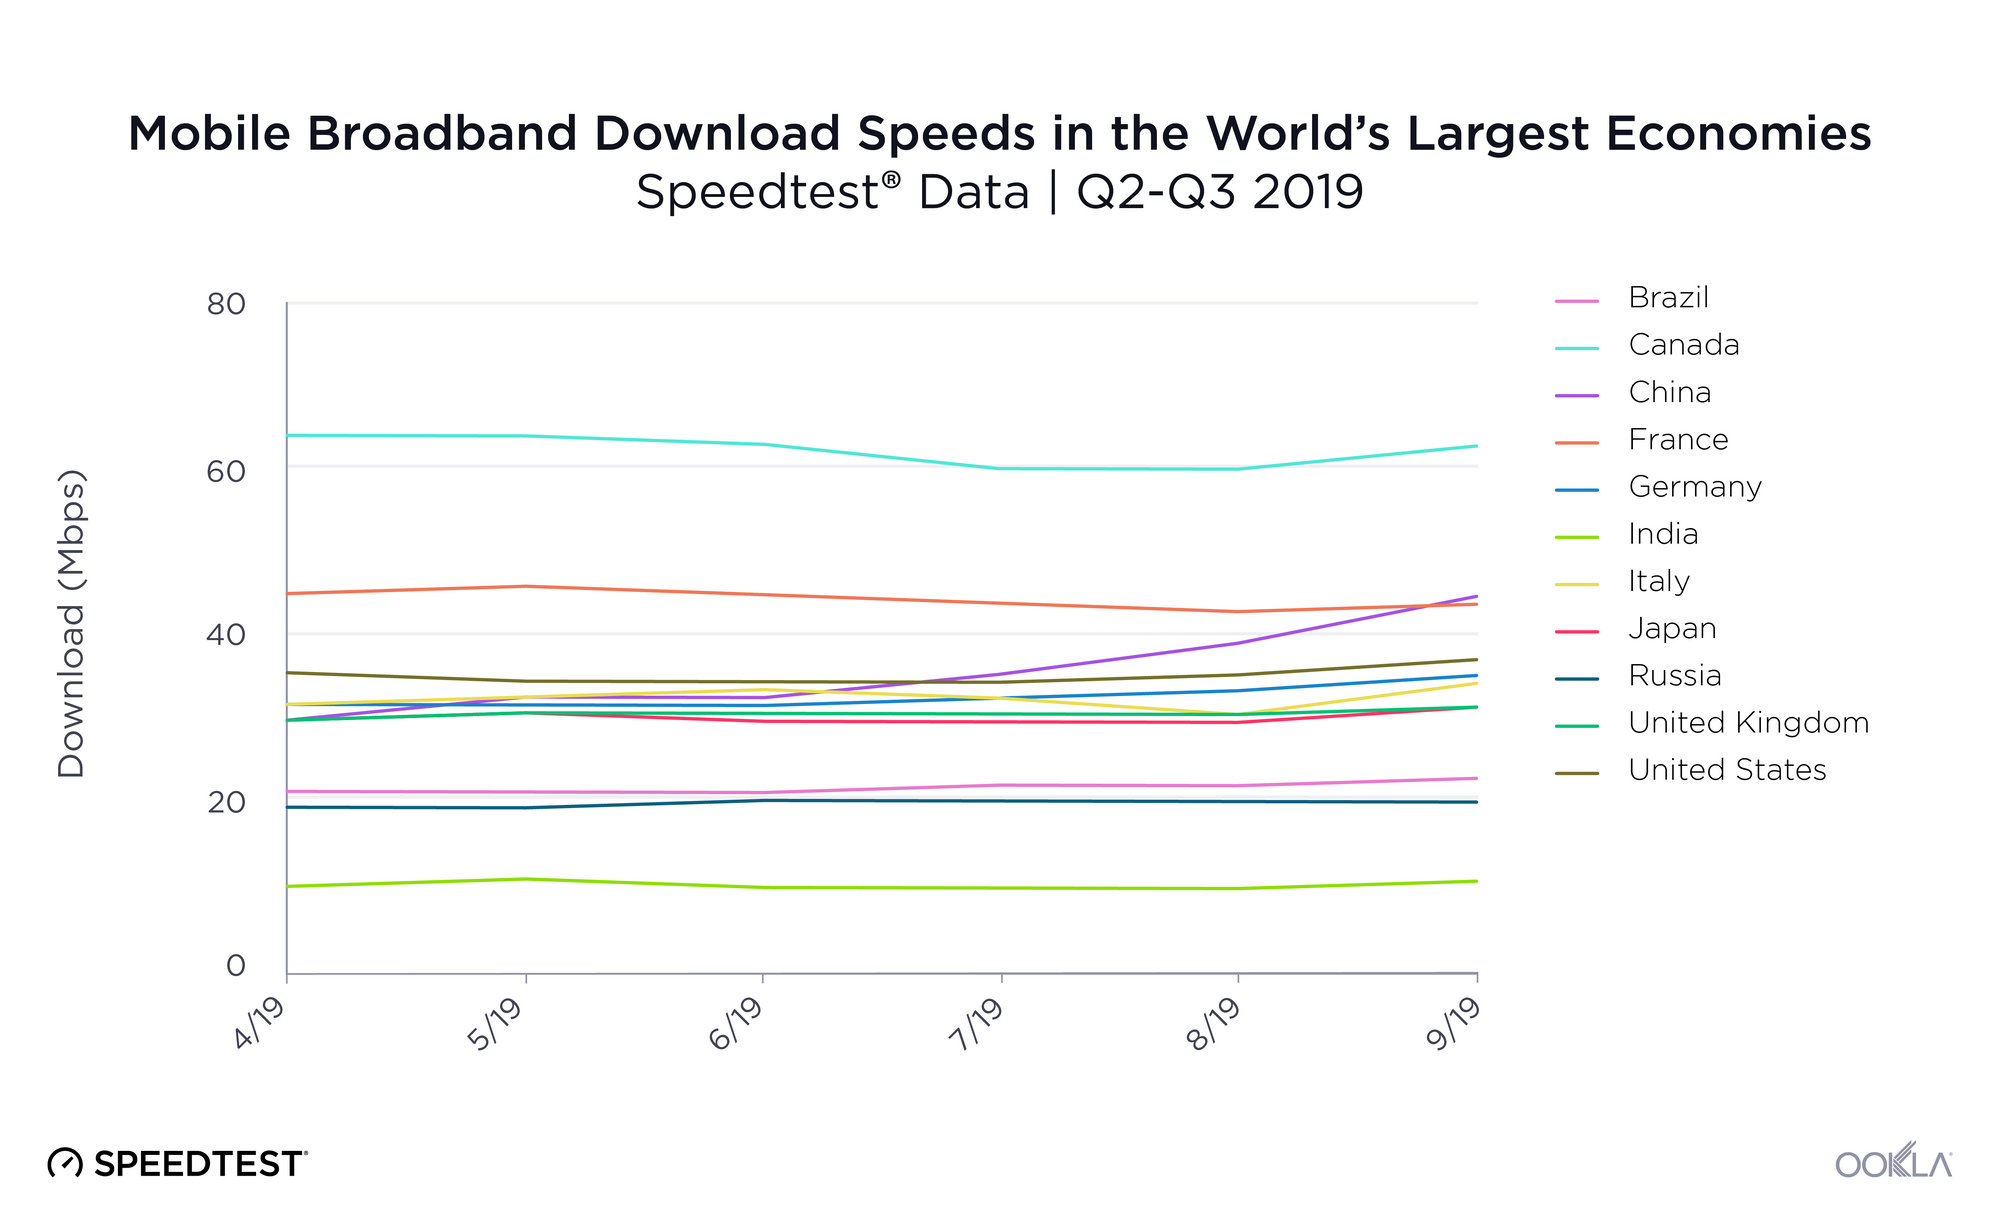
Speedtest data on mean download speeds over mobile reveals Canada, France, and China led the world’s largest economies during Q2-Q3 2019 with mean download speeds ranging between 36.68 Mbps and 62.62 Mbps. In tenth place, Russia once again landed in the bottom three along with Brazil and India. At 19.86 Mbps, Russia’s mean download speed on mobile was 68.3% slower than Canada’s.

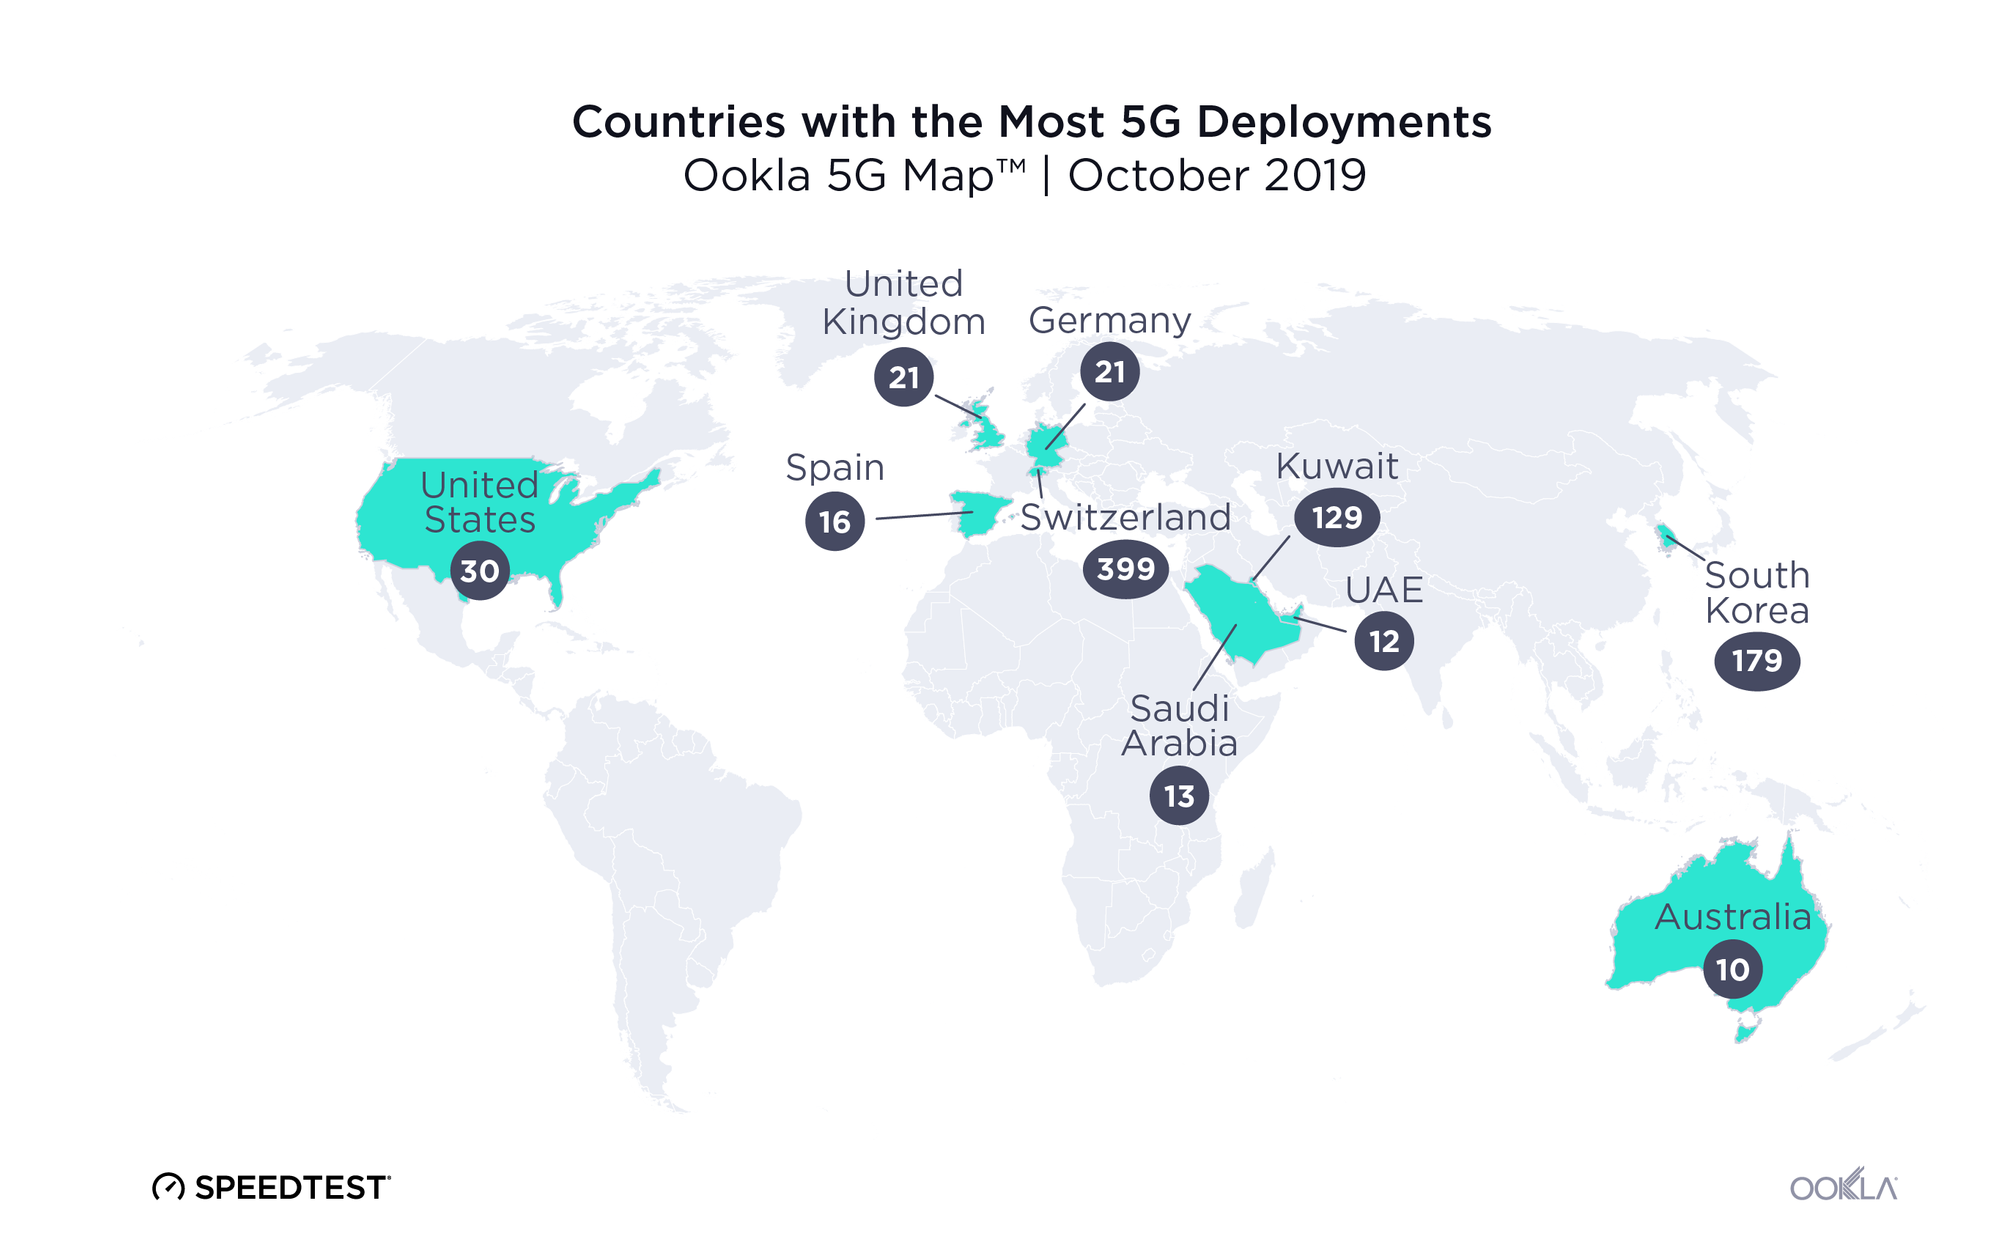
While there were significant shifts in the rankings of mobile download speed on a month by month basis, China was the only country that experienced a major increase in mobile speed during Q2-Q3 2019. From April to September, China’s mean download speed on mobile increased by a notable 51.3%. This increase makes it more likely for China to lead the group in this category in the future. 5G will of course play a role in mobile speed increases. According to the Ookla 5G MapTM, China, Germany, Italy, the U.K. and the U.S. are the only countries on this list with commercially available 5G as of November 18, 2019.

Russia also ranked poorly for mean upload speeds on mobile broadband during Q2-Q3 2019, coming in eighth with 9.40 Mbps when compared with the world’s largest economies. China ranked first with a mean upload speed of 14.86 Mbps, followed by Canada and Italy with mean upload speeds of 13.85 Mbps and 12.61 Mbps, respectively. Russia’s mean upload speed was 36.7% slower than China’s.

Japan, Brazil, and India made up the bottom three with mean upload speeds of 9.38 Mbps, 9.07 Mbps and 4.20 Mbps, respectively. First-place China’s mean upload speed was 253.8% faster than eleventh-place India’s mean upload speed during this period.

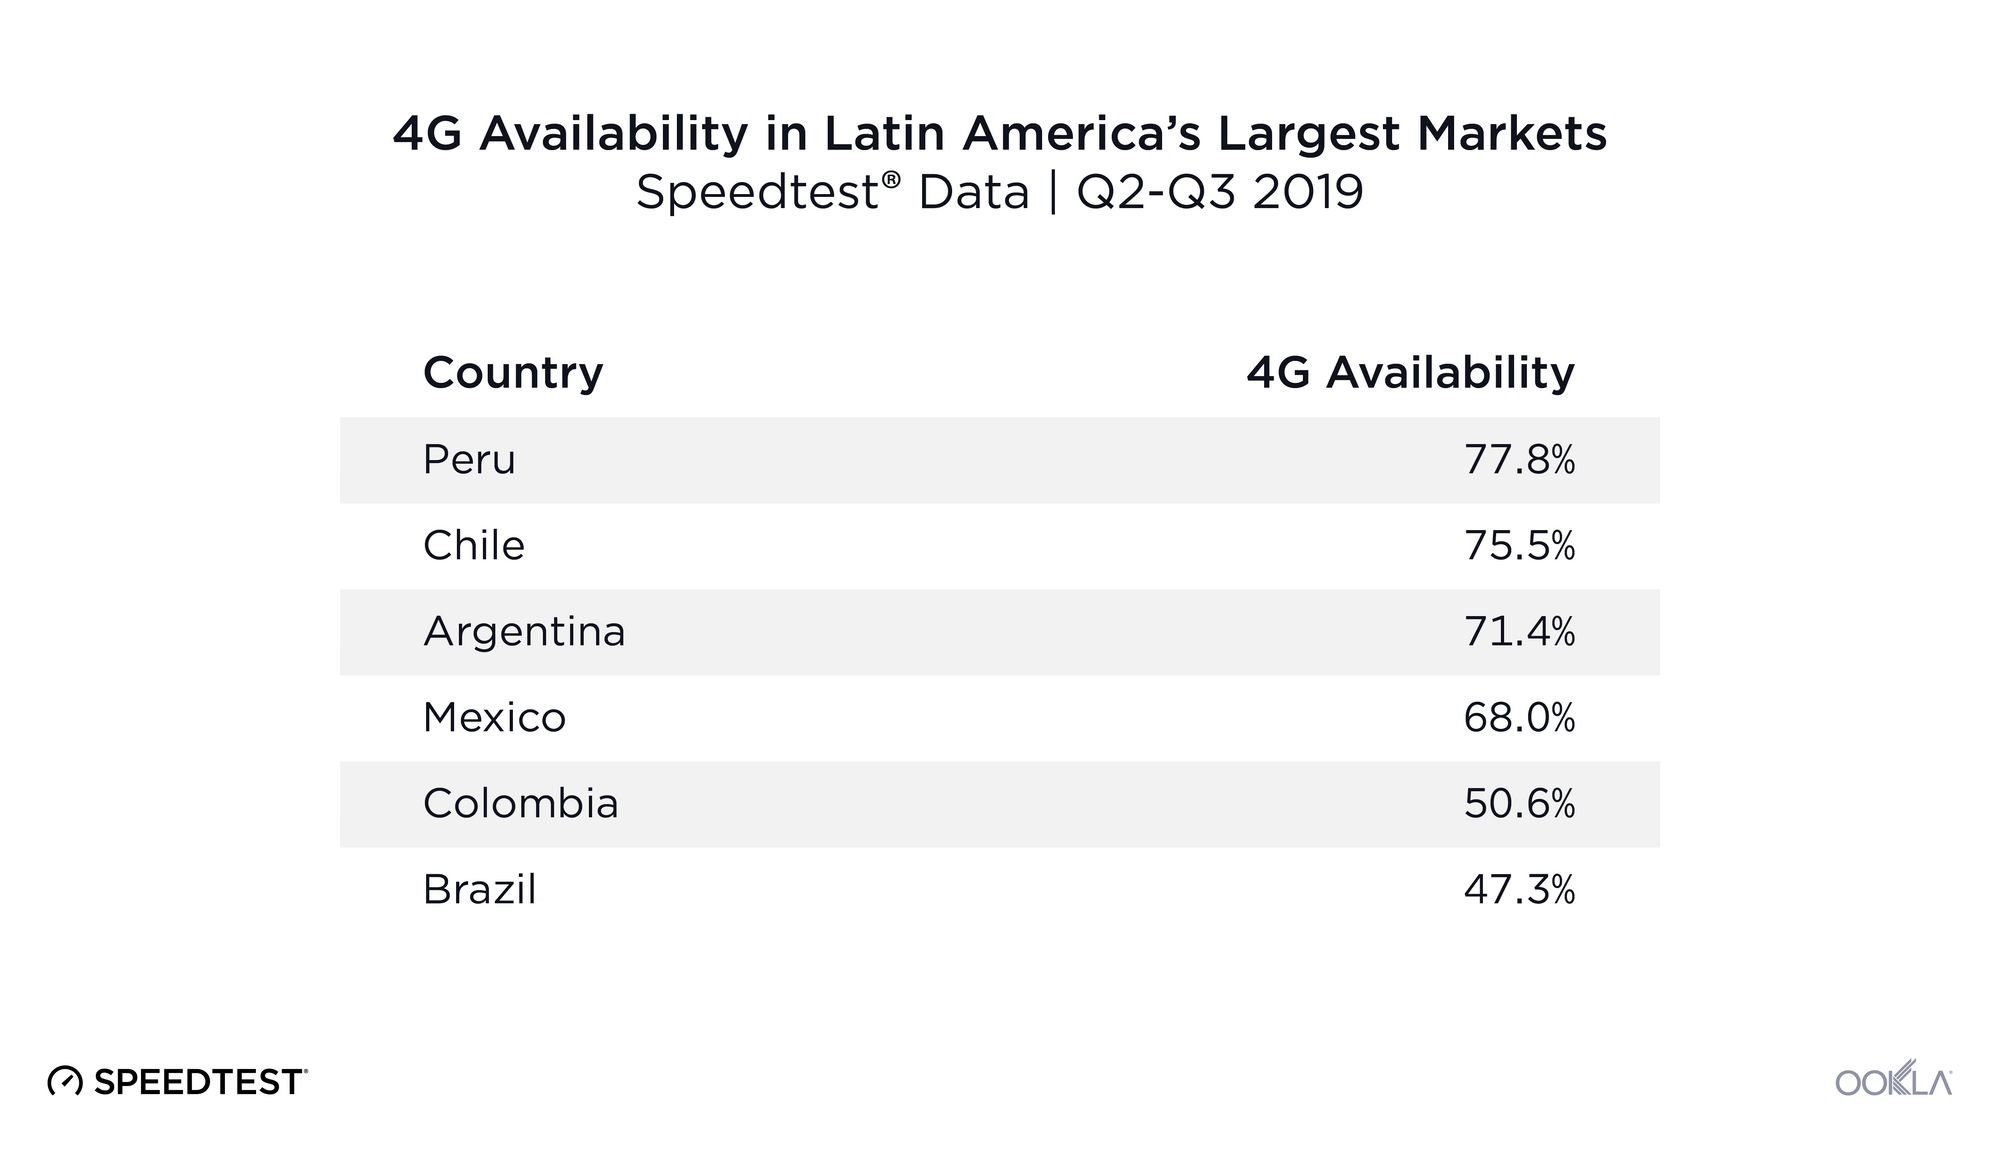
Russia’s 4G Availability was 60.4%

4G Availability in the World’s Largest Economies
Speedtest® Data | Q2-Q3 2019
Country 4G Availability
Japan 98.8%
China 96.7%
U.S. 94.0%
Canada 91.3%
U.K. 88.0%
India 87.9%
France 86.4%
Italy 85.0%
Germany 68.9%
Russia 60.4%
Brazil 47.3%

Russia ranked tenth for 4G Availability among the world’s largest economies during Q2-Q3 2019 with only 60.4% of surveyed locations in Russia having access to 4G LTE. This is not surprising given the vast land mass that Russian operators must contend with when building out mobile networks, as Russia is 80.1% larger in area than the next biggest country, Canada.

Japan had the highest 4G Availability on our list at 98.8%. China was a close second at 96.7% and the United States third at 94.0%. There was a significant gap in 4G Availability between eighth place Italy and ninth place Germany. Brazil completes the list in eleventh place.

Internet speeds vary widely between Russia’s largest cities

Fixed broadband download speeds in Russia’s largest cities

Ookla_Russia_Cities_Fixed-Broadband-Speeds_1119_en
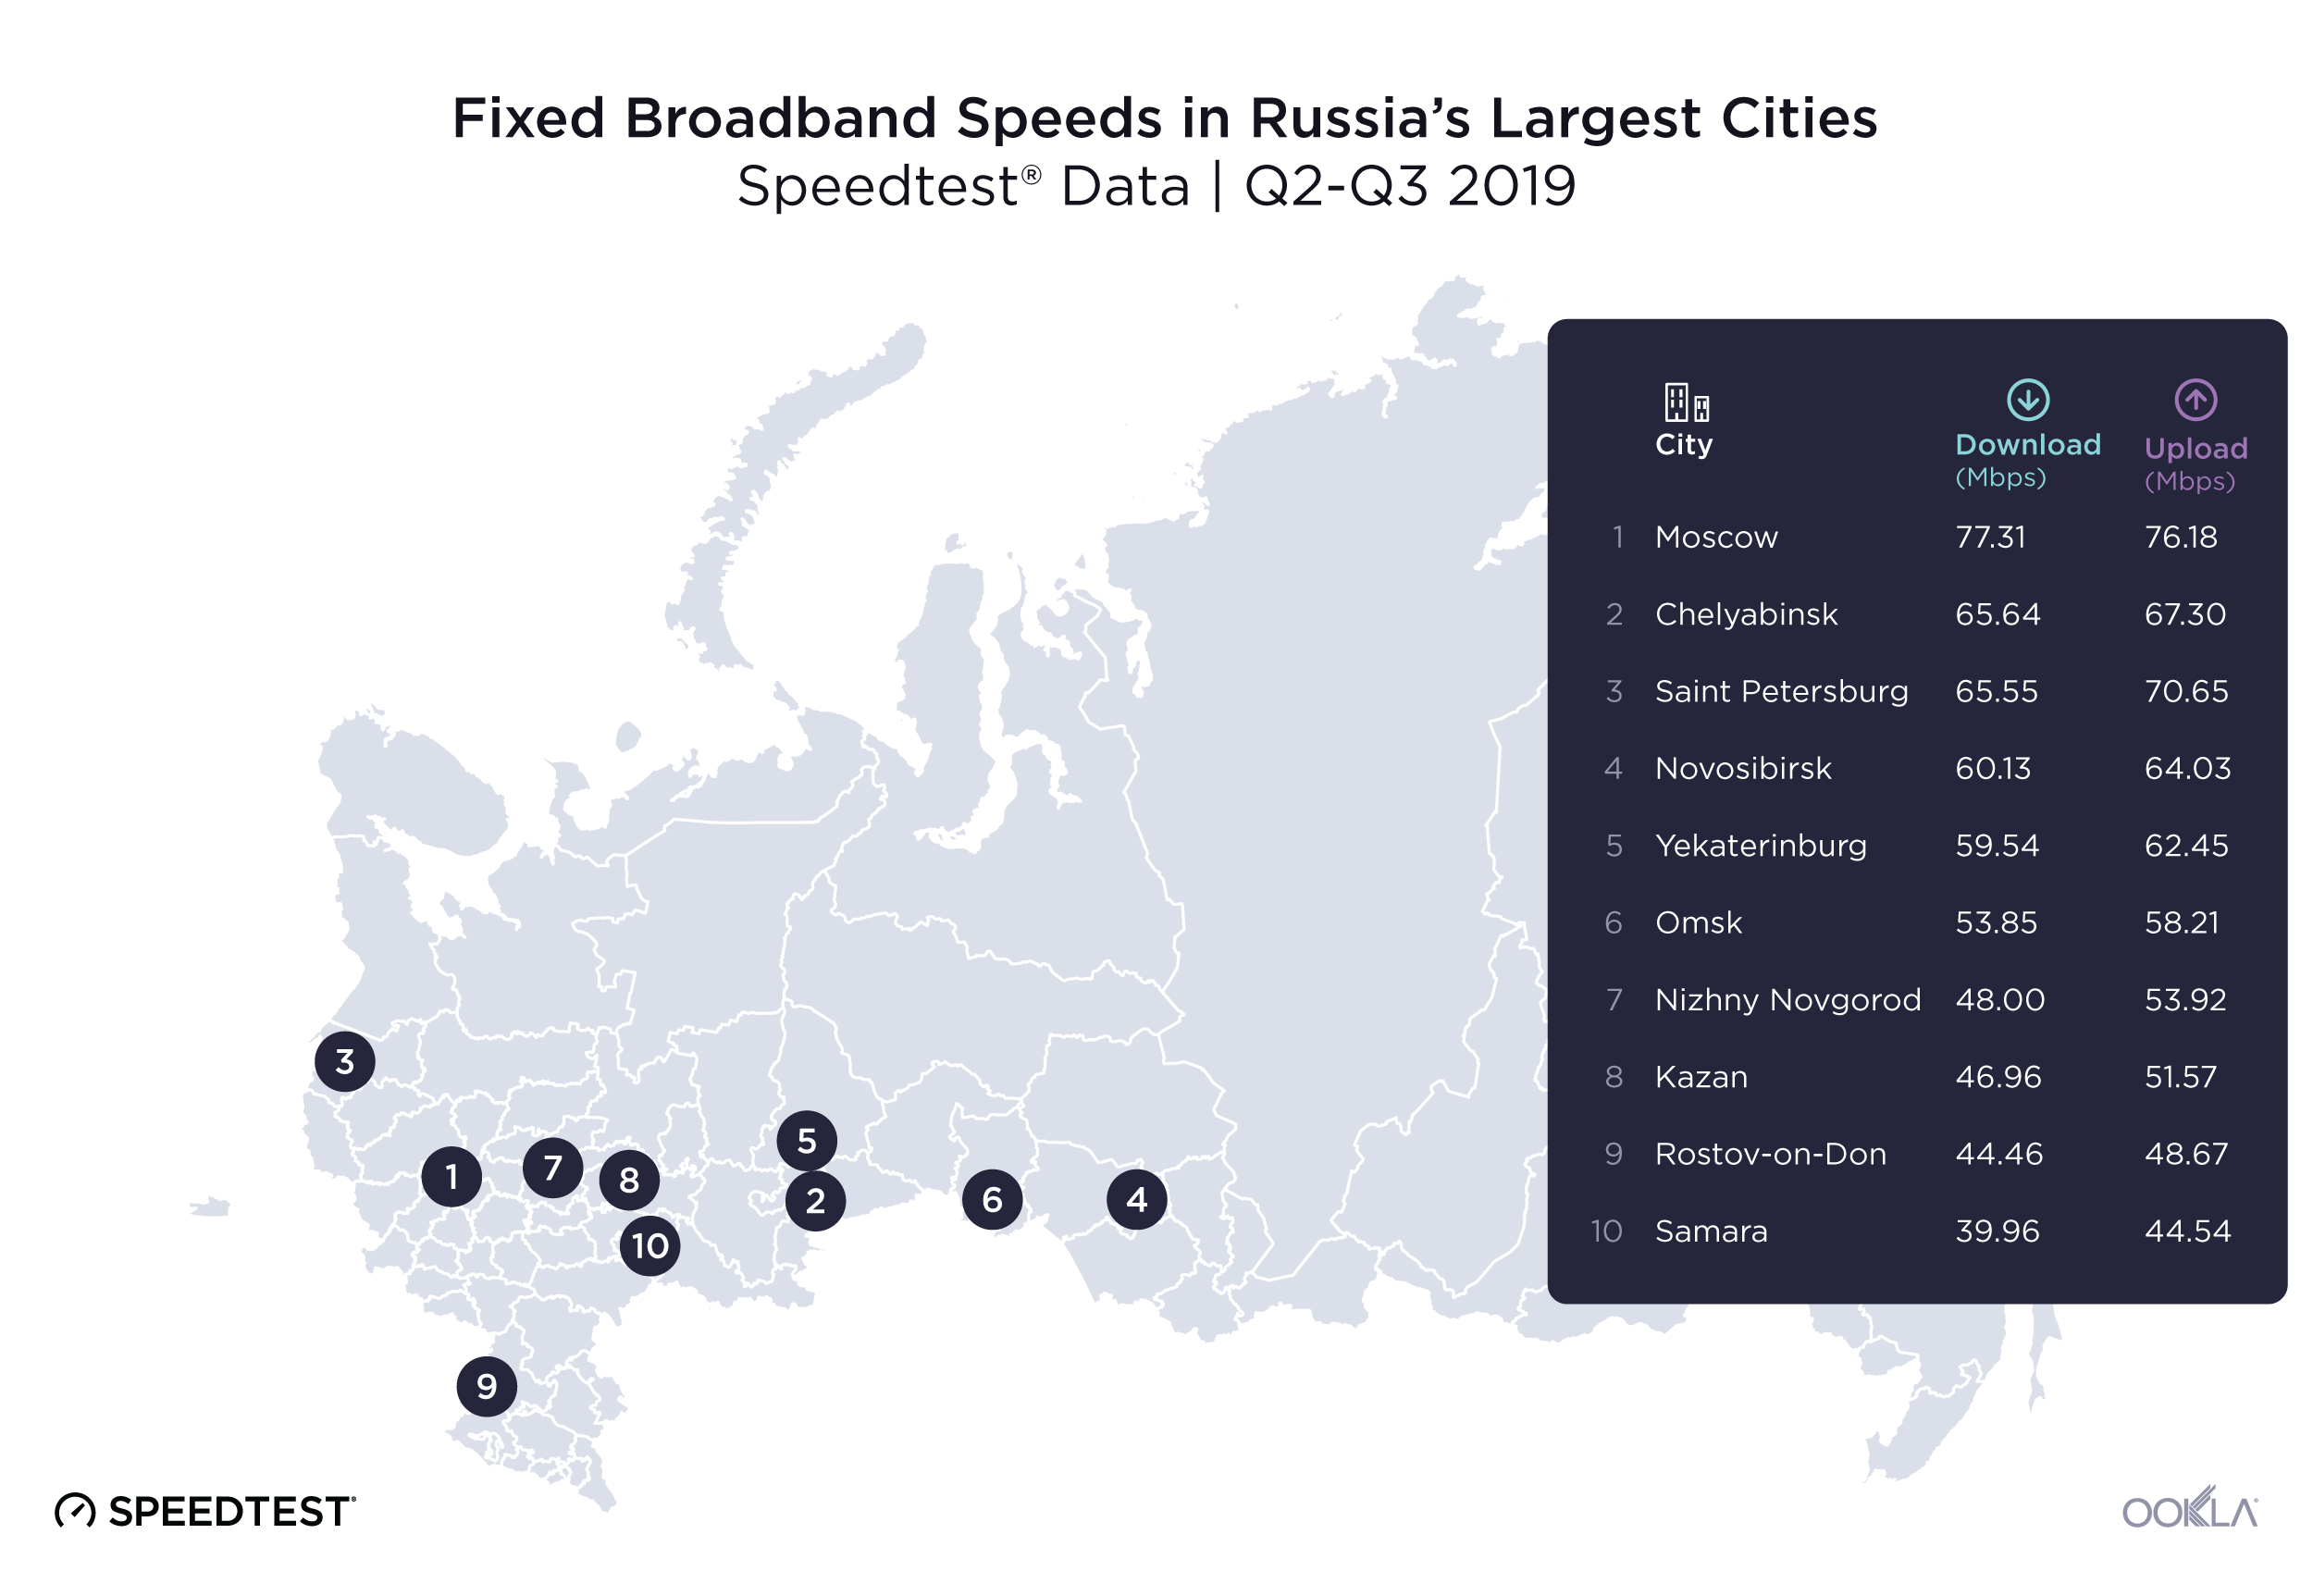
Speedtest data for mean download speed over fixed broadband showed a disparity among Russia’s most populous cities during Q2-Q3 2019. First place Moscow, both the most populous city on the list and Russia’s capital, had a mean download speed of 77.31 Mbps during Q2-Q3 2019. Moscow’s mean download speed over fixed broadband was 93.5% faster than last-place Samara’s at 39.96 Mbps.

Mean upload speeds on fixed broadband indicated a smaller gap between the fastest and slowest speeds. Moscow once again lead the group with a mean upload speed on fixed broadband of 76.18 Mbps, followed by Saint Petersburg with a mean upload speed of 70.65 Mbps. Rostov-on-Don and Samara ranked ninth and tenth with mean upload speeds of 48.67 Mbps and 44.54 Mbps, respectively. There was a 71.0% difference between Moscow’s mean upload speed and Samara’s during this period.

Mobile download speeds show less variation in Russia’s largest cities

Ookla_Russia_Cities_Mobile-Speeds_1119_en

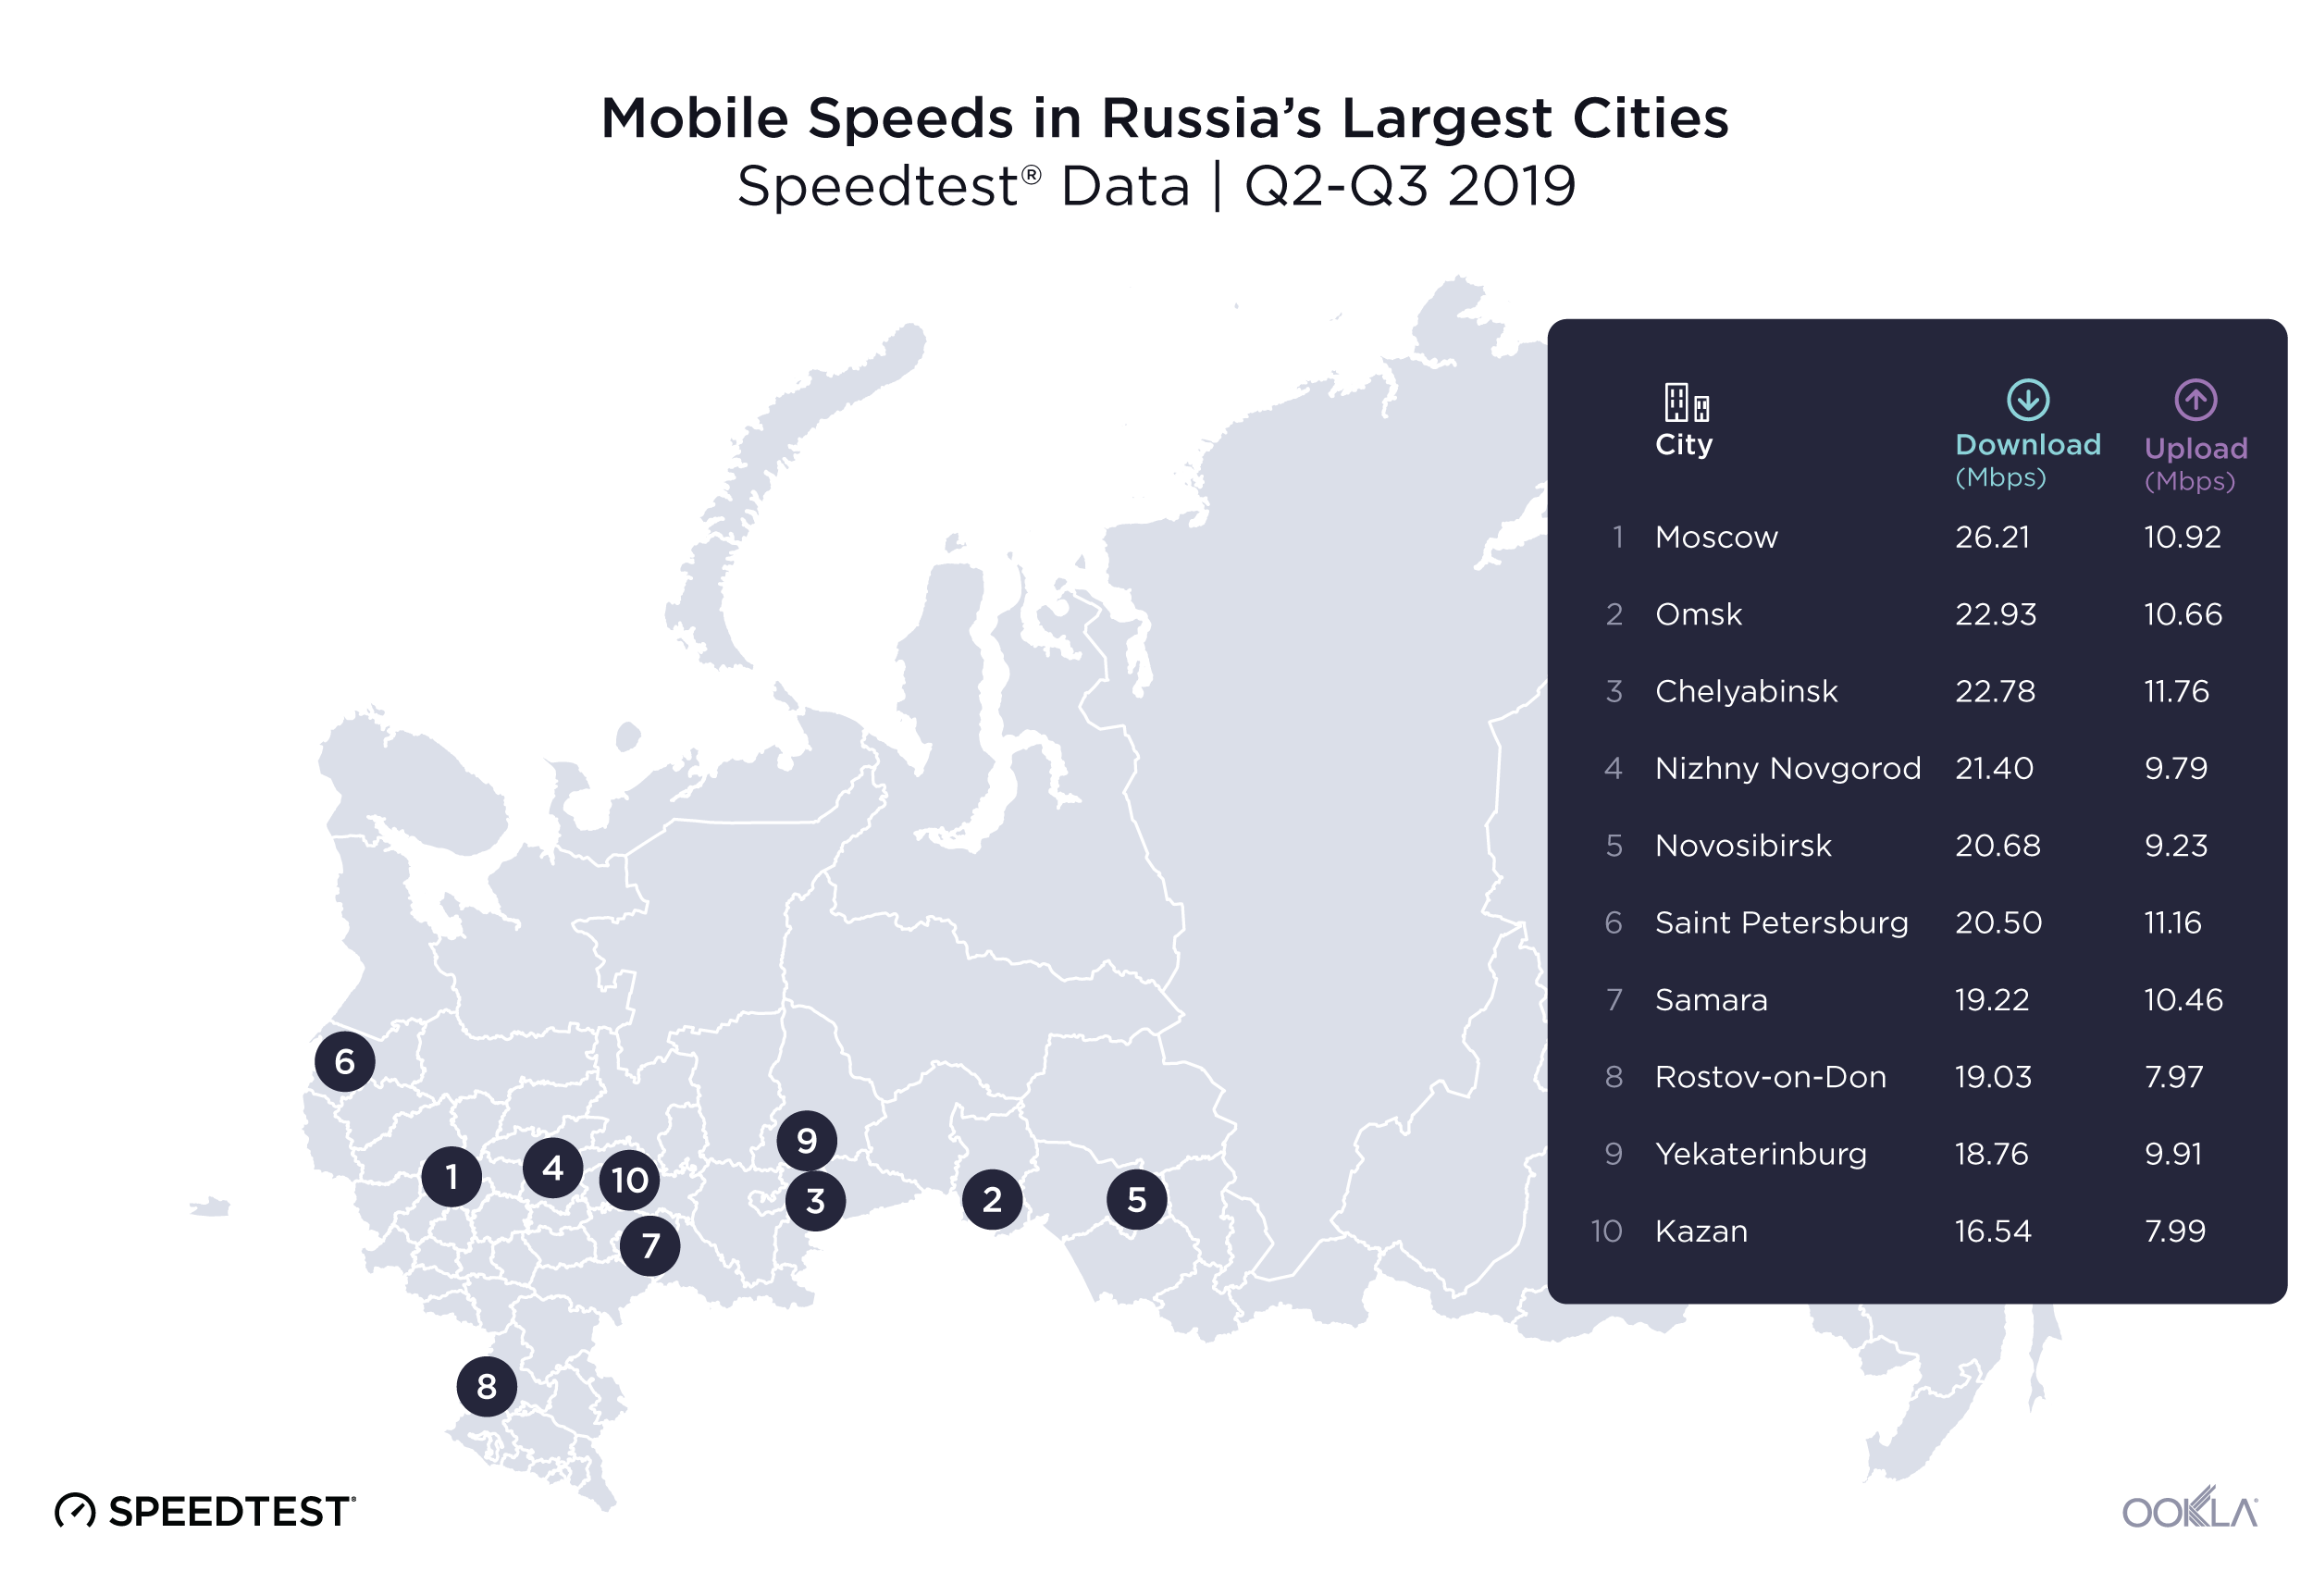
The gap between the fastest and slowest speeds in Russia’s largest cities was narrower on mobile broadband than on fixed during Q2-Q3 2019. Moscow ranked first with a mean download speed on mobile of 26.21 Mbps. Kazan had the slowest mean download speed at 16.54 Mbps. Moscow’s mean download speed was 58.5% faster than that of Kazan.

Chelyabinsk ranked first for mean upload speed on mobile broadband at 11.76 Mbps during Q2-Q3 2019. Saint Petersburg ranked second with 11.16 Mbps and Moscow ranked third with 10.92 Mbps. Rostov-on-Don ranked last with a mean upload speed of 7.97 Mbps, 32.2% slower than Chelyabinsk during this period.

4G Availability is relatively strong in Russia’s largest cities

Ookla_Russia_Cities_4G-Availability_1119_en
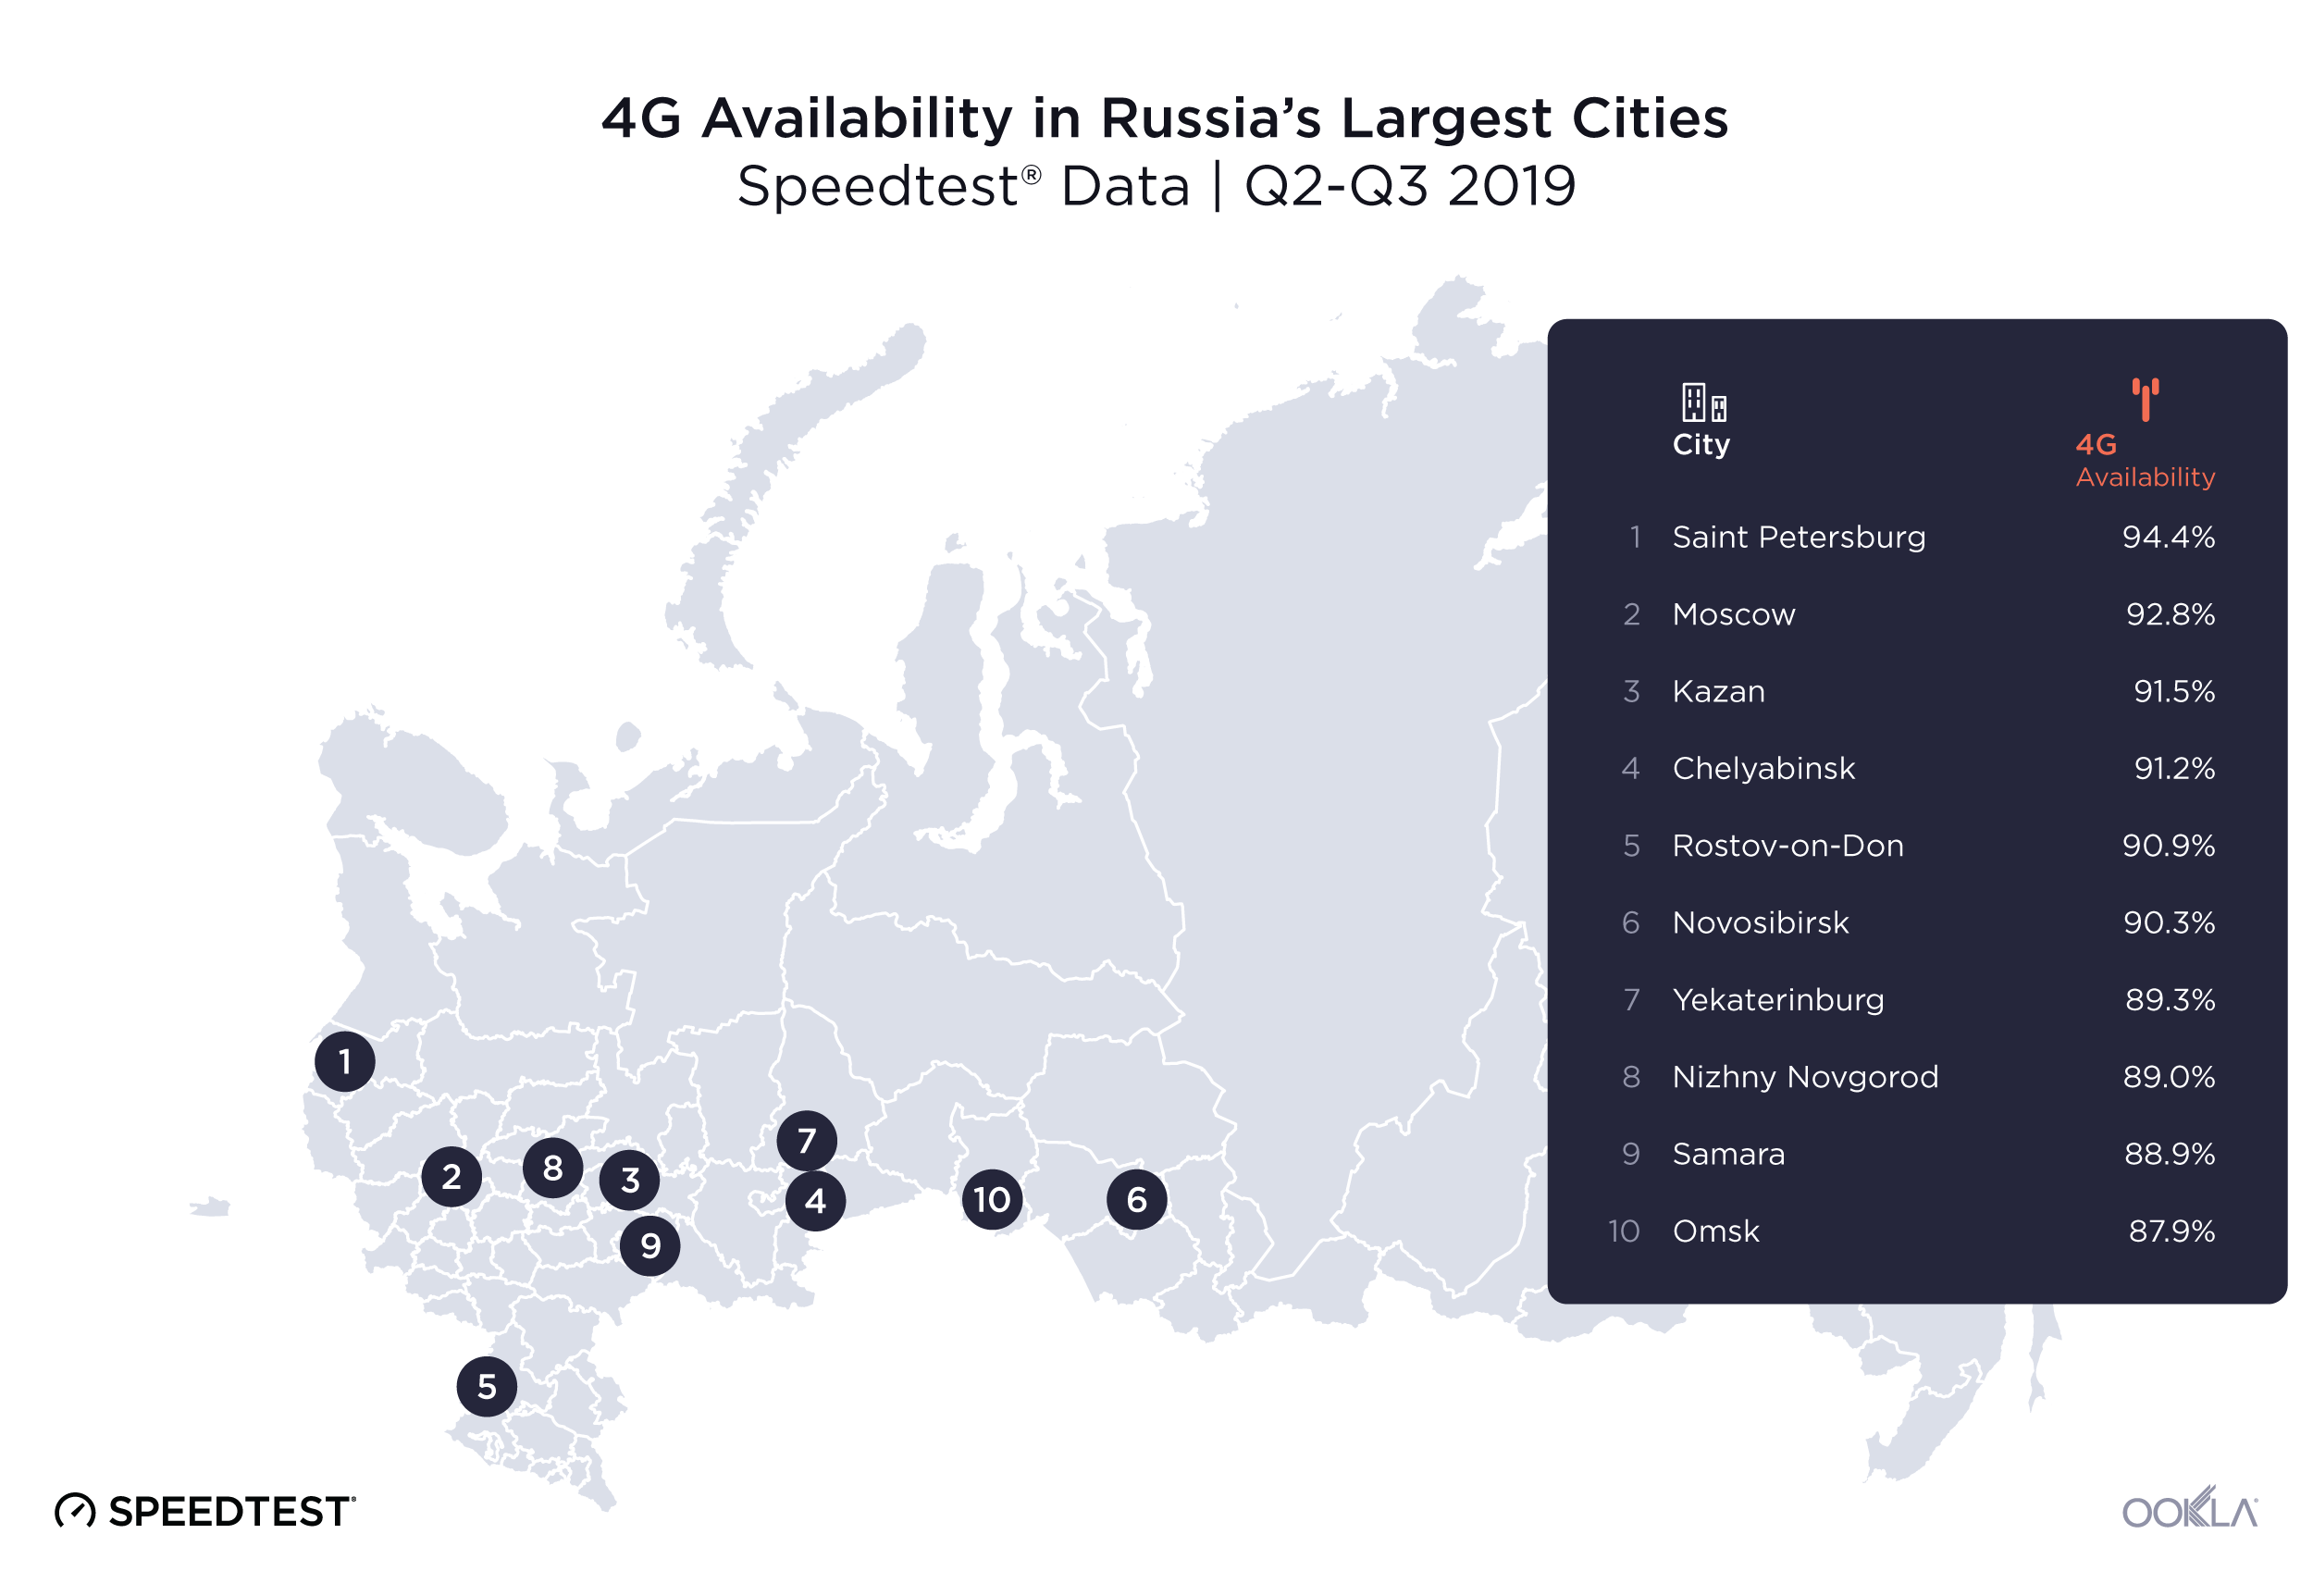
4G Availability during Q2-Q3 2019 was more consistent between Russia’s largest cities than internet speeds. Looking at 4G Availability during Q2-Q3 2019, Saint Petersburg was on top with 94.4% of surveyed locations showing access to 4G, followed by Moscow (92.8%) and Kazan (91.5%). Samara and Omsk ranked last for 4G Availability at 88.9% and 87.9%, respectively.

Internet speeds vary even more between Russia’s oblasts

We examined Speedtest data in Russia’s oblasts during Q2-Q3 2019 to see if there was any geographic logic to speeds. What we found was a large disparity in speeds that did not lend itself immediately to a geographic explanation.

Download speeds over fixed broadband are 175% faster in Russia’s fastest oblast than in the slowest

Ookla_Russia_Regional_Fixed-Broadband-Download-Speeds_1119_en

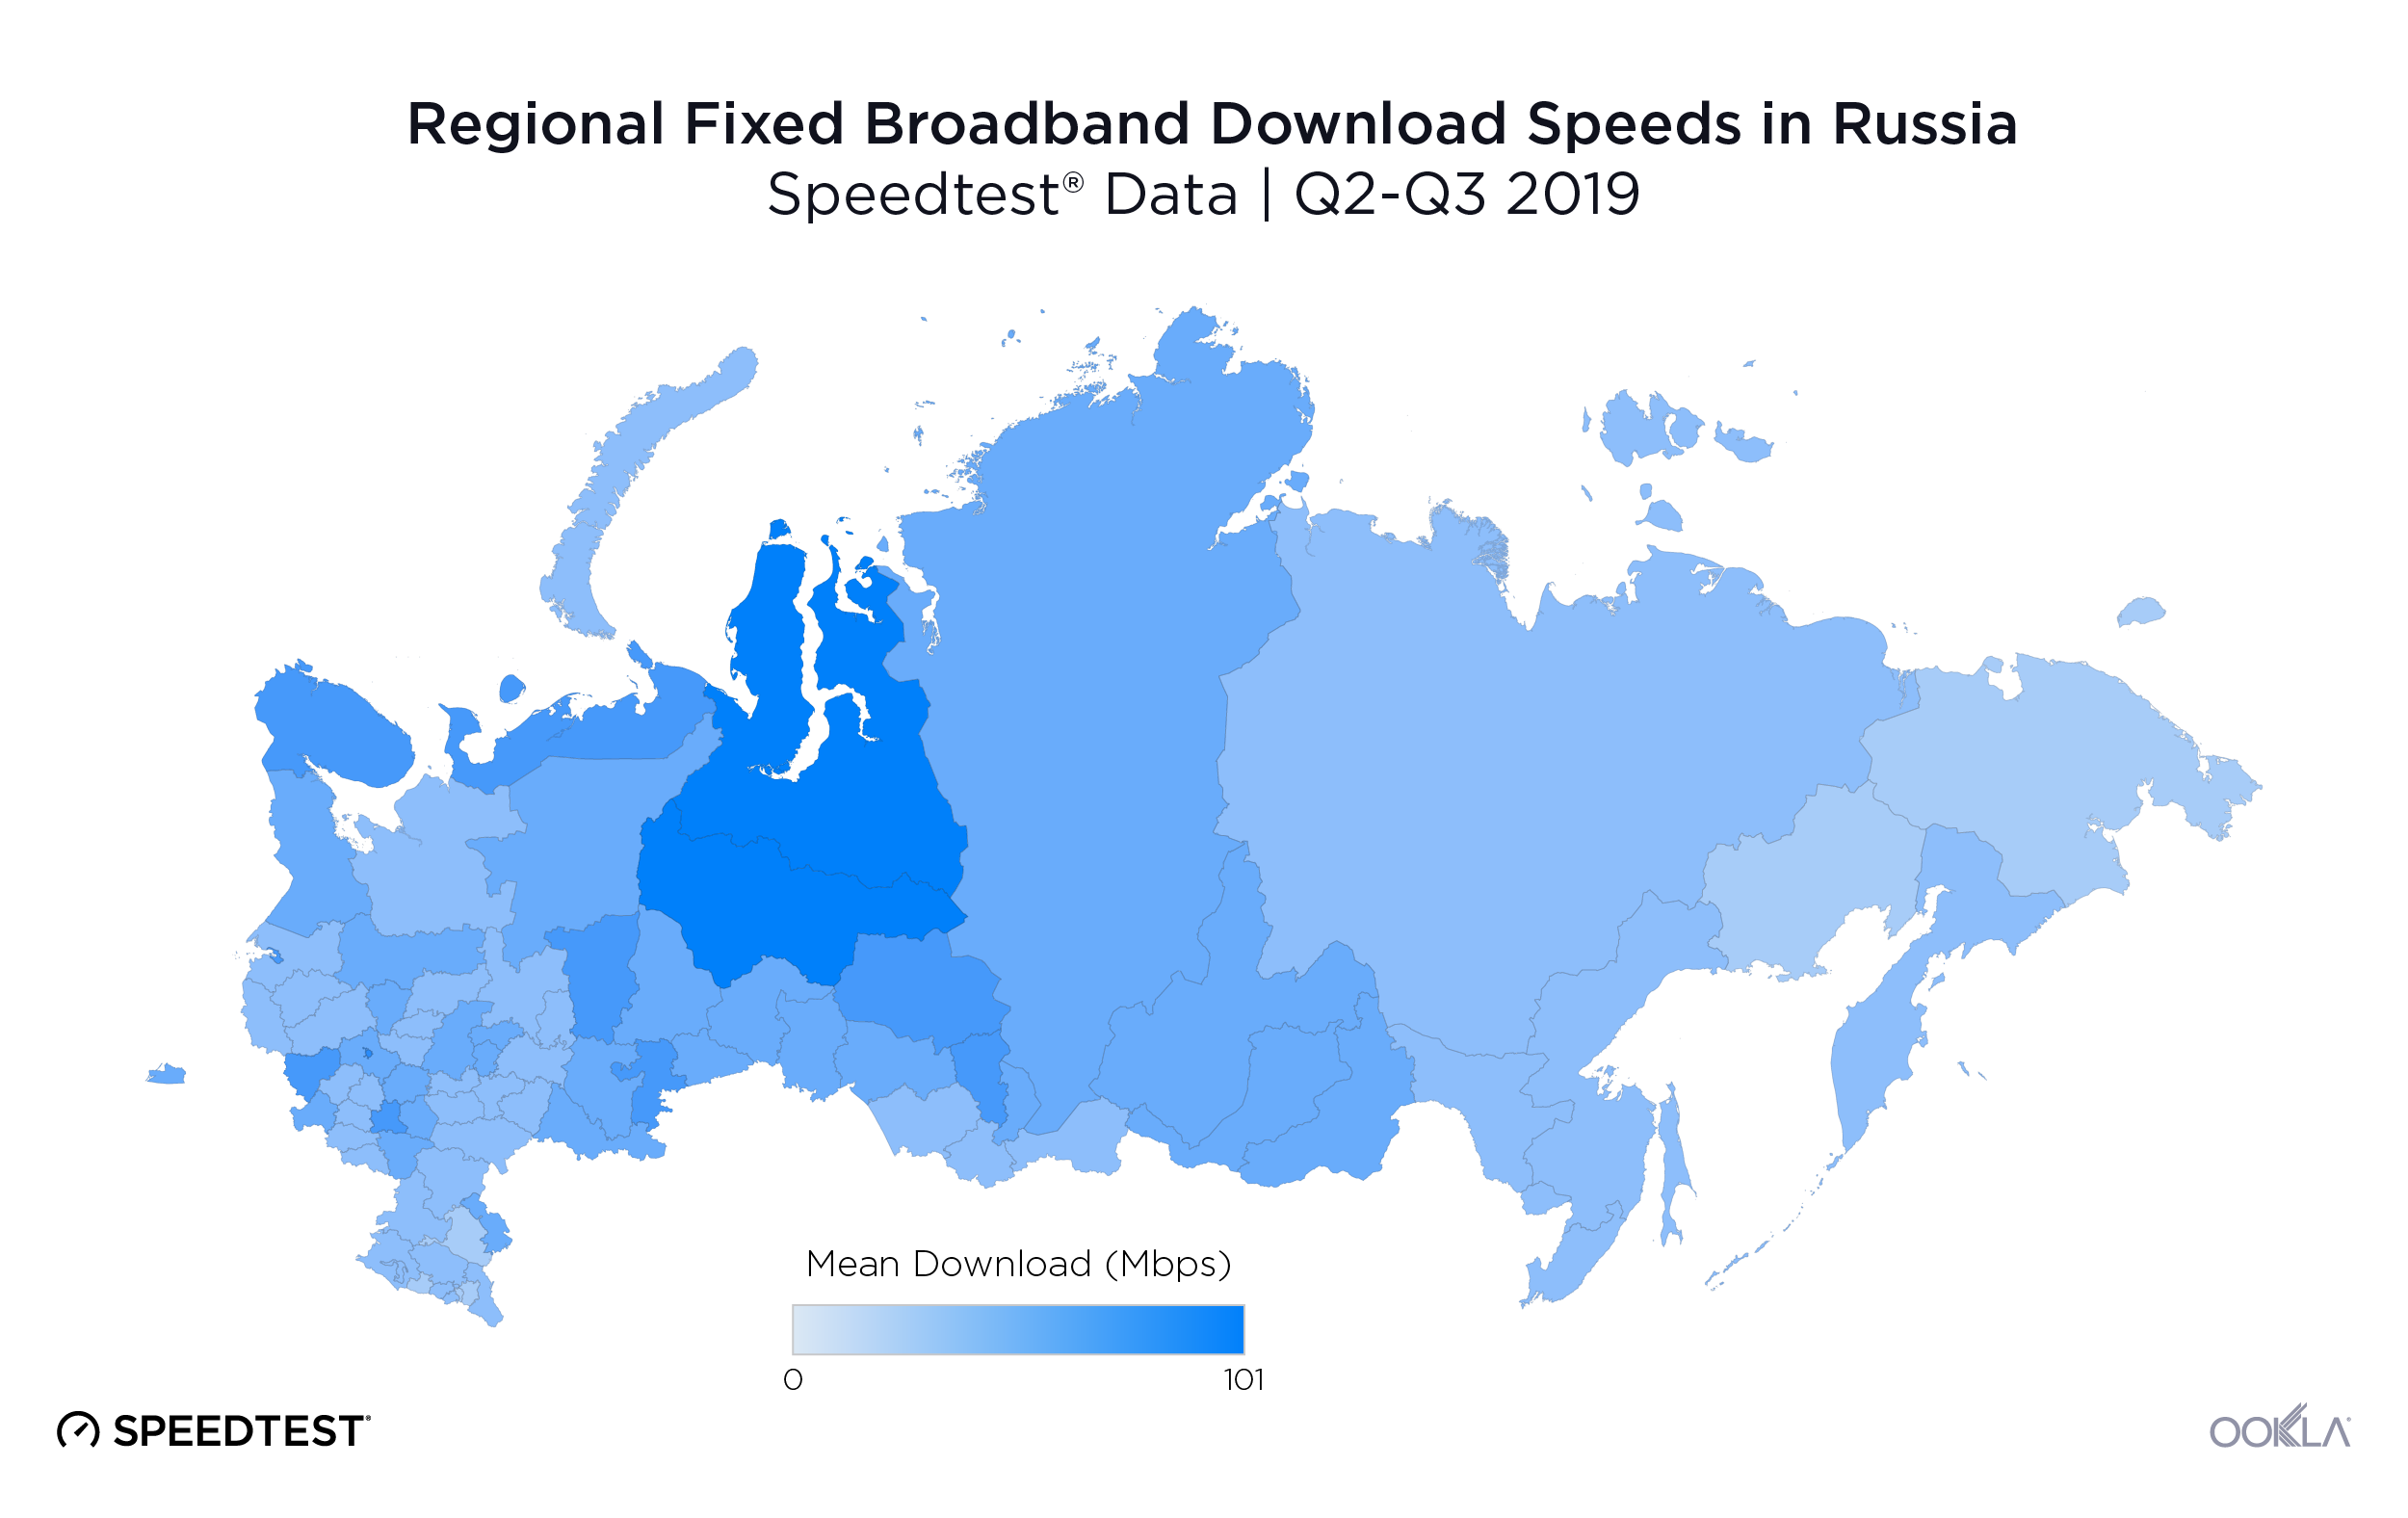
Murmansk, located near the border with Finland, was the fastest oblast in Russia during Q2-Q3 2019 with a mean download speed over fixed broadband of 71.13 Mbps. Kemerovo was second and Lipetsk third with mean download speeds of 68.32 Mbps and 66.37 Mbps, respectively. Kemerov is located in the south central region of the country, north of Russia’s border with Mongolia, Kazakhstan and China. Lipetsk is located closer to Europe, just east of Belarus.

Kaluga, Belgorod and Magadan were the three Russian oblasts with the slowest mean download speeds over fixed broadband in Q2-Q3 2019. First-place Murmank’s mean download speed was 175.0% faster than the mean download speed Magadan experienced during this period. Both Kaluga and Belgorod are located in the western part of the country, closer to Ukraine and Belarus. Magadan is on the other side of the country, closer to the Bering Sea and the Alaskan coast.

Mobile broadband speeds in Russia’s oblasts

Ookla_Russia_Regional_Mobile-Download-Speeds_1119_en
Aside for Murmansk and Kaluga, the list of oblasts with the fastest and slowest mean download speeds over mobile broadband during Q2-Q3 2019 was completely different from what we saw with fixed broadband. In addition, the range of speeds among Russian oblasts narrowed on mobile broadband.

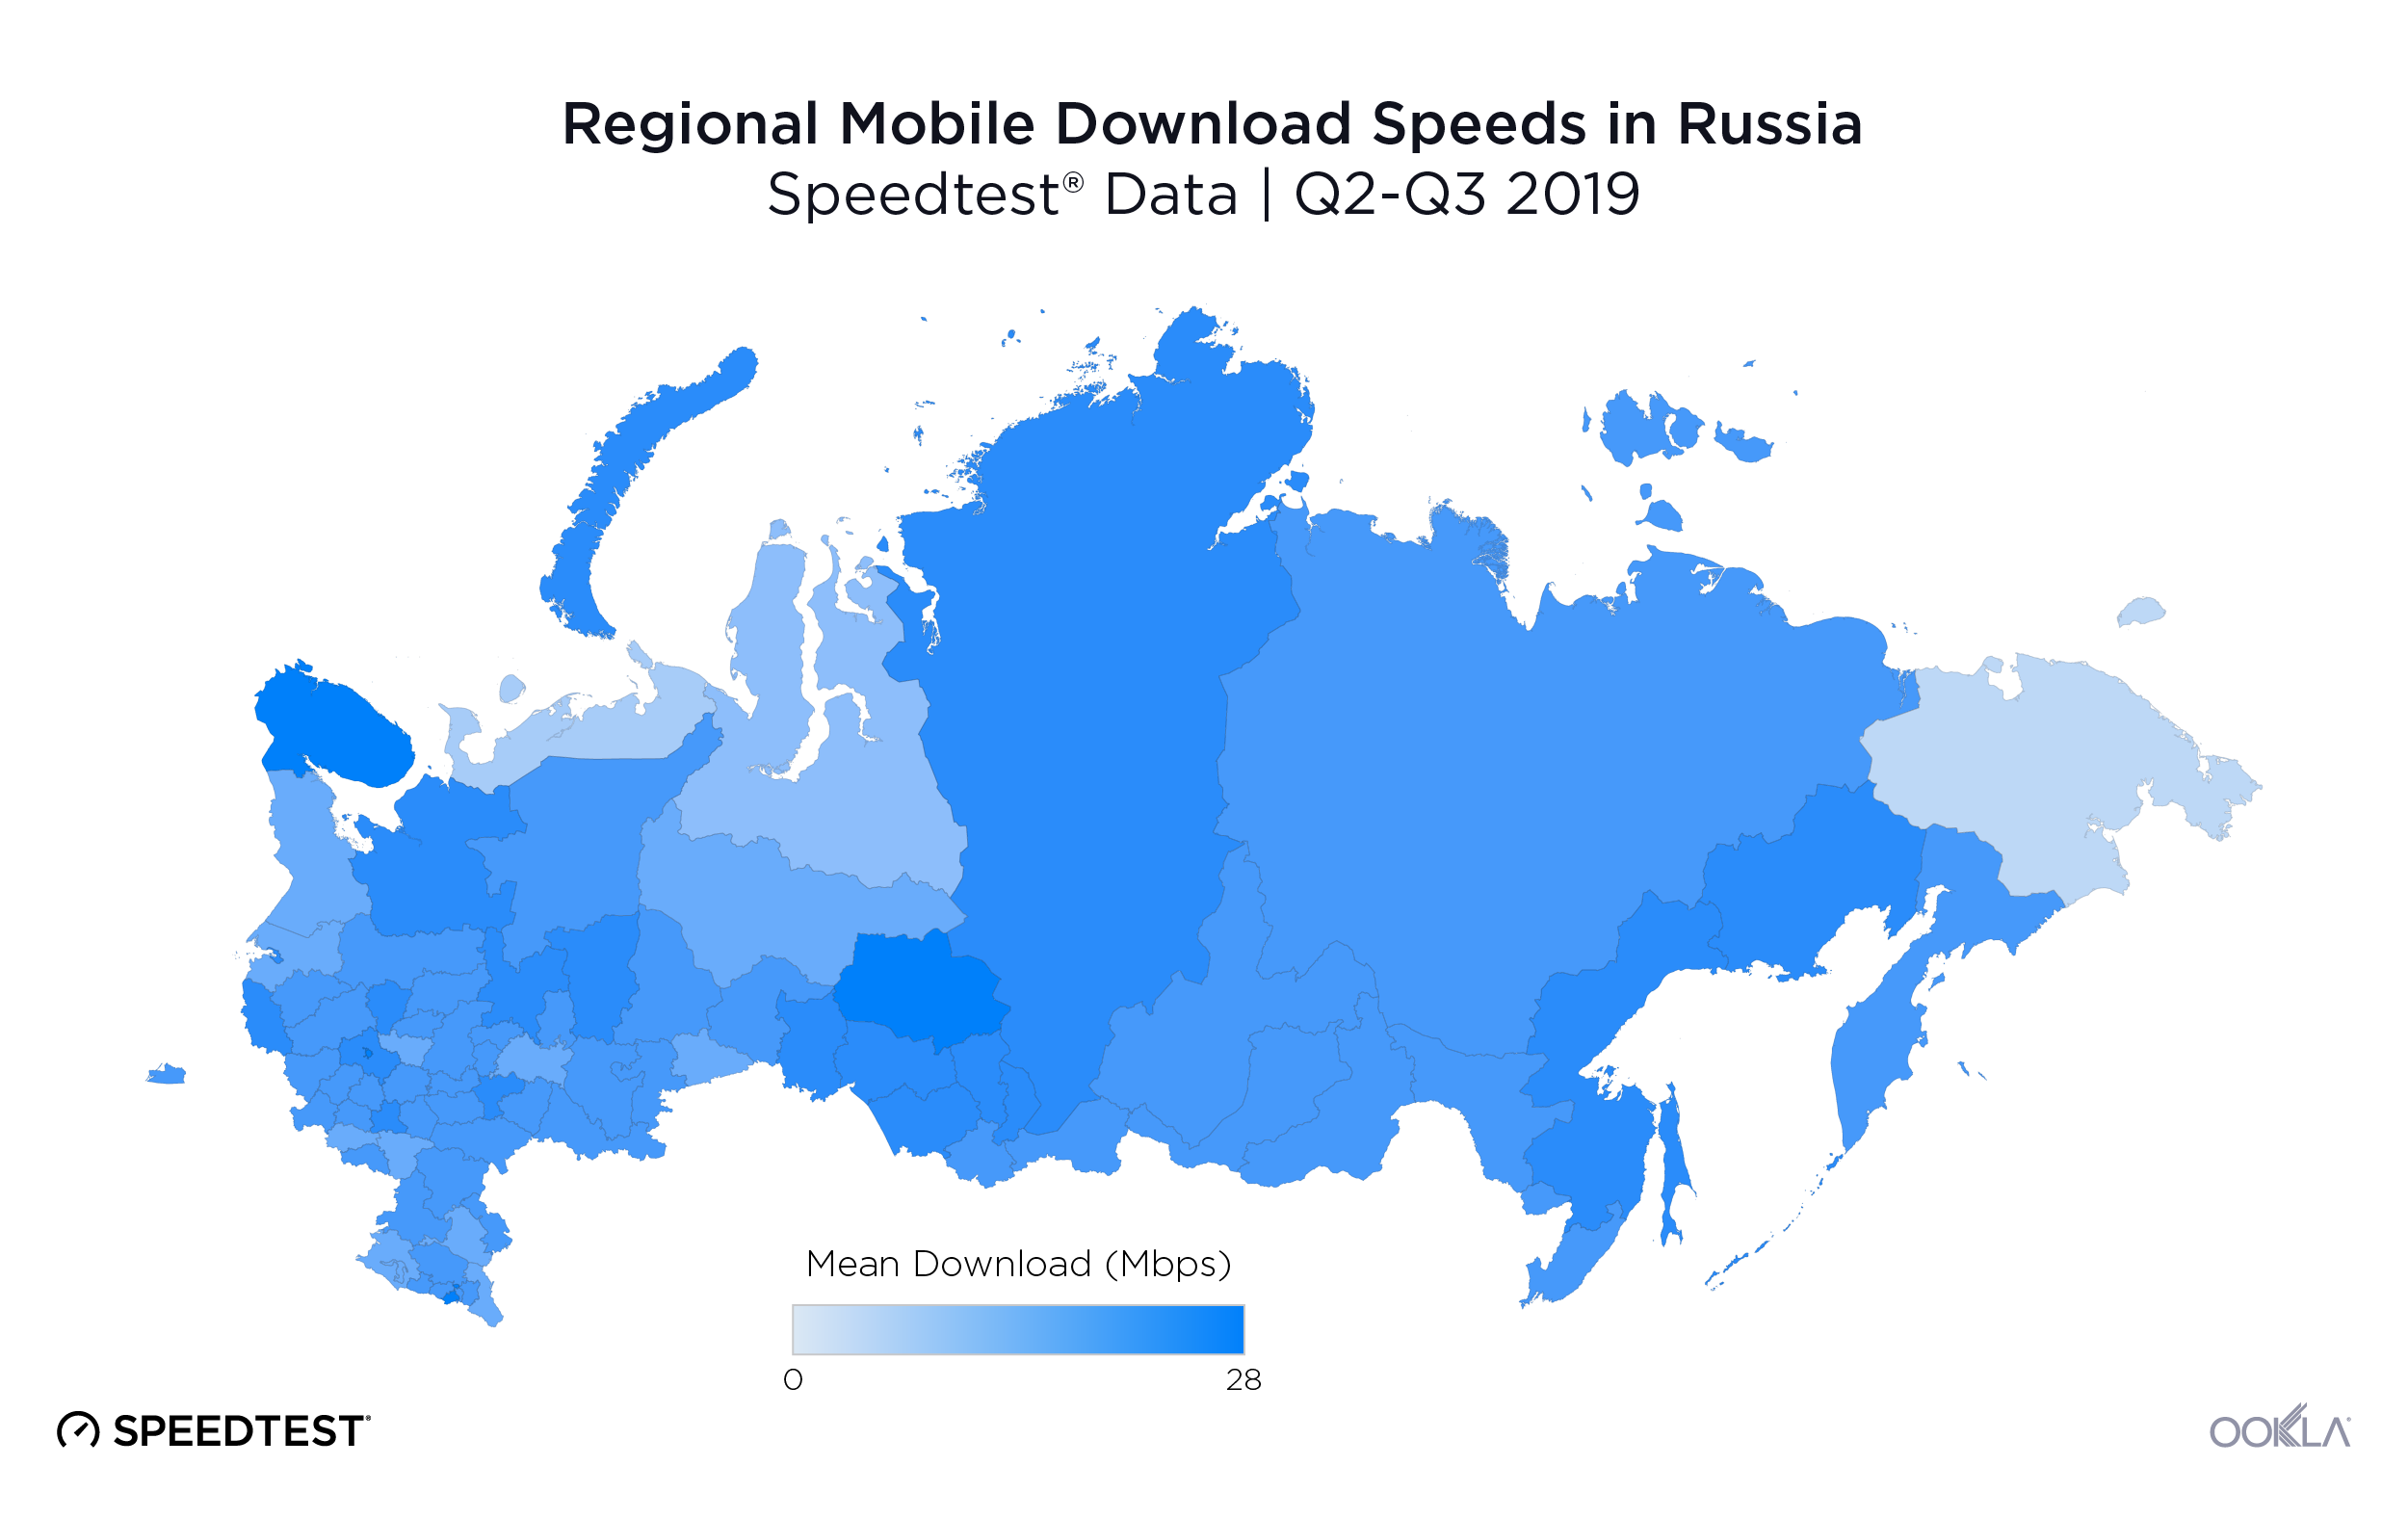
Tomsk, located north of Kazakhstan, had the fastest mean download speed on mobile broadband at 25.91 Mbps during Q2-Q3 2019. Murmansk followed Tomsk with a mean download speed of 24.50 Mbps. Ulyanovsk, located in the southwest part of Russia, was third with a mean download speed of 23.11 Mbps.

The slowest oblast for mean download speed over mobile was Leningrad, followed by Vladimir and Kursk. All three oblasts are located on the west side of the country, closer to Europe than Asia. Kursk borders Ukraine, Vladimir borders Moscow Oblast and Leningrad borders both Estonia and Finland. First-place Tomsk’s mean download speed over mobile was 85.2% faster than Leningrad’s during Q2-Q3 2019.

Russian oblasts show wide variances in 4G Availability

Ookla_Russia_Regional_4G-Availability_1119_en
4G Availability in Russian oblasts varied greatly, ranging from 37.1% to 75.5% of surveyed locations having access to 4G LTE during Q2-Q3 2019. Moscow Oblast had the highest 4G Availability during Q2-Q3 2019 at 75.5%, followed by Magadan’s 71.5% and Sakhalin’s 66.7%. Vologda Oblast had the lowest 4G Availability among Russian oblasts during Q2-Q3 2019 at 37.1%. Pskov Oblast was the second lowest at 37.3% and the Jewish Autonomous Oblast third at 37.5%.

Our analysis shows Russia is more competitive with BRIC countries when it comes to internet speeds and 4G Availability than it is to the world’s largest economies as a whole. Speeds and availability vary, though, between Russia’s largest cities and across oblasts. We’ll be watching this market closely to see if the improvements we saw carry forward into a brighter telecom future for Russia.

To find out more about internet speeds at the provider level or in a specific city, region or country, reach out to our team here.


Глобальное исследование скорости Интернета и доступности 4G в России

Россия как государство с одной из крупнейших в мире экономик и самой большой территорией — интересная область для исследования скорости Интернета. На протяжении II и III кварталов 2019 года мы изучали данные Speedtest® о скорости мобильного и фиксированного широкополосного Интернета, а также о доступности 4G, чтобы сравнить показатели России с десятью другими странами с самой крупной в мире экономикой. Кроме того, мы проанализировали данные из областей России и самых густонаселенных городов, чтобы определить, как скорость и доступность различаются по огромной территории этой страны.

Россия заняла девятое место по скорости скачивания через фиксированный широкополосный Интернет среди стран с самой крупной в мире экономикой

Ookla_Russia_Fixed-Download-Speeds_1119_ru

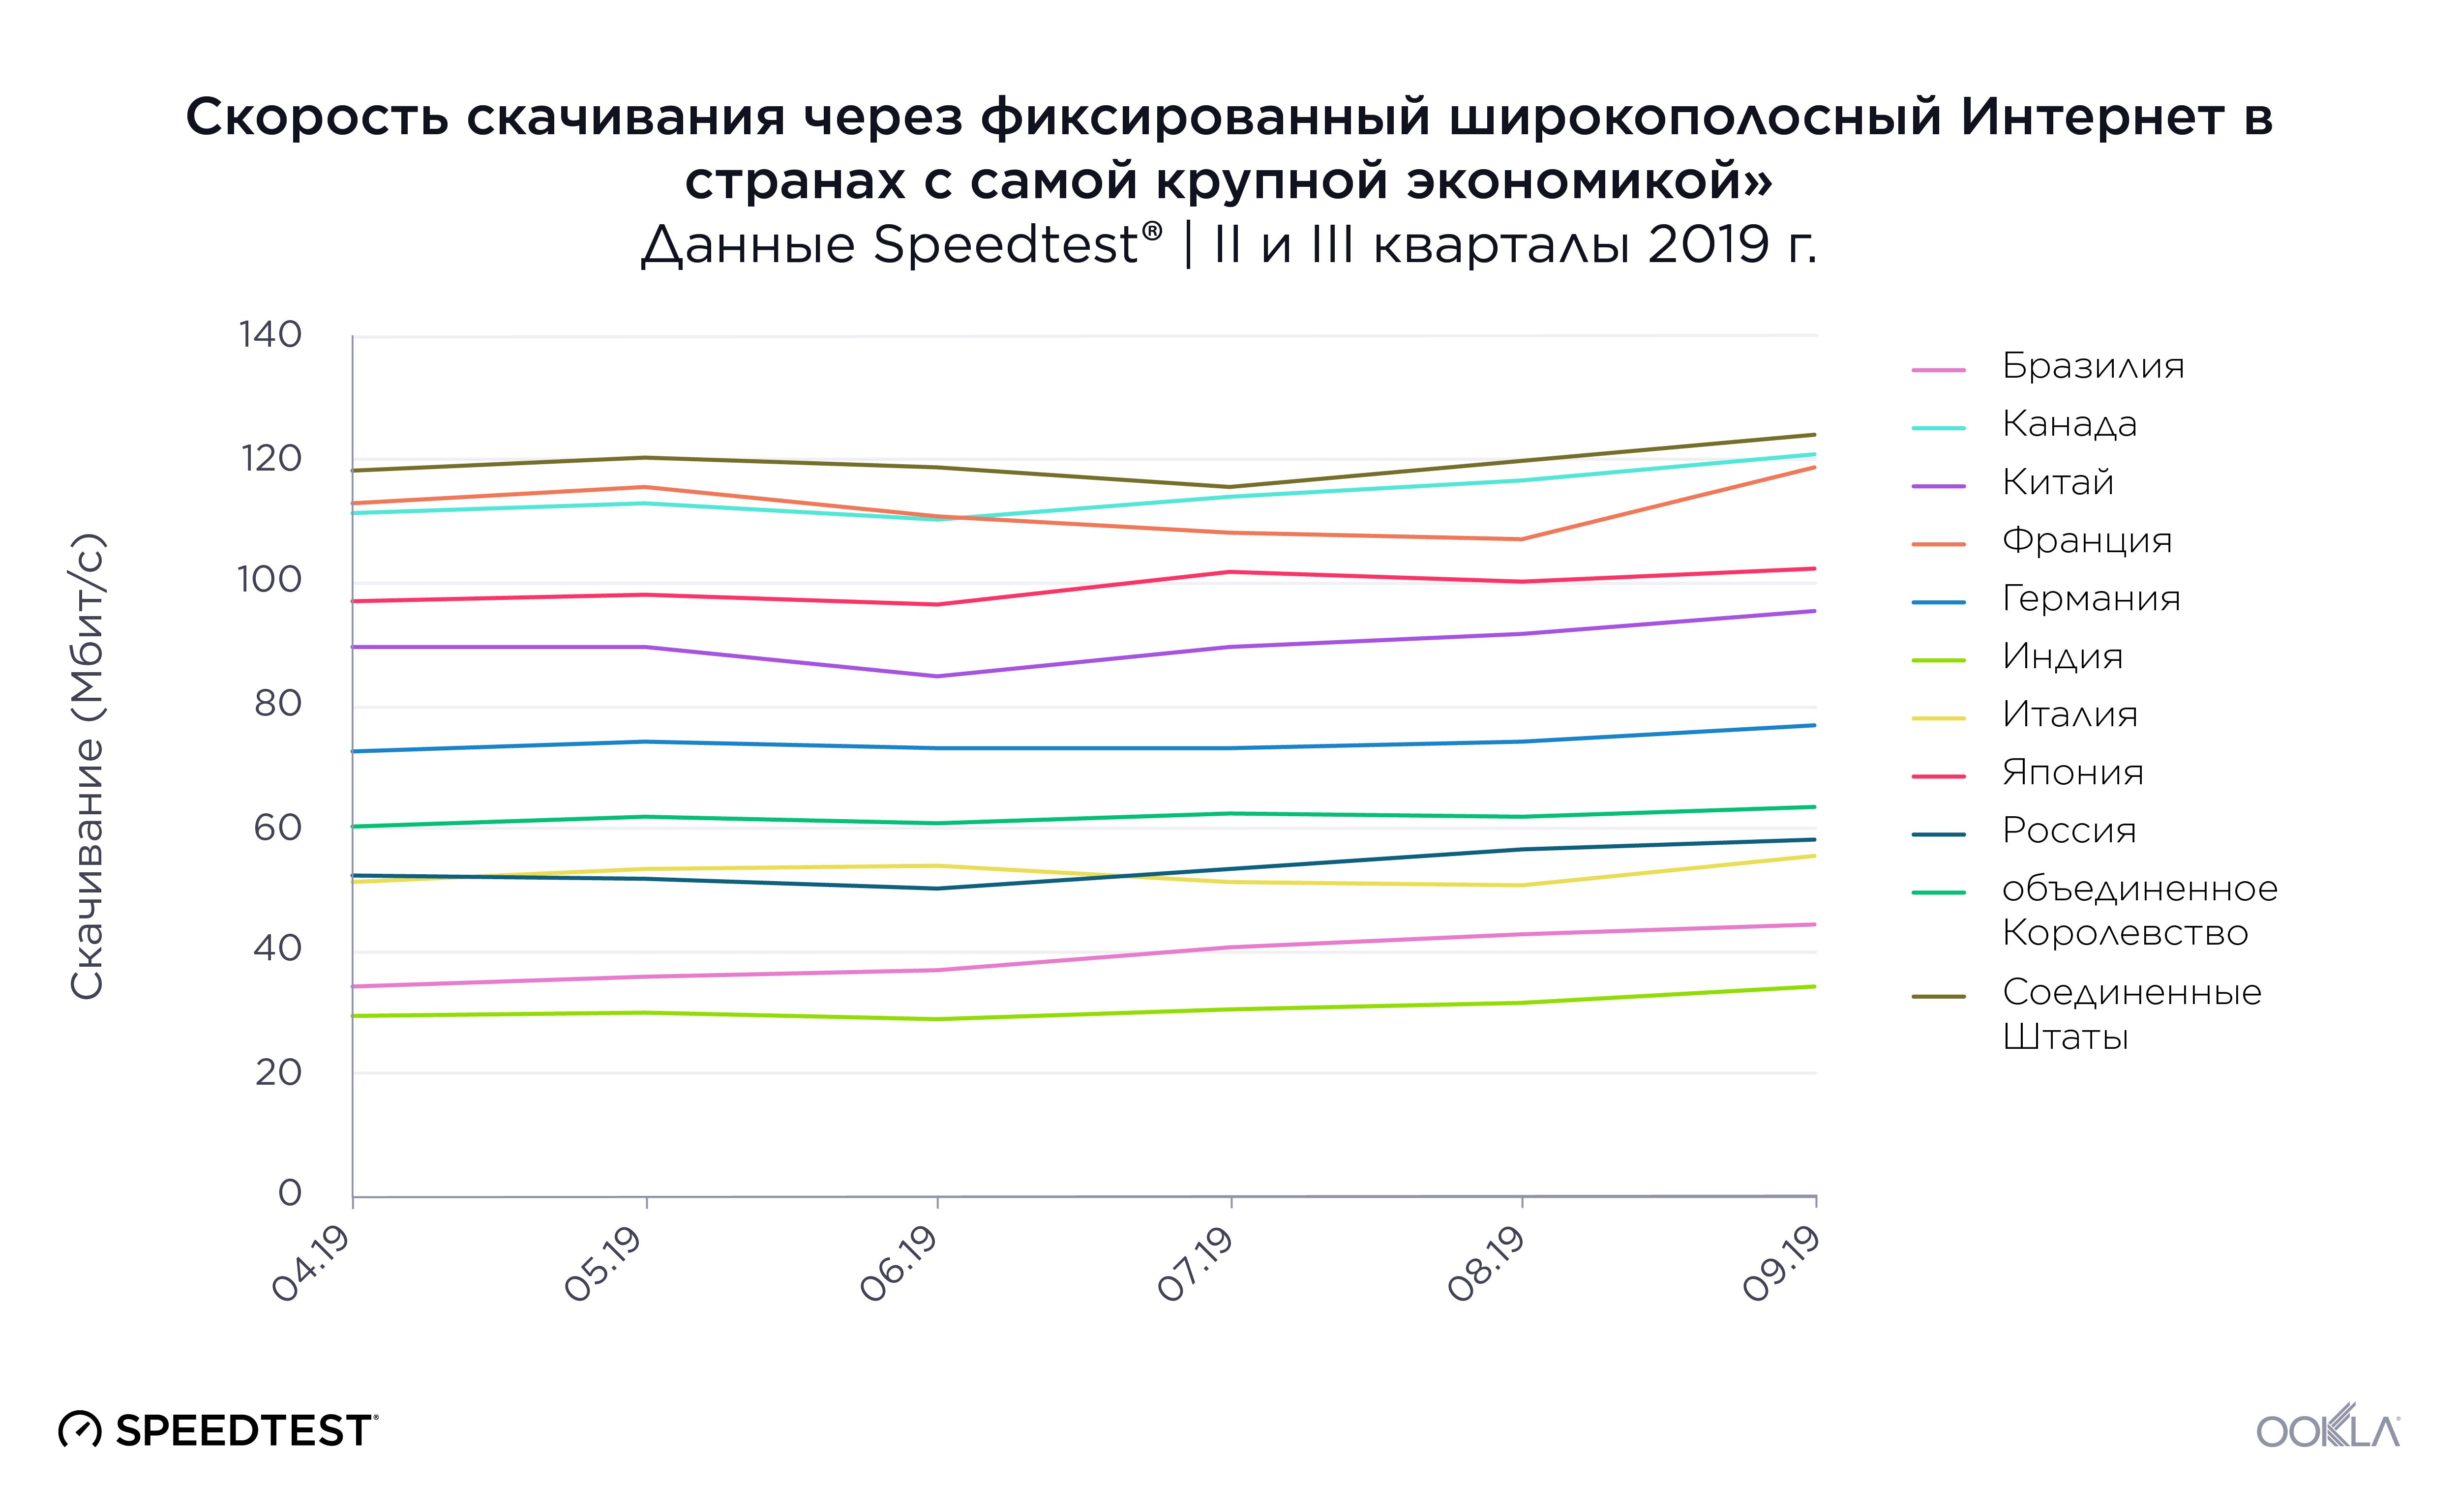
Средняя скорость скачивания через фиксированный широкополосный Интернет в России оказалась ниже, чем в большинстве стран с самой крупной экономикой во II и III кварталах 2019 г. Россия заняла девятое место среди 11 стран со средней скоростью скачивания 53,46 Мбит/с за этот период. Скорость в двух других странах из объединения БРИК — в Бразилии и Индии — была ниже, чем в России: 38,41 Мбит/с и 30,58 Мбит/с соответственно. Китай, четвертая страна из объединения БРИК, заняла пятое место со средней скоростью скачивания через фиксированный широкополосный Интернет на уровне 91,60 Мбит/с.

Соединенные Штаты Америки возглавили список среди стран с самым высоким ВВП, показав среднюю скорость скачивания 122,25 Мбит/с — на 128,7% выше, чем Россия, и на 299,8% выше, чем Индия. В Канаде и Франции, которые заняли второе и третье места соответственно, средняя скорость скачивания практически идентична показателю США: 112,86 Мбит/с и 112,84 Мбит/с соответственно.

Если отслеживать данные по месяцам, интересно отметить, что рейтинг большинства стран не изменился за этот период, за исключением России и Италии, которые конкурировали за восьмое и девятое места, а также Канады, которая опередила Францию.

Самое значительное увеличение скорости во II и III кварталах наблюдалось в Бразилии, где средняя скорость скачивания выросла на 29,5% (с 34,23 Мбит/с в апреле до 44,34 Мбит/с в сентябре). Повышение скорости отмечалось также в Индии и России. Средняя скорость скачивания в Индии увеличилась на 16,5%, а в России — на 11,0% за шесть месяцев. Такие улучшения демонстрируют, что в будущем эти три страны потенциально могут улучшить свои позиции в рейтинге.

Рейтинги по скорости передачи данных через фиксированный широкополосный Интернет не совпадают с показателями для скорости скачивания. При сравнении скорости передачи данных в странах с самым высоким ВВП во II и III кварталах 2019 г. Россия заняла третье место (со средней скоростью передачи данных 55,78 Мбит/с). Наблюдается значительный разрыв между странами, занявшими первые три места по скорости передачи данных: разница между Японией, занявшей первое место с показателем 105,83 Мбит/с, и Россией со скоростью 55,78 Мбит/с составляет 47,3%. Бразилия, Германия и Великобритания занимают последние три места в этой категории со скоростью передачи данных в диапазоне от 15,62 Мбит/с до 19,21 Мбит/с. Средняя скорость передачи данных в Японии, занявшей первое место, во II и III кварталах 2019 г. была на 577,5% выше, чем в Великобритании.

Россия заняла 10-е место по скорости скачивания через мобильный Интернет

Ookla_Russia_Mobile-Download-Speeds_1119_ru

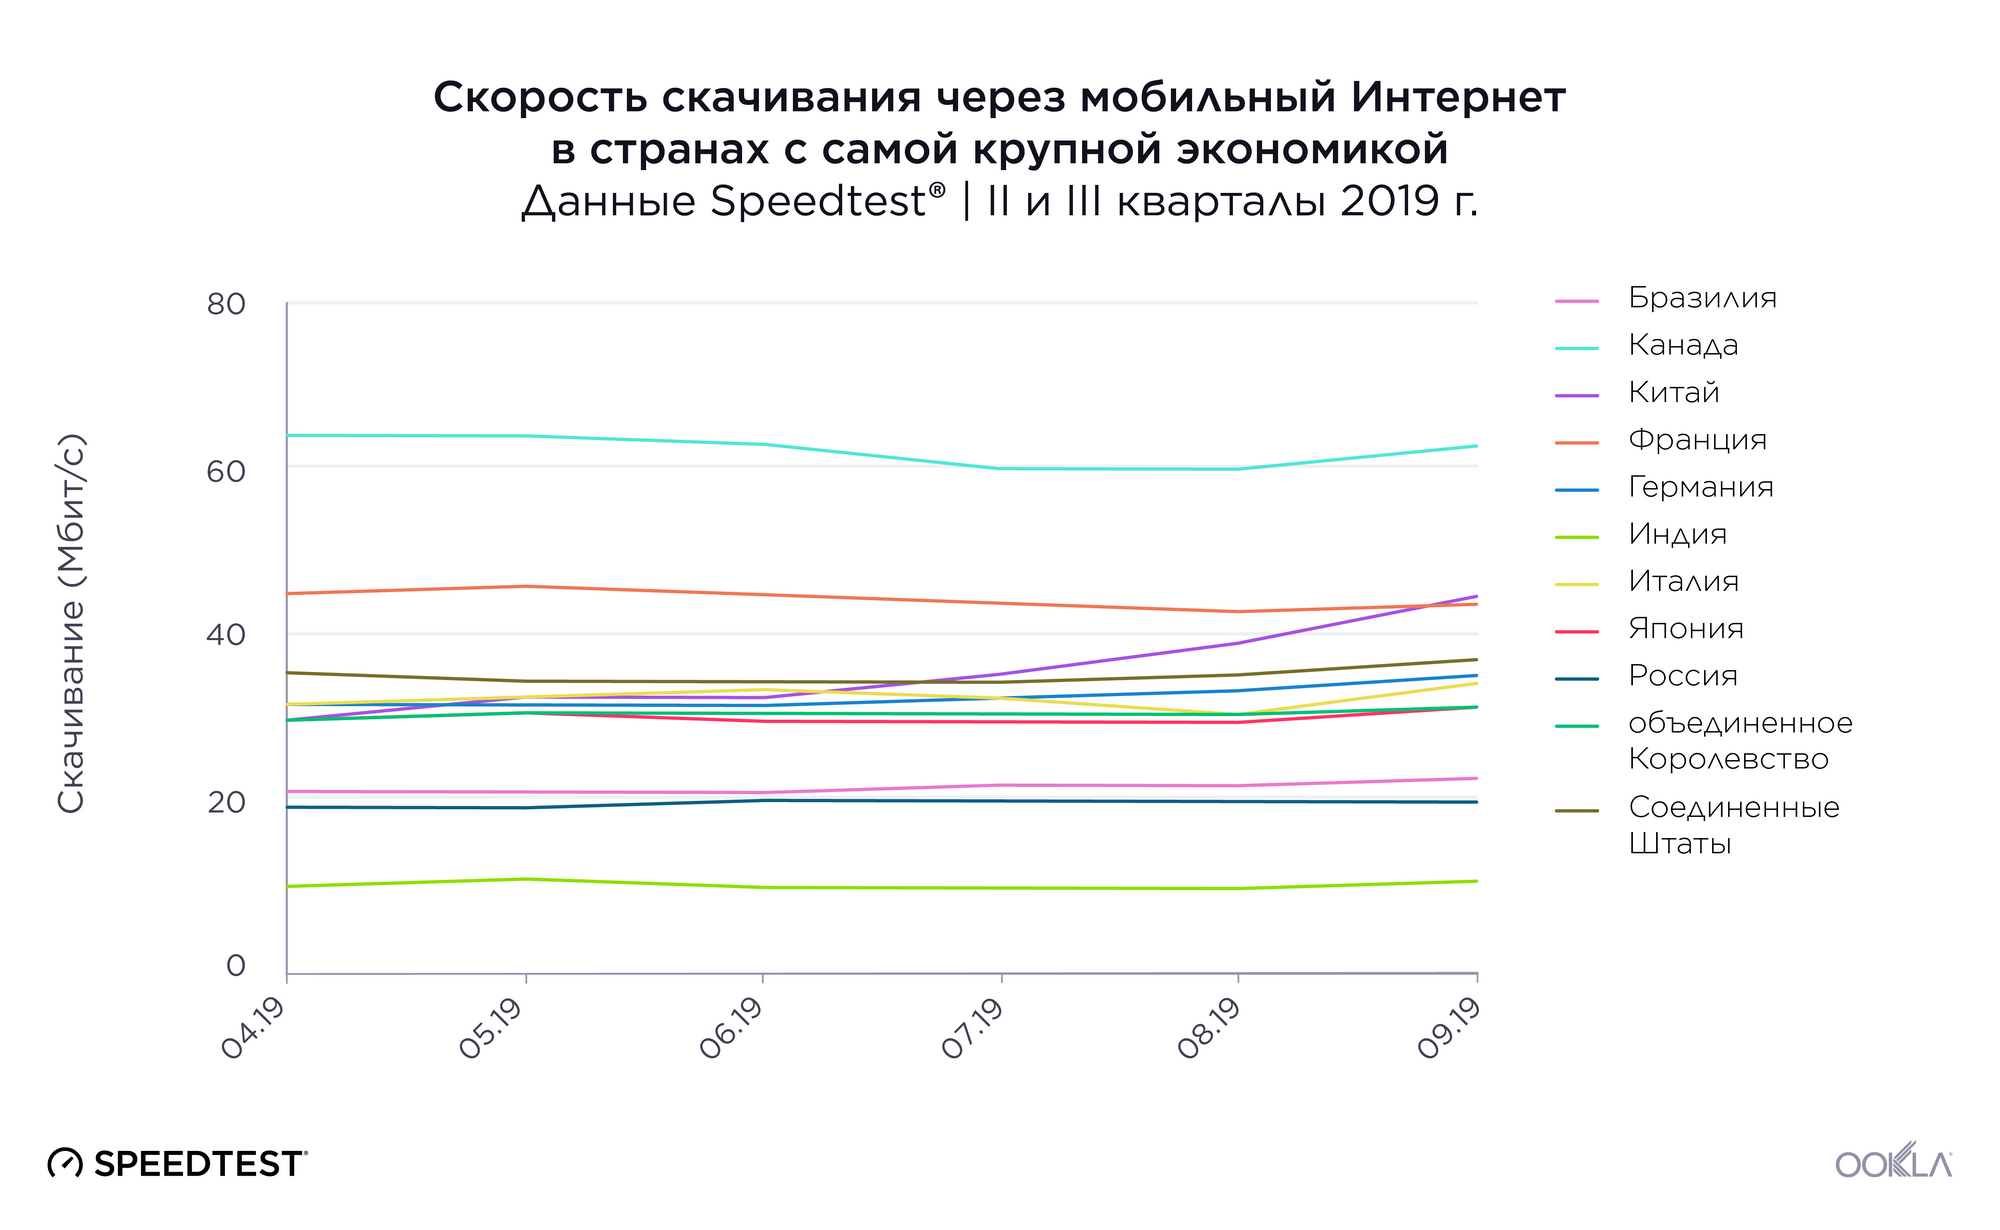
Данные Speedtest о средней скорости скачивания через мобильный Интернет показывают, что Канада, Франция и Китай заняли ведущие позиции среди стран с самой крупной в мире экономикой во II и III кварталах 2019 г. со средней скоростью скачивания от 36,68 Мбит/с до 62,62 Мбит/с. Россия заняла десятое место, снова в группе с Бразилией и Индией, которые оказались в числе последних. Средняя скорость скачивания через мобильный Интернет в России (19,86 Мбит/с) оказалась на 68,3% ниже, чем в Канаде.

По месяцам наблюдались значительные изменения в рейтингах по скорости скачивания через мобильный Интернет, однако Китай стал единственной страной, которая существенно увеличила скорость мобильного Интернета во II и III кварталах 2019 г. В период с апреля по сентябрь средняя скорость скачивания через мобильный Интернет в Китае выросла на 51,3%. При таком росте становится вероятнее, что Китай займет ведущую позицию в этой категории в будущем. Несомненно, 5G сыграет свою роль в повышении скорости мобильного Интернета. Согласно карте Ookla 5G MapTM, Китай, Германия, Италия, Великобритания и США — это единственные страны из представленного списка, в которых сеть 5G доступна на коммерческой основе, по данным на 18 ноября 2019 г.

Россия также получила низкий рейтинг по средней скорости передачи данных через мобильный Интернет во II и III кварталах 2019 г., заняв восьмое место с показателем 9,40 Мбит/с при сравнении с другими странами с самой крупной экономикой. Китай занял первое место со средней скоростью передачи данных 14,86 Мбит/с, а второе и третье места заняли Канада и Италия со средней скоростью передачи 13,85 Мбит/с и 12,61 Мбит/с соответственно. Средняя скорость передачи данных в России была на 36,7% ниже, чем в Китае.

Три нижние позиции заняли Япония, Бразилия и Индия со средней скоростью передачи данных 9,38 Мбит/с, 9,07 Мбит/с и 4,20 Мбит/с соответственно. Разница по средней скорости передачи данных между Китаем, занявшим первое место, и Индией, занявшей одиннадцатое место, составила 253,8% за этот период.

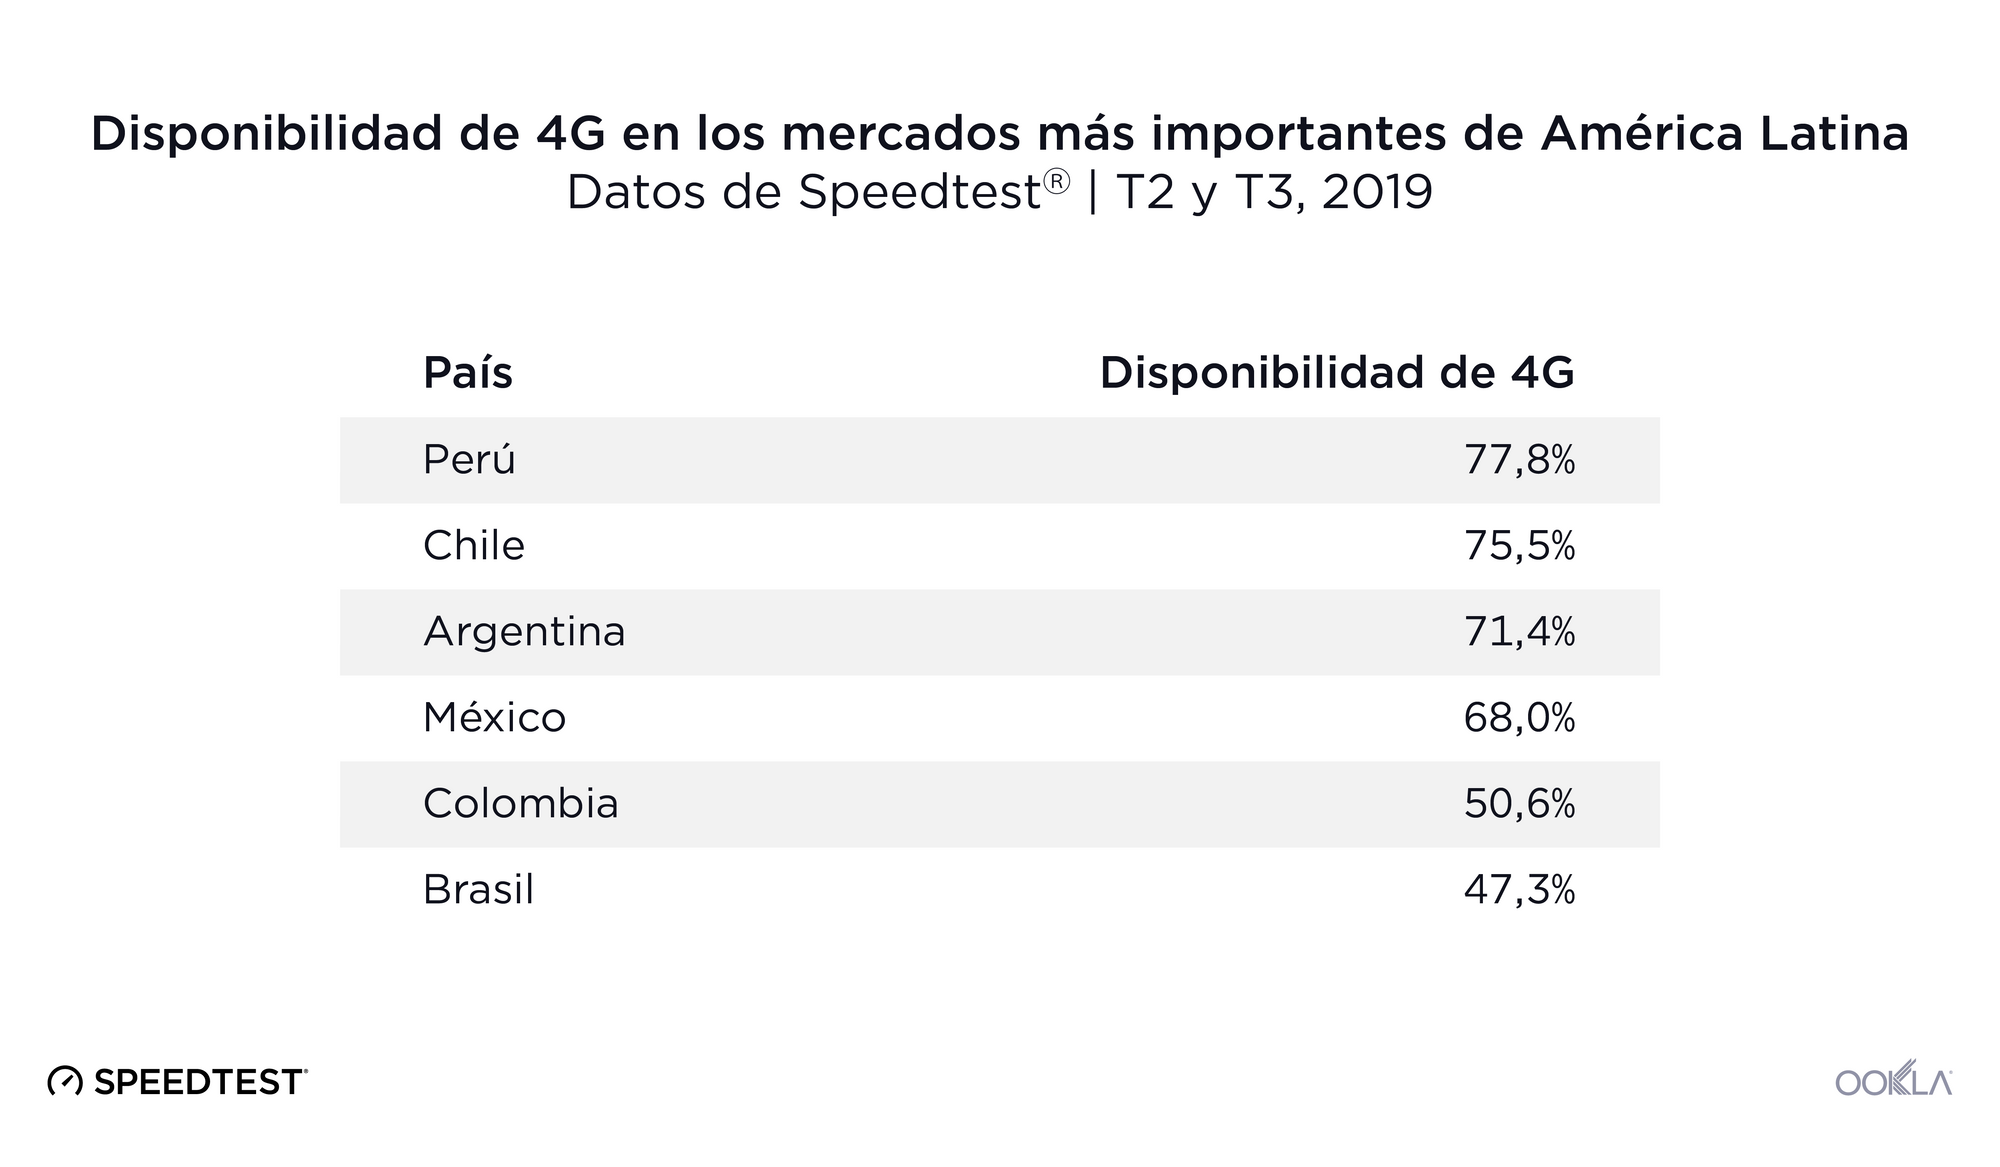
Доступность 4G в России составила 60,4%

Доступность 4G в странах с самой крупной экономикой
Данные Speedtest® | II и III кварталы 2019 г.
Страна Доступность 4G
Япония 98,8%
Китай 96,7%
США 94,0%
Канада 91,3%
Великобритания 88,0%
Индия 87,9%
Франция 86,4%
Италия 85,0%
Германия 68,9%
Россия 60,4%
Бразилия 47,3%

Россия заняла десятое место по доступности 4G среди стран с крупнейшей в мире экономикой во II и III кварталах 2019 года: только 60,4% расположений, в которых проводилось исследование в России, имели доступ к LTE-сети 4G. Такой результат не удивляет, если учитывать огромную территорию, которую необходимо охватывать российским операторам связи при строительстве мобильных сетей, поскольку Россия на 80,1% больше по площади, чем следующая по величине страна — Канада.

Максимальный показатель доступности 4G в нашем списке продемонстрировала Япония — 98,8%. С небольшим отрывом на втором месте Китай (96,7%), а на третьем — США (94%). Значительную разницу по доступности 4G можно отметить между Италией, занявшей восьмое место, и Германией, занявшей девятую позицию. Замыкает список Бразилия — одиннадцатое место.

Скорость Интернета значительно различается в крупных городах России

Скорость скачивания через фиксированный широкополосный Интернет в крупнейших городах России

Ookla_Russia_Cities_Fixed-Broadband-Speeds_1119_ru

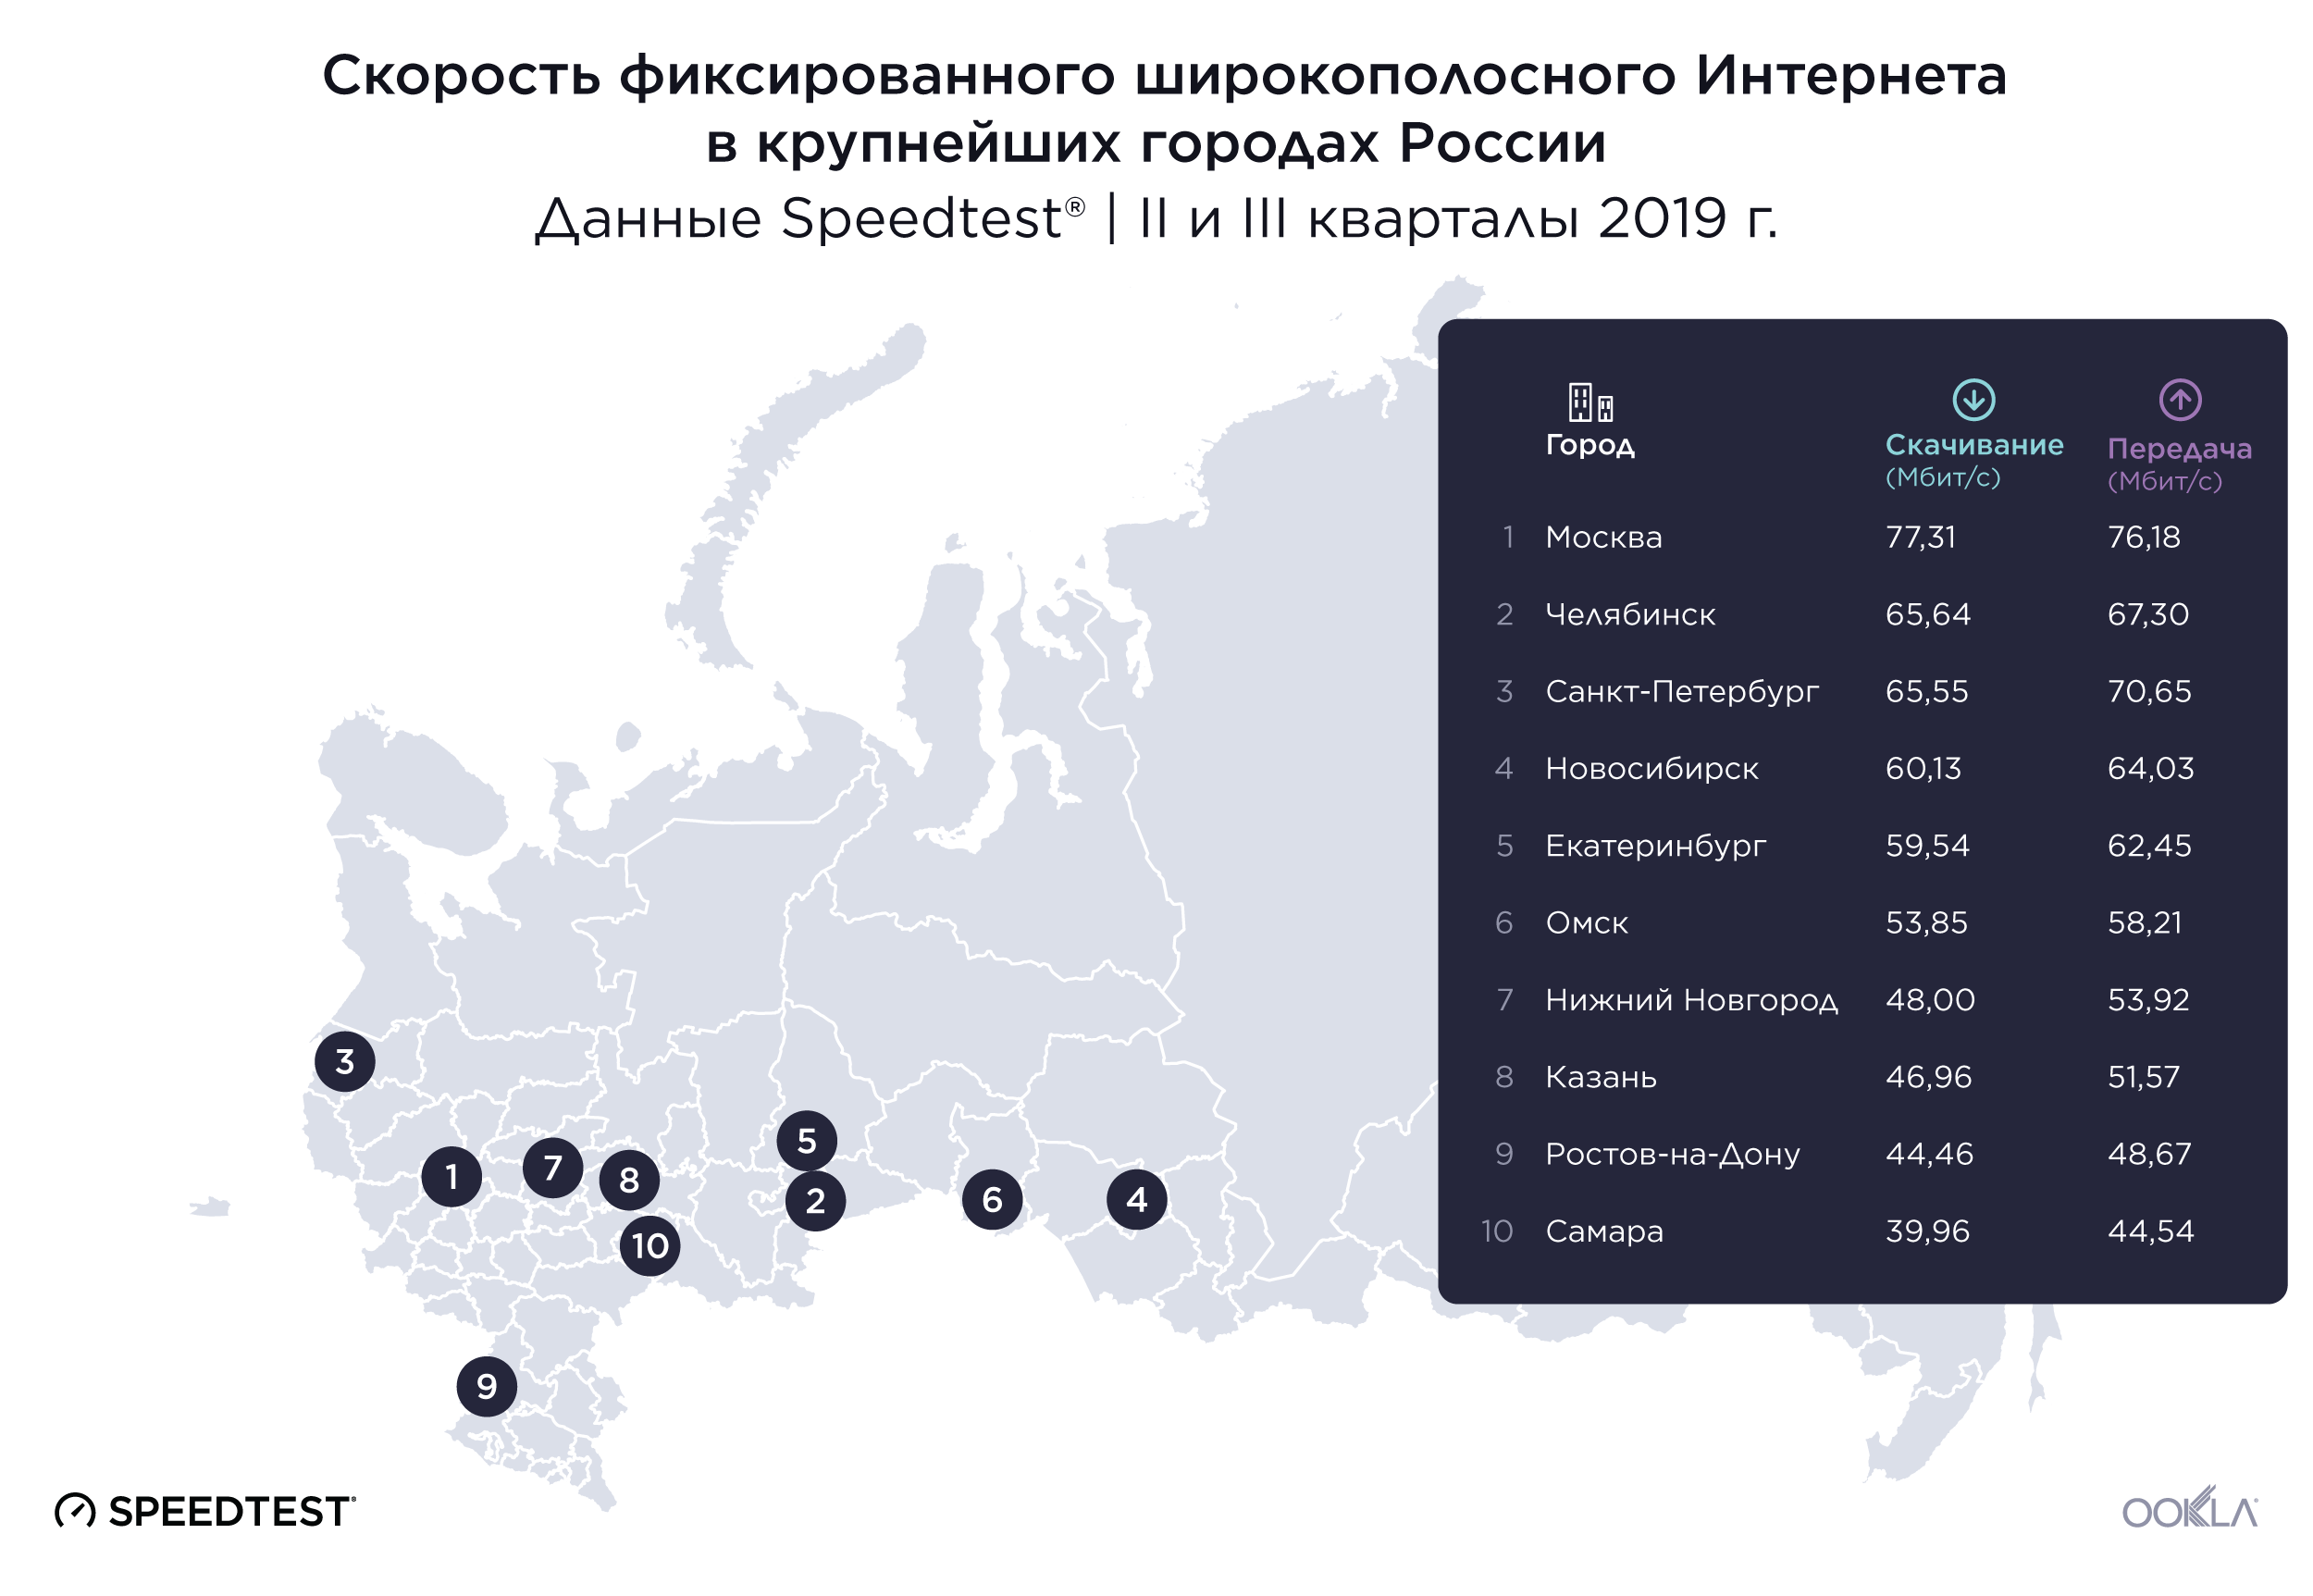
Данные Speedtest о средней скорости скачивания через фиксированный широкополосный Интернет показали значительные различия между самыми густонаселенными городами России во II и III кварталах 2019 г. Первое место заняла Москва, самый густонаселенный город и столица России, со средней скоростью скачивания 77,31 Мбит/с во II и III кварталах 2019 г. Средняя скорость скачивания в Москве была на 93,5% выше, чем в Самаре (39,96 Мбит/с), занявшей последнее место.

Различия по средней скорости передачи данных через фиксированный широкополосный Интернет были менее значительными между городами на первом и последнем местах. Москва снова заняла первое место в группе со средней скоростью передачи данных через фиксированный широкополосный Интернет на уровне 76,18 Мбит/с. За ней следует Санкт-Петербург со средней скоростью передачи данных 70,65 Мбит/с. Ростов-на-Дону и Самара заняли девятое и десятое места со средней скоростью передачи данных 48,67 Мбит/с и 44,54 Мбит/с соответственно. В этот период разница между средней скоростью передачи данных в Москве и Самаре составила 71%.

Различия по скорости скачивания через мобильный Интернет в самых крупных городах России не настолько значительны

Ookla_Russia_Cities_Mobile-Speeds_1119_ru

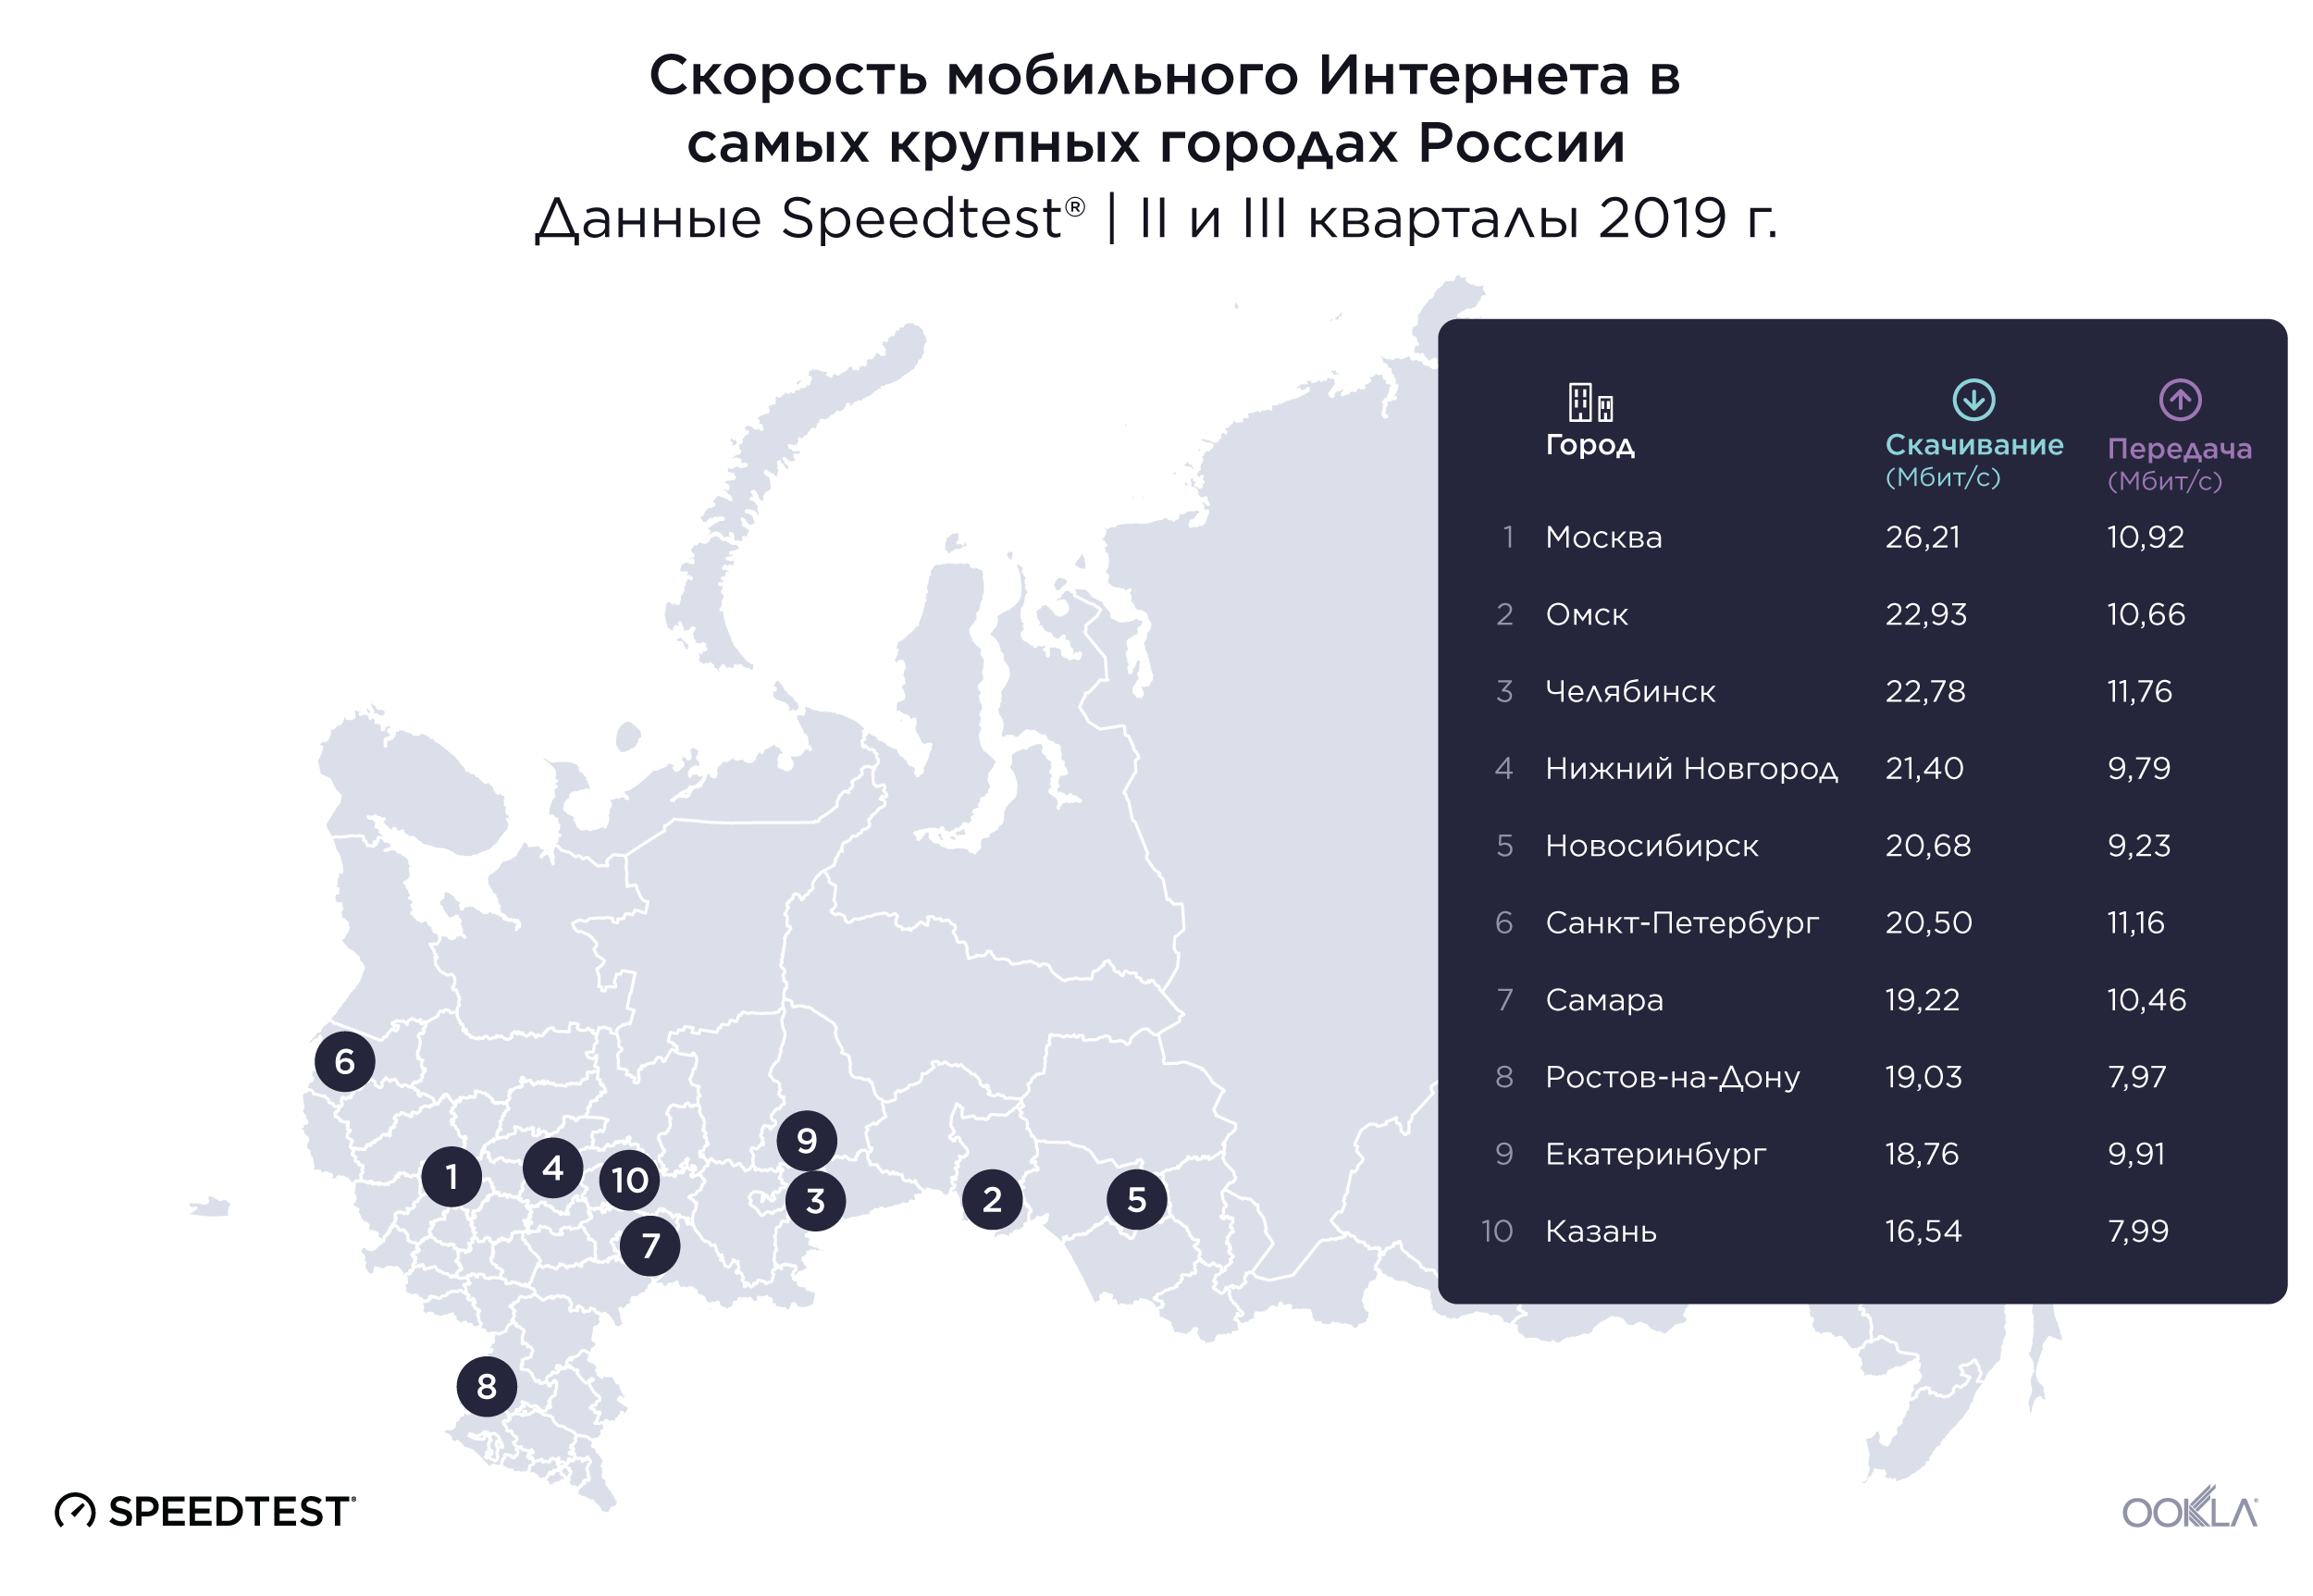
Разница между самой высокой и самой низкой скоростью в крупнейших городах России была меньше для мобильного Интернета, чем для фиксированного во II и III кварталах 2019 г. Москва заняла первое место со средней скоростью скачивания через мобильный Интернет 26,21 Мбит/с. Самая низкая средняя скорость скачивания была зафиксирована в Казани — 16,54 Мбит/с. Средняя скорость скачивания в Москве была на 58,5% выше, чем в Казани.

Челябинск занял первое место по средней скорости передачи данных через мобильный Интернет (11,76 Мбит/с) во II и III кварталах 2019 г. Санкт-Петербург занял второе место со скоростью 11,16 Мбит/с, а Москва — третье место со скоростью 10,92 Мбит/с. Ростов-на-Дону оказался на последнем месте со средней скоростью передачи данных 7,97 Мбит/с, которая была на 32,2% ниже, чем в Челябинске за этот период.

Доступность 4G относительно высока в крупнейших городах России

Ookla_Russia_Cities_4G-Availability_1119_ru

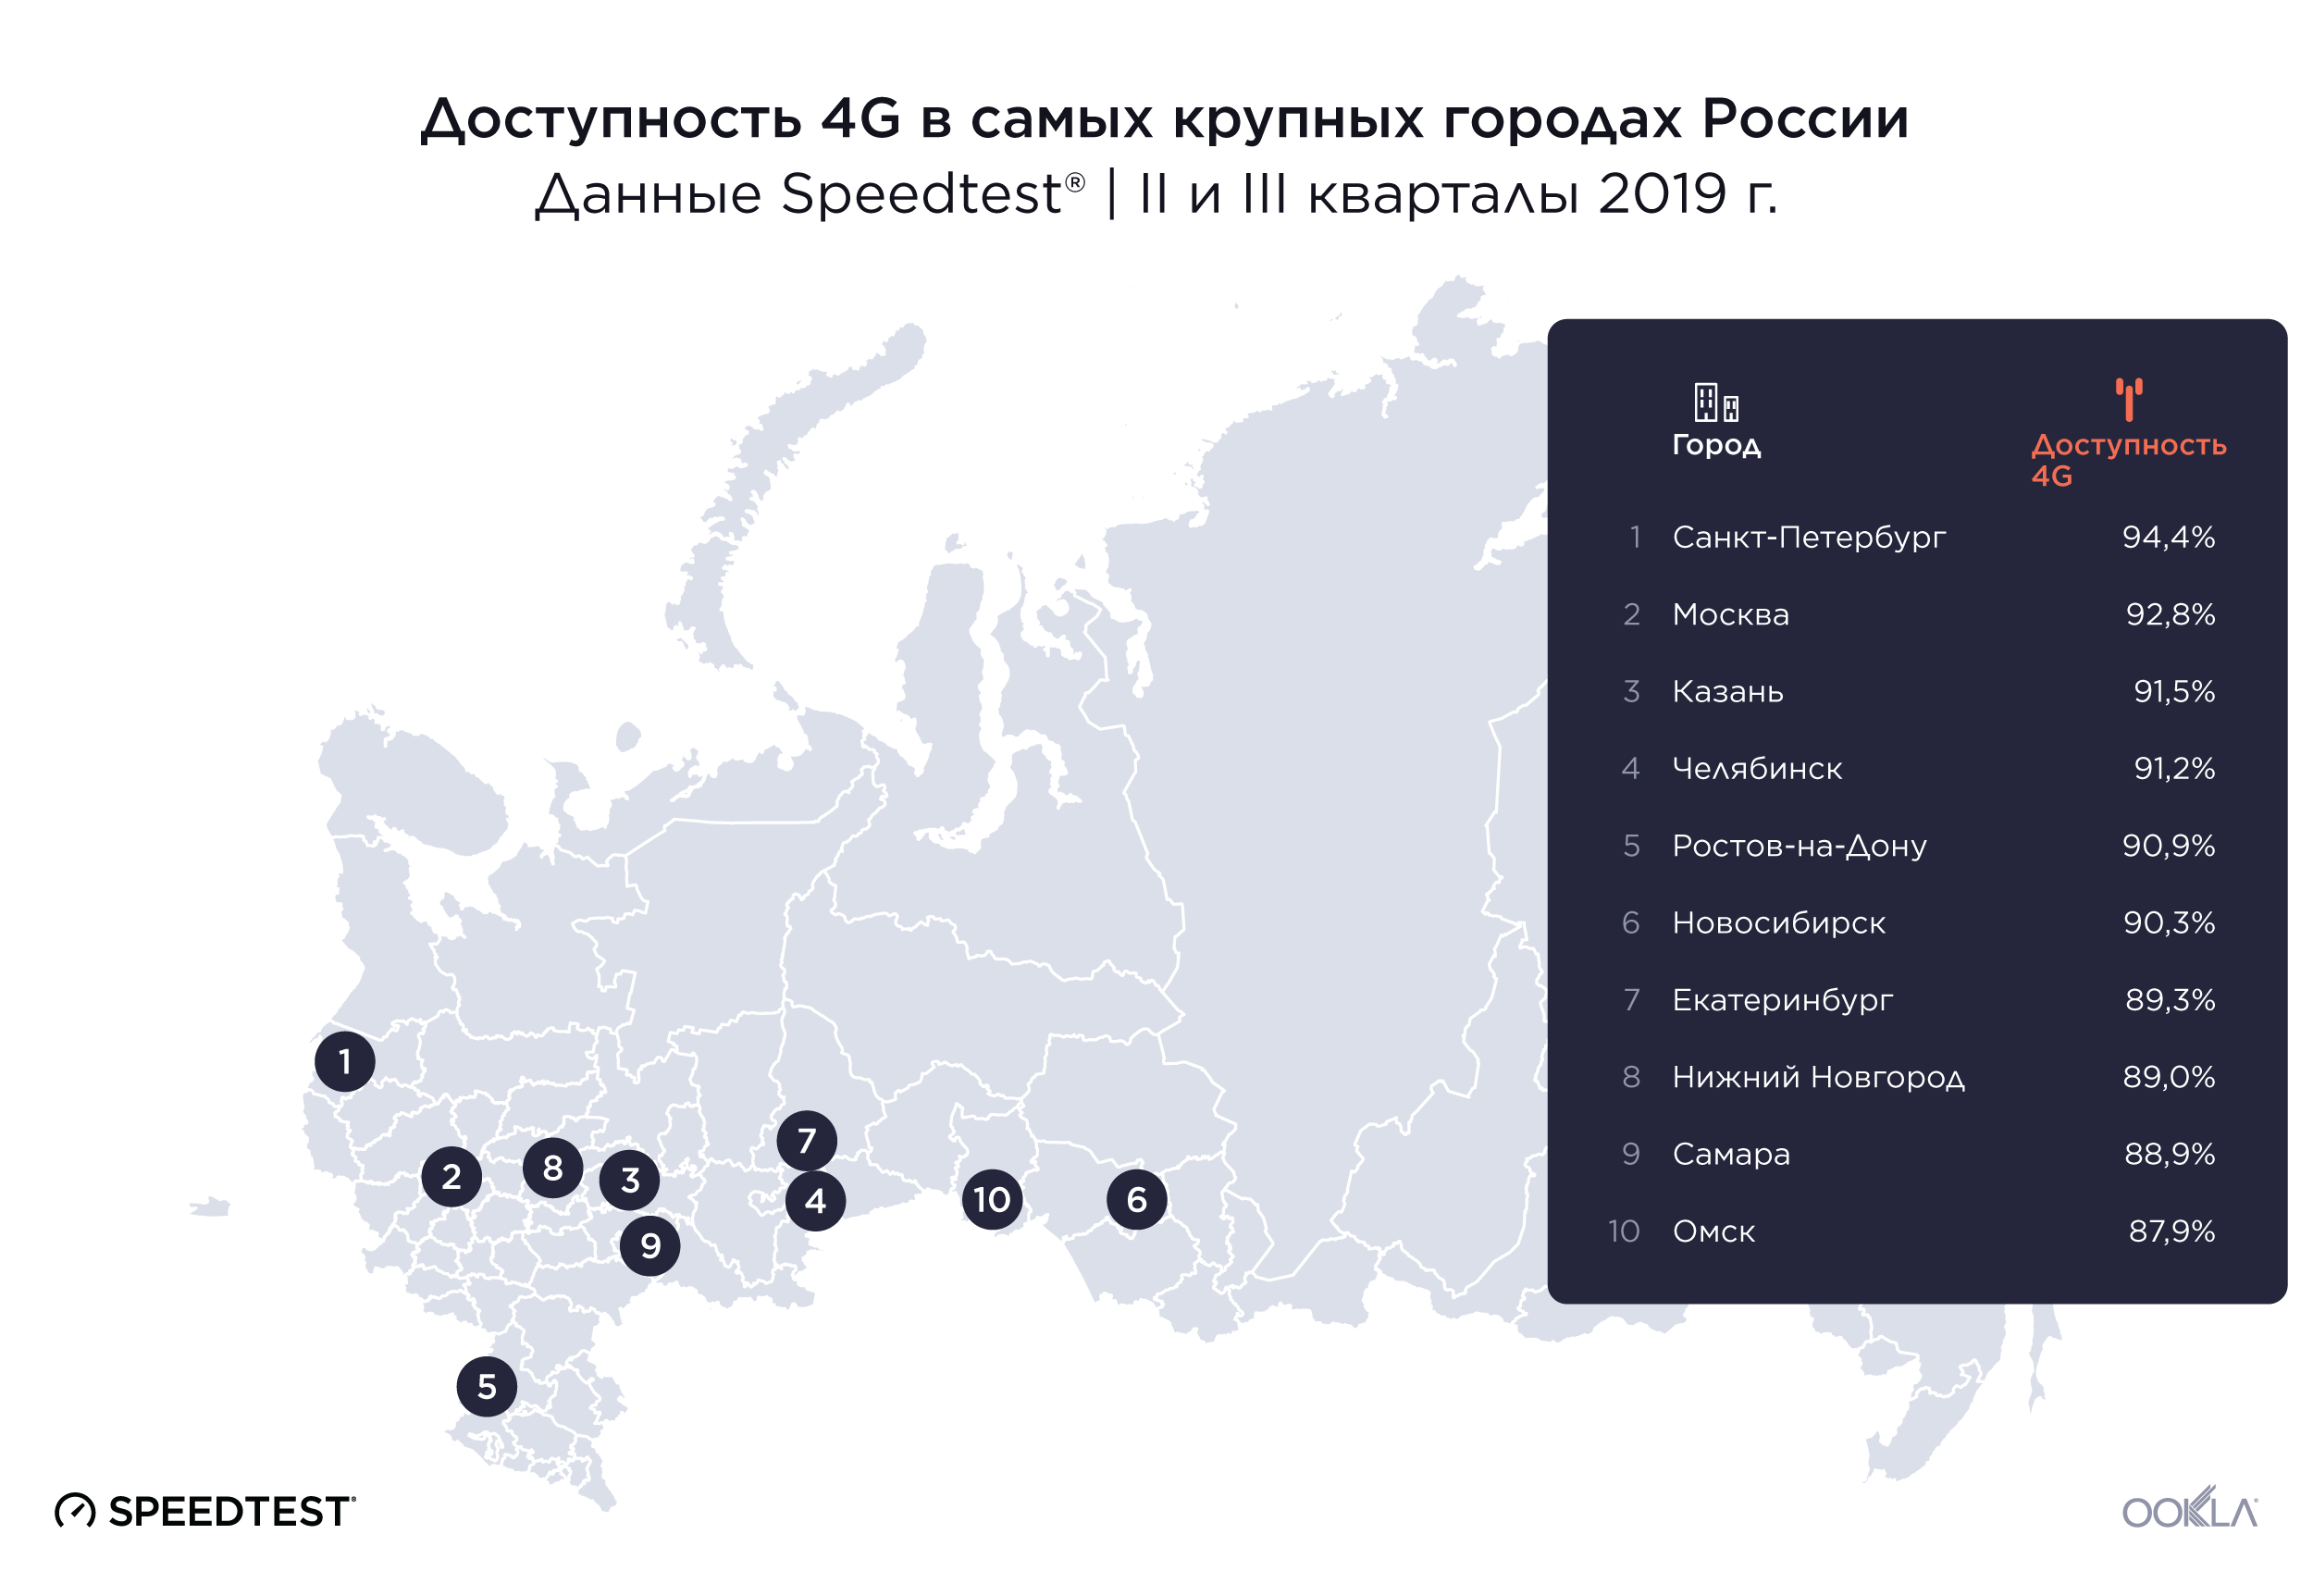
Показатели доступности 4G во II и III кварталах 2019 г. не так сильно варьировались в самых крупных городах России по сравнению со скоростью Интернета. По доступности 4G во II и III кварталах 2019 г. первое место занял Санкт-Петербург: в 94,4% расположений города доступна сеть 4G. За ним следуют Москва (92,8%) и Казань (91,5%). Самара и Омск заняли последние места в рейтинге по доступности 4G с показателями 88,9% и 87,9% соответственно.

Скорость Интернета различается еще больше между областями России

Мы изучили данные Speedtest по областям России за II и III кварталы 2019 г., чтобы определить, имеется ли какая-либо географическая закономерность, связанная со скоростью. Мы обнаружили значительные различия в скорости, которые не поддавались простому географическому объяснению.

Разница между самой высокой и самой низкой скоростью фиксированного широкополосного Интернета в областях России составила 175%

Ookla_Russia_Regional_Fixed-Broadband-Download-Speeds_1119_ru

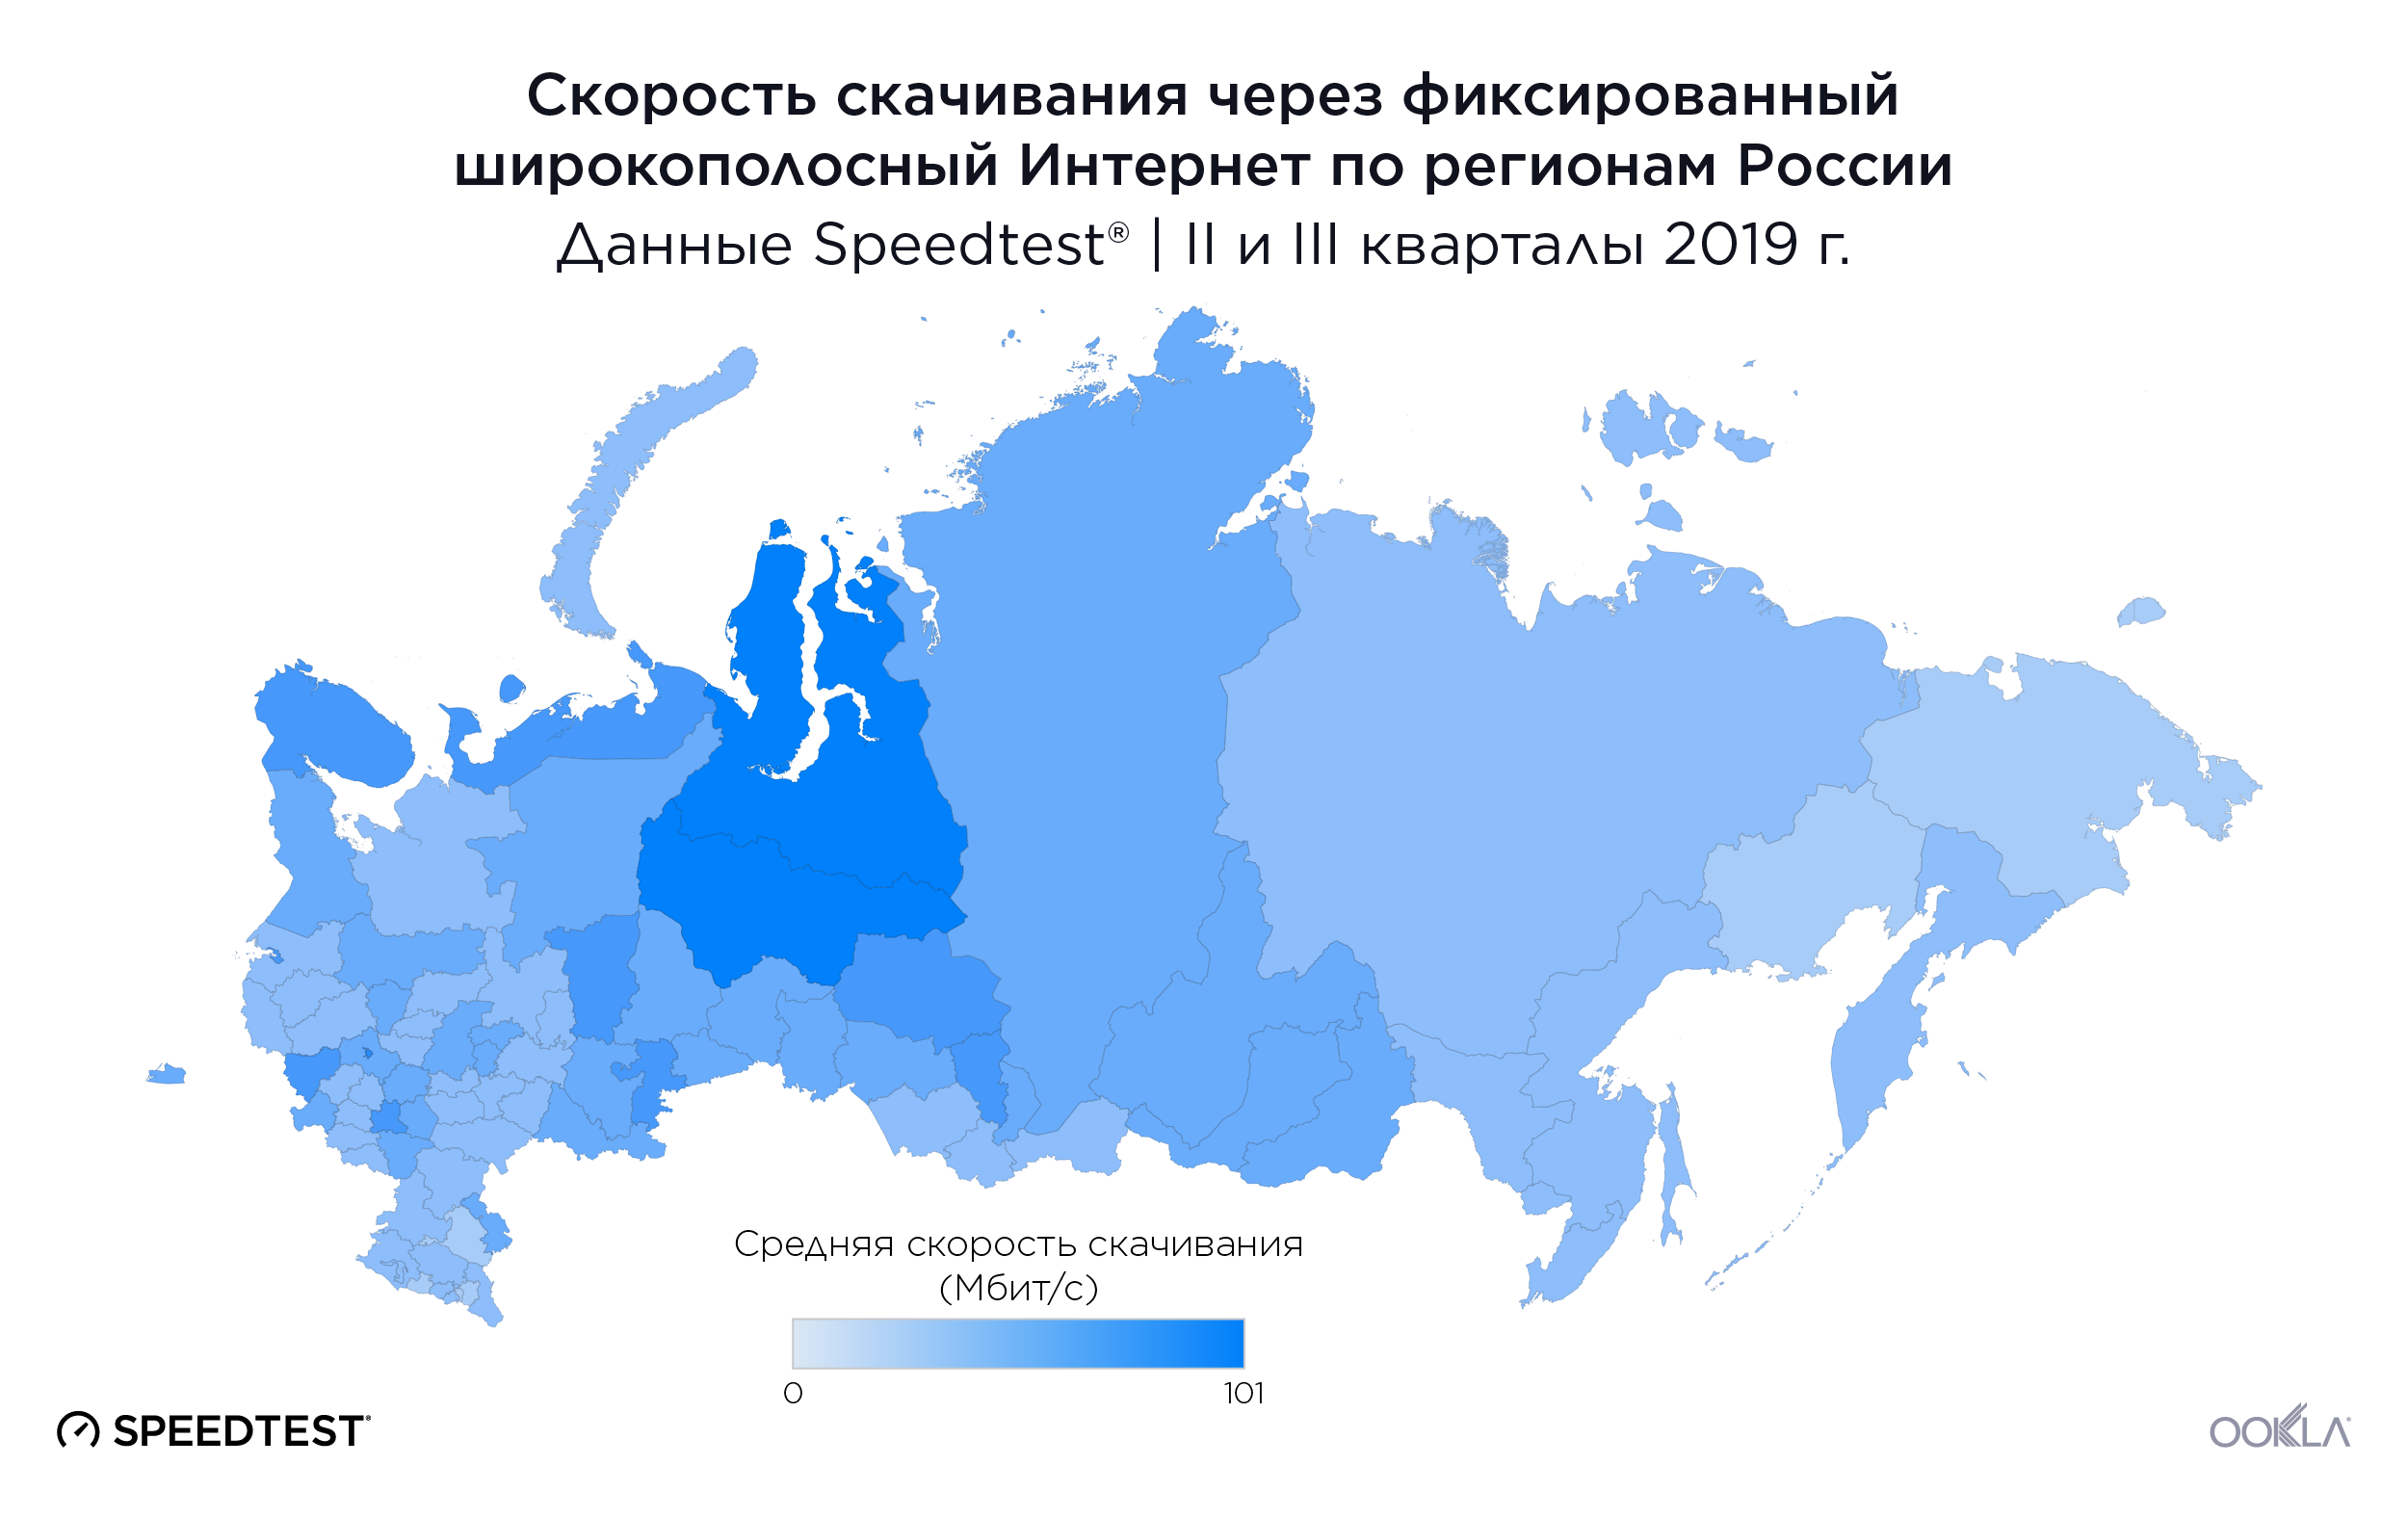
Во II и III кварталах средняя скорость скачивания через фиксированный широкополосный Интернет была выше всего в Мурманской области, расположенной возле границы с Финляндией, — 71,13 Мбит/с. Кемеровская область заняла второе, а Липецкая — третье место со средней скоростью скачивания 68,32 Мбит/с и 66,37 Мбит/с соответственно. Кемеровская область расположена в южно-центральном регионе страны, на север от границы России с Монголией, Казахстаном и Китаем. Липецкая область расположена ближе к Европе, на восток от Беларуси.

Калужская, Белгородская и Магаданская области — это три региона России с самой низкой средней скоростью передачи данных через фиксированный широкополосный Интернет во II и III кварталах 2019 г. Средняя скорость передачи в Мурманской области, занявшей первое место по этому показателю, была на 175% выше, чем аналогичный показатель в Магаданской области за этот период. Калужская и Белгородская области расположены в западной части страны, ближе к Украине и Беларуси. Магаданская область находится на противоположном конце страны, ближе к Беринговому морю и побережью Аляски.

Скорость мобильного Интернета в областях России

Ookla_Russia_Regional_Mobile-Download-Speeds_1119_ru

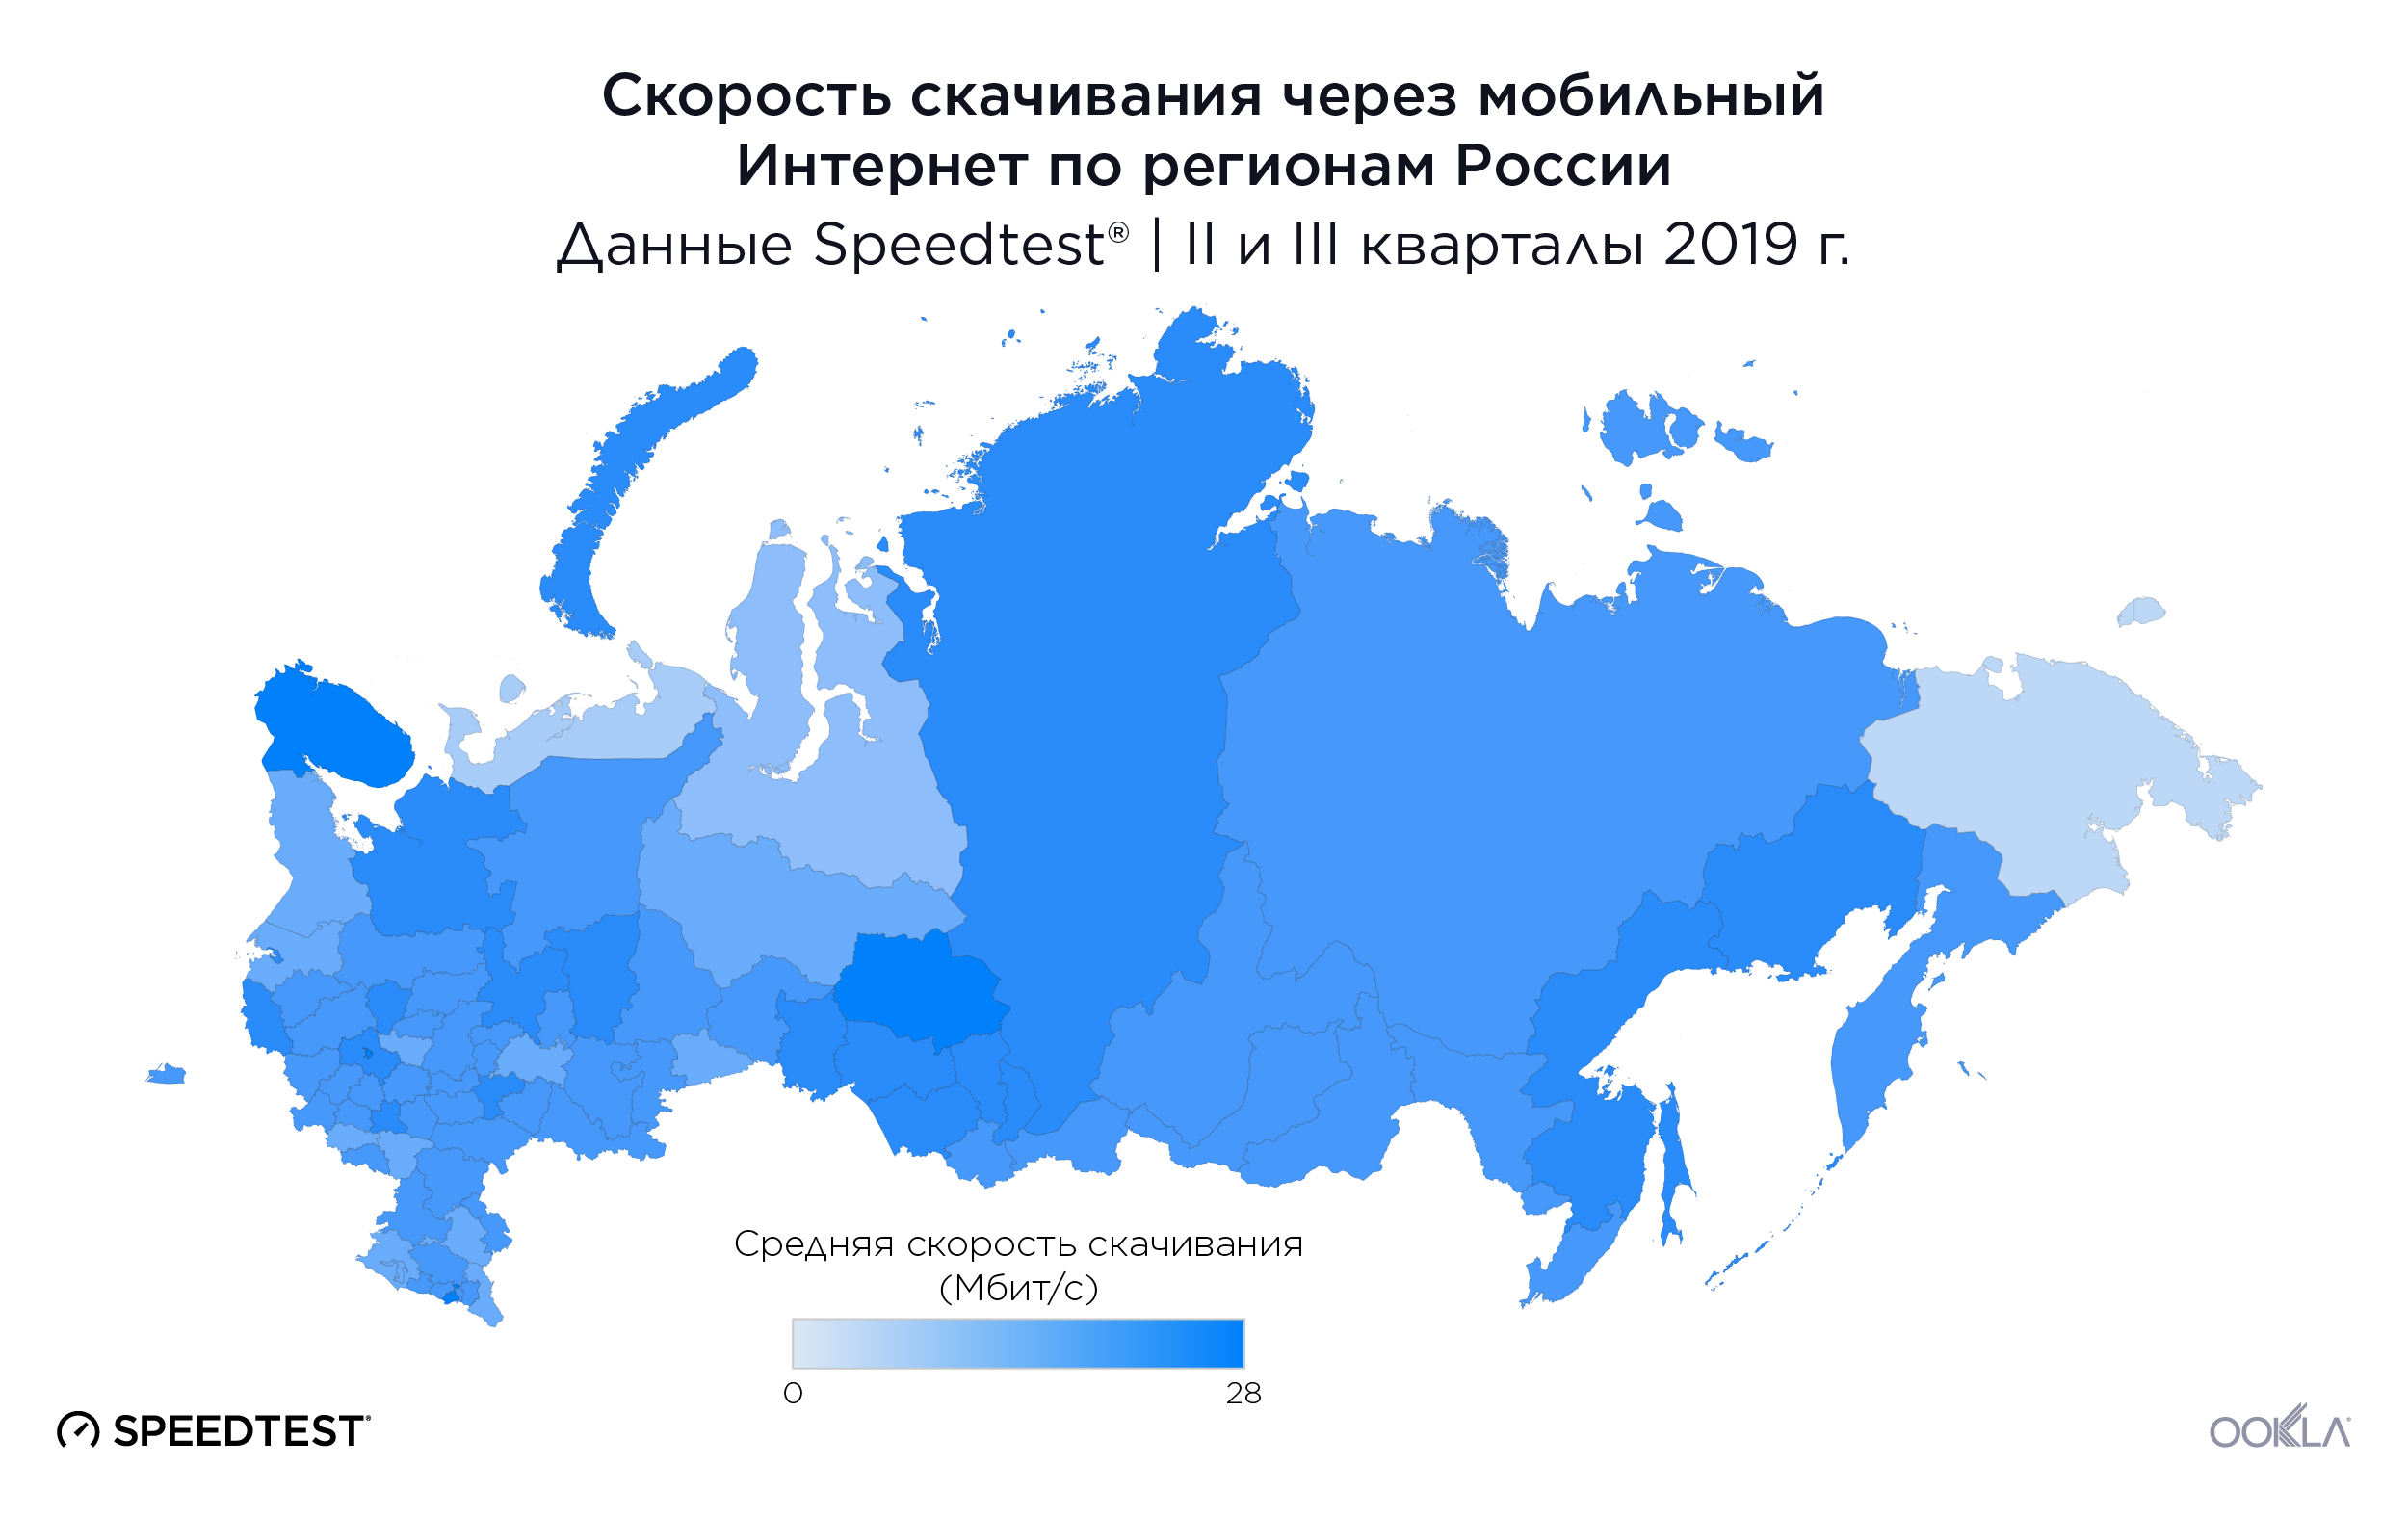
За исключением Мурманской и Калужской областей, список регионов с самой высокой и самой низкой средней скоростью скачивания через мобильный широкополосный Интернет во II и III кварталах 2019 г. значительно отличался от показателей для фиксированного широкополосного подключения. Более того, диапазон скорости мобильного Интернета среди областей России сократился.

Самая высокая средняя скорость скачивания через мобильный Интернет во II и III кварталах 2019 г. была зафиксирована в Томской области, расположенной на север от Казахстана, — 25,91 Мбит/с. Мурманская область заняла второе место после Томской со средней скоростью скачивания 24,50 Мбит/с. Ульяновская область, расположенная в юго-западной части России, заняла третье место со средней скоростью скачивания на уровне 23,11 Мбит/с.

Самая низкая средняя скорость скачивания через мобильный Интернет наблюдалась в Ленинградской области, за которой последовали Владимирская и Курская области. Все три области расположены в западной части страны, ближе к Европе, чем к Азии. Курская область граничит с Украиной, Владимирская — с Московской областью, а Ленинградская область — с Эстонией и Финляндией. Средняя скорость скачивания через мобильный Интернет в Томской области, занявшей первое место по этому показателю, была на 85,2% выше, чем в Ленинградской, во II и III кварталах 2019 г.

Области России демонстрируют значительные различия по доступности 4G

Ookla_Russia_Regional_4G-Availability_1119_ru

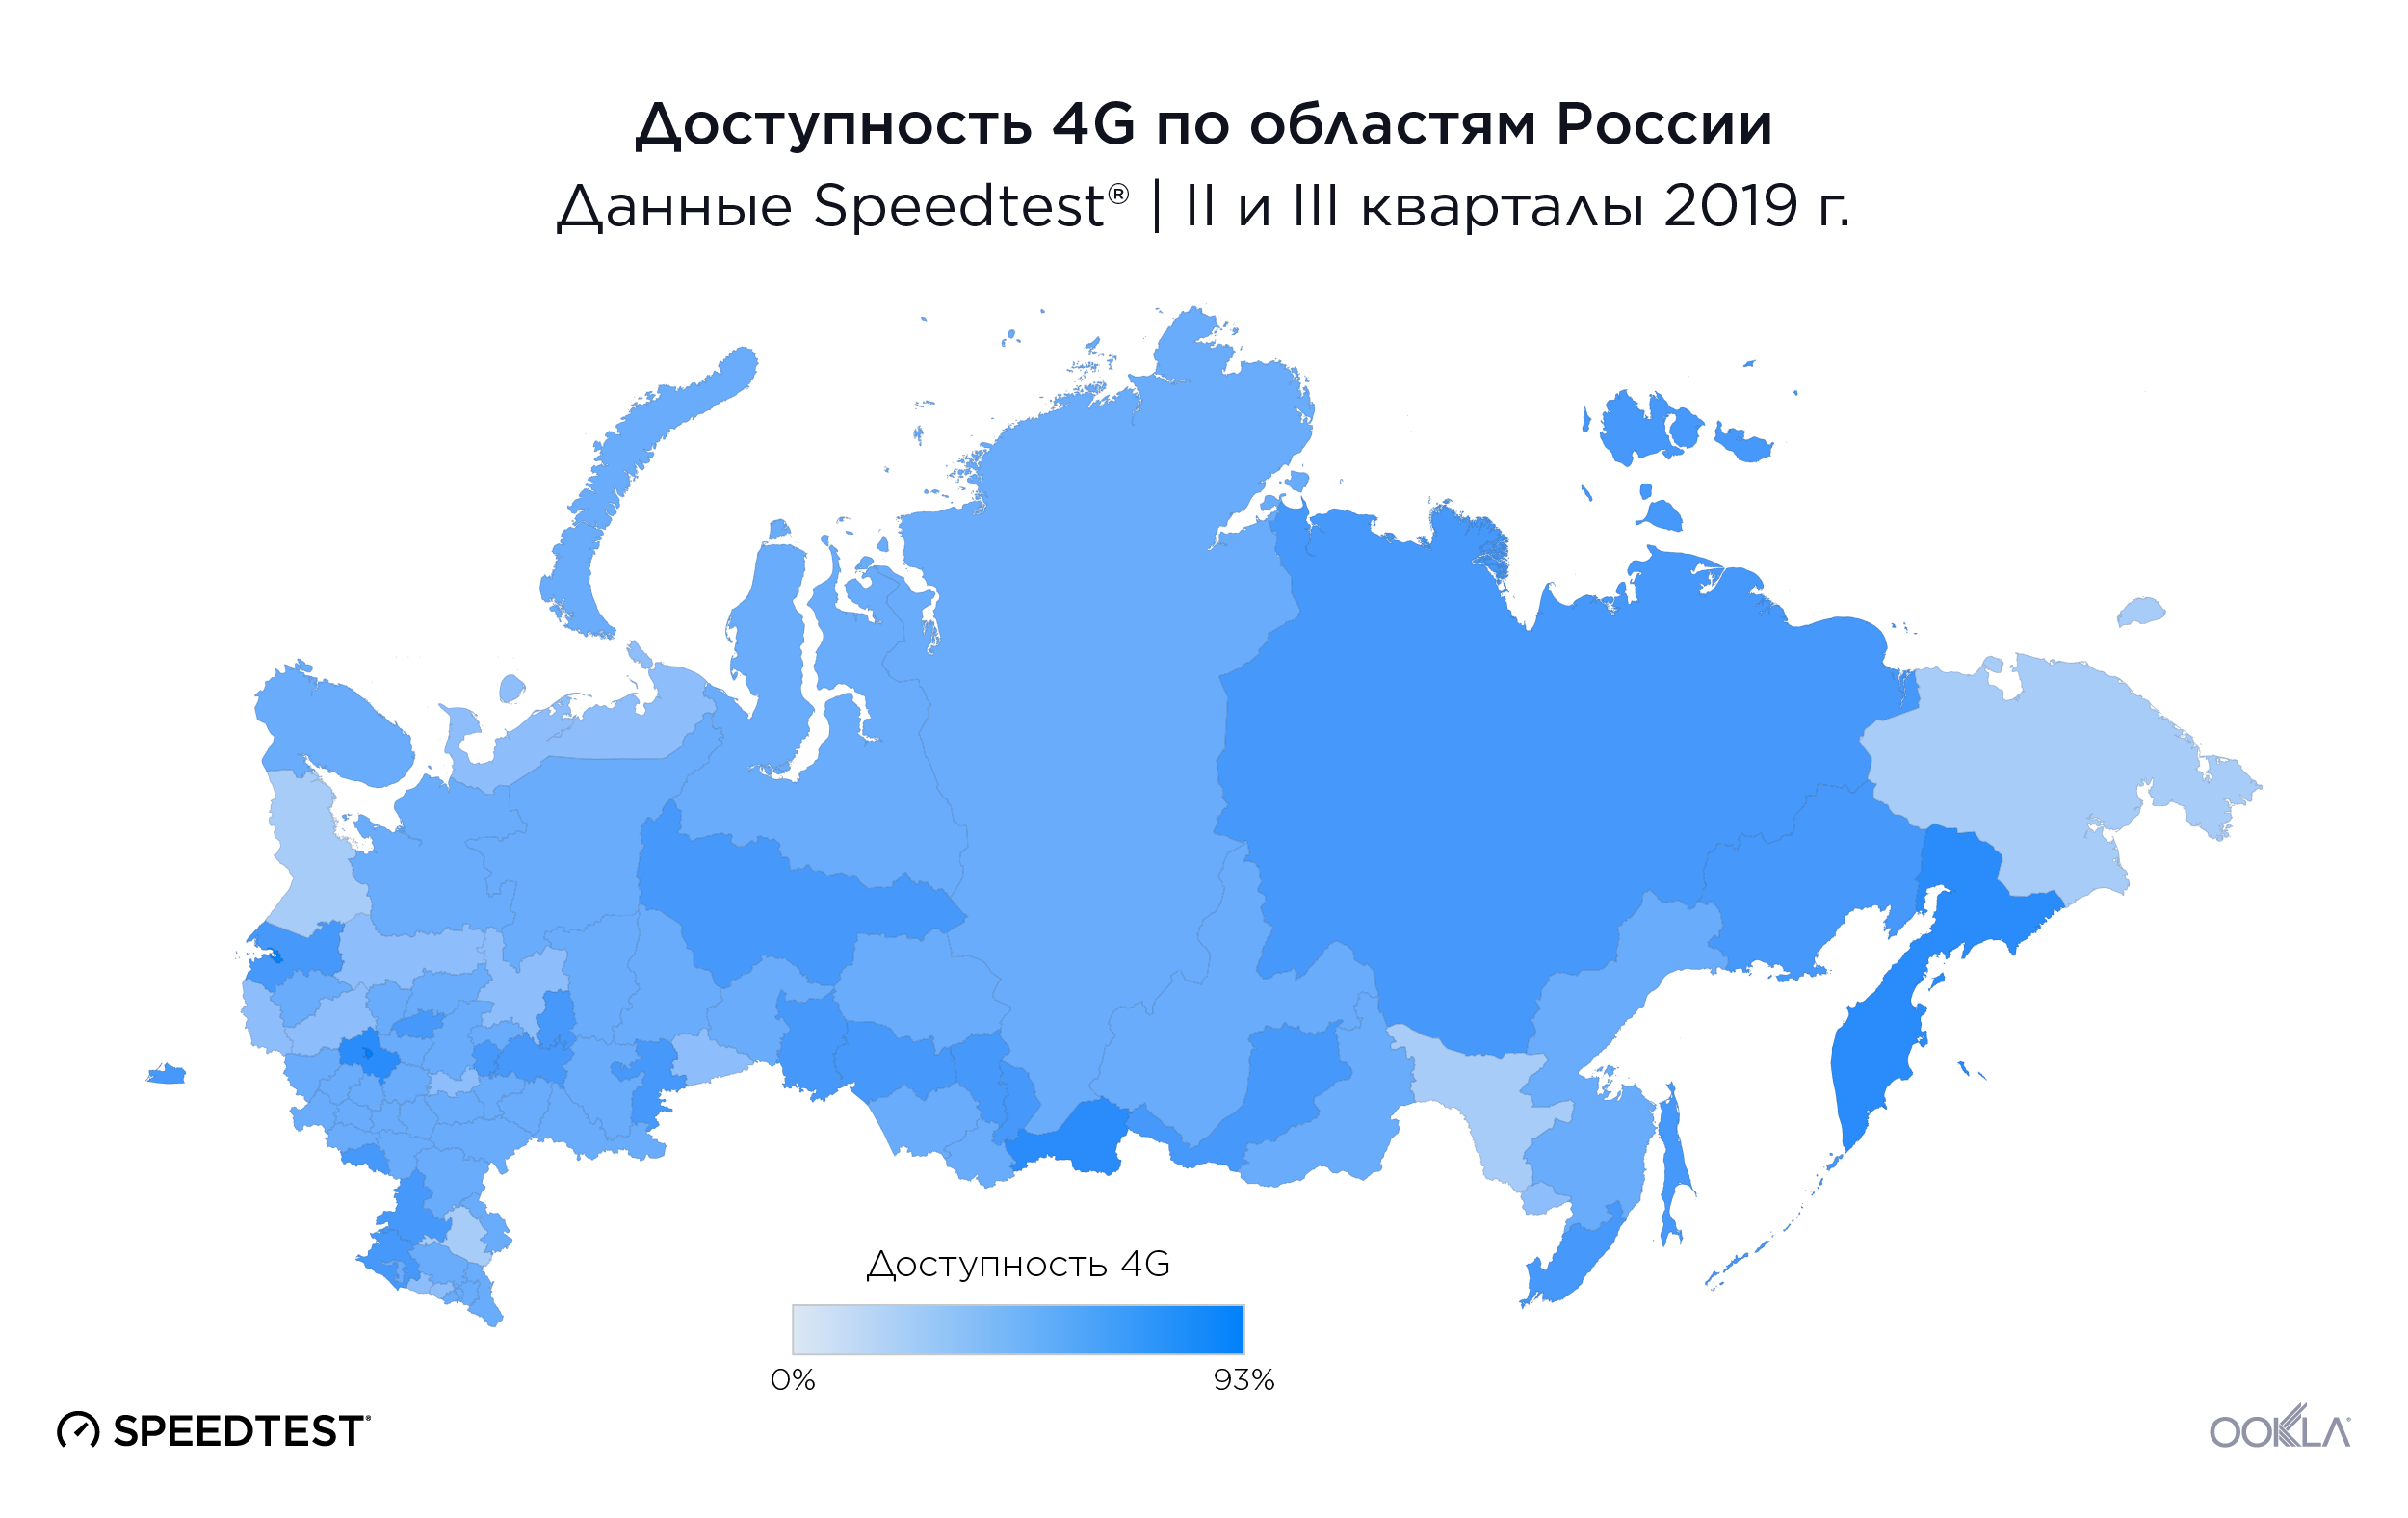
Во II и III кварталах 2019 г. доступность 4G по областям России значительно различалась: в исследуемых расположениях показатель доступности LTE-сети 4G колебался от 37,1% до 75,5%. В Московской области наблюдался самый высокий уровень доступности 4G во II и III кварталах 2019 г. — 75,5%. За ней последовали Магаданская (71,5%) и Сахалинская (66,7%) области. Самая низкая доступность 4G среди областей России во II и III кварталах 2019 г. была зарегистрирована в Вологодской области — 37,1%. Псковская область заняла предпоследнее место с показателем 37,3%, а Еврейская автономная область — третье место с конца с доступностью на уровне 37,5%.

Наш анализ демонстрирует, что показатели России лучше соотносятся со странами объединения БРИК в аспекте скорости Интернета и доступности 4G, чем со странами с самой крупной экономикой в целом. Однако скорость и доступность значительно различаются в крупнейших городах России и по областям. Мы будем пристально следить за этим рынком, чтобы узнать, приведут ли отмеченные улучшения к дальнейшему развитию телекоммуникаций в России.

Чтобы узнать больше о скорости Интернета на уровне отдельного провайдера, города, региона или страны, свяжитесь с нашей командой по этой ссылке.

Ookla retains ownership of this article including all of the intellectual property rights, data, content graphs and analysis. This article may not be quoted, reproduced, distributed or published for any commercial purpose without prior consent. Members of the press and others using the findings in this article for non-commercial purposes are welcome to publicly share and link to report information with attribution to Ookla.

| November 19, 2019

The State of Mobile 5G in the United Kingdom

Mobile operators in the United Kingdom firmly embraced 5G in 2019, rolling out deployments in major cities across the nation. This has the potential to revolutionize speeds across the U.K., however, the 5G experience varies by country and operator. We took a close look at Speedtest® data from Q3 2019 to pinpoint where consumers are able to access 5G and which operators are offering the fastest speeds and lowest latency on 5G. In addition, we examined 4G performance, as the majority of mobile users in the U.K. still rely on 4G for mobile access.

England leads the U.K. in 5G deployments

Ookla_UK_5G_Deployment_Map_1119
The Ookla 5G MapTM shows 5G deployments in 29 cities in the U.K. as of November 8, 2019. 5G is commercially available in 22 English cities including: London, Birmingham, Bristol, Liverpool, Manchester and Wolverhampton. Three cities in Scotland have 5G access: Edinburgh, Glasgow and Paisley. Belfast is currently the only city in Northern Ireland with 5G, while Wales has three 5G cities: Cardiff, Llandudno and Penarth.

5G results are more than 450% faster

Comparing 5G Speeds to Speeds on all Mobile Technologies in the United Kingdom
Speedtest® Results | Q3 2019
5G Download (Mbps) 5G Upload (Mbps) All Mobile Download (Mbps) All Mobile Upload (Mbps) % Change Download % Change Upload
United Kingdom 176.00 19.24 31.23 11.25 463.6% 71.0%
England 177.41 19.35 32.22 11.37 450.6% 70.2%
Northern Ireland 171.60 23.11 23.89 10.96 618.3% 110.9%
Scotland 175.05 15.76 30.66 11.38 470.9% 38.5%
Wales 176.69 18.25 30.69 10.50 475.7% 73.8%

5G is the great leveler for speeds in the U.K., where it’s available. Mean download speeds on 5G were uniformly high across the U.K., showing less than 6 Mbps difference between the fastest country (England) and the slowest (Northern Ireland).

In most countries Speedtest results on 5G show download speeds 450-475% faster than those on all mobile technologies combined. 5G download speed in Northern Ireland represented an even more impressive 618.3% improvement, because the mean mobile download speed on all technologies is so much slower in Northern Ireland than elsewhere in the U.K.

EE leads 5G speeds at the country level

5G Speeds by Operator in the United Kingdom
Speedtest® Results | Q3 2019
Operator 5G Download (Mbps) 5G Upload (Mbps) 5G latency (ms) 5G Top 10% Download (Mbps) 5G Top 10% Upload (Mbps)
EE 205.02 19.17 25 359.66 34.85
O2 159.48 17.28 26 261.32 27.55
Vodafone 140.15 19.36 21 230.57 32.97

EE showed the fastest mean download speed over 5G in the U.K. during Q3 2019. O2 was second and Vodafone third. We have omitted Three from this analysis as they currently only offer 5G broadband, and this only in certain districts of London. Three’s mobile 5G service is expected to be launched in the coming months. MVNO Virgin Mobile does not currently offer 5G.

The rankings remained the same when we analyzed the top 10% of results to get a better picture of the upper bound of 5G performance. These top 10% figures represent the 90th percentile, where 10% of results are greater than or equal to that speed.

Vodafone offered the lowest 5G latency in the U.K. during Q3 2019, EE was second and O2 third.

5G is rapidly evolving across the U.K. and each operator is taking a different approach. EE plans to launch 5G in seven additional cities in 2019. O2 is adding 5G in 16 cities in 2019, while Three will have 5G in 24 cities by the end of the year. Vodafone will add seven cities to its 5G portfolio in 2019. Virgin Media will also be working with Vodafone to launch 5G, potentially even in advance of fully switching to their network in 2021. 5G will continue to expand in 2020 as Ofcom is scheduled to auction additional spectrum for 5G in both the 700 MHz and 3.6-3.8 GHz bands in spring 2020.

5G speeds vary by operator in the U.K.’s capital cities

5G Speeds by Operator in the Capital Cities in the United Kingdom
Speedtest® Results | Q3 2019
City Operator 5G Download (Mbps) 5G Upload (Mbps) 5G latency (ms) 5G Top 10% Download (Mbps) 5G Top 10% Upload (Mbps)
Belfast EE 193.55 24.15 50 355.76 45.58
Cardiff Vodafone 181.96 17.74 20 292.41 26.60
Cardiff EE 168.47 18.27 32 296.04 30.37
Edinburgh EE 168.97 11.47 42 303.53 20.25
London EE 207.06 19.10 22 358.14 35.25
London O2 127.98 8.00 26 189.98 13.56
London Vodafone 115.92 20.23 23 184.20 37.10

Comparing 5G speeds by operator in the U.K.’s capital cities, EE showed the fastest mean download speed on 5G in London in Q3 2019 and Vodafone demonstrated the fastest 5G download speed in Cardiff. We’ve excluded O2 in Belfast and Edinburgh because they did not meet our minimum sample requirements during the period.

EE tops 4G speeds in the U.K.

We supplemented our 5G analysis with a look at 4G as not everyone has access to 5G. This is because it’s deployed on a city-by-city basis and requires 5G-capable phones to use.

4G Speeds by Operator in the United Kingdom
Speedtest® Results | Q3 2019
Operator 4G Download (Mbps) 4G Upload (Mbps) 4G latency (ms) 4G Top 10% Download (Mbps) 4G Top 10% Upload (Mbps)
EE 42.91 12.69 41 91.71 29.39
Virgin Mobile 35.67 13.12 45 67.45 29.73
Vodafone 33.32 12.92 38 75.76 25.57
Three 24.11 11.49 51 54.17 23.87
O2 22.95 10.04 44 49.97 19.17

EE had the fastest mean download speed over 4G during Q3 2019. Virgin Mobile was second, Vodafone third, Three fourth and O2 fifth. EE also had the fastest download speed when looking only at the top 10% of results. Vodafone had the lowest latency on 4G.

While we have seen faster 5G elsewhere in the world, the number of U.K. cities with 5G and the rapid expansion of 5G deployments is impressive. We were particularly pleased to see how consistent 5G speeds were across countries, something that’s been a pain point on 4G. We’ll be excited to revisit this analysis as mobile operators continue to expand and improve 5G in the U.K. Take a Speedtest and share your experience with us.

Ookla retains ownership of this article including all of the intellectual property rights, data, content graphs and analysis. This article may not be quoted, reproduced, distributed or published for any commercial purpose without prior consent. Members of the press and others using the findings in this article for non-commercial purposes are welcome to publicly share and link to report information with attribution to Ookla.

| October 14, 2019

Exploring Recent Trends in the Latin American Telecom Market


Leer en español | Leia em Português

The Latin American telecommunications market continues to be fascinating to watch as fixed broadband speeds increase and mobile operators ready their networks for 5G. In anticipation of Futurecom, we analyzed internet speeds and 4G Availability for Q2-Q3 2019 in Latin America’s major markets to see who’s leading the charge to the future.

Mobile and fixed speeds are increasing at the country level

LatAm-Mobile-Fixed-Speeds-in-Largest-Markets

Fixed broadband speeds are on the rise in Latin America’s largest markets. Colombia’s mean download speed increased 30.6% during Q2-Q3 2019 while Mexico’s increased 15.6%. Chile had the fastest mean download speed over fixed broadband by far and showed a 26.7% increase in speed during the period. Brazil was the second fastest throughout the period. Peru, Mexico and Argentina were closely vying for third, but in the end Peru won out. Colombia had the slowest download speed over fixed broadband.

Mobile speeds were much more competitive in Latin America’s largest markets. Increases in mean download speeds were not nearly as impressive as they were with fixed broadband, though. Mexico saw the greatest increase during Q2-Q3 2019 at 12.0%. Argentina’s mobile download speed increased 11.0%, followed by Brazil (7.9%), Chile (5.1%) and Colombia (4.6%). Peru’s mean download speed over mobile decreased 2.2% during the period. Mexico had the fastest mobile speed, followed by Peru, Brazil, Argentina, Chile and, finally, Colombia.

4G Availability varies widely by country

LatAm-4G-Availability-Q2-Q3

We looked at the percentage of surveyed locations where devices could access 4G LTE service in Latin America’s major markets during Q2-Q3 2019 and found that Peru was on top with 77.8% 4G Availability during the period. Chile came in second with 75.5% and Argentina third at 71.4%. Brazil had the lowest 4G Availability at 47.3% and Colombia had the second lowest at 50.6%.

City speeds vary by technology

Ookla_Internet-Speeds-in-Latin-America-Largetst-Cities_1019_EN
Fixed broadband speeds have increased dramatically in Latin America’s largest cities since we last examined them and these speeds have shifted the rankings significantly. Santiago, Chile had the fastest download speed over fixed broadband in Q2-Q3 2019, beating second-place Brasília, Brazil by 66.6%. São Paulo, Brazil came in a close third. Bogotá, Colombia had the slowest download speed over fixed broadband of the cities on our list. Lima, Peru was the second slowest city and Mexico City, Mexico third slowest.

Because of the political situation in Venezuela, we did not include Caracas in our analysis.

Mobile rankings have changed significantly since we last considered speeds in Latin America’s largest cities. Salvador, Brazil had the fastest mobile download speed on our list during this period. Brasília, Brazil was a close second and Mexico City, Mexico third fastest. Bogotá, Colombia also had the slowest mobile download speed on our list. Santiago, Chile was the second slowest city for mobile and Fortaleza, Brazil the third slowest.

Ookla will be at Futurecom! If you’d like to connect to learn more about the Latin American telecom market and how our data can help you, contact us.

Análisis de las tendencias recientes en el mercado de las telecomunicaciones de América Latina

El mercado de las telecomunicaciones de América Latina continúa siendo fascinante de analizar a medida que las velocidades de la banda ancha fija aumentan y los operadores de telefonía móvil preparan sus redes para la tecnología 5G. Mientras esperamos Futurecom, examinamos las velocidades de Internet y la disponibilidad de 4G en el segundo y tercer trimestre de 2019 en los principales mercados de América Latina para ver quién está a la vanguardia del cambio de cara al futuro.

Las velocidades fijas y móviles están aumentando en cada país

LatAm-Mobile-Fixed-Speeds-in-Largest-Markets_ES

Las velocidades de la banda ancha fija están en aumento en los mercados más importantes de América Latina. La velocidad media de descarga de Colombia aumentó un 30,6 % durante el segundo y tercer trimestre de 2019, mientras que la de México se incrementó en un 15,6 %. Chile tuvo la velocidad media de descarga por banda ancha más rápida por lejos y demostró un aumento del 26,7 % en la velocidad durante el período. Brasil fue el segundo más rápido en todo el período. Perú, México y Argentina le siguieron de cerca compitiendo por el tercer puesto, pero al final, ganó Perú. Colombia tuvo la velocidad de descarga por banda ancha fija más lenta.

Las velocidades móviles fueron mucho más competitivas en los mercados más importantes de América Latina. Sin embargo, los aumentos en las velocidades medias de descarga no fueron tan impresionantes como lo fueron los de la banda ancha fija. México tuvo el mayor aumento durante el segundo y tercer trimestre de 2019 con un 12 %. La velocidad de descarga móvil de Argentina aumentó un 11 %, seguida por Brasil (7,9 %), Chile (5,1 %) y Colombia (4,6 %). La velocidad media de descarga móvil de Perú disminuyó un 2,2 % durante el período. México tuvo la velocidad móvil más rápida, seguido por Perú, Brasil, Argentina, Chile y, por último, Colombia.

La disponibilidad de 4G varía ampliamente por país

LatAm-4G-Availability-Q2-Q3_ES

Examinamos el porcentaje de lugares encuestados en donde los dispositivos pudieran acceder al servicio 4G LTE en los principales mercados de América Latina durante el segundo y tercer trimestre de 2019 y concluimos que Perú quedó en la cima con un 77,8 % de disponibilidad de 4G durante el período. Chile quedó segundo con el 75,5 % y Argentina quedó en el tercer lugar con el 71,4 %. Brasil tuvo la menor disponibilidad de 4G con el 47,3 % y Colombia tuvo el segundo nivel más bajo, con el 50,6 %.

Las velocidades de las ciudades varían según la tecnología

Ookla_Internet-Speeds-in-Latin-America-Largetst-Cities_1019_ES

Las velocidades de la banda ancha fija han aumentado drásticamente en las ciudades más importantes de América Latina desde la última vez que las analizamos y estas velocidades han cambiado las clasificaciones de manera significativa. Santiago, Chile, tuvo la mayor velocidad de descarga en banda ancha fija en el segundo y tercer trimestre de 2019, y venció a Brasilia, Brasil, que se quedó con el segundo lugar por el 66.6%. San Pablo, Brasil, quedó en tercer lugar, cerca. Bogotá, Colombia tuvo la velocidad de descarga por banda ancha fija más lenta de las ciudades en nuestra lista. Lima, Perú, fue la segunda ciudad más lenta, y la Ciudad de México, México, la tercera.

Debido a la situación política de Venezuela, no incluimos a Caracas en nuestro análisis.

Las clasificaciones móviles ha cambiado de manera significativa desde la última vez que analizamos las velocidades en las ciudades más importantes de América Latina. Salvador, Brasil, tuvo la velocidad de descarga móvil más rápida en nuestra lista durante este período. Brasilia, Brasil, quedó en segundo lugar por poco, y la Ciudad de México, México, fue la tercera más rápida. Bogotá, Colombia, también tuvo la velocidad de descarga móvil más lenta en nuestra lista. Santiago, Chile, fue la segunda ciudad más lenta en velocidad móvil, y Fortaleza, Brasil, la tercera más lenta.

Ookla estará en Futurecom. Si desean ponerse en contacto para obtener más información sobre el mercado de las telecomunicaciones en América Latina y cómo nuestros datos pueden ayudarlos, comuníquense con nosotros.

Tendências recentes no mercado de telecomunicações da América Latina

O mercado de telecomunicações da América Latina continua fascinante graças ao aumento das velocidades de banda larga e a preparação das redes de operadoras de celular para o 5G. Nas vésperas da Futurecom, analisamos as velocidades da internet e a disponibilidade de redes 4G entre o segundo e o terceiro trimestres de 2019 nos principais mercados da América Latina, para ver quem está liderando essa empreitada em direção ao futuro.

As velocidades de redes fixas e móveis dos países estão aumentando

LatAm-Mobile-Fixed-Speeds-in-Largest-Markets_PT

A velocidade da banda larga está aumentando nos maiores mercados da América Latina. A velocidade média de download da Colômbia aumentou 30,6% entre o segundo e o terceiro trimestres de 2019, enquanto no México ela aumentou 15,6%. O Chile teve, de longe, a maior velocidade média de download em banda larga fixa, com um aumento de 26,7% na velocidade durante o período. O Brasil foi o segundo mais rápido durante o período. Peru, México e Argentina disputaram acirradamente o terceiro lugar, mas o Peru acabou vencendo. A Colômbia teve a menor velocidade de download em banda larga fixa.

Houve um aumento na concorrência no setor de velocidades móveis nos maiores mercados da América Latina. No entanto, o aumento na velocidade média de download não foi tão impressionante quanto na banda larga fixa. O México teve o maior aumento entre o segundo e o terceiro trimestres de 2019, com 12%. A velocidade de download móvel da Argentina aumentou 11%, seguida pelo Brasil (7,9%), Chile (5,1%) e Colômbia (4,6%). A velocidade média de download do Peru em rede móvel diminuiu 2,2% durante o período. O México teve a maior velocidade móvel, seguido de Peru, Brasil, Argentina, Chile e, por fim, Colômbia.

Disponibilidade do 4G varia muito conforme o país

LatAm-4G-Availability-Q2-Q3_PT

Analisamos a porcentagem de dispositivos com acesso ao serviço 4G LTE nos maiores mercados da América Latina entre o segundo e o terceiro trimestres de 2019 e descobrimos que o Peru teve a maior disponibilidade do 4G no período, com 77,8%. O Chile ficou em segundo, com 75,5%, enquanto a Argentina ficou em terceiro com 71,4%. O Brasil teve a menor disponibilidade do 4G, com 47,3%, enquanto a Colômbia teve a segunda menor, com 50,6%.

Velocidades no meio urbano variam de acordo com a tecnologia

Ookla_Internet-Speeds-in-Latin-America-Largetst-Cities_1019_PT

A velocidade de banda larga fixa aumentou dramaticamente nas maiores cidades da América Latina desde a nossa última análise, o que alterou os rankings de maneira significativa. Santiago, no Chile, teve a maior velocidade de download em banda larga fixa entre o segundo e terceiro trimestres de 2019, acima do segundo lugar, Brasília, com 66,6%. São Paulo ficou em terceiro lugar, com uma porcentagem próxima. Bogotá, na Colômbia, teve a menor velocidade de download em banda larga fixa nas cidades da lista. Lima, no Peru, teve a segunda menor velocidade, com a Cidade do México, no México, em terceiro.

Devido à situação política da Venezuela, Caracas não foi incluída na análise.

Os rankings de rede móvel mudaram significativamente desde nossa última análise da velocidade nas maiores cidades da América Latina. Salvador teve a maior velocidade de download em rede móvel durante o período. Brasília ficou em segundo lugar por pouco, enquanto a Cidade do México, no México, ficou em terceiro. Bogotá, na Colômbia, também teve a menor velocidade de download em rede móvel na nossa lista. Santiago, no Chile, teve a segunda menor velocidade para redes móveis, seguida por Fortaleza, que teve a terceira menor velocidade.

A Ookla estará na Futurecom! Entre em contato conosco para saber mais sobre o mercado de telecomunicações da América Latina e como nossos dados podem ajudá-lo.

Ookla retains ownership of this article including all of the intellectual property rights, data, content graphs and analysis. This article may not be quoted, reproduced, distributed or published for any commercial purpose without prior consent. Members of the press and others using the findings in this article for non-commercial purposes are welcome to publicly share and link to report information with attribution to Ookla.

| October 8, 2019

Investigating Internet Speeds on Tribal Lands in the U.S. and Canada

Ookla is headquartered in Seattle, traditional home of the Duwamish and Coast Salish people, where the mean download speed over fixed broadband is 142.67 Mbps. Thirty-six miles to the south on the Muckleshoot Reservation, it’s 101.85 Mbps. Meanwhile, the Makah Indian Reservation, located on the remote Washington coast, sees an average download speed of 5.91 Mbps.

Who gets fast internet speeds and who doesn’t involves a blend of factors (including geography, population density and economics) that is unique for every location, including individual Native American reservations and First Nations reserves. As Indigenous People’s Day nears, we are interested in how those factors combine to affect mobile and fixed broadband speeds on tribal lands across the U.S. and Canada. Because we are experts in internet speeds, not tribal policy, we are also offering our full tribal data set at the end of this article for anyone who would like to do further analyses.

Mobile speeds vary widely between tribal lands

Fastest-Mobile-Speeds-1

The Capilano Indian Reserve has the fastest mean download over mobile speed of all the reservations and reserves we examined. Also called X̱wemelch’stn, this community near Vancouver, B.C. is the most densely populated reserve of the Squamish Nation and its mean download speed on mobile is 27.8% faster than nearby Vancouver, B.C.

The Rumsey Indian Rancheria of the Yocha Dehe Wintun Nation virtually ties for the second fastest mean download speed over mobile. Located in California’s Coast Range, this reservation contains a casino and resort and experiences a 93.7% faster average than the state of California. With a nearly identical mean download speed, the Pala Reservation of the Pala Band of Mission Indians also houses a casino and resort and an average download speed 93.6% faster than California as a whole.

Except for Kahnawake, which has a 3.8% slower average mobile download speed than nearby Montreal, Quebec, all of the reservations and reserves on this fastest mobile list have download speeds at least 26% faster than the nearby non-tribal areas (adjacent large cities or encompassing states or provinces) we compared them with. Muckleshoot is 71.2% faster than Washington. Compared to California, Rincon is 49.9% faster, Morongo 37.1%, Twenty-Nine Palms 31.3% and Viejas 27.6%. The Mashantucket Pequot Reservation was 26.3% faster than Connecticut.

All ten of the reservations and reserves with the fastest mobile download speeds are home to large commercial enterprises including shopping centers, casinos, resorts and even a data center. Six are in California. Three are located in or adjacent to large cities.

Slowest-Mobile-Speeds-1

Our list of reservations with the slowest mobile download speeds contains some of the largest (by area) reservations in the U.S. A few have tribal enterprises including mining, casinos and tourism; most do not. All are located relatively far from large cities.

The Navajo Nation Reservation has the slowest mean download speeds over mobile of all the reservations and reserves we examined. This largest reservation in the U.S. shows an average mobile download speed that’s 80.8% slower than Arizona as a whole. Santa Clara Pueblo, located north of Santa Fe, New Mexico, has the second slowest mobile download speed on our list and is 68.5% slower than the state of New Mexico. White Earth Reservation is the third slowest on mobile, coming in 71.1% slower than the state of Minnesota.

The reservations and reserves with the slowest average mobile download speeds are at least 43.5% slower than neighboring non-tribal lands. The Allegany Reservation is 63.8% slower than New York. The Lummi and Colville Reservations are 63.3% and 63.0% slower, respectively, than Washington. In Idaho, the Nez Perce and Coeur d’Alene Reservations are 52.8% and 45.1% slower, respectively, than the state average. The Blackfeet Indian Reservation is 46.6% slower than Montana, and Pueblo Taos is 43.5% slower than New Mexico.

Fixed broadband speeds show even more variation

The ten reservations and reserves with the fastest fixed broadband download speeds are mostly in or directly adjacent to large, urban areas. All of the six reserves or reservations with the fastest fixed broadband download speed are in Canada with an additional seventh Canadian reserve in the top ten.

Fastest-Fixed-Broadband-Speeds-1

Cole Harbour 30, a Mi’kmaq reserve, has a very fast mean download speed over fixed broadband. It is located in the municipality of Halifax, Nova Scotia, a city we’ve previously found to have some of the fastest fixed broadband speeds in Canada. Cole Harbour beats Halifax’s speed by 213.1%.

Second-place Wendake is located within Quebec City, Quebec and has a fixed broadband mean download speed that’s 26.2% faster than the capital city. The Squamish Nation reserve of Seymour Creek 2 has the third fastest download speed among reserves and reservations. Located near North Vancouver, the reserve’s download speed is 24.0% faster than that of their neighboring city.

Most of these reservations and reserves show faster average download speeds over fixed broadband than comparable geographies — large cities when nearby and states or provinces when not. Cowichan 1 and Tsinstikeptum 10 are 19.7% and 16.8% faster than British Columbia, respectively. Burrard Inlet 3 is 11.2% faster than North Vancouver. The Hollywood Reservation is 5.5% faster than Hollywood, Florida, and New Songhees 1A is 1.7% faster than British Columbia. However, Salt River Reservation is 16.0% slower than neighboring Scottsdale, Arizona and the Puyallup Reservation is 4.5% slower than nearby Tacoma, Washington.

Slowest-Fixed-Broadband-Speeds-1

The slower list is evenly split between Canada and the U.S. and is mostly made up of rural and/or isolated reserves and reservations.

The Munsee-Delaware Nation No. 1 has the slowest mean download speed over fixed broadband of all the reserves and reservations we analyzed. Located in southwest Ontario, the reserve’s download speed is 99.4% slower than the provincial average. Close to Redwoods National Park in California, the Yurok Reservation is the second slowest for fixed broadband. It also has a mean download speed 96.9% slower than the state of California. Eskasoni 3 has the third slowest download speed over fixed broadband and was 95.6% slower than the surrounding province of Nova Scotia.

Fixed broadband download speeds on the rest of the tribal lands on this list are similarly slower than their comparable geographies: from the Chippewas of Georgina Island First Nation (96.1% slower than Toronto, Ontario) to the Cheyenne River Reservation (92.2% slower than South Dakota). Whitefish Bay 32A and Peguis 1B are 94.5% and 93.5% slower, respectively, than Ontario as a whole. In Washington, the Makah Reservation and the Quinault Reservation are 95.1% and 94.5% slower, respectively, than the state average. Annette Island Reserve is 93.6% slower than the state of Alaska.

There are so many reservations and reserves that we could not cover them all here. However, we are making our full CSV available for download if you’d like details on mobile and fixed broadband speeds on other tribal lands. This file includes June-August 2019 data for all locations that have 30 or more samples.

Ookla’s mission is to help make the internet better, faster and more accessible for everyone. We hope that by sharing this data we can contribute to conversation about internet equity for tribal lands. If you publish anything based on this data, please credit Speedtest IntelligenceTM as the source.

Editor’s note: The CSV was updated on December 10, 2019 to correct a sorting error that resulted in the misattribution of states.

Ookla retains ownership of this article including all of the intellectual property rights, data, content graphs and analysis. This article may not be quoted, reproduced, distributed or published for any commercial purpose without prior consent. Members of the press and others using the findings in this article for non-commercial purposes are welcome to publicly share and link to report information with attribution to Ookla.

| October 1, 2019

How 5G is Changing the Global Mobile Landscape

Five months ago, we started using the Ookla 5G MapTM to track 5G across the world. In the months since, 5G deployments have increased exponentially — where we saw 294 around the world in May, today there are more than that in Switzerland alone. Today we’re exploring where 5G is gaining the most traction, including an analysis of how much faster 5G is than 4G in various markets.

Countries with the most 5G deployments

The Ookla 5G Map reveals that Switzerland is winning the race of 5G expansion with more than twice as many commercially available deployments as second-place South Korea. Kuwait has the third largest number of 5G deployments in the world.

Ookla_Countries-with-the-most-5G-deployments-2

It’s interesting to note that of the world’s six largest economies, three do not have commercially available 5G at all (China, Japan and India). China does have 29 locations where 5G is in pre-release (with 5G network hardware in place but not yet accessible to consumers). Japan is expected to launch 5G in 2020 and 5G will likely be available in India in 2021.

The other three largest economies (the U.S., Germany and the U.K.) do feature among the 10 countries with the most commercially available 5G deployments, although they individually have many fewer deployments than Switzerland, South Korea and Kuwait.

5G downloads are at least 300% faster than 4G

In theory, 5G could eventually offer download speeds about 1300% faster than those on 4G. Real-world factors affect those numbers, though, so we examined data from Speedtest IntelligenceTM to see what consumers actually experienced in several key markets between June and August 2019.

Comparing Mean Speeds on 5G and 4G
Speedtest Results | June-August 2019
Country 4G Download (Mbps) 4G Upload (Mbps) 5G Download (Mbps) 5G Upload (Mbps) % Difference Download
Australia 60.59 16.37 258.18 33.25 326.1%
Bahrain 28.80 13.43 311.41 29.43 981.3%
Kuwait 34.02 18.36 352.93 23.24 937.4%
Qatar 62.27 17.57 303.57 36.78 387.5%
Saudi Arabia 42.11 16.50 395.04 33.75 838.1%
South Korea 64.79 14.66 393.07 30.33 506.7%
Switzerland 50.65 20.10 362.75 43.12 616.2%
United Arab Emirates 59.23 20.12 334.27 32.07 464.4%
United Kingdom 31.03 11.47 181.87 18.34 486.1%
United States 34.33 9.98 477.42 21.93 1290.7%

The mean download speed over 5G was fastest in the U.S. and also showed the largest percent difference when compared with mean download speed over 4G. Saudi Arabia had the second fastest mean download speed over 5G with South Korea coming in a close third. On the other end of the spectrum, the U.K. had the slowest mean download speed over 5G. Australia was the second slowest and Bahrain third slowest. Bahrain showed the second highest percent improvement when comparing 4G and 5G download speeds, though, and Kuwait was third. Australia showed the lowest percent increase between 4G and 5G download speeds and Qatar had the second lowest.

Mean upload speeds over 5G are less remarkable, though in almost every country we analyzed they represent a 50-120% improvement over those available on 4G. Kuwait was the exception, with only a 26.6% improvement in mean upload speed when using 5G rather than 4G. The U.S. and Bahrain were nearly tied for most improved with increases of 119.7% and 119.1%, respectively, when comparing mean upload speed on 5G to that on 4G. Switzerland had the fastest mean upload speed over 5G, Qatar was second and Saudi Arabia third. Mean upload speed over 5G was the slowest in the U.K., second slowest in the U.S. and third slowest in Kuwait.

5G Share of 4G/5G Speedtest Samples
June-August 2019
Country % 5G
South Korea 12.72%
Australia 1.31%
United Arab Emirates 0.65%
Kuwait 0.64%
Switzerland 0.59%
Qatar 0.43%
United Kingdom 0.30%
United States 0.20%
Bahrain 0.09%
Saudi Arabia 0.03%

The 5G share of the tests taken on either 4G or 5G differs widely among the countries on our list. South Korea was clearly on top with 5G accounting for nearly 13% of Speedtest 4G/5G samples. This is not surprising given that one South Korean mobile operator already has 1 million 5G subscribers. Australia had the second largest percentage of 5G tests and the U.A.E. third. Saudi Arabia had the smallest percentage of 5G results.

Ookla is your go-to resource for ongoing 5G analysis

Ookla will continue to analyze 5G speeds as operators across the globe make this significant improvement in their networks. We’re uniquely capable of measuring 5G speeds because Speedtest uses a client and server testing engine capable of measuring high-speed connections (up to 10 Gbps) that dynamically scales the number of connections to the server in order to saturate and accurately measure the client-side connection. This allows us to measure the full extent of real-world performance and overcome the effects of network bottlenecks such as TCP slow start and means we are unique in our ability to measure 5G.

In addition, Ookla has partnered with operators and device manufacturers all over the world to implement accurate in-app 5G detection — even as Android Pie, which powers the current generation of 5G devices, does not natively identify 5G connection types. Through this approach, we’re able to properly configure the parameters of a Speedtest and measure 5G tests.

Keep watching this space for future analyses or contact us to learn more about how our data can help you.

To get a broader understanding of how 5G is changing the mobile landscape, read our previous coverage here:

Ookla retains ownership of this article including all of the intellectual property rights, data, content graphs and analysis. This article may not be quoted, reproduced, distributed or published for any commercial purpose without prior consent. Members of the press and others using the findings in this article for non-commercial purposes are welcome to publicly share and link to report information with attribution to Ookla.

| September 17, 2019

What Happens to the Internet When Mobile Providers Go Down

You may have experienced the panic that happens when you realize you can’t get a connection on your phone. Most of us in these moments will try several ways of getting online before rushing to Downdetector® to see if our mobile operator is out of service or if it’s just us. Having access to data from both Downdetector and Speedtest® gives us unique insight into how network outages impact the internet as a whole, and in this article we’re exploring that impact in several key markets around the world.

The outages we explored

We looked specifically for recent outages that affected mobile networks in a variety of countries around the globe. The outages we explored were in Brazil (Vivo — 12,994 reports on August 22), Canada (Rogers and Freedom Mobile — 35,685 reports July 7-8), Italy (Iliad — 3,018 reports on June 21), India (Vodafone-Idea — 1,386 reports on July 17), the Netherlands (KPN Mobile, T-Mobile and Vodafone — 92,391 reports on June 24), Sweden (Tele2 — 7,275 reports June 17-19) and the United States (T-Mobile — 95,267 reports on September 6).

Working hypotheses

We had three hypotheses when we set out to do this analysis based on what we would expect to happen in a prolonged, near-total mobile outage:

  1. Mobile speeds would increase during an outage (for those who could connect) because there would be significantly less network congestion.
  2. Fixed broadband speeds would not change during an outage.
  3. The number of mobile Speedtest results would increase on the day of the outage as users tried to troubleshoot their connections.
  4. The number of fixed broadband Speedtest results would also increase on the day of the outage as people switched from mobile to fixed broadband to try and connect.

As with any real-world experiment there are many variables that can affect the results but for which we cannot control. Each of these outages varied in duration, cause and totality — factors which affect potential outcomes.

Mobile Outages Affect Download Speed in Different Ways

We compared each operator’s mean download speed over mobile on the day of the outage with their mean speed during that month to see if our hypothesis held. Results were mixed.

How Mobile Outages Affect Mobile Speed

In India and the U.S., mobile download speeds did increase very slightly for each provider on the day of the outage when compared with the monthly average. Both of these outages were localized within the country with the Indian outage centering around Ahmedabad and the U.S. outage falling on the East Coast.

On the other hand, mobile download speeds in Brazil and Italy were lower on the day of the outage than the monthly average. Significantly so in Italy. In both of these instances the mobile operator was experiencing a geographically widespread outage.

The outage in Canada revealed two different stories as download speed decreased slightly during the outage for Rogers customers and increased for customers of Freedom Mobile. Results were also mixed in the Netherlands with Vodafone customers seeing a significantly higher download speed, KPN Mobile customers seeing a slightly higher speed and T-Mobile customers seeing a decrease in download speed.

The outage in Sweden occurred in three waves over three separate days:

Downdetector view of June 2019 Tele2 Outage Peaks

We looked at each separately and found that mobile download speed on Tele2 increased during the smaller first and last waves. Meanwhile, mean download speed decreased during the largest middle outage.

Fixed broadband speeds show only slight variations

We measured download speed over fixed broadband at the country level both on the day(s) of the outages and compared that number with the average download speed for the appropriate month.

How Mobile Outages Affect Fixed Broadband Speed

Our hypothesis about fixed speeds not changing during mobile outages proved mostly true. Although download speed over fixed broadband did decrease in Italy and the Netherlands during their country-wide outages, the decrease was very small. In Canada there was virtually no difference in speed between the day of the outage and the monthly average.

Download speed over fixed broadband was faster during the outages in all other countries we examined. However, the differences were not large enough to rule out day-to-day fluctuations in speed.

Speedtest results usually increase during outages

We also compared the number of Speedtest results over both mobile and fixed broadband during the outages with the daily averages in each country for the appropriate month.

Effect of Mobile Outages on Number of Speedtest Results

Our hypothesis that the number of mobile Speedtest results would increase on the day of an outage held mostly true. Exceptions were Canada and two days of the Swedish outage. Fixed broadband Speedtest results also mostly increased, except in Canada and the Netherlands, but for the most part only very minimally.

Contact us to learn how data from Downdetector and Speedtest can help you before, during and after an outage.

Ookla retains ownership of this article including all of the intellectual property rights, data, content graphs and analysis. This article may not be quoted, reproduced, distributed or published for any commercial purpose without prior consent. Members of the press and others using the findings in this article for non-commercial purposes are welcome to publicly share and link to report information with attribution to Ookla.

| September 4, 2019

In-Depth Analysis of Changes in World Internet Performance Using the Speedtest Global Index

A lot has changed in the two years since 2017 when we first began ranking mobile and fixed broadband speeds of countries around the world with the Speedtest Global IndexTM. 5G is being deployed around the world and fiber continues to make gigabit speeds a reality in more and more countries. We’ve been tracking it all and are here to report on how much speeds have increased, which countries are leading internet performance and which are falling behind, and what trends we see across continents.

World mobile speed increased 21.4% with fixed broadband up 37.4%

World-Download-Speeds-2019-OG2

Looking just at the last year, the world’s mean download speed over mobile increased 21.4% from 22.81 Mbps in July 2018 to 27.69 Mbps in July 2019. Mean upload speed over mobile increased 18.1% from 9.13 Mbps to 10.78 Mbps. The world average for download speed over fixed broadband increased 37.4% from 46.48 Mbps in July 2018 to 63.85 Mbps in July 2019. Mean upload speed over fixed broadband increased 48.9% from 22.52 Mbps to 33.53 Mbps.

Shake-ups in the country rankings for internet performance

Fastest-Countries-Mobile-2018-2019

Mobile speeds in the fastest countries have skyrocketed in the past year which has dramatically shifted the rankings. South Korea, which was not even in the top ten a year ago, saw a 165.9% increase in mean download speed over mobile during the past 12 months, in large part due to 5G. Switzerland’s mean download speed increased 23.5%. Canada’s was up 22.2%, Australia 21.2%, the Netherlands 17.3%, UAE 11.1%, Malta 10.3% and Norway 5.8%. Qatar remained in the top ten, although the country’s mean download speed over mobile actually dropped 1.4% from July 2018 to July 2019.

Individual mobile operators can make a huge difference in a country’s speeds. In 2017 we were excited to see Telenor uncap their mobile speeds, which drove Norway to the top of the Speedtest Global Index. A big part of South Korea’s mobile success in the past year is the way KT, LG U+ and SK Telecom banded together to release 5G at the same time. Switzerland has also benefited from 5G and Sunrise leads the country with 262 5G deployments across the country while Swisscomm has 52.

Fastest-Countries-Fixed-2018-2019

Fixed broadband rankings on the Speedtest Global Index have not changed as dramatically during the past 12 months as those on mobile. Singapore remains the fastest country with an increase in mean download speed over fixed broadband of 5.6%. Taiwan had the largest jump in speeds among the top 10 with a 166.5% improvement in fixed download speed between July 2018 and July 2019. Mean download speed over fixed broadband increased 52.4% in South Korea, 26.4% in Macau, 21.7% in Romania, 21.0% in Switzerland, 19.3% in the United States and 3.5% in Hong Kong.

Monaco and Andorra did not have enough tests to qualify for the Speedtest Global Index one year ago, but massive fixed broadband improvements in both countries inspired us to lower our test count threshold for inclusion and also share these smaller countries’ success stories.

Technologies paving the way: 5G and gigabit

The presence of 5G is not enough to change a market

As discussed above, 5G has the potential to rocket a country to the top of the mobile rankings on the Speedtest Global Index. In practice, we’ve seen 5G speeds that were over 1000% faster than those on LTE.

Mobile-Download-Speeds-by-Country

In reality, though, unless 5G is commercially available widely across a country and from all mobile operators (as was the case in South Korea), the change in speeds at the country level is not that significant. Though commercial 5G was launched widely across Switzerland by Sunrise and Swisscom in April 2019, the country’s mean download speed only increased 2.8% in the three months since. The average mobile download speed in the U.S. has actually declined slightly since 5G was initially deployed. This is because 5G is still only available in a very limited number of markets to consumers with 5G-capable devices.

Visit the Ookla 5G Map for the latest on 5G deployments across the globe.

Gigabit is a game-changer, if you can get it

Unlike 5G, fiber connections have been rolling out since 2007, opening up the possibility of gigabit-speed fixed broadband. That said, it’s costly and time-intensive to lay miles and miles of fiber so progress has varied widely across the globe.

Gigabit-Test---Performance_Singapore-1

Geographically small countries like Singapore have the advantage when it comes to fiber, because It’s easier and cheaper to lay fiber optic cable across the country’s small footprint. Singaporean internet service providers (ISPs) have used this advantage to go beyond mere gigabit and offer connections as fast as 10 Gbps. This is reflected both in Singapore’s dominance of the fixed rankings on the Speedtest Global Index and in the fact that 2.87% of their total Speedtest results over fixed broadband are gigabit-speed (800 Mbps or higher).

Gigabit-Test---Performance_Brazil-1

Brazil offers a good contrast for how difficult it can be for gigabit to reach the masses. While the first Brazilian ISP to offer fiber-to-the-premises (FTTP) initially did so in 2007, easy access to gigabit speeds was slow to follow. However, that may be starting to change. Between June and July 2019 we saw a large uptick in gigabit-speed results in Brazil, where the proportion of gigabit speed tests increased from 0.02% of total fixed broadband tests to 0.17%. This corresponded with a large increase in mean download speed at the country level.

Comparing world mobile and fixed broadband at a glance

We were curious to see just how different internet performance experiences were around the world, so we plotted average mobile download speed against average download speed on fixed broadband. All of the graphs below use a percentage difference from the global average, a number that changed between 2018 and 2019.

fade-Performance-vs-Global---Quadrant-All

Speed Leaders

There was not much change in the list of countries that showed above-average download speeds on both mobile and fixed broadband between July 2018 and July 2019, the “Speed Leaders.” What did change was that fixed broadband speeds increased significantly enough among the group to bring the whole pack closer to Singapore and Hong Kong. On the mobile axis, South Korea’s major increase in download speed made that country more of an outlier, pushing the boundaries of what great performance can look like.

Fixed-Focused countries

Between July 2018 and July 2019 we saw the number of countries considered to be “Fixed-Focused” (having faster download speeds over fixed broadband than the world average while their average mobile download speeds were slower than average) increase. Ireland was the only country that solidly fit this category in 2018. Thailand and Chile started near the midline for fixed speeds and below-average for mobile speeds in 2018. 2019 found both countries squarely in the Fixed-Focused category. Israel also edged into this category as their mobile download speed fell between July 2018 and 2019.

Mobile-Focused countries

The “Mobile-Focused” category saw the most movement between July 2018 and July 2019 as some countries (the UAE and Qatar) increased their fixed speeds sufficiently to join the Speed Leaders. Meanwhile, Bosnia and Herzegovina’s mobile download speed increased year-over-year to move them into the Mobile-Focused quadrant. Georgia’s mobile download speed decreased enough to move them from Mobile-Focused to Speed Laggers.

It will be interesting to see how many of these Mobile-Focused countries double down on their mobile investments and explore 5G alternatives to fixed broadband.

Speed Laggers

No country wants to be in the position of having slower than average mobile and fixed broadband speeds. We saw 57 countries in this “Speed Laggers” quadrant in July 2018 and 78 in July 2019. This increase is mostly due to our expansion of the number of countries we consider for the Speedtest Global Index based on test count. There were enough countries in this category that we’ve considered them separately by continent below.

Regional views of mobile and fixed broadband performance

Mobile-and-Fixed-Broadband-Improvement-by-Continent-02

We aggregated Speedtest results by continent to analyze mobile and fixed broadband performance by continent.

Mobile-and-Fixed-Performance-by-Continent-01

Asia had the highest percentage increase in mobile download speed followed by North America, Oceania, South America, Africa and Europe. Oceania had the fastest mean download speed in July 2019. North America placed second, Europe third, Asia fourth, South America fifth and Africa sixth.

On the fixed broadband side, South America saw the highest percentage increase in download speed. Asia came in second, Europe third, Africa fourth, North America fifth and Oceania sixth. North America had the fastest mean download speed in July 2019. Europe was second, Asia third, and Oceania fourth. As we saw with mobile, South America and Africa again ranked fifth and sixth, respectively.

A zoomed-in view of the speed quadrants separated by continent offers a more detailed view of each country’s role in these rankings.

Africa mostly lags in internet speeds

2019-Performance-vs-Global---Africa

In July 2019, all but two African countries in the Speedtest Global Index fell into the Speed Laggers category, having mobile and fixed broadband speeds that were below global averages. The exceptions were South Africa and Guinea, which both had fast enough mobile speeds to place them in the mobile-focused quadrant.

Asian markets show a wide breadth of internet performance

2019-Performance-vs-Global---Asia

Asia was the most diverse continent we examined in terms of internet performance. We saw a plurality of countries in each of the four quadrants in July 2019. Most of the Speed Leaders were in East Asia: China, Hong Kong (SAR), Japan, Macau (SAR), South Korea, and Taiwan. If we include Singapore, another Speed Leader, these are among the wealthiest nations in Asia (using GDP per capita). Two of Asia’s Fixed-Focused countries are in Southeast Asia (Malaysia and Thailand) and one is in the Middle East (Israel).

The Speed Laggers category contained countries from South Asia (including Afghanistan, India and Pakistan), Southeast Asia (Brunei, Cambodia, the Philippines and Vietnam) and the Middle East (Jordan). Mobile-Focused countries in Asia were mostly Middle Eastern, including Kuwait, Lebanon, Oman, Saudi Arabia and Turkey.

European mobile performance is mostly strong, fixed varies

2019-Performance-vs-Global---Europe

With the exception of Ireland, the European countries on the Speedtest Global Index fell into the Speed Leaders, Mobile-Focused, and Speed Laggers categories. All of the Speed Laggers (Belarus, Kazakhstan, Russia and the Ukraine) were from Eastern Europe. Countries from Southeast Europe (including Albania, Bosnia and Herzegovina, Croatia, Greece, Montenegro, Moldova, Serbia and Slovenia) and Central Europe (Austria and the Czech Republic) made up the bulk of the Mobile-Focused category.

Speed Leaders included countries from the Baltics (Estonia, Latvia and Lithuania), the Nordics (Denmark, Norway and Sweden), Central Europe (Poland and Romania), and Western Europe (including Belgium, France, Germany, the Netherlands, and Spain).

North American internet performance is sharply divided

2019-Performance-vs-Global---North-America

Canada and the U.S. are the only two North American countries in the Speed Leaders category. Panama is the only North American country under Fixed-Focused. Mexico and all of the Central American countries fall into the Speed Laggers category. There are no North American countries that are Mobile-Focused.

Each country in Oceania has a very different internet story

2019-Performance-vs-Global---Ocean

Oceania is represented in three of the four quadrants: Speed Leaders (New Zealand), Mobile-Focused (Australia) and Speed Laggers (Papua New Guinea) with Fiji straddling the divide between Speed Laggers and Mobile-Focused.

South America mostly lags in mobile and fixed internet speeds

2019-Performance-vs-Global---South-America

Most of the South American countries represented on the Speedtest Global Index are in the Speed Laggers quadrant (Argentina, Bolivia, Brazil, Colombia, Ecuador, Paraguay, Peru, Suriname and Venezuela). Chile is an exception, being part of the Fixed-Focused group, as is Uruguay which sits in Mobile-Focused.

Global internet speeds are improving on average and 5G and gigabit are compounding those advances where available. However, not all countries are benefitting equally. We’ll be interested to see how 5G continues to push mobile speeds in the next year and also whether 5G Wi-Fi becomes a game changer for fixed broadband. Remember to check the Speedtest Global Index on a monthly basis for updated country rankings. And take a Speedtest to make sure your experience is represented in your country’s averages.

Editor’s Note: This article was edited on September 10, 2019 to correct an error in the labeling on the first image. The colors in a later image were updated for consistency.

Ookla retains ownership of this article including all of the intellectual property rights, data, content graphs and analysis. This article may not be quoted, reproduced, distributed or published for any commercial purpose without prior consent. Members of the press and others using the findings in this article for non-commercial purposes are welcome to publicly share and link to report information with attribution to Ookla.

| August 27, 2019

Where to Find the Fastest Airport Wi-Fi in the U.S. and Canada in 2019

We’re back with our annual survey of the fastest airport Wi-Fi in the U.S. and Canada. This year we’re sharing data on twice as many airports, as well as looking at which non-airport-sponsored SSIDs are your fastest choice. Whether you’re taking one last summer vacation or booking business trips for the fall, this guide should help you find the fastest airport internet connections.

Our analysis is based on Speedtest IntelligenceTM data from 51 of the largest airports in the U.S. and Canada during Q1-Q2 2019.

Fastest airport Wi-Fi

We looked first at mean download and upload speeds over the airport’s Wi-Fi SSID to see which airports are prioritizing fast speeds.

Honolulu’s Daniel K. Inouye International Airport makes its debut on the list this year at the very top of the rankings. With a mean download speed of 145.12 Mbps, Honolulu’s Wi-Fi was 37.5% faster than second-place Chicago Midway (which was also new to the list). These two airports unseated Sea-Tac, last year’s winner for fastest airport Wi-Fi. Ranking third, Sea-Tac’s mean download speed over Wi-Fi actually fell 4.4% since our last analysis. Nashville International and Phoenix Sky Harbor rounded out the top five

airport-update-chart1-1

Calgary placed 17th overall but showed the fastest airport Wi-Fi of the five Canadian airports we examined. Montréal–Pierre Elliott Trudeau International Airport had the slowest Wi-Fi among Canadian airports again this year, but their mean download speed jumped 154.4% since our last analysis.

We were excited to see that while we more than doubled the number of airports on the list this year, the number with Wi-Fi download speeds less than 10 Mbps fell. The airport with the slowest Wi-Fi was Louis Armstrong New Orleans International Airport, followed by Salt Lake City International Airport, Houston’s William P. Hobby Airport, Southwest Florida International Airport in Fort Myers, and Norman Y. Mineta San José International Airport.

Both Denver and San Francisco split their Wi-Fi between two separate SSIDs that appear to cater individually to 5 GHz and 2.4 GHz devices. In both of these cases we’ve chosen to list the faster of the two SSIDs. Fort Lauderdale has four different Wi-Fi SSIDs for four different terminals. We aggregated the speeds from those SSIDs to report a mean.

Comparing speeds on other Wi-Fi SSIDs at major airports

Airport-provided Wi-Fi is not always your fastest option. This year we also looked for alternate Wi-Fi SSIDs to see which is fastest at each airport. Access to some of these SSIDs may require memberships or day passes, so you can use the information below to decide whether or not to make that investment.

Fastest Wi-Fi SSIDs at 51 Largest Airports in U.S. and Canada
Speedtest IntelligenceTM | Q1-Q2 2019
Airport Fastest SSID Mean Download (Mbps) % Faster than Airport SSID
Austin–Bergstrom International Airport Boingo Hotspot 80.99 0.2%
Baltimore–Washington International Airport Boingo Hotspot 81.91 1.7%
Calgary International Airport YYC-Free-WiFi 69.22
Charlotte Douglas International Airport CLT Free WiFi 47.68
Chicago Midway International Airport _Free_MDW_Wi-Fi 105.51
Chicago O’Hare International Airport united_club 124.96 93.9%
Cleveland Hopkins International Airport CLE-GUEST 52.88
Dallas Love Field DAL Free WiFi 43.56
Dallas/Fort Worth International Airport TheCenturionLounge 70.29 28.8%
Daniel K. Inouye International Airport HNL Free WiFi 145.12
Denver International Airport – DEN Airport Free WiFi 88.47
Detroit Metropolitan Airport Boingo Hotspot 62.28 0.2%
Edmonton International Airport EIA_FREE_WIFI 51.44
Fort Lauderdale–Hollywood International Airport MedallionNet 41.98 237.5%
George Bush Intercontinental Airport united_club 156.73 1117.8%
Hartsfield–Jackson Atlanta International Airport DeltaSkyClub 111.89 69.8%
Indianapolis International Airport IND PUBLIC WiFi 71.14
John F. Kennedy International Airport TWA 161.66 221.5%
John Wayne Airport JWAFREEWIFI 79.91
Kansas City International Airport KCI_FREE_WiFi 38.28
LaGuardia Airport _Free LGA Wi-Fi 79.40
Logan International Airport Passpoint Secure 58.64 26.8%
Los Angeles International Airport united_club 156.91 122.3%
Louis Armstrong New Orleans International Airport #MSY-Free_Wifi 4.42 337.6%
McCarran International Airport McCarran WiFi 44.56
Miami International Airport Avianca_VIP 55.58 55.4%
Minneapolis–Saint Paul International Airport Boingo Hotspot 82.11 34.8%
Montréal–Pierre Elliott Trudeau International Airport VIP 44.37 172.0%
Nashville International Airport Boingo Hotspot 100.42 3.6%
Newark Liberty International Airport united_club 120.31 133.0%
Norman Y. Mineta San José International Airport XFINITY 26.81 208.2%
Oakland International Airport OAK Free WiFi 90.95
Orlando International Airport skyclub 63.06 47.1%
Philadelphia International Airport American Airlines lounge Wi-Fi 79.37 73.3%
Phoenix Sky Harbor International Airport Free PHX Boingo WiFi 93.47
Portland International Airport flypdx 38.47
Raleigh–Durham International Airport RDU Free WiFi 24.80
Ronald Reagan Washington National Airport FlyReagan 81.72
Sacramento International Airport flysacramento 37.26
Salt Lake City International Airport DeltaSkyClub 18.70 699.1%
San Antonio International Airport SAFreeWiFi 47.83
San Diego International Airport #SANfreewifi 85.30
San Francisco International Airport united_club 151.10 175.3%
Seattle–Tacoma International Airport Alaska Lounge 102.26 3.6%
Southwest Florida International Airport RSWiFly 7.51
St. Louis Lambert International Airport *STL_FREE_WIFI 60.20
Tampa International Airport TPA 19.50
Toronto Pearson International Airport Plaza Premium Lounge 38.52 25.3%
Vancouver International Airport @yvrairport 58.97
Washington Dulles International Airport united_club 185.86 150.2%
William P. Hobby Airport Free Airport WIFI 7.30

The airport’s own SSID was the fastest option for Wi-Fi at 26 airports.

At the other 25 airports, airport lounges (both those affiliated with airlines and other private entities) often topped the pack. We saw that “united_club” was the fastest SSID at six airports and “DeltaSkyClub” at two. “Alaska Lounge,” “American Airlines lounge Wi-Fi,” “Avianca_VIP,” “MedallionNet” and “Plaza Premium Lounge” were each the fastest SSID at one airport.

“Boingo Hotspot” was the fastest SSID at five airports and “Passpoint Secure” (a Boingo service) at one. It’s interesting that at airports where we saw both the “Boingo Hotspot” and “Passpoint Secure” SSIDs, mean download speeds on the “Boingo Hotspot” SSID were routinely faster.

How airline lounges fare for Wi-Fi

We won’t pretend to compare most of the amenities available at various airline lounges, but we do have data on which have the fastest Wi-Fi. We compared mean download speeds over Wi-Fi SSIDs affiliated with airlines and airport lounges to see which memberships you might want to consider.

The United Club has fast Wi-Fi at Dulles, LAX, George Bush Intercontinental, San Francisco, O-Hare and Newark, with mean download speeds well above 100 Mbps. At LAX, the mean download speed of 156.91 Mbps on “united_club” is 263.2% faster than “American Airlines lounge Wi-Fi.” Similarly, “united_club” is 158.9% faster than “American Airlines lounge Wi-Fi” at Chicago O’Hare. United’s more general SSID, “United_Wi-Fi” is slow — 97.3% slower than “united_club” in Houston, and 93.3% slower in Newark.

American Airlines had the fastest lounge Wi-Fi at JFK with a mean download speed of 103.61 Mbps. At Philadelphia International the lounge saw a mean download speed of 79.37 Mbps. It was slower at Miami International Airport, LAX and Chicago O’Hare, however, with mean download speeds in the mid-to-upper 40s. At Phoenix Sky Harbor and Dallas-Fort Worth, though, download speed at the American Airlines Lounge was closer to the mid 20s.

Delta operates three separate SSIDs in Atlanta with “DeltaSkyClub” having the fastest downloads at 111.89 Mbps, “Delta_Guest” at 86.42 Mbps and “DeltaWiFi” at 28.65. In Detroit “DeltaSkyClub” delivered a download speed of 42.12 Mbps and 35.64 Mbps in Minneapolis. Downloads were even slower on this SSID at LaGuardia, Salt Lake City, Sea-Tac, JFK and LAX, with mean speeds that ranged from 15.91 Mbps to 23.20 Mbps.

The Alaska Lounge was the fastest at Sea-Tac with a mean download speed of 102.26 Mbps. The Avianca VIP Lounge was the fastest at Miami International with 55.58 Mbps.

TWA had the fastest Wi-Fi at JFK by far, outpacing other airline-affiliated SSIDs by at least 60 Mbps. Also at JFK, JetBlue’s “Fly-Fi” was slow at 9.83 Mbps but 61.1% faster than “JetBlue Hotspot.”

Wherever your travels may take you, remember the number one rule of Wi-Fi: if the connection is not secured, your data isn’t either. Once you’re safely at your gate (or chilling in the lounge), take a Speedtest so we can bring you an updated version of this list next year

Ookla retains ownership of this article including all of the intellectual property rights, data, content graphs and analysis. This article may not be quoted, reproduced, distributed or published for any commercial purpose without prior consent. Members of the press and others using the findings in this article for non-commercial purposes are welcome to publicly share and link to report information with attribution to Ookla.