| March 10, 2021

India’s Internet Speeds Improve, But 5G Can’t Come Fast Enough


India has seen strong internet speed increases during a year when internet access has been crucial. 4G expansions are leading to mobile speed improvements, while fiber rollouts are driving jumps in fixed broadband speeds. Today we’re looking closely at how India’s improvements compare to other countries in the South Asian Association for Regional Cooperation (SAARC). We have also paired the internet speed performance of India’s top internet providers with data on consumer sentiment to shed light on how consumers view their operators.

India’s fixed broadband is fast for SAARC countries (and getting faster)

Mean-Fixed-Broadband-Speeds_SAARC_0321

India started 2020 with the fastest mean download speed over fixed broadband among SAARC countries, and strong improvements in India from Q2 2020 onward only widened the gap. India’s government has been instrumental in these improvements with both Digital India and the Smart Cities Mission.

A jump in fixed broadband download speed in Bangladesh brought the country to second by the end of the year, while a decline in speeds put Sri Lanka in third place. Afghanistan had the lowest mean download speed over fixed broadband among SAARC countries during 2020.

Despite increases, Indian mobile speeds lag among SAARC countries

Mean-Mobile-Speeds_SAARC_0321

The Maldives, the only SAARC country with active 5G during 2020, was the fastest for mean download speed over mobile throughout 2020. Pakistan, Nepal, Sri Lanka and Bhutan were very closely grouped for second, third, fourth and fifth fastest during Q4 2020. Afghanistan had the slowest mean download speed over mobile among SAARC countries throughout 2020. Bangladesh was second slowest and India third. According to the Ookla 5G Map™, India, Pakistan and Sri Lanka each have at least one location where 5G is available, but only in pre-release.

Jio had the fastest fixed broadband, highest ratings by customers

Speedtest® Consumer Sentiment data is gathered from single-question surveys presented to users at the end of a Speedtest. This data set provides rich insights into customer satisfaction over time, as well as competitive benchmarking, by providing data on both customers’ overall satisfaction with their network providers (based on a five-star scale) and Net Promoter Score (NPS). Operators and government regulators across the globe use this data to monitor improvements over time. By comparing Q4 2020 ratings data from India’s top providers with their speeds during the same period, we can explore the relationship between customer satisfaction and network performance.

Mean-Fixed-Speeds_India_0321

Jio had the fastest mean download speed over fixed broadband among India’s top providers during Q4 2020. Jio also had the highest rating at 3.7 stars and the only positive NPS. ACT was second for download speed over fixed broadband, Airtel third and Excitel fourth. ACT and Excitel had the same star rating, while ACT had a higher NPS. Airtel had the third highest NPS.

BSNL had the slowest mean download speed over fixed broadband during the same period, although Hathway had the lowest rating and the lowest NPS. Note that the confidence intervals are narrow enough that they are obscured in the above chart and the one below.

Jio along with BSNL and Airtel offers fixed-line broadband service at Pan-India level. ACT, Excitel and Hathway are fixed broadband ISPs which offer services in a few key Indian cities and metros.

Vi India is fastest for mobile

Mean-Mobile-Speeds_India_0321

Vi India had the fastest mean mobile download speed during Q4 2020 as it increased its download speed performance lead over Airtel from Q3. This confirms that Vi India is continuing to provide its users with a better network speed experience than its rivals. In Consumer Sentiment ratings, Vi tied with Airtel.

Airtel had the second-fastest mean download speed. Jio came in third place for performance, ratings and NPS. Vi led Airtel and Jio on NPS, but none of the providers’ scores were positive, indicating that customers were not likely to recommend any of the providers.

How Indian operators are approaching 5G

While 5G still isn’t commercialized in India, Airtel’s commercial 5G network is ready to roll out services once spectrum is allocated in late 2021 or early 2022. On January 28, 2021, Airtel successfully conducted a 5G trial in the Hyderabad region using Dynamic Spectrum Sharing (DSS) on a 1800 MHz spectrum band. This demonstration was made possible by the Swedish infrastructure giant Ericsson (which provided the software to its radio infrastructure) and the device manufacturer Oppo (which provided its 5G-capable device powered by Qualcomm’s Snapdragon 865 5G Mobile Platform). Over the past year, Airtel has deployed LTE services using “5G-ready” Altiostar’s virtual open RAN software stack. This indicates that the operator’s 5G strategy may at least partially include O-RAN.

In a recent interview, Vi India’s CEO declared the company is also ready for a 5G rollout, but Vi India will wait for the 5G spectrum auction in the 3.3 GHz – 3.6 GHz band.

Jio, the telecom branch of Reliance Industries Limited (RIL), has been getting ready to roll out its homegrown O-RAN 5G network. Building an in-house cloud-native 5G core and radio access network from the ground up — while leveraging containerized network functions — will lay the groundwork for the operator to deliver improved security and spectral efficiency. This network approach can also enable new use cases like ultra-reliable low-latency communications (URLLC), network slicing and improved reliability, to name a few. Similar to Rakuten Mobile’s approach, Jio aims to leverage automation and artificial intelligence for network monitoring and optimization, as well as capacity planning. A zero-touch deployment approach promises to deliver rapid cell site provisioning, which opens the door for massive infrastructure scaling.

However, without a sufficient amount of wireless spectrum, LTE and 5G technologies won’t be able to deliver the ultra-fast speeds and low latency promised by the emerging technology. This is why the Indian Department of Communications (DoT) held a spectrum auction on March 1, 2021 to license the spectrum blocks in the 700 MHz and 800 MHz bands. Airtel opted for spectrum in the sub-GHz, mid band and 2300 MHz bands. Vi India did not disclose which spectrum it had purchased and Jio reportedly purchased spectrum in the 800 MHz, 1800 MHz and 2300 MHz bands to renew permits expiring in July. The 700 MHz band did not get any offers.

Mobile and fixed broadband are rapidly improving in India, and we’ll be watching this market for continued performance improvements in the near future. Soon, we’ll also be using data from Speedtest video testing to assess how networks are performing when streaming video. Try video testing on Speedtest for iOS now to see how well your operator supports streaming video.

Ookla retains ownership of this article including all of the intellectual property rights, data, content graphs and analysis. This article may not be quoted, reproduced, distributed or published for any commercial purpose without prior consent. Members of the press and others using the findings in this article for non-commercial purposes are welcome to publicly share and link to report information with attribution to Ookla.

| February 11, 2021

Emerging 5G Market Keeps Canada in the Global Top 10 for Mobile Speeds


5G may still feel like an emerging technology in Canada as it’s less than a year old and is only available in limited cities. However, operators are actively working to expand coverage, and the country’s 5G speeds are already impressive. This article explores how much of an improvement 5G represents over 4G, which provinces and cities are seeing the most benefit and how individual operators are performing over 5G.

5G is 205% faster than 4G in Canada

Comparing Median 5G and 4G Performance in Canada
Speedtest Intelligence® | Q4 2020
5G Download (Mbps) 4G Download (Mbps) % Change
Canada 169.46 55.50 205.3%

Mobile speeds in Canada are strong, with the country consistently ranking in the top ten globally for mobile download speed over the past year according to the Speedtest Global Index™. 5G can only improve overall mobile speeds in Canada, and data from Speedtest Intelligence® reveals Canada’s median download speed over 5G was 205.3% faster than that over 4G during Q4 2020.

Bell was the fastest operator for 5G in Canada

5G-performance_canada_operator_0221_en

As reported in our Canada Market Analysis, Bell was the fastest operator for 5G in Canada in Q4 2020 with a median download speed of 228.99 Mbps. TELUS was a close second and Rogers third.

Rogers had the highest time spent on 5G in Canada

5G-time-spent_canada_operator_0221

We calculated the proportion of time that users with 5G-capable devices spent on 5G in Canada and found that Rogers had the highest 5G Time Spent during Q4 2020 at 27.0%. TELUS had the second highest 5G Time Spent in Canada at 21.0% and Bell was third at 12.7%. Time Spent includes time spent on both 5G and 5G roaming.

Over the past several months Canadian operators have continued to expand their 5G footprints, bringing 5G network capabilities to users across many new cities and towns. All major operators have now launched non-standalone 5G deployments leveraging FDD FR1 spectrum assets across low, mid and high bands.

Equipped with 2.5 GHz spectrum to spare, Rogers launched a 5G network in various cities a year ago, now reaching over 160 communities across Canada. With the addition of newly acquired 600 MHz licenses, the operator is looking to deliver even broader coverage and capacity. Recently, Rogers announced the rollout of their standalone 5G core network, which will eventually allow the operator to deliver even more benefits of this technology to users, including ultra low latency and network slicing.

TELUS and Bell utilized AWS-3 spectrum allocation for their initial 5G launch back in June. The operators have been working in close partnership with Ericsson and Nokia to improve network efficiency and user experience.

Canada’s upcoming spectrum auction will unlock a significant amount of bandwidth in the 3.5 GHz range, which should deliver on the promise of greater speeds. It’s worth noting that the current generation of flagship devices powered by Qualcomm Snapdragon X60 5G Modem-RF System are capable of FDD+TDD 5G aggregation, which streamlines the process of adding the soon to be available 3.5 GHz channels on top of the existent FDD 5G coverage layer. This should provide a stepping stone to standalone 5G, and much greater capacity across the 5G footprint.

British Columbia has the most cities with 5G deployments

Ookla_Canada_5G_Deployment_Map_0221-1

According to the Ookla 5G MapTM, which shows the location of 5G deployments across the globe, British Columbia showed the largest number of cities with commercially available 5G deployments in Canada, as of February 2, 2021. Ontario was second and Alberta third (we included Lloydminster in Alberta’s count).

Québec and Alberta had the fastest 5G download speed

5G-performance_canada_province_0221_en

Data from Speedtest Intelligence reveals Québec and Alberta had the fastest median download speeds over 5G during Q4 2020 among Canadian provinces with sufficient 5G samples. The confidence intervals in the chart show that most provinces have comparable 5G performance.

Alberta showed the highest time spent on 5G

5G-time-spent_canada_province_0221

Alberta had the highest percentage of 5G Time Spent among Canadian provinces with sufficient samples during Q4 2020. Users with 5G-capable devices in British Columbia spent the second highest proportion of time on 5G in Canada at 19.0%, and Ontario showed the third highest 5G Time Spent. Québec had the lowest 5G Time Spent on this list during Q4 2020.

Montréal had the fastest 5G download speed

5G-performance_canada_municipalities_0221

Analysis of median 5G download speed in Canada’s largest municipalities found that Montréal was the fastest during Q4 2020. Calgary, Edmonton and Ottawa formed the group of next fastest cities, followed by Greater Toronto and Greater Vancouver. The confidence intervals in the above chart indicates that the performance among these two groups of cities was too close to definitively rank them.

We’ll be very excited to see how Canada expands on this performance, given the country’s already impressive speeds and expanding 5G footprint. Inquire about Speedtest Intelligence for detailed information about city-level performance by provider or take a Speedtest to see how your network compares.

Ookla retains ownership of this article including all of the intellectual property rights, data, content graphs and analysis. This article may not be quoted, reproduced, distributed or published for any commercial purpose without prior consent. Members of the press and others using the findings in this article for non-commercial purposes are welcome to publicly share and link to report information with attribution to Ookla.

| January 12, 2021

2020 Recap: How the Internet Held Up During a Global Pandemic


There was major concern last year that the internet might fail under the pressure of increased use as COVID-19 drove unparalleled waves of remote work and schooling. We watched internet performance carefully using data from Speedtest Intelligence® as conditions changed in different areas of the world. Now we’re back to assess what happened during the year as a whole.

A note on the methodology: 5G launches drove up mean internet speeds on mobile in many countries. For this reason we’ve simplified our view to include only median speeds, which are less subject to being skewed by especially fast 5G tests.

Mobile speeds dipped in many G20 countries in the spring of 2020

Mobile-Broadband-Speeds-in-G20-Countries_0121

Median download speeds over mobile in many G20 countries dropped at some point during 2020. Countries that saw month-to-month declines during the spring include: Australia, Canada, France, India, Italy, Saudi Arabia, South Korea, Spain and Turkey. China saw a decline in mobile speed in February while Japan suffered a drop in June and July. Argentina, Brazil, Indonesia, Russia and the United Kingdom showed only very minor decreases, while speeds in Germany, Mexico, South Africa and the United States remained unchanged or increased.

Despite the drops, almost all G20 countries saw higher median download speeds over mobile in December 2020 than they had in January 2020. Median download speed over mobile increased 76.3% in China during that time. Germany saw a 62.8% increase, the United States 56.9%, South Korea 55.5% and Saudi Arabia 48%. Turkey saw a 0.7% decrease in median download speed over mobile during the same period.

Despite interim dips, fixed broadband improved in all G20 countries during 2020

Fixed-Broadband-Speeds-in-G20-Countries_0121

There were notable dips in median download speeds over fixed broadband in many countries during the spring of 2020. G20 countries that saw these declines on a monthly basis include: Argentina, Canada, France, India, Indonesia, Italy, Japan, South Korea, Spain, Turkey and the United States. Brazil, China, Germany and Russia notably showed only increases in month-to-month median download speed over fixed broadband during this time. Other countries showed only very minor decreases.

Perhaps most important, all G20 countries saw higher median download speeds over fixed broadband in December 2020 than they had in January 2020. Median download speed over fixed broadband increased 51.9% in Brazil during that time. France saw a 48.3% increase, Japan 46.5%, Saudi Arabia 43.7% and South Africa 40%. South Korea saw the smallest increase in median download speed over fixed broadband over the same period at 8.1%.

We are impressed, on the whole, with how well the internet held up to the massive scale of increased use during the past year. Of course, month-by-month, country-level views are averages that might not reveal problems with specific mobile operators or internet service providers on individual days. If you want to assess how your internet connection is performing right now, take a Speedtest®. And if you are unable to connect to a specific service on the internet, check Downdetector® to see the status of that service.

Ookla retains ownership of this article including all of the intellectual property rights, data, content graphs and analysis. This article may not be quoted, reproduced, distributed or published for any commercial purpose without prior consent. Members of the press and others using the findings in this article for non-commercial purposes are welcome to publicly share and link to report information with attribution to Ookla.

| January 4, 2021

Slack Starts the New Year Late


2021 started with a sigh today as workers across the globe rushed back to their desks only to find that Slack was down. Users flocked to Downdetector® to report problems with Slack across the globe just after 7:00 a.m. Pacific. Issues were reported in Asia (Japan), Australia, Europe (Finland, France, Germany, Italy, the Netherlands, Poland, Russia, Spain, Sweden and the United Kingdom), North America (United States and Canada) and South America (Brazil). The most frequently reported issue was the inability to connect at all and the majority of reports came from the U.S.

Downdetector_Slack_Outage_1020

Although the spike has passed and the outage seems to be resolving itself, the service is not fully operational yet. Now might be a good time to take a breath and catch up on all that post-holiday email. The little red notification will be back on your desktop soon enough.

Downdetector data can help your team resolve service issues faster and improve customer experience when an outage occurs, which becomes all the more important during periods of high usage. Contact us here to learn how your network operations center can get faster outage detection.

Ookla retains ownership of this article including all of the intellectual property rights, data, content graphs and analysis. This article may not be quoted, reproduced, distributed or published for any commercial purpose without prior consent. Members of the press and others using the findings in this article for non-commercial purposes are welcome to publicly share and link to report information with attribution to Ookla.

| December 14, 2020

Exploring the Relationship Between Network Performance and NPS in Germany, Austria and Switzerland

Deutsche

While cultural ties bind the three countries in the DACH region (Germany, Austria and Switzerland), internet performance varies widely between them. Using data from Speedtest Intelligence®, we compared performance for mobile network operators (MNOs) and fixed broadband internet service providers (ISPs) across countries and at the provider level during Q3 2020. We also compared provider performance to Speedtest Consumer SentimentTM data on five-star ratings and Net Promoter Score (NPS) to understand how network performance impacts customer satisfaction.

Switzerland boasts the highest mobile and fixed broadband download speeds

Speeds-Chart_Austria_Germany_Switzerland_1220_en-2

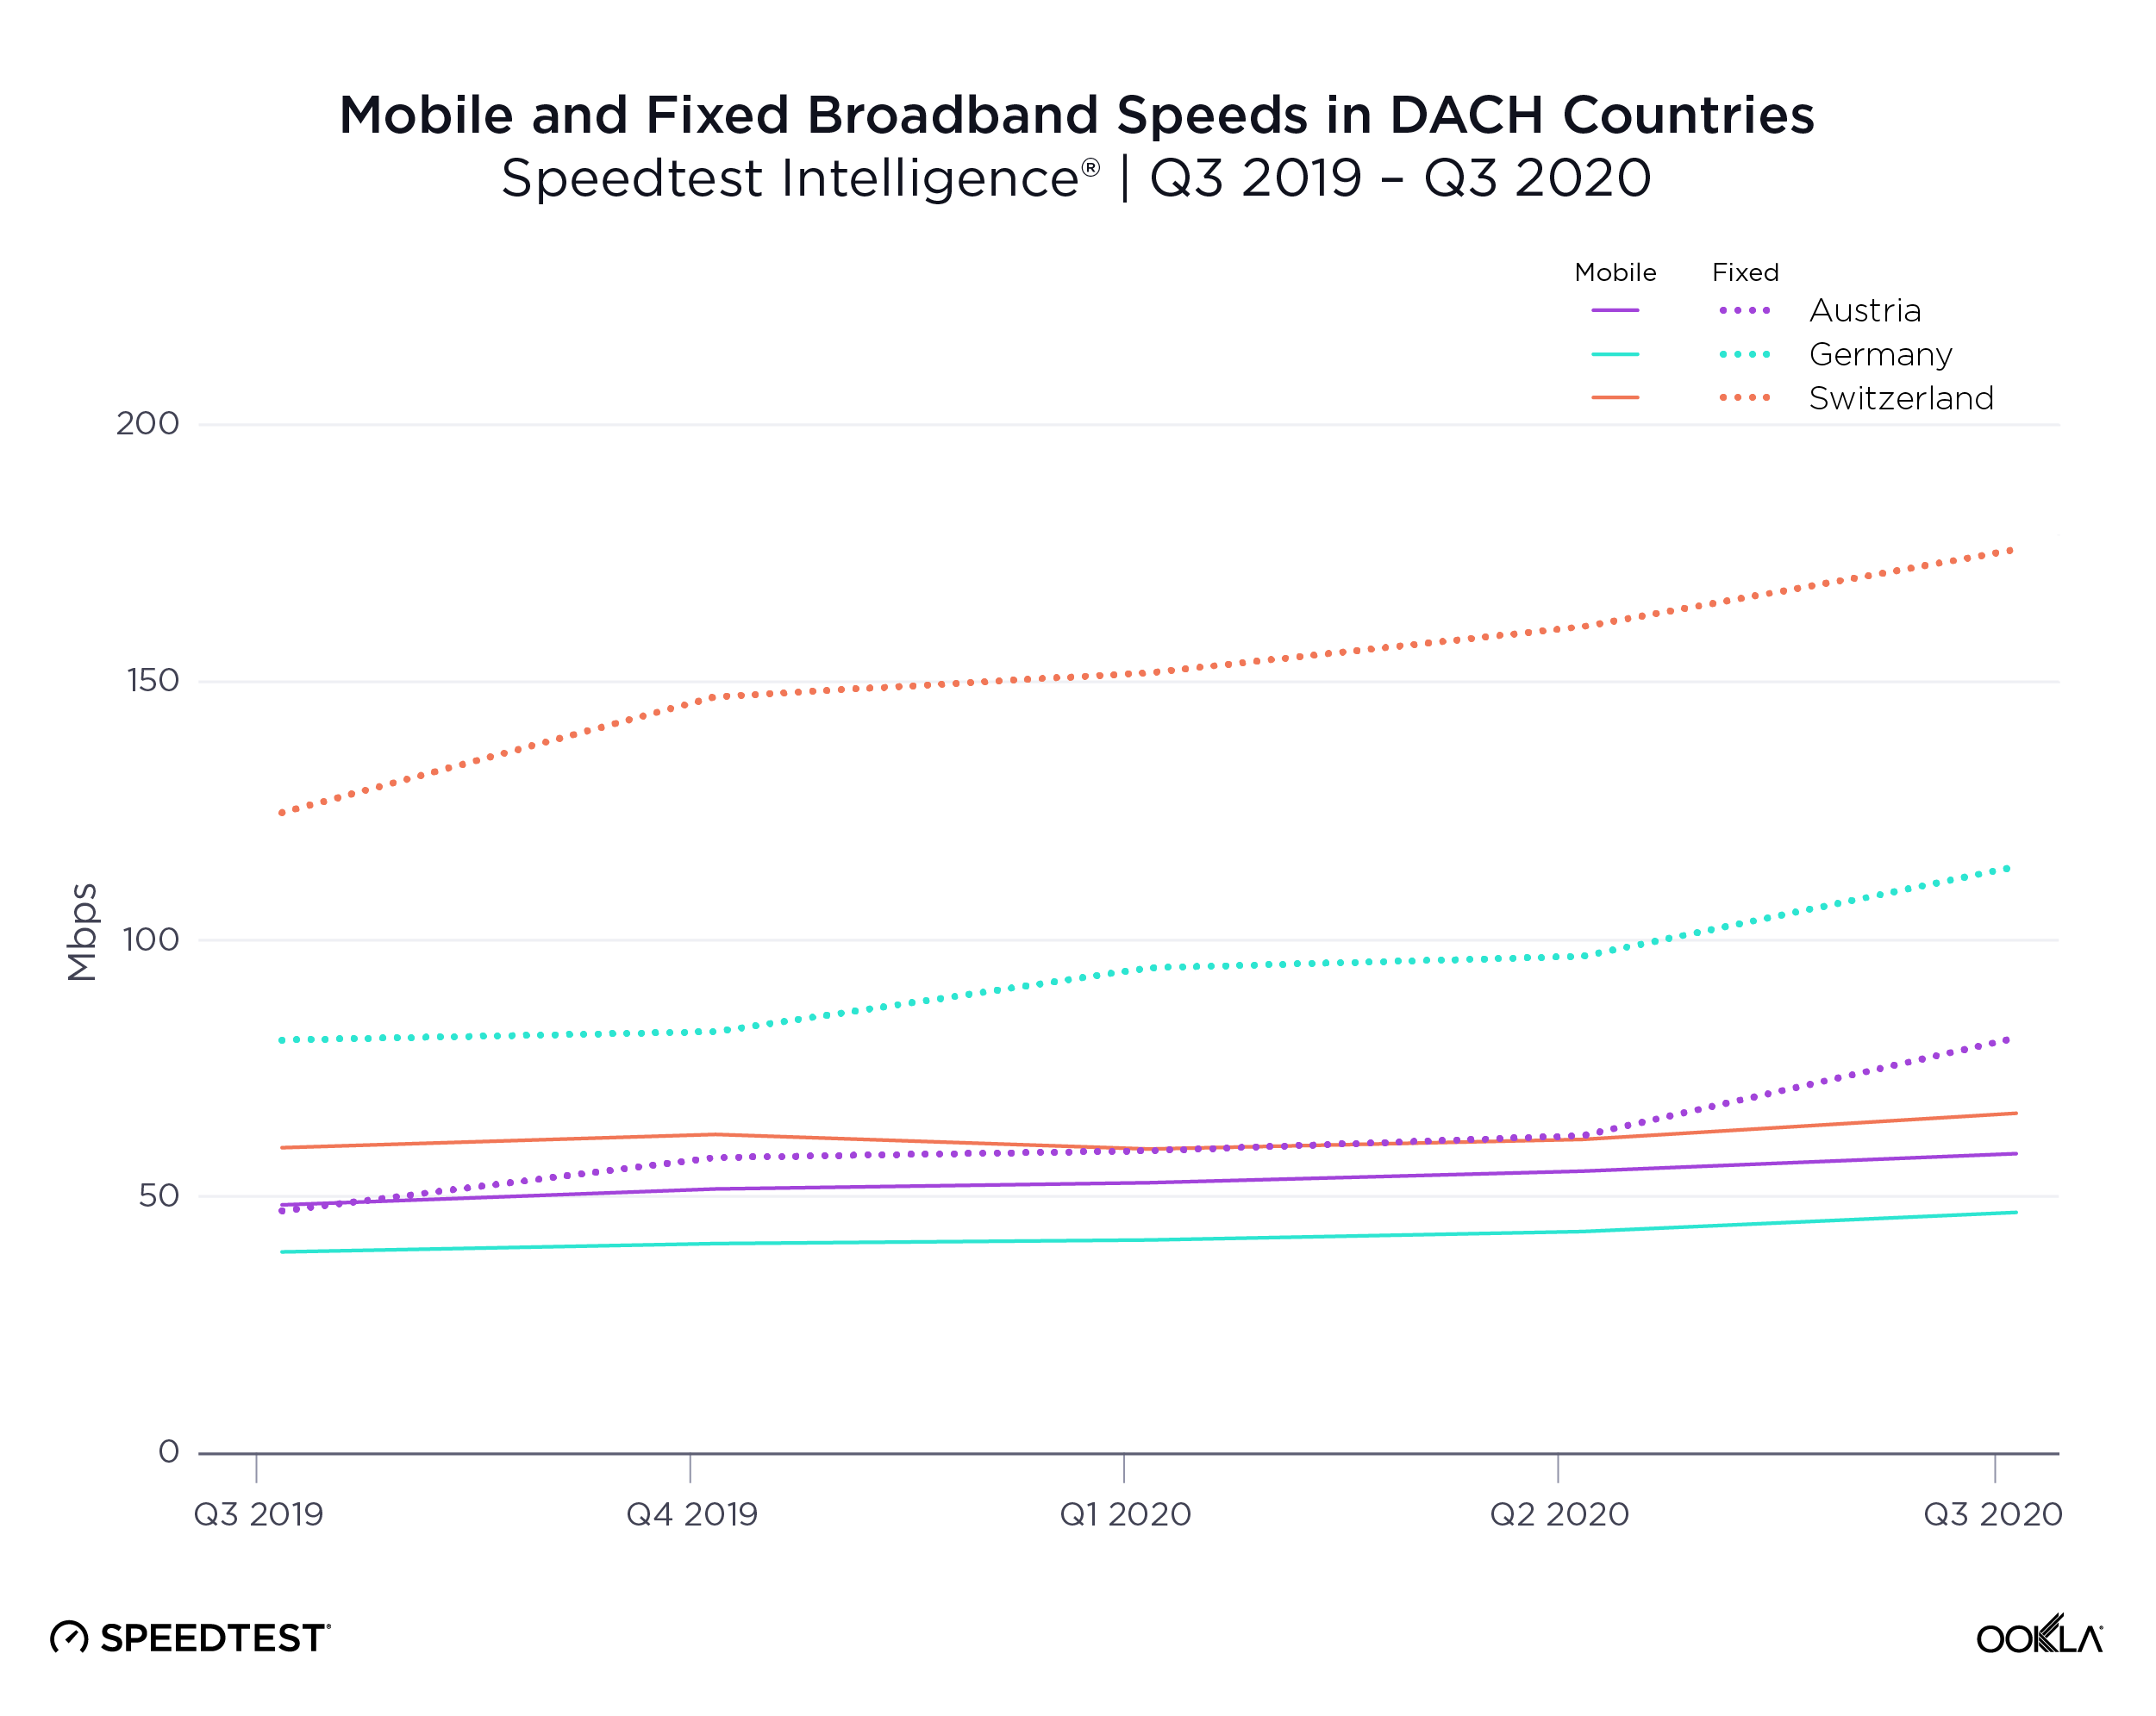
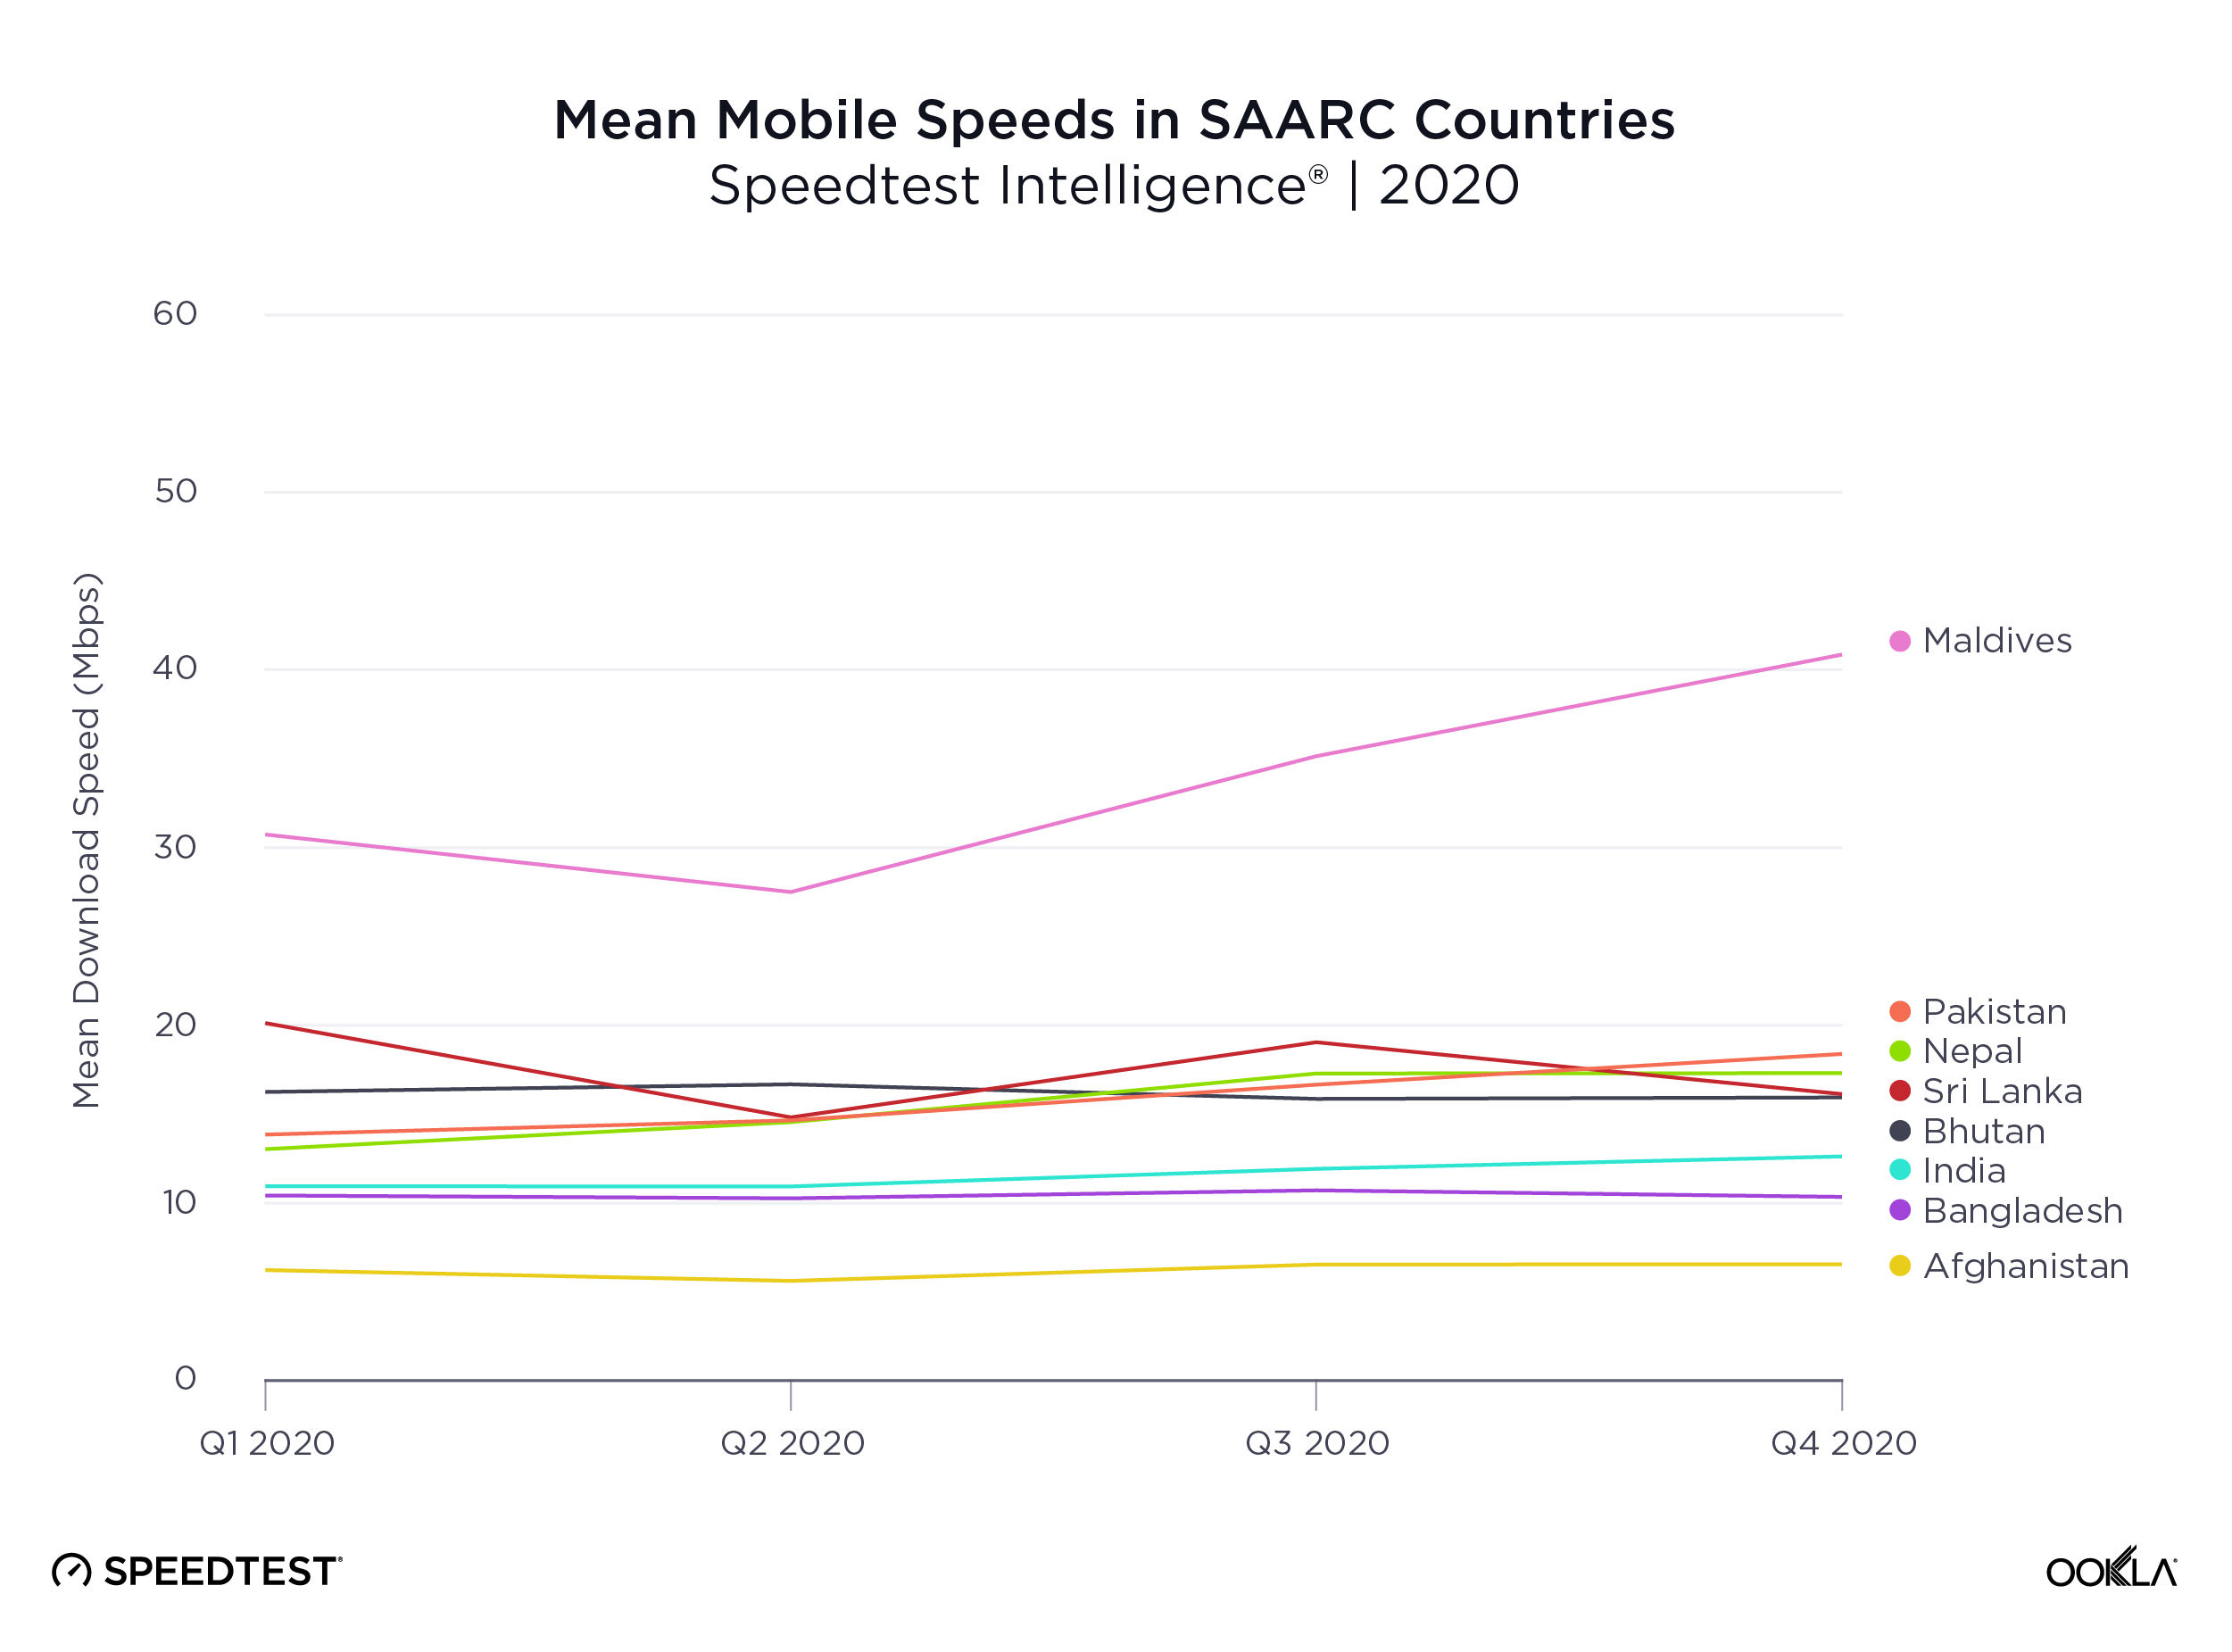
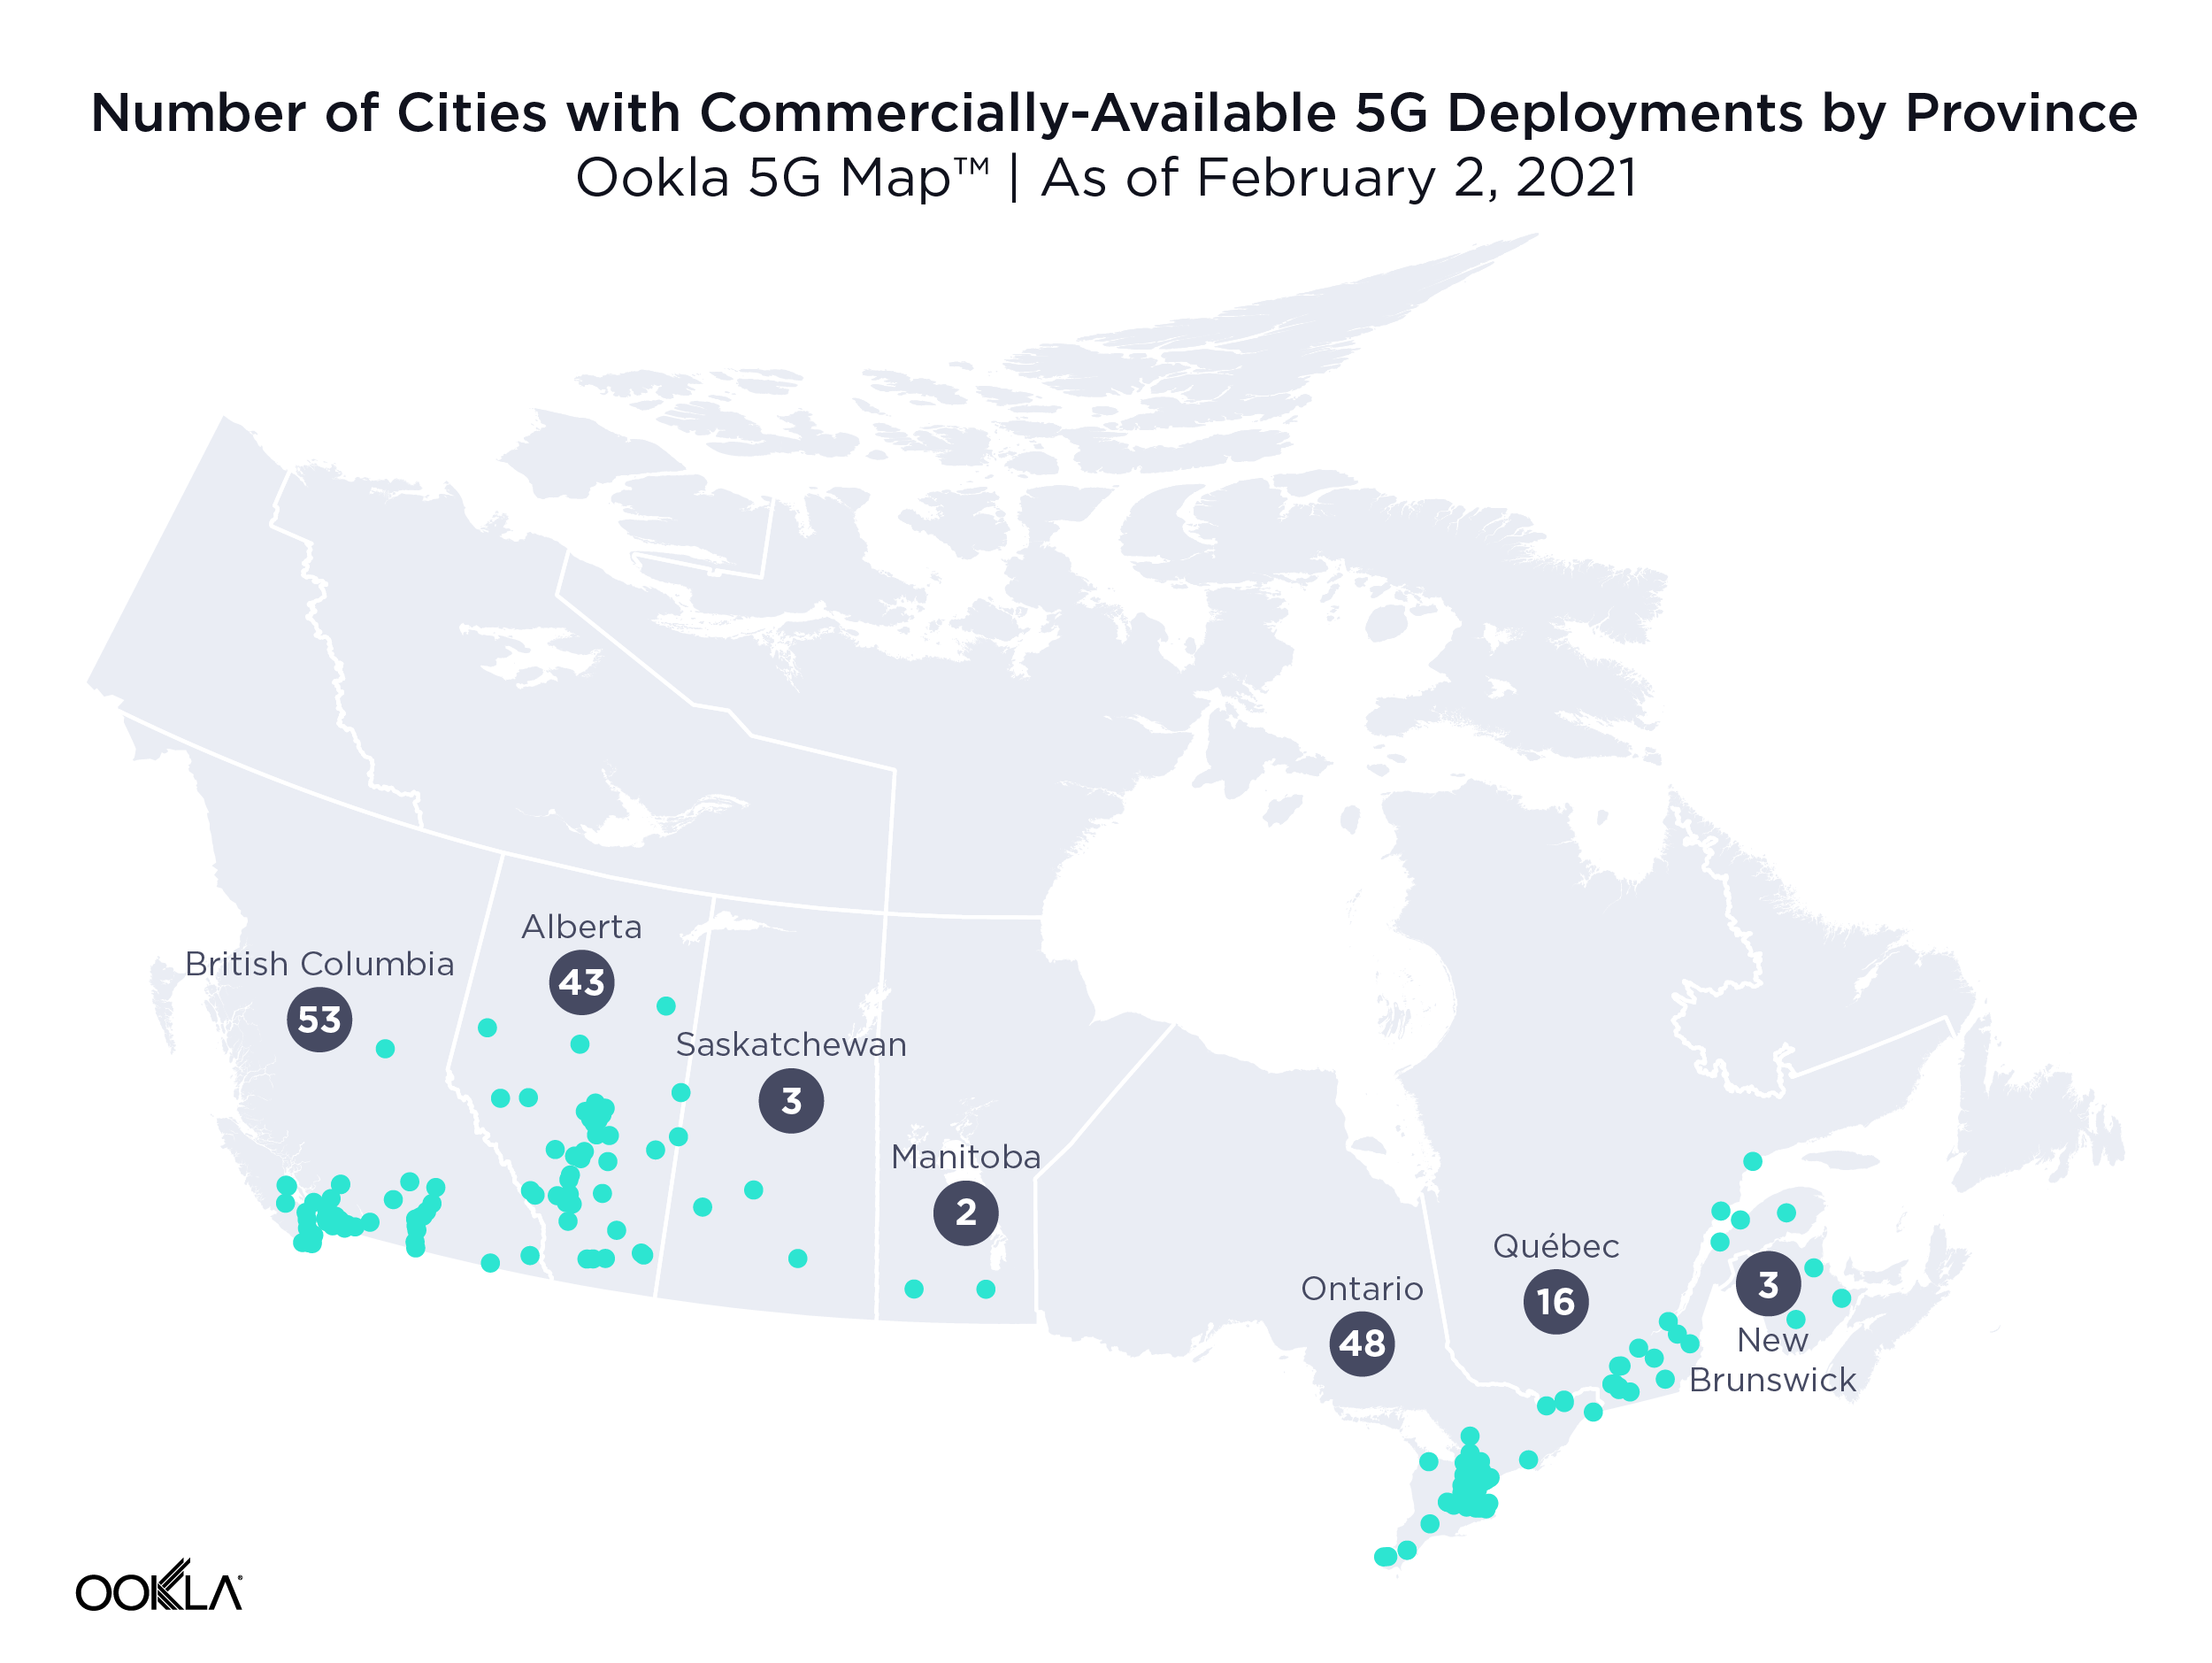
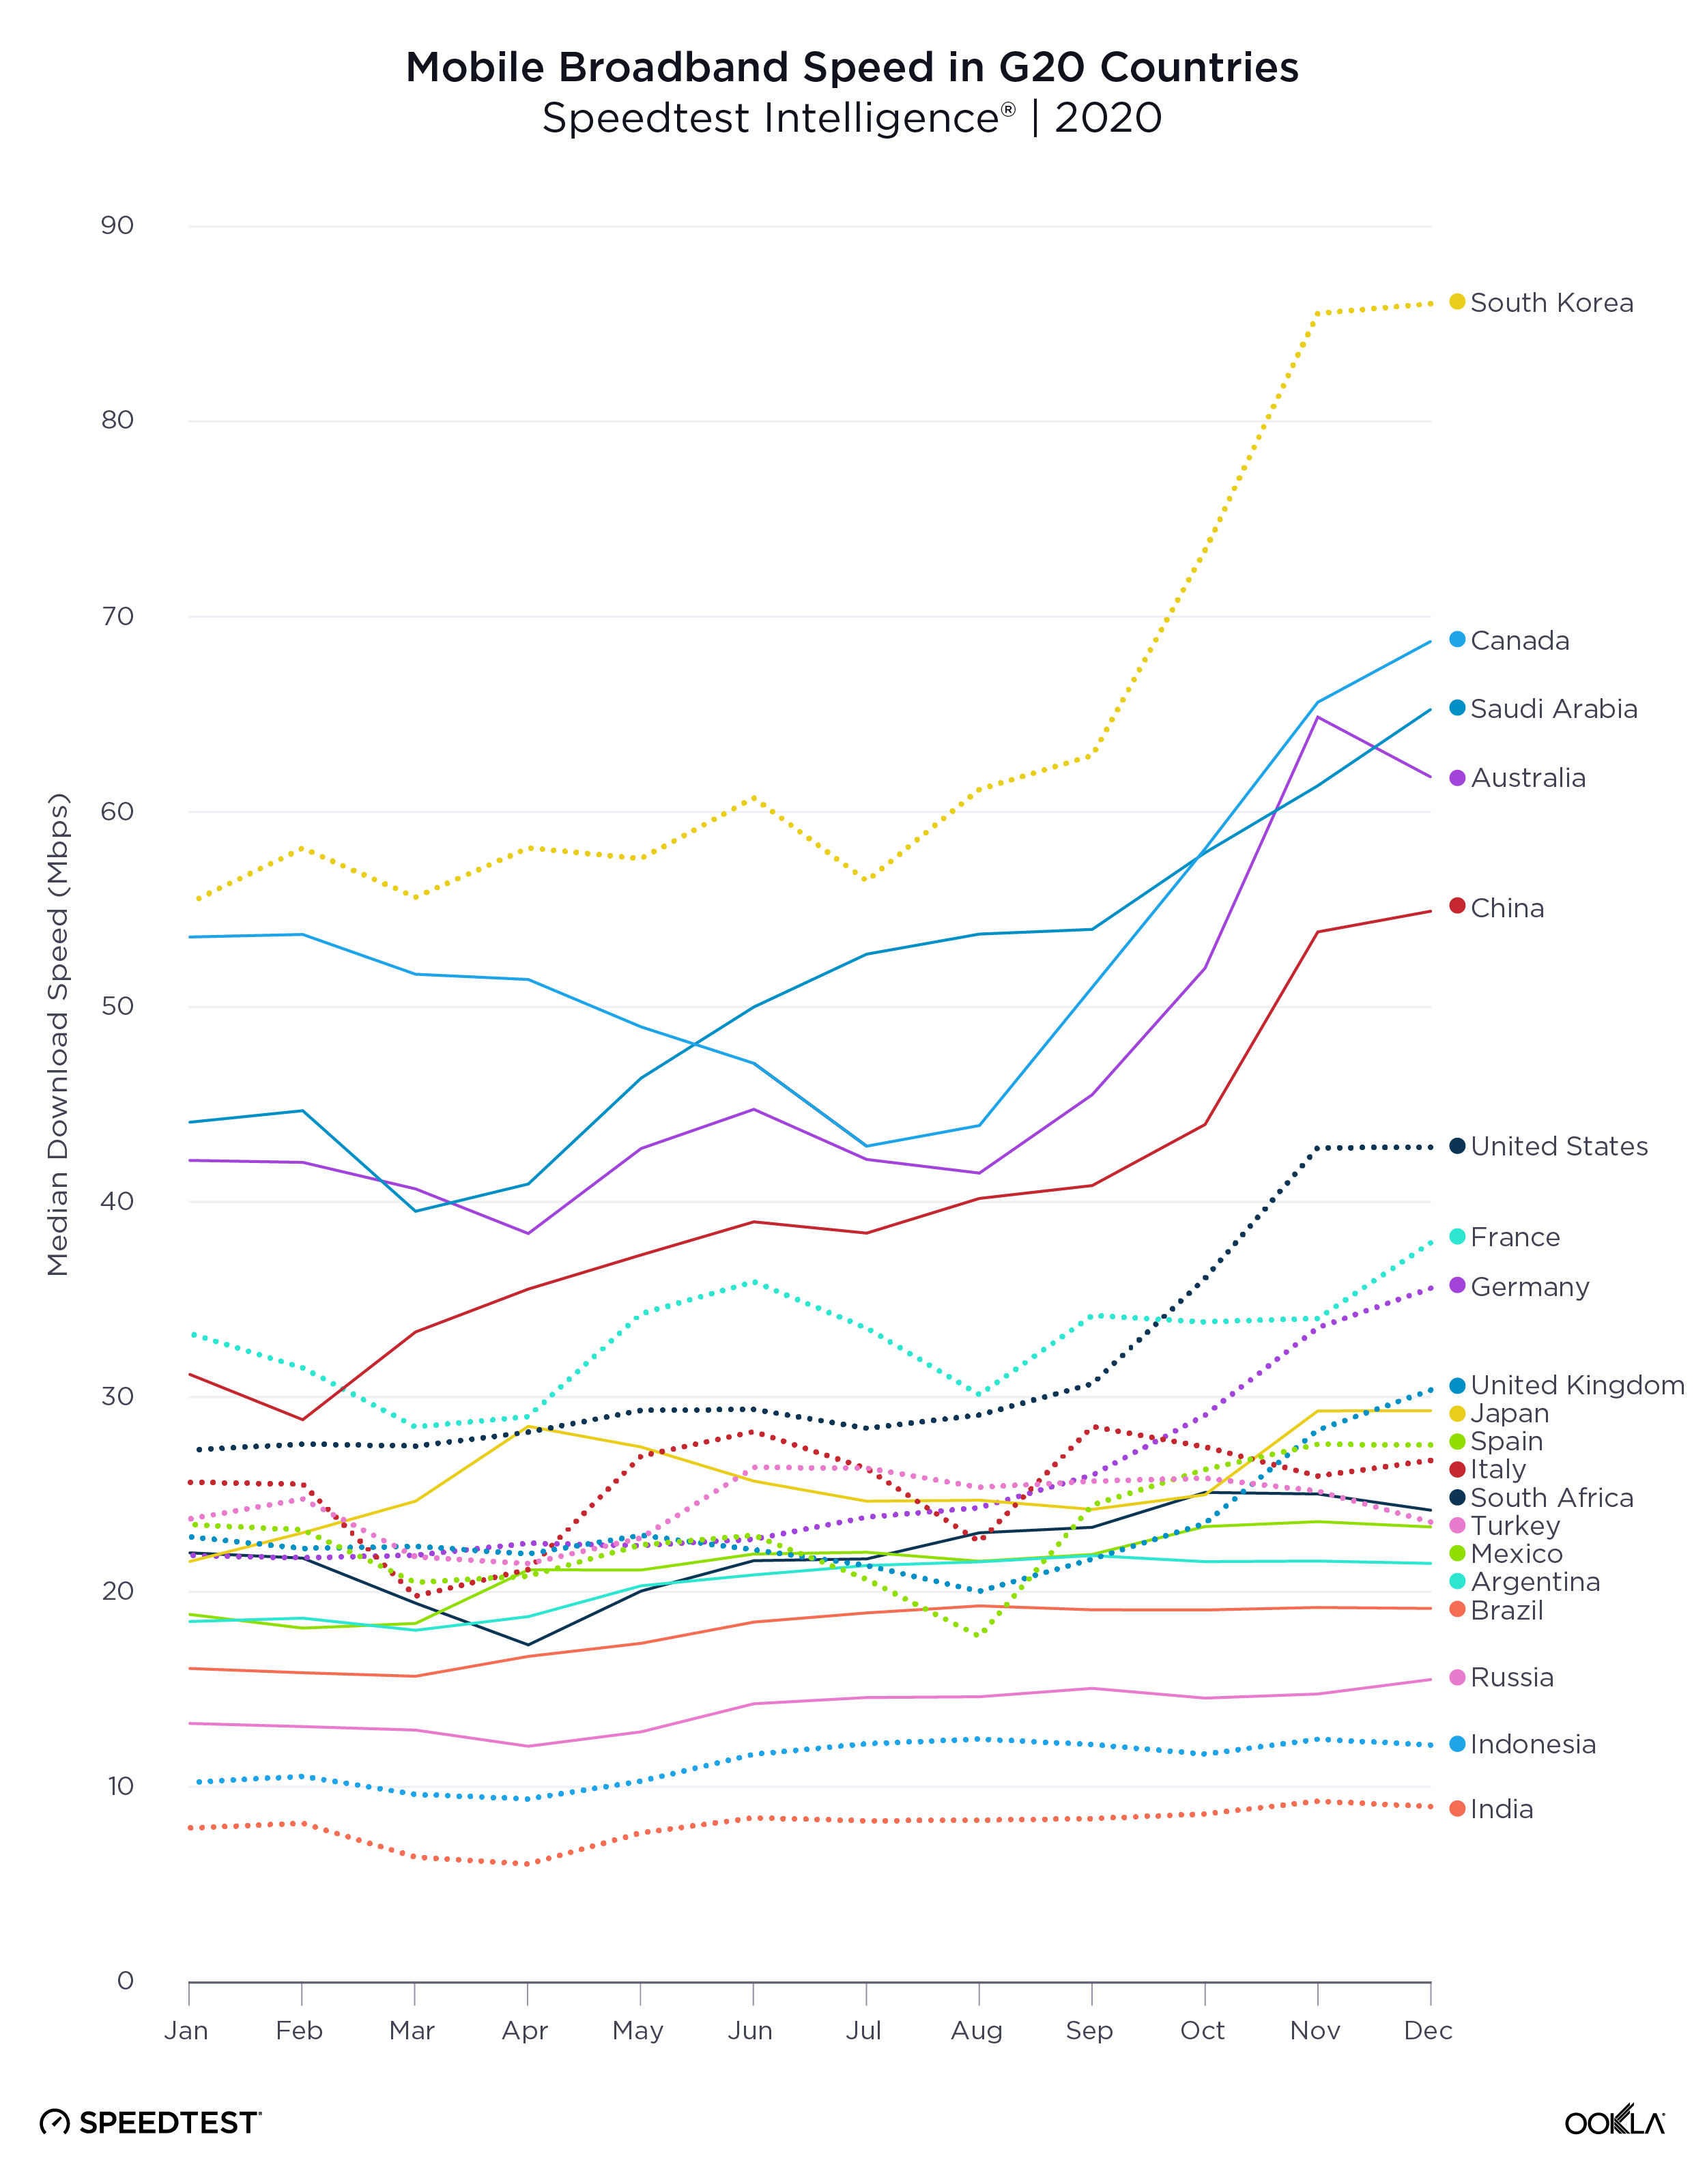
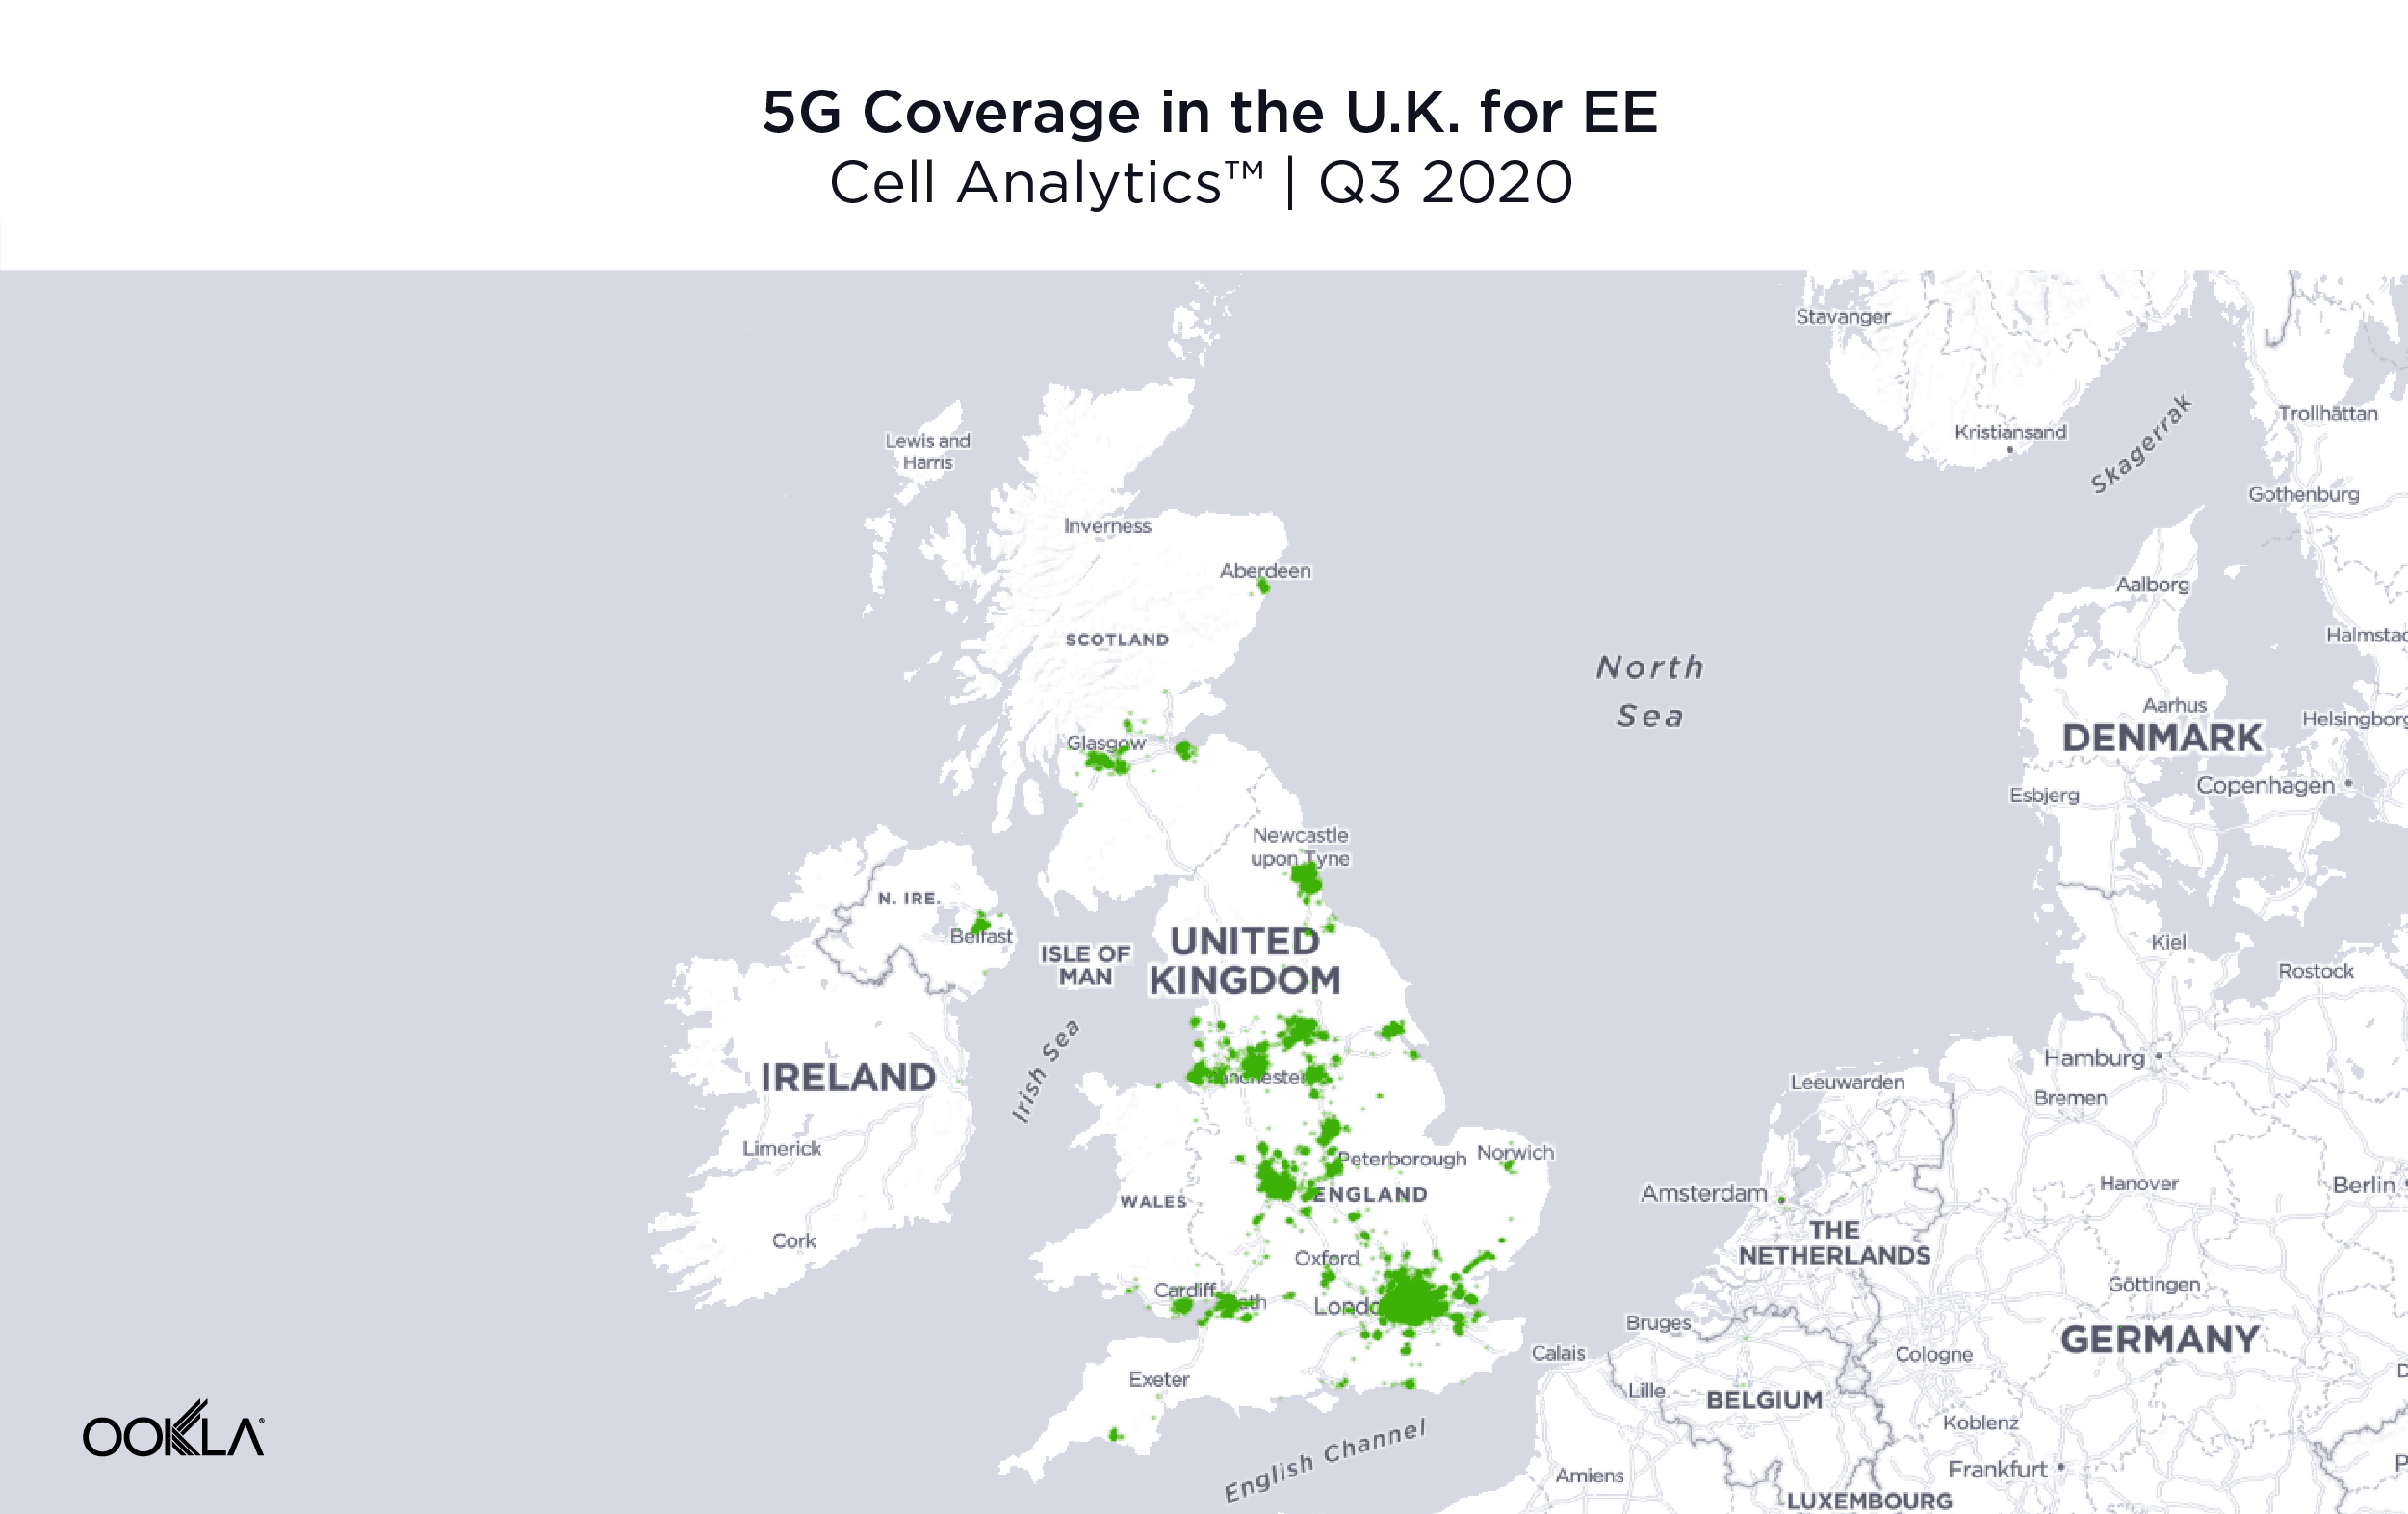
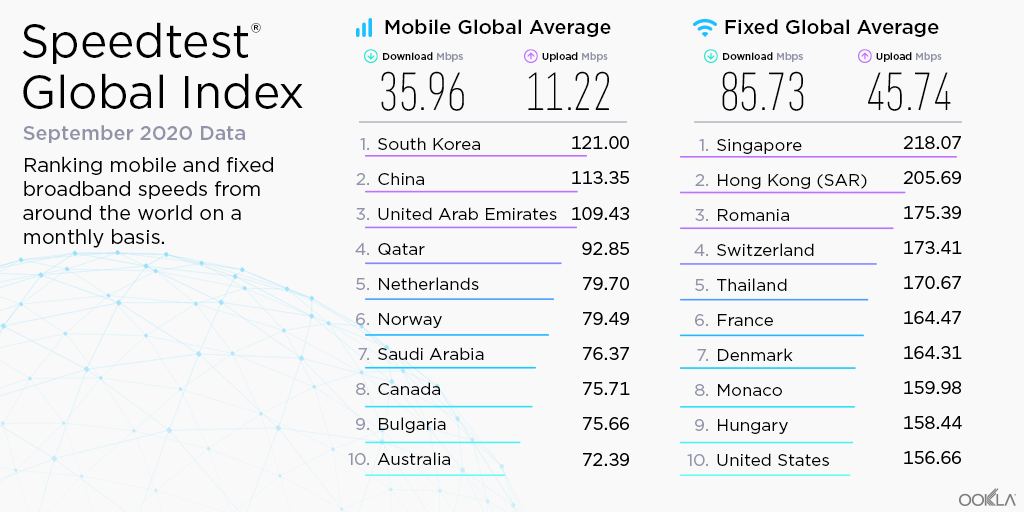
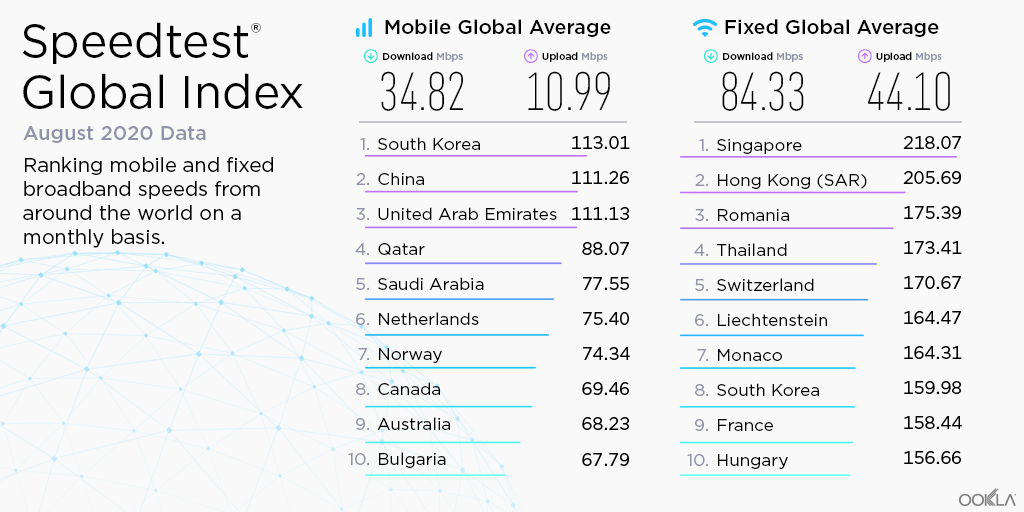
Switzerland outperformed Austria and Germany for mean mobile download speed with a mean download speed over mobile of 60.61 Mbps in Q3. Switzerland ranked 12th in the world on the Speedtest Global IndexTM as of September 2020. Austria, which had a mobile download speed of 52.76 Mbps in Q3 2020, ranked 20th in the world for mobile. Germany’s mobile download speed during Q3 2020 was 41.34 Mbps and the country ranked 35th. All three countries have invested heavily in 5G with Germany showing the largest number of cities with 5G deployments as of November 4, 2020, according to the Ookla 5G MapTM at 2,311. Switzerland had 554 and Austria 1,104. Interestingly, Switzerland actually saw a peak in mobile download speed during Q3 2020 after a decrease in Q1-Q2 2020.

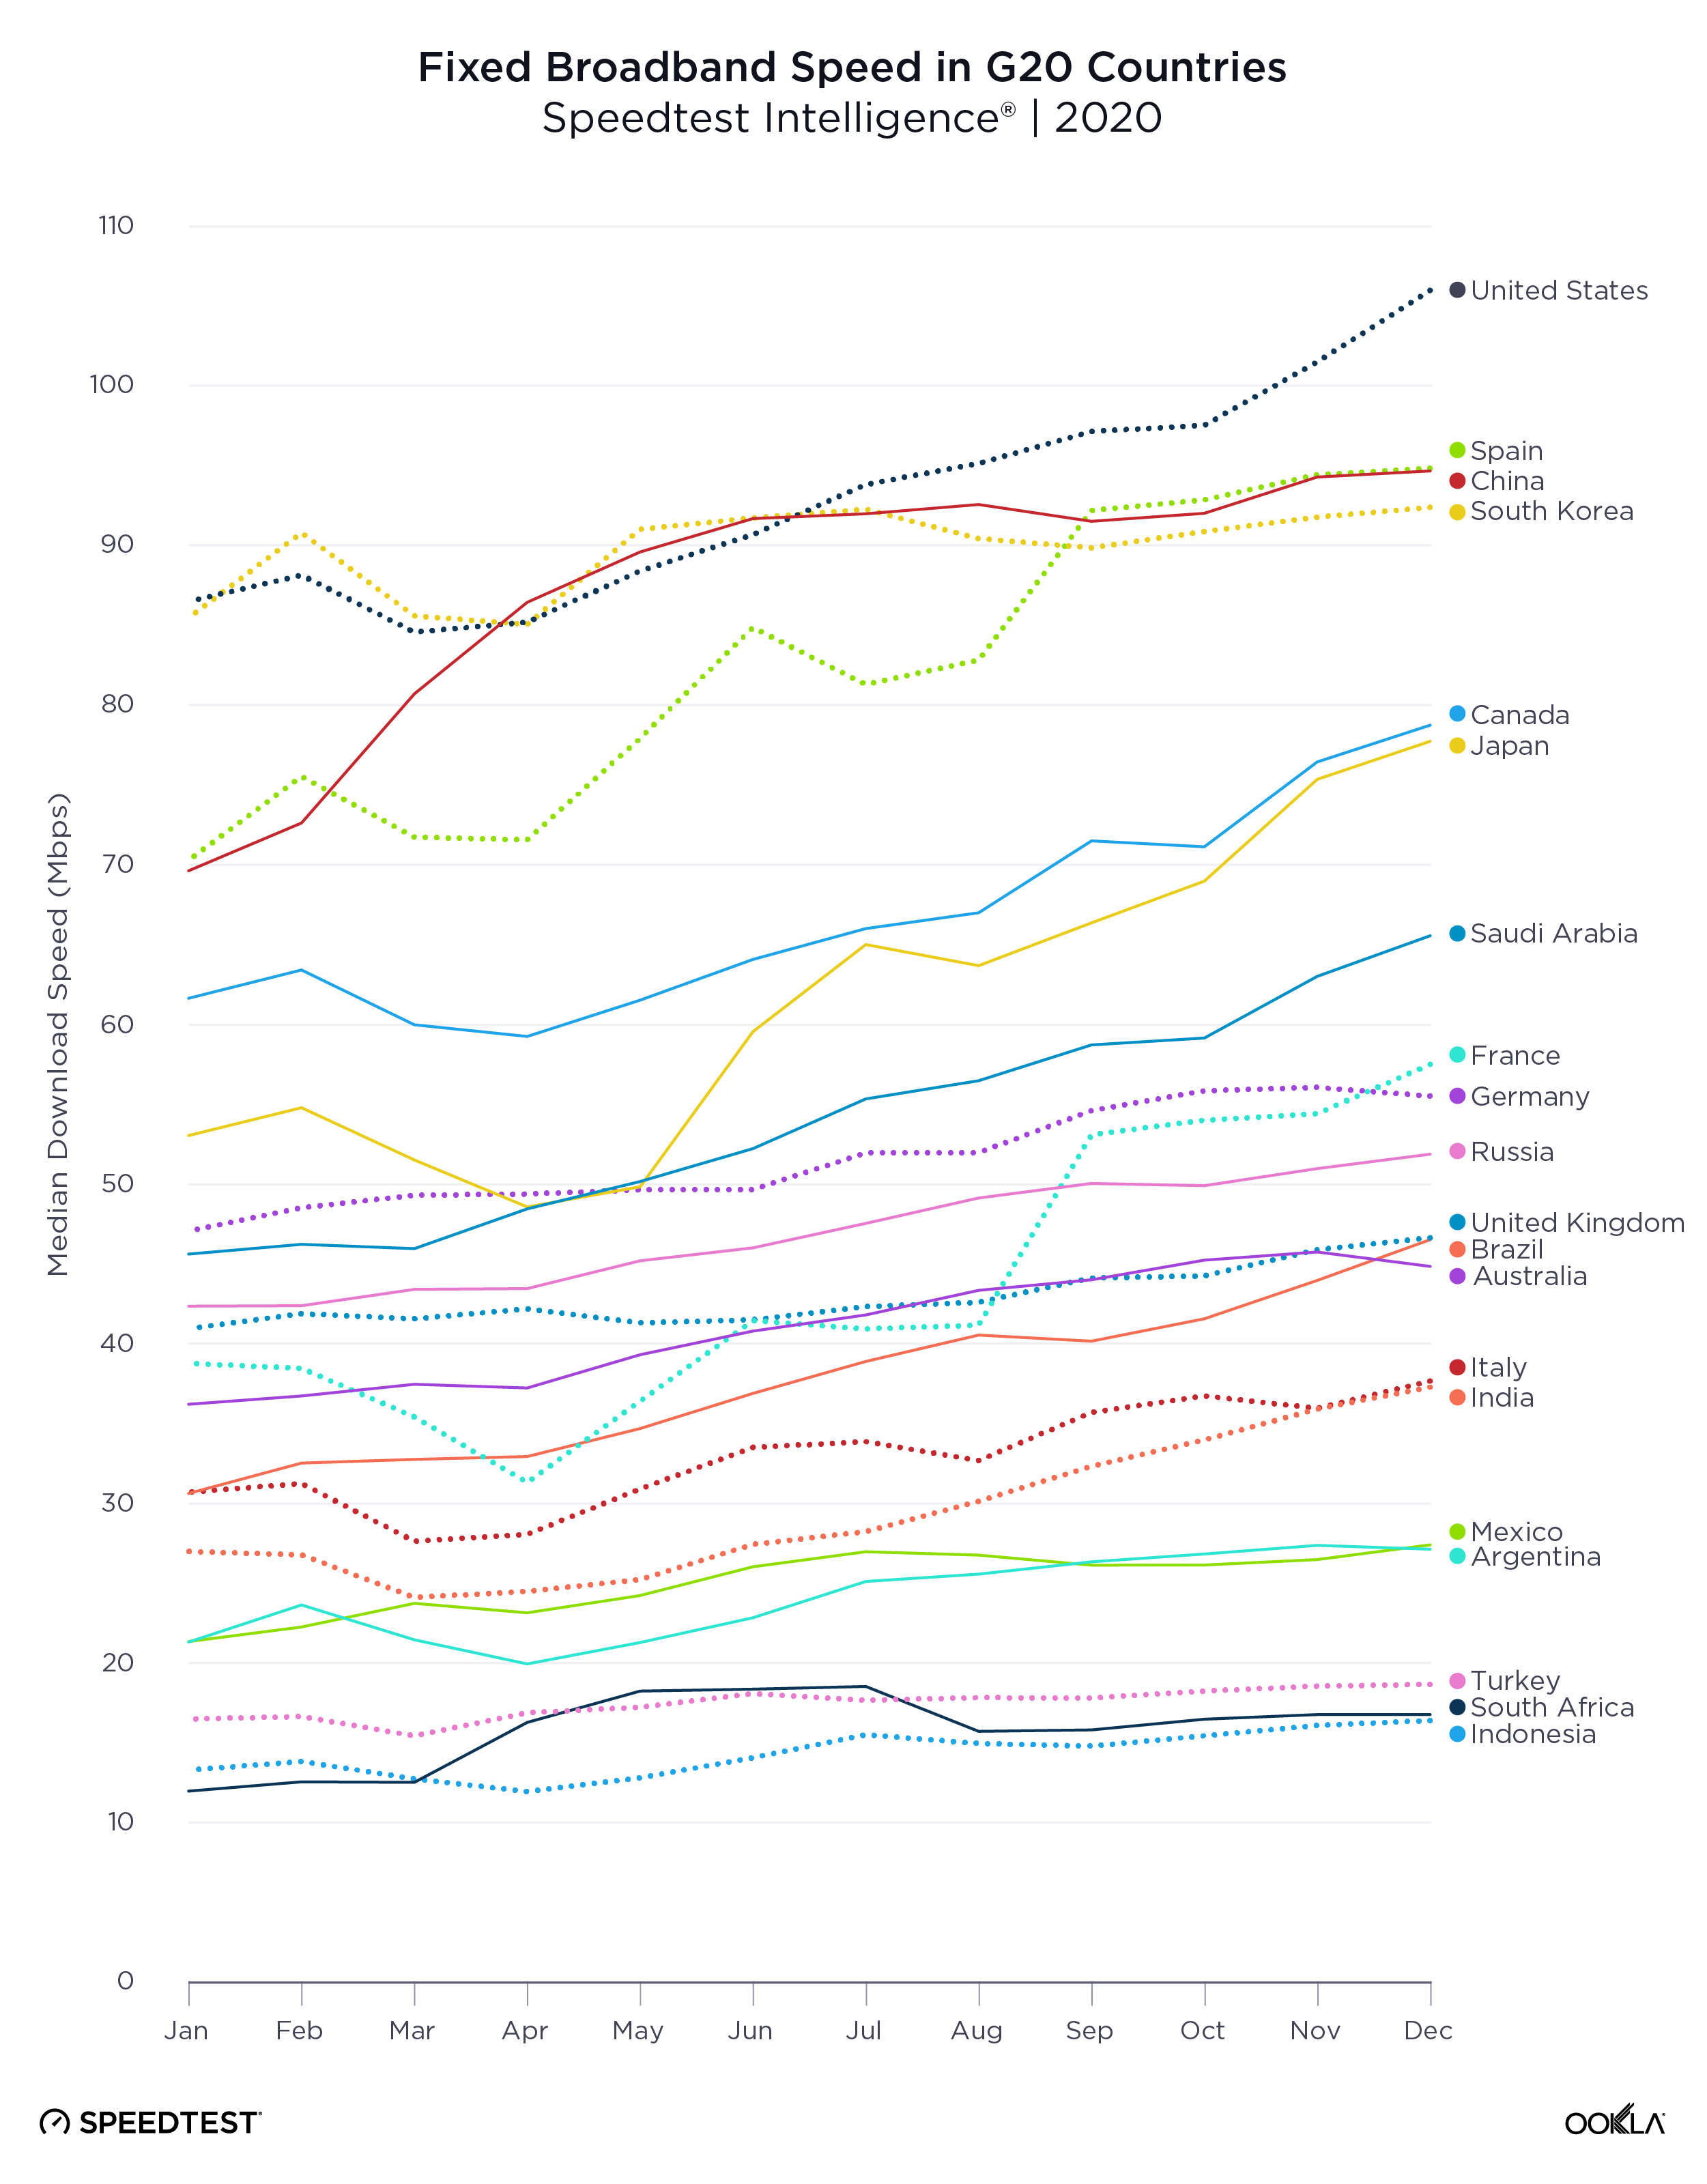
On the fixed side, Switzerland fared even better with a mean download speed of 170.21 Mbps during Q3. Switzerland ranked 4th in the world for fixed broadband according to the Speedtest Global Index as of September 2020. Germany’s Q3 2020 download speed over fixed broadband was 108.57 Mbps and the country ranked 29th in the world. Austria had the lowest download speed over fixed broadband at 75.27 Mbps during Q3 2020 and ranked 50th for fixed broadband download speed. Switzerland was the only country of the three to show parity between download and upload speed over fixed broadband with a mean upload speed of 110.09 Mbps during Q3 2020. For comparison, Germany showed 25.84 Mbps and Austria was at 18.42 Mbps during the same period.

Fastest providers in Austria, Germany and Switzerland

We compared Q3 2020 internet performance for top providers in Austria, Germany and Switzerland using Speed ScoreTM. On mobile, these results consider only devices that use modern chipsets.

A1 (mobile) and Magenta (fixed broadband) are fastest in Austria

Internet Performance of Top Mobile Providers in Austria
Speedtest Intelligence® | Modern Chipsets in Q3 2020
Provider Speed Score
A1 61.55
3 43.55
Magenta Telekom 41.00

A1 had the fastest Speed Score among Austrian mobile operators at 61.55 during Q3 2020. Three showed the second fastest Speed Score, followed by Magenta Telekom.

Internet Performance of Top Fixed Providers in Austria
Speedtest Intelligence® | Q3 2020
Provider Speed Score
Magenta 81.21
3 26.39
A1 24.84

On the fixed broadband side at the national level, Magenta was the fastest provider in Austria during Q3 2020. Three was second, while A1 was third. While LIWEST, kabelplus and CableLink had higher Speed Scores than both 3 and A1, these regional providers are only available in select portions of the country.

Telekom (mobile) and Vodafone (fixed broadband) are fastest in Germany

Internet Performance of Top Mobile Providers in Germany
Speedtest Intelligence® | Modern Chipsets in Q3 2020
Provider Speed Score
Telekom 49.09
Vodafone 29.69
1&1 23.18
O2 22.65

Telekom was the fastest mobile operator in Germany during Q3 2020 with a Speed Score of 49.09, far above second-place Vodafone. 1&1 was third and O2 was fourth.

Internet Performance of Top Fixed Providers in Germany
Speedtest Intelligence® | Q3 2020
Provider Speed Score
Vodafone 103.57
Telekom 44.28
O2 38.38

Vodafone was the fastest fixed broadband provider in Germany during Q3 2020 with a Speed Score of 103.57. This was more than double that of second-place Telekom. O2 was third.

Switzerland’s fastest providers are Swisscom (mobile) and Salt (fixed broadband)

Internet Performance of Top Mobile Providers in Switzerland
Speedtest Intelligence® | Modern Chipsets in Q3 2020
Provider Speed Score
Swisscom 57.10
Sunrise 46.13
Salt 38.79

The fastest mobile operator in Switzerland during Q3 2020 was Swisscom with a Speed Score of 57.10. Sunrise was second and Salt third.

Internet Performance of Top Fixed Providers in Switzerland
Speedtest Intelligence® | Q3 2020
Provider Speed Score
Salt 290.89
UPC 150.45
Quickline 95.18
net+ 82.98
Sunrise 79.40
Swisscom 76.73

Salt was the fastest fixed broadband provider in Switzerland during Q3 2020 with a Speed Score of 290.89 — nearly twice as high as second-place UPC. Quickline was third, net+ was fourth, Sunrise fifth and Swisscom sixth.

We compared five-star ratings and NPS data to providers’ performance to understand how speeds impacted customer perceptions of German, Austrian and Swiss providers. Speedtest Consumer Sentiment data is gathered from single-question surveys presented to users at the end of a Speedtest®. This data set provides rich insights into customer satisfaction over time, as well as competitive benchmarking, by providing data on both Net Promoter Score (NPS) and customers’ overall satisfaction with their network providers.

Provider performance vs. ratings

Consumer Sentiment includes data on how users rate providers on a five-star scale. We compared ratings data from Austrian, German and Swiss providers in Q3 2020 with Speed Score to better understand the relationship between network performance and customers’ overall satisfaction with their network providers.

In Austria, A1 rated highest for mobile, kabelplus for fixed broadband

Internet Performance and Five-Star Ratings of Top Mobile Providers in Austria
Speedtest Intelligence® | Modern Chipsets in Q3 2020
Provider Speed Score Rating
A1 61.55 3.8
3 43.55 3.3
Magenta Telekom 41.00 3.4

Ratings aligned with performance in Austria during Q3 2020 with A1 coming first for ratings and Speed Score among Austrian mobile operators.

Internet Performance and Five-Star Ratings of Top Fixed Providers in Austria
Speedtest Intelligence® | Q3 2020
Provider Speed Score Rating
Magenta 81.21 3.2
3 26.39 3.0
A1 24.84 2.7

On fixed broadband, Magenta showed the highest rating among users in Austria during Q3 2020. Three was second and A1 was third for ratings on fixed broadband.

In Germany, Telekom highest rated for mobile, Telekom for fixed broadband

Internet Performance and Five-Star Ratings of Top Mobile Providers in Germany
Speedtest Intelligence® | Modern Chipsets in Q3 2020
Provider Speed Score Rating
Tekelom 49.09 3.9
Vodafone 29.69 3.1
1&1 23.18 3.0
O2 22.65 3.2

In Germany, the mobile operator with the highest rating, Telekom, was also the fastest provider during Q3 2020. The rest of the rankings did not follow the order of network performance, but the spread between rankings was relatively small.

Internet Performance and Five-Star Ratings of Top Fixed Providers in Germany
Speedtest Intelligence® | Q3 2020
Provider Speed Score Rating
Vodafone 103.57 2.9
Telekom 44.28 3.3
O2 38.38 3.1

On fixed broadband, the highest-rated provider in Germany during Q3 2020 was Telekom. Despite having a much higher Speed Score than competitors, Vodafone was rated lowest by consumers.

Swisscom rated highest for mobile in Switzerland, Salt for fixed broadband

Internet Performance and Five-Star Ratings of Top Mobile Providers in Switzerland
Speedtest Intelligence® | Modern Chipsets in Q3 2020

Provider Speed Score Rating
Swisscom 57.10 3.6
Sunrise 46.13 3.2
Salt 38.79 2.9

Swisscom was both the highest-rated mobile operator in Switzerland during Q3 2020 and the operator with the best Speed Score. The spread between highest- and lowest-rated mobile operators was very narrow at less than a star.

Internet Performance and Five-Star Ratings of Top Fixed Providers in Switzerland
Speedtest Intelligence® | Q3 2020
Provider Speed Score Rating
Salt 290.89 3.5
UPC 150.45 3.2
Quickline 95.18 3.5
net+ 82.98 3.5
Sunrise 79.40 3.4
Swisscom 76.73 3.5

On the fixed broadband side, Salt, net+, and Swisscom and Quickline tied for the highest rating in Switzerland during Q3 2020 despite a wide difference in Speed Score. The difference between the highest-rated provider and lowest-rated was again very small on fixed broadband.

Provider performance vs. NPS

Speedtest users are also asked how likely they are to recommend their provider to friends or family on a 0 to 10 scale. NPS ratings are categorized into Detractors (score 0-6), Passives (score 7-8), and Promoters (score 9-10). NPS is calculated as (% Promoters – % Detractors) x 100. Any NPS score above 0 indicates that a provider’s audience is more loyal than not. We compared the resulting Net Promoter Score (NPS) with Speed Score to see how performance relates to a user’s likelihood of recommending a provider.

A1 had highest NPS on mobile in Austria, kabelplus highest on fixed broadband

Internet Performance of Top Mobile Providers in Austria
Speedtest Intelligence® | Modern Chipsets in Q3 2020
Provider Speed Score NPS
A1 61.55 1.58
3 43.55 -39.67
Magenta Telekom 41.00 -20.18

A1 showed the highest NPS among mobile operators in Austria in Q3 2020, while Magenta Telekom and 3 showed negative NPS. This suggests that users were not to recommend these operators.

Internet Performance of Top Fixed Providers in Austria
Speedtest Intelligence® | Q3 2020
Provider Speed Score NPS
Magenta 81.21 -28.97
3 26.39 -36.00
A1 24.84 -51.63

Magenta had the highest NPS among fixed broadband providers in Austria in Q3 2020, followed by 3 and A1. No providers had positive NPS values.

Telekom had highest NPS on mobile and fixed broadband in Germany

Internet Performance of Top Mobile Providers in Germany
Speedtest Intelligence® | Modern Chipsets in Q3 2020
Provider Speed Score NPS
Tekelom 49.09 14.82
Vodafone 29.69 -37.74
1&1 23.18 -58.65
O2 22.65 -34.59

Not only did Telekom have the highest NPS on mobile in Germany during Q3 2020, it was also the only mobile operator with a positive NPS, indicating consumers were likely to recommend the operator. As we saw above, Telekom was also the fastest operator and the most highly rated.

Internet Performance of Top Fixed Providers in Germany
Speedtest Intelligence® | Q3 2020
Provider Speed Score NPS
Vodafone 103.57 -50.26
Telekom 44.28 -27.10
O2 38.38 -40.76

Telekom had the highest NPS among fixed broadband providers in Germany during Q3 2020. However, all fixed broadband providers showed negative NPS values.

Swisscom had highest NPS on mobile in Switzerland, Salt on fixed broadband

Internet Performance of Top Mobile Providers in Switzerland
Speedtest Intelligence® | Modern Chipsets in Q3 2020
Provider Speed Score NPS
Swisscom 57.10 -2.74
Sunrise 46.13 -24.66
Salt 38.79 -46.75

Along with having the highest Speed Score in Switzerland and earning the highest ratings from customers, Swisscom had the highest NPS on mobile in Switzerland during Q3 2020. That said, all Swiss mobile operators showed negative NPS values, suggesting that consumers were not likely to recommend these operators to friends or family.

Internet Performance of Top Fixed Providers in Switzerland
Speedtest Intelligence® | Q3 2020
Provider Speed Score NPS
Salt 290.89 -1.24
UPC 150.45 -23.70
Quickline 95.18 -18.29
net+ 82.98 -8.33
Sunrise 79.40 -10.93
Swisscom 76.73 -10.34

Salt, whose Speed Score was almost double that of its nearest competitor, had the highest NPS of any fixed broadband provider in Switzerland during Q3 2020. Among the other providers, speed rankings did not otherwise match the provider rankings for NPS in Switzerland, with second-fastest UPC showing the lowest NPS.

While the fastest speeds don’t always correlate to the highest ratings from customers, there is a clear relationship between the performance, quality and availability of networks and customer satisfaction. As more mobile operators in the DACH countries continue to deploy 5G — and high-speed fiber internet becomes more available in the region — it will be interesting to watch speeds continue to climb. We will continue to monitor both network metrics and Consumer Sentiment data for the region and to surface these insights so providers can understand how and where to improve their networks.


Untersuchung des Verhältnisses zwischen Netzwerkleistung und NPS in Deutschland, Österreich und der Schweiz

Die drei Länder der DACH-Region (Deutschland, Österreich und die Schweiz) sind zwar kulturell miteinander verbunden, aber die Leistungsfähigkeit des Internets ist sehr unterschiedlich. Mithilfe von Daten von Speedtest Intelligence® haben wir die Leistung von Mobilfunknetzbetreibern (MNOs) und Festnetz-Breitband-Internetdienstanbietern (ISPs) in verschiedenen Ländern und auf Anbieterebene im 3. Quartal 2020 verglichen. Wir haben auch die Leistung der Anbieter mit Speedtest Consumer Sentiment™-Daten zu Fünf-Sterne-Ratings und dem Net Promoter Score (NPS) verglichen, um zu verstehen, wie sich die Netzleistung auf die Kundenzufriedenheit auswirkt.

Die Schweiz verfügt über die höchsten Geschwindigkeiten beim Mobilfunk- und Festnetz-Breitband-Download

Speeds-Chart_Austria_Germany_Switzerland_1220_de-1

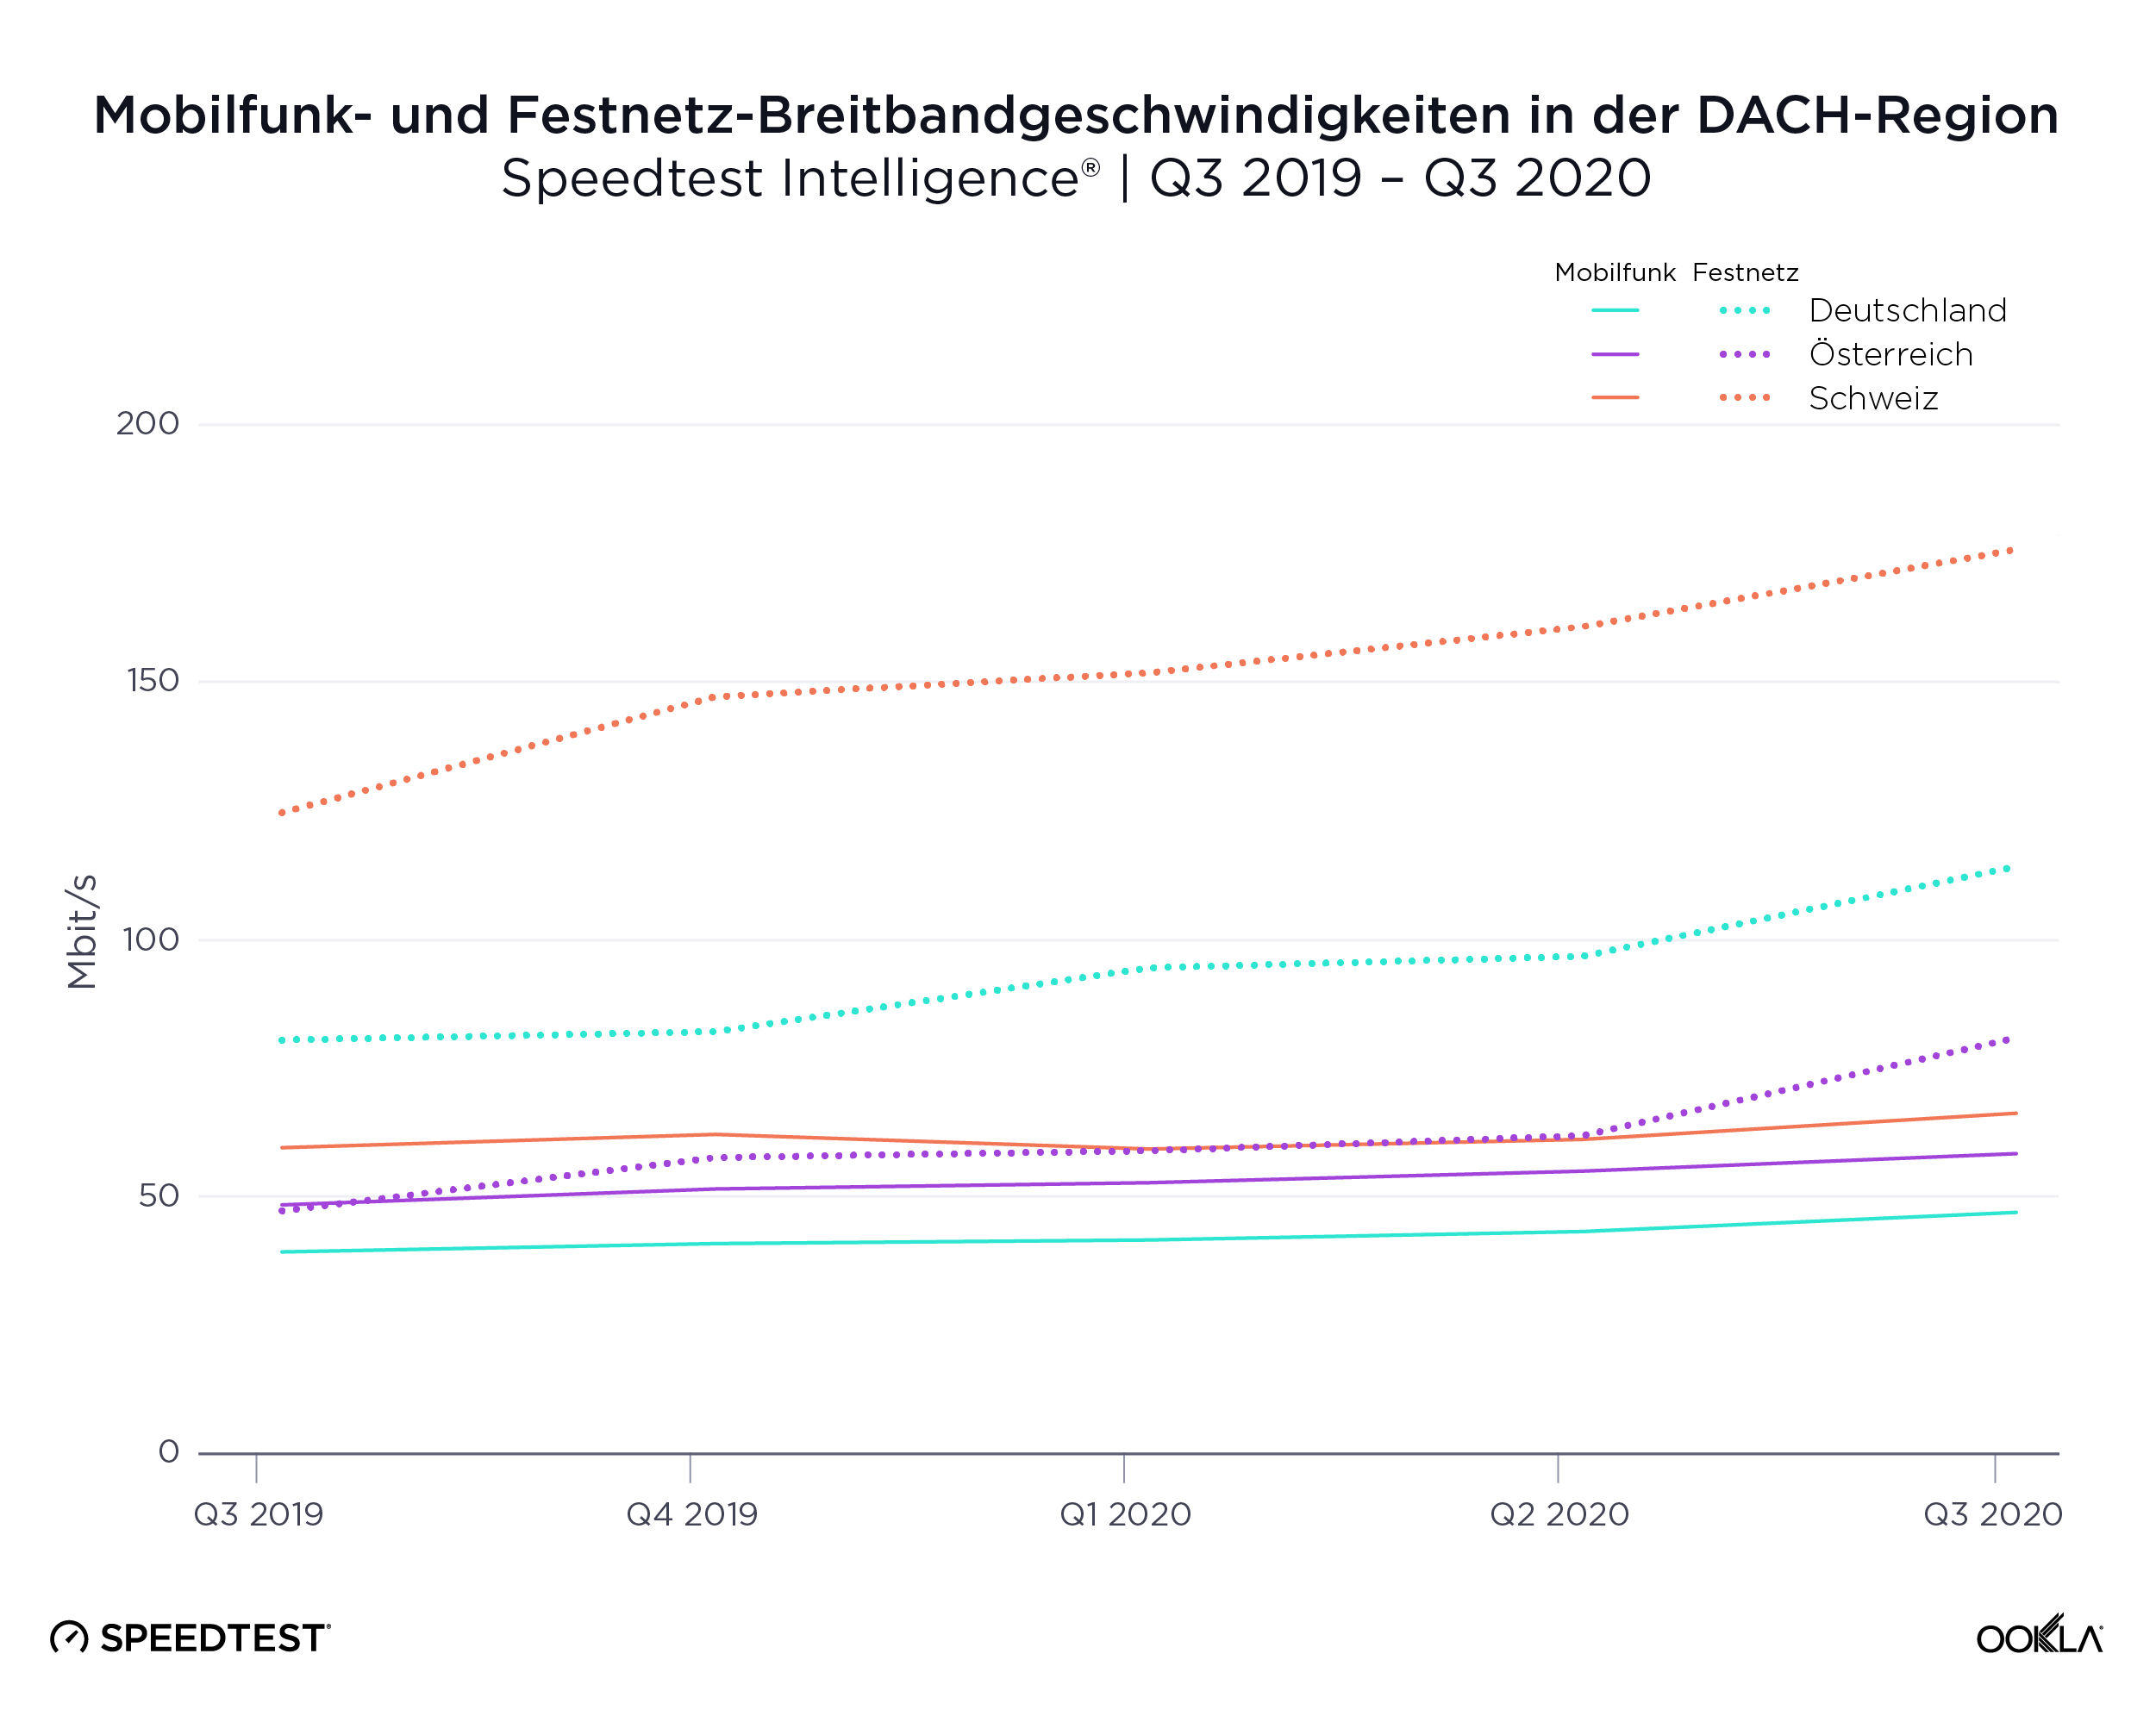
Die Schweiz übertraf Österreich und Deutschland in Bezug auf die durchschnittliche mobile Downloadgeschwindigkeit: Sie erreichte einen Durchschnittswert von 60,61 Mbit/s im dritten Quartal. Die Schweiz belegte im September 2020 weltweit Platz 12 im Speedtest Global IndexTM. Österreich schaffte es mit einer Downloadgeschwindigkeit von 52,76 Mbit/s im Mobilfunk im 3. Quartal 2020 weltweit auf Platz 20. Deutschland wies im 3. Quartal 2020 eine Mobilfunk-Downloadgeschwindigkeit von 41,34 Mbit/s auf und belegte Platz 35. Alle drei Länder haben in großem Umfang in 5G investiert, wobei Deutschland laut der Europäischen Kommission am 4. November 2020 die größte Anzahl von Städten mit 5G-Installationen aufwies. Laut der Ookla 5G MapTM belief sich die Zahl der Installationen auf 2.311. In der Schweiz waren es 554, in Österreich 1.104. Interessanterweise erlebte die Schweiz nach einem Rückgang im Q1-Q2 2020 in Q3 2020 sogar einen Höhepunkt der mobilen Downloadgeschwindigkeit.

Auf der Festnetzseite schnitt die Schweiz mit einer durchschnittlichen Downloadgeschwindigkeit von 170,21 Mbit/s im dritten Quartal noch besser ab. Laut dem Speedtest Global Index vom September 2020 belegte die Schweiz weltweit den 4. Platz im Bereich Festnetz-Breitband. Deutschlands Downloadgeschwindigkeit im 3. Quartal 2020 über Festnetz-Breitband betrug 108,57 Mbit/s und das Land belegte weltweit Platz 29. Österreich hatte im 3. Quartal 2020 mit 75,27 Mbit/s die niedrigste Downloadgeschwindigkeit über Festnetz-Breitband und belegte damit Platz 50. Die Schweiz war das einzige der drei Länder, das im 3. Quartal 2020 mit einer durchschnittlichen Upload-Geschwindigkeit von 110,09 Mbit/s einen gleichen Wert für die Download- und Upload-Geschwindigkeit über Festnetz-Breitband-Verbindungen aufwies. Zum Vergleich: Im selben Zeitraum beliefen sich die Werte in Deutschland auf 25,84 Mbit/s und in Österreich auf 18,42 Mbit/s.

Schnellste Anbieter in Österreich, Deutschland und der Schweiz

Wir verglichen die Internetleistung in Q3 2020 der Top-Anbieter in Österreich, Deutschland und der Schweiz mit Speed ScoreTM. Im Mobilfunkbereich werden hier nur Geräte berücksichtigt, die moderne Chipsätze verwenden.

A1 (Mobilfunk) und Magenta (Festnetz-Breitband) sind in Österreich am schnellsten

Internetleistung der Top-Mobilfunkanbieter in Österreich
Speedtest Intelligence® | Moderne Chipsätze in Q3 2020
Anbieter Speed Score
A1 61,55
3 43,55
Magenta Telekom 41,00

A1 hatte von allen Mobilfunkanbietern in Österreich in Q3 2020 mit 61,55 den schnellsten Speed Score. Three erreichte den zweitschnellsten Speed Score, gefolgt von Magenta Telekom.

Internetleistung der Top-Festnetz-Breitband-Anbieter in Österreich
Speedtest Intelligence® | Q3 2020
Anbieter Speed Score
Magenta 81,21
3 26,39
A1 24,84

Auf der Festnetz-Breitband-Seite auf nationaler Ebene war Magenta im 3. Quartal 2020 der schnellste Anbieter in Österreich. Three belegte den zweiten und A1 den dritten Platz. LIWEST, kabelplus und CableLink hatten zwar höhere Speed Scores als 3 und A1, aber diese regionalen Anbieter sind nur in Teilen Österreichs verfügbar.

Telekom (Mobilfunk) und Vodafone (Festnetz-Breitband) sind in Deutschland am schnellsten

Internetleistung der Top-Mobilfunkanbieter in Deutschland
Speedtest Intelligence® | Modern Chipsets in Q3 2020
Anbieter Speed Score
Telekom 49,09
Vodafone 29,69
1&1 23,18
O2 22,65

Telekom war in Q3 2020 der schnellste Mobilfunkanbieter in Deutschland und lag mit einem Speed Score von 49,09 weit vor dem Zweitplatzierten Vodafone. Platz 3 belegt 1&1 und O2 war auf dem vierten Platz.

Internetleistung der Top-Festnetz-Breitband-Anbieter in Deutschland
Speedtest Intelligence® | Q3 2020
Anbieter Speed Score
Vodafone 103,57
Telekom 44,28
O2 38,38

Vodafone war mit einem Speed Score von 103,57 der schnellste Festnetz-Breitband-Anbieter in Deutschland in Q3 2020. Der Speed Score war doppelt so hoch wie beim Zweitplatzierten, der Telekom. O2 belegte Platz 3.

Die schnellsten Anbieter in der Schweiz sind Swisscom (Mobilfunk) und Salt (Festnetz-Breitband)

Internetleistung der Top-Mobilfunkanbieter in der Schweiz
Speedtest Intelligence® | Modern Chipsets in Q3 2020
Anbieter Speed Score
Swisscom 57,10
Sunrise 46,13
Salt 38,79

Der schnellste Mobilfunkanbieter in der Schweiz in Q3 2020 war Swisscom mit einem Speed Score von 57,10. Sunrise war zweiter und Salt dritter.

Internetleistung der Top-Festnetz-Breitband-Anbieter in der Schweiz
Speedtest Intelligence® | Q3 2020
Anbieter Speed Score
Salt 290,89
UPC 150,45
Quickline 95,18
net+ 82,98
Sunrise 79,40
Swisscom 76,73

Salt war in Q3 2020 der schnellste Festnetz-Breitband-Anbieter in der Schweiz und erreichte einen Speed Score von 290,89, fast zweimal so viel wie der Zweitplatzierte UPC. Quickline belegte Platz 3, net+ Platz 4, Sunrise Platz 5 und Swisscom Platz 6.

Wir haben Fünf-Sterne-Ratings und NPS-Daten mit der Leistung der Anbieter verglichen, um zu verstehen, wie sich die Geschwindigkeit auf die Kundenwahrnehmung deutscher, österreichischer und schweizerischer Anbieter auswirkte. Speedtest Consumer Sentiment-Daten werden über Umfragen mit einer einzigen Frage gesammelt, die den Anwendern am Ende eines Speedtest® angezeigt werden. Dieser Datensatz bietet wertvolle Einblicke in die Kundenzufriedenheit im Laufe der Zeit sowie Wettbewerbsvergleiche, indem er Daten sowohl zum Net Promoter Score (NPS) als auch zur Gesamtzufriedenheit der Kunden mit ihren Netzbetreibern liefert.

Anbieterleistung vs. Bewertungen

Consumer Sentiment erfasst Daten darüber, wie Anwender Anbieter auf einer Skala von eins bis fünf bewerten. Wir haben Bewertungsdaten aus österreichischen, deutschen und schweizer Anbietern in Q3 2020 mit Speed Score verglichen, um die Beziehung zwischen Netzwerkleistung und der Zufriedenheit der Kunden insgesamt mit ihren Netzwerkanbietern zu analysieren.

In Österreich bekam A1 die besten Bewertungen für Mobilfunk und kabelplus schnitt am besten beim Festnetz-Breitband ab

Internetleistung und Fünf-Sterne-Bewertungen der Top-Mobilfunkanbieter in Österreich
Speedtest Intelligence® | Modern Chipsets in Q3 2020
Anbieter Speed Score Bewertung
A1 61,55 3,8
3 43,55 3,3
Magenta Telekom 41,00 3,4

Die Bewertungen deckten sich in Österreich im 3. Quartal 2020 mit der Leistung, wobei A1 bei den Bewertungen und beim Speed Score unter den österreichischen Mobilfunkbetreibern den ersten Platz belegt.

Internetleistung und Fünf-Sterne-Bewertungen der Top-Festnetz-Breitband-Anbieter in Österreich
Speedtest Intelligence® | Q3 2020
Anbieter Speed Score Bewertung
Magenta 81,21 3,2
3 26,39 3,0
A1 24,84 2,7

Im Festnetz-Breitband-Bereich erhielt Magenta die besten Anwenderbewertungen in Q3 2020. Three belegte bei den Bewertungen für Festnetz-Breitband den zweiten Platz und A1 den dritten.

In Deutschland schnitt die Telekom bei den Bewertungen für Mobilfunk und Festnetz-Breitband am besten ab

Internetleistung und Fünf-Sterne-Bewertungen der Top-Mobilfunkanbieter in Deutschland
Speedtest Intelligence® | Modern Chipsets in Q3 2020
Anbieter Speed Score Bewertung
Tekelom 49,09 3,9
Vodafone 29,69 3,1
1&1 23,18 3,0
O2 22,65 3,2

In Deutschland war der Mobilfunkbetreiber mit den besten Bewertungen, die Telekom, gleichzeitig auch der schnellste Anbieter in Q3 2020. Die weitere Platzverteilung entsprach nicht der Reihenfolge der Netzwerkleistung, aber die Spanne zwischen den Platzierungen war relativ gering.

Internetleistung und Fünf-Sterne-Bewertungen der Top-Festnetz-Breitband-Anbieter in Deutschland
Speedtest Intelligence® | Q3 2020
Anbieter Speed Score Bewertung
Vodafone 103,57 2,9
Telekom 44,28 3,3
O2 38,38 3,1

Im Bereich Festnetz-Breitband schnitt die Telekom in Deutschland bei den Bewertungen in Q3 2020 am besten ab. Obwohl der Speed Score von Vodafone deutlich höher war, als bei anderen Mitbewerbern, fielen die Bewertungen der Verbraucher hier am niedrigsten aus.

Swisscom erhielt die besten Bewertungen für den Mobilfunkbereich in der Schweiz und Salt schnitt am besten bei Festnetz-Breitband ab

Internetleistung und Fünf-Sterne-Bewertungen der Top-Mobilfunkanbieter in der Schweiz
Speedtest Intelligence® | Modern Chipsets in Q3 2020
Anbieter Speed Score Bewertung
Swisscom 57,10 3,6
Sunrise 46,13 3,2
Salt 38,79 2,9

Swiscom wurde in Q3 2020 als bester Mobilfunkbetreiber in der Schweiz bewertet und hatte auch den besten Speed Score. Die Differenz zwischen den am besten und am schlechtesten bewerteten Mobilfunkbetreibern war sehr knapp und betrug weniger als einen Stern.

Internetleistung und Fünf-Sterne-Bewertungen der Top-Festnetz-Breitband-Anbieter in der Schweiz
Speedtest Intelligence® | Q3 2020
Anbieter Speed Score Bewertung
Salt 290,89 3,5
UPC 150,45 3,2
Quickline 95,18 3,5
net+ 82,98 3,5
Sunrise 79,40 3,4
Swisscom 76,73 3,5

Im Bereich Festnetz-Breitband gab es bei den Bewertungen einen Gleichstand: Salt, net+, Swisscom und Quickline belegten in Q3 2020 alle den ersten Platz, obwohl es einen großen Unterschied beim Speed Score gab. Die Differenz zwischen dem am besten und dem am schlechtesten bewerteten Anbieter war auch hier im Bereich Festnetz-Breitband sehr gering.

Anbieterleistung vs. NPS

Die Anwender von Speedtest werden auch gefragt, wie wahrscheinlich sie ihren Anbieter ihren Freunden oder ihrer Familie weiterempfehlen würden (Skala von 0 bis 10). NPS-Bewertungen werden in Kritiker (Punktzahl 0-6), Passive (Punktzahl 7-8) und Befürworter (Punktzahl 9-10) eingeteilt. Der NPS wird berechnet aus (% Unterstützer – % Kritiker) x 100. Jeder NPS-Wert über 0 zeigt an, dass die Kunden eines Anbieters eher loyal sind. Wir haben den erzielten Net Promoter Score (NPS) mit dem Speed Score verglichen, um zu sehen, wie die Leistung mit der Wahrscheinlichkeit, dass ein Anwender, einen Anbieter weiterempfiehlt, zusammenhängt.

A1 erzielte den höchsten NPS im Bereich Mobilfunk in Österreich, kabelplus erhielt den besten Wert im Bereich Festnetz-Breitband

Internetleistung der Top-Mobilfunkanbieter in Österreich
Speedtest Intelligence® | Modern Chipsets in Q3 2020
Anbieter Speed Score NPS
A1 61,55 1,58
3 43,55 -39,67
Magenta Telekom 41,00 -20,18

A1 erzielte den höchsten NPS bei den Mobilfunkbetreibern in Österreich in Q3 2020, während Magenta Telekom und 3 negative NPS-Ergebnisse aufwiesen. Daraus lässt sich schließen, dass Anwender diese Betreiber nicht weiterempfehlen würden.

Internetleistung der Top-Festnetz-Breitband-Anbieter in Österreich
Speedtest Intelligence® | Q3 2020
Anbieter Speed Score NPS
Magenta 81,21 -28,97
3 26,39 -36,00
A1 24,84 -51,63

Magenta hatte unter den Festnetz-Breitband-Anbietern den höchsten NPS in Österreich in Q3 2020, gefolgt von 3 und A1. Keiner der Anbieter erzielte positive NPS-Werte.

Die Telekom erzielte den höchsten NPS im Bereich Mobilfunk und Festnetz-Breitband in Deutschland

Internetleistung der Top-Mobilfunkanbieter in Deutschland
Speedtest Intelligence® | Modern Chipsets in Q3 2020
Anbieter Speed Score NPS
Tekelom 49,09 14,82
Vodafone 29,69 -37,74
1&1 23,18 -58,65
O2 22,65 -34,59

Die Telekom erzielte nicht nur den höchsten NPS im Bereich Mobilfunk in Deutschland in Q3 2020, das Unternehmen war auch der einzige Mobilfunkbetreiber mit einem positiven NPS, was bedeutet, dass die Verbraucher den Betreiber wahrscheinlich weiterempfehlen würden. Wie wir bereits gesehen haben, war die Telekom auch der schnellste Anbieter und der am besten bewertete.

Internetleistung der Top-Festnetz-Breitband-Anbieter in Deutschland
Speedtest Intelligence® | Q3 2020
Anbieter Speed Score NPS
Vodafone 103,57 -50,26
Telekom 44,28 -27,10
O2 38,38 -40,76

Die Telekom verzeichnete den höchsten NPS unter den Anbietern von Festnetz-Breitband in Deutschland in Q3 2020. Alle Festnetz-Breitband-Anbieter erzielten jedoch negative NPS-Werte.

Swisscom holte den höchsten NPS im Mobilfunkbereich in der Schweiz ein, Salt im Festnetz-Breitband

Internetleistung der Top-Mobilfunkanbieter in der Schweiz
Speedtest Intelligence® | Modern Chipsets in Q3 2020
Anbieter Speed Score NPS
Swisscom 57,10 -2,74
Sunrise 46,13 -24,66
Salt 38,79 -46,75

Neben dem höchsten Speed Score in der Schweiz und den besten Bewertungen von Kunden erzielte Swisscom auch den höchsten NPS im Mobilfunkbereich in der Schweiz in Q3 2020. Dennoch wiesen alle schweizer Mobilfunkbetreiber negative NPS-Werte auf, was darauf hindeutet, dass die Verbraucher diese Betreiber wahrscheinlich nicht an Freunde oder Verwandte weiterempfehlen würden.

Internetleistung der Top-Festnetz-Breitband-Anbieter in der Schweiz
Speedtest Intelligence® | Q3 2020
Anbieter Speed Score NPS
Salt 290,89 -1,24
UPC 150,45 -23,70
Quickline 95,18 -18,29
net+ 82,98 -8,33
Sunrise 79,40 -10,93
Swisscom 76,73 -10,34

Salt, dessen Speed Score fast doppelt so hoch war wie der, des nächsten Mitbewerbers, hatte unter den Festnetz-Breitband-Anbietern in der Schweiz in Q3 2020 den höchsten NPS. Unter den anderen Anbietern entsprach die Geschwindigkeitsrangliste ansonsten nicht den NPS-Anbieterrankings in der Schweiz, wobei der zweitschnellste, UPC, den niedrigsten NPS aufweist.

Zwar entsprechen die schnellsten Geschwindigkeiten nicht immer den besten Kundenbewertungen, aber es besteht ein klarer Zusammenhang zwischen der Leistung, Qualität und Verfügbarkeit der Netze und der Kundenzufriedenheit. Da immer mehr Mobilfunkbetreiber in der DACH-Region zunehmend 5G bereitstellen – und das Hochgeschwindigkeits-Glasfaser-Internet in der Region immer besser verfügbar wird – ist es interessant zu beobachten, wie die Geschwindigkeiten weiter steigen. Wir werden weiterhin sowohl Netzwerkmetriken als auch die Verbraucherstimmung in der Region beobachten und diese Erkenntnisse aufbereiten, damit die Anbieter erkennen können, wie und wo Verbesserungsbedarf für ihre Netzwerke besteht.

Ookla retains ownership of this article including all of the intellectual property rights, data, content graphs and analysis. This article may not be quoted, reproduced, distributed or published for any commercial purpose without prior consent. Members of the press and others using the findings in this article for non-commercial purposes are welcome to publicly share and link to report information with attribution to Ookla.

| December 10, 2020

Massive Expansions and Huge Improvements in Speed: The Worldwide Growth of 5G in 2020

The rapid expansion of 5G in countries across the globe was a bright spot in a year that needed one. But just how great is the news? We examined Speedtest Intelligence® data from over 60.5 million Speedtest® results during Q3 2020 to see how much speeds have improved, where download speeds are the fastest at the country and capital level, where 5G deployments have increased and what worldwide 5G coverage looks like now. We also looked at countries where 5G doesn’t yet reach to understand where good news might be on the horizon.

We have only included countries with commercially available 5G on these lists in order to provide a more accurate view of the performance consumers can reasonably expect. While our data shows results for many countries where 5G is not yet commercially available, these tests are likely results from engineers testing their own networks. In addition, we’re only providing analysis for countries with more than 200 samples during Q3 2020. The bars shown in our charts are 95% confidence intervals, which represent the range of values in which the true value is likely to be. Countries marked in tables with an asterisk first launched 5G commercially in 2020.

5G downloads were 954% faster than 4G at the global level

The worldwide median download speed over 5G was 954% faster than that over 4G during Q3 2020. Median upload speed over 5G was 311% faster than that over 4G. Consumers are eagerly adopting the new technology and many have wanted to measure the full throughput capacity of their network connection. In Q3 2020 alone, there were 4,324,788 Speedtest results over 5G.
Median-Speeds-Worldwide_1220-1

United Arab Emirates had the fastest 5G

United Arab Emirates topped the list of countries with the fastest top 10% 5G download speed in Q3 2020. Top 10% (or 90th percentile) measures the speeds seen by the fastest 10% of users and is a way to gauge what each country’s networks are capable of. Saudi Arabia was second for top 10% 5G download speed, Norway third, Spain fourth and Japan fifth.
Fastest-Countries-Top-5G-Download-Speed_1220-2

Another way to measure 5G performance is to look at median 5G download speed, which is a better predictor of the kind of performance most 5G customers can expect. Norway was the country with the fastest median download speed over 5G during Q3 2020. U.A.E. was second in this category, South Africa third, Saudi Arabia fourth and Spain fifth.
Fastest-Countries-Median-5G-Download-Speed_1220-2

It’s notable that Japan was on the list of 10 countries with the fastest top 10% 5G download speed but not on the list of 10 countries with the fastest median download speed over 5G. No matter how fast a country’s mobile infrastructure is, many other factors go into median 5G speeds, including device adoption and spectrum allocation.

Abu Dhabi tops list of 5G speeds in world capitals

Our examination of 5G performance for 18 world capital cities with 5G during Q3 2020 found that Abu Dhabi had the fastest median download speed over 5G at 546.81 Mbps. Riyadh was second, Madrid third, Seoul fourth and Kuwait City fifth. As we saw at the country level, median upload speed was much lower than download speed.
Median-5G-Performance-Capitals_1220-2

How 5G performance and time spent compare within regions

We looked more closely at 5G performance across several intergovernmental organizations and trade blocs to get a better sense of how countries are performing in comparison to their neighbors and trade partners. We also calculated Time Spent on 5G, the proportion of time that users with 5G-capable devices spent on 5G, for each country.

Italy had the fastest 5G among G7 countries, U.S. the slowest

Italy had the fastest median download speed over 5G of all the G7 countries. Japan was second, Canada third, the U.K. fourth and Germany fifth. The U.S. had the highest Time Spent on 5G, followed by Canada. For a deeper analysis of 5G in the U.K., read our previous coverage. Because France launched commercially available 5G only within the last couple of weeks, we have not included it on this table.
5G-Performance-G7-Countries_1220

South Africa was the only country in the African Union with sufficient 5G to rate

As we saw above, South Africa’s impressive median download speed over 5G ranked the country third in the world during Q3 2020. South Africa was only one of two countries in the African Union to have commercially available 5G during Q3 2020. The other, Madagascar, did not have sufficient samples to properly analyze. Time Spent on 5G in South Africa was very low, an indication that 5G is not yet widely available there.
5G-Performance-Africa_1220

South Korea had the fastest 5G in APEC countries, U.S. the slowest

A median download speed over 5G of 411.11 Mbps put South Korea comfortably at the top of Asia-Pacific Economic Cooperation (APEC) countries with the fastest 5G during Q3 2020. Thailand was second, Australia third, China fourth and Taiwan fifth. 5G speeds represented the largest improvement over 4G in the Philippines where the median download speed over 4G during Q3 2020 (9.36 Mbps) was substantially lower than that of other countries on this list.

South Korea and the U.S. tied for highest Time Spent on 5G among APEC countries during Q3 2020, followed by Hong Kong and Taiwan.
5G-Performance-APEC_1220

Spain had the fastest 5G in the E.U., Poland the slowest

Spain showed the fastest median download speed over 5G among the 11 European Union (E.U.) countries with sufficient 5G samples to rank during Q3 2020. Hungary was second, Finland third, Romania fourth and Ireland fifth. Spain’s median download speed over 5G also represented the largest gain over 4G among all of these countries, partially because Spain had the second slowest median download speed over 4G. France is not included on this list because 5G did not become commercially available in the country until after Q3 2020.

The Netherlands had the highest Time Spent on 5G among E.U. countries during Q3 2020, indicating that customers with 5G phones are able to spend far more time on 5G there than in other E.U. countries. Denmark was second for Time Spent on 5G among EU countries in Q3 2020 and Finland third.
5G-Performance-EU_1220

U.A.E had the fastest 5G in Gulf Cooperation Council Countries

With the second fastest median download speed over 5G in the world, U.A.E. was also the Gulf Cooperation Council (GCC) country with the fastest 5G during Q3 2020. Saudi Arabia was second and Qatar third. While Oman does have commercially available 5G, there were insufficient samples in the country during Q3 2020 to properly analyze performance.

5G represented the largest improvement over 4G in Kuwait and Bahrain, countries that had slower median download speeds over 4G than their neighbors.

Time Spent on 5G was relatively high in all the GCC countries on this list, except Bahrain, when compared to other countries in the world during Q3 2020. Qatar showed the highest Time Spent on 5G among GCC countries in Q3 2020 at 16.0%. U.A.E. was second and Saudi Arabia third.
5G-Performance-GCC_1220

Brazil was the only MERCOSUR country with sufficient 5G to rate

Brazil’s median download speed over 5G of 84.60 Mbps during Q3 2020 may not seem fast for 5G, but it still puts Brazil well ahead of other countries in the Southern Common Market (MERCOSUR), most of which do not yet have 5G at all. We did see 5G results in Colombia, but there were insufficient samples to properly compare.

Time Spent on 5G in Brazil during Q3 2020 was not quite one percent, indicating that customers do not have much access to 5G yet.
5G-Performance-MERCOSUR_1220

The U.S., Europe and Asia see widespread 5G coverage

Data from Cell Analytics™ shows a global view of 5G coverage in Q3 2020. This map, based on 5G connectivity data for opted-in Speedtest users, shows that 5G is spreading rapidly across the U.S., Europe, the Arabian Peninsula and Asia. In other regions, 5G is primarily available in larger cities, if at all.
Global-5G-Coverage_1220

99 countries worldwide had 5G, in 14,643 total cities

The number of countries with 5G deployments increased 62.3% between Q3 2019 and Q3 2020, with 99 countries having 5G deployments at the end of Q3 2020, according to the Ookla 5G Map™. There were 14,643 cities worldwide with 5G deployments at the end of Q3 2020, a 1,671% increase over Q3 2019. The total number of deployments worldwide was 17,046. The counts here and throughout this section include commercially available 5G as well as 5G networks with limited availability and those in pre-release.

Countries with the Most 5G Cities
Ookla 5G Map™ | Q3 2020
Country Numbers of Cities with 5G
United States 7,583
Germany 2,312
Austria 1,104
Netherlands* 1,009
Switzerland 554
Thailand* 325
Ireland 214
Puerto Rico 187
United Kingdom 169
Kuwait 97

The U.S. had the most cities with 5G deployments at the end of Q3 2020 with 7,583. Germany was second, Austria third, the Netherlands fourth and Switzerland fifth. A deployment is when a provider has some level of 5G presence in a city. A city can have multiple deployments when more than one provider is present.

Countries with the Largest Growth in Number of Deployments
Ookla 5G Map™ | Q3 2020
Country 5G Deployments as of Q3 2020 % Change Q3 2020 vs Q3 2019
Netherlands* 1,071 50,350%
Thailand* 451 32,401%
United States 7,808 21,566%
Germany 2,417 11,460%
Canada* 93 7,600%
Austria 1,173 4,918%
Ireland 236 4,180%
Poland 81 3,150%
Japan* 75 2,050%
Oman 50 2,000%

The Netherlands showed the largest percentage change in the number of 5G deployments between Q3 2019 and Q3 2020 with a 50,350% jump from two deployments in Q3 2019 to 1,071 in Q3 2020. Thailand saw the second largest percentage increase, the U.S. third, Germany fourth and Canada fifth.

Most early trials and commercial deployments of 5G spectrum allocations around the world have been centered around fallow swaths of the mid-band (3.3 GHz – 4.2 GHz) spectrum. With the recent commercialization of Dynamic Spectrum Sharing (DSS) across all major 5G infrastructure vendors, there is now increasing demand for 5G support on many existing 4G frequencies, ranging from 600 MHz to 2.5 GHz. In unique 5G markets like Japan, there is an additional need for the 4.5 GHz band as well as the millimeter wave (FR2).

In the United States, early deployments leveraged millimeter wave frequency bands in the 28 GHz and the 39 GHz, which delivered impressive speeds in a very constrained footprint. The rapid 5G deployment in the 600 MHz band has added a substantial nationwide 5G footprint — and with that, much wider 5G availability for many more Americans. With the recent merger between T-Mobile and Sprint, the deployment of 2.5 GHz spectrum has been significantly accelerated, which should improve both network efficiency and user experience on T-Mobile’s network. Additionally, next year’s availability of 5G Carrier Aggregation will allow T-Mobile to combine 600 MHz with 2.5 GHz to deliver improved 5G speeds on top of the existing nationwide footprint. In addition, DSS has recently been deployed by AT&T and Verizon, which allows operators to choose from existing low-band spectrum assets (850 MHz) and deliver both LTE and 5G at the same time. This feature alone doesn’t add a significant boost in perceived user experience, but will certainly improve the 5G footprint.

China showed the highest percentage of 5G test samples

Another way to measure 5G adoption is to look at the proportion of samples taken over 5G relative to the total number of samples on all technologies. Speedtest Intelligence is uniquely positioned to measure global growth in 5G because of the worldwide adoption of Speedtest apps. China had the highest percentage of 5G Speedtest results compared to other mobile technology types in Q3 2020 at 18.9%. South Korea was second, Hong Kong third, Puerto Rico fourth and Qatar fifth.

Countries with the Most 5G
Speedtest Intelligence® | Q3 2020
Country 5G Samples as a % of Total
China 18.9%
South Korea 15.8%
Hong Kong (S.A.R.)* 7.9%
Puerto Rico 6.7%
Qatar 5.7%
United States 5.5%
Netherlands* 4.9%
United Arab Emirates 4.6%
Kuwait 4.6%
Australia 4.2%

What 5G will look like in 2021

With recently announced device chipset advancements expected in 2021, including 5G Carrier Aggregation, operators will be able to combine two 5G frequency bands in the sub-6GHz (FR1) range, allowing not only faster speeds, but also greater coverage. More importantly, the ability to combine Frequency Division Duplexing (FDD) and Time Division Duplexing (TDD) FR1 channels will enable operators to leverage low-band frequencies (sub-1GHz) for uplink transmissions (user device to cell site), while combining the low-band with the mid-band (2.5 GHz, 3.5 GHz) on the downlink. This should significantly expand the availability of fast 5G download speeds across larger geographies.

Similarly, DSS — which is a stepping stone to standalone 5G and allows for the simultaneous delivery of 4G and 5G technology on the same spectrum slice — will enable operators to combine already-deployed FDD spectrum with dedicated mid-band spectrum for an enhanced standalone 5G experience. This will unlock the full potential of 5G networks, such as ultra low latency and network slicing, while delivering an improved mobile experience to users.

Where 5G fails to reach

During Q3 2020 Speedtest Intelligence showed 55 countries in the world (with more than 200 samples) where more than 20% of samples were from 2G and 3G connections (combined). These are countries where, in many cases, 5G is still aspirational. As excited as we are about the expansion of 5G, we do not want to see these countries left behind.

Countries That Still Rely Heavily on 2G and 3G Connections
Speedtest Intelligence® | Q3 2020
Country 2G & 3G Samples 4G Samples
Turkmenistan 74.9% 25.1%
Rwanda 52.3% 47.7%
Iraq 49.4% 50.6%
Belarus 46.5% 53.5%
Afghanistan 46.0% 54.0%
Antigua and Barbuda 40.2% 59.8%
Tajikistan 40.2% 59.8%
Suriname 39.7% 60.3%
Haiti 37.7% 62.3%
Syria 37.5% 62.5%
Ghana 36.0% 64.0%
Ethiopia 35.0% 65.0%
Mozambique 34.7% 65.3%
Benin 34.3% 65.7%
Angola 34.1% 65.9%
El Salvador 32.5% 67.5%
Moldova 31.8% 68.2%
Venezuela 30.3% 69.7%
Tanzania 30.0% 70.0%
Papua New Guinea 29.5% 70.5%
Jamaica 29.4% 70.6%
Sudan 29.2% 70.8%
Algeria 29.0% 71.0%
Namibia 28.5% 71.5%
Zimbabwe 28.5% 71.5%
Somalia 28.4% 71.6%
Nicaragua 28.1% 71.9%
Armenia 28.1% 71.9%
Bosnia and Herzegovina 28.1% 71.9%
Uzbekistan 27.8% 72.2%
Cameroon 27.5% 72.5%
Zambia 27.4% 72.6%
Uganda 26.6% 73.4%
Trinidad and Tobago 26.6% 73.4%
Honduras 26.5% 73.5%
Bangladesh 26.3% 73.7%
Burkina Faso 26.0% 74.0%
Ukraine 25.8% 74.2%
Nigeria 25.7% 74.3%
DR Congo 24.6% 75.4%
Costa Rica 24.3% 75.7%
Botswana 24.1% 75.9%
Libya 22.9% 77.1%
Azerbaijan 22.9% 77.1%
Ecuador 22.8% 77.2%
Mali 22.4% 77.6%
Mongolia 21.8% 78.2%
Maldives 21.6% 78.4%
Mauritius 21.3% 78.7%
Tunisia 21.0% 79.0%
Belize 20.7% 79.3%
Laos 20.5% 79.5%
Kenya 20.3% 79.7%
Paraguay 20.1% 79.9%
Côte d’Ivoire 20.0% 80.0%

In markets where 4G layers haven’t been deployed or substantially covered, end users fall back to the circuit-switched network (2G, 3G). These decades-old network technologies should be sufficient for basic voice and texting, social media, and navigation apps, but cannot deliver rich media experiences or video calling. Unfortunately, many countries on this list are places where consumers rely primarily on mobile phones for their internet connectivity.

5G is radically changing the speeds and capabilities of mobile networks around the world. If the current growth rate continues, it won’t be long before most nations have access to 5G. But there are nations and subsets of subscribers who may not see the benefits of 5G for years to come. We will continue reporting on 5G achievements across the globe and watching speeds in general on the Speedtest Global Index™.

Ookla retains ownership of this article including all of the intellectual property rights, data, content graphs and analysis. This article may not be quoted, reproduced, distributed or published for any commercial purpose without prior consent. Members of the press and others using the findings in this article for non-commercial purposes are welcome to publicly share and link to report information with attribution to Ookla.

| November 23, 2020

5G Advances Across the U.K., but Access Varies Widely by Country

The United Kingdom has seen considerable advances in 5G during the past year, but access to this emerging technology continues to be uneven across countries of the U.K. Looking at Q3 2020, data from Speedtest Intelligence® and Ookla Cell Analytics™ reveals how 5G affected overall mobile speeds, which country had the fastest 5G and where access was lacking. We also shed light on which operator had the fastest 5G in the U.K. as a whole and in London, specifically.

5G is 518% faster than 4G in the U.K.

5G speeds in the U.K. far exceeded those on 4G during Q3 2020 with the mean download speed over 5G coming in 517.8% faster than median download speed over 4G. The U.K’s mean upload speed over 5G was 121.5% faster than that over 4G.

Mean Mobile Speeds in the United Kingdom
Speedtest Intelligence® | Q3 2020
5G Download (Mbps) 5G Upload (Mbps) 4G Download (Mbps) 4G Upload (Mbps)
United Kingdom 186.97 21.38 30.26 9.65

Scotland had the fastest 5G download speed

Scotland brought up the national average for 5G speeds in the U.K. during Q3 2020 with a 6.1% faster mean download speed than we saw in the U.K. as a whole. England was the second fastest country in the U.K. for mean download speed over 5G and Wales was third. While 5G download speeds were promising in Northern Ireland, the volume of data did not meet our rigorous sampling guidelines. We’ll be interested to see how speeds there develop as more users access the networks.

Mean Mobile Speeds in the United Kingdom
Speedtest Intelligence® | Q3 2020
5G Download (Mbps) 5G Upload (Mbps) 4G Download (Mbps) 4G Upload (Mbps)
England 184.48 21.49 31.05 9.69
Scotland 198.39 22.05 28.60 9.87
Wales 171.12 21.49 26.26 9.02

Three was the fastest operator for 5G in the U.K.

As we’ve previously reported, 3 was the fastest mobile operator over 5G in the U.K during Q3 2020 with a median download speed of 201.12 Mbps. EE had the highest percentage of 5G Time Spent (when subscribers’ 5G-capable devices are connected to 5G).

How operators in the U.K. are using spectrum for 4G

The distribution of low, mid and high spectrum bands is evenly spread across all mobile operators in the U.K. All four operators hold licenses in the 800 MHz frequency band, while Vodafone and O2 hold additional 900 MHz licenses — some of which are still used to support the legacy 2G and 3G services. Three and Vodafone hold 20 MHz each of the 1500 MHz supplemental downlink band 32, and all four operators hold 1800 MHz and 2100 MHz licenses. It’s worth noting that EE holds a massive 40 MHz contiguous slice in the 1800 MHz band and 20 MHz in the 2100 MHz band.

O2 holds an additional 40 MHz contiguous spectrum block in the 2300 MHz (TDD) band. In the 2600 MHz capacity band, O2 holds a single 20 MHz block, Vodafone holds two 20 MHz blocks, while EE operates on a whopping 50 MHz slice of spectrum.

Given the spectrum distribution in the mid- and high-capacity bands, and the increased proliferation of devices with modern chipsets capable of aggregating multiple LTE component carriers, it’s fairly easy to see why EE has been able to consistently deliver the fastest LTE speeds in recent years.

5G-specific spectrum allocation in the U.K.

When it comes to 5G, all operators have deployed 5G non-standalone networks in the 3.5GHz to 3.6GHz band (n78). EE and O2 operate their 5G networks using 40 MHz slices, Vodafone holds a 50 MHz license, while 3 was able to secure a 100 MHz license during the 5G auction — the largest possible channel width defined for FR1 networks. Given the massive advantage over its 5G competitors, 3 is able to consistently deliver the fastest 5G speeds.

The upcoming Ofcom spectrum auction in early 2021 should offer additional capacity in the 3.6-3.8 GHz range as well as the 700 MHz band, which should enable much wider 5G coverage across the U.K. Devices capable of aggregating low and mid 5G spectrum bands are also expected in the first half of 2021, which should allow operators to efficiently roll out standalone 5G and deliver broader 5G coverage with even faster speeds and ultra low latency.

England has the majority of 5G deployments in the U.K.

The Ookla 5G MapTM showed 5G deployments in 199 cities or towns in the U.K. as of November 4, 2020. 5G was commercially available in 176 English cities, and there were 14 5G cities or towns in Scotland, five in Wales and four in Northern Ireland.

This compares with 29 5G cities in the whole U.K. at this time last year: 22 in England, three each for Scotland and Wales and one in Northern Ireland.

Ookla_UK_5G_Deployment_Map_1120

5G coverage varies by operator

Not all operators are deploying 5G cell sites in the same areas. Data from Cell Analytics measures where customers of each operator are accessing 5G and how strong that 5G signal is in each area. The following maps show 5G signal strength greater than -110 dBm for each operator.

Ookla_UK_Coverage_3_1120

Ookla_UK_Coverage_EE_1120-3

Ookla_UK_Coverage_O2_1120-3

Ookla_UK_Coverage_Vodafone_1120-3

Three and EE show larger areas of measured coverage in most parts of the U.K., especially in and around Belfast, Birmingham and London. Vodafone shows a larger area of coverage around Glasgow and Newcastle upon Tyne. O2 shows a much smaller coverage area with clusters in and around Belfast, Leeds and London.

London’s 5G download speed was slower than the national average

London saw a mean download speed over 5G of 167.06 Mbps in Q3 2020, 10.6% slower than that in the U.K. as a whole. London’s median 5G upload speed of 22.92 Mbps was 7.2% faster than that in the U.K as a whole.

Mean 5G Performance in London
Speedtest Intelligence® | Q3 2020
Download (Mbps) Upload (Mbps)
London 167.06 22.92

We’d like to be able to report which country’s capital city had the fastest 5G, but this technology is still emerging and there were not enough samples to responsibly determine a winner outside of London. We will be watching these markets carefully and will report back when there is additional information.

Three was the fastest operator in London

Three showed the fastest mean download speed over 5G among mobile operators in London during Q3 2020. O2 was second, an important distinction as many other data providers do not have sufficient samples to include O2 in their analyses. Vodafone was third and EE fourth.

5G Performance by Operator in London
Speedtest Intelligence® | Q3 2020
Operator Mean Download (Mbps) Mean Upload (Mbps) Top 10% Download (Mbps) Top 10% Upload (Mbps)
3 196.02 18.93 362.46 43.74
O2 181.19 15.55 289.65 24.35
Vodafone 166.77 25.50 288.17 41.42
EE 142.86 26.83 245.73 52.21

We also analyzed the fastest 10% of Speedtest results over 5G for each operator to evaluate what speeds each network is capable of reaching at this time. Three had the fastest download speed in this category by far and EE led for upload speed.

England showed the highest time spent on 5G

Ookla_UK_5G_Time-Spent_Map_1120-3

We calculated the proportion of time that users with 5G-capable devices spent on 5G in the United Kingdom and found that England had the highest 5G Time Spent during Q3 2020 at 5.6%. This was higher than the average 5G Time Spent for the U.K. of 5.3%. Scotland had the second highest 5G Time Spent in the U.K. at 3.0% and Wales was third. As above, we have not included data for Northern Ireland because samples were too few. 5G Time Spent includes time spent on both 5G and 5G roaming.

While the rapid spread of 5G across the U.K. is exciting and speeds are promising, the benefits of 5G are spread unevenly across the nation — and time spent on 5G is still very low. We’ll be excited to see this technology expand and to analyze how 5G improves mobile performance across the U.K.

Ookla retains ownership of this article including all of the intellectual property rights, data, content graphs and analysis. This article may not be quoted, reproduced, distributed or published for any commercial purpose without prior consent. Members of the press and others using the findings in this article for non-commercial purposes are welcome to publicly share and link to report information with attribution to Ookla.

| October 22, 2020

ICYMI: Ookla Data and Research from September 2020

Highlights from the Speedtest Global IndexTM

Global-Index-Tweet-Image-Sept-2020
These are the top stories from September 2020:

  • Croatia is back up to 11th place on mobile after a two-month slump.
  • Denmark’s relatively steady increase in fixed broadband speeds over the last 13 months has them ranked seventh.
  • There was no change in the rankings of the top four countries on mobile and the top three on fixed broadband from August.

New Market Analyses

Canada

TELUS showed the fastest Speed Score on mobile during Q3 2020 while Rogers was fastest on fixed broadband. Québec City had the fastest mean mobile download speed while London was fastest for fixed broadband.

Malaysia

Maxis had the fastest Speed Score on mobile during Q1-Q2 2020 while TIME was fastest for fixed broadband. Nusajaya had the fastest mean download speed over mobile while Shah Alam was fastest for fixed broadband.

Taiwan

Chunghwa Telecom showed the highest 4G Availability in Taiwan during Q1-Q2 2020.

Turkey

Turkcell was the fastest mobile provider in Turkey during Q3 2020 while Turksat Kablo was the fastest ISP.

United Kingdom

EE had the fastest Speed Score on mobile during Q3 2020 while Virgin Media was fastest on fixed broadband. Three showed the fastest median download speed on 5G. Cardiff had the fastest mean download speed on mobile while Edinburgh was fastest for fixed broadband. Read our latest article debunking misleading claims in the U.K.

United States

AT&T was the fastest mobile operator in the U.S. during Q3 2020 while Verizon was the fastest fixed broadband ISP. Fort Wayne, Indiana had the fastest mobile download speed on our list and Austin, Texas was the fastest city for fixed broadband.

Articles worth a second look

Announcing Ookla Open Datasets

map
This is your chance to crunch Ookla’s data on global network performance. Use our new open dataset to create a project that illustrates internet performance where you live.

How Georgia is Leveraging Cell Analytics to Enable Virtual Classrooms

classroom
Ookla helped the Georgia Department of Education to find the best locations to deploy school buses with mobile Wi-Fi hotspots to bridge the connectivity gap for remote learning.

Read our latest white paper

How to Improve In-Building Network Performance and Coverage with Crowdsourced Data

buildings
This guide for RAN engineering teams will show you how to use crowdsourced data to analyze in-building network performance and coverage — and how to prioritize the network improvements that have the most impact on your customers.

Ookla retains ownership of this article including all of the intellectual property rights, data, content graphs and analysis. This article may not be quoted, reproduced, distributed or published for any commercial purpose without prior consent. Members of the press and others using the findings in this article for non-commercial purposes are welcome to publicly share and link to report information with attribution to Ookla.

| September 17, 2020

In Case You Missed It (ICYMI): Ookla Data and Analysis from August 2020

Welcome to this first edition of our monthly digest, where we’ll share highlights from the Speedtest Global IndexTM and links to recent articles of note.

Highlights from the Speedtest Global Index

Global-Index-Tweet-Image-Aug-2020

Every month the Speedtest Global Index tracks mobile and fixed broadband speeds across the world. These are the top stories from August 2020:

  • China moved up to second place on mobile for the first time
  • Denmark jumped 14 places on mobile, recovering from a July dip
  • Hungary was back in the top ten for fixed broadband for the first time since November 2019

Articles worth a second look

Introducing New 3D Views of Network Performance and Coverage in Cell Analytics

New 3D “z-axis” views in Cell Analytics allow mobile network operators to spot problems at specific elevations.

Exploring the Relationship Between Network Performance and NPS in Taiwan

Learn how customers’ ratings of mobile operators in Taiwan compare to the speeds they are receiving.

SpatialBuzz Joins Ookla

Ookla acquires SpatialBuzz.

How to Ensure Your Internet is Ready for Back to School

Tips for students, teachers, parents and administrators to troubleshoot internet connectivity for back to school.

Ookla retains ownership of this article including all of the intellectual property rights, data, content graphs and analysis. This article may not be quoted, reproduced, distributed or published for any commercial purpose without prior consent. Members of the press and others using the findings in this article for non-commercial purposes are welcome to publicly share and link to report information with attribution to Ookla.

| August 19, 2020

How to Ensure Your Internet is Ready for Back to School

Autumn means back to school in the Northern Hemisphere, and this year many students’ classroom experience will be at least partially digital. This transition could place a major strain on network infrastructure both at schools and in homes, so we’ve gathered some information to help teachers, students and administrators stay virtually connected.

Internet speed matters

Video conference platforms like Zoom and Google Meet only work well when connected to adequately fast internet. Zoom suggests download and upload speeds of at least 3 Mbps for sending 1080p HD video. Google support documentation recommends having both upload and download speeds of at least 3.2 Mbps for group video meetings with multiple participants.

Take a Speedtest® to ensure that your download and upload speeds are at least 3 Mbps. If your connection is not delivering the speed you need, call your internet service provider.

speedtest-desktop800

More users = less speed

Every new user you add to an internet connection places additional strain on the connection, potentially slowing it down. This is true if you’re a school administrator trying to support multiple teachers streaming from one building. It’s also true if you’re a parent trying to set up multiple remote classrooms in addition to a remote office for yourself.

When measuring the speed of your connection, try connecting all the users to your network at the same time and have them use the network in the way they normally would to see what the throughput really is.

Make sure your modem is up to date

Older modems can be a bottleneck when it comes to internet speeds. In general, if your modem is more than three years old, it might be time for an upgrade. If you’re using a cable modem, you’ll want to look for one that supports DOCSIS 3.1. A DOCSIS 3.1 modem is able to bond multiple frequency channels, offering faster speeds and a more reliable connection. If your ISP supports the technology, you can get even faster speeds by upgrading to a DOCSIS 4.0 modem, but this is not yet universally available.

Replace your modem if it’s more than three years old. Look for DOCSIS 3.1 if you’re upgrading a cable modem.

Wi-Fi can add to your woes

Your router could be slowing you down

Choose a router that supports 802.11ax (802.11ac if you want to drop the price point a bit). You’ll need an up-to-date computer to get the most power out of 802.11ax, but 802.11 is generally backwards compatible. That means you should get improved service with a modern router. Over the years, improved router standards have included wider channel bandwidth (up to 160 MHz), denser constellation and additional spatial streams over previous versions that can keep your Wi-Fi router from becoming a bottleneck.

Look for a router that supports 802.11ax (or at least the most up-to-date standard that your computer can handle).

More antennas mean more speed

The number of transmitting and receiving antenna elements directly affects the ability to extract and process multiple spatial streams out of a single transmission.

Check the number of antennas on your router. More = better.

Wi-Fi extenders can be problematic

wifi-waves
As nice as it is to set up your classroom anywhere in the house or garden, Wi-Fi extenders are notorious for slowing down connections because everything you transmit over your network needs to be sent multiple times. If you cannot run enough wired connections for every user in your space, use traditional Wi-Fi extenders with caution.

Many of the challenges of bolting a Wi-Fi extender onto an existing network can be solved by replacing your existing Wi-Fi access point(s) with a mesh system. Place these devices around your home and they will automatically tune themselves to use the appropriate channels to ensure you are getting the best possible coverage. These mesh points generally use one channel to communicate back to the wired base station and an entirely different channel to communicate with your devices. This allows them to minimize potential interference, and automatically adjust coverage to best suit your needs.

Instead of using a traditional Wi-Fi extender, look to a Wi-Fi mesh system that can more intelligently select channels and route traffic.

Gigahertz matter

Many Wi-Fi setups let you choose between 2.4 GHz and 5 GHz. 2.4 GHz is best for connecting with older devices and when you want the farthest range possible. 5 GHz offers faster speeds and less interference, but it requires your devices to be closer, or have line of sight, to the base station. To get a better connection, especially if you’re using 2.4 GHz, move away from cordless phones, microwaves, baby monitors, Bluetooth devices, and anything that could be broadcasting a signal.

Choose 5 GHz if you’re close to the wireless access point and need speed or are worried about interference. Choose 2.4 GHz for older computers or devices that are farther away from the access point.

Is the service even working?

Like taking a deep breath, make sure to check Downdetector before assuming that your personal setup has failed if a class blinks out. Many online services will be tested in ways never before considered as everyone heads back to school, and outages will likely happen. Possible points of failure include the video conference software and your internet service provider, so use the Downdetector homepage (on your phone if needed) to check what’s down — before you start turning everything off and on again.

Check Downdetector before you assume the error is on your end.

dd-screen-2

This year will be an adjustment as much as an adventure. We hope these tips can help you make the most of your virtual learning experience. For additional help with your remote setup, read this article.

Ookla retains ownership of this article including all of the intellectual property rights, data, content graphs and analysis. This article may not be quoted, reproduced, distributed or published for any commercial purpose without prior consent. Members of the press and others using the findings in this article for non-commercial purposes are welcome to publicly share and link to report information with attribution to Ookla.