| December 20, 2021

Starlink Expands but Q3 2021 Performance Flattens in Some Areas


Satellite internet is making headlines across the globe as Starlink continues to launch service in new countries and Viasat plans to acquire Inmarsat. We’re here to check in on our ongoing series on satellite internet performance around the globe with fresh data from Q3 2021 to see if Starlink’s performance is holding up and how satellite internet compares to fixed broadband in 12 countries.

United States: Starlink fastest, speeds decreasing

Consumers in the U.S. looking to use satellite service to connect to the internet will find that performance was mostly flat when comparing Q3 2021 to Q2 2021. Starlink’s median download speed decreased from 97.23 Mbps during Q2 2021 to 87.25 Mbps in Q3 2021, which could be a function of adding more customers. HughesNet followed distantly at 19.30 Mbps (comparable to the 19.73 Mbps we saw in Q2 2021) and Viasat third at 18.75 Mbps (18.13 Mbps in Q2 2021). For comparison, the median download speed for all fixed broadband providers in the U.S. during Q3 2021 was 119.84 Mbps (115.22 Mbps in Q2 2021).

ookla_satellite-performance_us_1221-01-1

Starlink’s median upload speed of 13.54 Mbps (down from 13.89 Mbps in Q2 2021) was much closer to that on all fixed broadband (18.03 Mbps in Q3 2021 and 17.18 Mbps in Q2 2021). Viasat and HughesNet followed at 2.96 Mbps (3.38 Mbps in Q2 2021) and 2.54 Mbps (2.43 Mbps in Q2 2021), respectively.
As we saw last quarter, Starlink, which uses low earth orbit (LEO) satellites, was the only satellite internet provider with a median latency anywhere near that seen on fixed broadband in Q3 2021 (44 ms and 15 ms, respectively). Viasat and HughesNet, which both utilize higher “geosynchronous” orbits, had median latencies of 629 ms and 744 ms, respectively.

Starlink performance varies at the county level

We saw sufficient samples during Q3 2021 to analyze Starlink performance in 304 counties in the U.S. While there was about a 100 Mbps range in performance between the county with the fastest median download speed (Santa Fe County, New Mexico at 146.58 Mbps) and the county with the slowest median download speed (Drummond Township, Michigan at 46.63 Mbps), even the lower-end speeds are well above the FCC’s Baseline performance tier of at least a 25 Mbps download speed.

ookla_united_states_median_download_starlink_map_1221g-01-1

Satellite internet performance elsewhere in the world

We examined satellite internet performance in countries with an established market share to see how well their speeds compare to local fixed broadband. We’re excited to add analysis on satellite performance in Australia and Belgium this quarter.

Australia: Starlink outperformed Viasat and fixed broadband average

Starlink radically outperformed Viasat in Australia during Q3 2021 with a median download speed of 138.12 Mbps to Viasat’s 15.60 Mbps. Starlink also outpaced Viasat for median upload speed at 22.63 Mbps and 1.04 Mbps, respectively. Compared to the median download speed over all fixed broadband of 51.17 Mbps, Starlink could be an attractive alternative to traditional fixed broadband on all levels except latency where Starlink showed 42 ms vs. 10 ms for all fixed broadband combined.

ookla_satellite-performance_au_1221-01-1

Belgium: Starlink dramatically faster than fixed broadband

Starlink’s median download speed of 127.46 Mbps during Q3 2021 was dramatically faster than the country’s median download for all fixed broadband of 72.90 Mbps. At 16.73 Mbps, Starlink’s median upload speed was only slightly slower than the overall median of 17.98 Mbps. However, Starlink’s 49 ms latency was higher than the country’s average of 13 ms. Starlink was the only satellite internet provider with adequate samples to analyze in Belgium during Q3 2021.

ookla_satellite-performance_be_1221-01

Brazil: Viasat close to national average

Viasat’s median download speed in Brazil improved to 66.32 Mbps during Q3 2021 (up from 60.30 Mbps in Q2 2021. This was close to the national median for fixed broadband of 71.50 Mbps. Viasat’s median upload speed (1.06 Mbps) was much slower, however, than that on fixed broadband (36.37 Mbps), and Viasat’s latency was much higher (615 ms vs 6 ms).

ookla_satellite-performance_br_1221-01-1

Canada: Starlink performance relatively flat

Our previous article showed that Starlink’s median download speed exceeded that of fixed broadband in Canada during Q2 2021 (86.92 Mbps vs. 84.24 Mbps). In Q3 2021, Starlink’s median download speed decreased slightly to 84.55 Mbps while that over all fixed broadband increased to 90.67 Mbps. This is in line with what we expect to see on new technologies as additional users are added to a system. Starlink’s median upload speed was slower than fixed broadband (13.87 Mbps vs. 20.67 Mbps). Latency on Starlink was much higher (56 ms vs. 12 ms). Starlink is still a viable alternative to fixed broadband in Canada, especially for consumers without access to other options.

ookla_satellite-performance_ca_1221-01-1

Starlink faster than overall fixed broadband in 5 provinces

Starlink showed enough samples to analyze performance in nine out of 10 provinces in Canada during Q3 2021. Starlink’s Q3 2021 median download speed was faster than the median for all fixed broadband in five provinces: Manitoba (81.04 Mbps vs. 65.91 Mbps), Nova Scotia (109.60 Mbps vs. 99.82 Mbps), Prince Edward Island (118.02 Mbps vs. 46.86 Mbps), Quebec (92.59 Mbps vs. 72.07 Mbps) and Saskatchewan (97.67 Mbps vs. 57.59 Mbps). Download speeds were comparable between Starlink and overall fixed broadband in New Brunswick (104.56 Mbps vs. 104.28 Mbps), and overall fixed broadband was faster than Starlink in Alberta (92.65 Mbps vs. 82.48 Mbps), British Columbia (111.36 Mbps vs. 87.34 Mbps) and Ontario (86.26 Mbps vs. 79.54 Mbps).

ookla_canada_median_download_starlink_map_1221g-01

Chile: HughesNet slower than fixed broadband average

HughesNet was hard pressed to compete with Chile’s fixed broadband, which ranked fourth in the world during October 2021. HughesNet showed a 15.21 Mbps median download speed compared during Q3 2021 with the country’s fixed broadband average of 133.81 Mbps during the same period. Median upload speeds also showed a wide gap (3.50 Mbps for HughesNet to 62.18 Mbps on fixed broadband), and HughesNet’s latency was very high (626 ms vs. 8 ms).

ookla_satellite-performance_cl_1221-01-1

Colombia: HughesNet slow but improving

HughesNet’s median download speed increased in Q3 2021 to 12.12 Mbps (up from 9.28 Mbps during Q2 2021), compared with Colombia’s 46.08 Mbps for fixed broadband overall (35.90 Mbps in Q2 2021). Median upload speed was also slower using the satellite internet provider (3.05 Mbps) than fixed broadband (10.50 Mbps), and latency was much higher on satellite (753 ms vs. 15 ms).

ookla_satellite-performance_co_1221-01-1

France: Starlink speeds decreasing, remains faster than fixed broadband average

Starlink users in France saw a median download speed of 102.15 Mbps in Q3 2021 (down from 139.39 Mbps in Q2 2021, likely due to increased usage). Starlink’s download speed easily beat the country-wide median for fixed broadband of 75.47 Mbps (up from 70.81 Mbps in Q2 2021). Starlink’s upload speed during Q3 2021 was slower than the fixed broadband median (19.84 Mbps vs. 56.66 Mbps), and Starlink’s latency was higher (54 ms vs. 13 ms).

ookla_satellite-performance_fr_1221-01

Germany: Starlink faster than country average for fixed broadband

Starlink’s median download speed in Germany of 95.40 Mbps was much faster than the country median of 60.99 Mbps during Q3 2021. Starlink was slightly slower for upload speed than overall fixed broadband (17.63 Mbps vs. 21.05 Mbps) and Starlink showed a higher latency (45 ms vs. 15 ms).

ookla_satellite-performance_de_1221-01-1

Mexico: Viasat faster than HughesNet for downloads

Viasat, with a median download speed of 14.94 Mbps during Q3 2021 (up from 13.95 Mbps in Q2 2021), was faster than HughesNet (10.64 Mbps in Q3 2021, down from 11.92 Mbps in Q2 2021) but slower than the country’s median for fixed broadband (33.14 Mbps in Q3 2021, 29.99 Mbps in Q2 2021). HughesNet was slightly faster than Viasat for upload speed during Q3 2021 (3.21 Mbps vs. 2.03 Mbps). While Viasat’s latency was high (675 ms vs 12 ms for fixed broadband), it was lower than HughesNet’s (748 ms).

ookla_satellite-performance_mx_1221-01-1

New Zealand: Starlink slowed slightly, remained faster than fixed broadband average

Starlink’s Q3 2021 median download speed (120.10 Mbps, down from 127.02 Mbps in Q2 2021, likely due to increased usage) was much faster than New Zealand’s median fixed broadband download speed (84.98 in Q3 2021 up from 78.85 Mbps in Q2 2021). Starlink was slower than New Zealand’s overall fixed broadband for Q3 2021 upload speed (16.87 Mbps vs. 23.62 Mbps). While Starlink’s median latency improved from 101 ms in Q2 2021 to 81 ms in Q3 2021, it was still slower than New Zealand’s median for all fixed broadband of 7 ms during Q3 2021.

ookla_satellite-performance_nz_1221-01-1

United Kingdom: Starlink nearly twice as fast as fixed broadband average

Starlink showed a much faster median download speed in the U.K. during Q3 2021 (111.66 Mbps, up from 108.30 Mbps in Q2 2021) than the country’s median for fixed broadband (53.16 Mbps in Q3 2021, up from 50.14 Mbps in Q2 2021). Starlink’s upload speed was comparable to the median for all fixed broadband in the U.K. (16.02 Mbps vs. 15.77 Mbps), and the latency was pretty good, given the distance traveled (37 ms vs. 15 ms).

ookla_satellite-performance_uk_1221-01-1

We look forward to updating this data again next quarter with new locations as satellite internet continues to become a more viable option for many. If you’re using satellite internet, take a Speedtest to help us provide an accurate picture of real-world performance.

Ookla retains ownership of this article including all of the intellectual property rights, data, content graphs and analysis. This article may not be quoted, reproduced, distributed or published for any commercial purpose without prior consent. Members of the press and others using the findings in this article for non-commercial purposes are welcome to publicly share and link to report information with attribution to Ookla.

| February 22, 2023

Starlink Resurgence? Speeds Increase in Europe and Oceania

Ookla® is back with exciting, fresh data from Q3 and Q4 2022 for SpaceX’s Starlink and Sky Logic in Europe and Oceania, as well as new Starlink markets we haven’t yet featured in our ongoing series on satellite internet. With the FCC greenlighting Amazon’s Project Kuiper and many other exciting satellite developments launching this year, we’re certain all eyes will be on the sky in 2023 as new orbital connectivity options become available for consumers.

This analysis includes Starlink results from six new countries, and data for Starlink and Sky Logic in Europe and Starlink in Oceania. We also examine how Starlink’s internet performance has changed over the past year in Australia, Austria, Belgium, Croatia, France, Germany, Ireland, Italy, the Netherlands, New Zealand, Poland, Portugal, and the United Kingdom.

Starlink is mostly speeding up again from Q3 to Q4 2022, but is still slower than a year ago

As Starlink rides the wave of becoming an increasingly popular connectivity option for consumers, we’ve seen the service speed up and then slow down year-over-year in most markets. However, Q4 2022 data shows many countries are experiencing a modest rise in median download speeds when compared to Q3 2022. That’s encouraging for consumers, especially as Starlink hit over 1 million users in Q4 2022, and could be a sign that Starlink seems to be maturing its constellation’s capacity. That’s particularly intriguing as Starlink launches more next-gen satellites, which were first deployed at the tail end of Q4 2022 and will most likely show up in Q1 2023 results.

In Europe, all the countries we evaluated for year-over-year median download speeds were slower for Q4 2022 than Q4 2021 when there were fewer users on each network. Most countries showed between 10-20% slower speeds in Q4 2022 than what users experienced in Q4 2021, including Ireland (at least 11% slower), Austria (at least 13%), Portugal (at least 14%), Italy (at least 15%), Germany (at least 16%), and the U.K. (at least 19%). Users in France saw very similar speeds year over year, with just a 4% decrease from Q4 2021 to Q4 2022, while users in Poland saw a large decrease (at least 56% slower), and users in the Netherlands (at least 21%) and Belgium (at least 28%) saw substantial decrease during the same period.

In Oceania, Starlink year-over-year results were mixed, with Starlink’s download speed in Australia 24% slower in Q4 2022 than during Q4 2021, while in New Zealand it was 4% faster in Q4 2022 than Q4 2021.

Starlink in Denmark and Switzerland had the fastest satellite internet in Europe during Q4 2022

Speedtest Intelligence® reveals there was no fastest satellite provider in Europe during Q4 2022, though Starlink in Denmark (147.52 Mbps) and Switzerland (136.03 Mbps) led the pack for fastest median download speed. In all, Starlink download speeds were faster than 100 Mbps in 10 out of 15 European countries during Q4 2022 — a rise from just five out 15 in Q3 2022. 

Starlink outperformed fixed broadband providers over download speed in eight countries, including: Austria (105.67 Mbps), Belgium (104.84 Mbps), Croatia (102.99 Mbps), Czechia (64.67 Mbps), Germany (94.37 Mbps), Ireland (103.39 Mbps), Italy (101.06 Mbps), and the U.K. (96.79 Mbps). Fixed broadband providers were faster than satellite providers analyzed in Denmark, France, Netherlands, and Poland. Results were too close to call in Sweden with fixed providers at 106.73 Mbps and Starlink at 101.83 Mbps, as well as Portugal with Starlink at 108.02 Mbps and fixed broadband at 117.97 Mbps. Skylogic was too close to call between the median fixed broadband speed in Italy at 55.50 Mbps to 59.40 Mbps, and had download speeds faster than 40 Mbps in France (44.46 Mbps) and Sweden (48.09 Mbps).

For upload speeds, every country’s combined fixed broadband providers had faster median upload speeds than every satellite provider, though Starlink in Portugal had the fastest upload speed among satellite providers at 20.86 Mbps. All Starlink upload speeds ranged between 10-20 Mbps except Poland (9.79 Mbps) and Denmark (8.04 Mbps). 

Multi-server latency for all satellite providers was higher than fixed broadband providers in every European country in Q4 2022, which ranged from 12.34 ms in Sweden to 23.46 ms in Italy. However, Starlink had a median multiserver latencies of less than 60 ms in the U.K. (53.24 ms), Portugal (56.81 ms), and the Netherlands (58.85 ms). Most latencies were between 60-75 ms, with Poland having the highest latency at 86.46 ms — still low enough to have a good quality of experience and be able to video chat.

Starlink in New Zealand was the fastest satellite provider in Oceania

During Q4 2022, Starlink in New Zealand had the fastest median download speed among satellite providers in Oceania at 124.72 Mbps, followed by Starlink in Australia (106.43 Mbps), and Starlink in Tonga (35.15 Mbps). However, New Zealand fixed broadband outperformed Starlink, while Starlink in Australia outperformed fixed broadband providers. In Tonga, speeds were too close to call. 

Speedtest Intelligence shows Starlink falling behind fixed broadband providers for median upload speeds in New Zealand (16.89 Mbps) and Australia (11.38 Mbps), while Tonga was again too close to call.

Multi-server latency was higher over Starlink than fixed broadband in all three countries we surveyed in Oceania during Q4 2022. However, Starlink’s median latency was under 50 ms in New Zealand (48.11 ms), which is a very exciting development for consumers, especially with latency becoming an increasingly important metric. Starlink latency in Australia was higher at 65.52 ms, while Tonga followed at 88.81 ms.

New Q4 2022 Starlink countries show very promising results

Speedtest Intelligence shows the six new countries where we found new Starlink data are off to a roaring start in Q4 2022, which include Bulgaria, Finland, Jamaica, Japan, Latvia, and Malta. Starlink had faster median download speeds than the country’s respective fixed broadband providers combined in two countries: Bulgaria (110.76 Mbps versus 65.69 Mbps), and Jamaica (87.43 Mbps vs. 48.34 Mbps), while results were too close to call in the remaining four markets. However, Starlink showed promising 100+ Mbps speeds in Japan (156.94 Mbps), Finland (102.70 Mbps), and Malta (101.36 Mbps). 

Median upload speeds for Starlink lagged behind fixed broadband providers in all markets, though Malta was too close to call (20.40 Mbps for Starlink and 20.25 Mbps for fixed broadband). Starlink upload speeds ranged from about 14 Mbps to 20 Mbps in every market.

Consumers and enterprises stand to benefit from satellite developments in 2023

Starlink dominated headlines in 2022 — and for good reason. They’ve gained over 1 million users worldwide, will be available in connected vehicles, planes, RVs, and ships, partnered with T-Mobile to bring Starlink to mobile devices, and launched their second-gen satellites at the end of 2022. But that could very seriously change in 2023 with multiple competitors deploying major offensives in the satellite market. We’ll say it again: there is a new space race for connectivity being waged, and we’re just at the tip of what’s to come.

Here are some major updates about what’s next for various different satellite competitors:

Amazon’s Project Kuiper approved by the FCC

The biggest news concerning satellite connectivity is the FCC approving Amazon’s Project Kuiper constellation, which will include 3,236 satellites in an LEO array. On two fronts, this poses two potential challenges for Starlink: on one hand, Amazon has the global reach, scale, and consumer base that being one of the largest companies in the world provides. On the other, Blue Origin is a direct competitor of SpaceX, and won’t have to rely on the service or other vendors to launch their array into space. Amazon is in a good position to compete and Project Kuiper could become a major player if their prototypes, which will be launched in early 2023, reach speeds anywhere close to competing with broadband internet. 

Viasat set to launch Viasat-3 arrays around April 8, 2023

Long-term incumbent satellite internet provider, Viasat, has a big year ahead after years of planning and providing connectivity to remote locations around the world. Viasat is finally set to launch its Viasat-3 array, which aims to provide 1 Terabit per second (Tbps) of network capacity on each satellite, allowing its users to experience 100+ Mbps connections; that’s a huge improvement for the mainly GEO provider. While consumers likely won’t see these results until Q4 2023, we’re very excited to see how Viasat improves its network.

Eutelsat’s merger with OneWeb approved by Eutelsat board, second-gen array being planned

One of the biggest mergers in recent years among satellite providers has jumped a major hurdle and was approved by the Eutelsat board. While the combined entities still have to be approved by shareholders and regulators, this merger could expand both companies’ market share, particularly in India, which has fast become an important satellite market. Furthermore, OneWeb is already planning a second-gen satellite, which they’re aiming to launch in 2025.

European Commission forges ahead on Constellation Iris

The European Union has been working to create its own satellite constellation since 2020, and during November 2022, agreed to a plan to commit €2.4 billion for a third satellite array named Iris, in addition to Galileo and Copernicus. The project, which includes GEO, MEO, and LEO arrays, will help support EU connectivity priorities including the economy, environment, security, and defense, and is hoping to launch in 2024, and be fully operational by 2027.

HughesNet aiming to launch Jupiter 3 array in H1 2023

Incumbent satellite internet provider HughesNet is planning to launch its new Jupiter 3 array in the first half of 2023, which will help expand its network capacity, “doubling the size of the Hughes JUPITER fleet over North and South America.” While the Jupiter 3 array will still be a GEO constellation, the added network capacity will alleviate congested networks and give consumers more bandwidth to use the internet.

Ookla will continue monitoring new satellite internet developments

As 2023 continues to shape up as a pivotal year for satellite internet providers, we’ll be watching the sky to make sure providers are providing the connectivity consumers need. We’ll continue our series next quarter with Q4 2022 and Q1 2023 data from North and South America and any new countries where Starlink launches, and be back with Europe and Oceania data in Q3 2023. In the meantime, be sure to download the Speedtest® app for Windows and Mac computers or for iOS or Android for devices and see how your satellite internet stacks up to our findings.

Ookla retains ownership of this article including all of the intellectual property rights, data, content graphs and analysis. This article may not be quoted, reproduced, distributed or published for any commercial purpose without prior consent. Members of the press and others using the findings in this article for non-commercial purposes are welcome to publicly share and link to report information with attribution to Ookla.

| September 20, 2022

Starlink Slowed in Q2, Competitors Mounting Challenges

Ookla® has covered SpaceX’s Starlink satellite internet for over a year now with our ongoing series on satellite internet performance. We’ve seen Starlink launch in new locations across the world, and while some speeds have shown signs of slowing down from their initial launches, the newly announced T-Mobile partnership with Starlink could extend the benefit of satellite connections to the mobile market.

Today, we have fresh data on satellite performance during Q2 2022 in Europe, Oceania, North America, and South America. This analysis includes results from eight additional countries, two new providers, and expanded data for Starlink, HughesNet, and Viasat. We also examine how Starlink’s internet performance has changed over the past year in Canada, France, Germany, New Zealand, the United Kingdom, and the United States.

Starlink speeds decreased in every country we surveyed over the past year as more users sign up for service

Chart of Starlink performances in select countries

Speedtest Intelligence® reveals that median download speeds for Starlink fell across Canada, France, Germany, New Zealand, the U.K, and the U.S., dropping between 9% and 54% from Q2 2021 to Q2 2022 as more users signed up for the service. However, Starlink still reached a median download speed of at least 60 Mbps in North America during Q2 2022, which is more than enough for at least one connected device to do most everything on the internet including streaming video, downloading games, and chatting on video with friends and family.

Upload speeds also slowed on Starlink, with speeds decreasing across all of the countries we’ve tracked over the past year. Latency fared a little better with latency remaining relatively flat (though high when compared to fixed broadband) in most countries. New Zealand was the outlier, with latency dropping 23 ms. For most users, we still suspect these dips are still worthwhile for areas that have no service, slow service, or few affordable options for fast internet.

Starlink in Puerto Rico was the fastest satellite provider in North America

Chart of Satellite performance versus fixed broadband internet in North America

Starlink in Puerto Rico had the fastest satellite internet in North America during Q2 2022 with a median download speed of 112.22 Mbps, followed by Starlink in Mexico (80.17 Mbps), Canada (75.73 Mbps), and the U.S. (62.53 Mbps). Starlink in Puerto Rico and Mexico was faster than their countries’ fixed broadband providers combined (74.80 Mbps and 45.50 Mbps, respectively), while fixed broadband in the U.S. (150.12 Mbps) and Canada (106.41 Mbps) was faster than each country’s satellite providers.

In every country except Mexico, fixed broadband upload speeds were faster than satellite speeds. Starlink in Mexico edged out fixed broadband providers 14.48 Mbps to 12.20 Mbps. Latency was higher for every satellite provider compared to fixed broadband. Starlink in the U.S. had the lowest median latency among satellite providers at 48 ms.

Starlink outperformed fixed broadband average in 16 European countries

Chart of Satellite performance versus fixed broadband internet in Europe

Speedtest Intelligence shows Starlink was fast in Europe during Q2 2022, outperforming fixed broadband median download speed in 16 countries and reached download speeds over 100 Mbps in 10 countries. In contrast, fixed broadband only achieved median download speeds over 100 Mbps in six countries: Romania, Spain, Portugal, France, Hungary, and the Netherlands during Q2 2022. Starlink was fastest for median download speed in Portugal at 123.01 Mbps, the Netherlands (122.43 Mbps), Austria (112.01 Mbps), France (110.98 Mbps), and Belgium (110.40 Mbps). Romania and Spain were the only countries to have fixed broadband beat Starlink for fastest median download speed, achieving 131.41 Mbps and 127.19 Mbps, respectively.

For upload, Starlink in Greece and Austria was the only satellite provider to achieve faster upload speeds than all fixed broadband providers combined at 19.34 Mbps to 5.14 Mbps, and to 17.14 Mbps to 15.90 Mbps, respectively. Fixed broadband providers in Spain (99.21 Mbps), Romania (94.23 Mbps), Sweden (92.77 Mbps), France (88.22 Mbps), Lithuania (83.54 Mbps), and Portugal (73.13 Mbps) all recorded median upload speeds greater than 70 Mbps, with the closest satellite provider being Starlink in Portugal at 28.52 Mbps.

All satellite providers fell far behind fixed broadband providers in the whole of Europe for latency during Q2 2022. Starlink in Spain and the United Kingdom recorded the lowest satellite latencies at 37 ms and 39 ms, respectively — still a far cry from the closest fixed broadband latency, which was 14 ms in Germany, Greece, and Italy.

Starlink in Brazil was the fastest satellite provider in South America

Chart of Satellite performance versus fixed broadband internet in South America

Our analysis of Speedtest Intelligence data found Starlink in Brazil was the fastest satellite provider in South America with a median download speed of 128.38 Mbps during Q2 2022, followed by Starlink in Chile at 94.79 Mbps. Chilean fixed broadband internet was still much faster for those who could get access to it. The Speedtest Global Index™ found Chile had the second fastest fixed broadband internet in the world with a median download speed of 211.43 Mbps during August 2022. Starlink in Brazil was the only satellite provider to be faster than its country’s fixed broadband providers combined.

Like last quarter, South American fixed broadband providers surpassed satellite providers in each respective upload speeds during Q2 2022. All satellite providers had a higher median latency than fixed broadband, though Starlink in Brazil and Chile had latencies of 38 ms.

Starlink in New Zealand was the fastest satellite provider in Oceania 

Chart of Satellite performance versus fixed broadband internet in Oceania

Starlink’s fastest median download speed in Oceania was in New Zealand at 105.99 Mbps, though this still fell short of fixed broadband providers in the country. Starlink in Australia was faster than fixed broadband providers by a wide margin at 102.76 Mbps to 51.46 Mbps during Q2 2022. Starlink outperformed fixed broadband providers in new-to-our-list Tonga 45.25 Mbps to 22.32 Mbps. 

New Zealand’s fixed broadband dominated for the fastest median upload speed in Oceania at 87.29 Mbps during Q2 2022, while Australia’s fixed broadband fell far behind with an upload speed of 17.86 Mbps. Both speeds were still faster than Starlink’s median upload speeds in New Zealand and Australia (12.31 Mbps and 10.45 Mbps, respectively). Tonga didn’t have a statistical winner for fastest upload speed, but Starlink reached 19.26 Mbps and fixed broadband 18.11 Mbps. Fixed broadband also had a lower median latency than Starlink during Q1 2022, which clocked in at 49 ms in Australia, 78 ms in New Zealand, and 98 ms in Tonga.

Biggest questions lie ahead, but competition will be good for consumers

Satellite connectivity is coming to mobile, with Starlink’s new partnership with T-Mobile and new mobile devices becoming satellite enabled. This will cause ripples across North America, which is a net positive for consumers who live in areas with low mobile and fixed broadband connectivity. Connecting with the world won’t be a question of how anymore, it will be a question of how good your experience is. That’s hopefully a win-win for consumers, especially as more providers vie for the fastest and best satellite experience — a true global space race.

Starlink isn’t stopping there — they’re trying to get into airplanes, cruise ships, and cars. But they’re not the only satellite provider making moves; Viasat is launching its Viasat-3 fleet, OneWeb is combining business with Eutelsat, and Amazon is sending 3,236 Project Kuiper satellites into orbit. We’ll be here monitoring the skies in our ongoing satellite series. Take a Speedtest® to help us provide an accurate and more complete picture of real-world performance. And if we’re missing data on your satellite network, send us a screenshot of your speed on Twitter or Facebook.

Ookla retains ownership of this article including all of the intellectual property rights, data, content graphs and analysis. This article may not be quoted, reproduced, distributed or published for any commercial purpose without prior consent. Members of the press and others using the findings in this article for non-commercial purposes are welcome to publicly share and link to report information with attribution to Ookla.

| June 28, 2022

Here’s How Fast Starlink Has Gotten Over the Past Year

It’s been a year since we first examined SpaceX’s Starlink satellite internet, which launched its public beta in November 2020. Today we’re updating our ongoing series on satellite internet performance with data from Q1 2022 in Europe, Oceania, North America, and South America, including results from 10 additional countries. We’re also examining how Starlink’s internet performance has changed over the past year in the United States and Canada.

Starlink speeds increased nearly 58% in Canada and 38% in the U.S. over the past year

chart of Starlink and fixed broadband performance in Canada and the United States

Speedtest Intelligence® reveals that median download speeds for Starlink dramatically increased from Q1 2021 to Q1 2022 in the U.S. and Canada, as did speeds for all fixed broadband providers combined. In the U.S., Starlink median download speeds improved roughly 38% from 65.72 Mbps in Q1 2021 to 90.55 Mbps in Q1 2022. In Canada, Starlink’s download speed leapt ahead nearly 58% from 61.84 Mbps to 97.40 Mbps during the same time period.

However, Speedtest Intelligence also showed that upload speeds for Starlink decreased at least 33% in the U.S. (16.29 Mbps in Q1 2021 to 9.33 Mbps in Q1 2022) and at least 36% in Canada (16.69 Mbps to 10.70 Mbps) during the same time period. Median latency on Starlink marginally increased from 40 ms to 43 ms in the U.S. and from 51 ms to 55 ms in Canada during the past year. For many Starlink users, we suspect these changes are negligible.

Starlink in Mexico was the fastest satellite provider in North America

Chart of Satellite performance versus fixed broadband internet in North America

Starlink in Mexico had the fastest satellite internet in North America during Q1 2022 with a median download speed of 105.91 Mbps, followed by Starlink in Canada (97.40 Mbps) and the U.S. (90.55 Mbps). Mexico’s fixed broadband download speed (40.07 Mbps) was much slower than Starlink, while Starlink download speeds were slower than fixed broadband for all providers combined in the U.S. (144.22 Mbps) and Canada (106.86 Mbps). Puerto Rico, new to our list, showed HughesNet had the fastest satellite internet on the island territory at 20.54 Mbps, though fixed broadband was much faster at 68.88 Mbps.

Starlink in Lithuania was the fastest satellite provider in Europe

Chart of satellite performance versus fixed broadband internet in Europe

Speedtest Intelligence showed that Starlink blazed ahead in Europe during Q1 2022, with Starlink achieving a 100+ Mbps median download speed in every country where it was commercially available. In contrast, fixed broadband only achieved median download speeds over 100 Mbps in Spain, Portugal, and the Netherlands during Q1 2022. Starlink was fastest for download speed in Lithuania at 160.08 Mbps, followed by Belgium (147.85 Mbps), Slovakia (146.25 Mbps), Croatia (136.00 Mbps), and Austria (132.61 Mbps). Spain was the only country to have its fixed broadband beat Starlink for fastest median download speed, achieving 131.99 Mbps to Starlink’s 108.43 Mbps within the country.

For upload, fixed broadband providers in Spain (100.65 Mbps), France (86.02 Mbps), Portugal (74.42 Mbps), and Lithuania (73.95 Mbps) all recorded median speeds greater than 70 Mbps, while the closest satellite provider, Starlink in Portugal, trailed at 32.05 Mbps.

All satellite providers fell far behind fixed broadband providers in the whole of Europe for latency during Q1 2022, with Starlink in Spain and the United Kingdom recording the highest satellite latencies at 35 ms and 36 ms, respectively — a far cry from the lowest fixed broadband latency, which was 15 ms in the U.K.

Starlink in Chile was the fastest satellite provider in South America

Chart of Satellite performance versus fixed broadband internet in South America

Our analysis of Speedtest Intelligence data found Starlink in Chile was the fastest satellite provider in South America with a median download speed of 110.49 Mbps during Q1 2022. Although Chilean fixed broadband internet was much faster for those who could get access to it. In fact, during May 2022, the Speedtest Global Index™ found Chile had the second fastest fixed broadband internet in the world with a median download speed of 206.97 Mbps, just a hair shy of Singapore’s first place speed of 209.21 Mbps. 

No South American satellite provider surpassed its country’s fixed broadband download or upload speeds during Q1 2022. Viasat in Brazil had a noteworthy median download speed of 62.07 Mbps, though still fell short of the country’s fixed broadband speed of 90.20 Mbps. All satellite providers had a higher median latency than fixed broadband, though Starlink in Chile had a latency of 38 ms.

Starlink in Australia was the fastest satellite provider in Oceania

Chart of Satellite performance versus fixed broadband internet in Oceania

Starlink raced ahead in Oceania, recording faster median download speeds than fixed broadband in both Australia and New Zealand. In Australia, Starlink had a median download speed of 124.31 Mbps, much faster than Australian fixed broadband at 50.87 Mbps for download during Q1 2022. The comparison in New Zealand was much closer with Starlink’s median download speed at 118.70 Mbps and fixed broadband at 116.83 Mbps during Q1 2022.

New Zealand’s fixed broadband dominated for the fastest median upload speed in Oceania at 84.34 Mbps during Q1 2022, while Australia’s fixed broadband fell far behind with an upload speed at 17.85 Mbps. Both speeds were still faster than Starlink’s median upload speeds in New Zealand and Australia (13.09 Mbps and 11.71 Mbps, respectively). Fixed broadband also had a faster median latency than Starlink during Q1 2022, which clocked in at 47 ms in Australia and 78 ms in New Zealand.

Consumers are flocking to Starlink, but competitors are close behind

As we’ve continued to see over the past year, Starlink’s low-earth orbit satellites (LEOs) provide a life-changing service for consumers in rural areas that might not otherwise have access to high-speed internet. However, more companies are looking to compete with Starlink and launch their own LEO constellations, including Amazon’s Project Kuiper, which recently received FCC permission to test their own satellite service and is slated to launch later this year, and Viasat which is set to merge with Inmarsat and launch new constellations by 2023.

We’ll continue to monitor the skies in our ongoing satellite series, but if you’re using satellite internet, take a Speedtest® to help us provide an accurate and more complete picture of real-world performance.

Editor’s note: This article was amended on June 28 to clarify percentage increases in the U.S. and Canada and to update the percent change for upload for Canada.

Ookla retains ownership of this article including all of the intellectual property rights, data, content graphs and analysis. This article may not be quoted, reproduced, distributed or published for any commercial purpose without prior consent. Members of the press and others using the findings in this article for non-commercial purposes are welcome to publicly share and link to report information with attribution to Ookla.

| March 16, 2022

Starlink Hits 100+ Mbps Download Speed in 15 Countries During Q4 2021

Fast satellite internet has become increasingly available to more and more people across the globe. It’s already a huge boon to rural communities that might otherwise be too remote for fixed broadband service. Starlink, Viasat, HughesNet, and other satellite providers are all placing big bets on low-earth orbital (LEO) satellite constellations, and Starlink is even introducing a new premium service with speeds expected to be around 150-500 Mbps. It’s a gamble, as Starlink recently learned after losing about 40 satellites to a geomagnetic storm, but it’s a gamble worth making. The European Commission is even planning a multibillion Euro investment to connect the continent to satellite internet. 

We’ve analyzed fresh satellite internet performance data from Q4 2021 including results from seven additional countries to update our ongoing series.

United States: Starlink was the fastest satellite provider during Q4 2021 and speeds increased over Q3 2021

Satellite Internet Performance vs Fixed in USA

U.S. consumers saw mixed satellite performance when comparing Q3 2021 to Q4 2021, while the United States government has been trying to increase satellite internet competition. Starlink’s median download speed increased from 87.25 Mbps during Q3 2021 to 104.97 Mbps in Q4 2021 — an important benchmark that inches Starlink closer to reaching the Rural Digital Opportunity Fund’s (RDOF) baseline of download speeds greater than 100 Mbps. Viasat overtook HughesNet to follow Starlink distantly at 21.81 Mbps (comparable to the 18.75 Mbps we saw in Q3 2021) and HughesNet followed at 20.92 Mbps (19.30 Mbps in Q3 2021). SES, new to our list this quarter, trailed far behind at 2.19 Mbps. For comparison, the median download speed for all fixed broadband providers rose moderately in the U.S. during Q4 2021 from 119.84 Mbps in Q3 2021 to 131.30 Mbps in Q4 2021.

Starlink saw a slight decrease in median upload speed from 13.54 Mbps during Q3 2021 to 12.04 Mbps in Q4 2021, still short of the median upload speed for all fixed broadband, which rose to 19.49 Mbps in Q4 2021 from 18.03 Mbps in Q3 2021. Viasat followed at 2.88 Mbps (2.96 Mbps in Q3 2021), then HughesNet at 2.54 Mbps (2.13 Mbps in Q3 2021), and SES at 1.19 Mbps.

As we’ve seen over the past year, Starlink, which uses only low earth orbit (LEO) satellites, was once again the only satellite internet provider with a median latency anywhere close to fixed broadband in Q4 2021 (40 ms and 14 ms, respectively). SES, Viasat, and HughesNet, which all utilize higher geosynchronous earth orbit (GEO) satellites for now, had much higher median latencies at 613 ms, 627 ms, and 725 ms, respectively.

Starlink performance continues to vary widely at the county level

Median Download Speed for Starlink in Selected US Counties

During Q4 2021, we saw about a 130 Mbps range in performance between the U.S. county with the fastest median download speed over Starlink (Miami Dade County in Florida at 191.08 Mbps) and the county with the slowest median download speed (Columbia County in Oregon at 64.95 Mbps). Even the lower-end speeds were well above the FCC’s baseline performance tier for broadband internet of at least a 25 Mbps download speed.

Satellite internet performance elsewhere in the world

We examined satellite internet performance in countries with an established market share to see how well their speeds compare to local fixed broadband. We’re excited to add analyses on satellite performance in Austria, Ireland, Italy, Mexico, Netherlands, Poland, and Portugal this quarter. We’ve also added Starlink to the list of providers in Chile. With Starlink continuing to launch in additional countries, we’re looking forward to seeing how Starlink performs during Q1 2021.

Australia: Starlink nearly triples fixed broadband download average

Starlink performed well in Australia during Q4 2021 with a median download speed of 141.55 Mbps. The median download speed for all fixed broadband providers was 51.35 Mbps. Starlink’s 14.84 Mbps median upload speed fell behind fixed broadband providers’ 18.01 Mbps. Starlink is a clear alternative to traditional fixed broadband for speeds, however Starlink can’t yet compete for latency, with Starlink showing a median latency of 43 ms vs. 10 ms for all fixed broadband combined.

Austria: Starlink download speed outpaces fixed broadband by more than double

New to our list this quarter, Austrian consumers had fast speeds over Starlink during Q4 2021, achieving faster median download speeds than that of all fixed broadband providers combined at 131.84 Mbps vs. 50.33 Mbps on fixed broadband. Starlink also had a faster median upload speed at 19.91 Mbps vs. 14.34 Mbps on fixed broadband. Starlink trailed fixed broadband on median latency during Q4 2021, 52 ms vs. 13 ms.

Satellite Internet Performance vs Fixed Broadband in Austria

Belgium: Starlink much faster than fixed broadband

Starlink’s median download speed of 155.15 Mbps during Q4 2021 was much faster than the country’s median download for all fixed broadband of 76.94 Mbps. That’s also a large increase from Starlink’s median download speed of 127.46 Mbps in Q3 2021. For median upload speed, Starlink was only slightly slower at 15.15 Mbps than the median fixed broadband upload speed of 18.05 Mbps. However, Starlink’s 45 ms latency was higher than the country’s median latency of 13 ms. Starlink was the only satellite internet provider with adequate samples to analyze in Belgium during Q4 2021. For rural Belgians, Starlink is a strong option.

Satellite Internet Performance vs Fixed Broadband in Belgium

Brazil: Viasat fell further behind as national fixed broadband sped up

Viasat’s median download speed in Brazil dipped slightly from 66.32 Mbps during Q3 2021 to 62.80 Mbps during Q4 2021. This fell further away from the national median for fixed broadband, which sped up to 83.03 Mbps during Q4 2021 (71.50 Mbps in Q3 2021). Viasat’s median upload speed (1.07 Mbps) was much slower than that on fixed broadband (40.76 Mbps), and Viasat’s latency was much higher (610 ms vs 6 ms). With Starlink slated to enter the Brazilian market soon, we’ll be watching these numbers closely to see if additional competition spurs the market.

Satellite Internet Performance vs Fixed Broadband in Brazil

Canada: Starlink performance reaches milestone during Q4 2021

In our last article, Starlink’s median download speed decreased to slower than fixed broadband in Canada during Q3 2021 (84.55 Mbps vs. 90.67 Mbps). But in Q4 2021, Starlink’s median download speed leapt ahead, achieving 106.64 Mbps while median download speed for fixed broadband increased to 96.39 Mbps. Starlink’s median upload speed was slower than fixed broadband (12.82 Mbps vs. 21.66 Mbps) and latency on Starlink was still much higher (55 ms vs. 11 ms). Starlink should be considered a viable option compared to fixed broadband in Canada, especially for rural consumers or those without access to fast fixed broadband options like fiber.

Satellite Internet Performance vs Fixed Broadband in Canada

Starlink faster than overall fixed broadband in nearly every province

Median Download Speed for Starlink in Canadian Provinces

Starlink showed enough samples to analyze performance in all 10 provinces in Canada during Q4 2021 — all of which showed substantial increases in Starlink’s download speed during Q4 2021 compared to Q3 2021. Starlink’s median download speed was faster than the median download for all fixed broadband in seven provinces during Q4 2021: Manitoba (101.66 Mbps vs. 83.06 Mbps), Newfoundland and Labrador (195.30 Mbps vs. 131.58 Mbps), Nova Scotia (143.52 Mbps vs. 121.57 Mbps), Ontario (106.24 Mbps vs. 95.06 Mbps), Prince Edward Island (139.11 Mbps vs. 75.95 Mbps), Quebec (123.50 Mbps vs. 84.50 Mbps), and Saskatchewan (116.24 Mbps vs. 68.43 Mbps).

Download speeds were comparable between Starlink and overall fixed broadband in New Brunswick (130.67 Mbps vs. 132.65 Mbps), and overall fixed broadband was faster than Starlink in Alberta (107.32 Mbps vs. 96.56 Mbps) and British Columbia (130.97 Mbps vs. 94.74 Mbps) — with the latter two provinces having better access to fiber-to-the-home (FTTH).

Chile: Starlink debuts fast speeds, but still much slower than scorching fast fixed broadband

Chilean fixed broadband providers have continued to achieve some of the fastest speeds in the world, recording the fastest speed on the Speedtest Global Index during February 2022, and we were interested to see how Starlink would compete. Starlink reached 118.95 Mbps in Chile during Q4 2021, which was faster than HughesNet (15.30 Mbps) but much slower than Chile’s median download speed for all fixed broadband providers (168.92 Mbps). 

Median upload speeds also showed a wide gap in Chile between satellite and fixed broadband during Q4 2021 (23.46 Mbps for Starlink and 3.42 Mbps for HughesNet vs. 89.76 Mbps on fixed broadband). Fixed broadband was also much faster for latency: 7 ms for fixed broadband vs. 38 ms for Starlink and 615 ms for HughesNet.

Satellite Internet Performance vs Fixed Broadband in Chile

Colombia: HughesNet decreased over download and upload speeds

HughesNet’s median download speed decreased in Q4 2021 to 11.75 Mbps from 12.12 Mbps during Q3 2021, while Colombia’s fixed broadband increased to 54.60 Mbps (46.08 Mbps in Q3 2021). Median upload speed was also slower for HughesNet than fixed broadband (2.88 Mbps vs. 11.86 Mbps), and latency was much higher on HughesNet (717 ms vs. 14 ms).

Satellite Internet Performance vs Fixed Broadband in Colombia

France: Starlink download speed increased, still faster than fixed broadband

Starlink users in France saw a median download speed of 121.21 Mbps in Q4 2021 (up from 102.15 Mbps in Q3 2021). Starlink’s download speed easily beat the country-wide median for fixed broadband of 90.88 Mbps (up from 75.47 Mbps in Q3 2021). Starlink’s upload speed during Q4 2021 was slower than the fixed broadband median (17.20 Mbps vs. 69.49 Mbps), and Starlink’s latency was higher (51 ms vs. 12 ms). Satellite provider SES, on this list for the first time, trailed behind both Starlink and fixed broadband with a 14.88 Mbps download speed, 1.83 Mbps upload speed, and 649 ms latency. Starlink remains an good option for rural French consumers.

Satellite Internet Performance vs Fixed Broadband in France

Germany: Starlink blazes ahead of fixed broadband download speed

Starlink’s median download speed in Germany of 115.58 Mbps was much faster than the fixed broadband median of 65.86 Mbps during Q4 2021 (and Starlink’s Q3 2021 download speed of 95.40 Mbps). Starlink was slightly slower for upload speed than overall fixed broadband (15.17 Mbps vs. 22.40 Mbps) and Starlink showed a higher latency (47 ms) than fixed broadband (14 ms).

Satellite Internet Performance vs Fixed Broadband in Germany

Ireland: Starlink download debuts nearly double that of fixed broadband

Starlink’s debut on our list is noteworthy in Ireland, where it achieved a download speed almost double that of Ireland’s combined fixed broadband average during Q4 2021 (123.51 Mbps vs. 65.89 Mbps). Median upload speeds were almost level, with Starlink recording a median upload speed at 24.35 Mbps vs. 22.63 Mbps for fixed broadband. Starlink lagged for latency at 45 ms vs. 11 ms for fixed broadband. Starlink is a great option for those who are looking for fast speeds in Ireland and can’t get access to fixed broadband.

Satellite Internet Performance vs Fixed Broadband in Ireland

Italy: Starlink dominates against fixed broadband

Starlink enters our list in Italy with a decisive statement during Q4 2021: It achieved a median download speed of 124.39 Mbps, a huge leap ahead of Italy’s fixed broadband average of 49.56 Mbps. Upload speeds were comparable between the two, with Starlink recording a median of 18.90 Mbps to 18.29 on fixed broadband. Starlink had a higher latency at 52 ms vs. 14 ms on fixed broadband. Starlink is an attractive option for fast internet in Italy.

Satellite Internet Performance vs Fixed Broadband in Italy

Mexico: Starlink impresses during Q4 2021 debut

Starlink, which only became commercially available in Mexico during November 2021, made a significant splash during its brief Q4 2021 debut, achieving a median download speed of 141.94 Mbps. That was significantly faster than Viasat (16.34 Mbps), HughesNet (10.63 Mbps), and all fixed broadband providers combined (36.56 Mbps). 

Starlink also outpaced fixed broadband for fastest upload speed (22.32 Mbps vs. 9.53 Mbps). HughesNet and Viasat followed at 3.10 Mbps and 2.06 Mbps, respectively. Starlink was the only satellite provider that came close to fixed broadband median latency, 64 ms to 11 ms. Viasat and HughesNet were distantly behind at 676 ms and 763 ms, respectively. With Starlink making such an impressive entrance into Mexico, we’ll be interested to see if the performance holds up in the coming months.

Satellite Internet Performance vs Fixed Broadband in Mexico

Netherlands: Starlink faster for median download, lagging on upload and latency

The Netherlands, which is new to this list, has some of the fastest median mobile and fixed broadband speeds in the world according to the Speedtest Global Index. We were eager to see how Starlink would perform against this competition. During Q4 2021, Starlink achieved a median download speed of 138.40 Mbps compared to 95.55 Mbps over fixed broadband. Starlink lagged noticeably behind for upload speed at 15.60 Mbps vs. 30.87 Mbps on fixed broadband. Starlink also had a higher latency at 45 ms vs. 11 ms on fixed broadband.

Satellite Internet Performance vs Fixed Broadband in Netherlands

New Zealand: Starlink slowed slightly, still faster than fixed broadband download

Starlink’s Q4 2021 median download speed (116.44 Mbps, down slightly from 120.10 Mbps Mbps in Q3 2021, likely due to increased adoption) was faster than New Zealand’s median fixed broadband download speed (98.61 in Q4 2021, up from 84.98 Mbps in Q3 2021). Starlink was much slower than New Zealand’s median fixed broadband upload speed for Q4 2021 (13.79 Mbps vs. 59.26 Mbps, which was a huge increase from 23.62 Mbps on fixed broadband during Q3 2021). Starlink’s median latency during Q4 2021 was comparable to Q3 2021 (79 ms vs. 81 ms) which was still much slower than New Zealand’s median for all fixed broadband of 6 ms during Q4 2021.

Satellite Internet Performance vs Fixed Broadband in New Zealand

Poland: Starlink a fast option for Poles

Starlink launched in Poland during September 2021 and is already recording fast speeds. The median download speed for Starlink was much faster than fixed broadband at 129.29 Mbps to 83.88 Mbps during Q4 2021. Upload speed was roughly comparable, with Starlink recording a slightly slower median upload speed of 24.17 Mbps and fixed broadband ahead at 28.60 Mbps. Starlink’s latency was higher at 58 ms to 10 ms on fixed broadband. That’s still acceptable for online gaming, but higher than what’s considered optimal.

Satellite Internet Performance vs Fixed Broadband in Poland

Portugal: Starlink far ahead on download speed in debut, fixed broadband much faster on upload

Another newcomer to this list this quarter, Portugal was a place where Starlink dominated with a much faster median download speed than fixed broadband at 140.35 Mbps to 94.62 Mbps, respectively, during Q4 2021. Upload speed was a different story, with fixed broadband notching a median upload speed of 65.52 Mbps to Starlink’s 30.16 Mbps. Starlink also had a much higher latency than fixed broadband at 44 ms to 7 ms. Starlink remains a good option if you don’t have access to good fixed broadband in Portugal. 

Satellite Internet Performance vs Fixed Broadband in Portugal

United Kingdom: Starlink still nearly twice as fast as fixed broadband median

Starlink showed a faster median download speed in the U.K. (121.94 Mbps in Q4 2021, up from 111.66 Mbps in Q3 2021) than the country’s median for fixed broadband (57.66 Mbps in Q4 2021, up from 53.16 Mbps in Q3 2021). Starlink’s median upload speed (13.96 Mbps) was comparable to the median upload for all fixed broadband in the U.K. (16.84 Mbps), and the latency was relatively fast given the distance traveled (36 ms for Starlink vs. 15 ms for all fixed broadband) — enough to be able to reliably play online multiplayer games. Satellite provider SES trailed far behind during Q4 2021 with a 3.79 Mbps median download speed, 3.74 Mbps median upload, and 636 ms median latency.

Satellite Internet Performance vs Fixed Broadband in United Kingdom

Competition among satellite providers is rapidly increasing and we’ll continue watching closely

We look forward to updating this data again next quarter with new locations as satellite internet continues to become a more viable option for many. If you’re using satellite internet, take a Speedtest® to help us provide an accurate picture of real-world performance.

Editor’s note: The section on Australia was amended on March 24 to remove performance details for Viasat which was determined not to be a consumer offering at this time.

Ookla retains ownership of this article including all of the intellectual property rights, data, content graphs and analysis. This article may not be quoted, reproduced, distributed or published for any commercial purpose without prior consent. Members of the press and others using the findings in this article for non-commercial purposes are welcome to publicly share and link to report information with attribution to Ookla.

| December 22, 2024

Ringing in the New Year - How do 5G Networks Cope Under Stress?

5G Networks Support NYE Festivities Across Major Cities

Major events present a unique challenge for mobile networks, particularly sporting events where users congregate in concentrated numbers, and where sharing of video to social media, and to friends and family is a key use case. Ringing in the New Year is another case in point – for many years network operators published statistics on the number of voice calls made, messages sent, and the amount of data traffic their networks handled. While the rise of over-the-top (OTT) communications platforms such as WhatsApp have put a damper on these press releases, there remains a sizeable impact on operators’ networks. For example, Belgian operator Proximus noted a 95% increase in mobile data traffic on New Year’s Eve in 2023 compared to 2022. The trend isn’t uniform across markets, with Australia’s Telstra consistently seeing lower data usage on New Year’s Eve, with its customers using 30% less data than average, according to a news source. What is clear is that the New Year presents network operators with the challenge of serving sufficient bandwidth to customers attending major New Year celebrations, allowing them to share the moment, but also to support the mass wishing of “Happy New Year” across a variety of channels.

We reviewed Speedtest Intelligence data for New Year’s Eve 2023/24, to analyse how 5G networks coped with the surge in demand and change in traffic patterns at New Year, across a selection of major cities featuring some of the largest New Year celebrations around the globe. We focused in on median performance alongside the 10th percentile, in order to evaluate the spread of performance from the median user to those experiencing more challenging network conditions which would impact their experience at New Year.

Worst 10% of Speedtest samples reveal network challenges

We zeroed in on 5G upload performance first. Network operators universally allocate more spectral capacity to the downlink, as most mobile use cases lean more heavily on downloading data to the end-user device. However, the usage profile at the New Year is different, with video sharing, video streaming and calling, as well as uploading content to social media, more prevalent. These are all activities that are supported by uplink from the device.

Our data shows a significant gap between upload performance for the median user, and those in the lower 10th percentile – those experiencing the worst 10% of performance samples. Half the cities in our analysis recorded 10th percentile upload performance of less than 1 Mbps, with speeds ranging from 0.30 Mbps in Berlin, to 6.09 Mbps in Dubai. These sub-par speeds make it nearly impossible to upload photos or videos.

User Experience – Assessing the Worst 10% of Performance Samples on New Year's Eve
Speedtest data, New Year's Eve 23/24, 8pm – 1am

It was a similar picture for New Year revellers based on download speeds and latency. Despite more capacity being allocated to the downlink, performance for the lowest 10% of samples tumbled significantly compared to the median experience, with cities in APAC (Bangkok, Hong Kong, Sydney and Tokyo) in particular suffering, recording 10th percentile 5G download speeds of less than 10 Mbps. Latency was more of a mixed story across cities. At one end of the scale, Tokyo recorded a variance in latency between the median and 90th percentile (the worst 10% of latency samples) of just 19 ms, while Sydney saw a much wider gap of almost 200 ms. At 200 ms of latency users are likely to experience frustratingly slow loading times, unresponsive applications, and poor video quality.

Our data also showed the degree to which New Year usage pulled down 5G performance for the worst 10% of samples. New York, and cities in Europe saw less of an impact at New Year’s Eve compared to their global counterparts. Berlin, London, New York and Paris saw 5G download speeds for 10th percentile drop by between 1.13 Mbps and 6.88 Mbps. In contrast, Bangkok, Hong Kong and Sydney saw performance drop by between 15.13 Mbps and 21.44 Mbps. Dubai and Rio de Janeiro recorded the largest variance, however with faster 5G speeds they still outpaced the remaining markets by a significant margin. Upload performance for the worst 10% of samples followed a similar trend to download, however latency performance was more varied. Berlin, Dubai, New York, Rio de Janeiro and Tokyo saw very little difference between New Year Eve latency performance and the Q4 2023 average. However, Paris, Hong Kong and London saw an increase in latency for the worst 10% off samples of between 22 ms and 36 ms, while Bangkok and Sydney fared worst, with an increase of 61 ms and 171 ms respectively.

Impact of New Year's Eve Traffic on Users With the Worst 10% of Samples
Speedtest data, Q4 2023 vs New Year's Eve 23/24, 8pm – 1am

Addressing network pain points

Addressing network pain points for users affected by poor performance in dense urban areas is a challenging task. For major events like the recent Paris Olympics, which we reported on earlier this year, network operators will typically deploy temporary network assets such as cells on wheels (CoWs) to add extra network capacity, which can then be removed once the event concludes. Network operators can also look to build private networks, to provide dedicated capacity to support the operations of the event, including routing traffic for broadcasting purposes. However, city authorities also have an important role to play here, as highlighted in our recent whitepaper with Dublin City Council and the City Telecoms Association. Having a holistic view of network performance and its evolution across a city, as well as international benchmarks, provides city authorities with the data and insights to engage more constructively with network operators and regulators, and help introduce more effective policies to deliver meaningful change for end-users. We’ll continue to benchmark and report on city and state performance, based on Speedtest Intelligence data. For more information, please contact us.

Ookla retains ownership of this article including all of the intellectual property rights, data, content graphs and analysis. This article may not be quoted, reproduced, distributed or published for any commercial purpose without prior consent. Members of the press and others using the findings in this article for non-commercial purposes are welcome to publicly share and link to report information with attribution to Ookla.

| April 14, 2024

Early 5G Results for the Samsung Galaxy S24 Family: How do New S24 Models Stack up to Previous Generations and iPhone 15’s on 5G? 

Consumers around the world eagerly awaited Samsung’s release of the latest line of its flagship Galaxy S series of smartphones on February 1, 2024. Was the wait worth it? In this article, we analyze how the Samsung Galaxy S24 family measures up against its predecessors in terms of 5G speed and latency during its first several weeks on the market (February 1 – March 24, 2024). 

With new chipsets and technologies alongside plenty of other cool new features in Galaxy S24 devices, we examined early results from Speedtest® users in 15 select countries around the world to see whether the Galaxy S24 lineup — comprising the S24, S24+, and S24 Ultra models — outpaced Samsung’s earlier S22 and S23 families for 5G performance. Additionally, we’ve compared the 5G speeds and latency of Apple’s iPhone 15 family — including the iPhone 15, 15 Pro, and 15 Pro Max — against Samsung’s offerings.

It’s important to note that device performance metrics can vary significantly from one country to another. Factors such as government and mobile operator investments in 5G infrastructure, spectrum allocations, and the extent of 5G network deployment all contribute to these variations.

Key takeaways:

  • The Samsung Galaxy S24 family showed a statistically significant lead for median 5G download speeds in seven out of 15 countries in this study. On the other hand, the Apple iPhone 15 family posted the fastest 5G speeds in only one country. It’s worth noting, however, that speed differences between Galaxy S24 devices and iPhone 15’s were relatively minor in some of the countries analyzed (see the charts below for details). 
  • The S24 family recorded the lowest median 5G multi-server latency in 10 of 15 countries, whereas iPhone 15 devices offered the highest median 5G latency in 10 markets.
  • Samsung Galaxy S22 models unsurprisingly offered the slowest median 5G download speeds in eight countries, while the Galaxy S23 family was slowest in four countries. 
  • Devices in the Galaxy S24 family experienced the fastest median 5G upload speed in 13 of the 15 countries examined for this analysis. However, upload speeds were much slower than 5G download speeds, ranging from 11.83 Mbps to Mbps to 66.52 Mbps, with median 5G upload speeds of 50 Mbps or better found in only three countries (South Korea, Qatar, and the U.A.E.). 

To learn more about what speeds mean in real-world terms, check out our article looking at how much speed users need for a variety of daily mobile activities.

Take me straight to the data!

Asia Pacific | Middle East & Africa | Europe | North America 

New chipsets and modems in the Galaxy S24 family 

Everyone wants to know if the newest technology is worth the upgrade when they’re investing in an expensive new smartphone. Each device within the Galaxy S24 family has various upgrades (including new AI features), but when it comes to features that impact speed and latency performance, here’s a look at the chipsets and modems for each line of smarthpones in our study:

  • Samsung Galaxy S24 Ultra models use Qualcomm’s Snapdragon 8 Gen 3 chipset globally, while the S24 and S24+ use it only in Canada, China, Hong Kong, Taiwan, and the United States. The Samsung Exynos 2400 is used elsewhere for the S24 & S24+.
  • The Galaxy S23 series uses Qualcomm’s Snapdragon 8 Gen 2 worldwide, while Samsung S22 models use an Exynos 2200 chipset in Europe and the Snapdragon 8 Gen 1 elsewhere. 
  • Galaxy S24 devices utilize the Snapdragon X75 5G modem, S23 models have a Qualcomm Snapdragon X70 modem, while S22 models have a Qualcomm Snapdragon X65 modem.
  • Apple iPhone 15 models use Apple’s A16 Bionic chipset, while iPhone 15 Pro and Pro Max models use the A 17 Pro chip. All devices in the Apple iPhone 15 family utilize Qualcomm’s Snapdragon X70 5G modem. 

Do you own one of these devices? See how your speeds compare by taking a quick Speedtest. And to learn more about mobile and fixed broadband performance in cities and regions across the world, visit the Speedtest Performance Directory, where you’ll find ISP recommendations, insights on mobile and fixed broadband performance, and more. 

Digging into the Data: Where does the Samsung Galaxy S24 Family Lead its S22, S23, and iPhone 15 Counterparts Around the Globe? 

Early findings from Speedtest Intelligence® reveal that the latest Galaxy S24 family outperformed its predecessors — especially S22 models — in terms of 5G speed across several of the countries we analyzed. While differences in speed between devices were minimal in some countries, S24 models showed significant speed advantages over previous generation Samsung devices in markets like Qatar, the United Arab Emirates, and others. 

Does that mean users in those locations should upgrade immediately? Not necessarily. The decision to upgrade depends on various factors, from price to features to performance and more. However, if speed is your primary concern, the Galaxy S24 series is a compelling option, especially for consumers currently utilizing devices from the Galaxy S22 lineup, which is now over two years old.

Read on to see our complete analysis of all 15 countries in this study or select a region below to dig into more localized results. 

Asia Pacific | Middle East & Africa | Europe | North America 

Asia Pacific

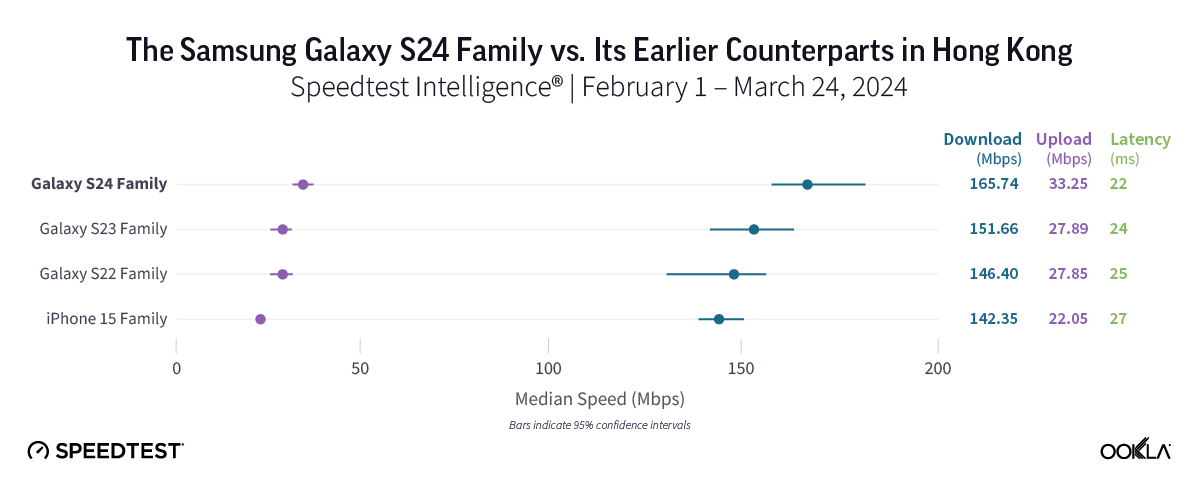
Consumers in Hong Kong who want new features might want to upgrade

Speedtest Intelligence data revealed strong performance for all device families in Hong Kong, with the new Galaxy S24 family performing particularly well, boasting a median 5G download speed of 165.74 Mbps and the lowest median 5G multi-server latency in the market at 21.74 ms. However, the S24’s median 5G download speed was statistically comparable to that of its older Samsung and iPhone 15 peers, making the choice to upgrade currently more about new features than about performance.

Bottom line: With strong — and similar — 5G download speeds across all device families in Japan, upgrading to a new Galaxy device isn’t a must just yet, unless you want to enjoy the S24 family’s new features.

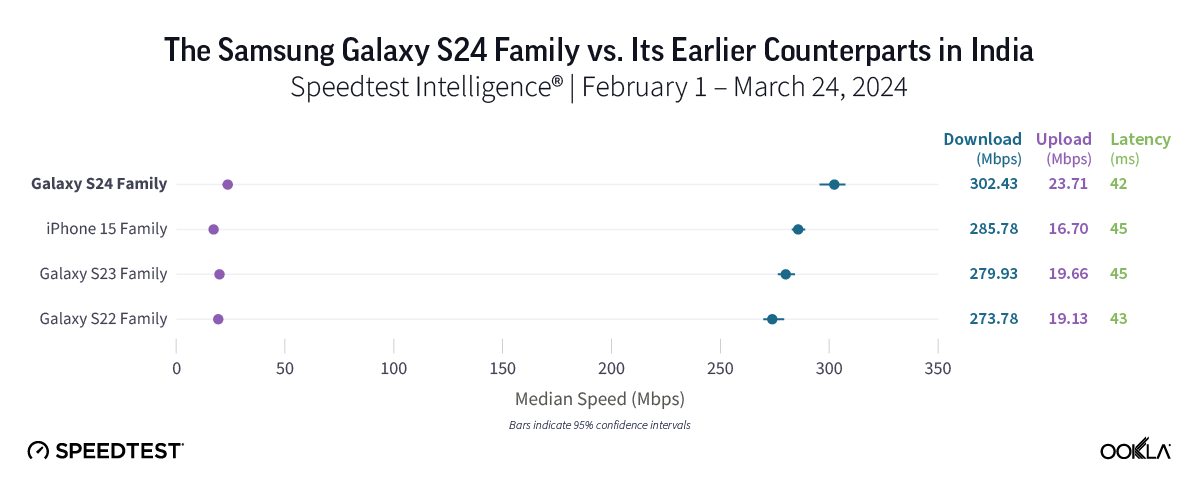
5G speeds were fast across the board in India, where the Samsung Galaxy 24 family held a slight edge 

In the early days following the release of the Galaxy S24 series in India, the latest Samsung models led for both 5G download speeds and 5G multi-server latency. While 5G speeds impressed across all device families in India — all notched speeds of at least 273.78 Mbps — Galaxy S24 models posted the top median 5G download speed at 302.43 Mbps and the lowest median 5G multi-server latency at 41.56 ms. On the other hand, Galaxy S22 devices showed the slowest — but still impressive — speeds in India at 273.78 Mbps, while the Samsung Galaxy S23 was just a tick behind at 279.93 Mbps. The iPhone 15 family, meanwhile, clocked in with a median 5G download speed of 285.78 Mbps.

Bottom line: Consumers in India currently using S22 devices might want to upgrade to an S24 model, given the nearly 30 Mbps speed advantage the new devices provided in this study. However, with excellent 5G speeds across all device families and similar speeds for devices in the S22, S23, and iPhone 15 families, users might not feel a huge difference in their 5G experience from one device to another. 

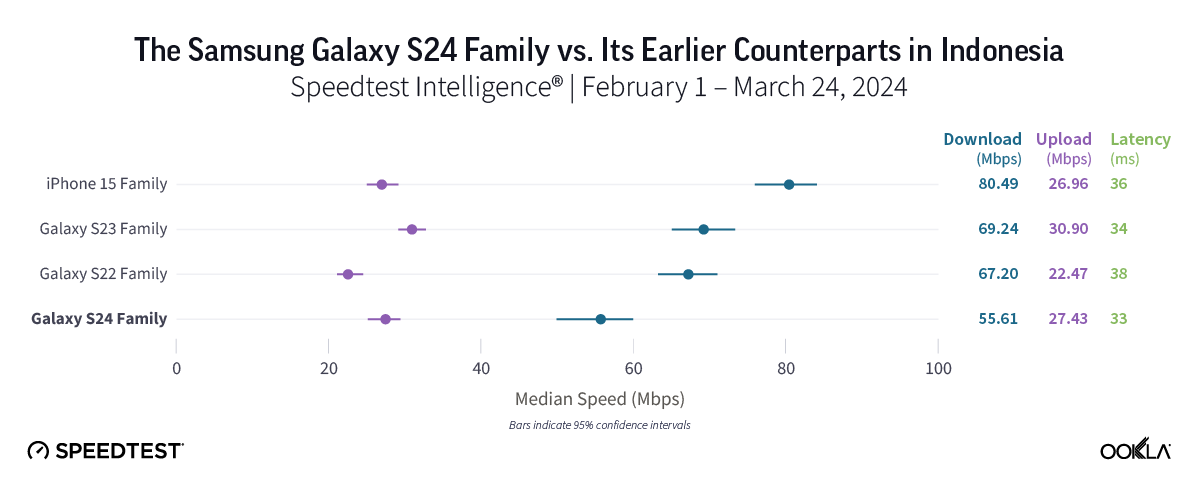
Samsung Galaxy enthusiasts in Indonesia needn’t rush to upgrade to an S24 device — yet

In contrast with what our results showed in most countries, the iPhone 15 family emerged as the leader in Indonesia with a median 5G download speed of 80.49 Mbps. All three Samsung Galaxy families trailed with speeds ranging from 55.61 Mbps for the S24 family to 69.24 Mbps for S23 models. While the iPhone 15 family’s 5G speed was nearly 25 Mbps faster than that of S24 devices, it’s worth noting that the difference among all three Samsung Galaxy models was only about 14 Mbps, and our results revealed no statistical difference in median 5G download speeds between the S22 and S23 families. 

Bottom line: Despite the iPhone 15 providing the top speeds in the market, the Galaxy S24 could hold greater long-term potential for consumers in Indonesia, especially when compared to older Samsung models. Equipped with a newer processor and modem, the S24 could see quicker speeds over time as Indonesia’s 5G networks evolve. In the meantime, users shouldn’t experience notable disparities in speed or latency among all three Samsung device families analyzed. 

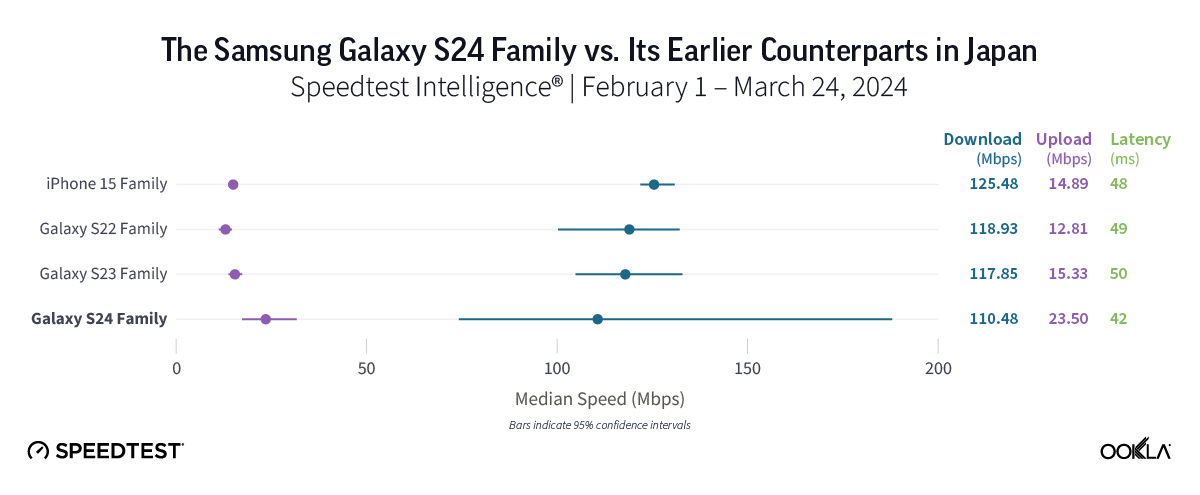
No clear advantage to upgrading to a new Galaxy S24 in Japan

People in Japan who upgraded to a Galaxy S24 device likely haven’t seen a performance boost just yet. While all four device families performed similarly well in Japan, there was no statistical difference in the median 5G download speeds offered by all three Galaxy families, with speeds ranging from 110.48 Mbps to 118.93 Mbps across all three Galaxy devices. The iPhone 15 lineup also had a strong speed at 125.48 Mbps. 

Bottom line: With generally similar median 5G download speeds across all device families in Japan, users who are considering upgrading to a new Galaxy smartphone might want to wait. While we anticipate the S24’s speeds to surpass those of its predecessors over time, 5G speeds in the market were quite close across all three Galaxy device families in the early days of the S24’s release. 

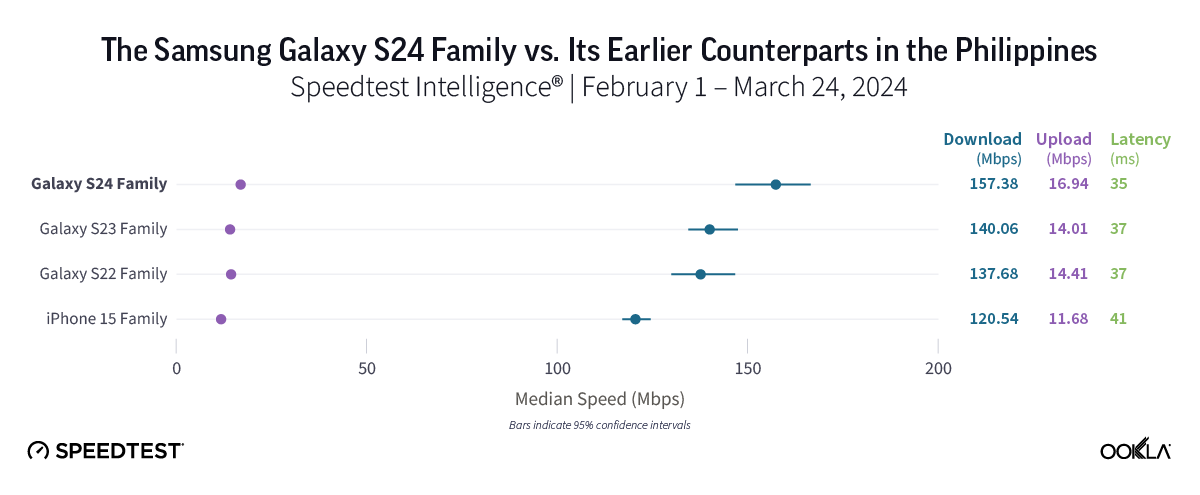
For users in the Philippines who want the fastest 5G, Galaxy S22 users may want to upgrade. 

Samsung Galaxy S24 users in the Philippines might have noticed a modest improvement to their 5G speeds compared to those on older S23 and S22 models since they upgraded, as the Galaxy S24 family’s median 5G download speed of 157.38 Mbps was about 20 Mbps faster than that of Galaxy S22’s (137.68 Mbps) and a little over 15 Mbps faster than the Galaxy S23 family (140.06 Mbps). Meanwhile, the iPhone 15 family’s median 5G download speed of 120.04 Mbps trailed all three Samsung Galaxy families in the market.

Bottom line: For users in the Philippines seeking the fastest possible 5G experience, upgrading to an S24 device is worth considering. However, it’s worth noting that the differences in speed between devices wasn’t as stark as that in some other countries, and upgrading likely isn’t for everyone just yet.

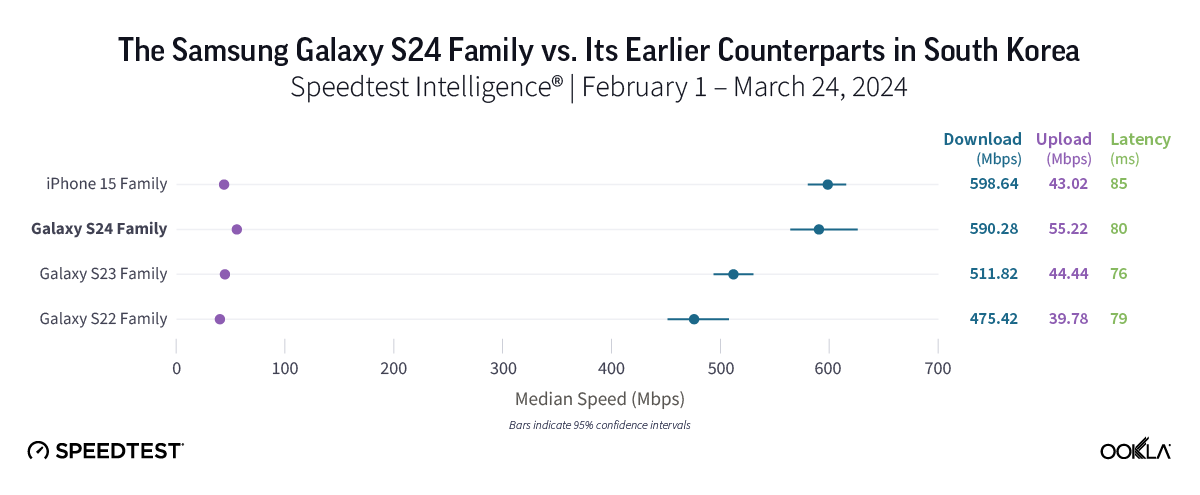
Samsung Galaxy S24 and iPhone 15 much faster on 5G in South Korea than S22 devices 

In South Korea, home to the first widespread 5G launch in the world, our results reflected outstanding 5G speeds, with the iPhone 15 and Samsung Galaxy S24 families posting similar median 5G download speeds of 598.64 Mbps and 590.28 Mbps, respectively. The S22 family, meanwhile, offered the “slowest” 5G speeds in South Korea, posting an excellent median 5G download speed of 475.42 Mbps, while Galaxy S23 devices came in at 511.82 Mbps.

Bottom line: 5G users in South Korea can expect remarkable 5G speeds across the board, regardless of their device. However, Samsung Galaxy loyalists who currently use S22 models might want to consider moving to an S24 model, given that the S24 family was over 100 Mbps faster than Galaxy S22’s, while also offering the top median 5G upload speed in the market at 55.22 Mbps. For users who prioritize the fastest 5G experience, Galaxy S24’s and iPhone 15’s are both worth a look.

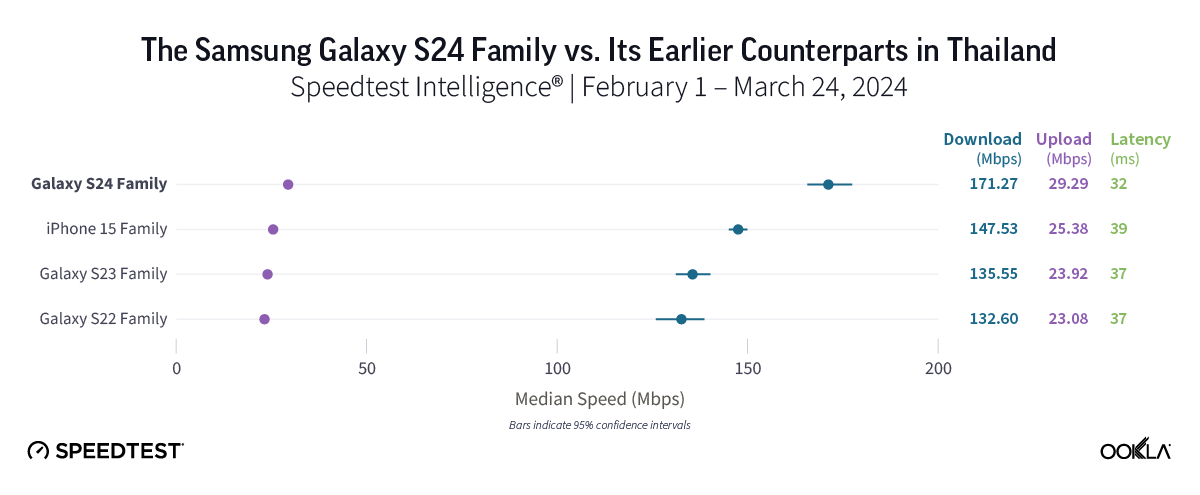
Samsung Galaxy S24 family provides top 5G download speeds in Thailand 

In Thailand, Speedtest Intelligence showed that the Galaxy S24 family delivered the fastest median 5G download speed in the market at 171.27 Mbps. That speed marks a notable improvement of roughly 35 Mbps over the S22’s 132.60 Mbps and the S23’s 135.55 Mbps. The Galaxy S24 family also offered the lowest median 5G multi-server latency in Thailand at 32.46 ms. The iPhone 15 family provided the second-fastest median 5G download speed in the market at 147.53 Mbps.

Bottom line: If you’re thinking of upgrading from an S22 or S23 device, our findings suggest that the Galaxy S24 might be the right choice. With faster 5G speeds compared to previous generations, coupled with low latency, smartphones in the Galaxy S24 family should allow for quick content downloads and smooth connectivity overall.

Middle East and Africa 

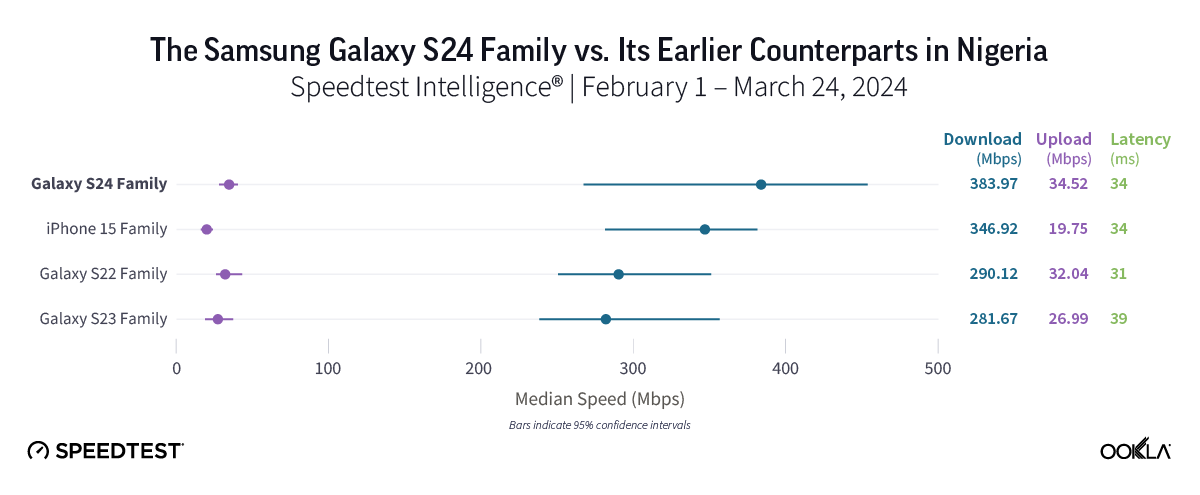
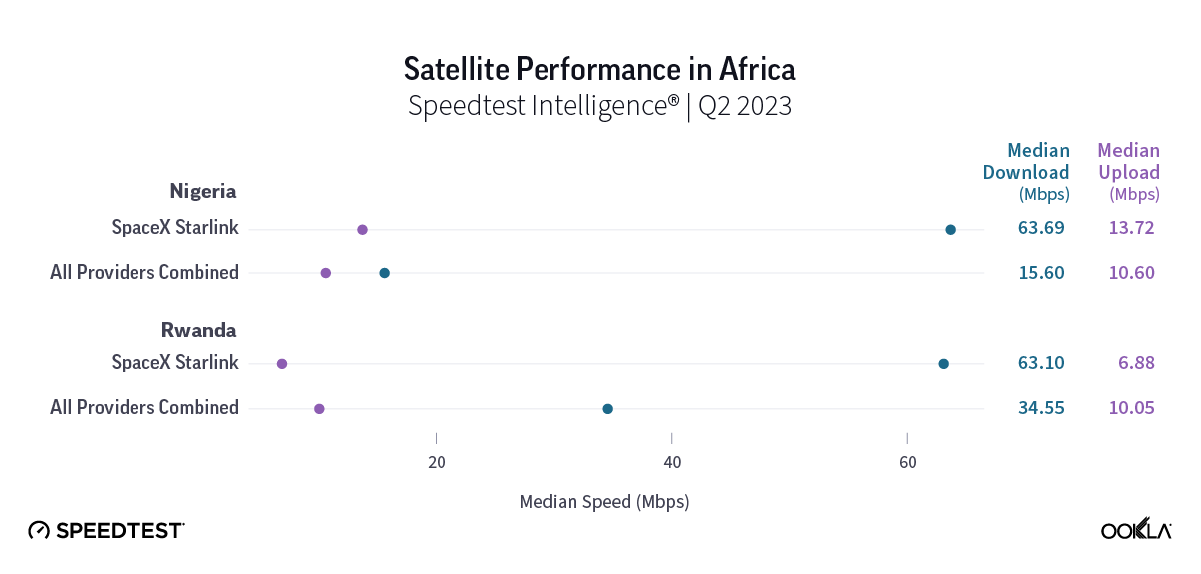
Excellent 5G speeds in Nigeria, but too soon to tell if you should upgrade for performance 

In Nigeria, 5G speeds were impressive overall, from the Galaxy S23 family’s median 5G download speed of 281.67 Mbps to the new Galaxy S24’s speed of 383.97 Mbps. However, in these early days of the S24 lineup’s release, we are still waiting to see how things stabilize in the market before we can make a firm recommendation on whether to upgrade. 

Bottom line: For users who like to have the latest gear and/or want the new features offered by the S24 lineup, upgrading is certainly worth considering. But with fast 5G speeds in general, users on any of the device families we looked at should see a quick download experience in general. 

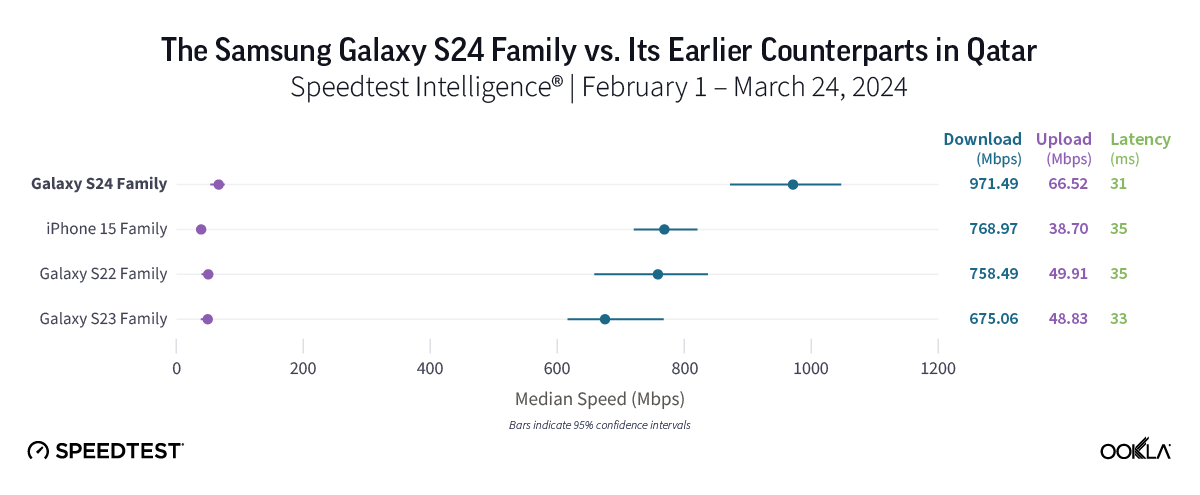
Samsung Galaxy S24 by far the fastest 5G in Qatar 

Home to some of the fastest 5G speeds in the world, Qatar showcased impressive median 5G download speeds across all three device families analyzed. The Galaxy S24 family led the pack with a jaw-dropping median 5G download speed of 971.49 Mbps and the top median 5G upload speed in the market at 66.52 Mbps. The Galaxy S22 and S23 families trailed, albeit with great median 5G download speeds of 675.06 Mbps and 758.49 Mbps, respectively. The iPhone 15 family also had a strong showing in Qatar, posting a median 5G download speed of 788.97 Mbps. 

Bottom line: Consumers in Qatar with older Galaxy S22 or S23 devices might want to make the switch, given that the S24 family’s remarkable median 5G download speed of nearly 1 Gbps was much faster than those of either the Galaxy S23 or especially S22 families.

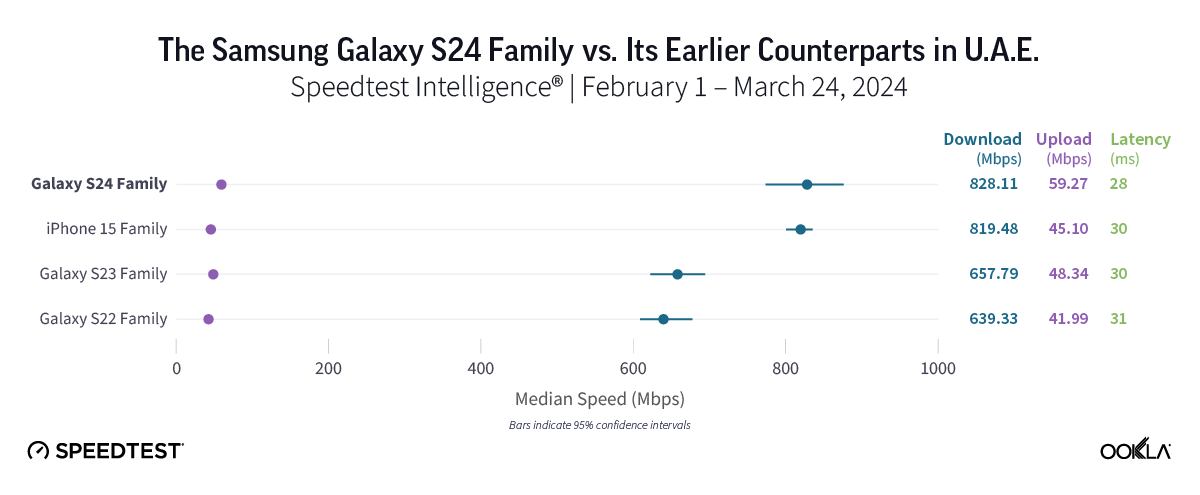
Galaxy S24 a good option for Samsung fans in the U.A.E.

In the U.A.E., which is home to outstanding 5G speeds in general, the Samsung Galaxy S24 and iPhone 15 families delivered the top median 5G download speeds in the market at 828.11 Mbps and 819.48 Mbps, respectively. When compared to its earlier generation Samsung predecessors, the S24 family held a commanding speed advantage, boasting speeds that were at least 170 Mbps higher than those of either the S22 (639.33 Mbps) or S23 (657.79 Mbps) families. 

Bottom line: With median 5G download speeds ranging from 639.33 Mbps to 828.11 Mbps, consumers in the U.A.E. will likely enjoy fantastic speeds regardless of device model. However, for current S22 or S23 users hoping to boost their speeds, the Galaxy S24 family stands out as a good choice.

Europe

Galaxy 24 family clocked 5G speeds over 80 Mbps faster than those on S22 devices in France

In France, the Galaxy S24 family was the frontrunner, delivering the fastest median 5G download speed among all device families in the market at 292.15 Mbps. That marks a significant improvement of over 80 Mbps compared to the S22 family’s speed of 211.32 Mbps, along with a jump of more than 60 Mbps compared to the S23’s speed of 229.78 Mbps. Meanwhile, iPhone 15 users experienced the second-fastest median 5G download speed in the market at 257.15 Mbps, with 5G latency nearly identical to that of the S22 and S23 families.

Bottom line: For consumers currently using an S23 or especially an S22 model, upgrading to an S24 device is worth considering. Our results in France showed that the latest Samsung lineup delivered a superior 5G speed experience over older Galaxy models, especially those in the Galaxy S22 family.

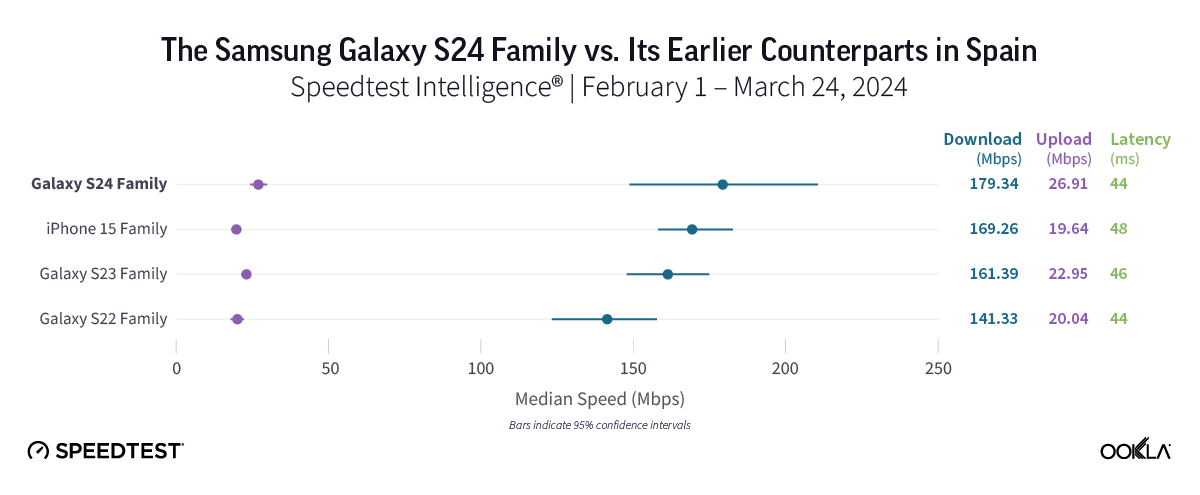
Galaxy S24’s a good choice over S22 models in Spain

All four device families in Spain provided good 5G speeds, ranging from the S22’s median 5G download speed of 141.33 Mbps to the S24 family’s speed of 179.34 Mbps. While speeds recorded on S24, S23, and iPhone 15 devices were statistically similar, the difference in speed between the S24 and S22 was much starker, with the S24 nearly 40 Mbps faster than the S22. 

Bottom line: The decision to upgrade should be more straightforward for S22 users in Spain compared to those with S23 or iPhone 15 models, as the S24’s median 5G download speed of 179.34 Mbps was almost 40 Mbps faster than that of the S22 family. 

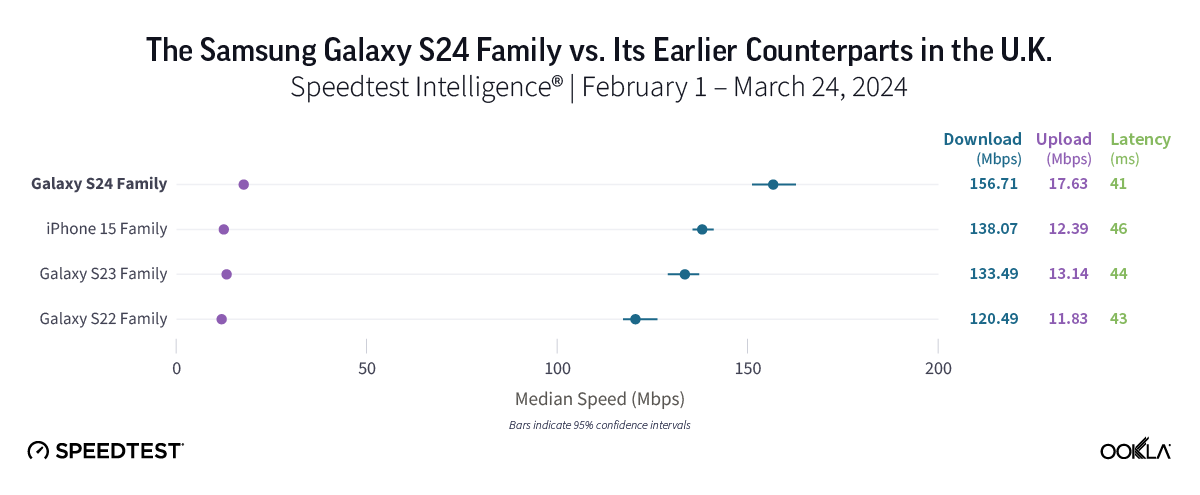
Samsung Galaxy S24 likely worth an upgrade from S22 in the U.K. 

In the U.K., Samsung Galaxy S24 models were the fastest in the market, with the S24’s median 5G download speed of 156.71 Mbps offering a speed gain of nearly 40 Mbps compared to the Galaxy S22 family. Galaxy S24 models also posted faster speeds than both the Galaxy S23 and iPhone 15 families, but the difference was less stark than it was with the S22 family, with Galaxy S22 models clocking in at 120.49 Mbps, Galaxy S23’s at 133.49 Mbps, and iPhone 15’s at 138.07 Mbps. 

Bottom line: U.K. consumers using either S22 or S23 models may want to look into upgrading to the S24 to enjoy faster speeds. That’s especially true for S22 users, given that the S24’s median 5G download speed was nearly 40 Mbps faster than that of S22 devices.

North America

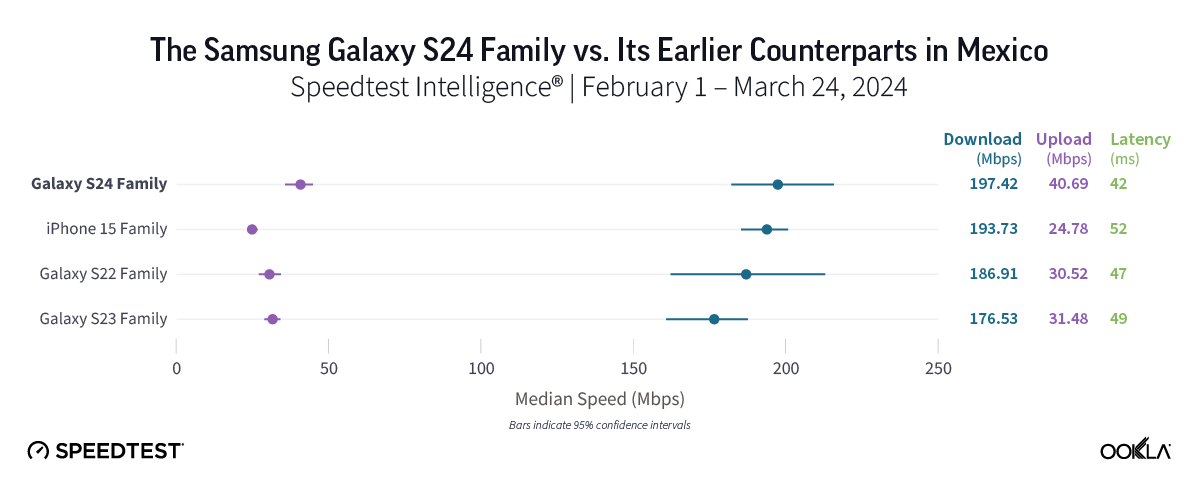
No major 5G speed boost for users in Mexico who upgraded to a Galaxy S24 

5G speeds in Mexico were impressive, with all device families posting median 5G download speeds of 176.53 Mbps or better. While Speedtest users of the Galaxy S24 family experienced the fastest median 5G download speed in the market at 197.42 Mbps, that speed marked only a modest improvement compared to Galaxy S22 devices (186.51 Mbps) and iPhone 15 models (193.73 Mbps). The Galaxy S23 family showed the slowest 5G speed in the market at 176.53 Mbps, coming in about 20 Mbps slower than Galaxy S24 models

Bottom line: For users eager to embrace the new features offered by Galaxy S24 devices or move on from S23 devices, an upgrade might be worthwhile. However, with fast 5G speeds across all device families in Mexico and only about 20 Mbps separating all four device families in our study, users likely won’t see a major change in their 5G experience by upgrading. 

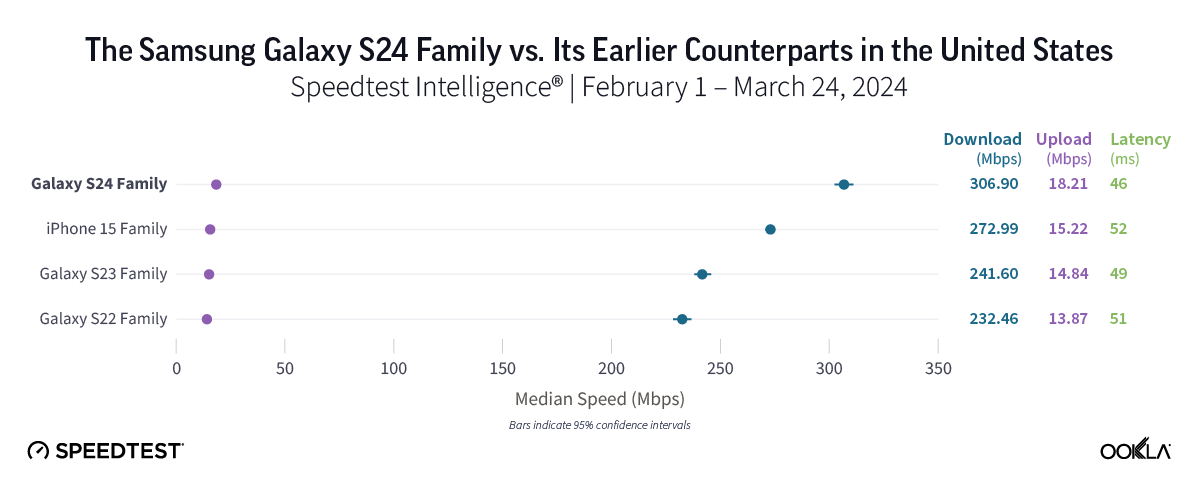
Galaxy S22 users in the U.S. could get faster 5G with the S24 family. 

5G speeds in the U.S. had an impressive showing across the board, with median 5G download speeds of at least 232.46 Mbps across all device families. The Samsung Galaxy S24 family led the way with an excellent median 5G download speed of 306.90 Mbps and the lowest median 5G multi-server latency at 45.71 ms. Users of the Galaxy S24 family enjoyed speeds roughly 75 Mbps faster than those on S22 models (232.46 Mbps) and approximately 65 Mbps faster than those on S23 devices (241.60 Mbps). Meanwhile, the iPhone 15 family also offered a strong performance, with a median 5G download speed of 272.99 Mbps. 

Bottom line: Users of older Samsung device models in the United States may want to switch to one of the newer models to capitalize on the faster 5G speeds offered by S24 devices, though speeds were strong for all device families in this study. 

Ookla will continue monitoring how devices are performing 

We’ll continue to check in on device performance as new models enter the market, so stay tuned for further insights into mobile and fixed broadband performance in countries around the world. 

If you’ve recently made the switch to an S24 device, make sure you’re getting the speeds you need by downloading the iOS or Android Speedtest® app.

Ookla retains ownership of this article including all of the intellectual property rights, data, content graphs and analysis. This article may not be quoted, reproduced, distributed or published for any commercial purpose without prior consent. Members of the press and others using the findings in this article for non-commercial purposes are welcome to publicly share and link to report information with attribution to Ookla.

| August 28, 2024

Paris - Do Major Sporting Events Leave a Network Legacy?

With the 2024 Summer Olympics in Paris having concluded on Sunday 11th August, and the handover to Los Angeles 2028 complete, we look back at how mobile networks performed during the Games, and examine the legacy of other major sporting events. Our data shows a strong increase in upload performance across both 4G and 5G networks in Paris in time for the event. However data from past events shows that this is a common trend, and that not all major sporting events leave a network legacy, with many deployments focussed on adding temporary capacity which is then removed post-event. The African Cup of Nations in Cote D’Ivoire, which took place in January and February 2024, is one exception, with 4G-LTE performance in the capital city of Abidjan increasing in time for the event and being sustained for the six month period afterwards. With so much infrastructure investment targeted at these events, often in congested areas of large cities, operators and organizers should do more to ensure they leave a lasting impact on the network user experience.

Driving network improvements to ensure sufficient capacity for major events

Major sporting events place considerable strain on public mobile networks, necessitating careful planning to anticipate demand. In the case of the Paris Olympics, organizers deployed additional cell sites and backhaul (both permanent and temporary), and added fiber. They also deployed a dedicated private wireless 5G network. Orange, the official connectivity partner of the Paris Olympics, opened up its 5G network to existing 4G consumer and business customers across France, from June to September. In addition to allowing existing 4G users to try 5G, this also freed up capacity on Orange’s 4G network, allowing it to better support 4G roaming users. The mobile operator also implemented an innovative push-to-talk (PTT) service over 4G to allow those organizing the Games to communicate more securely and effectively. For many large events like this, the host city or nation will embark upon significant upgrades to transport links and communication networks, and organizing committees such as the IOC and FIFA are increasingly keen that the events leave a legacy for residents and future visitors.

Network performance, based on consumer-initiated Speedtest samples, showed an increase in median 5G download performance in Paris during the weeks leading up to the opening ceremony on 26th July, as well as sustained performance across the duration of the event. What’s more interesting is the trend in median 5G upload speeds, which ramped up in early July to reach a weekly high of 27.07 Mbps in the week of the opening ceremony, but declined thereafter, down to 23.30 Mbps during the final week. Since the games concluded, 5G performance has picked up again, as the crowds who attended have subsided and the demand on the network abates.

Paris, Summer Olympics 2024 – Weekly Performance Before & During the Games
Speedtest Intelligence® | May – August 2024


This stronger proportional uplift in upload performance over download highlights the desire of network operators to adequately serve the anticipated spike in demand from users to upload and stream video content. Despite this, upload performance over 5G remained approximately 1/10th that of download performance, while Orange’s private wireless 5G network, geared to serve the upload of high-definition content from the Games to the International Broadcasting Centre, was configured to have 80% of its throughput dedicated to the uplink. 4G performance followed a similar pattern, showing stable median download speeds and a ramping up of upload performance.

Assessing the network legacy of past events

While we wait to evaluate the network legacy of these Games for Parisians, we examined previous sporting events, to assess whether the network infrastructure deployed had a more permanent or transitory impact on users. We looked at network performance six months prior to, during, and six months following the events.

5G Performance – Select Major Sporting Events
Speedtest Intelligence® | 2020-2024

5G uplink performance is clearly prioritized for these major events, which makes sense given the increased demand from visitors to upload and stream live content. With the exception of Tokyo, the other three major events saw a statistically significant improvement in median 5G upload speeds. The World Cup in Qatar led the way with a 34.8% improvement, followed closely by Paris with a 29.5% increase. That said, the improvements appear only temporary, with median upload speeds falling in the six months after each event. The uplift is more muted for median 5G download performance, with an increase recorded for both the Winter Olympics in Beijing and the FIFA World Cup in Qatar, while differences in 5G download speeds at the Summer Olympics in Paris and in Tokyo were too close to call. 

4G-LTE Performance – Select Major Sporting Events
Speedtest Intelligence® | 2016 – 2024

4G performance leading up to these major events paints a similar picture to 5G, with more of a focus on improvements to uplink capacity, however there is evidence of more sustained performance post-event. While there was no statistically significant increase in 4G download performance in time for the Summer Olympics in Paris, upload performance ramped up by 9.7%. We also recorded increased upload performance for the Summer Olympics in Rio de Janeiro, the Winter Olympics in Beijing, and for the African Cup of Nations in Cote D’Ivoire. The latter two of these recorded increases in both 4G download and upload performance in time for the events, and in Abidjan this performance uplift was sustained for the six months following the event.

We’ll continue to examine network performance at major events globally. We’re keen to see how the network build advances for LA28, especially given the big focus on major transport initiatives, including “Twenty-Eight by ’28”, which is really placing infrastructure development at the heart of the games.

Ookla retains ownership of this article including all of the intellectual property rights, data, content graphs and analysis. This article may not be quoted, reproduced, distributed or published for any commercial purpose without prior consent. Members of the press and others using the findings in this article for non-commercial purposes are welcome to publicly share and link to report information with attribution to Ookla.

| July 23, 2024

Is Parisian Mobile Coverage Ready for the Gold?

All eyes are on Paris this month for the 2024 Olympic Games. Hundreds of thousands of people will converge to watch the events or compete, and every single one will want to share their experience with friends, loved ones, and the internet at large. Which can only happen if they can find mobile coverage. So we analyzed Speedtest® data from Q2 2024 to help you find the best connection near the various Olympic venues in Paris.

Paris is 5G-ready overall

Map Best Available Mobile Technology in Paris

Our analysis of Speedtest data across Paris shows that 5G is available in almost every corner of the city. Coverage is not quite as complete in or near the cemeteries of Montparnasse or Pere Lachaise or in the parks of Bois de Boulogne or Bois de Vincennes, but for the most part you’ll have a hard time finding an area where you cannot connect at all. 5G offers better performance for mobile customers than 4G LTE, providing higher speeds and lower latency. To learn more about 5G, visit our 5G FAQ.

Each of the sections below will give you a good idea of what cellular connection type is most common in the area. For a view of the most common connection types for each mobile carrier, download the Speedtest app for Android or iOS and check the map tab. Pull up the drawer to select a carrier and whether you want to see the best connection type available or the most common. Remember that if you’re roaming, you may not get the performance you’re used to at home.

4th Arrondissement: Hôtel de Ville

Map of Most Common Mobile Technology in 4th Arrondissement in Paris

The Olympic marathon begins at Paris’s iconic city hall. You should be in luck for 5G coverage both at the start of the race and anywhere you wander along Rue de Rivoli and into the Arsenal section of the Marais. In northern parts of the Marais, 4G is more common, though you may still be able to connect to 5G.

7th Arrondissement: Eiffel Tower Stadium, Champ de Mars Arena, Invalides

Map of Most Common Mobile Technology in 7th Arrondissement in Paris

You’ll probably visit the Eiffel Tower and nearby Champ de Mars, even if you aren’t a fan of beach volleyball, judo, or wrestling. The good news is that 5G is the most common mobile technology near both those venues. The bad news is that there are a few small areas running up the middle of the 7th arrondissement where you’ll be on 3G or you could have no service at all. If this happens, keep walking east because you’ll pass through those areas quickly and find 5G again close to Les Invalides and leading up to Pont Alexandre III.

8th Arrondissement: Grand Palais, La Concorde, Pont Alexandre III

Map of Most Common Mobile Technology in 8th Arrondissement in Paris

The 8th arrondissement is home to venues featuring some of the newest Olympic sports, including breakdancing and skateboarding; it’s also teeming with 5G coverage and shows no dead zones. So whether you’re into fencing, taekwondo, cycling, or swimming, you’ll have access to 5G near all the major venues in this district.

12th Arrondissement: Bercy Arena

Map of Most Common Mobile Technology in 12th Arrondissement in Paris

Sharing all the gymnastics highlights should be easy at Bercy Arena in the 12th arrondissement with 5G solidly covering the southwest side of the venue up and down the Seine on Quai de Bercy. LTE is more common along the northeast side of the venue and deeper into the middle of the district. There are a few anomalous spots of 3G or no service dotted throughout the 12th arr., including near the Musée des Arts Forains, Place de la Nation, and in the Bois de Vincennes.

15th Arrondissement: South Paris Arenas

Map of Most Common Mobile Technology in 15th Arrondissement in Paris

5G is most commonly found along the southwest edge of the 15th arrondissement, including near the South Paris Arena. If you’re walking south from the Eiffel Tower and the 7th arrondissement for the handball, table tennis, volleyball, or weightlifting events at South Paris Arenas, you’ll likely be bumping back and forth between 4G and 5G. There are also a few small areas of 3G or no service scattered throughout the district, so if you’re having trouble connecting, walk a few hundred meters and try again because you’ll be back on LTE.

16th Arrondissement: Trocadéro, Parc des Princes, Stade Roland-Garros

Map of Most Common Mobile Technology in 16th Arrondissement in Paris

If you’re watching football, cycling, boxing, or tennis at any of the three Olympic venues in the 16th arrondissement, you’ll likely have 5G. However, you may quickly find yourself on 4G LTE if you’re wandering the district at large. As we saw in other districts, the edge of the Seine is a reliable place to find 5G should you need a faster connection.

18th Arrondissement: Porte de la Chapelle Arena

Map of Most Common Mobile Technology in 18th Arrondissement in Paris

Fans of badminton and rhythmic gymnastics will find the area around Porte de la Chapelle Arena in the 18th arrondissement to be well covered with 5G. In general, the northern part of this district has more 5G coverage, but there are a few areas of 3G or no service scattered throughout the southern half of the 18th arr.

To see what mobile coverage you can expect at Olympic venues outside of Paris or for a personalized view of mobile coverage by operator, download the free Speedtest app for Android or iOS and check the map tab. Be aware that massive crowds can weigh heavily on a network, so if you are having trouble connecting, check Downdetector® to see if there’s an outage or if a particular service is down.

Ookla retains ownership of this article including all of the intellectual property rights, data, content graphs and analysis. This article may not be quoted, reproduced, distributed or published for any commercial purpose without prior consent. Members of the press and others using the findings in this article for non-commercial purposes are welcome to publicly share and link to report information with attribution to Ookla.

| June 24, 2024

How Much Faster is 5G Anyway? An Analysis of Page Load Speed

There’s nothing quite like picking up your phone for a little “me” time only to open up that first web page… and wait for it to load. Maybe the images aren’t there yet or the content jumps around while the ads load — it’s the worst. 5G is meant to help, so we dug into Speedtest® quality of experience data to see if this newer technology is living up to its promise. Read on for an analysis of page load speed (how many milliseconds it takes for a page to load) on three popular services in nine major countries around the world during Q1 2024.

Click the country below to go directly to that section or read on for the full article:

Brazil | Canada | France | India 

Mexico | Nigeria 

South Africa | Spain | United States

Page speed relies on low latency for the best internet experience

Page load speed is a critical measure of your web browsing experience. It measures how long it takes for a page to load, fully displaying the content on that page. This is directly impacted by latency, which is how quickly your device gets a response after you’ve sent out a request. A typical request on the internet requires two to five round trip communications between various entities over different latency sensitive protocols.

One of the promises of 5G is lower latency, which should lead to a faster (lower) page load speed on any page. The Speedtest Global IndexTM reported the global average for mobile latency as 27 milliseconds (0.027 seconds) with fixed broadband at 9 ms (0.009 s) in May 2024. As seen in the video below, it can take 7x longer to load a full webpage when latency is high, and “40% of users will abandon a site if it takes more than 3 seconds to load,” according to one source. Read more about the importance of latency to quality of experience.

5G lived up to the latency promise, showing a faster page load speed than 4G on all services in all countries we surveyed. However, the improvement was not the same in all places, with Canada topping the list of fastest page load speed over 5G on all the services we surveyed while South Africa had the slowest 5G page load speed on Google and YouTube of countries reviewed here. Read on for details.

5G loads 20-30% faster than 4G in Brazil

Chart of 5G vs. 4G Page Load Speed in Brazil

Speedtest data shows that 5G delivered a much lower page load speed than 4G on all three services in Brazil during Q1 2024. Google loaded 20% faster on 5G than 4G, YouTube was 25% faster, and Facebook was 30% faster on 5G.

Canada’s 5G page load speed among the fastest on all 3 services

Chart of 5G vs. 4G Page Load Speed in Canada

As mentioned, Canada’s 5G page load speed was the fastest or among the fastest for all countries analyzed in this article, with Canada having the fastest page load speed on Facebook, Google, and YouTube. Our analysis demonstrated that 5G delivered a decently faster page load speed than 4G on all three services in Canada during Q1 2024. YouTube loaded 16% faster on 5G than 4G, Google was 18% faster, and Facebook was 23% faster on 5G.

French 5G loads 14-20% faster than 4G

Chart of 5G vs. 4G Page Load Speed in France

Speedtest data shows 5G page load speed on all three services was decently faster than on 4G in France during Q1 2024. YouTube loaded 14% faster on 5G than 4G, Facebook was 19%, and Google was 20% faster on 5G.

5G loads 23-33% faster than 4G in India

Chart of 5G vs. 4G Page Load Speed in India

Analysis of Speedtest data shows the page load speed on all three services was much lower on 5G than 4G in India during Q1 2024. Google loaded 23% faster on 5G than 4G, YouTube was 32% faster, and Facebook was 33% faster on 5G. India and Mexico had the slowest page load speeds for Facebook over 5G of any of the countries we looked at.

Mexican 5G loads 26-28% faster than 4G

Chart of 5G vs. 4G Page Load Speed in Mexico

Speedtest data shows 5G delivered a much lower page load speed than 4G on all three services in Mexico during Q1 2024. Google and Facebook loaded 26% faster on 5G than 4G and YouTube was 28% faster on 5G. Mexico and India had the slowest 5G page load speeds for Facebook among the countries examined.

5G loads up to 47% faster than 4G in Nigeria

Chart of 5G vs. 4G Page Load Speed in Nigeria

Our analysis revealed 5G delivered a much lower page load speed than 4G on all three services in Nigeria during Q1 2024. Google loaded 24% faster on 5G than 4G, YouTube was 27% faster, and Facebook was a whopping 47% faster on 5G.

South Africans see 22-36% faster 5G page load over 4G, but slow Google and YouTube

Chart of 5G vs. 4G Page Load Speed in South Africa

Speedtest data shows 5G delivered a much lower page load speed than 4G on all three services in South Africa during Q1 2024. Google loaded 22% faster on 5G than 4G, YouTube was 27% faster, and Facebook was 36% faster on 5G. South Africa had the slowest 5G page load speed for both Google and YouTube of any of the countries analyzed.

5G loads 11-15% faster than 4G in Spain

Chart of 5G vs. 4G Page Load Speed in Spain

5G page load speed in Spain was somewhat faster than 4G on all three services during Q1 2024. YouTube loaded 11% faster on 5G than 4G, Google was 14% faster than 4G, and Facebook was 15% faster on 5G.

U.S. 5G loads 21-26% faster than 4G

Chart of 5G vs. 4G Page Load Speed in United States

Speedtest data from the U.S. shows 5G delivered a much lower page load speed than 4G on all three services during Q1 2024. Google loaded 21% faster on 5G than 4G, YouTube was 22% faster, and Facebook was 26% faster on 5G.

Your time is valuable. Our data shows that you can get some of that important time back if you have access to 5G and can afford to upgrade. To learn more about your network experience, download the Speedtest app for Android or iOS. Remember, too, that there’s a Downdetector® tab in the Speedtest apps to help you troubleshoot pages that aren’t loading at all.

Ookla retains ownership of this article including all of the intellectual property rights, data, content graphs and analysis. This article may not be quoted, reproduced, distributed or published for any commercial purpose without prior consent. Members of the press and others using the findings in this article for non-commercial purposes are welcome to publicly share and link to report information with attribution to Ookla.