| May 8, 2023

New Speedtest Data Shows Starlink Users Love Their Provider

Satellite internet competition is heating up and Ookla® has exciting, fresh data from Q4 2022 and Q1 2023 for HughesNet, SpaceX’s Starlink, and Viasat in North America, South America, and the Caribbean, as well as new Starlink markets we haven’t yet featured in our ongoing satellite internet series

This analysis includes Starlink Net Promoter Score (NPS) for metro and nonmetro internet connections in the United States, year-over-year data for Starlink in Canada, Chile, Mexico, and the U.S., and Starlink results from three new countries (Philippines, Nigeria, and Peru).

Starlink users in metro and nonmetro areas love Starlink, fixed broadband users dislike their internet service providers

Using Speedtest Intelligence®, we examined NPS ratings by Starlink users and all fixed broadband providers combined for “metropolitan” and “nonmetropolitan” counties as defined by the U.S. Office of Management and Budget. NPS based on Speedtest® user responses after being asked how likely they are to recommend their provider to friends or family on a 0 to 10 scale. NPS ratings are categorized into Detractors (score 0-6), Passives (score 7-8), and Promoters (score 9-10), and is calculated as (% Promoters – % Detractors) x 100. Any NPS score above 0 indicates that a provider’s audience is more loyal than not.

Chat of Metropolitan vs. Nonmetropolitan NPS and Performance in the United States

As you see above, the difference in NPS between Starlink and all fixed broadband providers combined is stark: both metro and nonmetro Starlink far outperformed metro and nonmetro ISPs combined for NPS. Metro Starlink had a score of 31.94 compared to -23.62 for all metro fixed broadband providers combined, despite Starlink having a median download speed of 65.29 Mbps compared to 203.93 Mbps for all metro fixed broadband providers combined. Nonmetro Starlink had an even higher NPS at 42.21 compared to nonmetro ISPs at -21.27 — that’s especially notable given that Starlink’s median download speed was much closer to the median nonmetro fixed broadband speed at 72.18 Mbps to 100.41 Mbps. 

Clearly, Starlink provides a much loved option for more rural, nonmetro users who often don’t have many good — if any — internet options. And the message is loud and clear: Starlink users are more than willing to recommend the service and love the internet they are getting.

Starlink speeds increased in Canada and the U.S. over the past two quarters, but are mixed year-over-year

Chart of Starlink Performance in Select Countries in North and South America

As Starlink continues to become an increasingly popular and beloved option for users, especially those in more rural areas, steady increases in speeds in two large markets like Canada and the U.S. bode well for the internet provider. These increases come as major upgrades to Starlink’s satellite array are beginning, with Starlink having just launched 46 nextgen satellites on April 27, so we wouldn’t be surprised if speeds keep climbing across the globe.

In North America, all of the countries we surveyed saw slower median download and upload speeds during Q1 2023 than Q1 2022. However, Canada saw just about a 3 Mbps decrease in download speed from Q1 2022 to Q1 2023, with about a 28 Mbps increase over the past two quarters. The U.S., where Starlink has many more users, saw about a 24 Mbps decrease year-over-year for median download speeds, but at least a 13 Mbps increase during Q4 2022 and Q1 2023. Mexico, which saw 100+ Mbps median download speeds during Q1 2022, saw a roughly 49 Mbps dip year-over-year as more users signed up for the service; however, speeds leveled slightly with only an overall dip of about 8 Mbps during the past two quarters.

In South America, Chilean Starlink speeds slowed about 22 Mbps from Q1 2022 to Q1 2023, however, speeds only slowed about 8 Mbps over the past two quarters. Chile has continually ranked in the top four for fastest fixed broadband speeds on the Speedtest Global Index™ for over a year now. 

Starlink in Canada blazed ahead as the fastest satellite provider in mainland North America

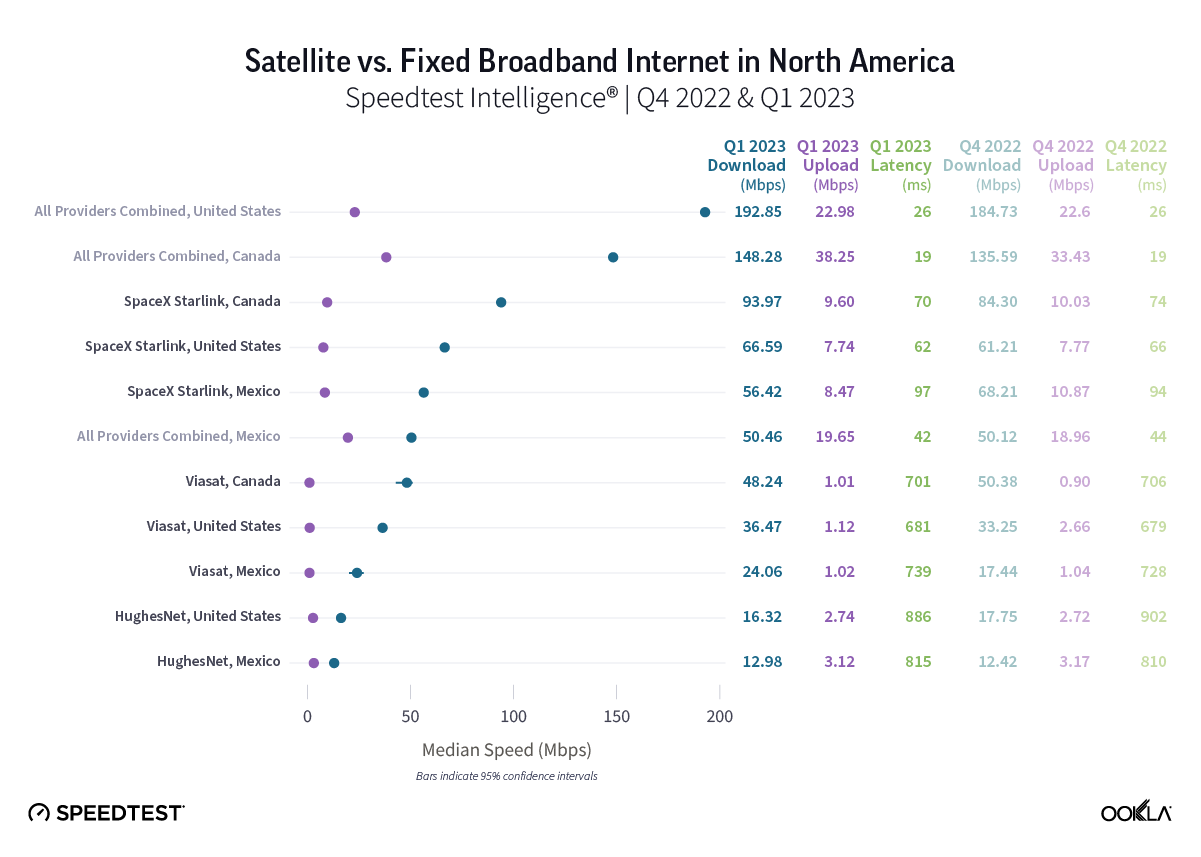
Chart of Satellite vs. Fixed Broadband Internet in North America

Speedtest Intelligence reveals that Starlink in Canada had the fastest download speed among satellite providers in mainland North America at 93.97 Mbps. That was about 40% faster than the runner-up, which was Starlink in the U.S. at 66.59 Mbps. Starlink in Mexico was next at 56.42 Mbps, and was faster than all fixed broadband providers in Mexico combined at 50.46 Mbps. 

Viasat in Canada, Mexico, and the U.S. made noticeable performance leaps over download speed from Q3 2022 when we last measured North American satellite providers. Canada went from 24.36 Mbps in Q3 2022 to 48.24 Mbps in Q1 2023, the U.S. from 28.07 Mbps to 36.47 Mbps, and Mexico from 16.14 Mbps to 24.06 Mbps. Hughesnet trailed over download speed in the U.S. (16.32 Mbps) and in Mexico (12.98 Mbps).

For upload speeds, all satellite providers trailed fixed broadband speeds in their respective countries, with Starlink in Canada achieving the fastest satellite upload speed at 9.60 Mbps, followed by Starlink in Mexico (8.47 Mbps) and the U.S. (7.74 Mbps). Viasat and HughesNet trailed behind.

Multi-server latency showed the stark difference of satellite internet’s real limitations, with the huge distances between satellite and users adding up to longer lag times than fixed broadband. Starlink had the only latencies under 100 ms among satellite providers, with Starlink in the U.S. having the lowest latency at 62 ms, followed by Canada (70 ms) and Mexico (97 ms). Viasat and HughesNet, which have farther geosynchronous orbits (GEO) than Starlink’s low-earth orbit (LEO), had much higher latencies.

Starlink in Chile raced ahead as the fastest satellite provider in South America

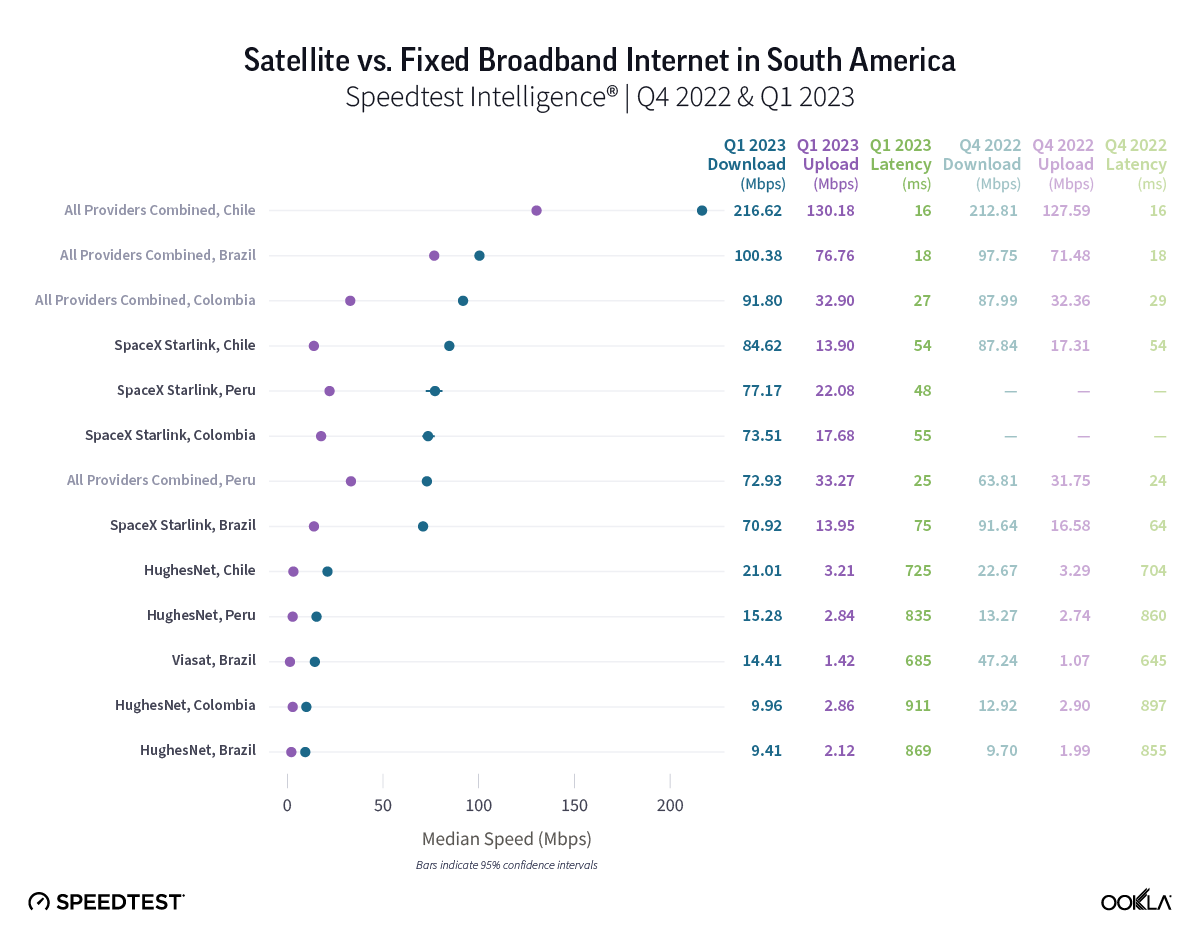
Chart of Satellite vs. Fixed Broadband Internet in South America

Starlink in Chile was the fastest satellite provider in South America during Q1 2023, edging out Starlink in Peru by about 5% with a median download speed at 84.62 Mbps to 77.17 Mbps. No satellite provider outperformed all fixed broadband providers combined in Q1 2023, but Starlink in Colombia and Brazil both reached median download speeds above 70 Mbps at 73.51 Mbps and 70.92 Mbps, respectively. HughesNet in Chile broke 20 Mbps at 21.01 Mbps, while Viasat in Brazil only reached 14.41 Mbps.

Satellites were outperformed by fixed broadband over upload speed in South America during Q1 2023, but Starlink had median upload speeds that ranged from 13.90 Mbps to 22.08 Mbps, the fastest being in Peru. HughesNet ranged from 2.12 Mbps to 3.21 Mbps, and Viasat in Brazil was at 1.42 Mbps.

Starlink’s multi-server latency dipped below 60 ms in three South American markets during Q1 2023: Peru (48 ms), Chile (54 ms), and Colombia (55 ms). Brazil followed at 75 ms, which was the next lowest. Viasat and HughesNet trailed far behind.

Starlink in Jamaica was the fastest Caribbean satellite provider

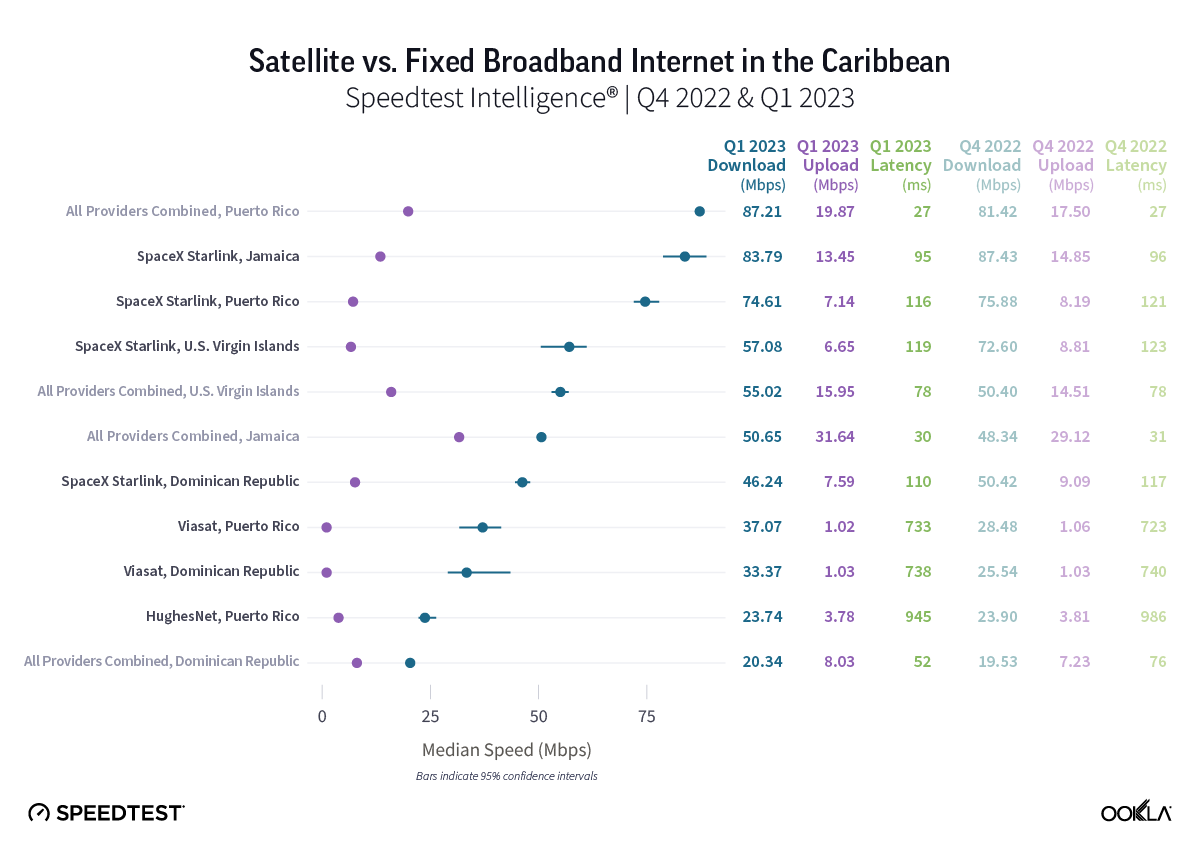
Chart of Satellite vs. Fixed Broadband Internet in the Caribbean

Speedtest Intelligence reveals that Starlink in Jamaica was the fastest satellite provider in the Caribbean at 83.79 Mbps during Q1 2023. Starlink was faster than all fixed broadband providers in Jamaica, and both Starlink and Viasat were faster than all providers combined in the Dominican Republic during Q1 2023. Starlink reached median download speeds of over 50 Mbps during Q1 2023 in Jamaica (83.79 Mbps), Puerto Rico (74.61 Mbps), and the U.S. Virgin Islands (57.08 Mbps), while it fell just short of that benchmark in the Dominican Republic (46.24 Mbps). Viasat had median download speeds of 37.07 Mbps and 33.37 Mbps in Puerto Rico and the Dominican Republic, respectively, during Q1 2023, while HughesNet had a median download speed of 23.74 Mbps in Puerto Rico during Q1 2023.

Upload speeds showed a bit more parity between satellite providers with only Starlink in Jamaica rising above 10 Mbps with a median upload speed of 13.45 Mbps during Q1 2023. Starlink had median upload speeds ranging from 6.65 Mbps to 13.45 Mbps, HughesNet had a median upload speed at 3.78 Mbps in Puerto Rico, and Viasat had upload speeds of 1.02 Mbps and 1.03 Mbps in Puerto Rico and the Dominican Republic, respectively, during Q1 2023. 

For multi-server latency, Caribbean satellite users saw higher multi-server latencies than mainland North and South America with only Starlink in Jamaica breaking under 100 ms. While fast speeds for remote users are always going to be appreciated, multi-server latencies of over 100 ms do make some internet uses much harder to do well like live gaming and video conferencing.

New Q1 2023 Starlink countries show promising initial results

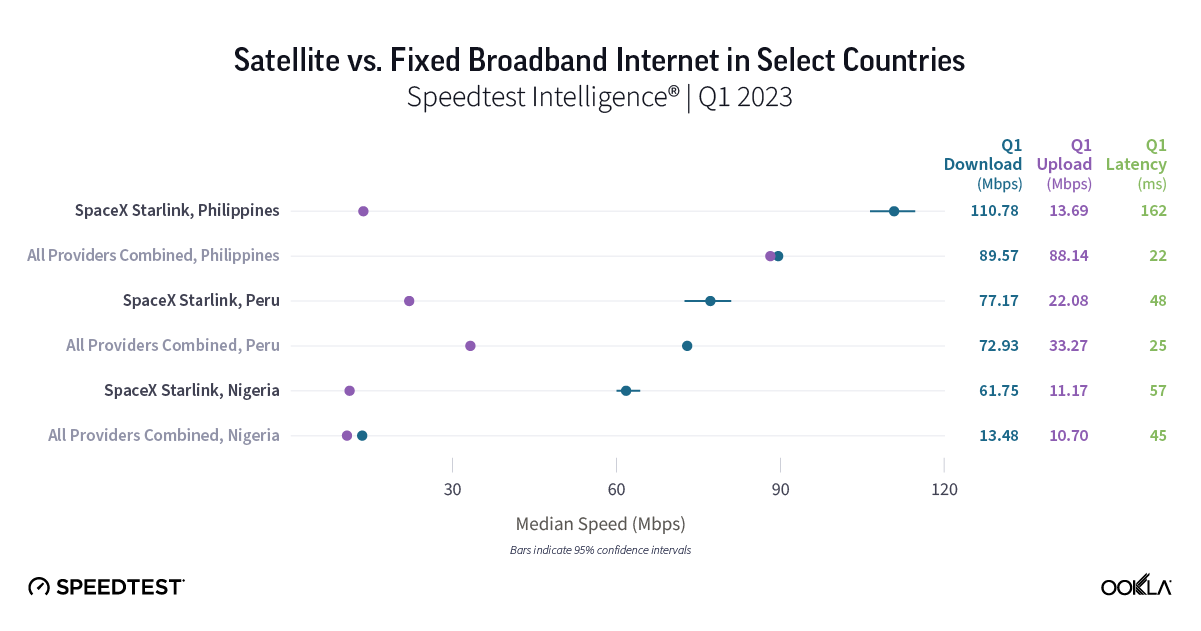
Chart of Satellite vs. Fixed Broadband Internet in Select Countries

Speedtest Intelligence data shows new Starlink data in three countries during Q1 2023, including Nigeria, Peru, and the Philippines, where Starlink is still a nascent provider with limited market share. Median download speeds for new Starlink countries were: 110.78 Mbps in the Philippines, 77.17 Mbps in Peru, and 61.75 Mbps in Nigeria during Q1 2023. 

Starlink had slower upload speeds than all fixed broadband providers combined in all of the new countries except Nigeria, which was too close to call at 11.17 Mbps to 10.70 Mbps. Starlink had a much higher latency than fixed broadband providers in the Philippines (162 ms) in Q1 2023, though it came very close in Nigeria 57 ms to 46 ms. 

It should be noted that satellite constellations have limited network bandwidth capacity, which may affect the consumer experience as more users sign up for the service. Starlink’s reach within these markets will also be limited by the cost of equipment (CPE) in particular, which ranges from PEN 1,750 ($470) in Peru, to PHP 29,320 ($530) in the Philippines and NGN 268,584 ($590) in Nigeria (prices correct at time of publication).

The 2023 space revolution is off to a huge start

Here are some major updates about what’s next for various different satellite competitors:

Amazon’s Project Kuiper showcases low-cost customer satellite terminals

After Amazon’s Project Kuiper 3,236 satellite LEO constellation was greenlit by the FCC, Amazon swiftly moved to showcase its consumer terminals in March. These new terminals have different tiered models, which are promised to deliver 100 Mbps and 400 Mbps models for consumers and businesses, and 1 Gbps models for “enterprise, government, and telecommunications applications that require even more bandwidth.” Furthermore, Amazon is getting into the chipset business and producing their own 5G modem chip, which will feature in each terminal.

Viasat launched its Viasat-3 arrays

On April 30, 2023, Viasat launched the first of three long-awaited Viasat-3 arrays, which aims to provide 1 Terabit per second (Tbps) of network capacity on each satellite, double that of the entire operating fleet. Add two more satellites and Viasat could raise the throughput up to 500-600% of its current network capacity. That could allow its users to experience 100+ Mbps connections — a huge improvement for many consumers. We’ll be eagerly anticipating results in the coming quarters.

Eutelsat, OneWeb, and Intelsat are making big moves

While the merger of Eutelsat and OneWeb has yet to be fully completed, both satellite operators inked major deals with Intelsat to add more global satellite capacity. Furthermore, OneWeb launched an additional 36 LEO satellites into orbit in late March 2023, providing additional options for many of its resellers. 

European Union greenlights multi-orbit constellation

The European Union has approved its multi-orbit, €6 billion constellation plan, which includes GEO, MEO, and LEO arrays, and will offer connectivity to all EU citizens. The project will support EU connectivity priorities including the economy, environment, security and defense, and is hoping to launch in 2024, and be fully operational by 2027.

HughesNet aiming to launch Jupiter 3 array in Q2 2023

Incumbent satellite internet provider HughesNet has revealed its new Jupiter 3 array, which is designed to offer 500 Gbps over Ka-band and will allow HughesNet to provide consumers offerings of 50 Mbps and 100 Mbps. While the array still doesn’t have an official launch, the Jupiter 3 array is “doubling the size of the Hughes JUPITER fleet over North and South America.”

Ookla will continue monitoring new satellite internet developments

As 2023 continues to shape up as a pivotal year for satellite internet providers, we’ll be watching the sky to make sure providers are providing the connectivity consumers need. We’ll continue our series next quarter with Q1 and Q2 2023 data from Asia, Europe, Oceania, and any new countries where Starlink launches, and be back with Africa, North America, and South America data in Q4 2023. In the meantime, be sure to download the Speedtest® app for Windows and Mac computers or for iOS or Android for devices and see how your satellite internet stacks up to our findings.

Editor’s note: This article was updated on May 10 with clarifying details and an updated chart.

Ookla retains ownership of this article including all of the intellectual property rights, data, content graphs and analysis. This article may not be quoted, reproduced, distributed or published for any commercial purpose without prior consent. Members of the press and others using the findings in this article for non-commercial purposes are welcome to publicly share and link to report information with attribution to Ookla.

| November 30, 2022

Starlink Speeds Dipped Slightly During Q3 2022 as the Space Race Heats up

Ookla® has exciting, fresh data from Q3 2022 for SpaceX’s Starlink, HughesNet, and Viasat in North and South America, as well as new Starlink markets we haven’t yet featured in our ongoing series on satellite internet. With accelerating competition on the horizon for 2023, we’ve been eager to see how Starlink continues to perform, especially as building new fiber connections continues to be costly around the world. 

This analysis includes results from five additional countries, two new providers, and expanded data for Starlink, HughesNet, and Viasat. We also examine how Starlink’s internet performance has changed over the past year in Canada, Chile, and the United States.

Starlink performance dipped once again during Q3 2022 (though only slightly)

Chart of Starlink perfromance in select North and South American countries

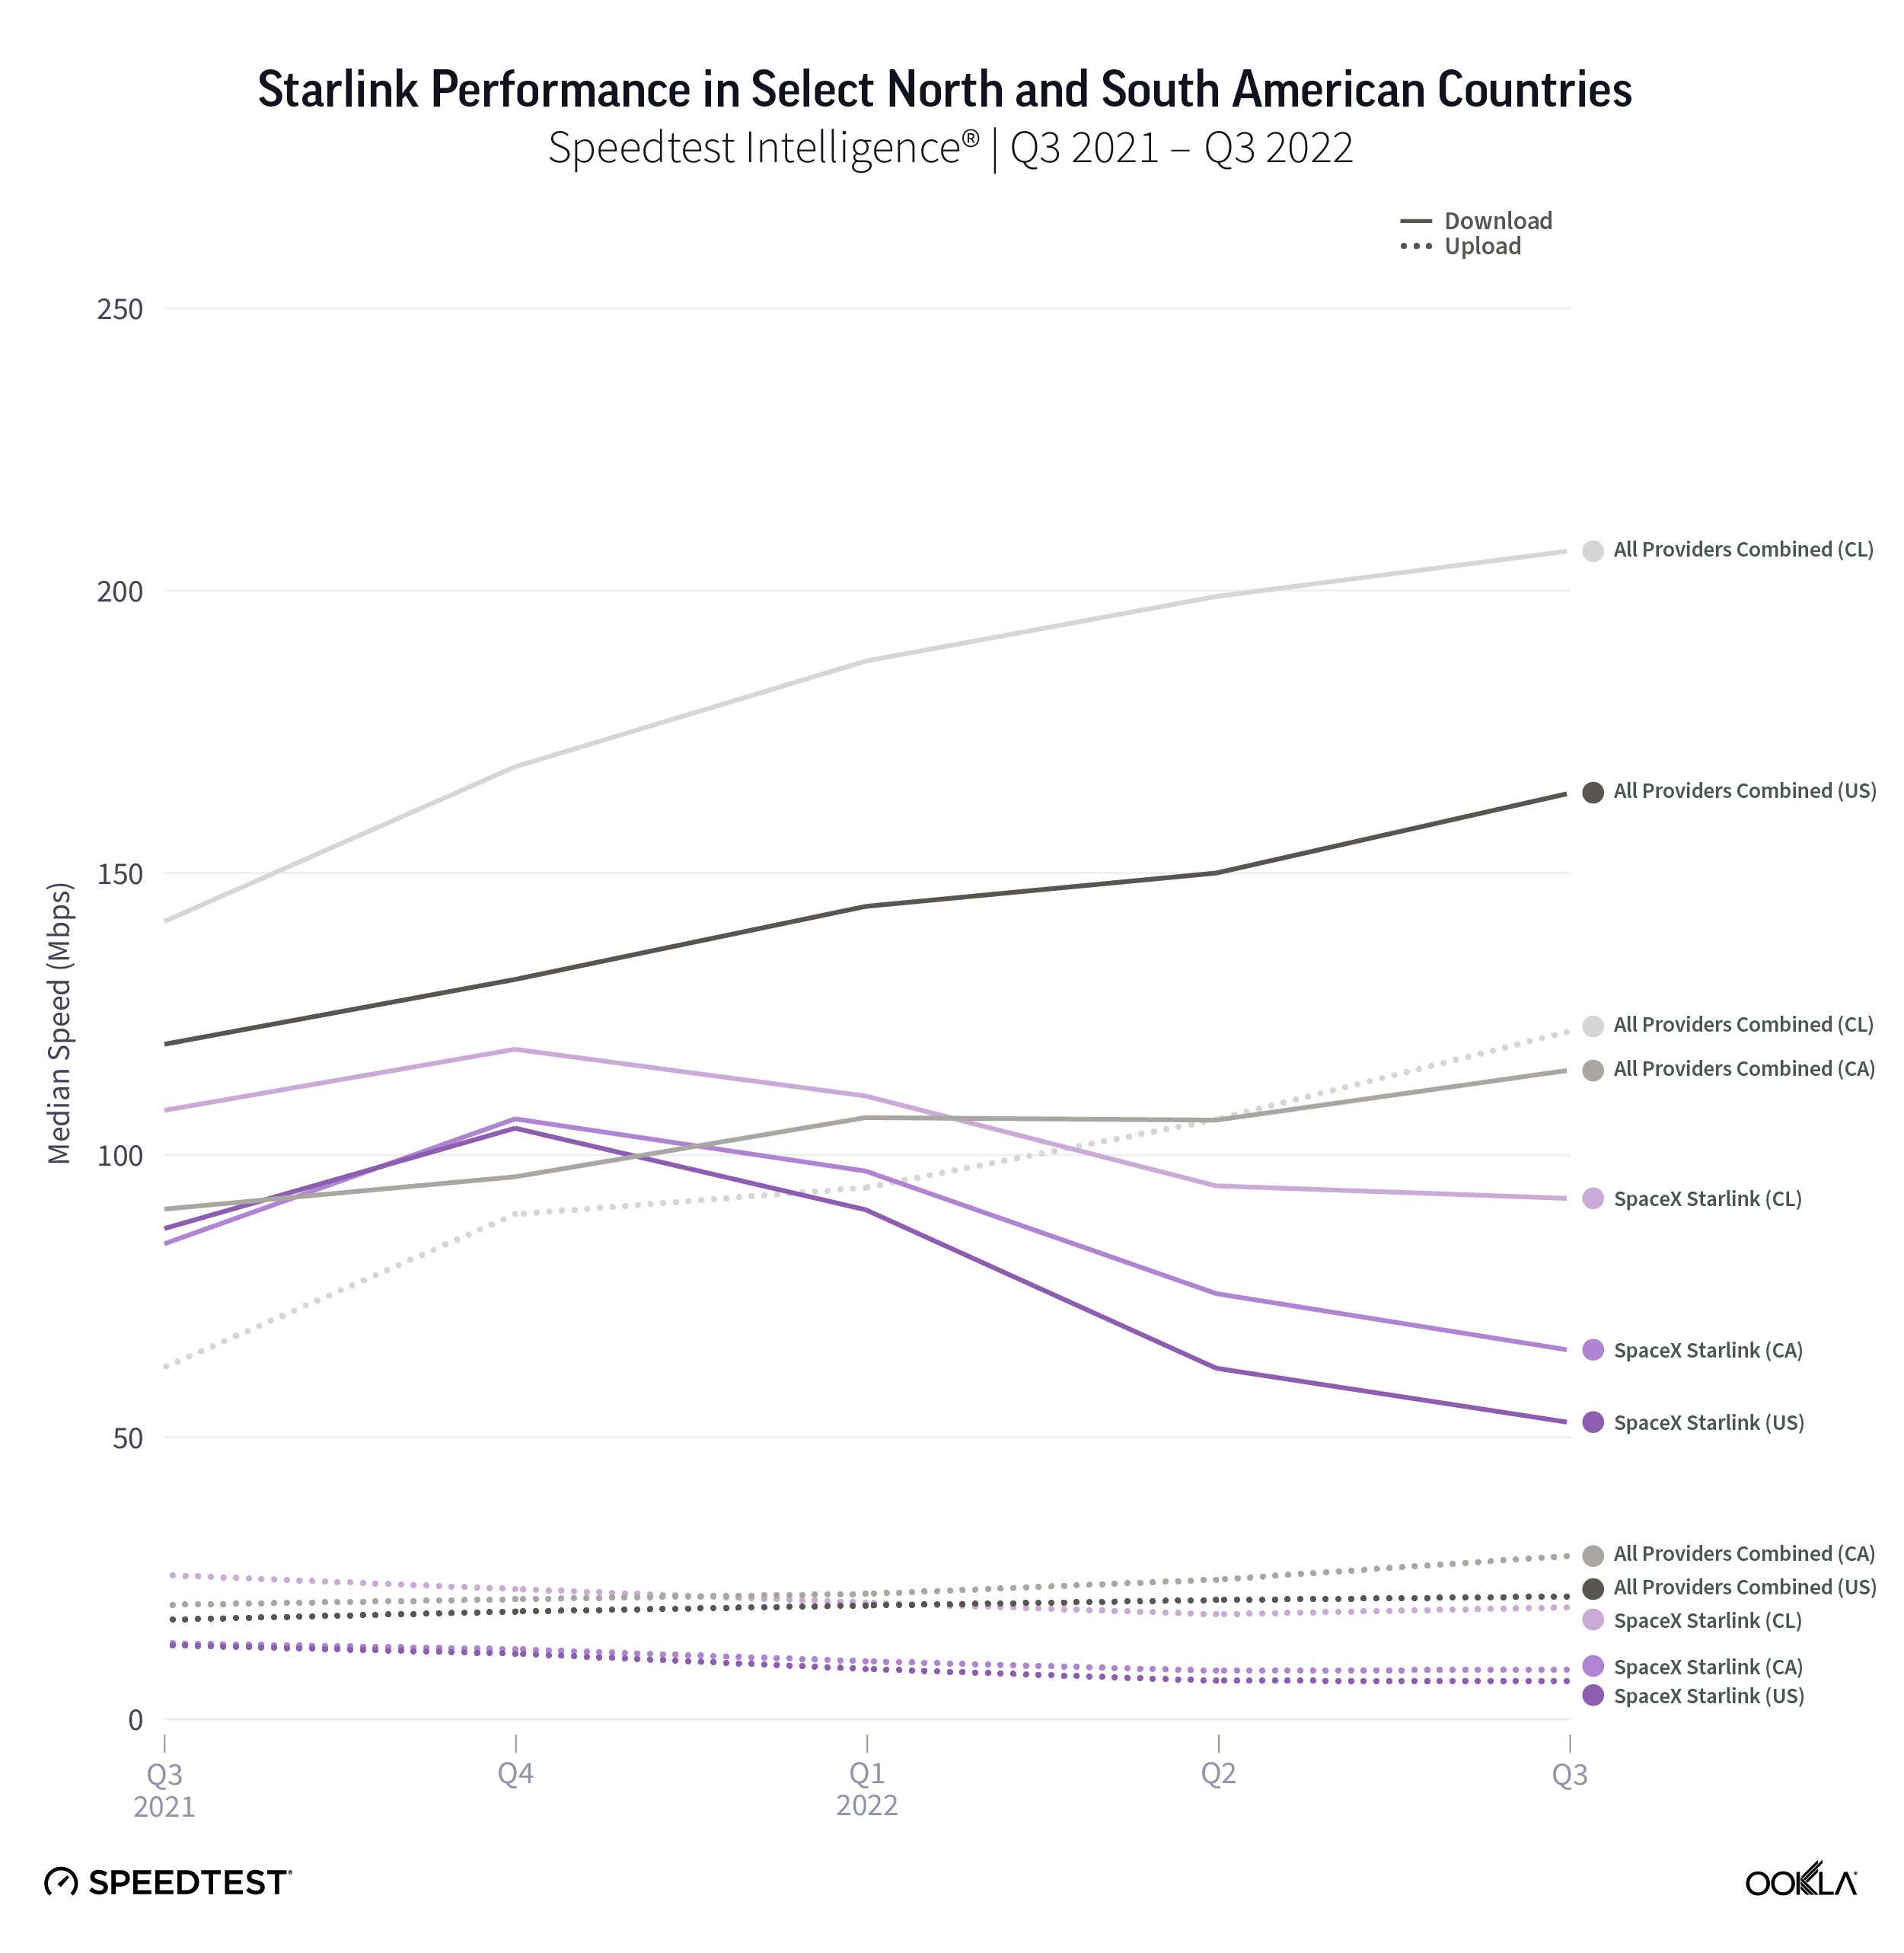
Perhaps a victim of their own success, Starlink download speeds dropped once again in Canada (at least 14%) and the U.S. (at least 17%) from Q2 to Q3 2022, while speeds remained roughly the same in Chile quarter over quarter. During the same period, fixed broadband performance raced ahead, improving at least 8% to 115.18 Mbps in Canada, at least 4% to 207.04 Mbps in Chile, and at least 8% to 164.13 Mbps in the U.S. 

Over the past year, as we’ve seen more users flock to sign up for Starlink (reaching 400,000 users worldwide during Q2 2022), speeds have started to decrease. Without a doubt, Starlink often can be a life-changing service for consumers where connectivity is inadequate or nonexistent. Even as speeds slow, they still provide more than enough connectivity to do almost everything consumers normally need to do, including streaming 4K video and video messaging. The biggest thing you might have issues with is if you’re trying to play multiplayer online games — even being a low-earth orbit (LEO) satellite, latency still lags far behind low-latency fixed broadband connections.

Starlink upload speeds remained roughly unchanged in all three countries we surveyed during Q3 2022, improving marginally in Canada and Chile, and essentially staying the same in the U.S. 

Starlink remains a boon for rural U.S. consumers who can afford it

Map of Starlink expansion in U.S. counties

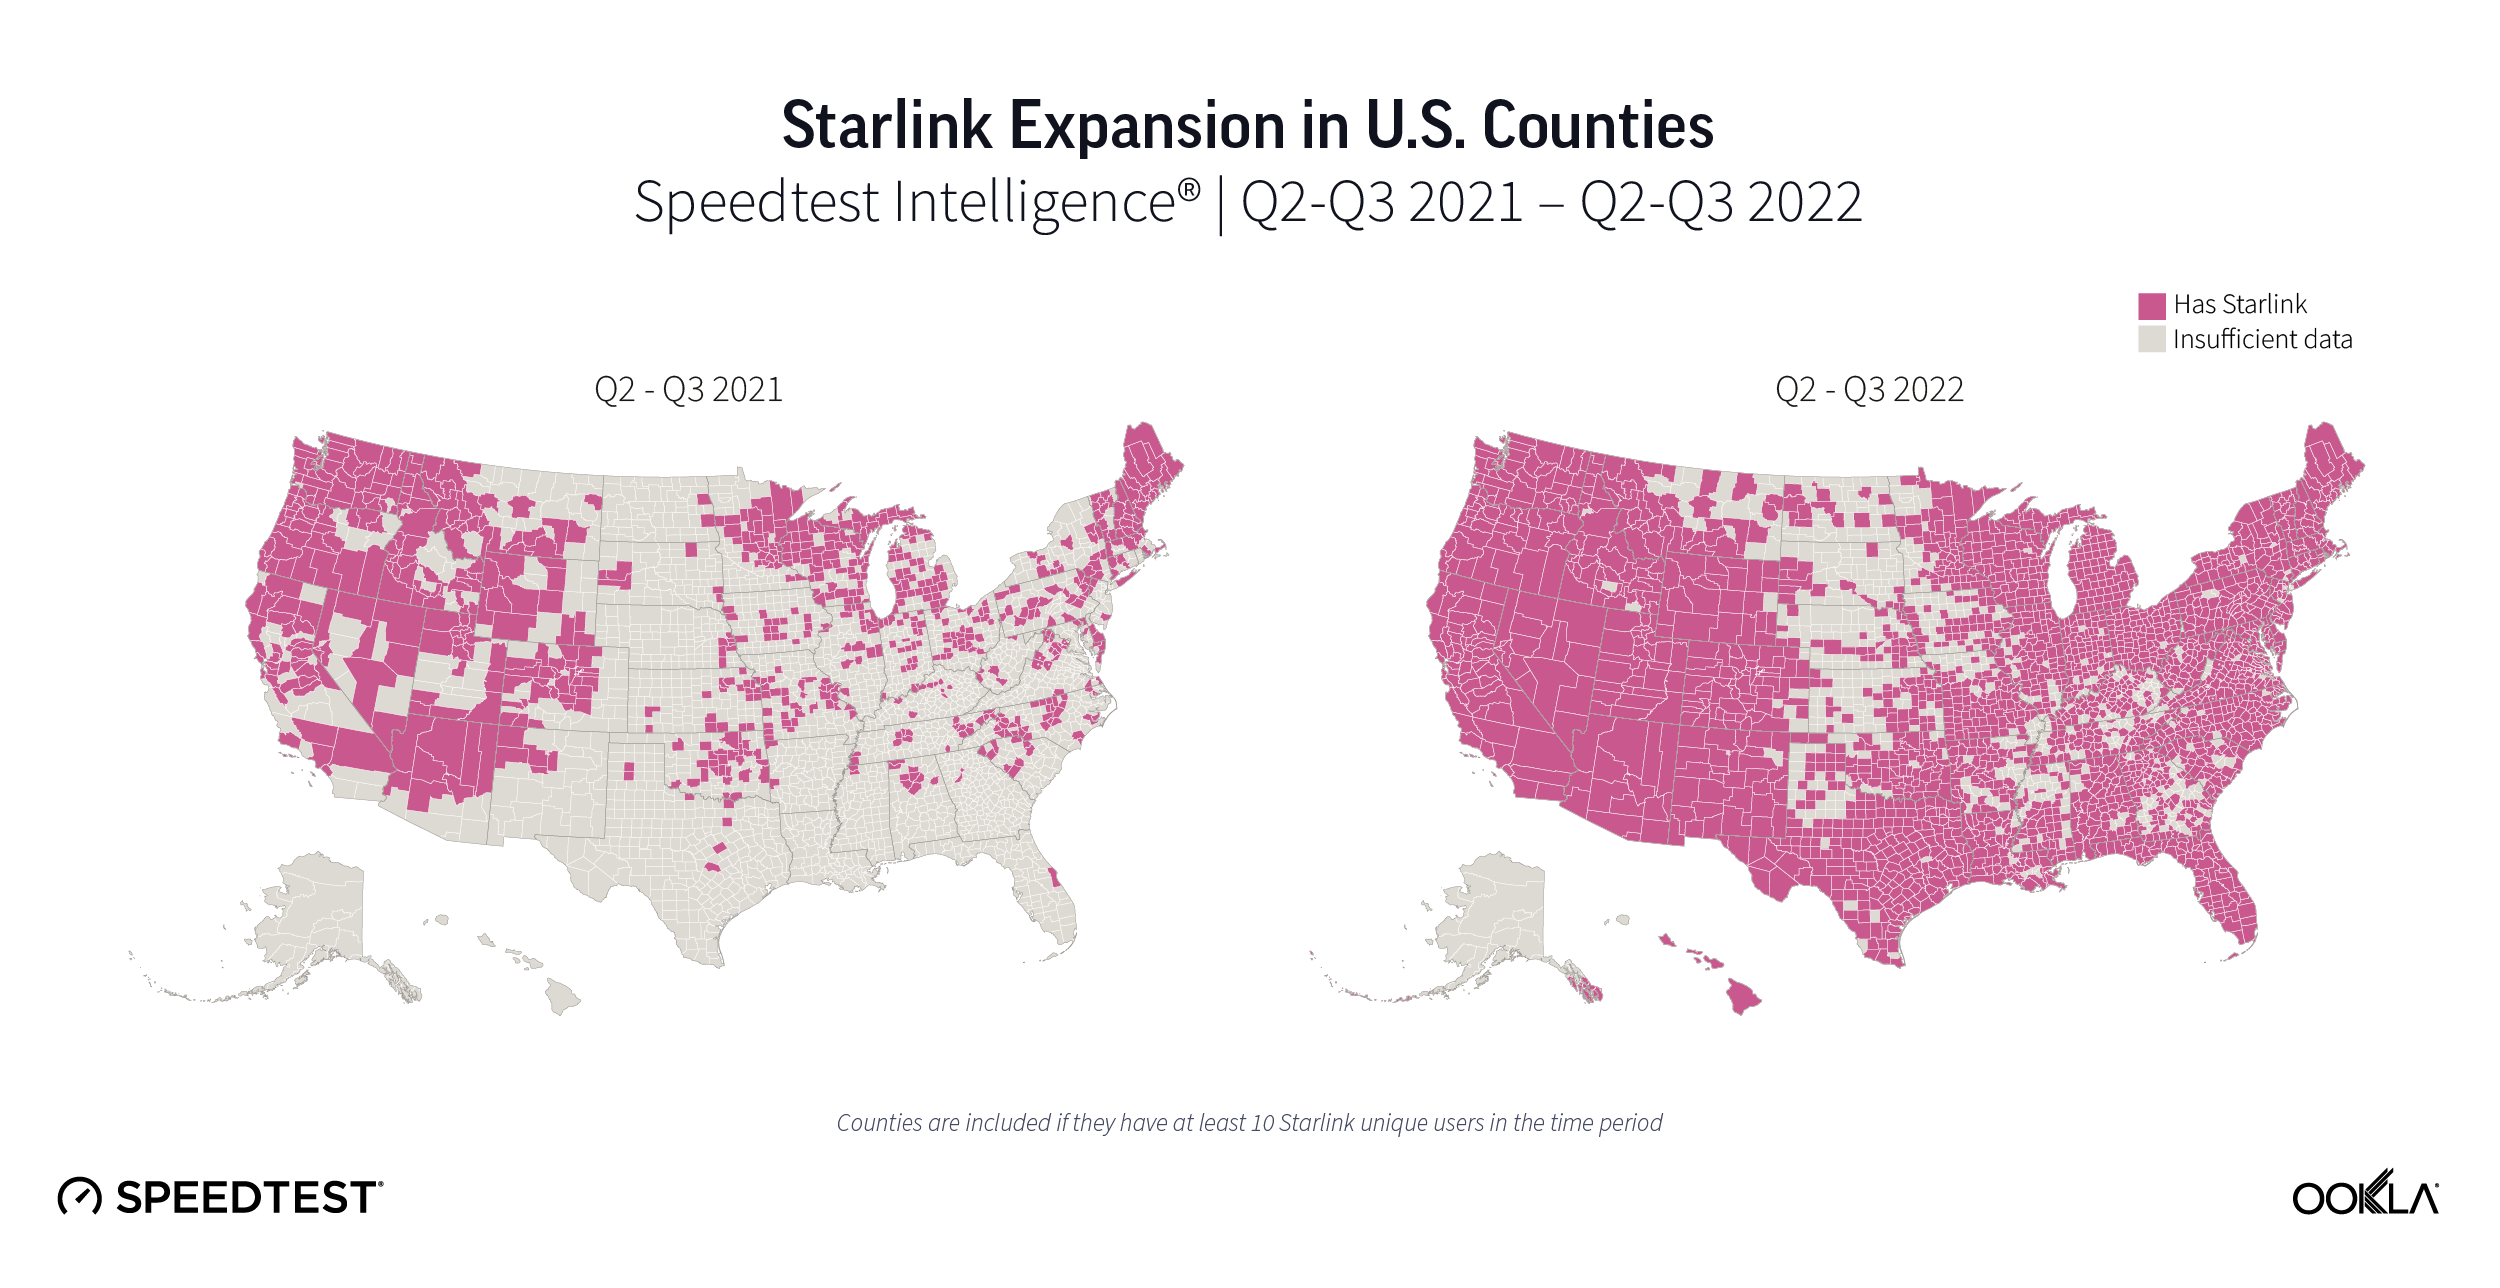
Over the past year, Starlink has proliferated across the U.S., going from having at least 10 unique users in 776 U.S. counties, or roughly 25% of all counties during Q2-Q3 2021 to 2,399 counties in Q2-Q3 2022, or roughly 75% of counties. That marks about a 200% increase year over year, indicating consumer confidence in the provider. 

Looking at only “nonmetro” counties as defined by the U.S. Office of Management and Budget, 336 counties showed at least 10 Starlink users in Q2-Q3 2021. That was about 17% of all nonmetro counties. In Q2-Q3 2022, that rose to 1359 counties, or about 69% of nonmetro counties, marking about a 300% increase year over year. 

Starlink in Puerto Rico and the U.S. Virgin Islands had the fastest satellite internet in North America

Chart of satellite performance compared to fixed broadband internet in North America

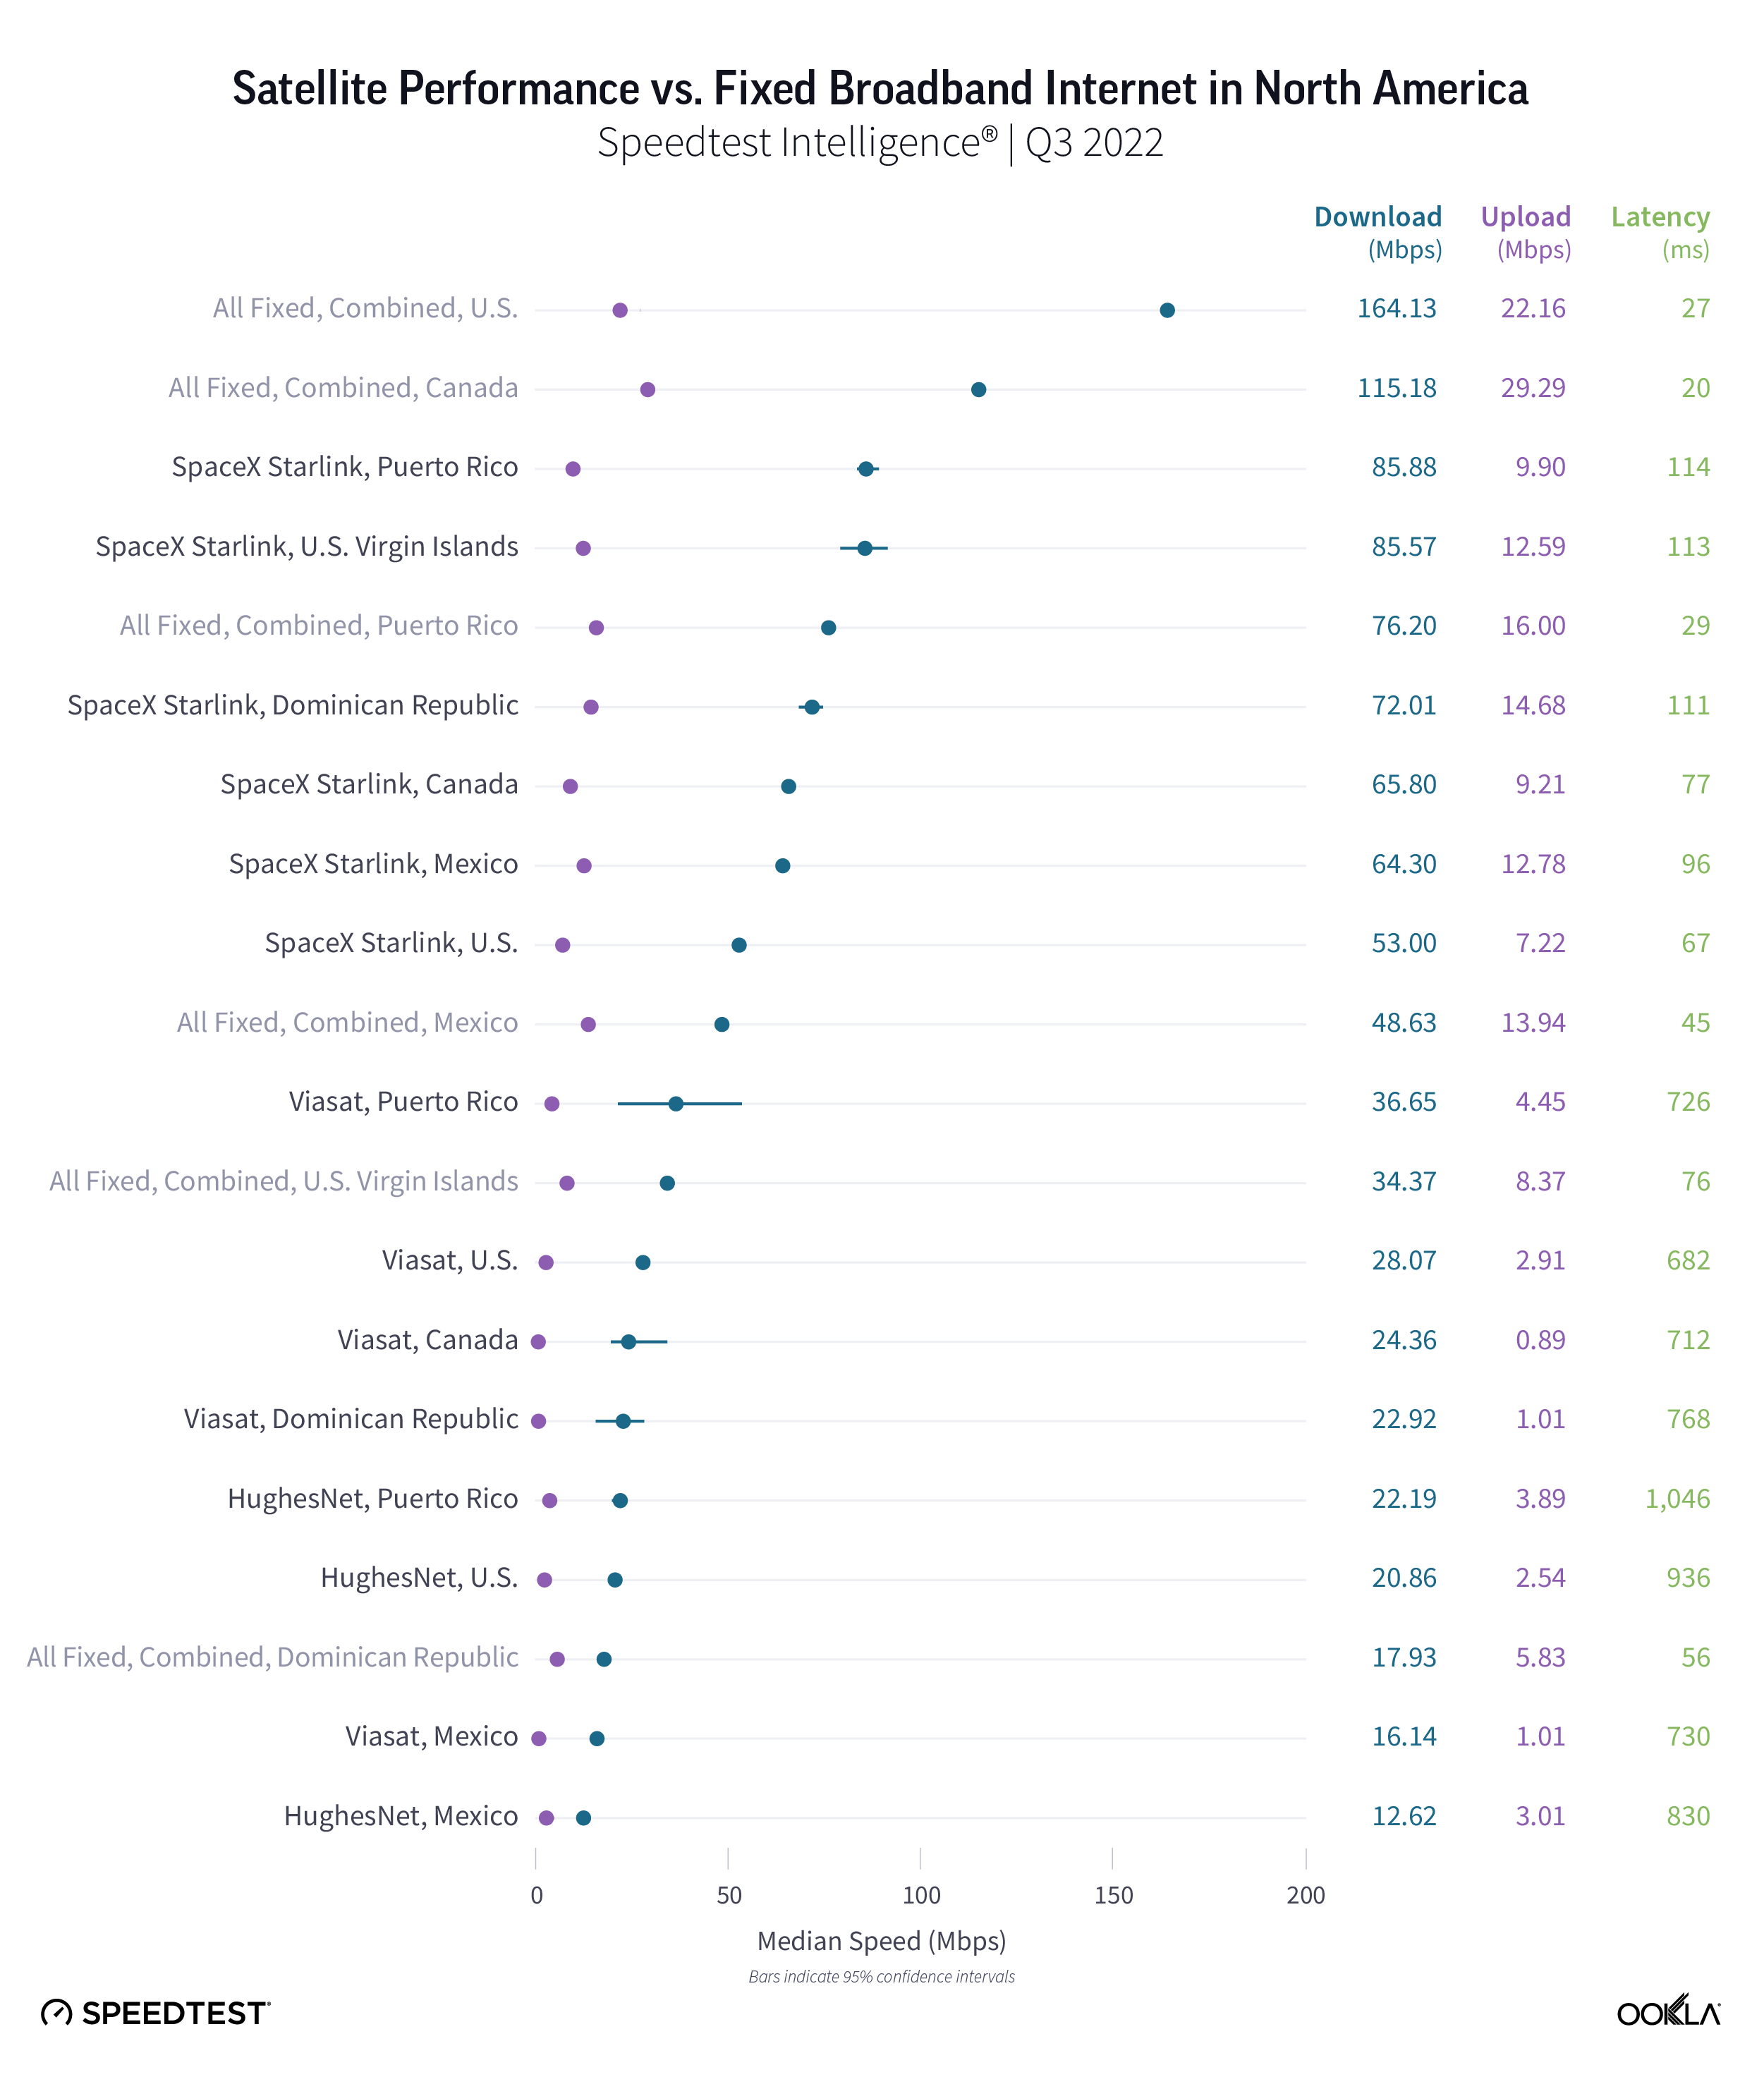
Speedtest Intelligence® reveals that Starlink in Puerto Rico and the U.S. Virgin Islands had the fastest median download speed among satellite providers in North America at 85.88 Mbps and 85.57 Mbps during Q3 2022. Starlink in the Dominican Republic (72.01 Mbps), Canada (65.80 Mbps), Mexico (64.30 Mbps), and the U.S. (53.00 Mbps) followed. Starlink had faster median download speeds than all fixed broadband providers combined in all of these countries except Canada and the U.S., and Viasat outperformed fixed broadband in the Dominican Republic (22.92 Mbps). 

Viasat and HughesNet recorded their fastest median download speeds in Puerto Rico at 36.65 Mbps and 22.19 Mbps, respectively. Almost every satellite provider on our list reached speeds fast enough to stream high-quality video at around 20 Mbps, though latency still was much higher than fixed broadband internet.

For upload speeds, Starlink outperformed fixed broadband providers combined in the Dominican Republic (14.68 Mbps to 5.83 Mbps) and the U.S. Virgin Islands (12.59 Mbps to 8.37 Mbps). Fixed broadband providers in Canada had the fastest upload on our list at 29.29 Mbps.

Multi-server latency showed satellite internet’s limits, with the huge distances between satellite and receivers adding up to long lags — and every satellite provider with higher latencies than fixed broadband providers. However, the Dominican Republic and U.S. Virgin Islands still had higher fixed broadband multi-server latencies at 55.45 ms and 76.15 ms, respectively. Starlink in the U.S. had the lowest multi-server latency at 67.16 ms, followed by Canada (77.32 ms), and Mexico (96.42 ms), which were the only satellite options that had a multi-server latency under 100 ms.

Starlink in Brazil was the fastest satellite provider in South America

Chart of satellite performance compared to fixed broadband internet in South America

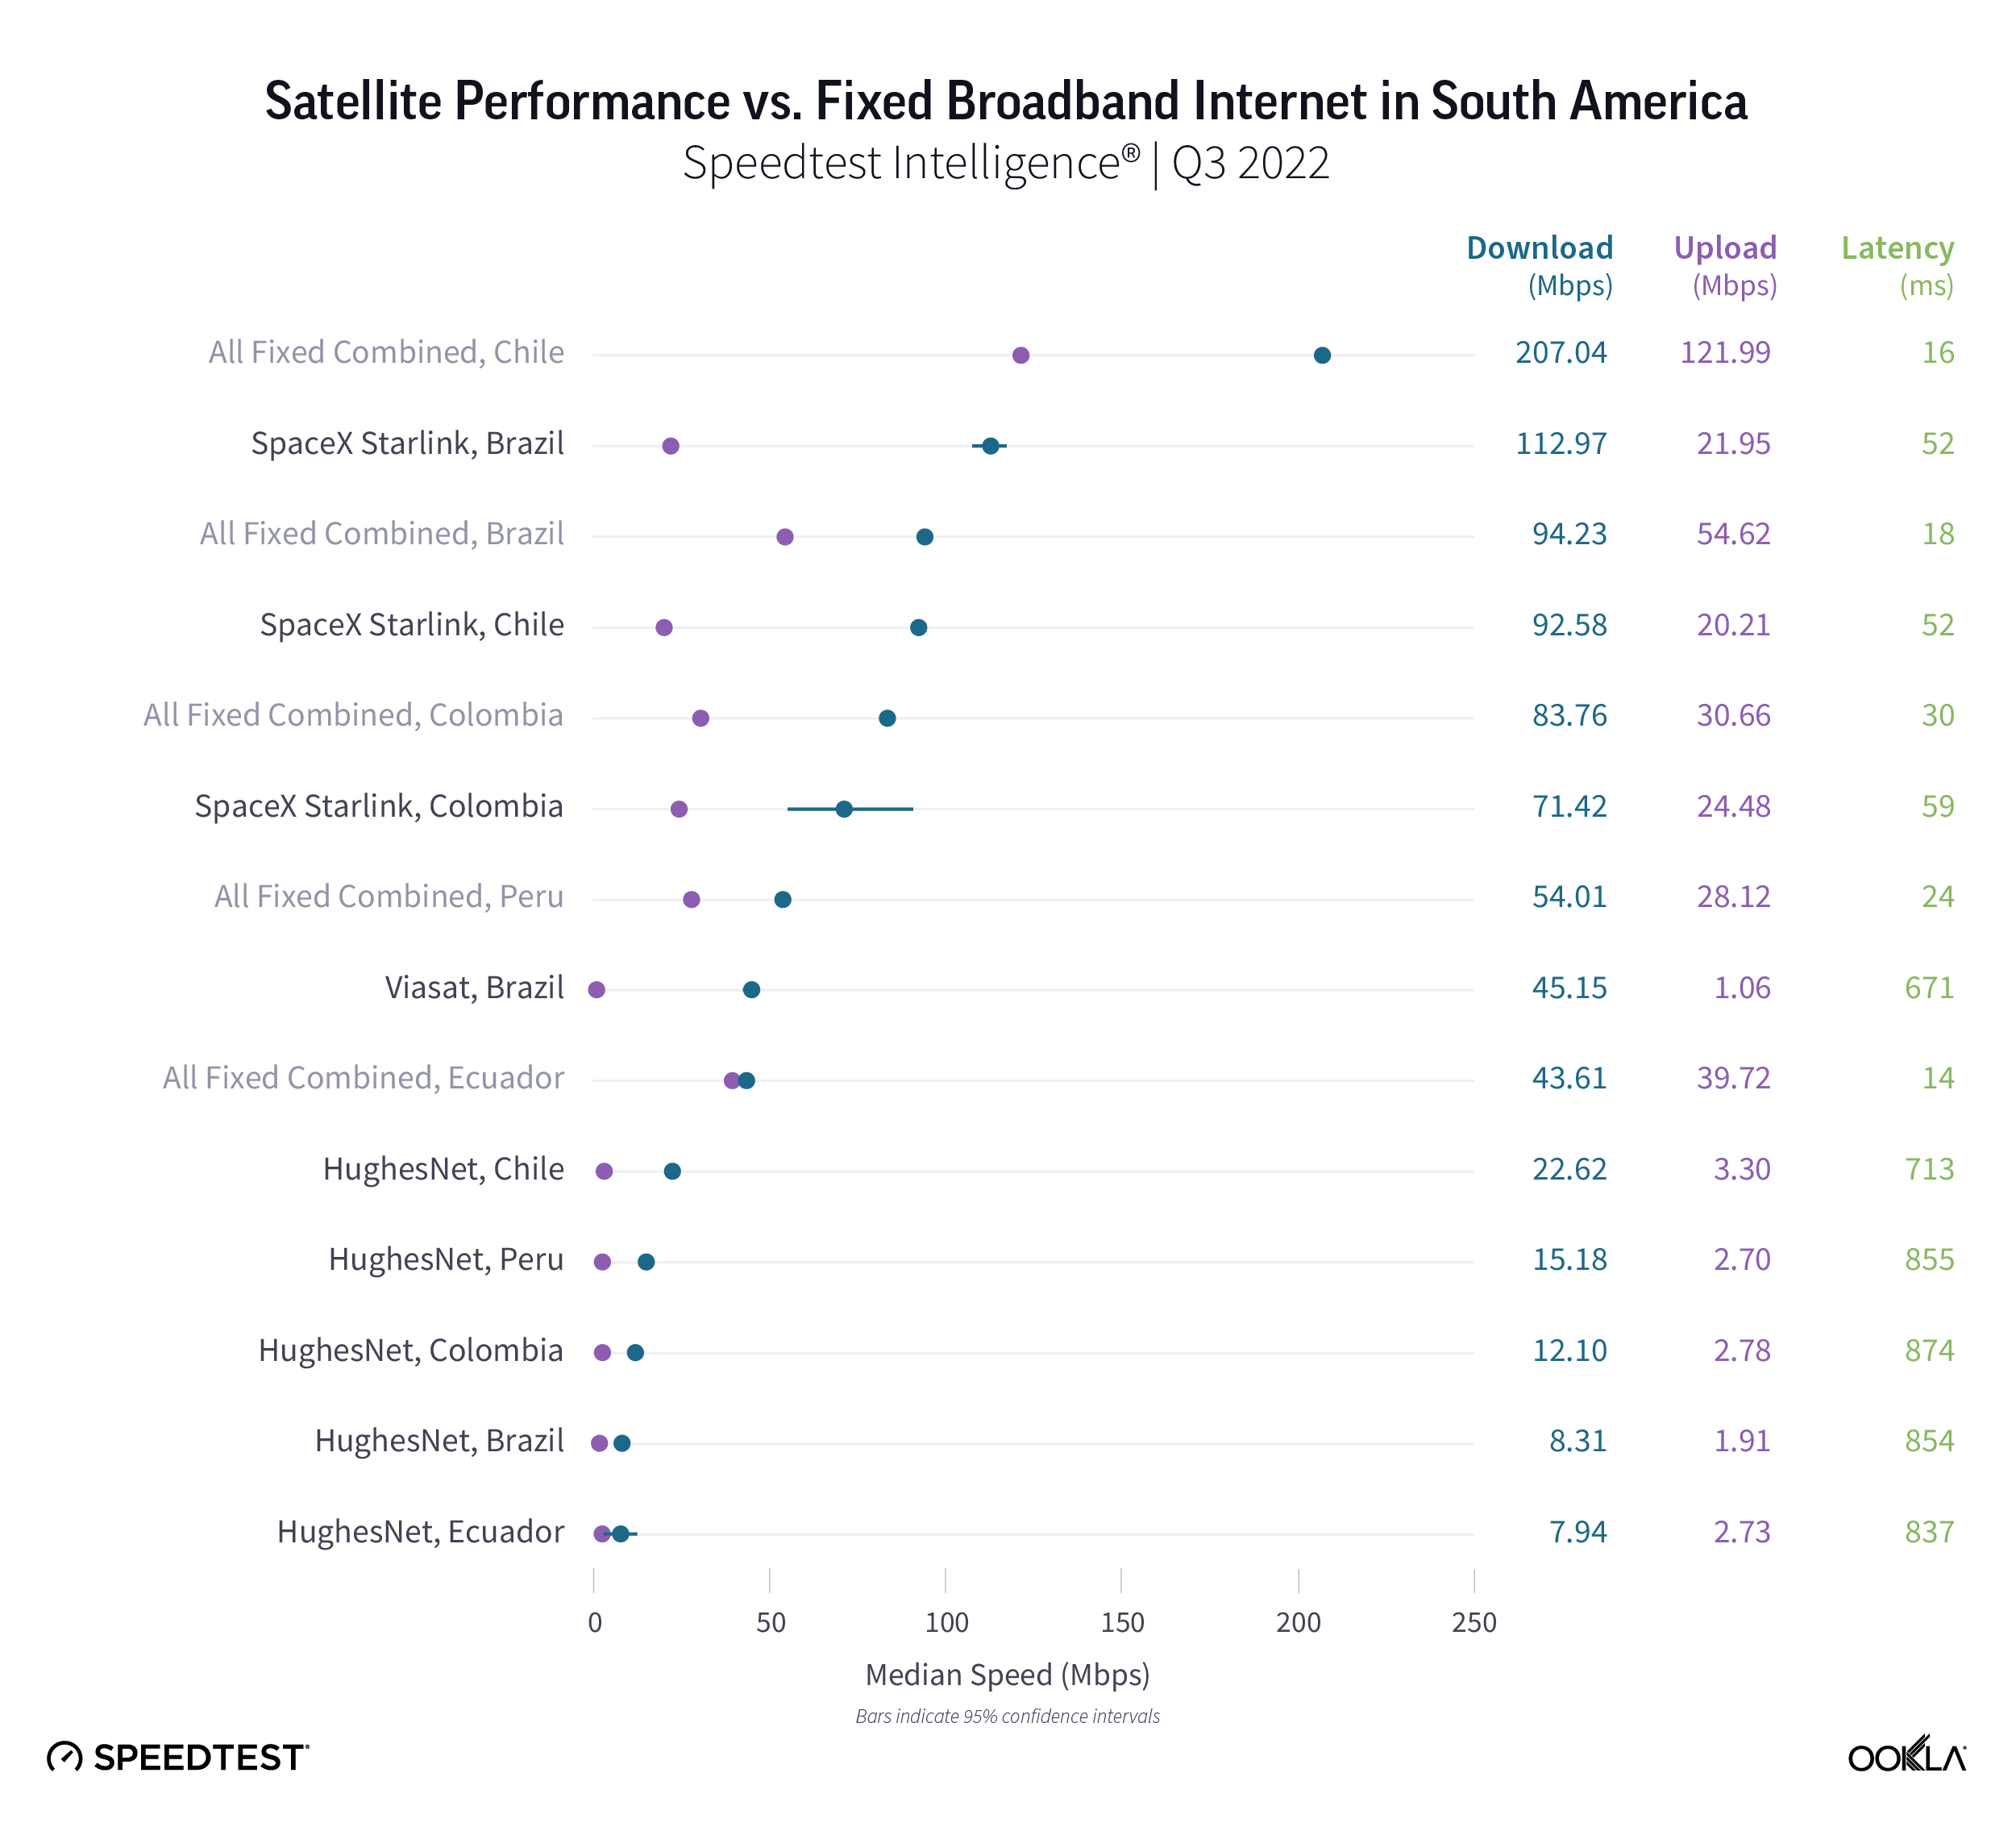
Brazilian satellite consumers weren’t lacking for fast internet options during Q3 2022, with Starlink blazing ahead among satellite providers in South America at 112.97 Mbps. Even Viasat notched a respectable median download speed of 45.15 Mbps. Starlink in Brazil was also the only satellite provider to outperform its country’s fixed broadband speeds, with ultrafast fixed broadband in Chile pulling ahead of Starlink 207.04 Mbps to 92.58 Mbps. Colombia was statistically too close to call in Q3 2022 with Starlink at 71.42 Mbps and fixed broadband at 83.76 Mbps. HughesNet trailed far behind with its fastest speed in Chile at 22.62 Mbps during Q3 2022.

For upload speeds, fixed broadband providers in every country we surveyed were faster than their satellite counterparts during Q3 2022. Starlink in Colombia had the fastest upload speed among satellite providers at 24.48 Mbps.

Speedtest Intelligence reveals multi-server latency told a similar story, with every country’s fixed broadband providers having a lower multi-server latency than their satellite counterparts. However, Starlink in Brazil and Chile had the lowest satellite multi-server latencies at 52.21 ms and 52.32 ms, respectively, during Q3 2022. Viasat and HughesNet lowest latencies were far behind with Viasat in Brazil at 670.63 ms and HughesNet in Chile at 713.04 ms.

New Q3 2022 Starlink countries have mixed results

Chart of satellite performance compared to fixed broadband internet in select countries

Speedtest Intelligence data shows Starlink data in six new countries during Q3 2022, including Colombia, the Dominican Republic, Estonia, Moldova, Norway, and the U.S. Virgin Islands. Starlink in Estonia (93.48 Mbps), the U.S. Virgin Islands (85.57 Mbps), and the Dominican Republic (72.01 Mbps) were much faster options than fixed broadband providers in their respective countries during Q3 2022. Starlink in Norway (113.86 Mbps) and Colombia (71.42 Mbps) were statistically in the same range as fixed broadband providers in their respective countries during the same time period. Starlink in Moldova (53.11 Mbps) was much slower than all fixed broadband providers combined (105.65 Mbps), though for rural folks with fewer options, still provides a speedy connection.

In all six countries, Starlink underperformed all fixed broadband providers combined for upload speed during Q3 2022, lagging behind from 12.59 Mbps to 24.48 Mbps, while median fixed broadband upload speeds ranged from 30.66 Mbps to 93.80 Mbps.

Multi-server latency was generally much higher than fixed broadband, with Starlink in Colombia showing the lowest multi-server latency at 58.65 ms, followed by Norway (73.00 ms), Estonia (85.37 ms), Moldova (105.26 ms), the Dominican Republic (110.62 ms), and the U.S. Virgin Islands (113.12 ms). 

The great space race is on

There is no doubt a new space race for connectivity is being waged across the world. Competitors are pouring hundreds of millions and even billions into unlocking the celestial connectivity dilemma. Here are some major updates about what’s next for various different satellite competitors:

With the competition for satellite connectivity heating up and Starlink facing potentially more competition in the coming months, we’ll be keeping our eyes to the sky to see how connectivity is performing. We’ll continue our series next quarter with Q3-Q4 2022 data from Europe and Oceania and any new countries where Starlink launches, and be back with North and South America data in Q2 2023. In the meantime, be sure to download the Speedtest app for Windows and Mac computers or for iOS or Android for devices and see how your satellite internet stacks up to our findings.

Ookla retains ownership of this article including all of the intellectual property rights, data, content graphs and analysis. This article may not be quoted, reproduced, distributed or published for any commercial purpose without prior consent. Members of the press and others using the findings in this article for non-commercial purposes are welcome to publicly share and link to report information with attribution to Ookla.

| September 20, 2022

Starlink Slowed in Q2, Competitors Mounting Challenges

Ookla® has covered SpaceX’s Starlink satellite internet for over a year now with our ongoing series on satellite internet performance. We’ve seen Starlink launch in new locations across the world, and while some speeds have shown signs of slowing down from their initial launches, the newly announced T-Mobile partnership with Starlink could extend the benefit of satellite connections to the mobile market.

Today, we have fresh data on satellite performance during Q2 2022 in Europe, Oceania, North America, and South America. This analysis includes results from eight additional countries, two new providers, and expanded data for Starlink, HughesNet, and Viasat. We also examine how Starlink’s internet performance has changed over the past year in Canada, France, Germany, New Zealand, the United Kingdom, and the United States.

Starlink speeds decreased in every country we surveyed over the past year as more users sign up for service

Chart of Starlink performances in select countries

Speedtest Intelligence® reveals that median download speeds for Starlink fell across Canada, France, Germany, New Zealand, the U.K, and the U.S., dropping between 9% and 54% from Q2 2021 to Q2 2022 as more users signed up for the service. However, Starlink still reached a median download speed of at least 60 Mbps in North America during Q2 2022, which is more than enough for at least one connected device to do most everything on the internet including streaming video, downloading games, and chatting on video with friends and family.

Upload speeds also slowed on Starlink, with speeds decreasing across all of the countries we’ve tracked over the past year. Latency fared a little better with latency remaining relatively flat (though high when compared to fixed broadband) in most countries. New Zealand was the outlier, with latency dropping 23 ms. For most users, we still suspect these dips are still worthwhile for areas that have no service, slow service, or few affordable options for fast internet.

Starlink in Puerto Rico was the fastest satellite provider in North America

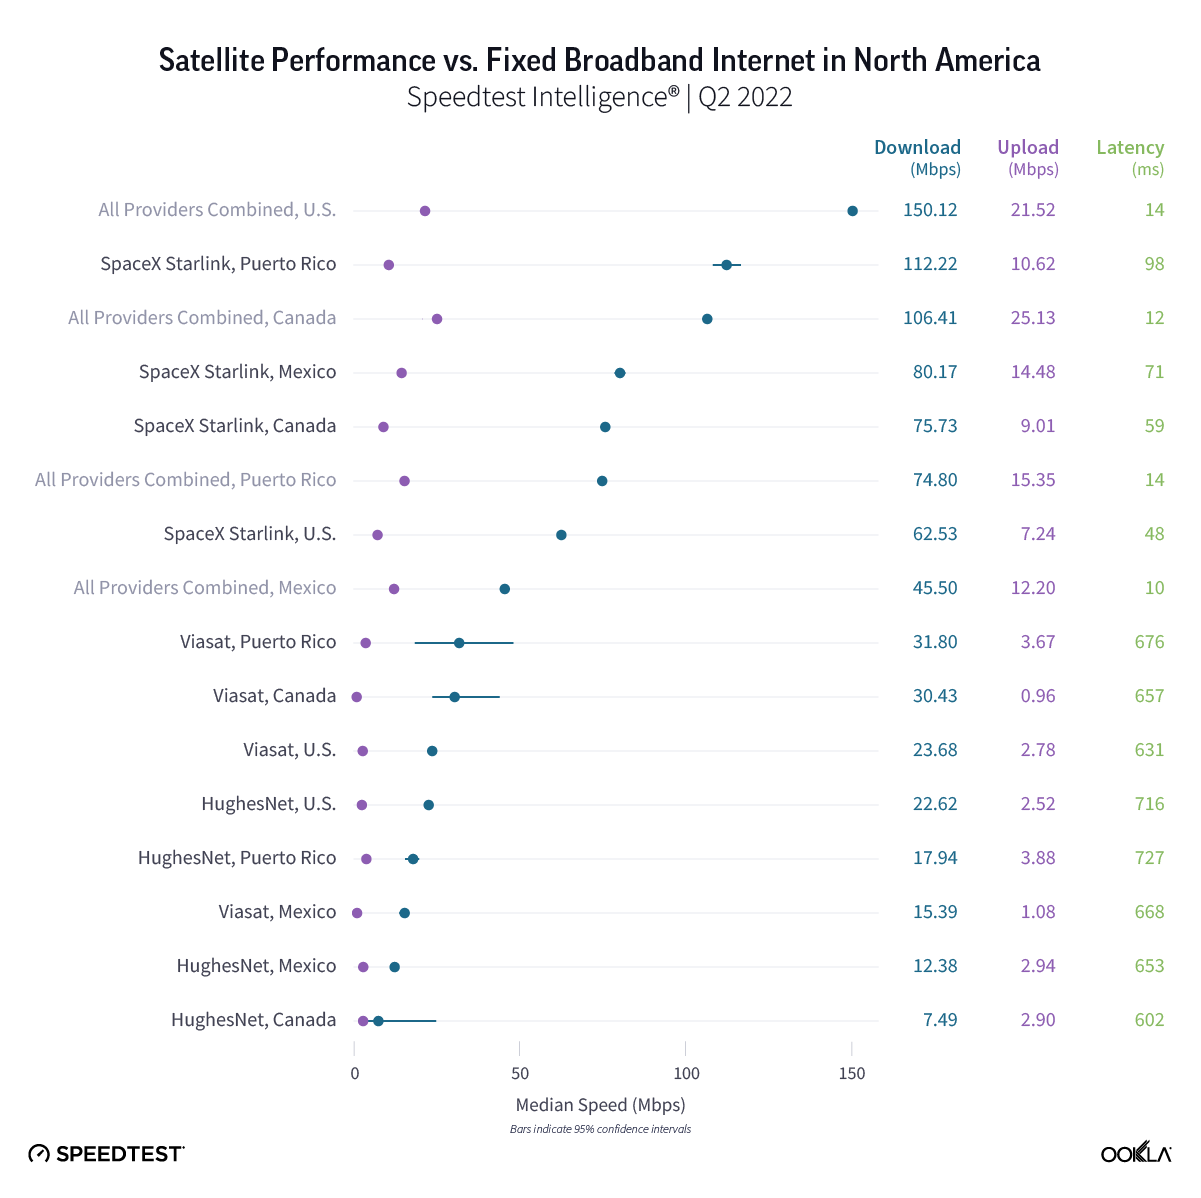
Chart of Satellite performance versus fixed broadband internet in North America

Starlink in Puerto Rico had the fastest satellite internet in North America during Q2 2022 with a median download speed of 112.22 Mbps, followed by Starlink in Mexico (80.17 Mbps), Canada (75.73 Mbps), and the U.S. (62.53 Mbps). Starlink in Puerto Rico and Mexico was faster than their countries’ fixed broadband providers combined (74.80 Mbps and 45.50 Mbps, respectively), while fixed broadband in the U.S. (150.12 Mbps) and Canada (106.41 Mbps) was faster than each country’s satellite providers.

In every country except Mexico, fixed broadband upload speeds were faster than satellite speeds. Starlink in Mexico edged out fixed broadband providers 14.48 Mbps to 12.20 Mbps. Latency was higher for every satellite provider compared to fixed broadband. Starlink in the U.S. had the lowest median latency among satellite providers at 48 ms.

Starlink outperformed fixed broadband average in 16 European countries

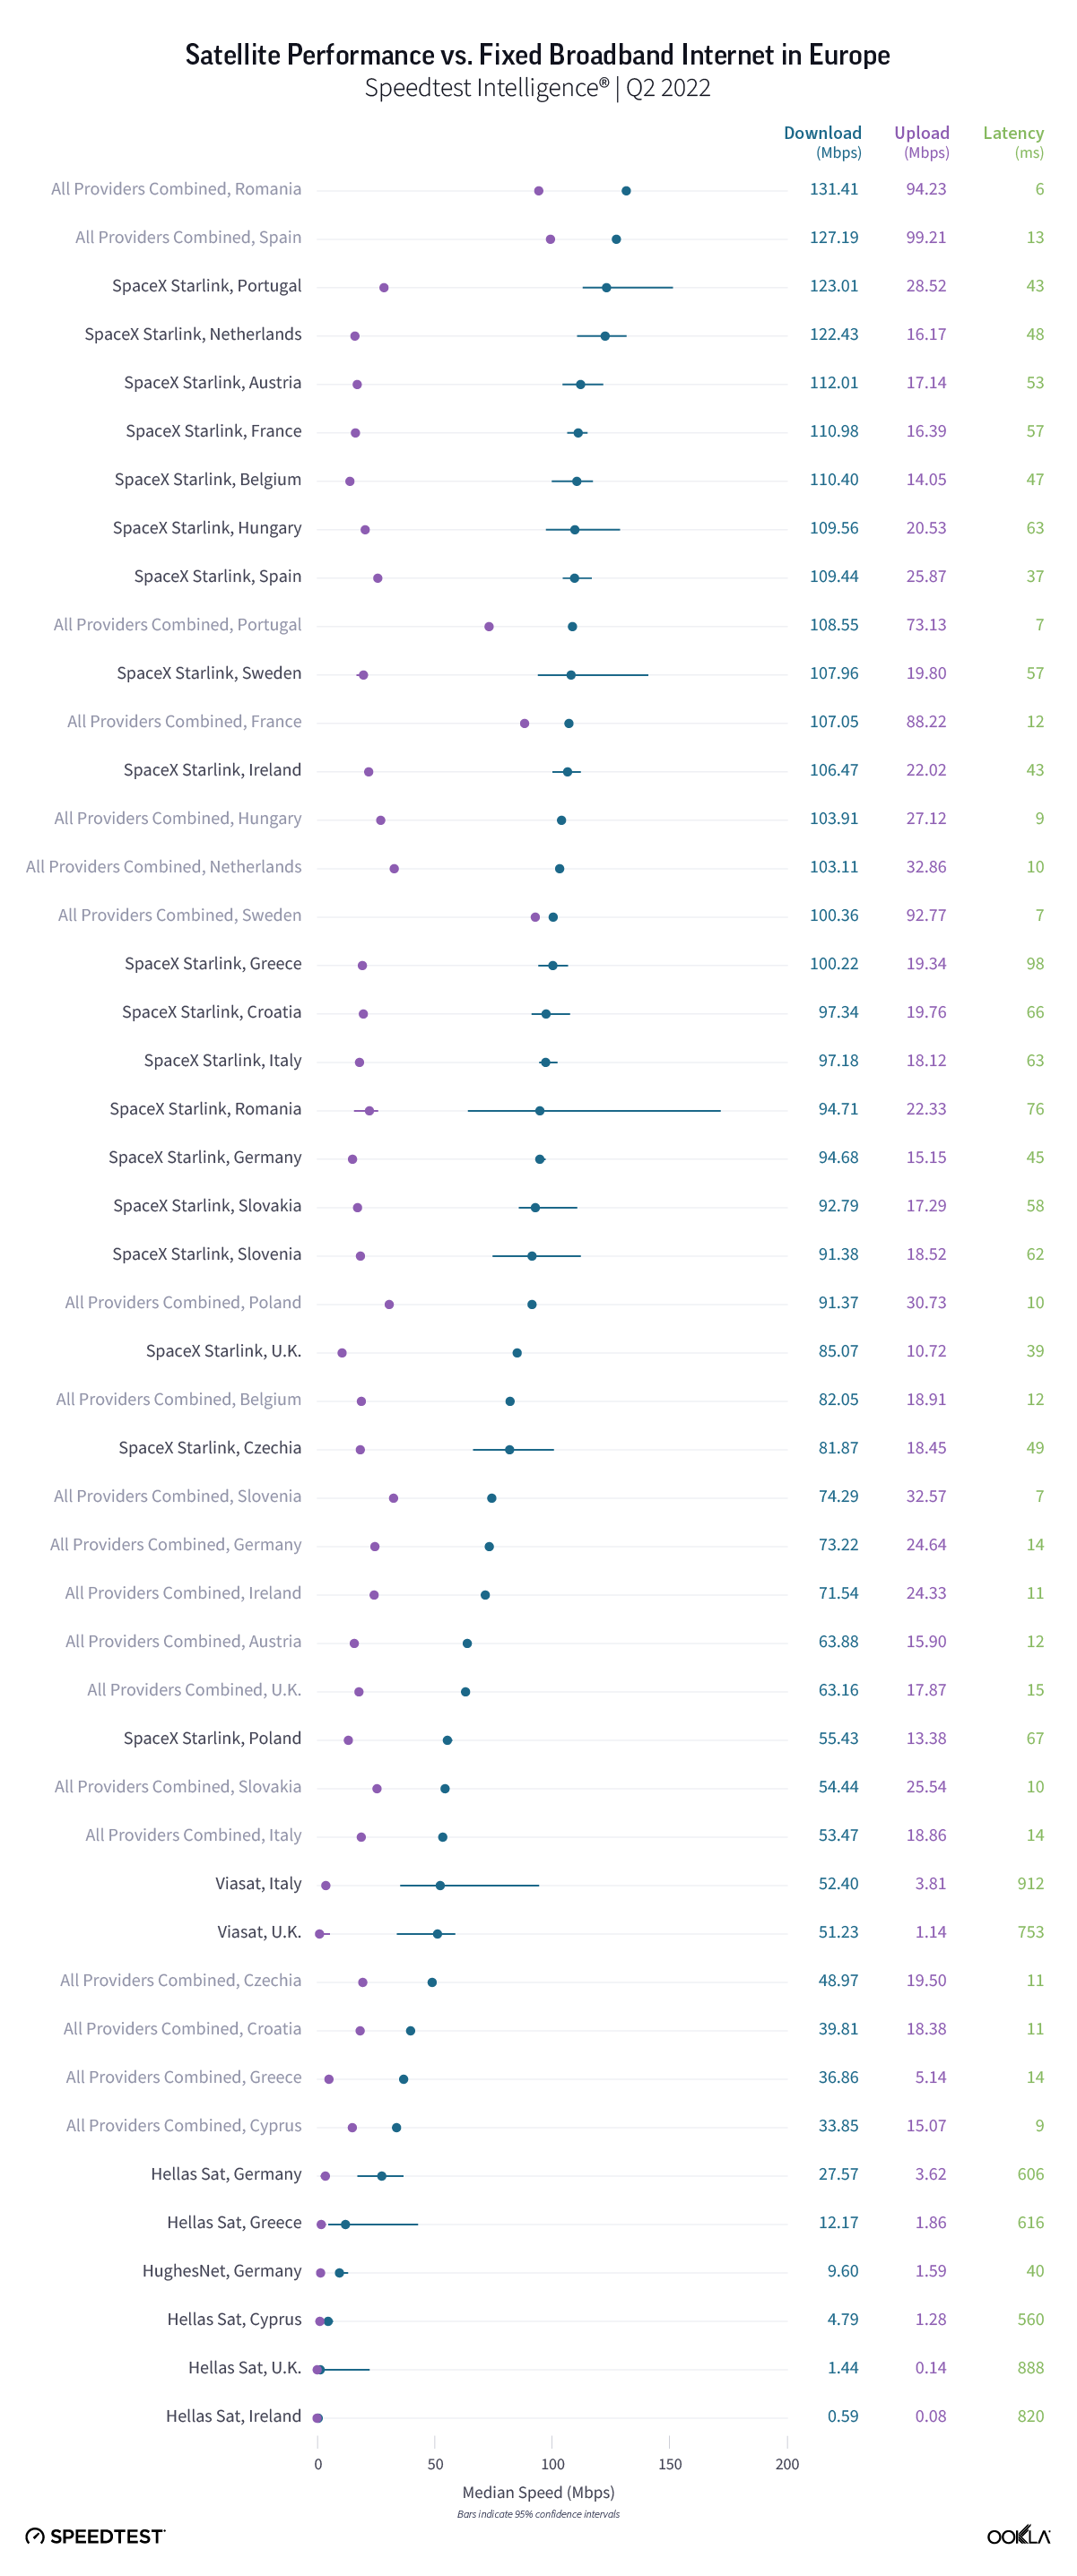
Chart of Satellite performance versus fixed broadband internet in Europe

Speedtest Intelligence shows Starlink was fast in Europe during Q2 2022, outperforming fixed broadband median download speed in 16 countries and reached download speeds over 100 Mbps in 10 countries. In contrast, fixed broadband only achieved median download speeds over 100 Mbps in six countries: Romania, Spain, Portugal, France, Hungary, and the Netherlands during Q2 2022. Starlink was fastest for median download speed in Portugal at 123.01 Mbps, the Netherlands (122.43 Mbps), Austria (112.01 Mbps), France (110.98 Mbps), and Belgium (110.40 Mbps). Romania and Spain were the only countries to have fixed broadband beat Starlink for fastest median download speed, achieving 131.41 Mbps and 127.19 Mbps, respectively.

For upload, Starlink in Greece and Austria was the only satellite provider to achieve faster upload speeds than all fixed broadband providers combined at 19.34 Mbps to 5.14 Mbps, and to 17.14 Mbps to 15.90 Mbps, respectively. Fixed broadband providers in Spain (99.21 Mbps), Romania (94.23 Mbps), Sweden (92.77 Mbps), France (88.22 Mbps), Lithuania (83.54 Mbps), and Portugal (73.13 Mbps) all recorded median upload speeds greater than 70 Mbps, with the closest satellite provider being Starlink in Portugal at 28.52 Mbps.

All satellite providers fell far behind fixed broadband providers in the whole of Europe for latency during Q2 2022. Starlink in Spain and the United Kingdom recorded the lowest satellite latencies at 37 ms and 39 ms, respectively — still a far cry from the closest fixed broadband latency, which was 14 ms in Germany, Greece, and Italy.

Starlink in Brazil was the fastest satellite provider in South America

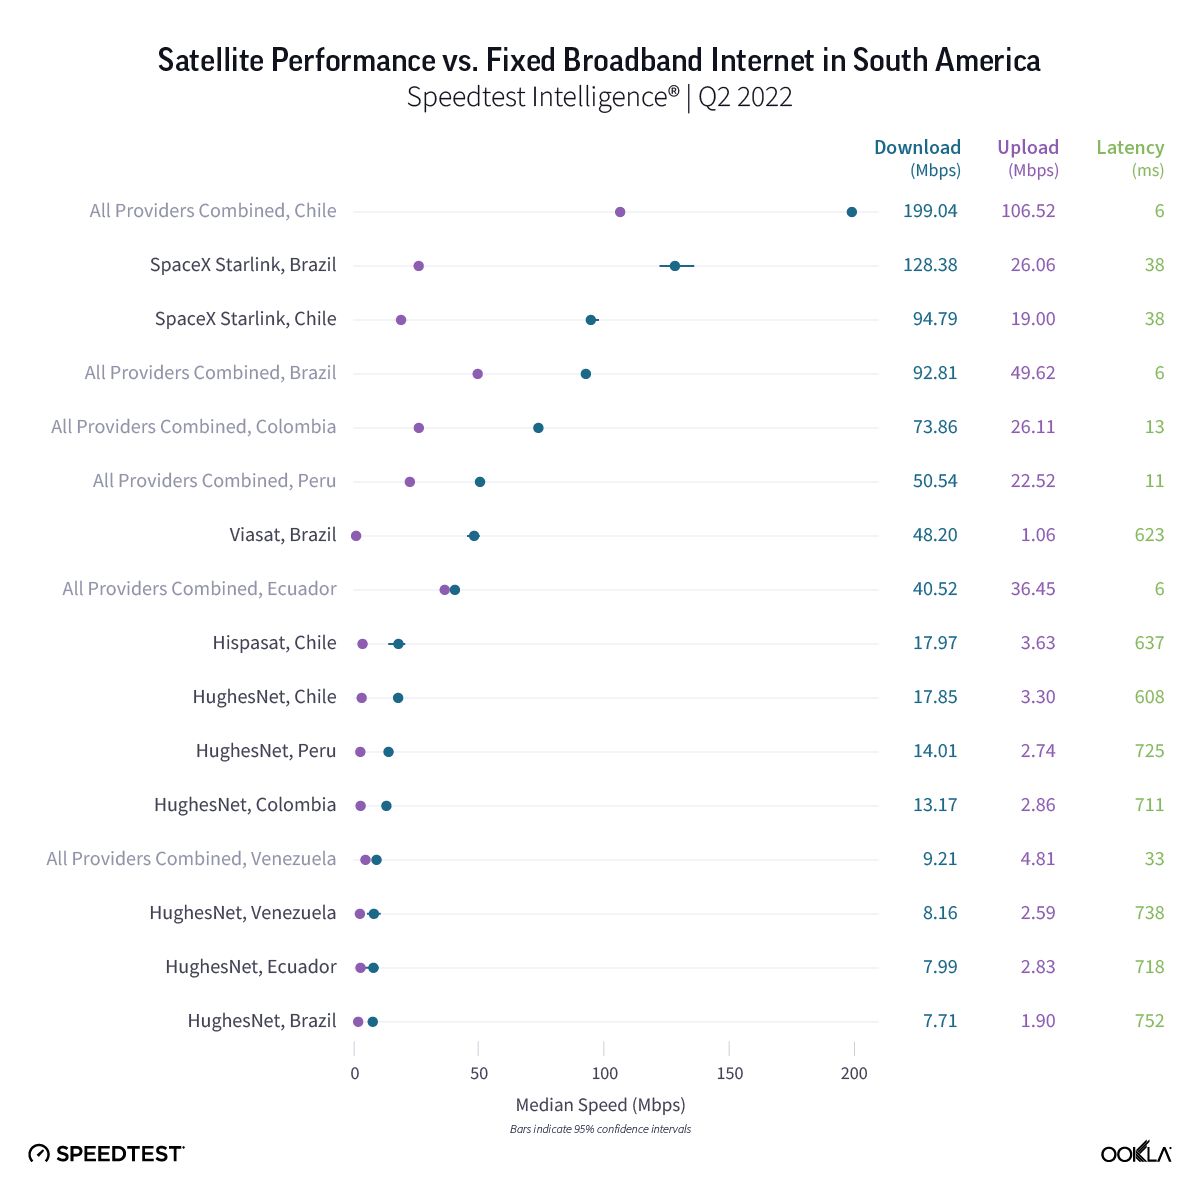
Chart of Satellite performance versus fixed broadband internet in South America

Our analysis of Speedtest Intelligence data found Starlink in Brazil was the fastest satellite provider in South America with a median download speed of 128.38 Mbps during Q2 2022, followed by Starlink in Chile at 94.79 Mbps. Chilean fixed broadband internet was still much faster for those who could get access to it. The Speedtest Global Index™ found Chile had the second fastest fixed broadband internet in the world with a median download speed of 211.43 Mbps during August 2022. Starlink in Brazil was the only satellite provider to be faster than its country’s fixed broadband providers combined.

Like last quarter, South American fixed broadband providers surpassed satellite providers in each respective upload speeds during Q2 2022. All satellite providers had a higher median latency than fixed broadband, though Starlink in Brazil and Chile had latencies of 38 ms.

Starlink in New Zealand was the fastest satellite provider in Oceania 

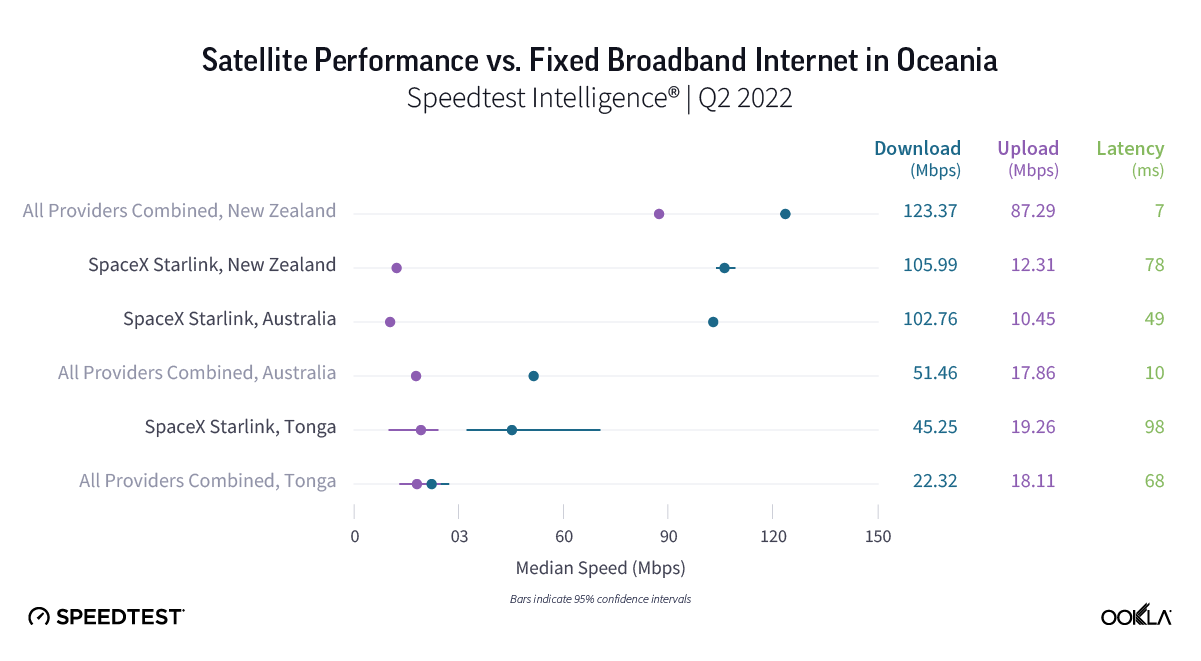
Chart of Satellite performance versus fixed broadband internet in Oceania

Starlink’s fastest median download speed in Oceania was in New Zealand at 105.99 Mbps, though this still fell short of fixed broadband providers in the country. Starlink in Australia was faster than fixed broadband providers by a wide margin at 102.76 Mbps to 51.46 Mbps during Q2 2022. Starlink outperformed fixed broadband providers in new-to-our-list Tonga 45.25 Mbps to 22.32 Mbps. 

New Zealand’s fixed broadband dominated for the fastest median upload speed in Oceania at 87.29 Mbps during Q2 2022, while Australia’s fixed broadband fell far behind with an upload speed of 17.86 Mbps. Both speeds were still faster than Starlink’s median upload speeds in New Zealand and Australia (12.31 Mbps and 10.45 Mbps, respectively). Tonga didn’t have a statistical winner for fastest upload speed, but Starlink reached 19.26 Mbps and fixed broadband 18.11 Mbps. Fixed broadband also had a lower median latency than Starlink during Q1 2022, which clocked in at 49 ms in Australia, 78 ms in New Zealand, and 98 ms in Tonga.

Biggest questions lie ahead, but competition will be good for consumers

Satellite connectivity is coming to mobile, with Starlink’s new partnership with T-Mobile and new mobile devices becoming satellite enabled. This will cause ripples across North America, which is a net positive for consumers who live in areas with low mobile and fixed broadband connectivity. Connecting with the world won’t be a question of how anymore, it will be a question of how good your experience is. That’s hopefully a win-win for consumers, especially as more providers vie for the fastest and best satellite experience — a true global space race.

Starlink isn’t stopping there — they’re trying to get into airplanes, cruise ships, and cars. But they’re not the only satellite provider making moves; Viasat is launching its Viasat-3 fleet, OneWeb is combining business with Eutelsat, and Amazon is sending 3,236 Project Kuiper satellites into orbit. We’ll be here monitoring the skies in our ongoing satellite series. Take a Speedtest® to help us provide an accurate and more complete picture of real-world performance. And if we’re missing data on your satellite network, send us a screenshot of your speed on Twitter or Facebook.

Ookla retains ownership of this article including all of the intellectual property rights, data, content graphs and analysis. This article may not be quoted, reproduced, distributed or published for any commercial purpose without prior consent. Members of the press and others using the findings in this article for non-commercial purposes are welcome to publicly share and link to report information with attribution to Ookla.

| June 28, 2022

Here’s How Fast Starlink Has Gotten Over the Past Year

It’s been a year since we first examined SpaceX’s Starlink satellite internet, which launched its public beta in November 2020. Today we’re updating our ongoing series on satellite internet performance with data from Q1 2022 in Europe, Oceania, North America, and South America, including results from 10 additional countries. We’re also examining how Starlink’s internet performance has changed over the past year in the United States and Canada.

Starlink speeds increased nearly 58% in Canada and 38% in the U.S. over the past year

chart of Starlink and fixed broadband performance in Canada and the United States

Speedtest Intelligence® reveals that median download speeds for Starlink dramatically increased from Q1 2021 to Q1 2022 in the U.S. and Canada, as did speeds for all fixed broadband providers combined. In the U.S., Starlink median download speeds improved roughly 38% from 65.72 Mbps in Q1 2021 to 90.55 Mbps in Q1 2022. In Canada, Starlink’s download speed leapt ahead nearly 58% from 61.84 Mbps to 97.40 Mbps during the same time period.

However, Speedtest Intelligence also showed that upload speeds for Starlink decreased at least 33% in the U.S. (16.29 Mbps in Q1 2021 to 9.33 Mbps in Q1 2022) and at least 36% in Canada (16.69 Mbps to 10.70 Mbps) during the same time period. Median latency on Starlink marginally increased from 40 ms to 43 ms in the U.S. and from 51 ms to 55 ms in Canada during the past year. For many Starlink users, we suspect these changes are negligible.

Starlink in Mexico was the fastest satellite provider in North America

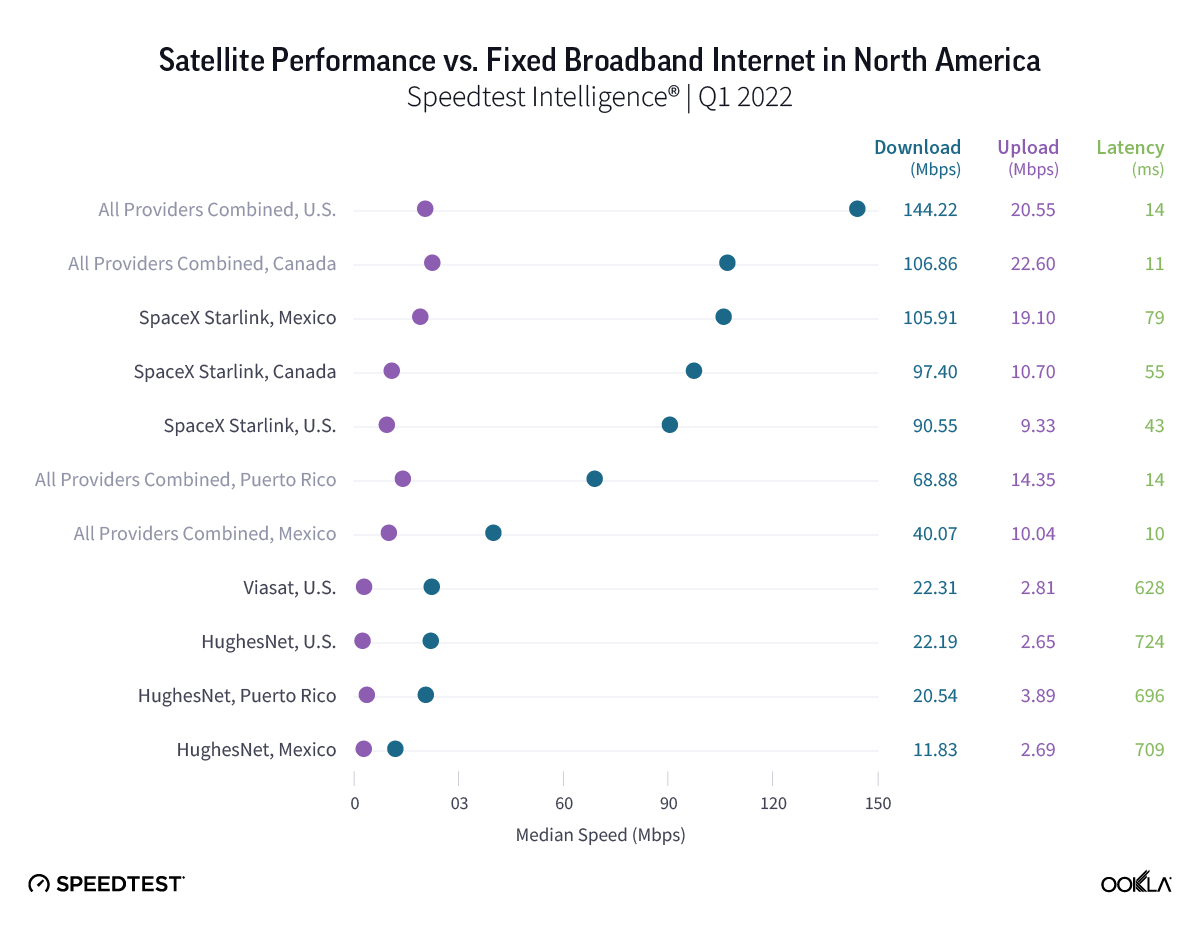
Chart of Satellite performance versus fixed broadband internet in North America

Starlink in Mexico had the fastest satellite internet in North America during Q1 2022 with a median download speed of 105.91 Mbps, followed by Starlink in Canada (97.40 Mbps) and the U.S. (90.55 Mbps). Mexico’s fixed broadband download speed (40.07 Mbps) was much slower than Starlink, while Starlink download speeds were slower than fixed broadband for all providers combined in the U.S. (144.22 Mbps) and Canada (106.86 Mbps). Puerto Rico, new to our list, showed HughesNet had the fastest satellite internet on the island territory at 20.54 Mbps, though fixed broadband was much faster at 68.88 Mbps.

Starlink in Lithuania was the fastest satellite provider in Europe

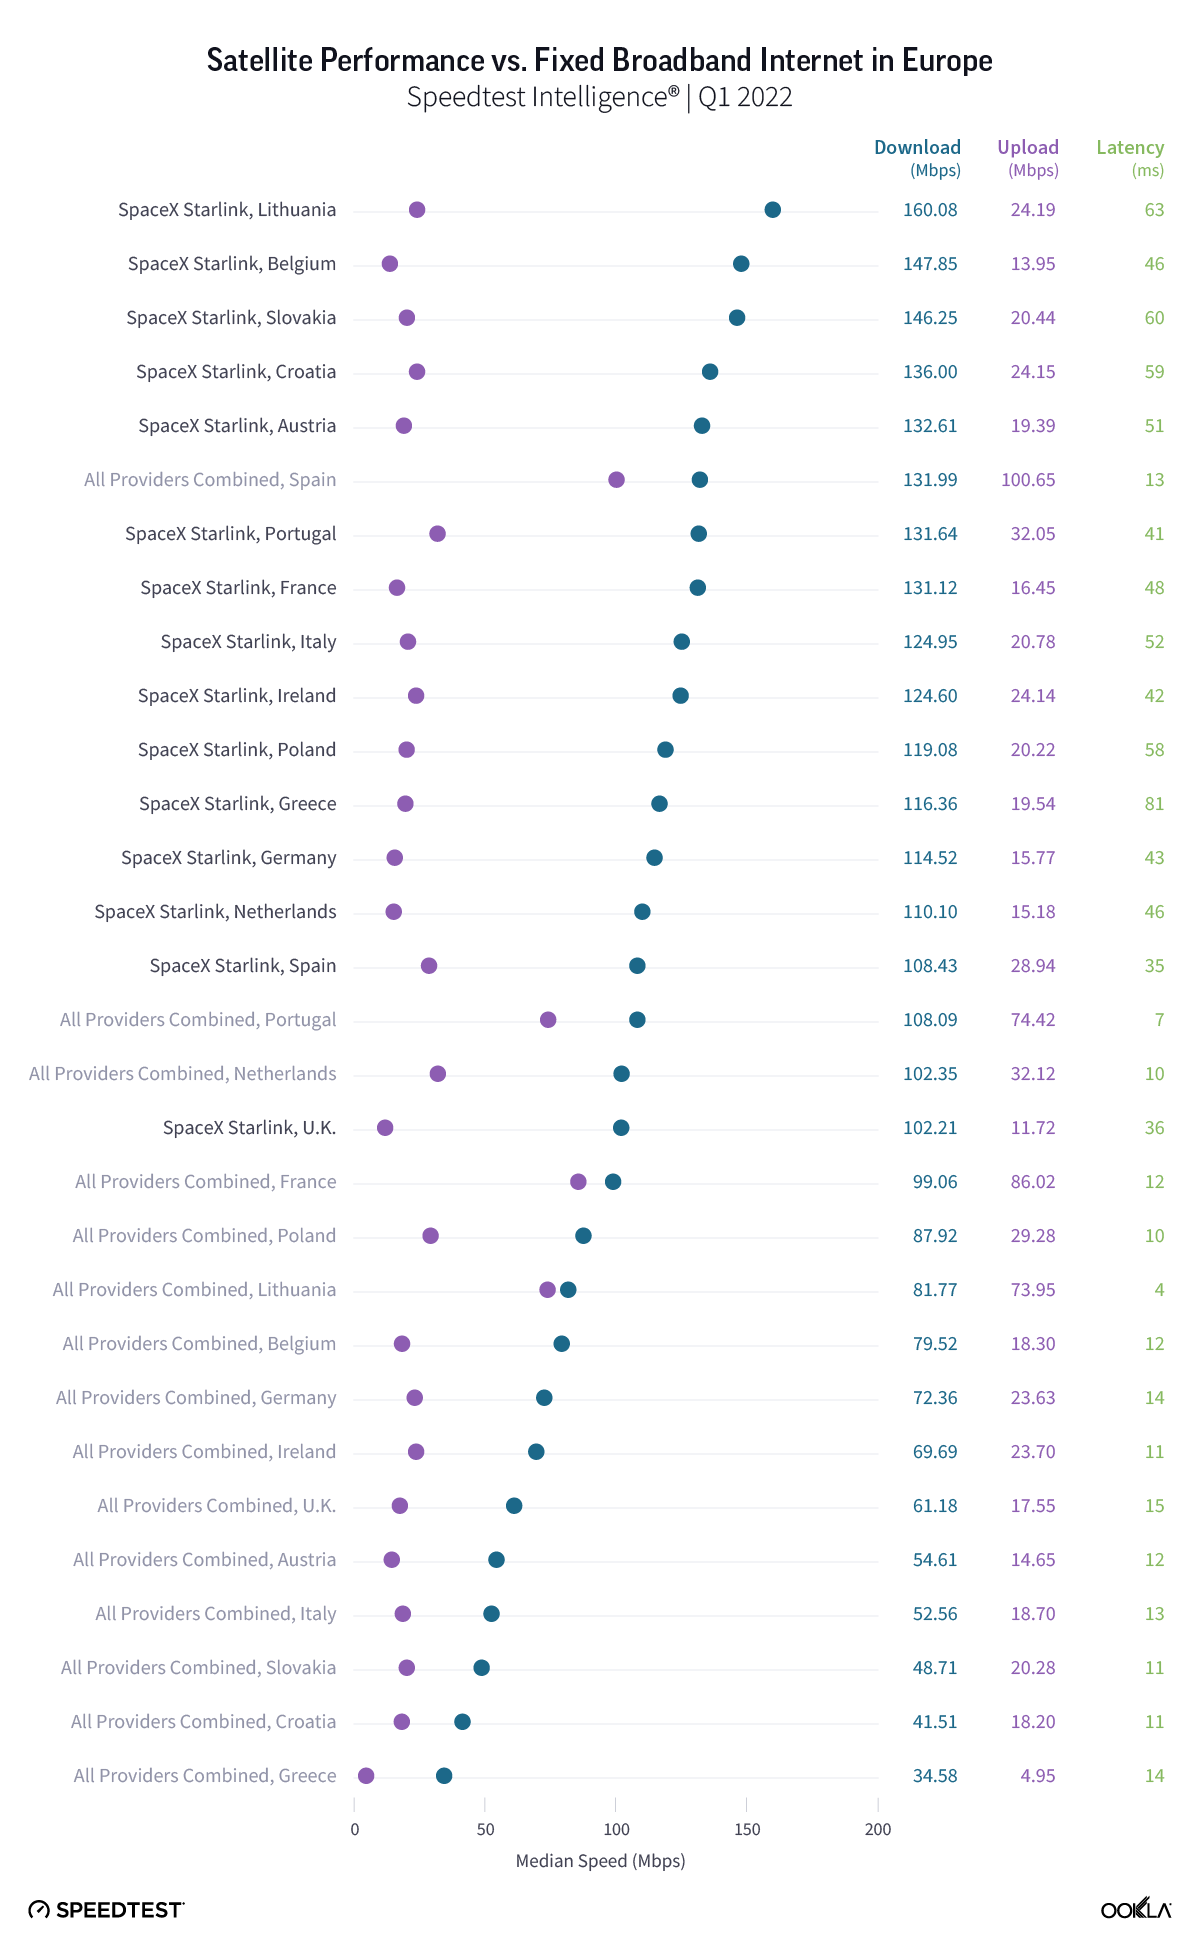
Chart of satellite performance versus fixed broadband internet in Europe

Speedtest Intelligence showed that Starlink blazed ahead in Europe during Q1 2022, with Starlink achieving a 100+ Mbps median download speed in every country where it was commercially available. In contrast, fixed broadband only achieved median download speeds over 100 Mbps in Spain, Portugal, and the Netherlands during Q1 2022. Starlink was fastest for download speed in Lithuania at 160.08 Mbps, followed by Belgium (147.85 Mbps), Slovakia (146.25 Mbps), Croatia (136.00 Mbps), and Austria (132.61 Mbps). Spain was the only country to have its fixed broadband beat Starlink for fastest median download speed, achieving 131.99 Mbps to Starlink’s 108.43 Mbps within the country.

For upload, fixed broadband providers in Spain (100.65 Mbps), France (86.02 Mbps), Portugal (74.42 Mbps), and Lithuania (73.95 Mbps) all recorded median speeds greater than 70 Mbps, while the closest satellite provider, Starlink in Portugal, trailed at 32.05 Mbps.

All satellite providers fell far behind fixed broadband providers in the whole of Europe for latency during Q1 2022, with Starlink in Spain and the United Kingdom recording the highest satellite latencies at 35 ms and 36 ms, respectively — a far cry from the lowest fixed broadband latency, which was 15 ms in the U.K.

Starlink in Chile was the fastest satellite provider in South America

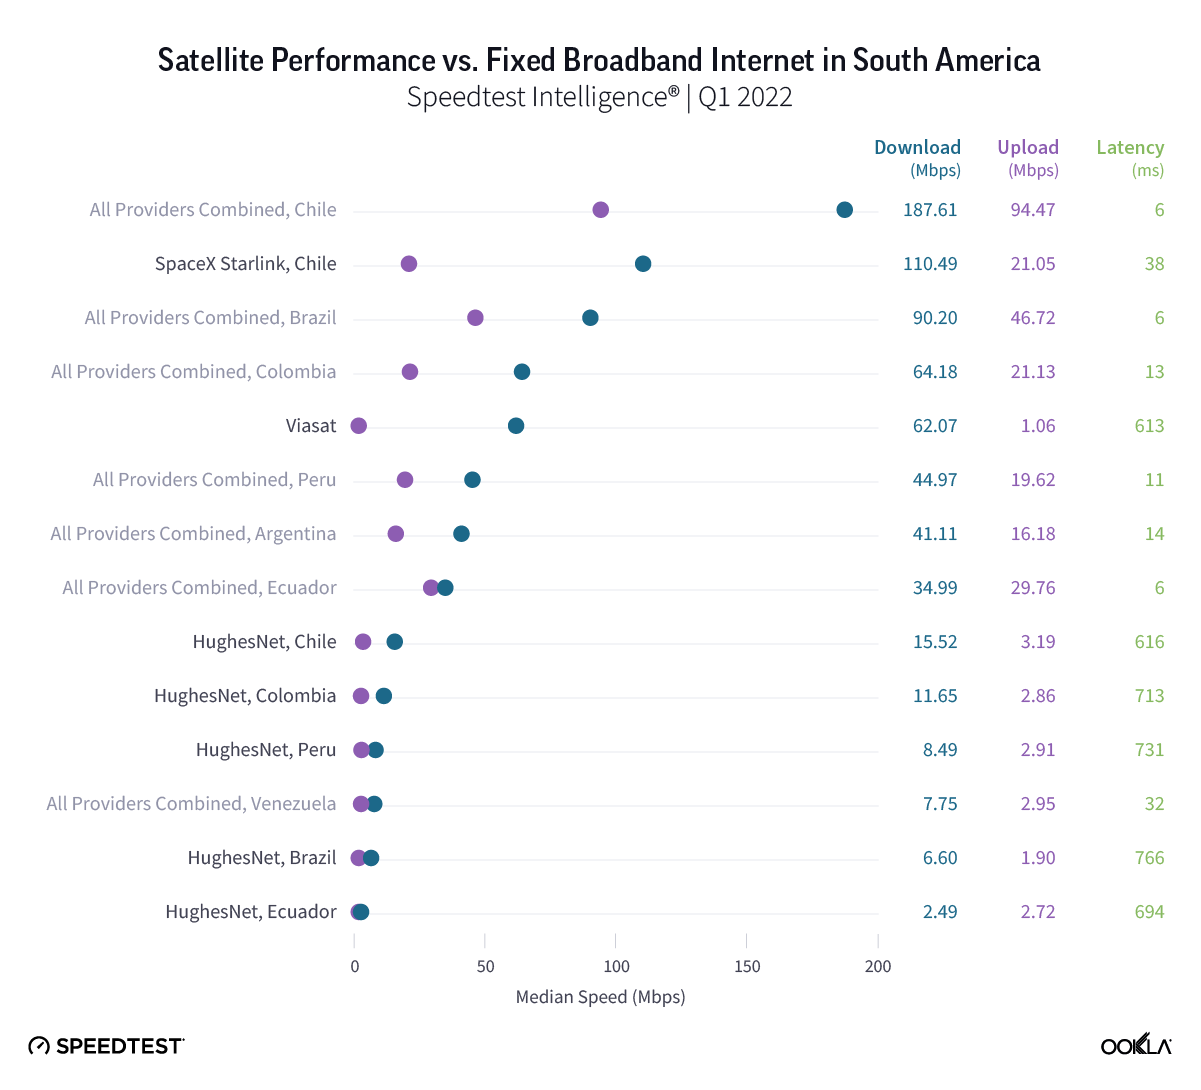
Chart of Satellite performance versus fixed broadband internet in South America

Our analysis of Speedtest Intelligence data found Starlink in Chile was the fastest satellite provider in South America with a median download speed of 110.49 Mbps during Q1 2022. Although Chilean fixed broadband internet was much faster for those who could get access to it. In fact, during May 2022, the Speedtest Global Index™ found Chile had the second fastest fixed broadband internet in the world with a median download speed of 206.97 Mbps, just a hair shy of Singapore’s first place speed of 209.21 Mbps. 

No South American satellite provider surpassed its country’s fixed broadband download or upload speeds during Q1 2022. Viasat in Brazil had a noteworthy median download speed of 62.07 Mbps, though still fell short of the country’s fixed broadband speed of 90.20 Mbps. All satellite providers had a higher median latency than fixed broadband, though Starlink in Chile had a latency of 38 ms.

Starlink in Australia was the fastest satellite provider in Oceania

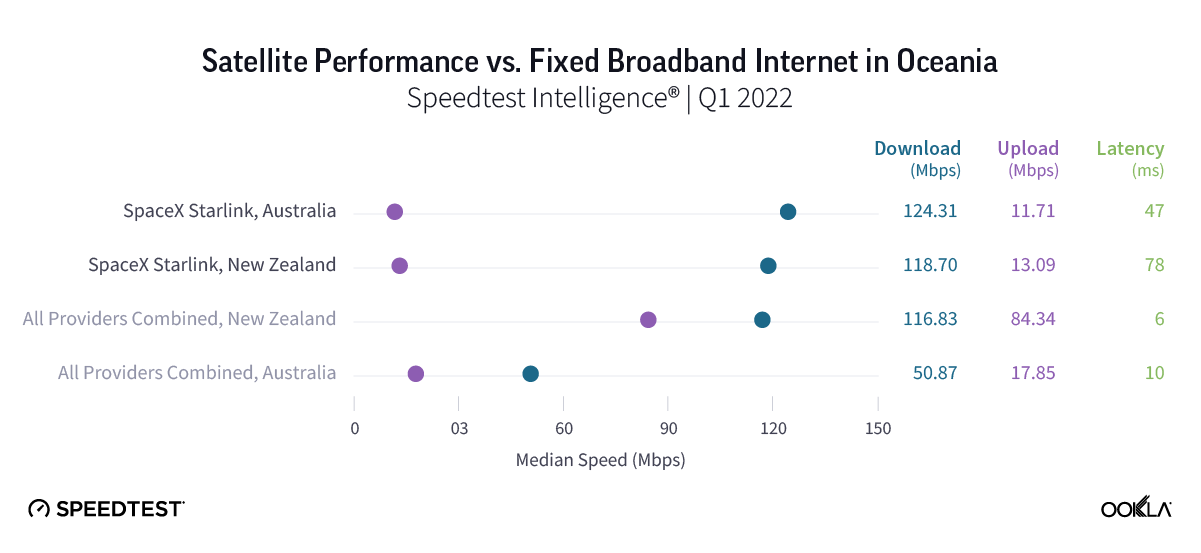
Chart of Satellite performance versus fixed broadband internet in Oceania

Starlink raced ahead in Oceania, recording faster median download speeds than fixed broadband in both Australia and New Zealand. In Australia, Starlink had a median download speed of 124.31 Mbps, much faster than Australian fixed broadband at 50.87 Mbps for download during Q1 2022. The comparison in New Zealand was much closer with Starlink’s median download speed at 118.70 Mbps and fixed broadband at 116.83 Mbps during Q1 2022.

New Zealand’s fixed broadband dominated for the fastest median upload speed in Oceania at 84.34 Mbps during Q1 2022, while Australia’s fixed broadband fell far behind with an upload speed at 17.85 Mbps. Both speeds were still faster than Starlink’s median upload speeds in New Zealand and Australia (13.09 Mbps and 11.71 Mbps, respectively). Fixed broadband also had a faster median latency than Starlink during Q1 2022, which clocked in at 47 ms in Australia and 78 ms in New Zealand.

Consumers are flocking to Starlink, but competitors are close behind

As we’ve continued to see over the past year, Starlink’s low-earth orbit satellites (LEOs) provide a life-changing service for consumers in rural areas that might not otherwise have access to high-speed internet. However, more companies are looking to compete with Starlink and launch their own LEO constellations, including Amazon’s Project Kuiper, which recently received FCC permission to test their own satellite service and is slated to launch later this year, and Viasat which is set to merge with Inmarsat and launch new constellations by 2023.

We’ll continue to monitor the skies in our ongoing satellite series, but if you’re using satellite internet, take a Speedtest® to help us provide an accurate and more complete picture of real-world performance.

Editor’s note: This article was amended on June 28 to clarify percentage increases in the U.S. and Canada and to update the percent change for upload for Canada.

Ookla retains ownership of this article including all of the intellectual property rights, data, content graphs and analysis. This article may not be quoted, reproduced, distributed or published for any commercial purpose without prior consent. Members of the press and others using the findings in this article for non-commercial purposes are welcome to publicly share and link to report information with attribution to Ookla.

| June 17, 2024

ISPs Driving Transformation in Broadband Performance Across the Caribbean

ISPs in the Caribbean have helped drive a step-change in performance across the region over the past four years. Fiber is at the forefront of this change, helping drive performance gains in terms of throughput and latency in leading markets such as Trinidad and Tobago, Bermuda, and the Cayman Islands, while Starlink’s LEO service is gaining a foothold in a number of islands too. Outside the leading Caribbean markets, performance varies significantly, but even among those lagging the regional average are advancing rapidly.

Key takeaways

  • Growing availability of faster broadband across the Caribbean. The last four years have seen a transformation in broadband performance in the Caribbean. Across the markets in this analysis, network Consistency – the share of Speedtest samples exceeding a threshold of 25 Mbps download and 3 Mbps upload – increased from 45.3% in Q1 2020, to 73.3% as of Q1 2024.
  • Fiber adoption driving performance gains. Trinidad and Tobago, Bermuda, and the Cayman Islands led the Caribbean region on fixed broadband performance, recording median download speeds of 110.26 Mbps, 109.79 Mbps, and 104.88 Mbps, respectively during Q1 2024. Strong fiber performance from a number of ISPs, including Digicel+ (across a range of markets), Amplia (Trinidad and Tobago), as well as Flow, Logic, and C3 Pure Fiber (Cayman Islands), helped drive this, with all recording median download speeds approaching or above 100 Mbps.
  • Latency performance varies hugely across the Caribbean. Key for real-time applications such as online gaming and video calling, latency performance varied significantly across the region. Thanks to the availability of fiber to most broadband users, markets such as Trinidad and Tobago hit median latency lows of just 15 ms in Q1 2024, while at the other end of the scale, markets such as Aruba and Haiti struggled with median latency approaching 100 ms.
  • Markets behind the curve are quickly catching up. The majority of Caribbean markets currently below the regional average for fixed network Consistency are catching up fast, led by markets such as the Dominican Republic, Sint Maarten, and the British Virgin Islands, which all increased network Consistency by more than 25 percentage points over the last two years. 

Fixed network performance varies dramatically across the Caribbean

Ookla Speedtest Intelligence® data shows a wide disparity in median fixed broadband performance across Caribbean markets, ranging from lows of 2.72 Mbps and 25.21 Mbps in Cuba and Sint Maarten respectively, to highs of 110.26 Mbps and 109.79 Mbps in Trinidad and Tobago, and Bermuda respectively. Median upload performance mimicked this trend, with a low of 1.02 Mbps for Cuba and a high of 89.15 Mbps in the Cayman Islands.

Fixed Broadband Performance Across Caribbean Markets
Speedtest Intelligence® | Q1 2024

Latency performance showed even greater variance, with some markets being able to access high-speed international links, and with others relying on multiple hops of undersea cables. Eight of the markets we examined recorded median multi-server latency below 50ms, with Trinidad and Tobago leading with 15ms, followed closely by Curaçao with 16ms. At the other end of the scale, a cluster of nine markets recorded latency ranging from 71 ms to 95 ms, while Cuba was the only market with median latency greater than 100 ms, recording 133 ms in Q1 2024. This marks an improvement year-on-year, down from 164 ms in Q1 2023, with the Arimao submarine cable (connecting Cuba to Martinique), helping drive some improvement, however, the island’s aging telecoms infrastructure continues to hold it back.

Fiber is the natural next step for many Caribbean ISPs

A number of Caribbean ISPs, led by groups such as Digicel, are transitioning to fiber access across their fixed operations. The transition from legacy broadband access technology to more modern, faster connections such as fiber takes time. In addition to network rollout and the significant public works this entails, operators and regulators need to ensure users are given enough incentive and education on the benefits of technologies such as fiber, in order to help drive adoption. Digicel+ in Bermuda stands out as a clear leader in the region on median download performance, followed by Digicel+ in Trinidad and Tobago. Beyond Digicel+, Logic, and C3 Pure Fiber in the Cayman Islands, and Amplia in Trinidad and Tobago all offered median download speeds approaching 100 Mbps. 

ISP Fiber Performance, Caribbean Markets
Speedtest Intelligence® | Q1 2024

Drive for broadband expansion puts leading Caribbean markets on par with the U.S. and Canada

Caribbean ISPs have made great strides in advancing the rollout of broadband services over the last four years. Ookla uses the network Consistency metric to gauge how prevalent acceptable broadband speeds are across a network, based on the percentage of Speedtest samples exceeding a threshold of 25 Mbps download and 3 Mbps upload performance. Cuba was rooted to the foot of the table based on Consistency, with just 4.0% of samples exceeding the threshold. Of the remaining Caribbean markets in this analysis, network Consistency climbed from 45.3% in Q1 2020 to 73.3% in Q1 2024.

The majority of Caribbean nations in this analysis recorded Consistency above 70% as of Q1 2024, with leading Caribbean nations such as Bermuda, Trinidad and Tobago, the Cayman Islands, Puerto Rico, and Barbados posting Consistency values approaching those of more advanced fixed markets in the Americas, such as the U.S. (89.8%) and Canada (88.7%).

Fixed Broadband Consistency Across Caribbean Markets
Speedtest Intelligence® | Q1 2024

This positive trajectory looks set to continue for many markets at the lower end of the scale too, as they look to catch up with their peers. The vast majority of those Caribbean markets recording less than 75% Consistency in Q1 2024, had increased their Consistency significantly over the past two years, led by Haiti, Sint Maarten, the British Virgin Islands and the Dominican Republic.

Change in Fixed Network Consistency, Select Caribbean Markets
Speedtest Intelligence® | Q1 2022 vs Q1 2024

Leading Caribbean markets face slowing Consistency growth and competition from non-traditional fixed ISPs

We see a mixed picture for leading Caribbean nations on further increases in network Consistency as they begin to approach other leading markets globally. Despite strong fixed broadband performance in many Caribbean markets, increases in network Consistency have been relatively static in some, including Bermuda, Aruba, and Grenada, which all saw network Consistency increase by less than 3 percentage points in the last two years. This indicates a tranche of users in these markets remain below the 25 Mbps download and 3 Mbps upload performance thresholds used in our measure of Consistency.

While growth will naturally slow as markets approach nationwide availability of fixed broadband services exceeding 25 Mbps download and 3 Mbps upload, operators in these markets need to zero in on locations where performance lags the rest of the market and identify root causes. For regulators, the priority may lie in encouraging the sunsetting of legacy fixed technologies, and facilitating the rollout and adoption of faster technologies such as fiber.

Change in Fixed Network Consistency, Leading Caribbean Markets
Speedtest Intelligence® | Q1 2022 vs Q1 2024

LEO satellite broadband is emerging as a viable home broadband alternative

We are beginning to see some alternative fixed broadband technologies make inroads within the Caribbean, following on the heels of their success in North America. While we see some instances of GEO and MEO satellite internet use across the Caribbean, the majority of satellite internet within the region, based on Speedtest samples, is from Starlink’s LEO service. Over the course of the last year (comparing Q1 2024 with Q1 2023), samples from Starlink among the markets in this analysis grew by 85.8%, and it continues to expand its service availability across Caribbean markets. According to its website, Starlink operates across a range of Caribbean markets, and of those included in this analysis, it is available in the Bahamas, Barbados, the Dominican Republic, Haiti, Jamaica, Puerto Rico, Trinidad and Tobago, and the U.S. Virgin Islands.

Starlink performed on par with, or faster than, the median download speed in each market it operated within, recording significant leads in the U.S. Virgin Islands and the Bahamas. However, Starlink does tend to lag the rest of the market on upload speeds and latency. While the cost of Starlink equipment and its subscriptions are often higher than for terrestrial broadband options, which will put it out of reach of some broadband users, it offers a viable alternative, especially in locations where legacy fixed broadband access is still prevalent, and where users prefer faster download performance.

Starlink Performance, Median Download Speed, Mbps
Speedtest Intelligence® | Q1 2024

With a range of cellular providers launching 5G across the Caribbean, we may begin to see 5G fixed-wireless (FWA) access begin to take root, as it has done in the U.S. Given the wide range of performance across the Caribbean, 5G FWA could offer users an uplift in speeds versus traditional fixed networks, and it will give cellular providers the opportunity to upsell home internet services to their existing mobile customer bases. While it’s still early days for these rival technologies, we’ll continue to monitor their progress and provide updates on the state of fixed broadband connectivity across the Caribbean. For more information about Ookla’s data and insights, please get in touch.

Ookla retains ownership of this article including all of the intellectual property rights, data, content graphs and analysis. This article may not be quoted, reproduced, distributed or published for any commercial purpose without prior consent. Members of the press and others using the findings in this article for non-commercial purposes are welcome to publicly share and link to report information with attribution to Ookla.

| July 27, 2021

Oslo Tops the List of World Capitals with the Fastest 5G in Q1-Q2 2021

Mobile operators are rapidly expanding 5G deployments across the globe, with 16,410 new 5G deployments across 109 countries added to the Ookla 5G Map in June 2021 alone. Huge investments in 5G are being made to increase performance, especially in major cities. We used Speedtest Intelligence® to see which world capitals have the best 5G speeds and availability, based on locations with commercially available 5G during Q1-Q2 2021.

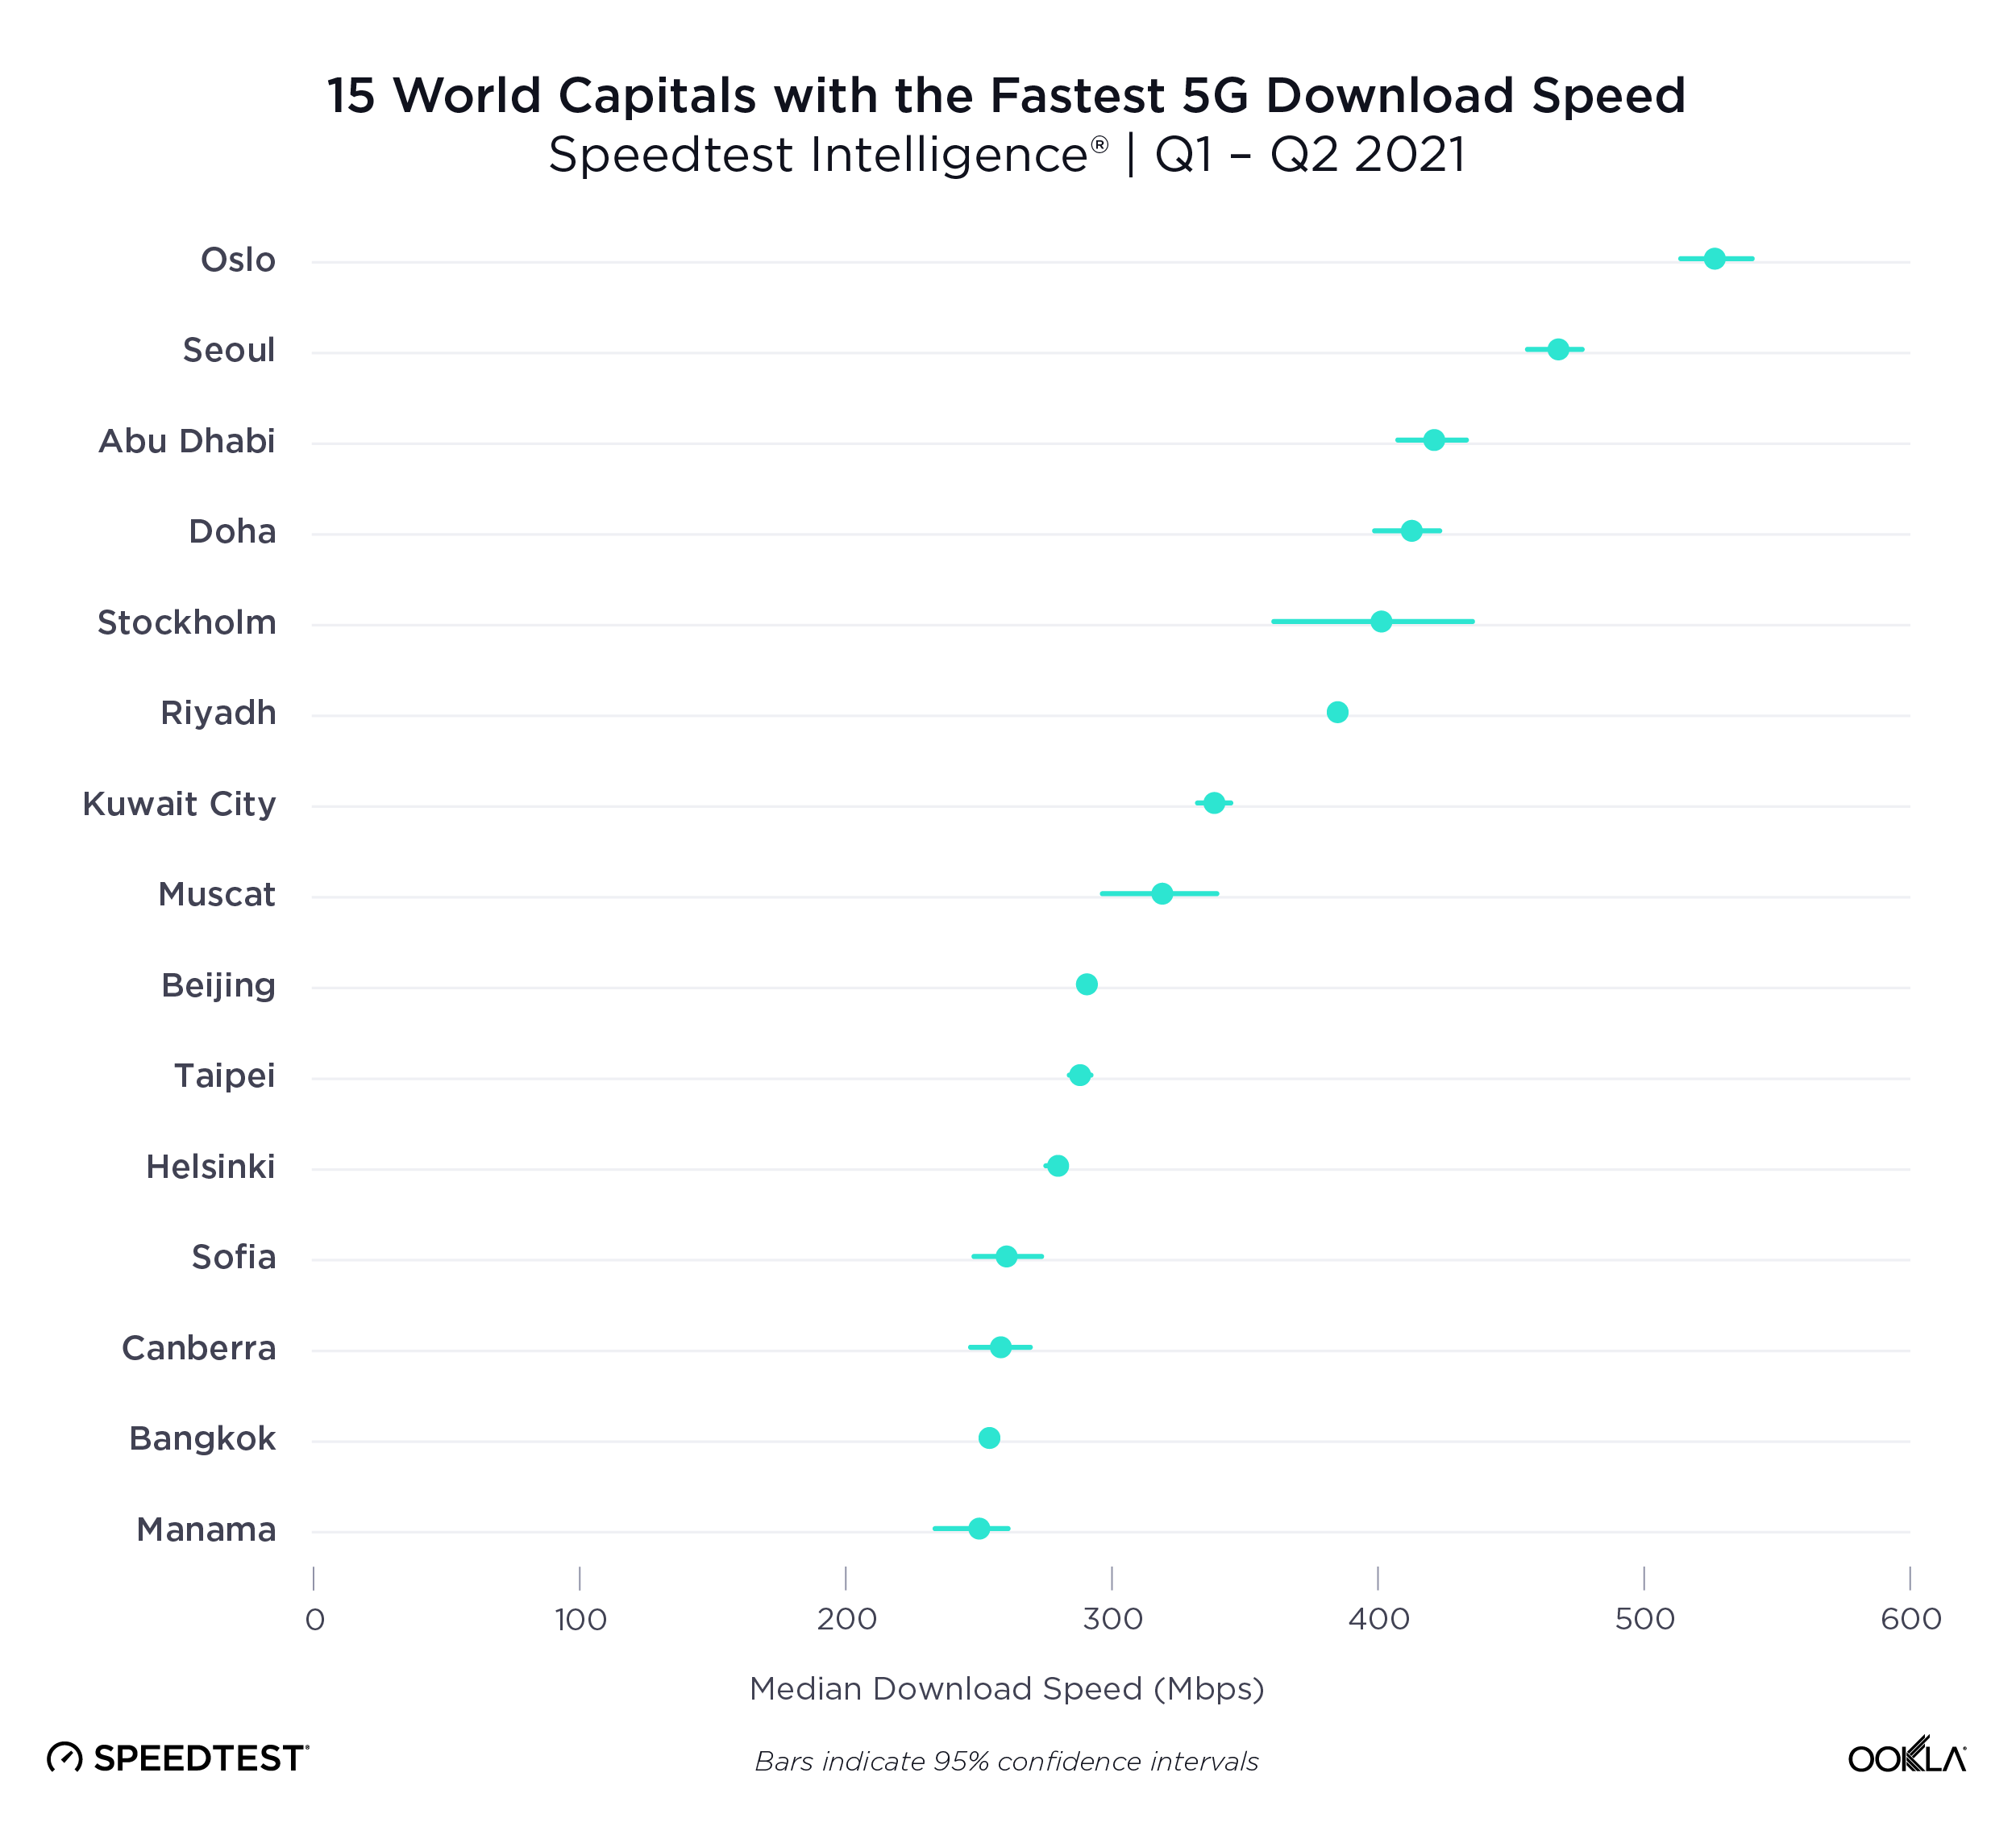
Oslo, Norway was the fastest world capital for 5G during Q1-Q2 2021

ookla_fastest_5g_download_speed_world_capitals_0721

The race for fastest 5G performance among world capitals was extremely competitive during Q1-Q2 2021. Oslo, Norway had the fastest 5G of any world capital, clocking in with a median download speed of 526.74 Mbps. Seoul, South Korea had the second fastest median download speed over 5G at 467.84 Mbps; Abu Dhabi, United Arab Emirates was third (421.26 Mbps); Doha, Qatar fourth (413.40 Mbps) and Stockholm, Sweden fifth (401.30 Mbps). Riyadh, Saudi Arabia (384.66 Mbps); Kuwait City, Kuwait (338.97 Mbps), Muscat, Oman (318.95 Mbps); Beijing, China (291.19 Mbps); and Taipei, Taiwan (287.86 Mbps); rounded out the top 10. Helsinki, Finland showed a median 5G download speed of 279.59 Mbps; Sofia, Bulgaria 260.55 Mbps; Canberra, Australia 258.39 Mbps; Bangkok, Thailand 253.73 Mbps; Manama, Bahrain 249.71; Dublin, Ireland 223.01; Luxembourg City, Luxembourg 209.98 Mbps; Paris, France 208.48 Mbps and Bucharest, Romania 203.44 Mbps.

We saw median 5G download speeds between 150 Mbps and 200 Mbps in the following world capitals during Q1-Q2 2021: Ottawa, Canada (196.11 Mbps); Hanoi, Vietnam (195.99 Mbps); Bratislava, Slovakia (188.23 Mbps); Madrid, Spain (183.37 Mbps); Bern, Switzerland (175.69 Mbps); Rome, Italy (171.79 Mbps); London, United Kingdom (167.50 Mbps); Tokyo, Japan (167.02 Mbps); Athens, Greece (164.95 Mbps); Copenhagen, Denmark (162.75 Mbps); Ljubljana, Slovenia (158.50 Mbps); Hong Kong (153.78) and Washington, D.C., United States (151.80 Mbps).

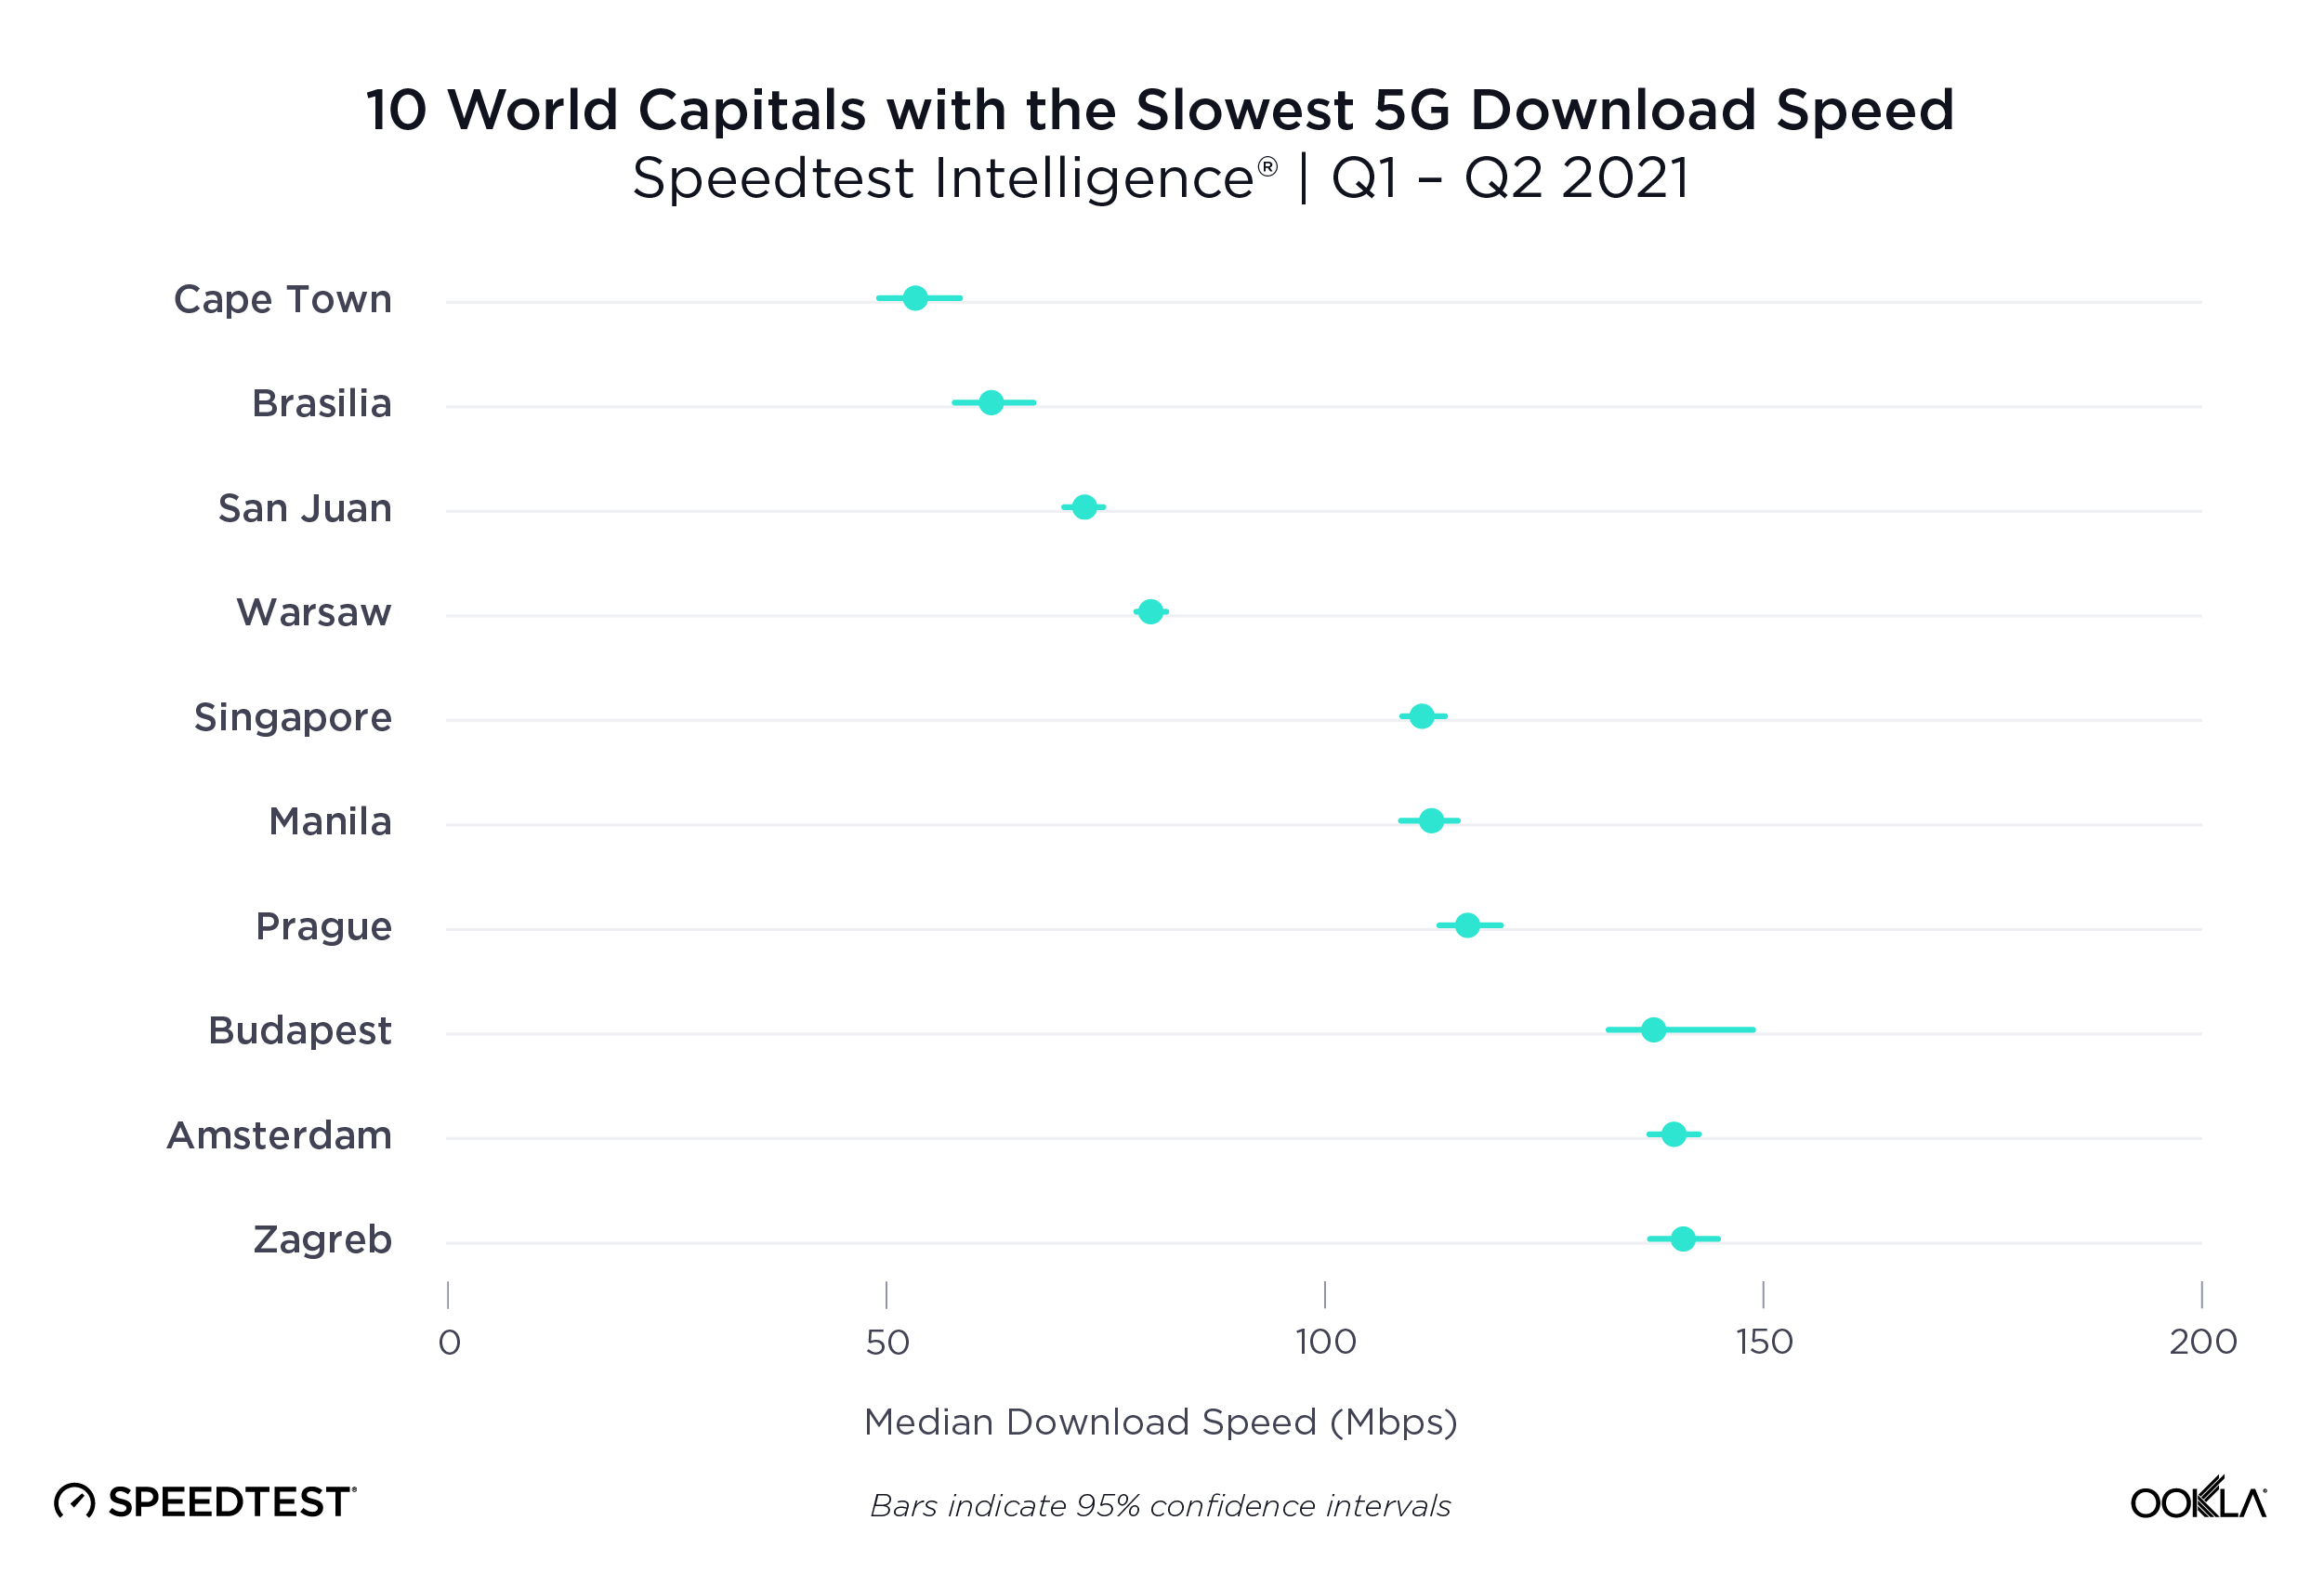
Cape Town, South Africa was the slowest world capital for 5G in Q1-Q2 2021

ookla_slowest_5g_download_speed_world_capitals_0721

Speedtest Intelligence shows Capetown, South Africa had the slowest median download speed over 5G during Q1-Q2 2021 at 53.33 Mbps. Other world capitals with slower median 5G download speeds included: Brasilia, Brazil (62.18 Mbps); San Juan, Puerto Rico (72.59 Mbps); Warsaw, Poland (80.18 Mbps); Singapore (111.20 Mbps); Manila, Philippines (112.23 Mbps); Prague, Czechia (116.30 Mbps); Budapest, Hungary (137.54 Mbps); Amsterdam, Netherlands (139.75 Mbps); Zagreb, Croatia (140.92 Mbps); Vienna, Austria (144.93 Mbps); Jerusalem, Israel (145.17 Mbps); and Berlin, Germany (148.16 Mbps).

Capitals not mentioned on either of these lists did not have sufficient 5G samples during Q1-Q2 2021 to be included in this report.

The fastest 5G speeds are yet to come

5G is rapidly improving across the world and we’re eager to see how countries, cities and operators continue to perform during Q3 2021 and beyond. If you want to see how your 5G network performs against these benchmarks, please download the Android or iOS app, and take a Speedtest®. Learn more about 5G provider performance in select cities here, and visit the Ookla 5G MapTM to see which providers are offering 5G in your area.

Editor’s note: This article was updated on July 28 to reorganize the content for clarity.

Ookla retains ownership of this article including all of the intellectual property rights, data, content graphs and analysis. This article may not be quoted, reproduced, distributed or published for any commercial purpose without prior consent. Members of the press and others using the findings in this article for non-commercial purposes are welcome to publicly share and link to report information with attribution to Ookla.

| November 19, 2018

Uncovering Which Latin American Countries have Adequate Internet Speeds (and Which Do Not)

Leer en español | Leia em Português

Latin America is a booming market for internet. Between a rapid increase in broadband subscribers and some of the most engaged mobile internet users, Latin Americans are smartphone savvy and looking for first world connection speeds. Trouble is, some markets don’t have access to the kind of fast mobile and broadband speeds that encourage economies to grow.

We analyzed Speedtest data on mobile and fixed broadband speeds from across Latin America during Q2-Q3 2018. The list includes sovereign countries and other generally recognized territories, except for Saint Barthélemy which did not show a significant test volume. We’ve broken down each set of results by the speeds typically needed for various activities:
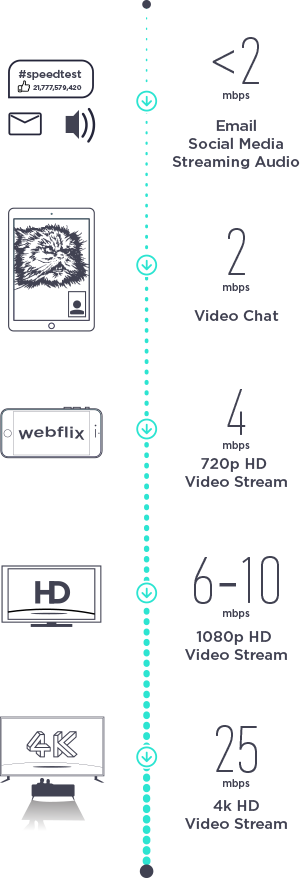

The results revealed deep divides in which countries are getting the speeds they need to easily connect to the world at large, those that have adequate connections and those that are struggling to connect.

Which country has the fastest mobile speeds in Latin America?

According to the GSMA, “Smartphones have been instrumental in establishing Latin America as one of the world’s largest consumers of social media, with the vast majority of usage occurring over mobile networks.” So who’s able to use those smartphones to their full capability and who’s better off using broadband?

4K Video Streamers

Our first group is made up of countries that should have the mean mobile download speeds to navigate even the most data-intensive mobile experiences. Martinique leads, ranking first in Latin America with a mean download speed over mobile that’s faster even than France. Guadeloupe is a close second.

Latin American Countries with Mobile Speeds > 25 Mbps
Speedtest Data | Q2-Q3 2018
Country Mean Download (Mbps) Mean Upload (Mbps)
Martinique 35.27 9.64
Guadeloupe 32.85 8.35

HD Streamers

The next group contains countries where residents should have the mobile speeds they need for HD streaming (at 1080p), video chat and social media. Uruguay tops this list to rank third in Latin America for mobile download speed. Saint Martin, Mexico, French Guiana, Ecuador, Peru and Honduras all show mobile download speeds faster than 20 Mbps.

Latin American Countries with Mobile Speeds 6-25 Mbps
Speedtest Data | Q2-Q3 2018
Country Mean Download (Mbps) Mean Upload (Mbps)
Uruguay 23.10 11.39
Saint Martin 22.65 8.00
Mexico 22.05 11.78
French Guiana 21.40 6.84
Ecuador 21.37 8.21
Peru 20.83 12.86
Honduras 20.36 10.33
Nicaragua 19.68 8.36
Brazil 18.50 7.52
Bolivia 17.33 11.03
Chile 16.32 9.07
Colombia 16.11 8.85
Argentina 15.40 7.77
Dominican Republic 14.90 8.28
Guatemala 14.89 9.48
Costa Rica 14.59 6.56
Puerto Rico 14.36 8.41
Paraguay 12.67 7.61
Panama 12.30 8.54
Haiti 9.33 3.41
El Salvador 8.83 4.17
Venezuela 7.74 4.33

Nicaragua, Brazil, Bolivia, Chile, Colombia, Argentina, the Dominican Republic, Guatemala, Costa Rica, Puerto Rico, Paraguay and Panama all show average mobile download speeds that are faster than the 6-10 Mbps recommended for HD video streaming on 1080p. This is important as growing segments of this region consume media primarily over mobile connections.

Learn more about Brazil’s mobile market in our Brazil Market Snapshot.

Video Chat and Email

The mobile speeds picture is not so good in Cuba where mobile speeds are slow enough that residents might struggle to use smartphones for more than one-to-one video chats and emails.

Latin American Countries with Mobile Speeds < 6 Mbps
Speedtest Data | Q2-Q3 2018
Country Mean Download (Mbps) Mean Upload (Mbps)
Cuba 5.34 1.92

Looking at the countries with the slowest speeds in Latin America, we can see they have all faced significant structural challenges including war, poverty and natural disaster. They are also countries that clearly need significant mobile investment.

While mobile infrastructure might not be the first thing these slowest countries choose to invest in, improving speeds in these areas could also significantly boost their economies by creating an environment that’s ripe for new startups and investment.

Fixed broadband

The speeds needed to complete internet tasks are similar on fixed broadband to what they are on mobile. What’s not the same is the list of countries in the 4K Video Streamers category.

4K Video Streamers

Chile jumps to the top when considering mean download speeds over fixed broadband in Latin America. Uruguay is second, Puerto Rico third, Panama fourth, Martinique fifth and Paraguay sixth. All of these Latin American countries have fast enough fixed broadband speeds to allow residents to easily do anything they’d like online.

Latin American Countries with Fixed Broadband Speeds > 25 Mbps
Speedtest Data | Q2-Q3 2018
Country Mean Download (Mbps) Mean Upload (Mbps) % Difference in Download Mobile Over Fixed
Chile 47.40 9.28 -190.44%
Uruguay 35.97 9.38 -55.71%
Puerto Rico 35.39 7.85 -146.45%
Panama 34.94 7.21 -184.07%
Martinique 29.71 11.39 15.76%
Paraguay 27.84 8.00 -119.73%

In almost all of these countries our analysis shows that fixed broadband download speeds are significantly faster than those on mobile. The exception is Martinique, which has faster mobile downloads than those on fixed broadband.

HD Streamers

The next group contains countries whose fixed broadband download speeds are good enough for video chat but where heavier uses like online gaming and streaming might not be as enjoyable. Brazil tops this list, ranking 7th in Latin America for download speed over fixed broadband. Brazil is followed by Guadeloupe, French Guiana, Peru, Mexico, Argentina, the Dominican Republic, Colombia, Ecuador, Costa Rica, Saint Martin, El Salvador, Haiti, Guatemala, Honduras, Bolivia and Nicaragua.

Latin American Countries with Fixed Broadband Speeds 6-25 Mbps
Speedtest Data | Q2-Q3 2018
Country Mean Download (Mbps) Mean Upload (Mbps) % Difference in Download Mobile Over Fixed
Brazil 23.64 10.57 -27.78%
Guadeloupe 23.31 9.34 29.04%
French Guiana 22.58 11.45 -5.51%
Peru 22.43 4.90 -7.68%
Mexico 22.37 8.53 -1.45%
Argentina 19.68 4.24 -27.79%
Dominican Republic 14.16 3.83 4.97%
Colombia 13.79 5.86 14.40%
Ecuador 13.08 9.69 38.79%
Costa Rica 11.39 3.61 21.93%
Saint Martin 9.13 5.54 59.69%
El Salvador 8.38 3.14 5.10%
Haiti 8.33 6.42 10.72%
Guatemala 7.94 3.78 46.68%
Honduras 7.32 4.36 64.05%
Bolivia 6.96 3.13 59.84%
Nicaragua 6.62 3.39 66.36%

With the exception of Guadeloupe, the six fastest countries in this group all have faster fixed broadband speeds than those on mobile. From the Dominican Republic on down the list, the rest of the countries in this group have faster mobile download speeds than those on fixed broadband.

Video Chat and Email

Venezuela joins Cuba on this list of countries in Latin America with fixed broadband download speeds slower than 6 Mbps. Though both countries have faster mobile download speeds than they do on fixed broadband. Which is good, because residents might need to resort to their phones to do more than simple video chats or email.

Latin American Countries with Fixed Broadband Speeds < 6 Mbps
Speedtest Data | Q2-Q3 2018
Country Mean Download (Mbps) Mean Upload (Mbps) % Difference in Download Mobile Over Fixed
Venezuela 3.96 1.50 48.84%
Cuba 3.73 4.07 30.15%

As we saw with mobile internet, there are many countries in Latin America that could use a solid investment in fixed broadband speeds. That is, unless providers are ready for mobile to be the primary vehicle consumers use to access the internet.

Mobile and broadband internet performance at a city level

Fort-de-France, Martinique ranks a strong first for mobile speed among the largest cities in Latin America, Marigot, Saint Martin second and Basse-Terre, Guadeloupe third. On the other end of the mobile spectrum, Havana ranks last followed by San Salvador, El Salvador and Caracas, Venezuela.

Internet Performance in Latin American Cities
Speedtest Data | Q2-Q3 2018
City Mobile Download (Mbps) Mobile Upload (Mbps) Fixed Download (Mbps) Fixed Upload (Mbps) % Difference in Download Mobile Over Fixed
Asunción, Paraguay 14.58 8.57 43.49 8.86 -198.29%
Basse-Terre, Guadeloupe 27.73 8.61 21.20 8.15 23.55%
Belo Horizonte, Brazil 19.00 7.86 28.38 6.62 -49.37%
Bogotá, Colombia 15.89 9.48 16.46 7.16 -3.59%
Brasília, Brazil 22.20 9.29 29.27 7.79 -31.85%
Buenos Aires, Argentina 16.40 8.53 27.56 5.31 -68.05%
Cali, Colombia 22.35 12.11 13.10 5.16 41.39%
Caracas, Venezuela 8.83 5.13 5.10 2.04 42.24%
Cayenne, French Guiana 22.66 7.86 25.32 14.67 -11.74%
Curitiba, Brazil 22.60 8.31 32.58 17.65 -44.16%
Ecatepec de Morelos, Mexico 16.67 10.35 19.89 3.98 -19.32%
Fort-de-France, Martinique 36.00 10.34 43.60 21.47 -21.11%
Fortaleza, Brazil 18.85 8.63 26.20 10.33 -38.99%
Guatemala City, Guatemala 16.09 10.33 9.60 5.10 40.34%
Guayaquil, Ecuador 23.61 9.43 14.44 9.42 38.84%
Havana, Cuba 4.47 1.26 2.99 3.10 33.11%
La Paz, Bolivia 16.92 11.81 7.16 3.20 57.68%
Lima, Peru 22.23 14.89 27.52 6.66 -23.80%
Managua, Nicaragua 21.04 8.89 6.87 3.52 67.35%
Manaus, Brazil 14.83 7.16 20.92 4.10 -41.07%
Marigot, Saint Martin 28.97 9.23 9.62 5.45 66.79%
Medellín, Colombia 17.58 9.17 14.76 6.87 16.04%
Mexico City, Mexico 21.41 11.22 29.81 12.41 -39.23%
Montevideo, Uruguay 23.30 11.65 38.39 10.12 -64.76%
Panama City, Panama 12.18 8.82 37.02 7.88 -203.94%
Port-au-Prince, Haiti 10.08 3.71 8.94 6.63 11.31%
Quito, Ecuador 21.01 7.75 15.54 11.59 26.04%
Rio de Janeiro, Brazil 22.02 9.02 28.62 10.36 -29.97%
Salvador, Brazil 17.85 7.44 20.43 6.09 -14.45%
San José, Costa Rica 14.69 6.92 12.39 4.74 15.66%
San Juan, Puerto Rico 16.05 9.76 50.13 15.64 -212.34%
San Salvador, El Salvador 8.65 4.23 10.26 3.88 -18.61%
Santiago, Chile 16.05 9.35 42.69 12.37 -165.98%
Santo Domingo, Dominican Republic 15.15 8.87 17.86 4.47 -17.89%
São Paulo, Brazil 20.74 8.41 36.54 17.45 -76.18%
Sucre, Bolivia 14.81 11.18 4.86 3.24 67.18%
Tegucigalpa, Honduras 26.24 13.61 7.39 2.91 71.84%

Denser and more urban locations are easier and more cost-effective places to deploy improvements to mobile infrastructure, so if speeds are slow in these areas, it’s a good sign that speeds are much worse elsewhere in the country.

On the fixed broadband side, San Juan, Puerto Rico ranks first in Latin America, followed by Fort-de-France, Martinique and Asunción, Paraguay. The city with the slowest fixed broadband download speed of those we analyzed is Havana, Cuba followed by Sucre, Bolivia and Caracas Venezuela.

Now that you know whether your country or city is rated for 4K video streaming, HD video streaming or just video chat and email, it’s time to find out if your speeds are above or below average. Take a Speedtest on Android, iOS or the web and tweet to us at @speedtest to share your experience.


Revelamos qué países de América Latina tienen velocidades de Internet adecuadas (y cuáles no)

América Latina es un mercado en expansión para Internet. Entre el rápido aumento de los suscriptores a la banda ancha y algunos de los usuarios de Internet móvil más activos, podemos decir que los latinoamericanos son conocedores de los teléfonos inteligentes y pretenden alcanzar las velocidades de conexión del primer mundo. El problema es que algunos mercados no tienen acceso a los tipos de velocidades de banda ancha y móvil rápidas que impulsan el crecimiento de las economías.

Analizamos los datos de Speedtest sobre velocidades de banda ancha móvil y fija de toda América Latina durante el segundo y tercer trimestres de 2018. La lista incluye países soberanos y otros territorios generalmente reconocidos, con la excepción de San Bartolomé, que no presentó un volumen de prueba significativo. Desglosamos cada conjunto de resultados por las velocidades que, en general, se necesitan para diversas actividades:

Los resultados revelaron grandes diferencias en los países que obtienen las velocidades que necesitan para conectarse de manera sencilla con el resto del mundo, los que tienen conexiones adecuadas y los que tienen dificultades de conexión.

¿Cuál es el país de América Latina que tiene las velocidades móviles más rápidas?

De acuerdo con la Asociación GSM, los “teléfonos inteligentes han sido fundamentales para que América Latina se convirtiera en uno de los más grandes consumidores de redes sociales del mundo, ya que la mayor parte de ese consumo se produce en redes móviles”. Por lo tanto, ¿quién puede aprovechar al máximo los teléfonos inteligentes y a quién le conviene usar la banda ancha?

Transmisores de video en 4K

Nuestro primer grupo está compuesto por países que deberían tener las velocidades medias de descarga móvil necesarias para admitir las experiencias móviles con el uso más intensivo de datos. Martinica lidera el grupo ocupando el primer lugar de América Latina con una velocidad media de descarga móvil más rápida que incluso la de Francia. Guadalupe ocupa el segundo lugar.

Países de América Latina con velocidades móviles superiores a 25 Mbps
Datos de Speedtest | T2-T3 2018
País Enlace descendente móvil (Mbps) Enlace ascendente móvil (Mbps)
Martinica 35,27 9,64
Guadeloupe 32,85 8,35

Transmisores en HD

El siguiente grupo incluye países en que los residentes deberían tener las velocidades móviles que necesitan para transmisión en HD (a 1080p), videollamada y redes sociales. Uruguay encabeza esta lista ocupando el tercer puesto de América Latina en cuanto a velocidad de descarga móvil. San Martín, México, Guayana Francesa, Ecuador, Perú y Honduras presentan velocidades de descarga móvil superiores a 20 Mbps.

Países de América Latina con velocidades móviles de 6 a 25 Mbps
Datos de Speedtest | T2-T3 2018
País Enlace descendente móvil (Mbps) Enlace ascendente móvil (Mbps)
Uruguay 23,10 11,39
San Martín 22,65 8,00
México 22,05 11,78
Guayana Francesa 21,40 6,84
Ecuador 21,37 8,21
Perú 20,83 12,86
Honduras 20,36 10,33
Nicaragua 19,68 8,36
Brasil 18,50 7,52
Bolivia 17,33 11,03
Chile 16,32 9,07
Colombia 16,11 8,85
Argentina 15,40 7,77
República Dominicana 14,90 8,28
Guatemala 14,89 9,48
Costa Rica 14,59 6,56
Puerto Rico 14,36 8,41
Paraguay 12,67 7,61
Panamá 12,30 8,54
Haití 9,33 3,41
El Salvador 8,83 4,17
Venezuela 7,74 4,33

Nicaragua, Brasil, Bolivia, Chile, Colombia, Argentina, República Dominicana, Guatemala, Costa Rica, Puerto Rico, Paraguay y Panamá presentan velocidades medias de descarga móvil superiores a los 6-10 Mbps recomendados para transmisión de video en HD a 1080p. Esto es importante, ya que los segmentos en crecimiento de esta región utilizan los medios principalmente mediante conexiones móviles.

Conozca más sobre el mercado móvil brasileño.

Videollamada y correo electrónico

El panorama de las velocidades móviles no es muy bueno en Cuba, donde las velocidades móviles son tan lentas que los residentes tienen dificultades para usar teléfonos inteligentes para correos electrónicos y videollamadas entre más de dos personas.

Países de América Latina con velocidades móviles inferiores a 6 Mbps
Datos de Speedtest | T2-T3 2018
País Enlace descendente móvil (Mbps) Enlace ascendente móvil (Mbps)
Cuba 5,34 1,92

Si analizamos los países con las velocidades más lentas de América Latina, podemos observar que todos han enfrentado desafíos estructurales significativos, entre ellos, guerras, pobreza y desastres naturales. Además, son países que, sin dudas, necesitan una importante inversión en redes móviles.

Si bien la infraestructura móvil puede no ser lo primero en que eligen invertir los países más lentos, al mejorar las velocidades en estas áreas, también se podrían impulsar significativamente sus economías mediante la creación de entornos preparados para nuevas empresas emergentes e inversiones.

Banda ancha fija

Las velocidades necesarias para realizar tareas en Internet son similares para la banda ancha fija y la banda ancha móvil. Lo que no es igual es la lista de países dentro de la categoría de transmisores de video en 4K.

Transmisores de video en 4K

Chile asciende al primer lugar cuando consideramos las velocidades medias de descarga mediante banda ancha fija en América Latina. Uruguay ocupa el segundo lugar; Puerto Rico, el tercero; Panamá, el cuarto; Martinica, el quinto; y Paraguay, el sexto. Todos estos países latinoamericanos cuentan con velocidades de banda ancha fija lo suficientemente rápidas para permitir que los residentes hagan lo que quieran con facilidad en Internet.

Países de América Latina con velocidades de banda ancha fija superiores a 25 Mbps
Datos de Speedtest | T2-T3 2018
País Enlace descendente fijo (Mbps) Enlace ascendente fijo (Mbps) Diferencia porcentual entre las descargas mediante banda ancha móvil y fija
Chile 47,40 9,28 -190,44%
Uruguay 35,97 9,38 -55,71%
Puerto Rico 35,39 7,85 -146,45%
Panamá 34,94 7,21 -184,07%
Martinica 29,71 11,39 15,76%
Paraguay 27,84 8,00 -119,73%

Nuestro análisis muestra que, en casi todos estos países, las velocidades de descarga de banda ancha fija son significativamente más rápidas que las de banda ancha móvil. La única excepción es Martinica, donde las velocidades de descarga móvil son más rápidas que las de banda ancha fija.

Transmisores en HD

El siguiente grupo incluye países cuyas velocidades de descarga de banda ancha fija son lo suficientemente buenas para videollamadas, pero donde los usos más intensivos, como los juegos y las transmisiones en línea, pueden no resultar tan placenteros. Brasil encabeza esta lista ocupando el séptimo lugar en América Latina para velocidad de descarga mediante banda ancha fija. A continuación de Brasil, se ubican Guadalupe, Guayana Francesa, Perú, México, Argentina, República Dominicana, Colombia, Ecuador, Costa Rica, San Martín, El Salvador, Haití, Guatemala, Honduras, Bolivia y Nicaragua.

Países de América Latina con velocidades de banda ancha fija de 6 a 25 Mbps
Datos de Speedtest | T2-T3 2018
País Enlace descendente fijo (Mbps) Enlace ascendente fijo (Mbps) Diferencia porcentual entre las descargas mediante banda ancha móvil y fija
Brasil 23,64 10,57 -27,78%
Guadeloupe 23,31 9,34 29,04%
Guayana Francesa 22,58 11,45 -5,51%
Perú 22,43 4,90 -7,68%
México 22,37 8,53 -1,45%
Argentina 19,68 4,24 -27,79%
República Dominicana 14,16 3,83 4,97%
Colombia 13,79 5,86 14,40%
Ecuador 13,08 9,69 38,79%
Costa Rica 11,39 3,61 21,93%
San Martín 9,13 5,54 59,69%
El Salvador 8,38 3,14 5,10%
Haití 8,33 6,42 10,72%
Guatemala 7,94 3,78 46,68%
Honduras 7,32 4,36 64,05%
Bolivia 6,96 3,13 59,84%
Nicaragua 6,62 3,39 66,36%

Con la excepción de Guadalupe, los seis países más rápidos de este grupo tienen velocidades de banda ancha fija más rápidas que las de banda ancha móvil. A partir de la República Dominicana hasta el final de la lista, el resto de los países de este grupo tienen velocidades de descarga móvil más rápidas que las velocidades de banda ancha fija.

Videollamada y correo electrónico

Venezuela ocupa el mismo lugar que Cuba en esta lista de países de América Latina con velocidades de descarga de banda ancha fija inferiores a 6 Mbps. Sin embargo, ambos países tienen velocidades de descarga móvil más rápidas que las velocidades de descarga por banda ancha fija. Esto es positivo, porque los residentes pueden necesitar recurrir a sus teléfonos para mucho más que solamente simples videollamadas o correos electrónicos.

Países de América Latina con velocidades móviles inferiores a 6 Mbps
Datos de Speedtest | T2-T3 2018
País Enlace descendente fijo (Mbps) Enlace ascendente fijo (Mbps) Diferencia porcentual entre las descargas mediante banda ancha móvil y fija
Venezuela 3,96 1,50 48,84%
Cuba 3,73 4,07 30,15%

Tal como observamos con el uso de Internet móvil, hay muchos países latinoamericanos donde sería recomendable realizar inversiones sólidas en velocidades de banda ancha fija. Es decir, a menos que los proveedores estén preparados para que la banda ancha móvil sea el principal medio que los consumidores utilizan para acceder a Internet.

Rendimiento de Internet por banda ancha fija y móvil en las ciudades

Fort-de-France (Martinica) ocupa cómodamente el primer lugar en cuanto a velocidad móvil entre las ciudades más grandes de América Latina. Marigot (San Martín) ocupa el segundo lugar y Basse-Terre (Guadalupe), el tercero. En el otro extremo del espectro móvil, La Habana ocupa el último lugar, seguida de San Salvador (El Salvador) y Caracas (Venezuela).

Rendimiento de Internet en ciudades latinoamericanas

Datos de Speedtest | Q2-Q3 2018
Ciudad Descarga móvil (Mbps) Carga móvil (Mbps) Descarga fijo (Mbps) Carga fijo (Mbps) Diferencia porcentual entre las descargas mediante banda ancha móvil y fija
Asunción, Paraguay 14,58 8,57 43,49 8,86 -198,29%
Basse-Terre, Guadeloupe 27,73 8,61 21,20 8,15 23,55%
Belo Horizonte, Brasil 19,00 7,86 28,38 6,62 -49,37%
Bogotá, Colombia 15,89 9,48 16,46 7,16 -3,59%
Brasília, Brazil 22,20 9,29 29,27 7,79 -31,85%
Buenos Aires, Argentina 16,40 8,53 27,56 5,31 -68,05%
Cali, Colombia 22,35 12,11 13,10 5,16 41,39%
Caracas, Venezuela 8,83 5,13 5,10 2,04 42,24%
Cayena, Guayana Francesa 22,66 7,86 25,32 14,67 -11,74%
Ciudad de Guatemala, Guatemala 16,09 10,33 9,60 5,10 40,34%
Ciudad de México, México 21,41 11,22 29,81 12,41 -39,23%
Ciudad de Panamá, Panamá 12,18 8,82 37,02 7,88 -203,94%
Curitiba, Brasil 22,60 8,31 32,58 17,65 -44,16%
Ecatepec de Morelos, México 16,67 10,35 19,89 3,98 -19,32%
Fort-de-France, Martinica 36,00 10,34 43,60 21,47 -21,11%
Fortaleza, Brasil 18,85 8,63 26,20 10,33 -38,99%
Guayaquil, Ecuador 23,61 9,43 14,44 9,42 38,84%
La Habana, Cuba 4,47 1,26 2,99 3,10 33,11%
La Paz, Bolivia 16,92 11,81 7,16 3,20 57,68%
Lima, Perú 22,23 14,89 27,52 6,66 -23,80%
Managua, Nicaragua 21,04 8,89 6,87 3,52 67,35%
Manaos, Brasil 14,83 7,16 20,92 4,10 -41,07%
Marigot, San Martín 28,97 9,23 9,62 5,45 66,79%
Medellín, Colombia 17,58 9,17 14,76 6,87 16,04%
Montevideo, Uruguay 23,30 11,65 38,39 10,12 -64,76%
Puerto Príncipe, Haití 10,08 3,71 8,94 6,63 11,31%
Quito, Ecuador 21,01 7,75 15,54 11,59 26,04%
Río de Janeiro, Brasil 22,02 9,02 28,62 10,36 -29,97%
Salvador, Brasil 17,85 7,44 20,43 6,09 -14,45%
San José, Costa Rica 14,69 6,92 12,39 4,74 15,66%
San Juan, Puerto Rico 16,05 9,76 50,13 15,64 -212,34%
San Salvador, El Salvador 8,65 4,23 10,26 3,88 -18,61%
Santiago, Chile 16,05 9,35 42,69 12,37 -165,98%
Santo, Domingo, República Dominicana 15,15 8,87 17,86 4,47 -17,89%
San Pablo, Brasil 20,74 8,41 36,54 17,45 -76,18%
Sucre, Bolivia 14,81 11,18 4,86 3,24 67,18%
Tegucigalpa, Honduras 26,24 13,61 7,39 2,91 71,84%

Las ubicaciones más urbanas y con mayor densidad de población son lugares donde es más fácil y económico implantar mejoras para la infraestructura móvil; por lo tanto, si las velocidades son lentas en estas áreas, es una buena señal que las velocidades sean aún más lentas en otros lugares del país.

En cuanto a la banda ancha fija, San Juan (Puerto Rico) ocupa el primer lugar de América Latina, seguida de Fort-de-France (Martinica) y Asunción (Paraguay). La ciudad con la velocidad de descarga de banda ancha fija más lenta de las que analizamos es La Habana (Cuba), seguida de Sucre (Bolivia) y Caracas (Venezuela).

Ahora que sabe si su país o su ciudad son aptos para transmisión de video en 4K, transmisión de video en HD o solo para videollamadas y correo electrónico, es momento de averiguar si las velocidades están por encima o por debajo de la media. Realice un Speedtest en Android, iOS o la Web y envíenos un tuit a @speedtest para compartir su experiencia.


Revelando quais países da América Latina têm velocidade de internet adequada (e quais não têm)

A América Latina é um mercado em expansão para a internet. A população da América Latina vivenciou um crescimento rápido no número de assinantes de banda larga, tem alguns dos usuários de internet móvel mais engajados do mundo, sabe usar bem seus smartphones e busca velocidades de conexão de primeiro mundo. O problema é que alguns mercados não têm acesso às velocidades rápidas de banda larga móvel e fixa que encorajam o crescimento econômico.

Analisamos dados do Speedtest quanto à velocidade de banda larga móvel e fixa de toda a América Latina durante o segundo e o terceiro trimestres de 2018. Essa lista inclui países soberanos e outros territórios geralmente reconhecidos, exceto São Bartolomeu, que não exibiu um volume de teste significativo. Detalhamos cada conjunto de resultados de acordo com as velocidades tipicamente necessárias para diversas atividades.

O resultado revelou que existe uma divisão em três grandes grupos: países que atingem as velocidades necessárias para se conectar com facilidade com o resto do mundo, países que atingem conexões adequadas e países que enfrentam dificuldades de conexão.

Qual país tem a maior velocidade de internet móvel na América Latina?

De acordo com o GSMA, “os smartphones foram e são essenciais para estabelecer a América Latina como um dos maiores consumidores de redes sociais do mundo, com grande parte do uso ocorrendo em redes móveis.” Então queremos saber: que países conseguem usar smartphones em sua capacidade total e que países dependem mais de banda larga fixa?

Streamers de vídeo em 4K

Nosso primeiro grupo é composto por países que atingem velocidades médias de download móvel ideal até mesmo para as experiências móveis que mais usam dados. Martinica está na liderança, ocupando a primeira posição na América Latina e contando com uma velocidade média de download em banda larga móvel mais rápida do que a da França. Guadalupe fica em segundo lugar, com pouca diferença.

Países da América Latina com velocidades móveis maiores que 25 Mbps
Dados de Speedtest | T2-T3 2018
País Veloc. de download (Mbps) Veloc. de upload (Mbps)
Martinica 35,27 9,64
Guadeloupe 32,85 8,35

Streamers de HD

No próximo grupo estão países nos quais os residentes têm velocidade móvel suficiente para streaming HD (em 1080p), chat por vídeo e redes sociais. O Uruguai ocupa o primeiro lugar da lista, ficando em terceiro na América Latina em questão de velocidade de download móvel. São Martinho, México, Guiana Francesa, Equador, Peru e Honduras apresentam velocidades de download móvel mais rápidas do que 20 Mbps.

Países da América Latina com velocidades móveis entre 6 e 25 Mbps
Dados de Speedtest | T2-T3 2018
País Veloc. de download (Mbps) Veloc. de upload (Mbps)
Uruguai 23,10 11,39
São Martinho 22,65 8,00
México 22,05 11,78
Guiana Francesa 21,40 6,84
Equador 21,37 8,21
Peru 20,83 12,86
Honduras 20,36 10,33
Nicarágua 19,68 8,36
Brasil 18,50 7,52
Bolívia 17,33 11,03
Chile 16,32 9,07
Colômbia 16,11 8,85
Argentina 15,40 7,77
República Dominicana 14,90 8,28
Guatemala 14,89 9,48
Costa Rica 14,59 6,56
Porto Rico 14,36 8,41
Paraguai 12,67 7,61
Panamá 12,30 8,54
Haiti 9,33 3,41
El Salvador 8,83 4,17
Venezuela 7,74 4,33

Nicarágua, Brasil, Bolívia, Chile, Colômbia, Argentina, República Dominicana, Guatemala, Costa Rica, Porto Rico, Paraguai e Panamá têm velocidades de download móvel médias mais rápidas do que os 6 a 10 Mbps recomendados para streaming de vídeo HD em 1080p. Isso é importante, pois cada vez mais segmentos dessa região consomem mídia primariamente por conexões móveis.

Saiba mais sobre o mercado de telefonia móvel do Brasil.

Chat por vídeo e e-mail

A cena da velocidade móvel não é tão boa em Cuba, onde as velocidades móveis são baixas a ponto de os residentes terem problemas para usar smartphones quando o uso vai além de chats de vídeo com duas pessoas e troca de e-mails.

Países da América Latina com velocidades móveis abaixo de 6 Mbps
Dados de Speedtest | T2-T3 2018
País Veloc. de download (Mbps) Veloc. de upload (Mbps)
Cuba 5,34 1,92

Observando os países com as velocidades mais baixas da América Latina, podemos constatar que todos eles enfrentaram desafios estruturais significativos, tais como guerra, pobreza e desastres naturais. Também são países que claramente precisam de investimento móvel significativo.

Embora a infraestrutura móvel possa não ser a primeira coisa na qual esses países mais lentos escolhem investir, a melhoria das velocidades nessas áreas também pode impulsionar significativamente suas economias ao criar um ambiente propício para novas startups e investimentos.

Banda larga fixa

As velocidades necessárias para realizar as tarefas da internet são semelhantes na banda larga fixa e móvel. Mas a lista de países na categoria Streamers de vídeo em 4K não é igual.

Streamers de vídeo em 4K

O Chile pula para o primeiro lugar quando consideramos as velocidades médias de download em banda larga fixa na América Latina. O Uruguai fica em segundo, Porto Rico em terceiro, Panamá em quarto, Martinica em quinto e Paraguai em sexto. Todos esses países da América Latina têm velocidades de banda larga fixa rápidas o suficiente para permitir que os residentes façam o que quiserem on-line e com facilidade.

Países da América Latina com velocidades de banda larga fixa maior que 25 Mbps
Dados de Speedtest | T2-T3 2018
País Veloc. de download (Mbps) Veloc. de upload (Mbps) Percentual de diferença na veloc. de download de banda larga móvel em relação a banda larga fixa
Chile 47,40 9,28 -190,44%
Uruguai 35,97 9,38 -55,71%
Porto Rico 35,39 7,85 -146,45%
Panamá 34,94 7,21 -184,07%
Martinica 29,71 11,39 15,76%
Paraguai 27,84 8,00 -119,73%

Em quase todos esses países, nossa análise revela que as velocidades de download de banda larga fixa são significativamente mais rápidas do que as velocidades de redes móveis. A exceção é Martinica, que tem velocidades de downloads móveis mais rápidas do que as velocidades downloads de banda larga fixa.

Streamers de HD

O próximo grupo contém países cujas velocidades de download de banda larga fixa são boas o suficiente para chat por vídeo, mas não são ideais para usos que exigem maior velocidade, tais como jogos on-line e streaming. O Brasil ocupa a primeira posição nessa lista e a 7ª na América Latina para velocidade de download em banda larga fixa. Depois do Brasil, temos Guadalupe, Guiana Francesa, Peru, México, Argentina, República Dominicana, Colômbia, Equador, Costa Rica, São Martinho, El Salvador, Haiti, Guatemala, Honduras, Bolívia e Nicarágua.

Países da América Latina com velocidades de banda larga fixa entre 6 e 25 Mbps
Dados de Speedtest | T2-T3 2018
País Veloc. de download (Mbps) Veloc. de upload (Mbps) Percentual de diferença na veloc. de download de banda larga móvel em relação a banda larga fixa
Brasil 23,64 10,57 -27,78%
Guadeloupe 23,31 9,34 29,04%
Guaiana Francesa 22,58 11,45 -5,51%
Peru 22,43 4,90 -7,68%
México 22,37 8,53 -1,45%
Argentina 19,68 4,24 -27,79%
República Dominicana 14,16 3,83 4,97%
Colômbia 13,79 5,86 14,40%
Equador 13,08 9,69 38,79%
Costa Rica 11,39 3,61 21,93%
São Martinho 9,13 5,54 59,69%
El Salvador 8,38 3,14 5,10%
Haiti 8,33 6,42 10,72%
Guatemala 7,94 3,78 46,68%
Honduras 7,32 4,36 64,05%
Bolívia 6,96 3,13 59,84%
Nicarágua 6,62 3,39 66,36%

Com a exceção de Guadalupe, os seis países mais rápidos deste grupo têm velocidades de banda larga fixa mais rápidas do que as de banda larga móvel. Da República Dominicana para baixo na lista, os outros países do grupo têm velocidades de download de banda larga móvel mais rápidas do que as de banda larga fixa.

Chat por vídeo e e-mail

A Venezuela se junta a Cuba na lista de países da América Latina com velocidades de download de banda larga fixa inferiores a 6 Mbps. Apesar disso, ambos os países terem velocidades de download de banda larga móvel mais rápidas do que as de banda larga fixa. Isso é positivo, já que é possível que os residentes precisem usar seus telefones para coisas mais complexas do que simples chats por vídeo ou e-mail.

Países da América Latina com velocidades móveis abaixo de 6 Mbps
Dados de Speedtest | T2-T3 2018
País Veloc. de download (Mbps) Veloc. de upload (Mbps) Percentual de diferença na veloc. de download de banda larga móvel em relação a banda larga fixa
Venezuela 3,96 1,50 48,84%
Cuba 3,73 4,07 30,15%

Como vimos com a internet móvel, para muitos países na América Latina seria útil ter um investimento maciço em velocidades de banda larga fixa. Quer dizer, a menos que os provedores estejam prontos para que a banda larga móvel seja o principal veículo que os consumidores usam para acessar a internet.

Desempenho de internet com banda larga móvel e fixa por cidade

Fort-de-France, em Martinica, ocupa a primeira posição no quesito velocidade móvel com bastante vantagem em relação às outras cidades importantes da América Latina. Marigot, em São Martinho, fica em segundo, e Basse-Terre, em Guadalupe, em terceiro. No outro extremo do espectro de redes móveis, a cidade de Havana é a última, seguida por San Salvador, El Salvador e Caracas, na Venezuela.

Desempenho da internet
em cidades latino-americanas

Dados de Speedtest | Q2-Q3 2018
Cidade Download móvel (Mbps) Upload móvel (Mbps) Download fixa (Mbps) Upload fixa (Mbps) Percentual de diferença na veloc. de download de banda larga móvel em relação a banda larga fixa
Asunción, Paraguai 14,58 8,57 43,49 8,86 -198,29%
Basse-Terre, Guadeloupe 27,73 8,61 21,20 8,15 23,55%
Belo Horizonte, Brasil 19,00 7,86 28,38 6,62 -49,37%
Bogotá, Colômbia 15,89 9,48 16,46 7,16 -3,59%
Brasília, Brazil 22,20 9,29 29,27 7,79 -31,85%
Buenos Aires, Argentina 16,40 8,53 27,56 5,31 -68,05%
Cali, Colômbia 22,35 12,11 13,10 5,16 41,39%
Caracas, Venezuela 8,83 5,13 5,10 2,04 42,24%
Cayenne, Guaiana Francesa 22,66 7,86 25,32 14,67 -11,74%
Cidade de Guatemala, Guatemala 16,09 10,33 9,60 5,10 40,34%
Cidade de México, México 21,41 11,22 29,81 12,41 -39,23%
Cidade de Panamá, Panamá 12,18 8,82 37,02 7,88 -203,94%
Curitiba, Brasil 22,60 8,31 32,58 17,65 -44,16%
Ecatepec de Morelos, México 16,67 10,35 19,89 3,98 -19,32%
Fort-de-France, Martinica 36,00 10,34 43,60 21,47 -21,11%
Fortaleza, Brasil 18,85 8,63 26,20 10,33 -38,99%
Guayaquil, Equador 23,61 9,43 14,44 9,42 38,84%
Havana, Cuba 4,47 1,26 2,99 3,10 33,11%
La Paz, Bolívia 16,92 11,81 7,16 3,20 57,68%
Lima, Peru 22,23 14,89 27,52 6,66 -23,80%
Managua, Nicarágua 21,04 8,89 6,87 3,52 67,35%
Manaus, Brasil 14,83 7,16 20,92 4,10 -41,07%
Marigot, São Martinho 28,97 9,23 9,62 5,45 66,79%
Medellín, Colômbia 17,58 9,17 14,76 6,87 16,04%
Montevideo, Uruguai 23,30 11,65 38,39 10,12 -64,76%
Port-au-Prince, Haiti 10,08 3,71 8,94 6,63 11,31%
Quito, Equador 21,01 7,75 15,54 11,59 26,04%
Rio de Janeiro, Brasil 22,02 9,02 28,62 10,36 -29,97%
Salvador, Brasil 17,85 7,44 20,43 6,09 -14,45%
San José, Costa Rica 14,69 6,92 12,39 4,74 15,66%
San Juan, Porto Rico 16,05 9,76 50,13 15,64 -212,34%
San Salvador, El Salvador 8,65 4,23 10,26 3,88 -18,61%
Santiago, Chile 16,05 9,35 42,69 12,37 -165,98%
Santo, Domingo, República Dominicana 15,15 8,87 17,86 4,47 -17,89%
São Paulo, Brasil 20,74 8,41 36,54 17,45 -76,18%
Sucre, Bolívia 14,81 11,18 4,86 3,24 67,18%
Tegucigalpa, Honduras 26,24 13,61 7,39 2,91 71,84%

Locais mais densos e urbanos são locais mais fáceis e econômicos para implementar melhorias na infraestrutura móvel, portanto, se as velocidades forem lentas nessas áreas, é um bom sinal de que as velocidades são muito piores em outros lugares do país.

No que diz respeito à banda larga fixa, San Juan, em Porto Rico, ocupa a primeira posição na América Latina, seguida por Fort-de-France, em Martinica, e Asunción, no Paraguai. A cidade com a velocidade de download de banda larga fixa mais lenta dentre as que analisamos é Havana, em Cuba, seguida por Sucre, na Bolívia e Caracas, na Venezuela.

Agora que você sabe a classificação do seu país ou cidade para streaming de vídeo em 4K, streaming de vídeo em HD ou apenas chat por vídeo e e-mail, é hora de descobrir se suas velocidades estão acima ou abaixo da média. Faça o Speedtest no Android, iOS, ou na web e mande um tweet para @speedtest para compartilhar sua experiência.

Ookla retains ownership of this article including all of the intellectual property rights, data, content graphs and analysis. This article may not be quoted, reproduced, distributed or published for any commercial purpose without prior consent. Members of the press and others using the findings in this article for non-commercial purposes are welcome to publicly share and link to report information with attribution to Ookla.

| July 12, 2022

Caribbean Advances Toward Digital Future but Some Are Left Behind

Mobile connectivity in the Caribbean is a growth industry with 28 million unique mobile subscribers as of Q2 2022, a market penetration of 63.7%, according to the GSMA, short of the global market penetration of 67.1%. Additionally, few Caribbean markets have 5G. In advance of the CANTO conference on July 17, we examined Q2 2022 data from the five most populous Caribbean countries as well as Puerto Rico to see how initiatives to enable digital evolution and transformation are progressing. We looked at country-level performance data as well as mobile availability statistics in each country.

Mobile performance varies widely across the Caribbean

At 46.84 Mbps, Puerto Rico had the fastest median mobile download speed by far when comparing the most populous Caribbean countries during Q2 2022 using Speedtest Intelligence®. This was at least a 43% improvement over Q2 2021. 5G is a big differentiator with only Puerto Rico and the Dominican Republic having commercial availability for 5G according to the Ookla® 5G Map and Trinidad and Tobago showing only limited 5G Availability. Puerto Rico was 35% faster for download speed than Jamaica, which fared well for median download speed, coming in second on this list at 32.77 Mbps, at least 20% faster than in Q2 2021. Trinidad and Tobago (27.57 Mbps), the Dominican Republic (19.67 Mbps), and Haiti (12.83 Mbps) followed. Cuba was far behind the other countries on this list with a mobile download speed of 5.78 Mbps, at least a 162% drop from Q2 2021.

Chart of mobile speeds in Caribbean countries

Trinidad and Tobago had the fastest median mobile upload speed among the most populous Caribbean countries during Q2 2022. At 10.54 Mbps, Trinidad and Tobago’s mobile upload speed was 24% faster than that in Jamaica (8.34 Mbps) and up at least 6% over Q2 2021. Puerto Rico (7.48 Mbps) followed, then Haiti (6.94 Mbps), the Dominican Republic (6.87 Mbps), and Cuba (3.71 Mbps). Cuba’s median upload speed was down at least 117% when comparing Q2 2021 to Q2 2022.

Chart of latency in Caribbean Countries

Trinidad and Tobago had the lowest median multi-server latency on our list during Q2 2022 at 33 ms followed by the Dominican Republic (52 ms), Jamaica (60 ms), Haiti (86 ms), Puerto Rico (89 ms). At 141 ms, Cuba’s latency was the highest.

Availability shows some populations are stuck with decades-old technologies

Data from Speedtest Intelligence in Q2 2022 shows that Puerto Rico had a 5G Availability, the proportion of users with 5G-capable devices who spend the majority of their time on 5G, of 63.1%. While we also saw 5G results in the Dominican Republic, there were insufficient 5G samples in the Dominican Republic to reliably analyze.

Chart of availability in Caribbean countries

Puerto Rico had the highest 4G Availability, the proportion of users who spend the majority of their time on 4G and above, among the most populous Caribbean countries at 92.0%. Cuba followed at 77.0%, then the Dominican Republic (76.2%), Jamaica (71.2%), Haiti (69.2%), and Trinidad and Tobago (68.1%).

Unfortunately, the other countries show a large number of users who are still relying on legacy mobile technologies. 3G and 2G are only sufficient for basic uses including: voice and texting, social media, and navigation apps. Users who want rich media experiences or video calling need access to 4G or higher.

2G and 3G Availability, the proportion of users who spend the majority of their time on 2G and 3G, was higher in Haiti (29.1%) and Trinidad and Tobago (30.4%) during Q2 2022 with no statistical difference between the two. Jamaica closely followed at 26.7%, then Cuba (20.2%), the Dominican Republic (19.6%), and Puerto Rico (5.7%) where both Liberty Mobile and T-Mobile have both recently sunsetted their 3G networks. Affordability of new handsets and more expensive subscription tiers could play a role in slow upgrades.

The Caribbean is certainly an exciting and growing telecom market. We’ll be interested to see what new initiatives come out of CANTO and how they help consumers in the region get closer to a digital future. Please stop by Booth 22 at CANTO to visit with us and discuss local provider performance and more.

Ookla retains ownership of this article including all of the intellectual property rights, data, content graphs and analysis. This article may not be quoted, reproduced, distributed or published for any commercial purpose without prior consent. Members of the press and others using the findings in this article for non-commercial purposes are welcome to publicly share and link to report information with attribution to Ookla.

| December 12, 2017

The World’s Internet Speeds Increased More than 30% in 2017. Are You Keeping Up?

In a world where business and life are increasingly fast and global, you want to know if your country’s internet is up to speed. In August, we launched Speedtest Global IndexTM to provide you that objective look at internet performance around the world. Knowing what your speeds are and how they compare to your neighbors’ makes for a good story, but what was missing was a benchmark. To provide you that worldwide context, we’re introducing Global Speed, the average internet speed of the world, to the top of the Speedtest Global Index.

You can still use the Speedtest Global Index to see download and upload speeds by country and rank who’s fastest and slowest. Here we’ve paired data about those individual country speeds over the past year with the new global averages call out which countries have improved most over the past year, who’s shown the least improvement and what speeds are like in the world’s most populous countries. Read on to see who’s winning the internet speed race and who has a lot of catching up to do.

The comparisons here are based on Speedtest data from November 2016-November 2017. We used the same monthly threshold for this article that we do for inclusion in the Speedtest Global Index: to be ranked in each category, countries must have at least 670 Speedtest results from unique users on mobile and at least 3,333 for fixed broadband. Although we use the word “country” throughout, you will notice some regions like Hong Kong and Puerto Rico that are large or autonomous enough to call out as separate entities, even though they are not separate countries. Global speeds are a weighted average of all samples from around the world.

Global download speeds are up more than 30% across the board

With a mean global speed of 20.28 Mbps, mobile downloads increased 30.1% over the last 12 months and mobile uploads increased 38.9%. A global average of 40.11 Mbps makes fixed broadband downloads 97.8% faster than mobile and this speed increased 31.6% during the same period. Uploads over fixed broadband showed the smallest increase of 25.9%.

Global Internet Speeds
November 2016 – November 2017
Download: November 2017 Average (Mbps) Download: Year Over Year Increase Upload: November 2017 Average (Mbps) Upload: Year Over Year Increase
Mobile 20.28 30.1% 8.65 38.9%
Fixed 40.11 31.6% 19.96 25.9%

In November 2017, 119 countries boasted a faster mobile download speed than the global average while 134 were slower. On the fixed broadband side, 71 countries and regions beat the global average download speed and 185 were slower. As we reported last week, gigabit Speedtest results are rolling in from across the planet, but their distribution across continents is wildly uneven.

Most improved countries

It was a good year for Laotian mobile speeds. With a 249.5% jump in mobile download speeds, Laos showed the largest improvement in the world. Vietnam came in second with an increase of 188.7% and Trinidad and Tobago was third at 133.1%. All of the countries listed on the table below are to be commended for making mobile internet faster.

Countries with the Largest Improvement
Mobile Download Speed

November 2016 – November 2017
Year Over Year Increase November 2017 Speed (Mbps)
Laos 249.5% 13.77
Vietnam 188.7% 19.54
Trinidad and Tobago 133.1% 11.68
Hong Kong (SAR) 102.6% 35.64
Lebanon 92.3% 24.50
Cyprus 90.2% 26.14
Republic of the Union of Myanmar 81.0% 11.72
Costa Rica 80.9% 7.89
Cambodia 70.5% 14.97
Sudan 68.9% 9.85

The tiny island of Reunion, a region of France off the coast of Africa, saw the largest improvement in download speed over fixed broadband in the world with a gain of 141.5%. Guatemala was second at 116.7% and Ghana third at 82.1%.

Countries with the Largest Improvement
Fixed Broadband Download Speed

November 2016 – November 2017
Year Over Year Increase November 2017 Speed (Mbps)
Reunion 141.5% 62.64
Guatemala 116.7% 12.04
Ghana 82.1% 18.96
Peru 80.1% 16.48
India 76.9% 18.82
Panama 76.6% 28.62
Italy 72.1% 31.58
Libya 67.6% 3.84
Argentina 62.2% 15.49
Kenya 60.9% 15.59

In some countries, notably Libya, a small gain in megabits per second (Mbps) can result in a large percentage increase. Although the actual performance improvement is small, we’re glad to see speeds moving in the right direction.

Speeds in some countries declined

On the flip side, there were far too many countries and regions where internet speeds decreased. The devastation of Puerto Rico’s mobile infrastructure by Hurricane Maria surely contributed to the island’s 39.8% drop in mobile download speed during the past twelve months. Uzbekistan saw a decline of 31.8% and Côte d’Ivoire 26.1%.

Countries with the Smallest Improvement
Mobile Download Speed

November 2016 – November 2017
Year Over Year Change November 2017 Speed (Mbps)
Puerto Rico -39.8% 8.53
Uzbekistan -31.8% 6.47
Côte d’Ivoire -26.1% 10.95
Brunei -23.4% 9.83
Thailand -19.7% 13.38
Iraq -16.8% 3.12
Algeria -10.8% 7.19
Nigeria -8.4% 9.90
Bangladesh -7.4% 4.97
Morocco -6.3% 15.03

Algeria saw the largest decrease in download speed over fixed broadband speed in the world at 23.9%. Dips of 9.1% in Ecuador and 6.5% in Latvia were less troubling but still moving in the wrong direction.

Countries with the Smallest Improvement
Fixed Broadband Download Speed

November 2016 – November 2017
Year Over Year Change November 2017 Speed (Mbps)
Algeria -23.9% 3.76
Ecuador -9.1% 10.40
Latvia -6.5% 47.25
Tunisia -3.2% 6.90
Iraq -1.1% 7.87
Syria -0.3% 7.12
Taiwan 0.5% 42.32
Maldives 1.0% 12.04
Namibia 1.2% 9.74
Jamaica 1.5% 19.11

Performance in the world’s most populous countries

With 57% of the world’s population, any internet performance improvements seen in the world’s ten most populous countries have a wide reach. Pakistan came out on top of the world’s largest countries with a 56.2% jump in mobile download speed during the past 12 months. India came in second in this category at 42.4% and Brazil third at 27.6% .

World’s Most Populous Countries
Improvement in Mobile Downloads

November 2016 – November 2017
Year Over Year Change November 2017 Speed (Mbps)
Pakistan 56.2% 13.08
India 42.4% 8.80
Brazil 27.6% 16.25
Japan 23.5% 21.67
United States 22.0% 26.32
Russia 19.2% 15.80
Indonesia 18.1% 9.73
China 3.3% 31.22
Bangladesh -7.4% 4.97
Nigeria -8.4% 9.90

At the other end of the spectrum, Nigeria’s mobile download speed actually dropped 8.4% and Bangladesh’s dipped 7.4%. China showed only a modest 3.3% increase in mobile download speed in 2017.

On the fixed broadband side, India came out on top of the world’s most populous countries for improvements to download speed during the past 12 months with an increase of 76.9%, beating China’s second place 42.3% increase and a 37.3% gain in the U.S.

World’s Most Populous Countries
Improvement in Fixed Broadband Downloads

November 2016 – November 2017
Year Over Year Change November 2017 Speed (Mbps)
India 76.9% 18.82
China 42.3% 61.24
United States 37.3% 75.94
Japan 20.7% 73.51
Indonesia 18.9% 13.38
Brazil 18.5% 17.80
Pakistan 15.5% 6.13
Russia 14.6% 36.90
Bangladesh 13.7% 16.14
Nigeria 3.8% 9.53

Nigeria again came out at the bottom of the world’s largest countries, this time with a 3.8% increase in download speed over fixed broadband.

We’ll revisit global internet speeds periodically here on our blog, but you can keep up to date on the latest trends in worldwide internet speeds by visiting the Speedtest Global Index. It’s updated every month with individual country data and, now, global averages. Keep track of your country’s performance and see how you rank against the world.

Ookla retains ownership of this article including all of the intellectual property rights, data, content graphs and analysis. This article may not be quoted, reproduced, distributed or published for any commercial purpose without prior consent. Members of the press and others using the findings in this article for non-commercial purposes are welcome to publicly share and link to report information with attribution to Ookla.

| January 15, 2020

Power is Key to Mobile Network Recovery After Earthquakes in Puerto Rico

Mobile connectivity is crucial in the wake of a natural disaster as consumers seek to connect with loved ones and vital services. This is made all the more difficult by the fact that natural disasters can also wreak havoc on the infrastructure that supports that connectivity, including electrical power. In order to support recovery efforts, we used Speedtest® data from before and after the major recent earthquakes in Puerto Rico to see how mobile users were affected and where network connectivity currently stands.

While it was reported that power plants automatically shut off for safety following the quake on Monday, January 6 at 6:32 a.m. local time, we do not see the same effect to mobile networks during that time as we did when power plants were then reportedly damaged in the Tuesday, January 7 quake that struck at 4:24 a.m. local time. Not all power plants were yet fully online by the time of the quake on Saturday, January 11 at 8:54 a.m. Electricity is essential to power cellular networks and not all cell sites have on-site power generators. We explore the various impacts of these power outages below.

Signal measurements and test volumes dropped after Tuesday’s quake

An hourly timelapse from the time before the first major earthquake on Monday, January 6, through the second (Tuesday, January 7) and third (Saturday, January 11) show the number of passive signal measurements from Android devices on the island of Puerto Rico.

Coverage scans timelapse

We see a similar pattern of scans throughout the period, but the volume of samples declines following each of the three quakes.

PR-Embedded-Volumes-Devices-Tests-4

Embedded tests also dropped off after the Tuesday, January 7 earthquake. These come from devices (including: routers, gateways, modems, test and measurement devices and IoT Devices) that use Speedtest PoweredTM to monitor connectivity by running a Speedtest, usually on a regular schedule. Except when the power is out.

No service status jumped after Tuesday’s quake

PR-No-Service-Scans-Devices

The proportion of scans and devices with no service in Puerto Rico show a large jump after the earthquake on Tuesday, January 7 compared with the time period following the Monday, January 6 quake. This shows that the real impact to mobile networks was a result of the quake on Tuesday, January 7, likely because of power outages, and that networks were slowly recovering in the days after.

It looks as though scans and devices with no service were trending upward following the quake on Saturday, January 11 as well, though full data was still trickling in as this article was being written.

Battery level fell when devices were disconnected from power

For signal to matter, a device needs to have battery or the ability to charge. We used Speedtest data to analyze the proportion of devices that were connected to power during a coverage scan during the month of January.
Proportion-of-Devices-Connected-Puerto-Rico_0120-4
Before and after the earthquake on Monday, January 6, we see a fairly consistent daily pattern where between 30% and 85% of devices are connected to power during a scan. Immediately following the quake on Tuesday, January 7, there is a sharp drop in devices connected to power. The pattern had still not fully recovered when the third major quake hit on the morning of Saturday, January 11. There also appeared to be a longer than average dip in devices connected to power immediately following Saturday’s quake, but the pattern looks to be normalizing in the days since.

The disruption in devices connected to power after the January 7 quake then affected average battery life of unplugged devices. This drop in average battery level reflects devices that had been charging when the power went out. We can also see that the average battery level didn’t return to a normal cycle until Friday, January 10.

Average-Battery-Level-of-Devices-Puerto-Rico_0120-2

While these battery observations may appear straight-forward, they are important to highlight because they illuminate the cascading connectivity challenges that communities face in times of crisis.

Natural disasters can happen anywhere. In places like Puerto Rico, where the power grid is still suffering from the effects of Hurricane Maria, the effects of additional natural disasters on critical mobile networks can be especially challenging. Full power was expected to have been restored to the island on Sunday.

At Ookla, we share data pro bono in times of need that can help assist recovery in a number of ways. If you are an operator or regulator assisting with rebuild efforts in Puerto Rico that could use Ookla data to aid your immediate efforts, please inquire for more information.

Ookla retains ownership of this article including all of the intellectual property rights, data, content graphs and analysis. This article may not be quoted, reproduced, distributed or published for any commercial purpose without prior consent. Members of the press and others using the findings in this article for non-commercial purposes are welcome to publicly share and link to report information with attribution to Ookla.