| February 22, 2023

Starlink Resurgence? Speeds Increase in Europe and Oceania

Ookla® is back with exciting, fresh data from Q3 and Q4 2022 for SpaceX’s Starlink and Sky Logic in Europe and Oceania, as well as new Starlink markets we haven’t yet featured in our ongoing series on satellite internet. With the FCC greenlighting Amazon’s Project Kuiper and many other exciting satellite developments launching this year, we’re certain all eyes will be on the sky in 2023 as new orbital connectivity options become available for consumers.

This analysis includes Starlink results from six new countries, and data for Starlink and Sky Logic in Europe and Starlink in Oceania. We also examine how Starlink’s internet performance has changed over the past year in Australia, Austria, Belgium, Croatia, France, Germany, Ireland, Italy, the Netherlands, New Zealand, Poland, Portugal, and the United Kingdom.

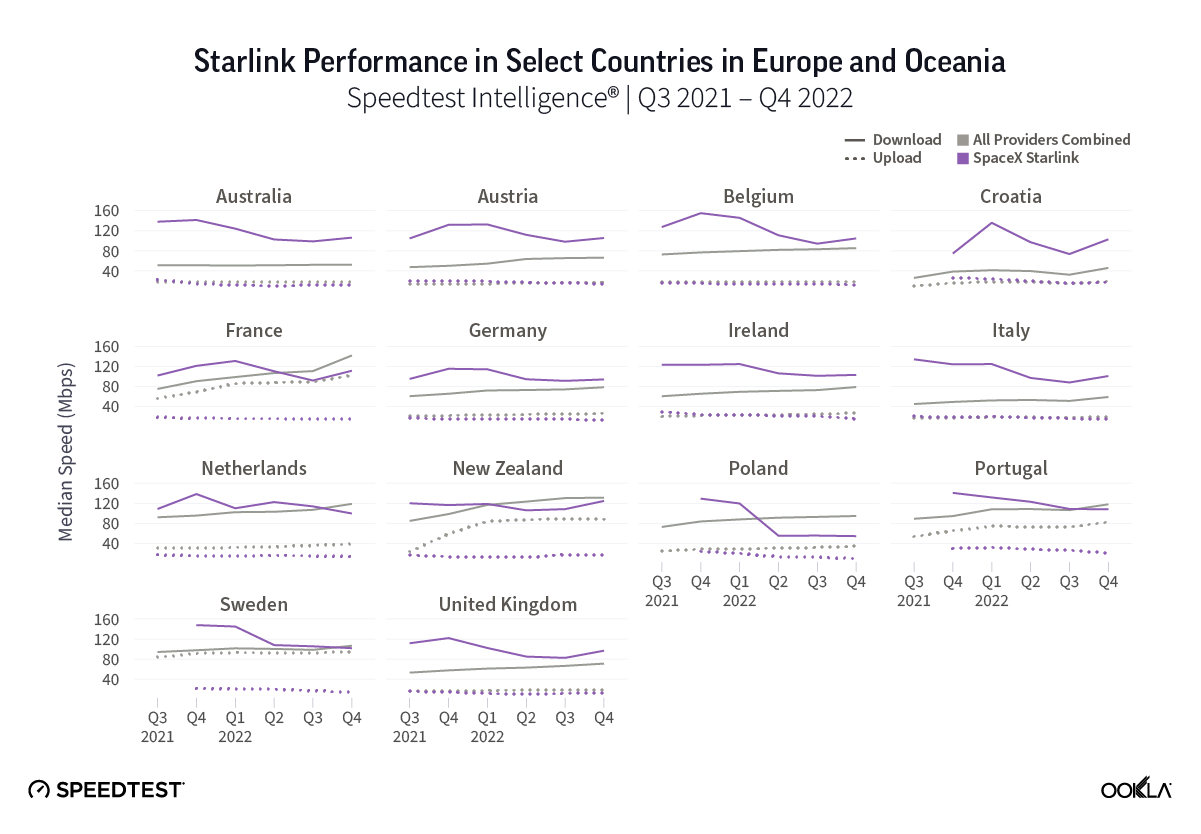
Starlink is mostly speeding up again from Q3 to Q4 2022, but is still slower than a year ago

As Starlink rides the wave of becoming an increasingly popular connectivity option for consumers, we’ve seen the service speed up and then slow down year-over-year in most markets. However, Q4 2022 data shows many countries are experiencing a modest rise in median download speeds when compared to Q3 2022. That’s encouraging for consumers, especially as Starlink hit over 1 million users in Q4 2022, and could be a sign that Starlink seems to be maturing its constellation’s capacity. That’s particularly intriguing as Starlink launches more next-gen satellites, which were first deployed at the tail end of Q4 2022 and will most likely show up in Q1 2023 results.

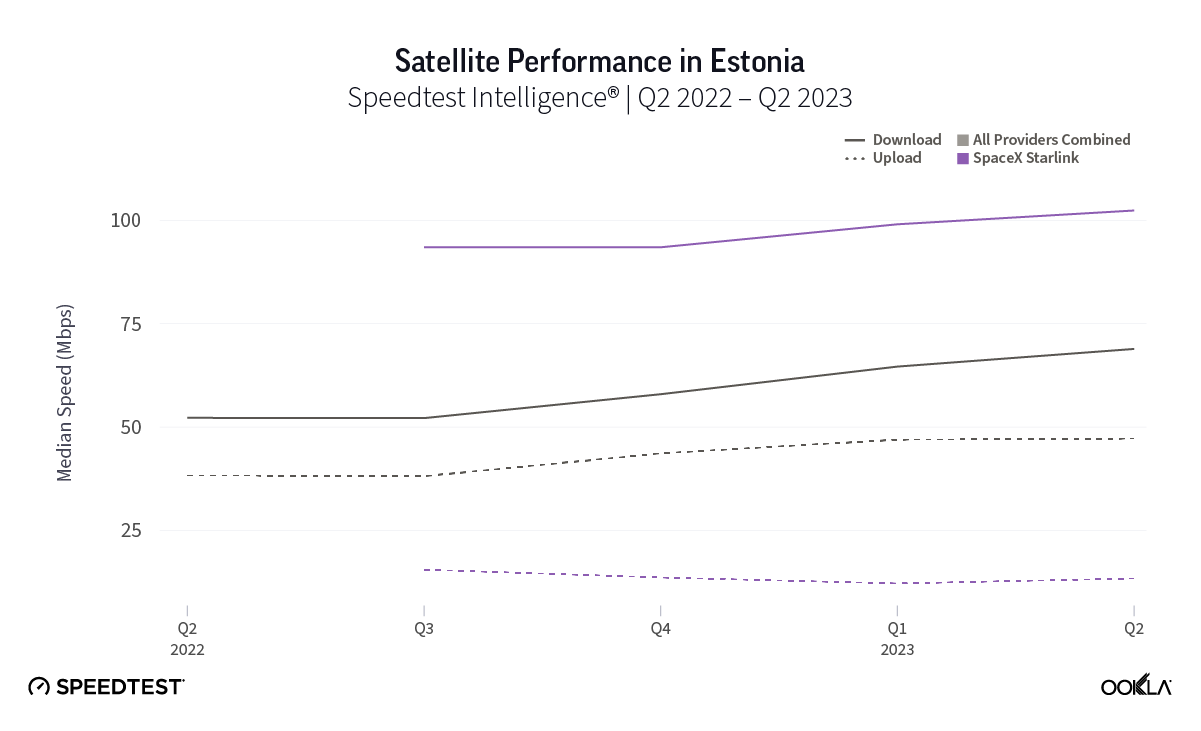
In Europe, all the countries we evaluated for year-over-year median download speeds were slower for Q4 2022 than Q4 2021 when there were fewer users on each network. Most countries showed between 10-20% slower speeds in Q4 2022 than what users experienced in Q4 2021, including Ireland (at least 11% slower), Austria (at least 13%), Portugal (at least 14%), Italy (at least 15%), Germany (at least 16%), and the U.K. (at least 19%). Users in France saw very similar speeds year over year, with just a 4% decrease from Q4 2021 to Q4 2022, while users in Poland saw a large decrease (at least 56% slower), and users in the Netherlands (at least 21%) and Belgium (at least 28%) saw substantial decrease during the same period.

In Oceania, Starlink year-over-year results were mixed, with Starlink’s download speed in Australia 24% slower in Q4 2022 than during Q4 2021, while in New Zealand it was 4% faster in Q4 2022 than Q4 2021.

Starlink in Denmark and Switzerland had the fastest satellite internet in Europe during Q4 2022

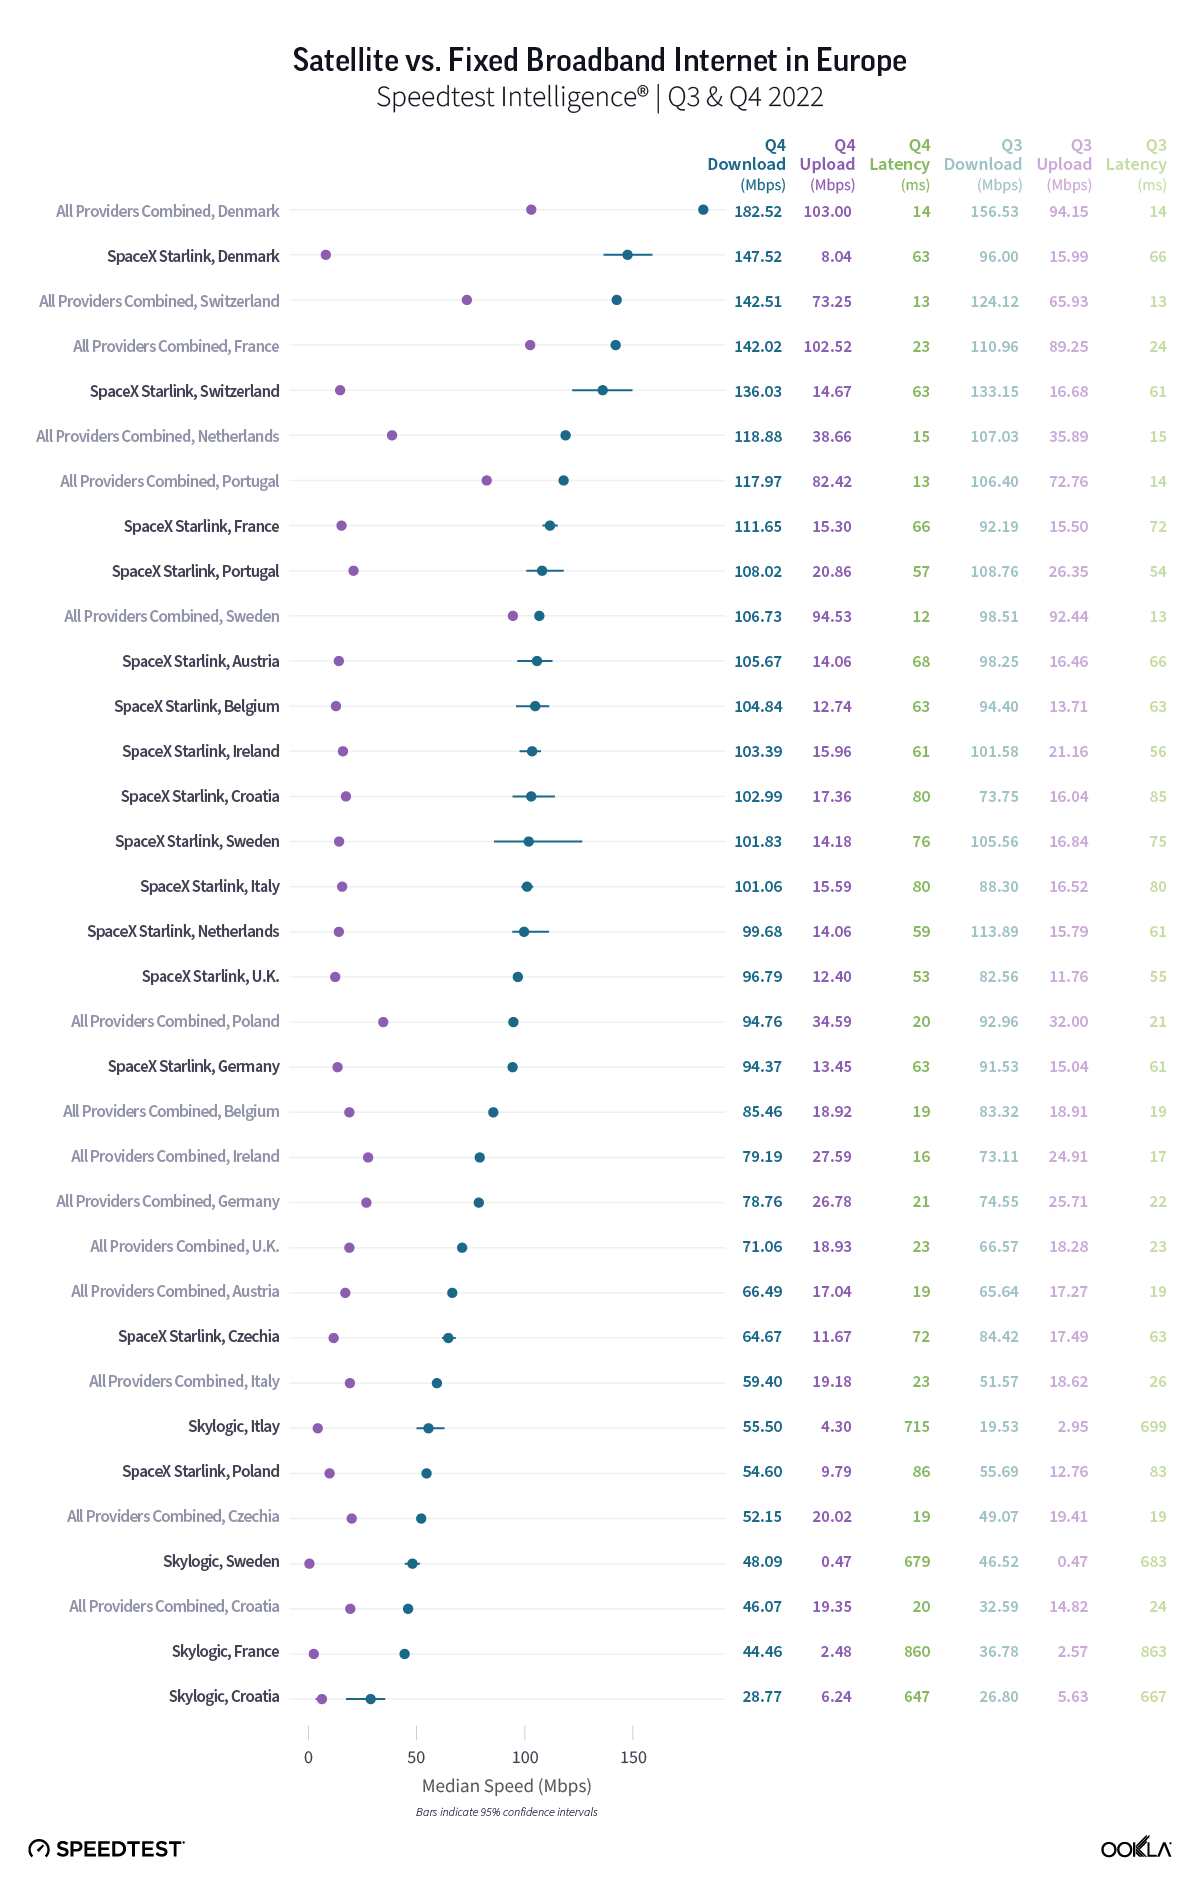
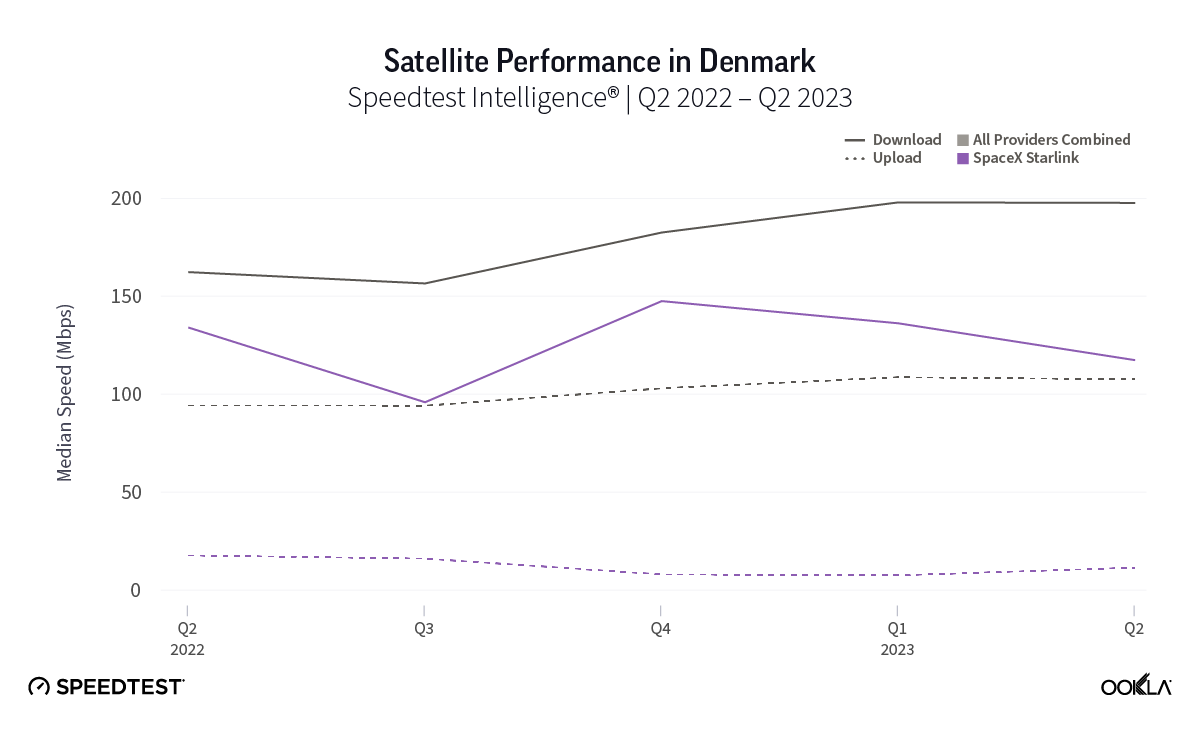
Speedtest Intelligence® reveals there was no fastest satellite provider in Europe during Q4 2022, though Starlink in Denmark (147.52 Mbps) and Switzerland (136.03 Mbps) led the pack for fastest median download speed. In all, Starlink download speeds were faster than 100 Mbps in 10 out of 15 European countries during Q4 2022 — a rise from just five out 15 in Q3 2022. 

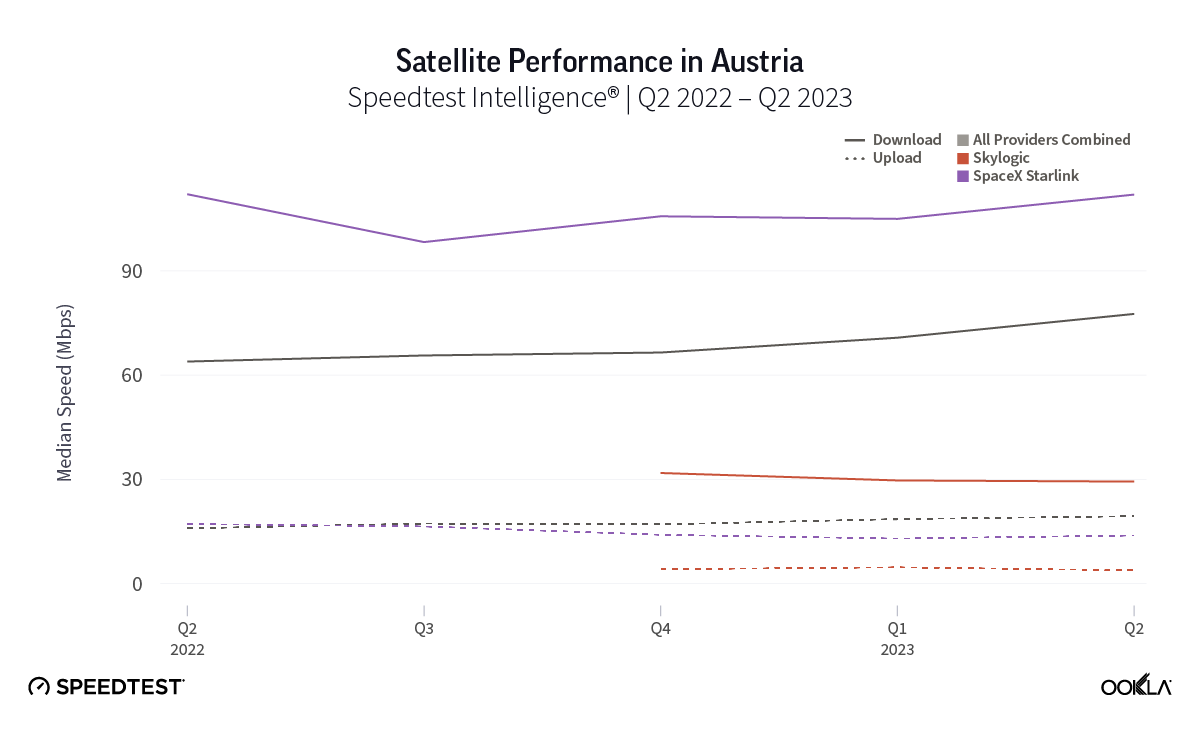
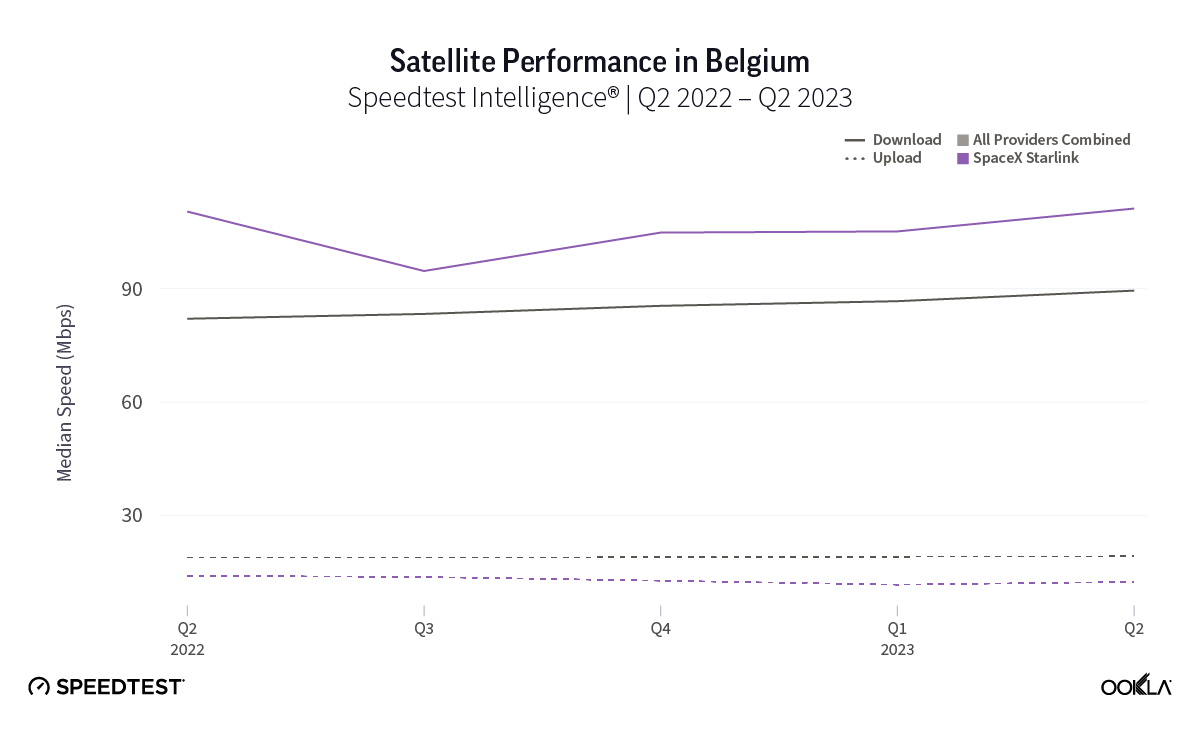
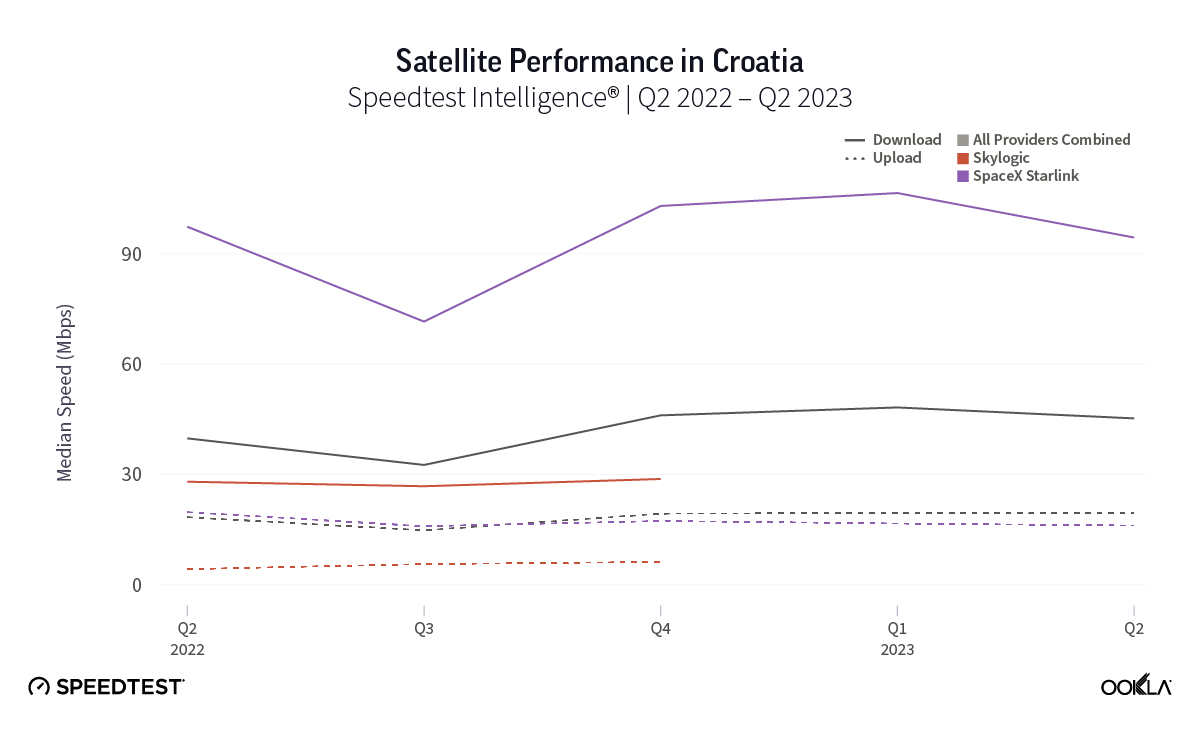
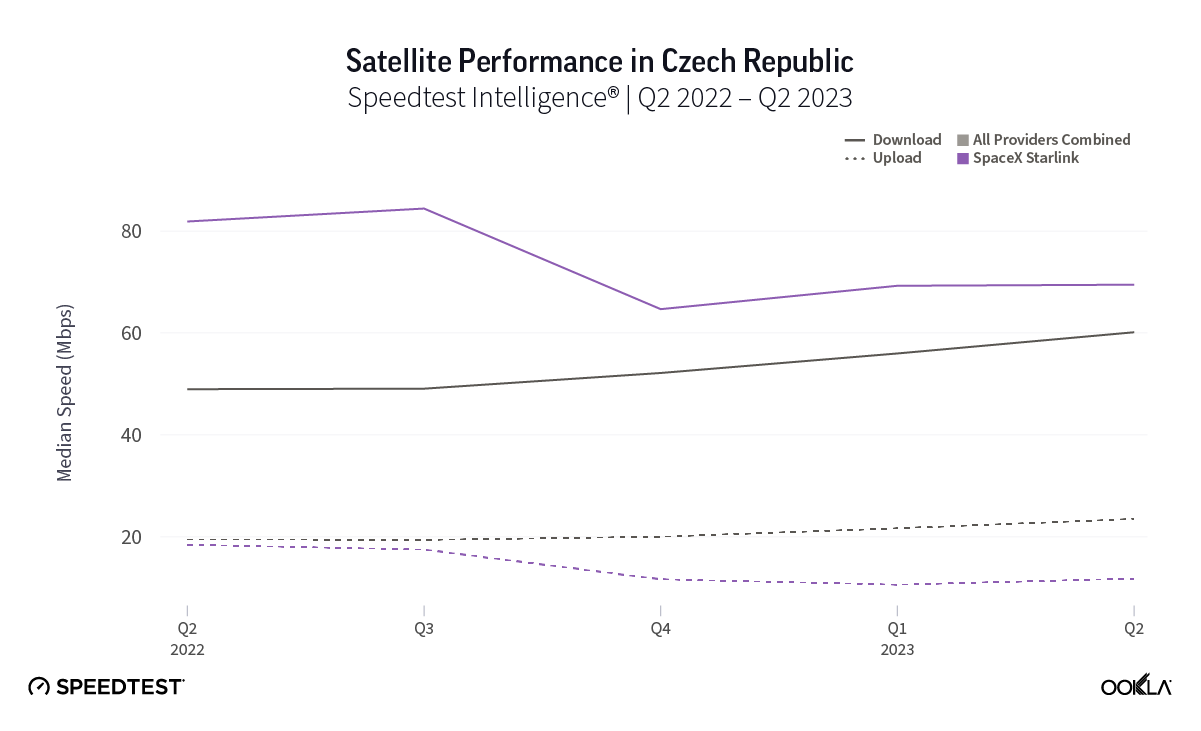
Starlink outperformed fixed broadband providers over download speed in eight countries, including: Austria (105.67 Mbps), Belgium (104.84 Mbps), Croatia (102.99 Mbps), Czechia (64.67 Mbps), Germany (94.37 Mbps), Ireland (103.39 Mbps), Italy (101.06 Mbps), and the U.K. (96.79 Mbps). Fixed broadband providers were faster than satellite providers analyzed in Denmark, France, Netherlands, and Poland. Results were too close to call in Sweden with fixed providers at 106.73 Mbps and Starlink at 101.83 Mbps, as well as Portugal with Starlink at 108.02 Mbps and fixed broadband at 117.97 Mbps. Skylogic was too close to call between the median fixed broadband speed in Italy at 55.50 Mbps to 59.40 Mbps, and had download speeds faster than 40 Mbps in France (44.46 Mbps) and Sweden (48.09 Mbps).

For upload speeds, every country’s combined fixed broadband providers had faster median upload speeds than every satellite provider, though Starlink in Portugal had the fastest upload speed among satellite providers at 20.86 Mbps. All Starlink upload speeds ranged between 10-20 Mbps except Poland (9.79 Mbps) and Denmark (8.04 Mbps). 

Multi-server latency for all satellite providers was higher than fixed broadband providers in every European country in Q4 2022, which ranged from 12.34 ms in Sweden to 23.46 ms in Italy. However, Starlink had a median multiserver latencies of less than 60 ms in the U.K. (53.24 ms), Portugal (56.81 ms), and the Netherlands (58.85 ms). Most latencies were between 60-75 ms, with Poland having the highest latency at 86.46 ms — still low enough to have a good quality of experience and be able to video chat.

Starlink in New Zealand was the fastest satellite provider in Oceania

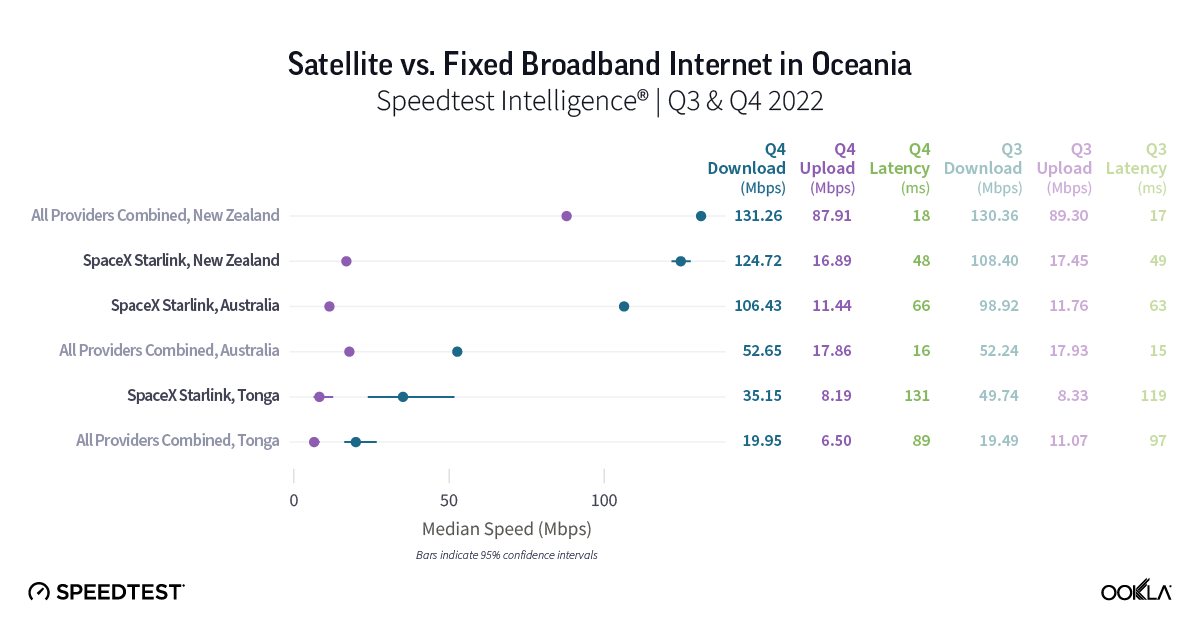
During Q4 2022, Starlink in New Zealand had the fastest median download speed among satellite providers in Oceania at 124.72 Mbps, followed by Starlink in Australia (106.43 Mbps), and Starlink in Tonga (35.15 Mbps). However, New Zealand fixed broadband outperformed Starlink, while Starlink in Australia outperformed fixed broadband providers. In Tonga, speeds were too close to call. 

Speedtest Intelligence shows Starlink falling behind fixed broadband providers for median upload speeds in New Zealand (16.89 Mbps) and Australia (11.38 Mbps), while Tonga was again too close to call.

Multi-server latency was higher over Starlink than fixed broadband in all three countries we surveyed in Oceania during Q4 2022. However, Starlink’s median latency was under 50 ms in New Zealand (48.11 ms), which is a very exciting development for consumers, especially with latency becoming an increasingly important metric. Starlink latency in Australia was higher at 65.52 ms, while Tonga followed at 88.81 ms.

New Q4 2022 Starlink countries show very promising results

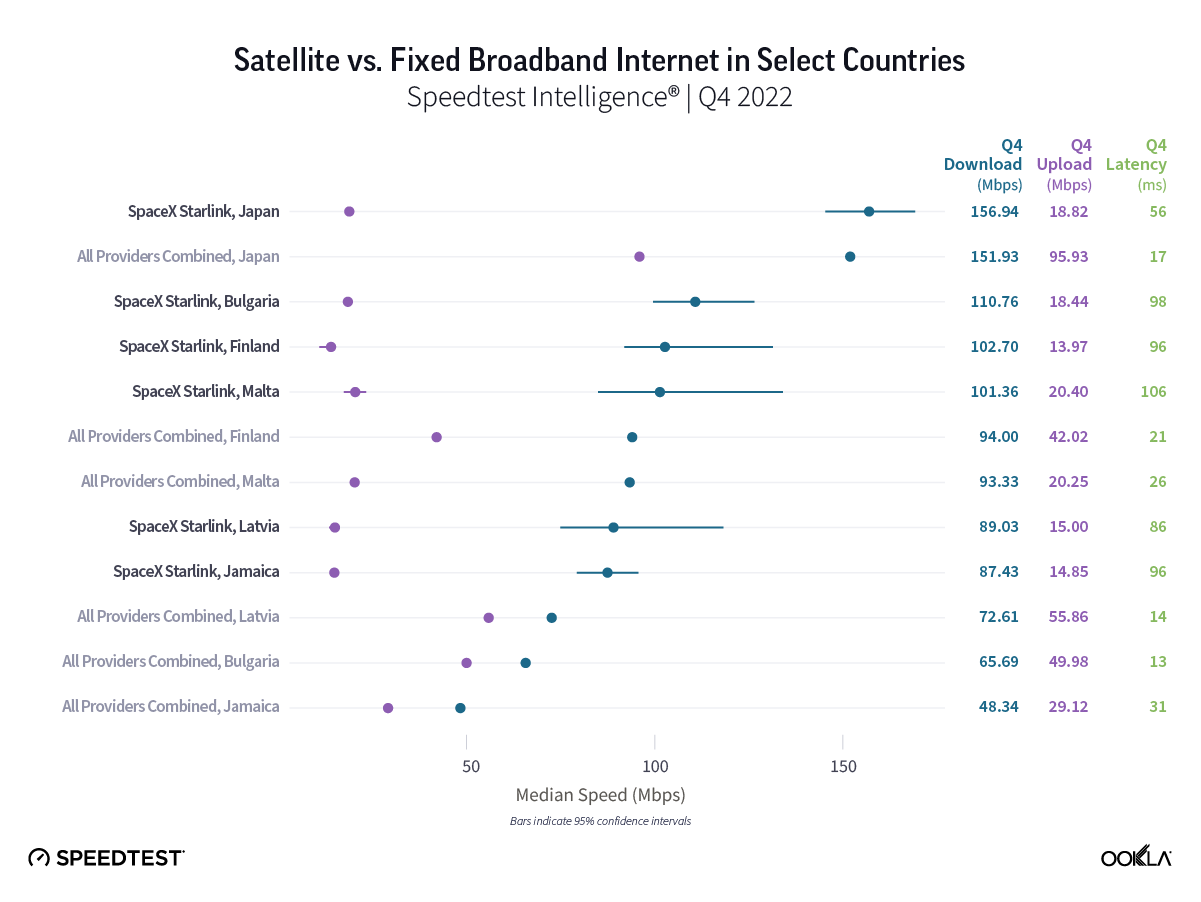
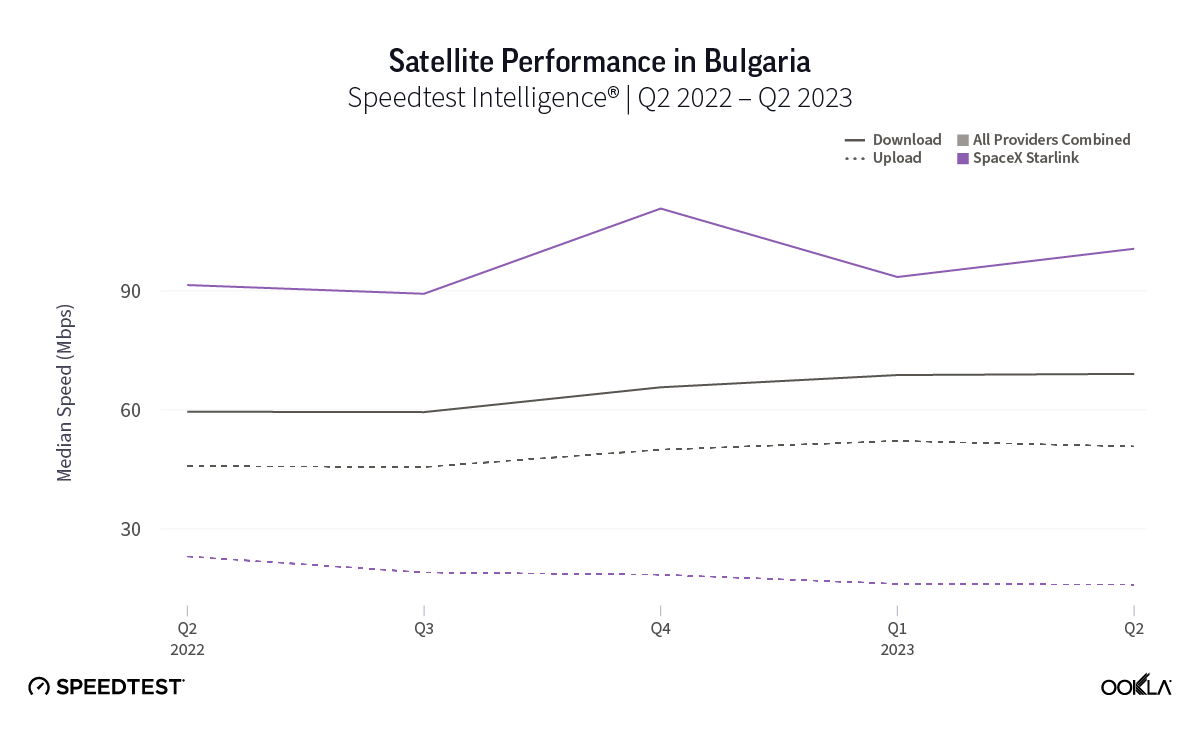
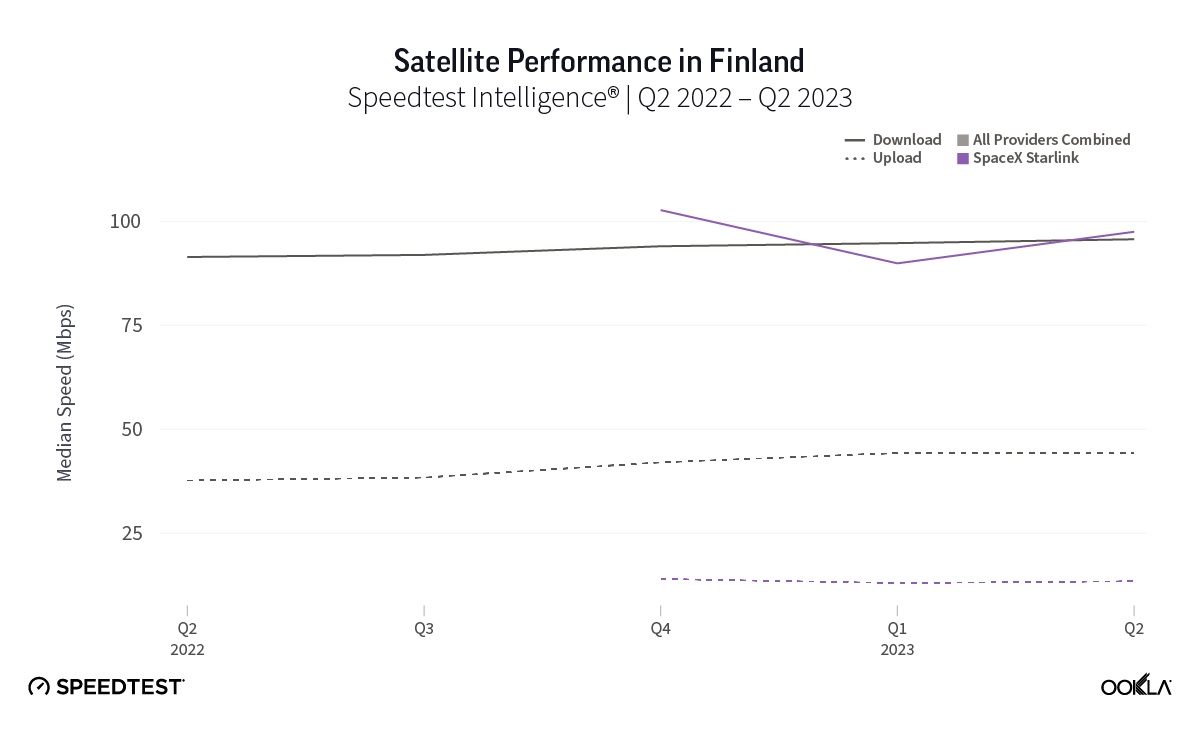
Speedtest Intelligence shows the six new countries where we found new Starlink data are off to a roaring start in Q4 2022, which include Bulgaria, Finland, Jamaica, Japan, Latvia, and Malta. Starlink had faster median download speeds than the country’s respective fixed broadband providers combined in two countries: Bulgaria (110.76 Mbps versus 65.69 Mbps), and Jamaica (87.43 Mbps vs. 48.34 Mbps), while results were too close to call in the remaining four markets. However, Starlink showed promising 100+ Mbps speeds in Japan (156.94 Mbps), Finland (102.70 Mbps), and Malta (101.36 Mbps). 

Median upload speeds for Starlink lagged behind fixed broadband providers in all markets, though Malta was too close to call (20.40 Mbps for Starlink and 20.25 Mbps for fixed broadband). Starlink upload speeds ranged from about 14 Mbps to 20 Mbps in every market.

Consumers and enterprises stand to benefit from satellite developments in 2023

Starlink dominated headlines in 2022 — and for good reason. They’ve gained over 1 million users worldwide, will be available in connected vehicles, planes, RVs, and ships, partnered with T-Mobile to bring Starlink to mobile devices, and launched their second-gen satellites at the end of 2022. But that could very seriously change in 2023 with multiple competitors deploying major offensives in the satellite market. We’ll say it again: there is a new space race for connectivity being waged, and we’re just at the tip of what’s to come.

Here are some major updates about what’s next for various different satellite competitors:

Amazon’s Project Kuiper approved by the FCC

The biggest news concerning satellite connectivity is the FCC approving Amazon’s Project Kuiper constellation, which will include 3,236 satellites in an LEO array. On two fronts, this poses two potential challenges for Starlink: on one hand, Amazon has the global reach, scale, and consumer base that being one of the largest companies in the world provides. On the other, Blue Origin is a direct competitor of SpaceX, and won’t have to rely on the service or other vendors to launch their array into space. Amazon is in a good position to compete and Project Kuiper could become a major player if their prototypes, which will be launched in early 2023, reach speeds anywhere close to competing with broadband internet. 

Viasat set to launch Viasat-3 arrays around April 8, 2023

Long-term incumbent satellite internet provider, Viasat, has a big year ahead after years of planning and providing connectivity to remote locations around the world. Viasat is finally set to launch its Viasat-3 array, which aims to provide 1 Terabit per second (Tbps) of network capacity on each satellite, allowing its users to experience 100+ Mbps connections; that’s a huge improvement for the mainly GEO provider. While consumers likely won’t see these results until Q4 2023, we’re very excited to see how Viasat improves its network.

Eutelsat’s merger with OneWeb approved by Eutelsat board, second-gen array being planned

One of the biggest mergers in recent years among satellite providers has jumped a major hurdle and was approved by the Eutelsat board. While the combined entities still have to be approved by shareholders and regulators, this merger could expand both companies’ market share, particularly in India, which has fast become an important satellite market. Furthermore, OneWeb is already planning a second-gen satellite, which they’re aiming to launch in 2025.

European Commission forges ahead on Constellation Iris

The European Union has been working to create its own satellite constellation since 2020, and during November 2022, agreed to a plan to commit €2.4 billion for a third satellite array named Iris, in addition to Galileo and Copernicus. The project, which includes GEO, MEO, and LEO arrays, will help support EU connectivity priorities including the economy, environment, security, and defense, and is hoping to launch in 2024, and be fully operational by 2027.

HughesNet aiming to launch Jupiter 3 array in H1 2023

Incumbent satellite internet provider HughesNet is planning to launch its new Jupiter 3 array in the first half of 2023, which will help expand its network capacity, “doubling the size of the Hughes JUPITER fleet over North and South America.” While the Jupiter 3 array will still be a GEO constellation, the added network capacity will alleviate congested networks and give consumers more bandwidth to use the internet.

Ookla will continue monitoring new satellite internet developments

As 2023 continues to shape up as a pivotal year for satellite internet providers, we’ll be watching the sky to make sure providers are providing the connectivity consumers need. We’ll continue our series next quarter with Q4 2022 and Q1 2023 data from North and South America and any new countries where Starlink launches, and be back with Europe and Oceania data in Q3 2023. In the meantime, be sure to download the Speedtest® app for Windows and Mac computers or for iOS or Android for devices and see how your satellite internet stacks up to our findings.

Ookla retains ownership of this article including all of the intellectual property rights, data, content graphs and analysis. This article may not be quoted, reproduced, distributed or published for any commercial purpose without prior consent. Members of the press and others using the findings in this article for non-commercial purposes are welcome to publicly share and link to report information with attribution to Ookla.

| September 20, 2022

Starlink Slowed in Q2, Competitors Mounting Challenges

Ookla® has covered SpaceX’s Starlink satellite internet for over a year now with our ongoing series on satellite internet performance. We’ve seen Starlink launch in new locations across the world, and while some speeds have shown signs of slowing down from their initial launches, the newly announced T-Mobile partnership with Starlink could extend the benefit of satellite connections to the mobile market.

Today, we have fresh data on satellite performance during Q2 2022 in Europe, Oceania, North America, and South America. This analysis includes results from eight additional countries, two new providers, and expanded data for Starlink, HughesNet, and Viasat. We also examine how Starlink’s internet performance has changed over the past year in Canada, France, Germany, New Zealand, the United Kingdom, and the United States.

Starlink speeds decreased in every country we surveyed over the past year as more users sign up for service

Chart of Starlink performances in select countries

Speedtest Intelligence® reveals that median download speeds for Starlink fell across Canada, France, Germany, New Zealand, the U.K, and the U.S., dropping between 9% and 54% from Q2 2021 to Q2 2022 as more users signed up for the service. However, Starlink still reached a median download speed of at least 60 Mbps in North America during Q2 2022, which is more than enough for at least one connected device to do most everything on the internet including streaming video, downloading games, and chatting on video with friends and family.

Upload speeds also slowed on Starlink, with speeds decreasing across all of the countries we’ve tracked over the past year. Latency fared a little better with latency remaining relatively flat (though high when compared to fixed broadband) in most countries. New Zealand was the outlier, with latency dropping 23 ms. For most users, we still suspect these dips are still worthwhile for areas that have no service, slow service, or few affordable options for fast internet.

Starlink in Puerto Rico was the fastest satellite provider in North America

Chart of Satellite performance versus fixed broadband internet in North America

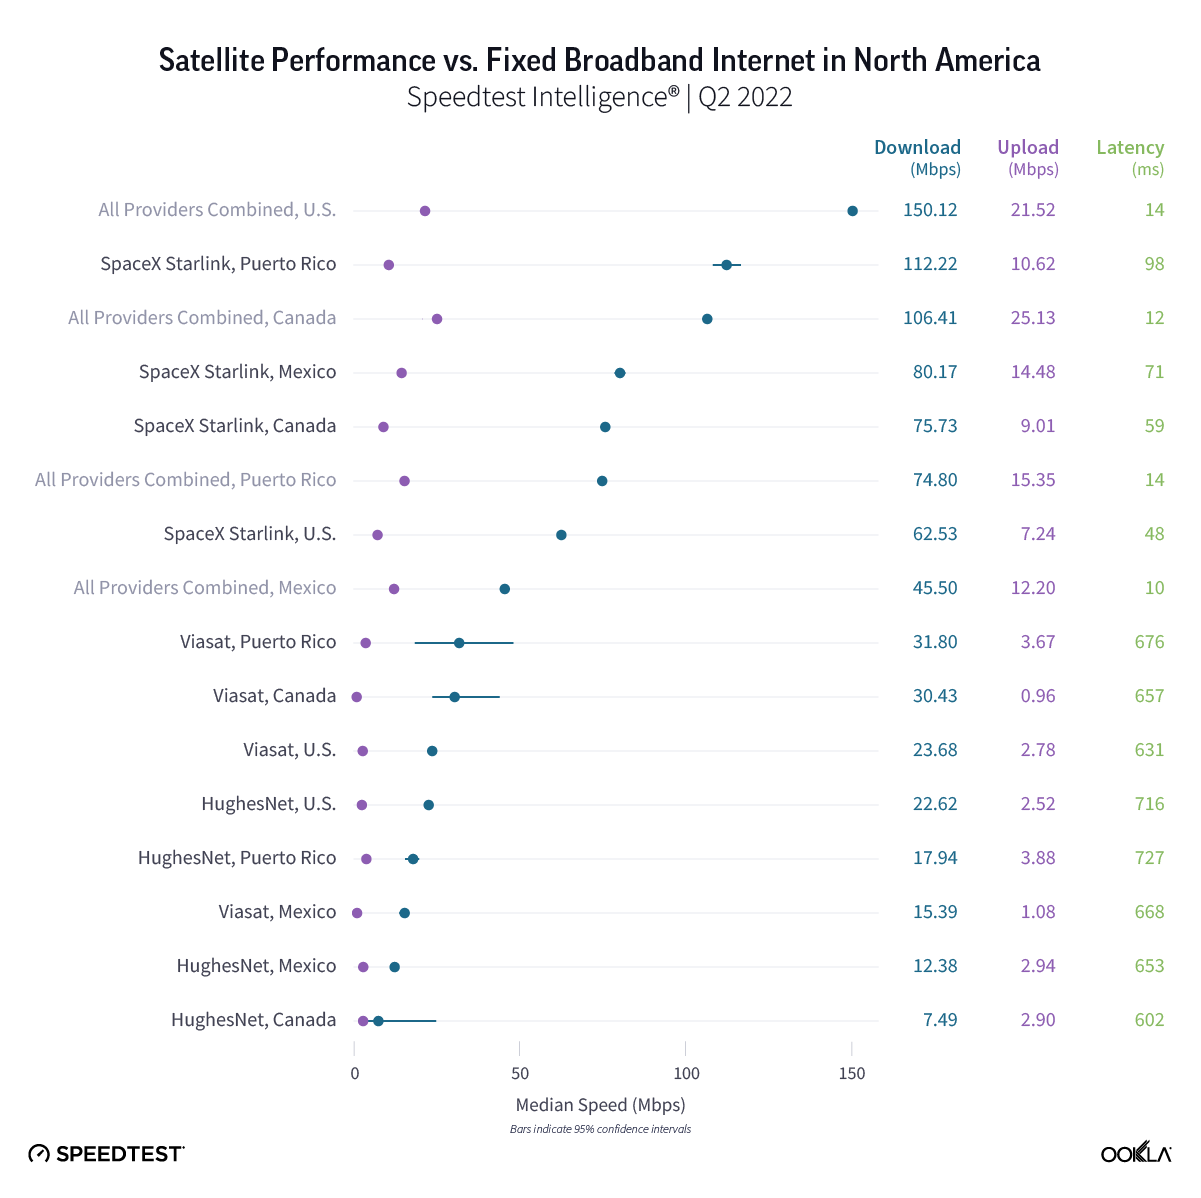
Starlink in Puerto Rico had the fastest satellite internet in North America during Q2 2022 with a median download speed of 112.22 Mbps, followed by Starlink in Mexico (80.17 Mbps), Canada (75.73 Mbps), and the U.S. (62.53 Mbps). Starlink in Puerto Rico and Mexico was faster than their countries’ fixed broadband providers combined (74.80 Mbps and 45.50 Mbps, respectively), while fixed broadband in the U.S. (150.12 Mbps) and Canada (106.41 Mbps) was faster than each country’s satellite providers.

In every country except Mexico, fixed broadband upload speeds were faster than satellite speeds. Starlink in Mexico edged out fixed broadband providers 14.48 Mbps to 12.20 Mbps. Latency was higher for every satellite provider compared to fixed broadband. Starlink in the U.S. had the lowest median latency among satellite providers at 48 ms.

Starlink outperformed fixed broadband average in 16 European countries

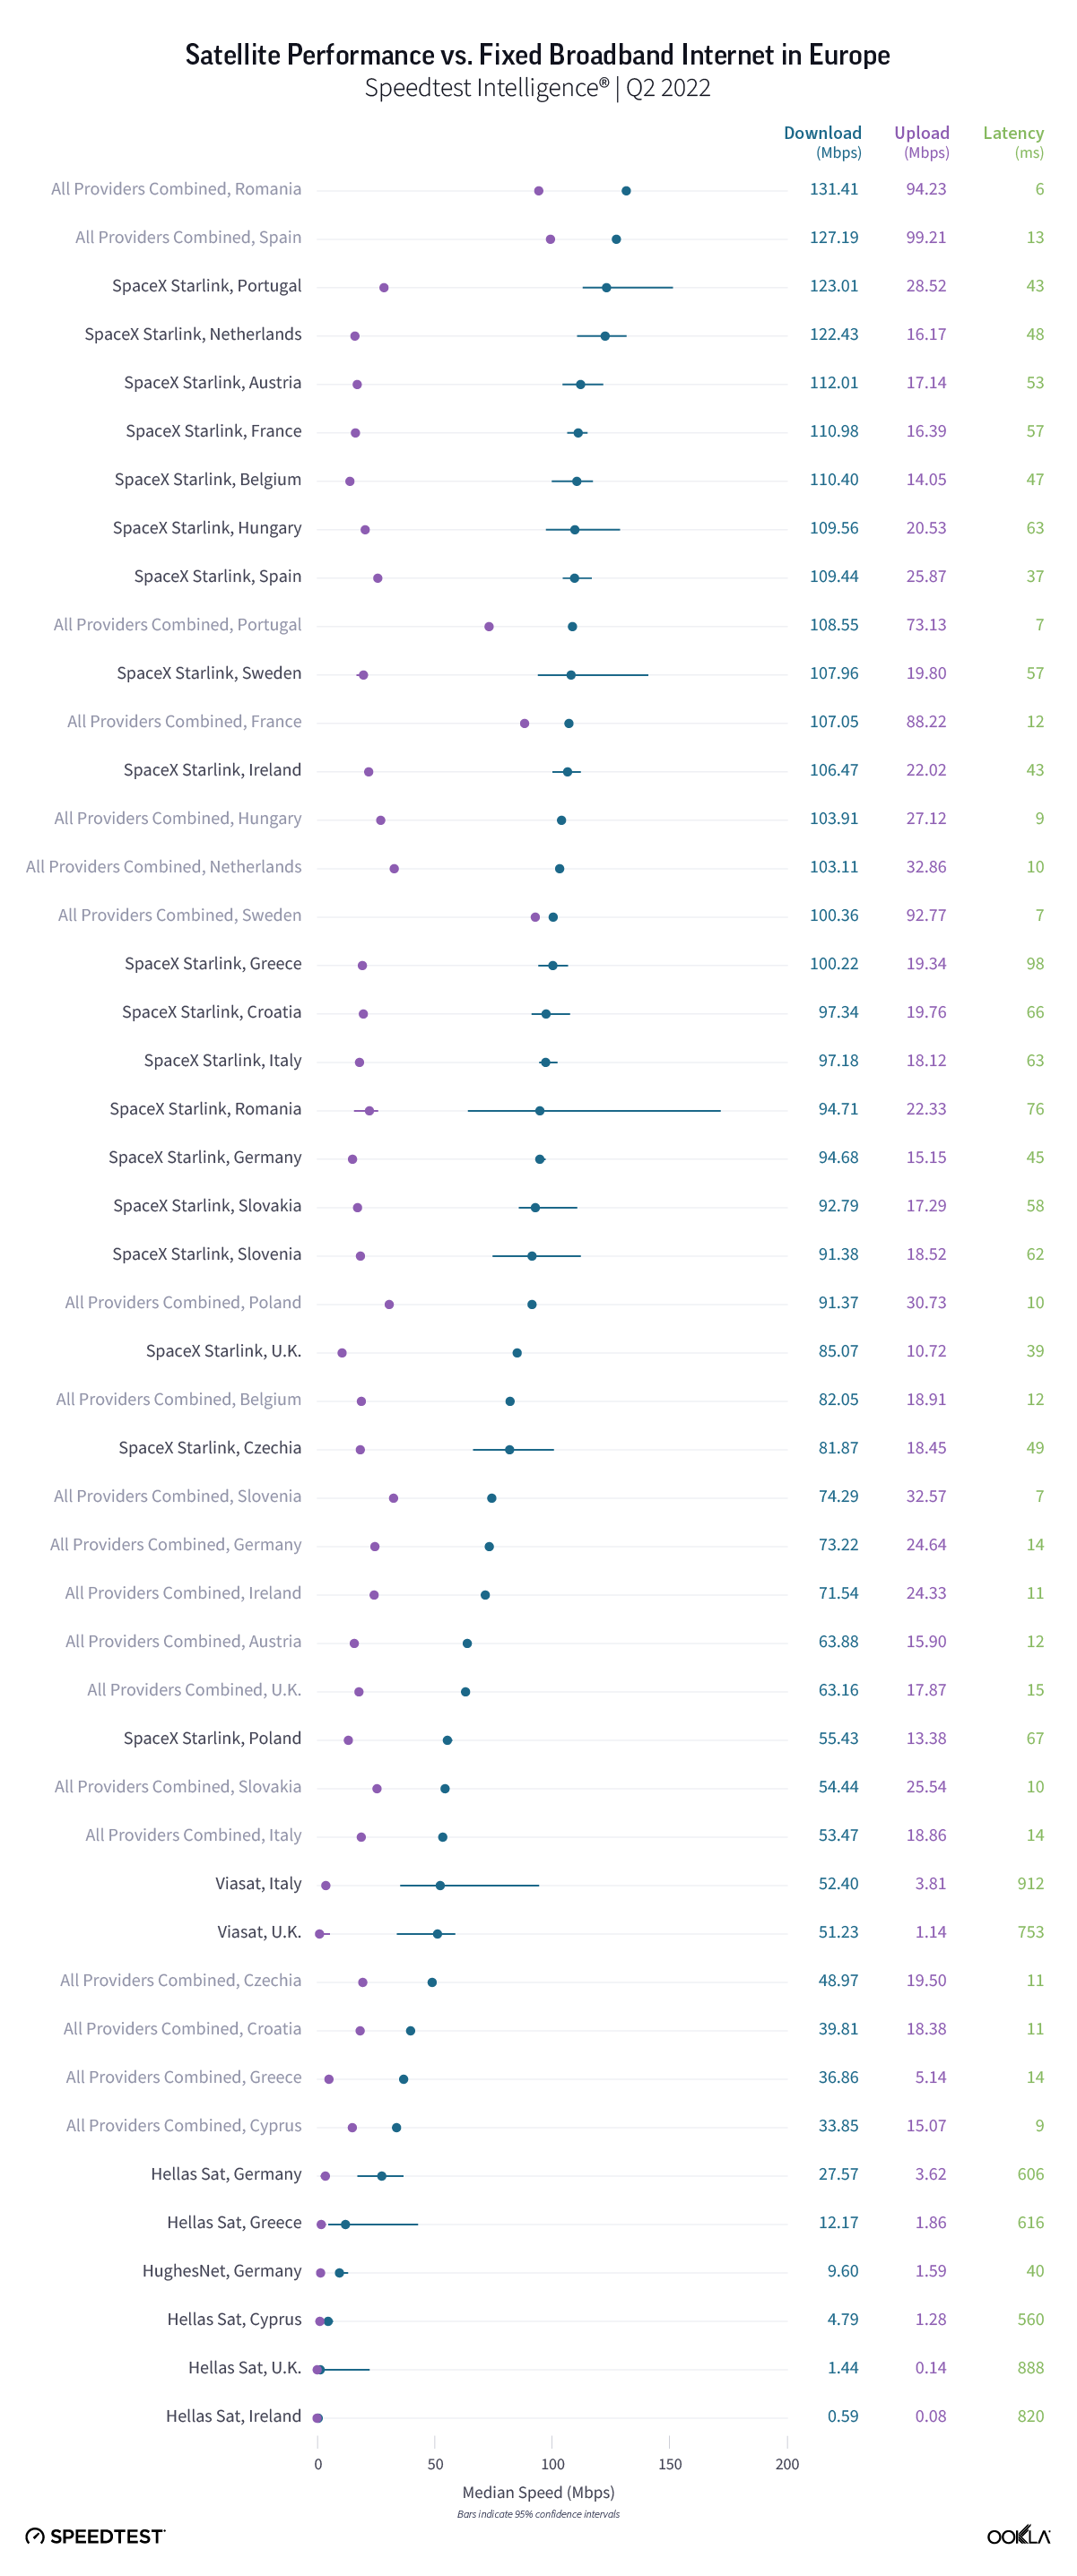
Chart of Satellite performance versus fixed broadband internet in Europe

Speedtest Intelligence shows Starlink was fast in Europe during Q2 2022, outperforming fixed broadband median download speed in 16 countries and reached download speeds over 100 Mbps in 10 countries. In contrast, fixed broadband only achieved median download speeds over 100 Mbps in six countries: Romania, Spain, Portugal, France, Hungary, and the Netherlands during Q2 2022. Starlink was fastest for median download speed in Portugal at 123.01 Mbps, the Netherlands (122.43 Mbps), Austria (112.01 Mbps), France (110.98 Mbps), and Belgium (110.40 Mbps). Romania and Spain were the only countries to have fixed broadband beat Starlink for fastest median download speed, achieving 131.41 Mbps and 127.19 Mbps, respectively.

For upload, Starlink in Greece and Austria was the only satellite provider to achieve faster upload speeds than all fixed broadband providers combined at 19.34 Mbps to 5.14 Mbps, and to 17.14 Mbps to 15.90 Mbps, respectively. Fixed broadband providers in Spain (99.21 Mbps), Romania (94.23 Mbps), Sweden (92.77 Mbps), France (88.22 Mbps), Lithuania (83.54 Mbps), and Portugal (73.13 Mbps) all recorded median upload speeds greater than 70 Mbps, with the closest satellite provider being Starlink in Portugal at 28.52 Mbps.

All satellite providers fell far behind fixed broadband providers in the whole of Europe for latency during Q2 2022. Starlink in Spain and the United Kingdom recorded the lowest satellite latencies at 37 ms and 39 ms, respectively — still a far cry from the closest fixed broadband latency, which was 14 ms in Germany, Greece, and Italy.

Starlink in Brazil was the fastest satellite provider in South America

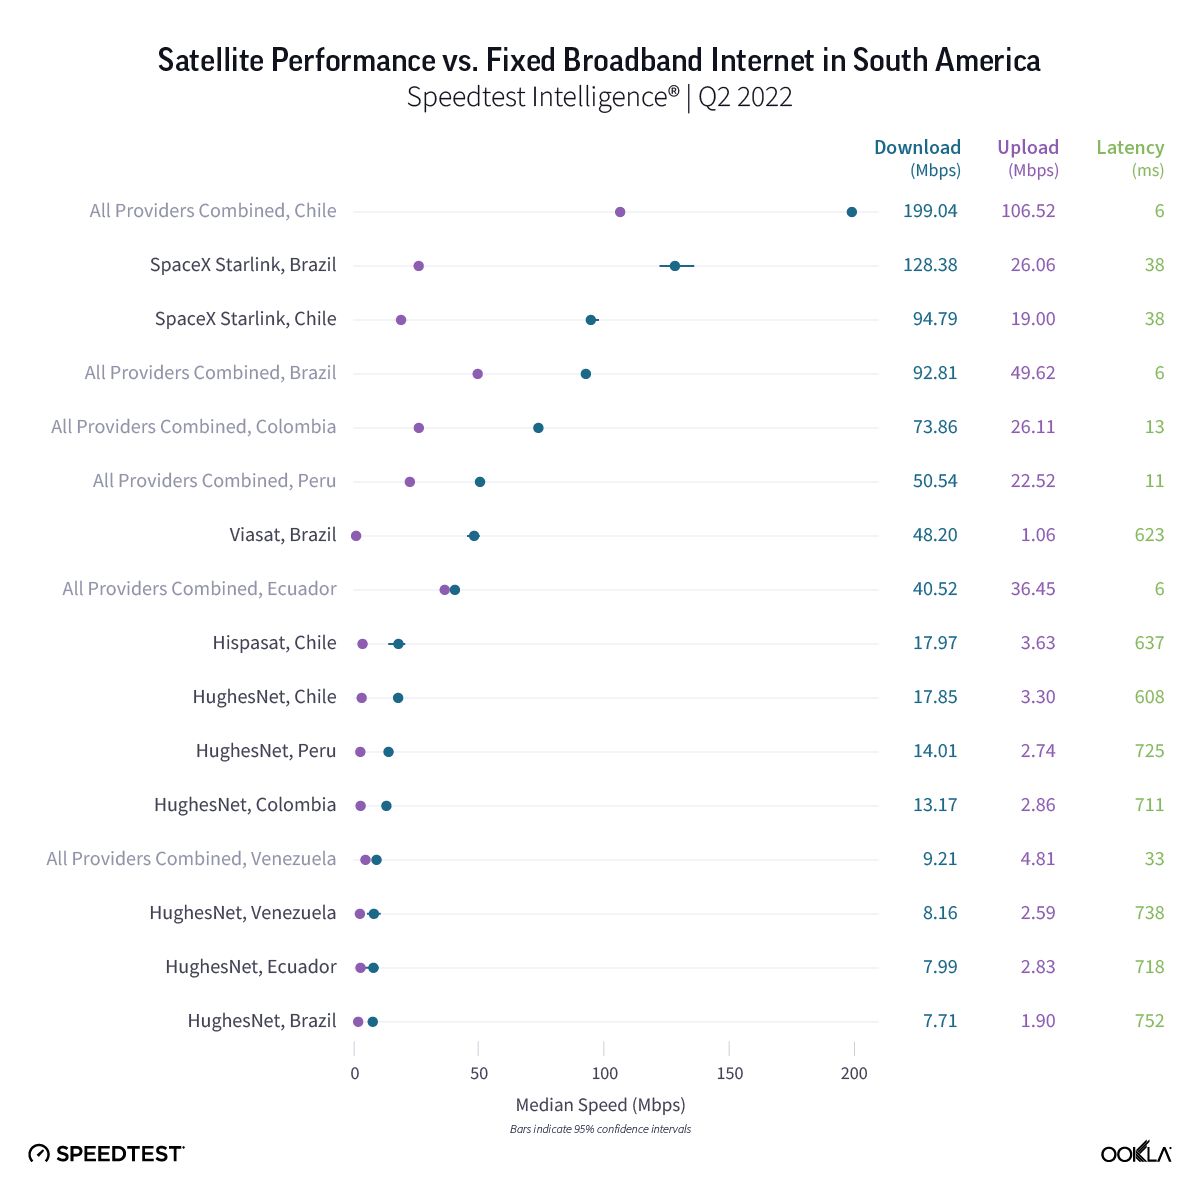
Chart of Satellite performance versus fixed broadband internet in South America

Our analysis of Speedtest Intelligence data found Starlink in Brazil was the fastest satellite provider in South America with a median download speed of 128.38 Mbps during Q2 2022, followed by Starlink in Chile at 94.79 Mbps. Chilean fixed broadband internet was still much faster for those who could get access to it. The Speedtest Global Index™ found Chile had the second fastest fixed broadband internet in the world with a median download speed of 211.43 Mbps during August 2022. Starlink in Brazil was the only satellite provider to be faster than its country’s fixed broadband providers combined.

Like last quarter, South American fixed broadband providers surpassed satellite providers in each respective upload speeds during Q2 2022. All satellite providers had a higher median latency than fixed broadband, though Starlink in Brazil and Chile had latencies of 38 ms.

Starlink in New Zealand was the fastest satellite provider in Oceania 

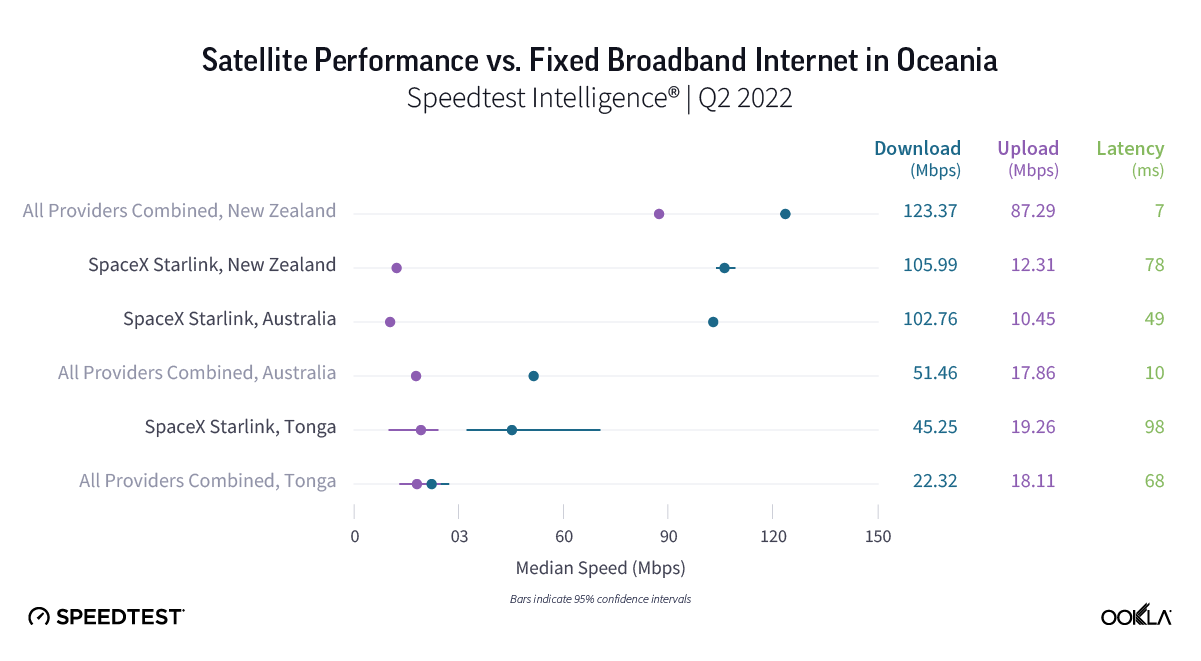
Chart of Satellite performance versus fixed broadband internet in Oceania

Starlink’s fastest median download speed in Oceania was in New Zealand at 105.99 Mbps, though this still fell short of fixed broadband providers in the country. Starlink in Australia was faster than fixed broadband providers by a wide margin at 102.76 Mbps to 51.46 Mbps during Q2 2022. Starlink outperformed fixed broadband providers in new-to-our-list Tonga 45.25 Mbps to 22.32 Mbps. 

New Zealand’s fixed broadband dominated for the fastest median upload speed in Oceania at 87.29 Mbps during Q2 2022, while Australia’s fixed broadband fell far behind with an upload speed of 17.86 Mbps. Both speeds were still faster than Starlink’s median upload speeds in New Zealand and Australia (12.31 Mbps and 10.45 Mbps, respectively). Tonga didn’t have a statistical winner for fastest upload speed, but Starlink reached 19.26 Mbps and fixed broadband 18.11 Mbps. Fixed broadband also had a lower median latency than Starlink during Q1 2022, which clocked in at 49 ms in Australia, 78 ms in New Zealand, and 98 ms in Tonga.

Biggest questions lie ahead, but competition will be good for consumers

Satellite connectivity is coming to mobile, with Starlink’s new partnership with T-Mobile and new mobile devices becoming satellite enabled. This will cause ripples across North America, which is a net positive for consumers who live in areas with low mobile and fixed broadband connectivity. Connecting with the world won’t be a question of how anymore, it will be a question of how good your experience is. That’s hopefully a win-win for consumers, especially as more providers vie for the fastest and best satellite experience — a true global space race.

Starlink isn’t stopping there — they’re trying to get into airplanes, cruise ships, and cars. But they’re not the only satellite provider making moves; Viasat is launching its Viasat-3 fleet, OneWeb is combining business with Eutelsat, and Amazon is sending 3,236 Project Kuiper satellites into orbit. We’ll be here monitoring the skies in our ongoing satellite series. Take a Speedtest® to help us provide an accurate and more complete picture of real-world performance. And if we’re missing data on your satellite network, send us a screenshot of your speed on Twitter or Facebook.

Ookla retains ownership of this article including all of the intellectual property rights, data, content graphs and analysis. This article may not be quoted, reproduced, distributed or published for any commercial purpose without prior consent. Members of the press and others using the findings in this article for non-commercial purposes are welcome to publicly share and link to report information with attribution to Ookla.

| February 12, 2020

How Roaming Affects Mobile Speeds in Europe

Last year, we conducted an expansive analysis of mobile roaming in the European Union. We’re updating our data to see which countries have the best roaming speeds and how roaming affects time spent on Wi-Fi. This analysis is based on Speedtest data from Android devices in Europe during Q3-Q4 2019. Despite Brexit, we’ve included data from the United Kingdom to keep parity year-over-year, as the roaming agreement remains in place for 2020 and this data involves travel within a specific set of countries.

Roaming in Europe typically means slower download speeds

Mobile roaming speeds are affected by the deals struck between individual mobile operators on a country-by-country basis. This means roaming speeds can depend on the plan a subscriber has selected in their home country and on what is offered in the country of destination.

Out of the 28 countries we examined, residents of 22 countries experienced slower speeds when roaming elsewhere in Europe than they do in their home countries. Travelers from the Netherlands experience the most significant loss in speed, with a roaming download speed that is 54.7% slower than at home. However, users in Slovakia barely notice a change in download speed with a roaming download speed only 2.6% slower than the mean download speed in Slovakia during this period.

Roaming vs. Local Mobile Download Speeds in Europe
Speedtest® Data | Q3-Q4 2019
Country Local Speeds (Mbps) Roaming Speed Upload (Mbps) % Change
Austria 46.30 35.93 -22.4%
Belgium 50.95 33.38 -34.5%
Bulgaria 55.32 30.95 -44.1%
Croatia 52.40 43.73 -16.6%
Cyprus 43.50 21.04 -51.6%
Czech Republic 47.00 36.37 -22.6%
Denmark 48.38 32.28 -33.3%
Estonia 42.61 43.90 3.0%
Finland 43.38 41.46 -4.4%
France 44.34 34.00 -23.3%
Germany 34.07 30.48 -10.5%
Greece 39.90 45.03 12.9%
Hungary 45.53 29.55 -35.1%
Ireland 26.73 32.05 19.9%
Italy 33.64 40.98 21.8%
Latvia 33.20 38.54 16.1%
Lithuania 46.72 39.73 -15.0%
Luxembourg 52.55 34.61 -34.1%
Malta 48.88 32.30 -33.9%
Netherlands 62.52 28.31 -54.7%
Poland 33.07 25.57 -22.7%
Portugal 34.49 36.34 5.4%
Romania 37.84 33.69 -11.0%
Slovakia 34.74 33.83 -2.6%
Slovenia 39.34 32.67 -16.9%
Spain 34.28 27.56 -19.6%
Sweden 48.52 36.55 -24.7%
United Kingdom 36.36 34.96 -3.8%

Upload speeds locally are also mostly faster than those experienced while roaming. Cyprus, Denmark, and the Netherlands all had relatively high mean upload speeds locally, but they also had the largest loss in roaming upload speeds ranging from 31.3% to 36.7% slower upload speeds on mobile roaming.

Residents of some European countries do benefit from faster speeds when roaming on mobile. Users from Estonia, Portugal, Greece, Latvia, Ireland, and Italy all experienced faster download speeds when roaming elsewhere in Europe than they did in their home countries during Q3-Q4 2019. Italian and Irish travelers gained the most when roaming with download speeds that were 21.8% and 19.9% faster than their local speeds, respectively.

A total of 12 countries had higher mean upload speeds while roaming than they experienced locally during this period. France, Latvia, and Ireland benefitted the most with an increase in upload speeds that ranged from 26.5% to 21.4% while roaming.

Latency increases dramatically while roaming in Europe

Unlike mean download and upload speeds, latency is almost always dramatically different while roaming. This is because roaming signals are routed through a user’s home network, making latency a significant issue for Europeans when traveling.

Local vs. Roaming Latency in Europe
Speedtest® Data | Q3-Q4 2019
Country Local Latency (ms) Roaming Latency (ms) % Change
Austria 26 84 220.4%
Belgium 27 83 205.7%
Bulgaria 27 127 368.3%
Croatia 33 89 166.0%
Cyprus 23 213 825.5%
Czech Republic 26 74 187.6%
Denmark 26 100 287.9%
Estonia 25 76 201.5%
Finland 27 97 254.6%
France 41 82 98.8%
Germany 38 87 128.1%
Greece 29 129 349.8%
Hungary 25 93 272.6%
Ireland 35 100 185.0%
Italy 50 91 81.2%
Latvia 26 95 268.2%
Lithuania 27 107 302.2%
Luxembourg 23 83 262.6%
Malta 19 136 611.6%
Netherlands 28 87 208.3%
Poland 35 109 209.2%
Portugal 30 109 258.8%
Romania 30 113 275.3%
Slovakia 31 76 105.5%
Slovenia 24 74 208.2%
Spain 45 107 137.4%
Sweden 29 118 304.3%
United Kingdom 38 103 173.1%

In their home country, residents of Malta (19 ms), Luxembourg (22 ms) and Cyprus (23 ms) enjoyed the lowest latencies in Europe. Residents of France, Spain and Italy experienced the highest latencies in their home countries at 41 ms, 45 ms and 50 ms, respectively.

European residents experienced an increase of at least 81.2% in their latency when visiting other countries within Europe. Residents from Cyprus, Malta and Bulgaria experience the biggest increase in latency when visiting other countries in Europe, ranging from Cyprus’ 825.5% to Bulgaria’s 368.3%. The countries that experienced the smallest increase in latency were Italy (81.2%), France (98.8%) and Germany (128.1%).

Locals spend more time on Wi-Fi than visitors in Europe

While there are no roaming changes within the E.U., users often opt to connect to Wi-Fi to avoid additional data overages at home and abroad. The following table compares the percentage of time spent on Wi-Fi by a resident of a country with that of a visitor to the same country during Q3-Q4 2019.

Percentage of Time Spent on Wi-Fi in Europe
Speedtest® Data | Q3-Q4 2019
Country Local Customers Visitors % Change
Austria 75.5% 40.5% -46.3%
Belgium 77.9% 35.8% -54.1%
Bulgaria 74.0% 60.3% -18.5%
Croatia 74.3% 53.8% -27.5%
Cyprus 79.3% 70.2% -11.5%
Czech Republic 80.1% 46.6% -41.8%
Denmark 78.7% 60.3% -23.4%
Estonia 70.3% 51.9% -26.2%
Finland 63.0% 60.3% -4.4%
France 69.3% 48.7% -29.7%
Germany 80.0% 47.1% -41.1%
Greece 79.3% 64.3% -19.0%
Hungary 76.8% 47.8% -37.8%
Ireland 75.6% 58.9% -22.0%
Italy 70.9% 55.1% -22.2%
Latvia 68.8% 49.2% -28.4%
Lithuania 73.8% 52.2% -29.2%
Luxembourg 72.4% 30.8% -57.4%
Malta 79.4% 65.9% -17.1%
Netherlands 81.8% 49.1% -40.1%
Poland 70.2% 58.2% -17.1%
Portugal 76.5% 61.9% -19.0%
Romania 69.6% 64.1% -7.9%
Slovakia 76.2% 40.1% -47.4%
Slovenia 70.7% 24.7% -65.2%
Spain 78.3% 62.8% -19.7%
Sweden 81.8% 53.8% -34.3%
United Kingdom 79.3% 60.9% -23.1%

As we saw last year, Finnish residents spent the least amount of time on Wi-Fi at 63.0%. Latvia showed the second lowest time spent on Wi-Fi (68.8%), followed by France (69.3%). Residents from the Netherlands, Sweden and the Czech Republic spent the most time on Wi-Fi at 81.8%, 81.8%, and 80.1%, respectively.

Visitors to Cyprus, Malta and Greece spent the most amount of time on Wi-Fi during this period. Time spent on Wi-Fi by visitors ranged from 64.3% in Greece to 70.2% in Cyprus. Visitors to Slovenia, Luxembourg and Belgium as a destination country spent the least amount of time on Wi-Fi at 25.7%, 30.8% and 35.8%, respectively.

Are you interested in more data on roaming performance? Read more here!

Ookla retains ownership of this article including all of the intellectual property rights, data, content graphs and analysis. This article may not be quoted, reproduced, distributed or published for any commercial purpose without prior consent. Members of the press and others using the findings in this article for non-commercial purposes are welcome to publicly share and link to report information with attribution to Ookla.

| June 16, 2021

How COVID-19 Affected Roaming for Mobile Speeds in Europe

Roaming might seem like an unusual topic in a time when inter-country travel has been largely prohibited, but we wanted to build on our previous analysis to see how roaming performance and behaviors evolved over the past year. This analysis examines Speedtest data from Android devices in the European Union (E.U.) and the United Kingdom (U.K.) from Q1 2020 through Q1 2021. We’ve included the U.K. to maintain continuity with pre-Brexit reports.

Roaming speeds were slower in most European countries in Q1 2021

Speedtest Intelligence® again showed that consumers who are roaming outside their home countries often experience slower speeds. During Q1 2021, 19 out of the 26 European countries with statistically viable roaming sample sizes experienced slower median roaming download speeds than median local download speeds. Cyprus and Malta had too few roaming samples to be included in this year’s analysis for Q1 2021.

For the seven countries that saw increased speeds, Latvians experienced the largest increase in median download speed when roaming elsewhere in Europe at 23.4%, which was followed closely by Estonia (22.8%) and Ireland (19.5%). Greece, Romania and Slovenia saw increases of more than 5%. The U.K. saw about the same speeds roaming and locally with an increase of only 0.5% when roaming. Hungary also saw comparable roaming download speeds to local speeds with a decrease of only 0.5% when roaming.

Median Local vs. Roaming Download Speeds in Europe
Speedtest Intelligence® | Q1 2021
Country Local Download (Mbps) Roaming Download (Mbps) % Change
Austria 36.19 26.13 -27.8%
Belgium 43.90 27.52 -37.3%
Bulgaria 61.76 29.74 -51.8%
Croatia 48.23 31.3 -35.1%
Czechia 31.35 19.74 -37.0%
Denmark 50.11 22.18 -55.7%
Estonia 34.34 42.16 22.8%
Finland 43.02 31.68 -26.4%
France 34.68 29.62 -14.6%
Germany 27.56 20.14 -26.9%
Greece 32.38 35.51 9.7%
Hungary 28.66 28.51 -0.5%
Ireland 14.99 17.91 19.5%
Italy 25.24 21.66 -14.2%
Latvia 22.69 28.00 23.4%
Lithuania 33.66 30.80 -8.5%
Luxembourg 40.65 26.31 -35.3%
Netherlands 77.52 26.48 -65.8%
Poland 26.51 23.13 -12.7%
Portugal 26.16 23.74 -9.3%
Romania 25.12 26.80 6.7%
Slovakia 23.79 20.94 -12.0%
Slovenia 27.63 29.58 7.1%
Spain 23.78 18.21 -23.4%
Sweden 38.26 23.16 -39.5%
United Kingdom 27.96 28.09 0.5%

Every other country on our list saw decreases in median download speeds of 8.5% or more while roaming, with customers from the Netherlands experiencing the largest drop (65.8%) from a local speed of 77.52 Mbps to 26.48 Mbps while roaming. Customers from Denmark and Bulgaria experienced roaming speeds less than half of what they’re accustomed to at home with decreases of 55.7% and 51.8%, respectively.

Roaming decreased during the pandemic while speeds increased

The COVID-19 pandemic has upended countless lives with multiple lockdowns throughout 2020 and 2021 and severe limits to movement across borders. Data from Speedtest Intelligence reflects this decrease in roaming with roaming samples markedly down when comparing Q1 2021 to Q1 2020. We saw the most roaming samples during Q3 2020 and Q1 2020, which corresponds to increased lockdowns and movement restrictions in Q2 and Q4 2020 in response to the first and second waves of the pandemic.

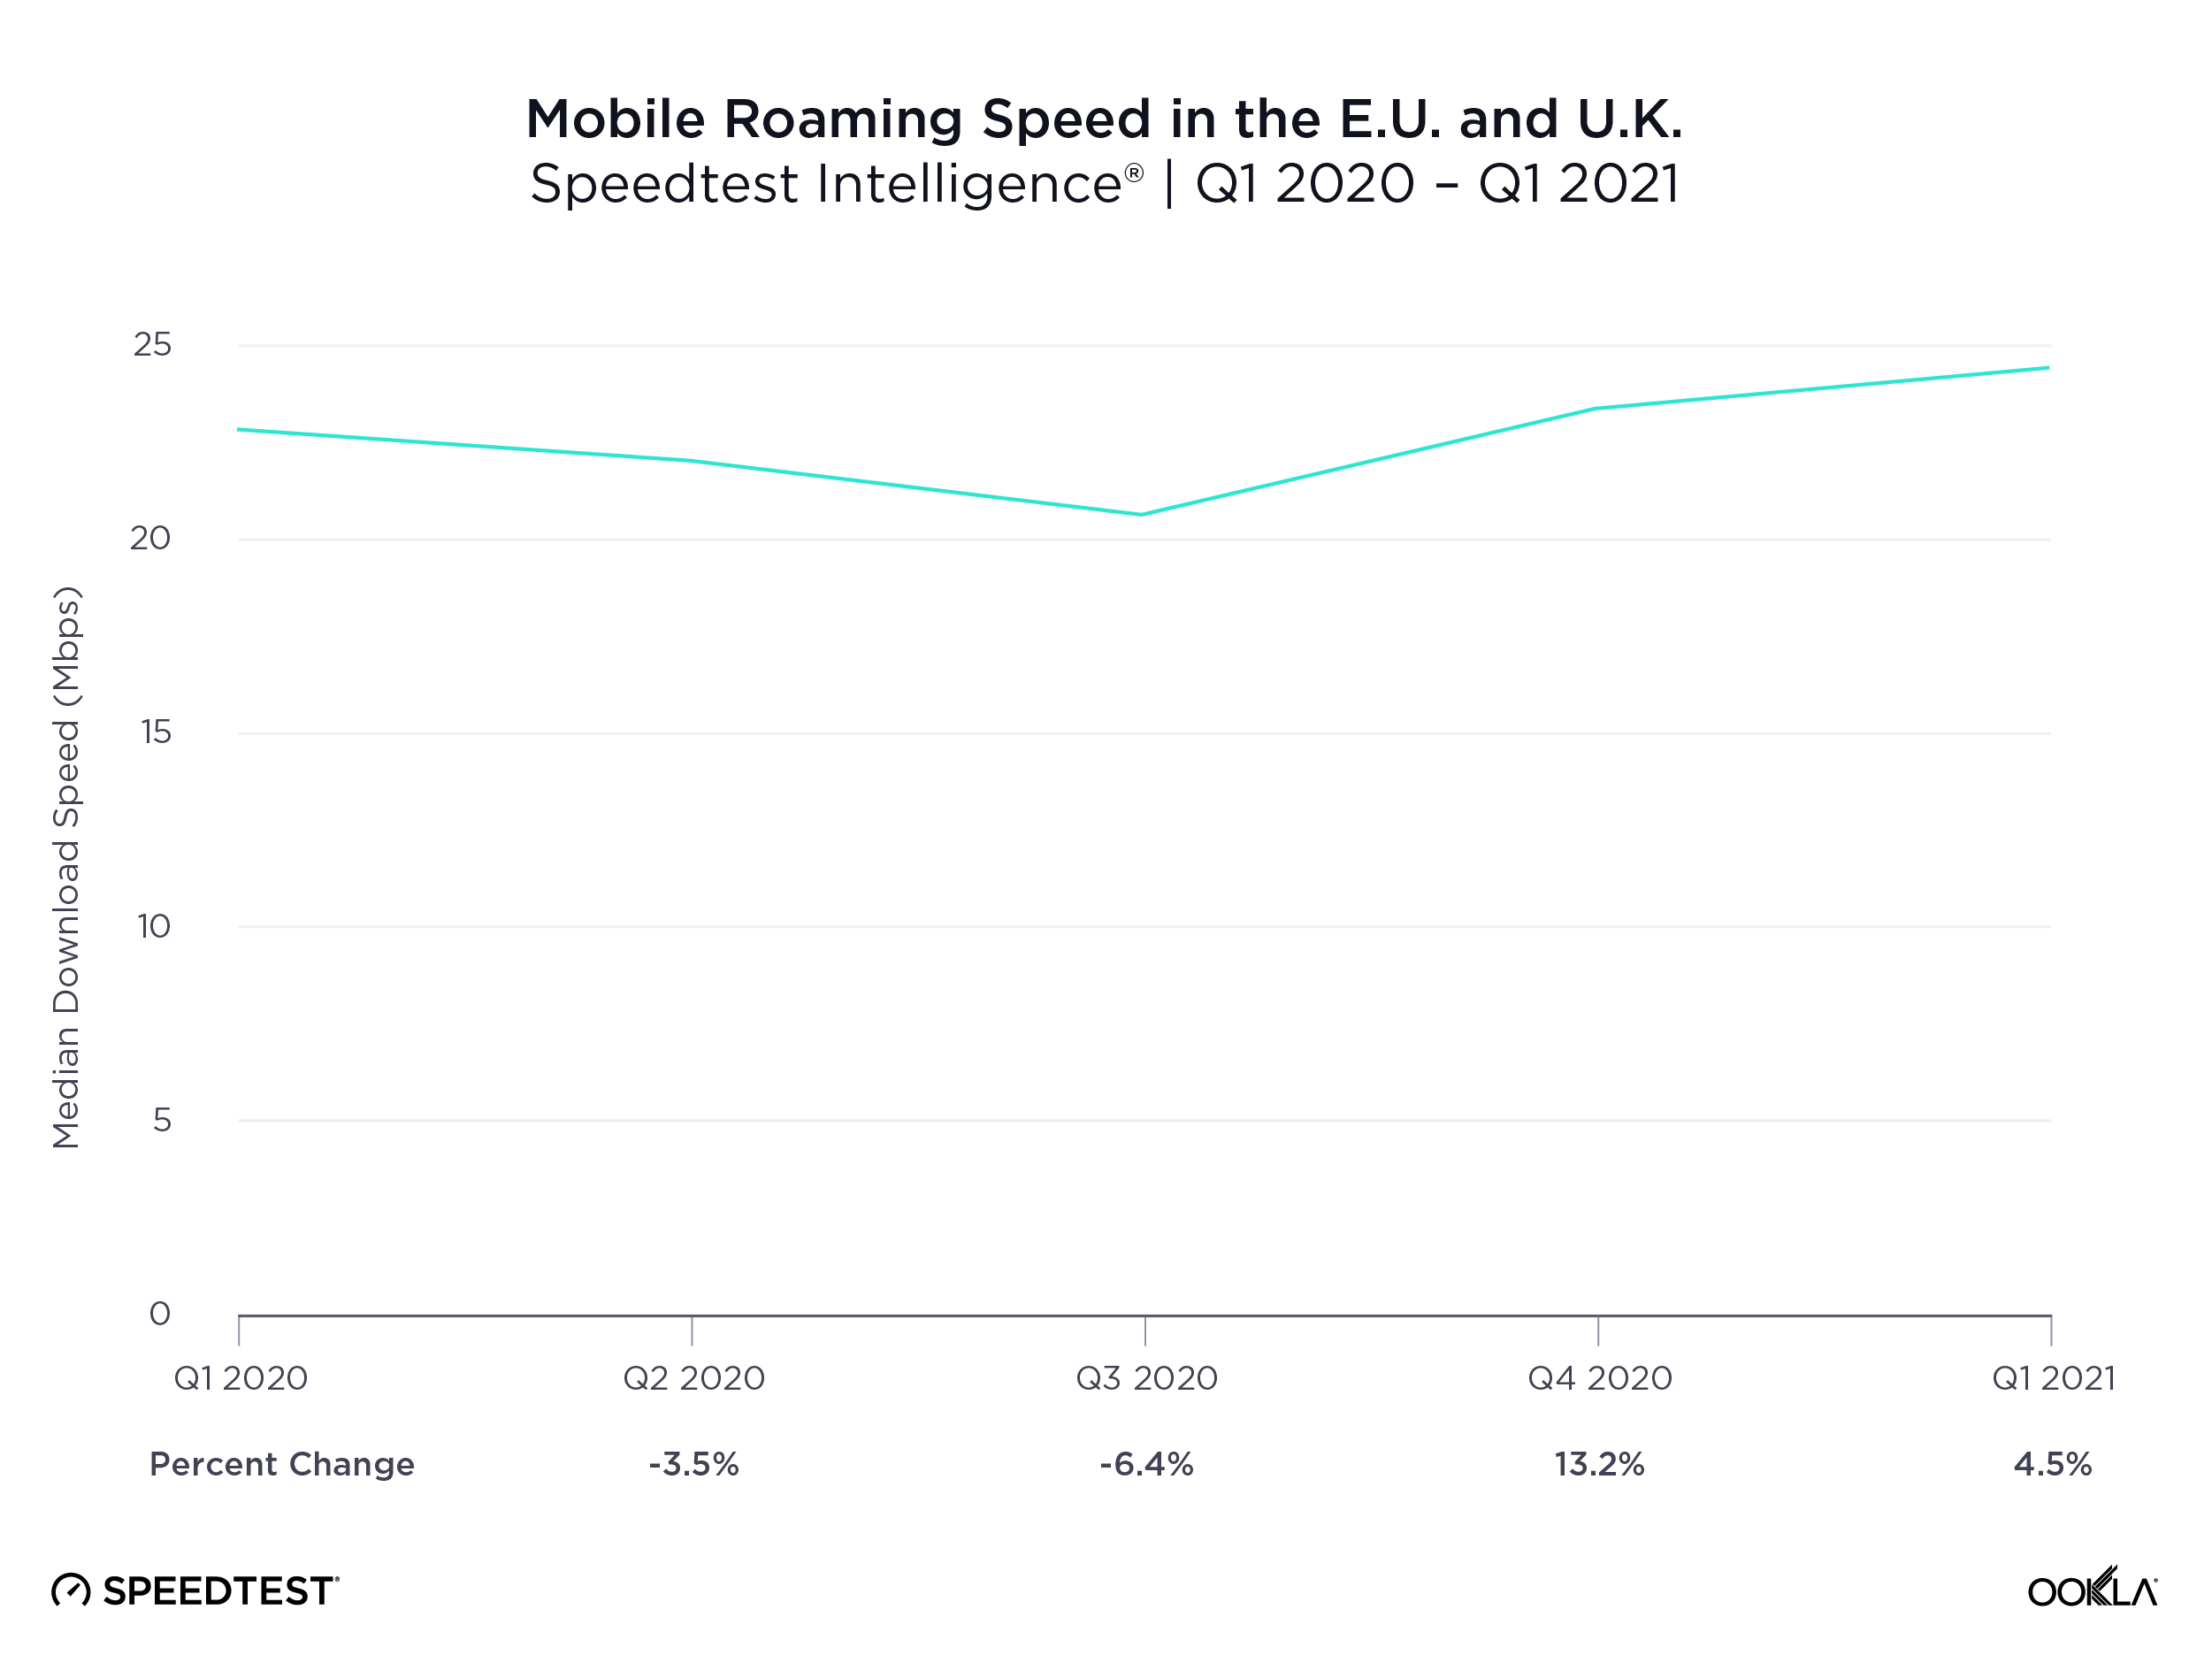
Roaming speeds for all European countries combined increased 6.9% between Q1 2020 and Q1 2021, though the increase was not linear. Median download speed while roaming decreased from 22.89 Mbps in Q1 2020 to 22.09 in Q2 2020 and slipped down to 20.68 Mbps in Q3 2020. Roaming speeds began to increase in Q4 2020 with the median download speed rising to 23.42 Mbps, and Q1 2021 saw a further increase to 24.47 Mbps.

ookla_roaming_quarter_change_eu_0621-1

Estonia saw the biggest year-over-year increase in median roaming download speed, Slovakia and Italy saw the largest decrease

Median European Roaming Download Speeds
Speedtest Intelligence® | Q1 2020 – Q1 2021
Country Q1 2020 Download (Mbps) Q1 2021 Download (Mbps) % Change
Europe (All Countries Combined) 22.89 24.47 6.9%
Austria 24.39 26.13 7.1%
Belgium 23.78 27.52 15.7%
Bulgaria 22.81 29.74 30.4%
Croatia 29.28 31.30 6.9%
Czechia 20.23 19.74 -2.4%
Denmark 21.38 22.18 3.7%
Estonia 27.82 42.16 51.5%
Finland 32.18 31.68 -1.6%
France 24.57 29.62 20.6%
Germany 20.74 20.14 -2.9%
Greece 41.07 35.51 -13.5%
Hungary 25.10 28.51 13.6%
Ireland 22.08 17.91 -18.9%
Italy 26.98 21.66 -19.7%
Latvia 26.38 28.00 6.1%
Lithuania 22.60 30.80 36.3%
Luxembourg 18.82 26.31 39.8%
Netherlands 18.39 26.48 44.0%
Poland 17.01 23.13 36.0%
Portugal 23.78 23.74 -0.2%
Romania 23.64 26.80 13.4%
Slovakia 26.16 20.94 -20.0%
Slovenia 25.30 29.58 16.9%
Spain 15.05 18.21 21.0%
Sweden 21.36 23.16 8.4%
United Kingdom 29.48 28.09 -4.7%

2020 also posed many challenges for telecom operators around the world as customers shifted use patterns. Despite these challenges, many Europeans saw increases in median roaming speeds year-over-year. In fact, customers in 17 out of the 26 countries analyzed saw faster download speeds while roaming elsewhere in Europe when comparing Q1 2020 to Q1 2021. Estonians saw the largest increase at 51.5% (from 27.82 Mbps to 42.16 Mbps), the Netherlands was next with a 44.0% jump (from 18.39 Mbps to 26.48 Mbps) and Luxembourg saw a 39.8% increase in download speed (from 18.82 Mbps to 26.31 Mbps).

Countries whose customers experienced year-over-year decreases in median downloads speed while roaming include Slovakia (20.0% decrease), Italy (19.7%), Ireland (18.9%), Greece (13.5%), the U.K. (4.7%), Germany (2.9%), Czechia (2.4%), Finland (1.6%) and Portugal (0.2%).

While the year-over-year change is an interesting baseline metric, it’s also important to note only Denmark, Germany, Poland and Spain had consistently slower median roaming download speeds than the European average during every quarter from Q1 2020 to Q1 2021. Every other country had at least one quarter where speeds were faster than the European average.

Outbound roaming speeds varied drastically from country to country from Q1 2020 to Q1 2021

Roaming speeds are heavily dependent on agreements between individual operators, which means they can vary dramatically by country and by operator. We looked closely at outbound roaming for individual countries to see how different countries’ networks performed during COVID-19 lockdowns.

Customers from the Netherlands roaming in France saw the fastest median roaming download speed in all of Europe during Q1 2021 at 70.46 Mbps. Customers from Germany roaming in Portugal experienced the slowest median roaming download speed during Q3 2020 at 0.42 Mbps.

Here were some of the fastest roaming speeds from select countries to other countries within Europe between Q1 2020 and Q1 2021:

  • Netherlands to France (70.46 Mbps in Q1 2021)
  • Bulgaria to the U.K. (58.21 Mbps in Q4 2020)
  • Netherlands to Poland (55.77 Mbps in Q1 2021)
  • Denmark to Sweden (40.46 Mbps in Q4 2020)
  • Finland to Estonia (48.41 Mbps in Q1 2020)

Here were some of the slowest roaming speeds between Q1 2020 and Q1 2021:

  • Germany to Portugal (0.42 Mbps in Q3 2020)
  • Czechia to France (4.98 Mbps in Q3 2020)
  • France to Portugal (5.54 Mbps in Q3 2020)
  • Hungary to France (5.95 Mbps in Q3 2020)
  • Poland to Belgium (7.59 Mbps in Q1 2020)

We’ll continue to watch roaming speeds over the next year to see how roaming changes as more countries reopen and travel picks up again. If you’re interested in learning more about roaming speeds for your business or country, please click here.

Ookla retains ownership of this article including all of the intellectual property rights, data, content graphs and analysis. This article may not be quoted, reproduced, distributed or published for any commercial purpose without prior consent. Members of the press and others using the findings in this article for non-commercial purposes are welcome to publicly share and link to report information with attribution to Ookla.

| July 27, 2021

Oslo Tops the List of World Capitals with the Fastest 5G in Q1-Q2 2021

Mobile operators are rapidly expanding 5G deployments across the globe, with 16,410 new 5G deployments across 109 countries added to the Ookla 5G Map in June 2021 alone. Huge investments in 5G are being made to increase performance, especially in major cities. We used Speedtest Intelligence® to see which world capitals have the best 5G speeds and availability, based on locations with commercially available 5G during Q1-Q2 2021.

Oslo, Norway was the fastest world capital for 5G during Q1-Q2 2021

ookla_fastest_5g_download_speed_world_capitals_0721

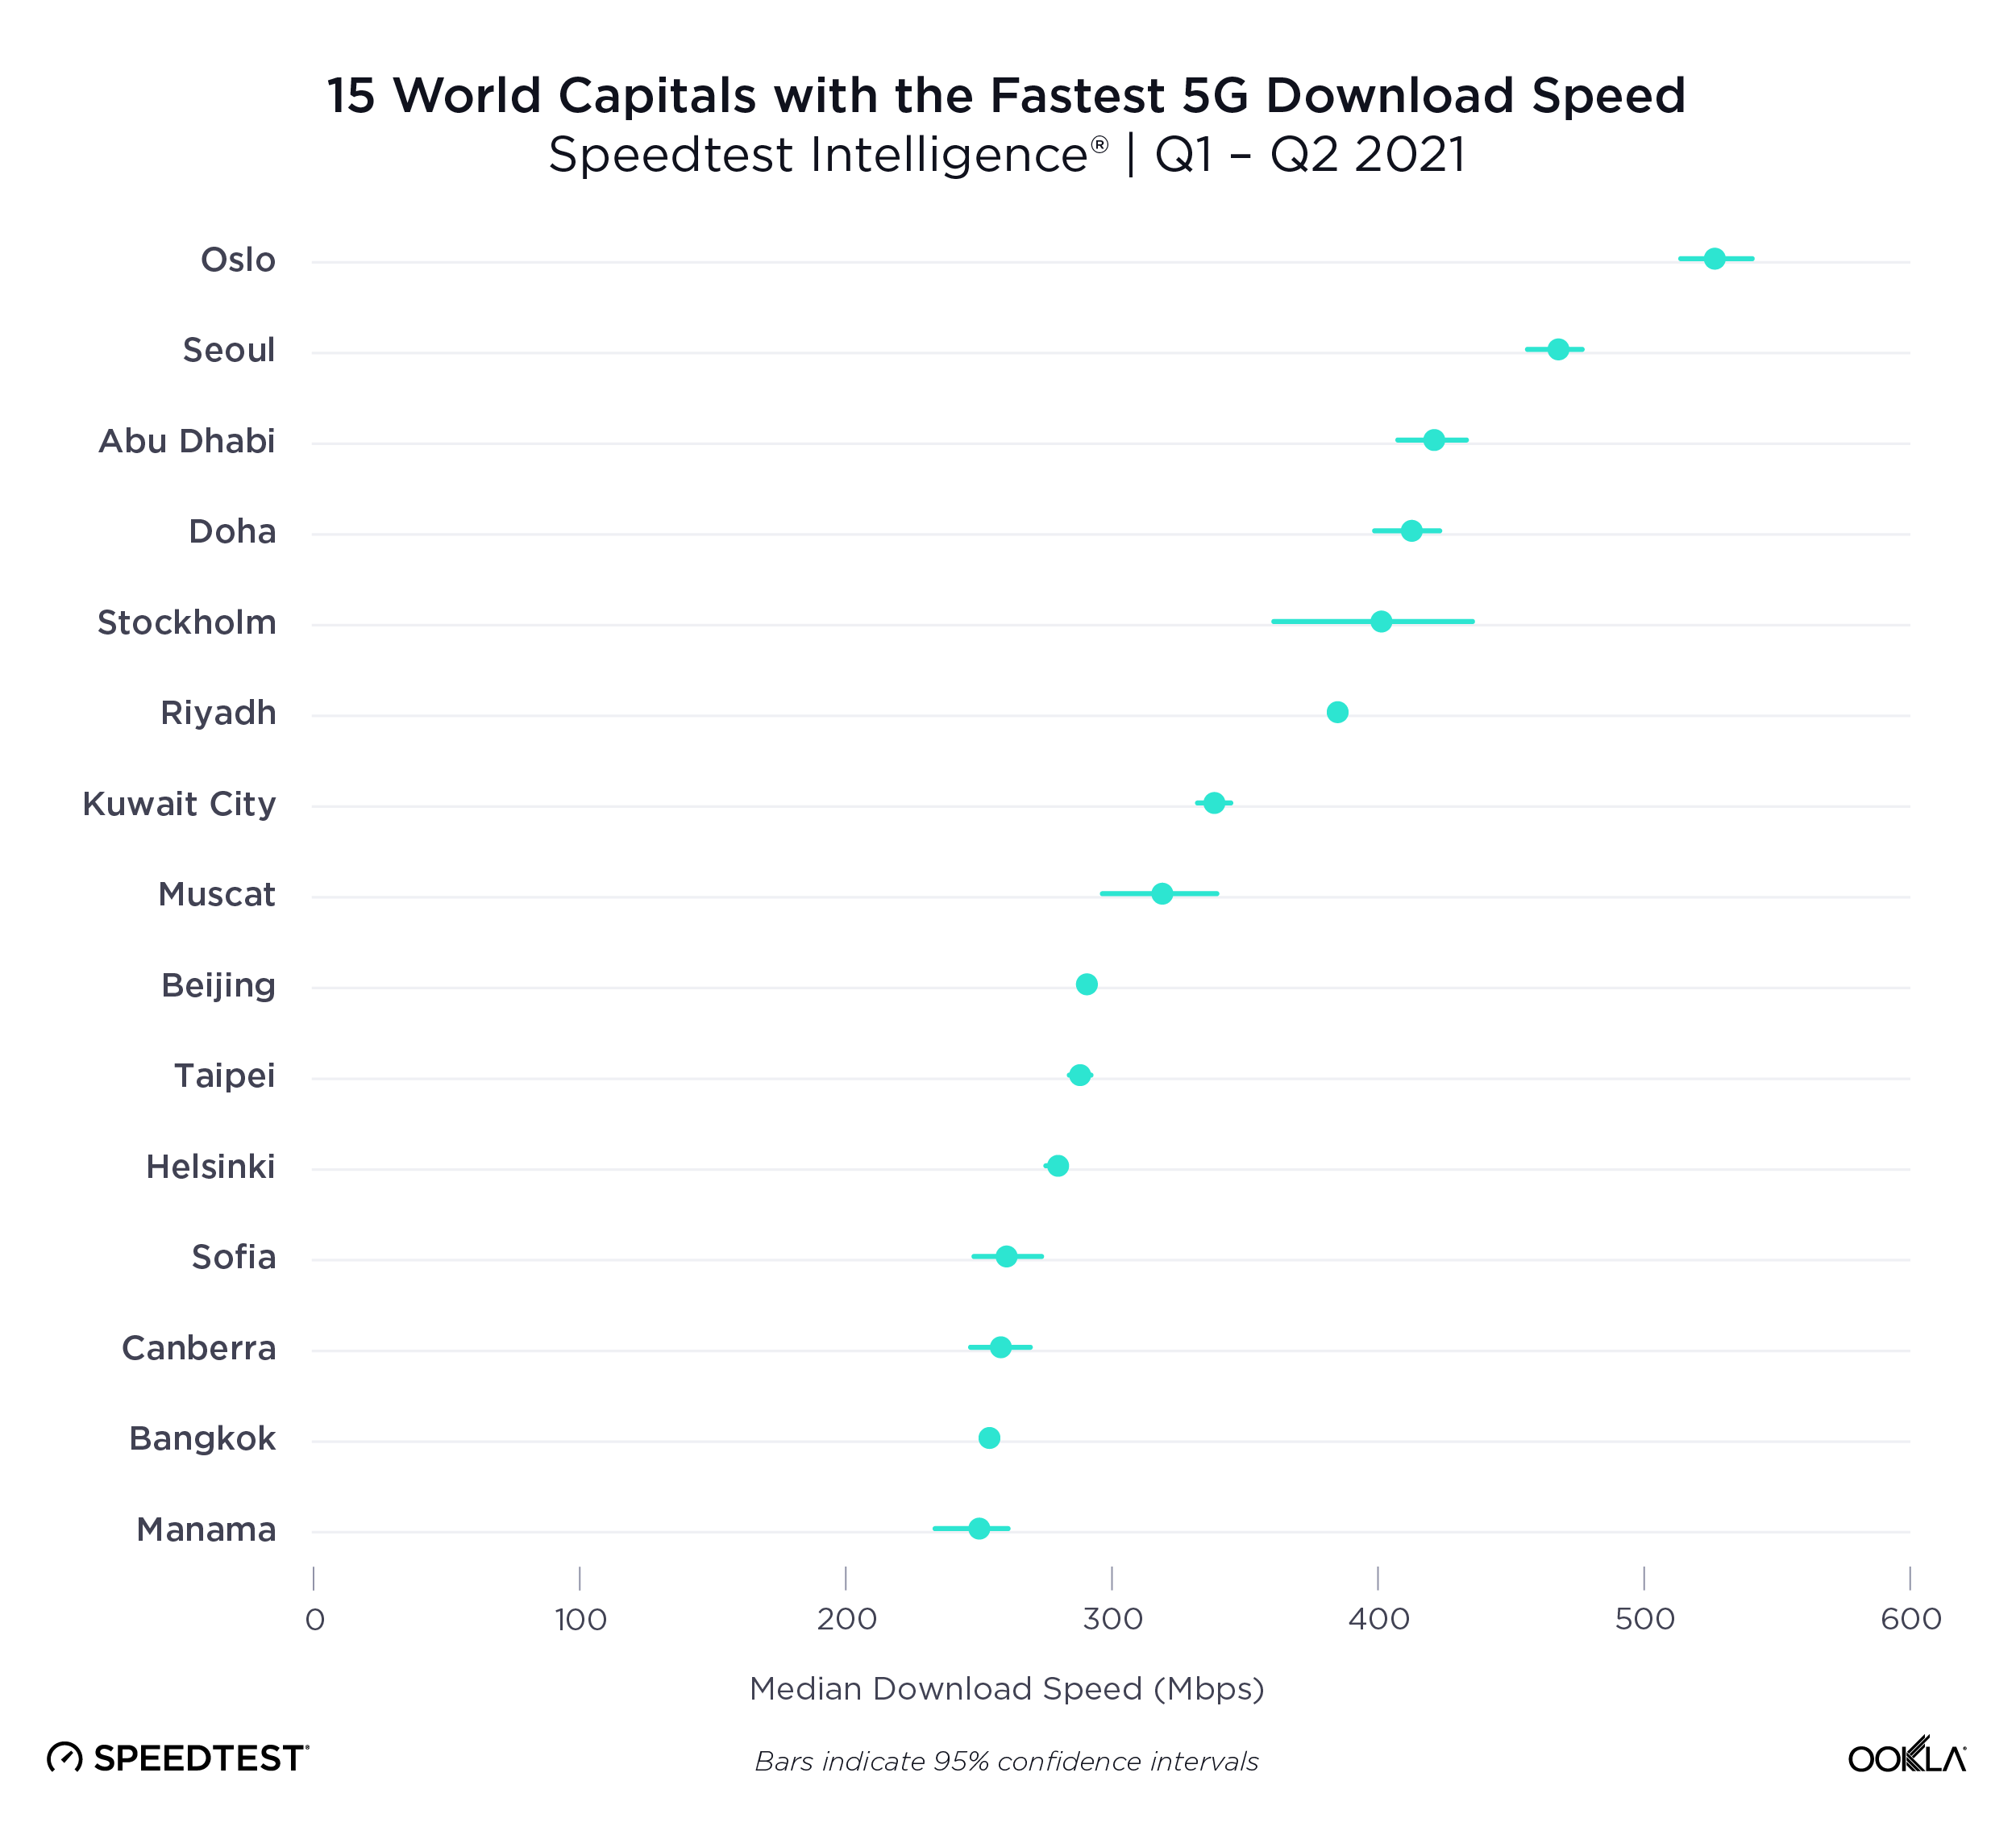
The race for fastest 5G performance among world capitals was extremely competitive during Q1-Q2 2021. Oslo, Norway had the fastest 5G of any world capital, clocking in with a median download speed of 526.74 Mbps. Seoul, South Korea had the second fastest median download speed over 5G at 467.84 Mbps; Abu Dhabi, United Arab Emirates was third (421.26 Mbps); Doha, Qatar fourth (413.40 Mbps) and Stockholm, Sweden fifth (401.30 Mbps). Riyadh, Saudi Arabia (384.66 Mbps); Kuwait City, Kuwait (338.97 Mbps), Muscat, Oman (318.95 Mbps); Beijing, China (291.19 Mbps); and Taipei, Taiwan (287.86 Mbps); rounded out the top 10. Helsinki, Finland showed a median 5G download speed of 279.59 Mbps; Sofia, Bulgaria 260.55 Mbps; Canberra, Australia 258.39 Mbps; Bangkok, Thailand 253.73 Mbps; Manama, Bahrain 249.71; Dublin, Ireland 223.01; Luxembourg City, Luxembourg 209.98 Mbps; Paris, France 208.48 Mbps and Bucharest, Romania 203.44 Mbps.

We saw median 5G download speeds between 150 Mbps and 200 Mbps in the following world capitals during Q1-Q2 2021: Ottawa, Canada (196.11 Mbps); Hanoi, Vietnam (195.99 Mbps); Bratislava, Slovakia (188.23 Mbps); Madrid, Spain (183.37 Mbps); Bern, Switzerland (175.69 Mbps); Rome, Italy (171.79 Mbps); London, United Kingdom (167.50 Mbps); Tokyo, Japan (167.02 Mbps); Athens, Greece (164.95 Mbps); Copenhagen, Denmark (162.75 Mbps); Ljubljana, Slovenia (158.50 Mbps); Hong Kong (153.78) and Washington, D.C., United States (151.80 Mbps).

Cape Town, South Africa was the slowest world capital for 5G in Q1-Q2 2021

ookla_slowest_5g_download_speed_world_capitals_0721

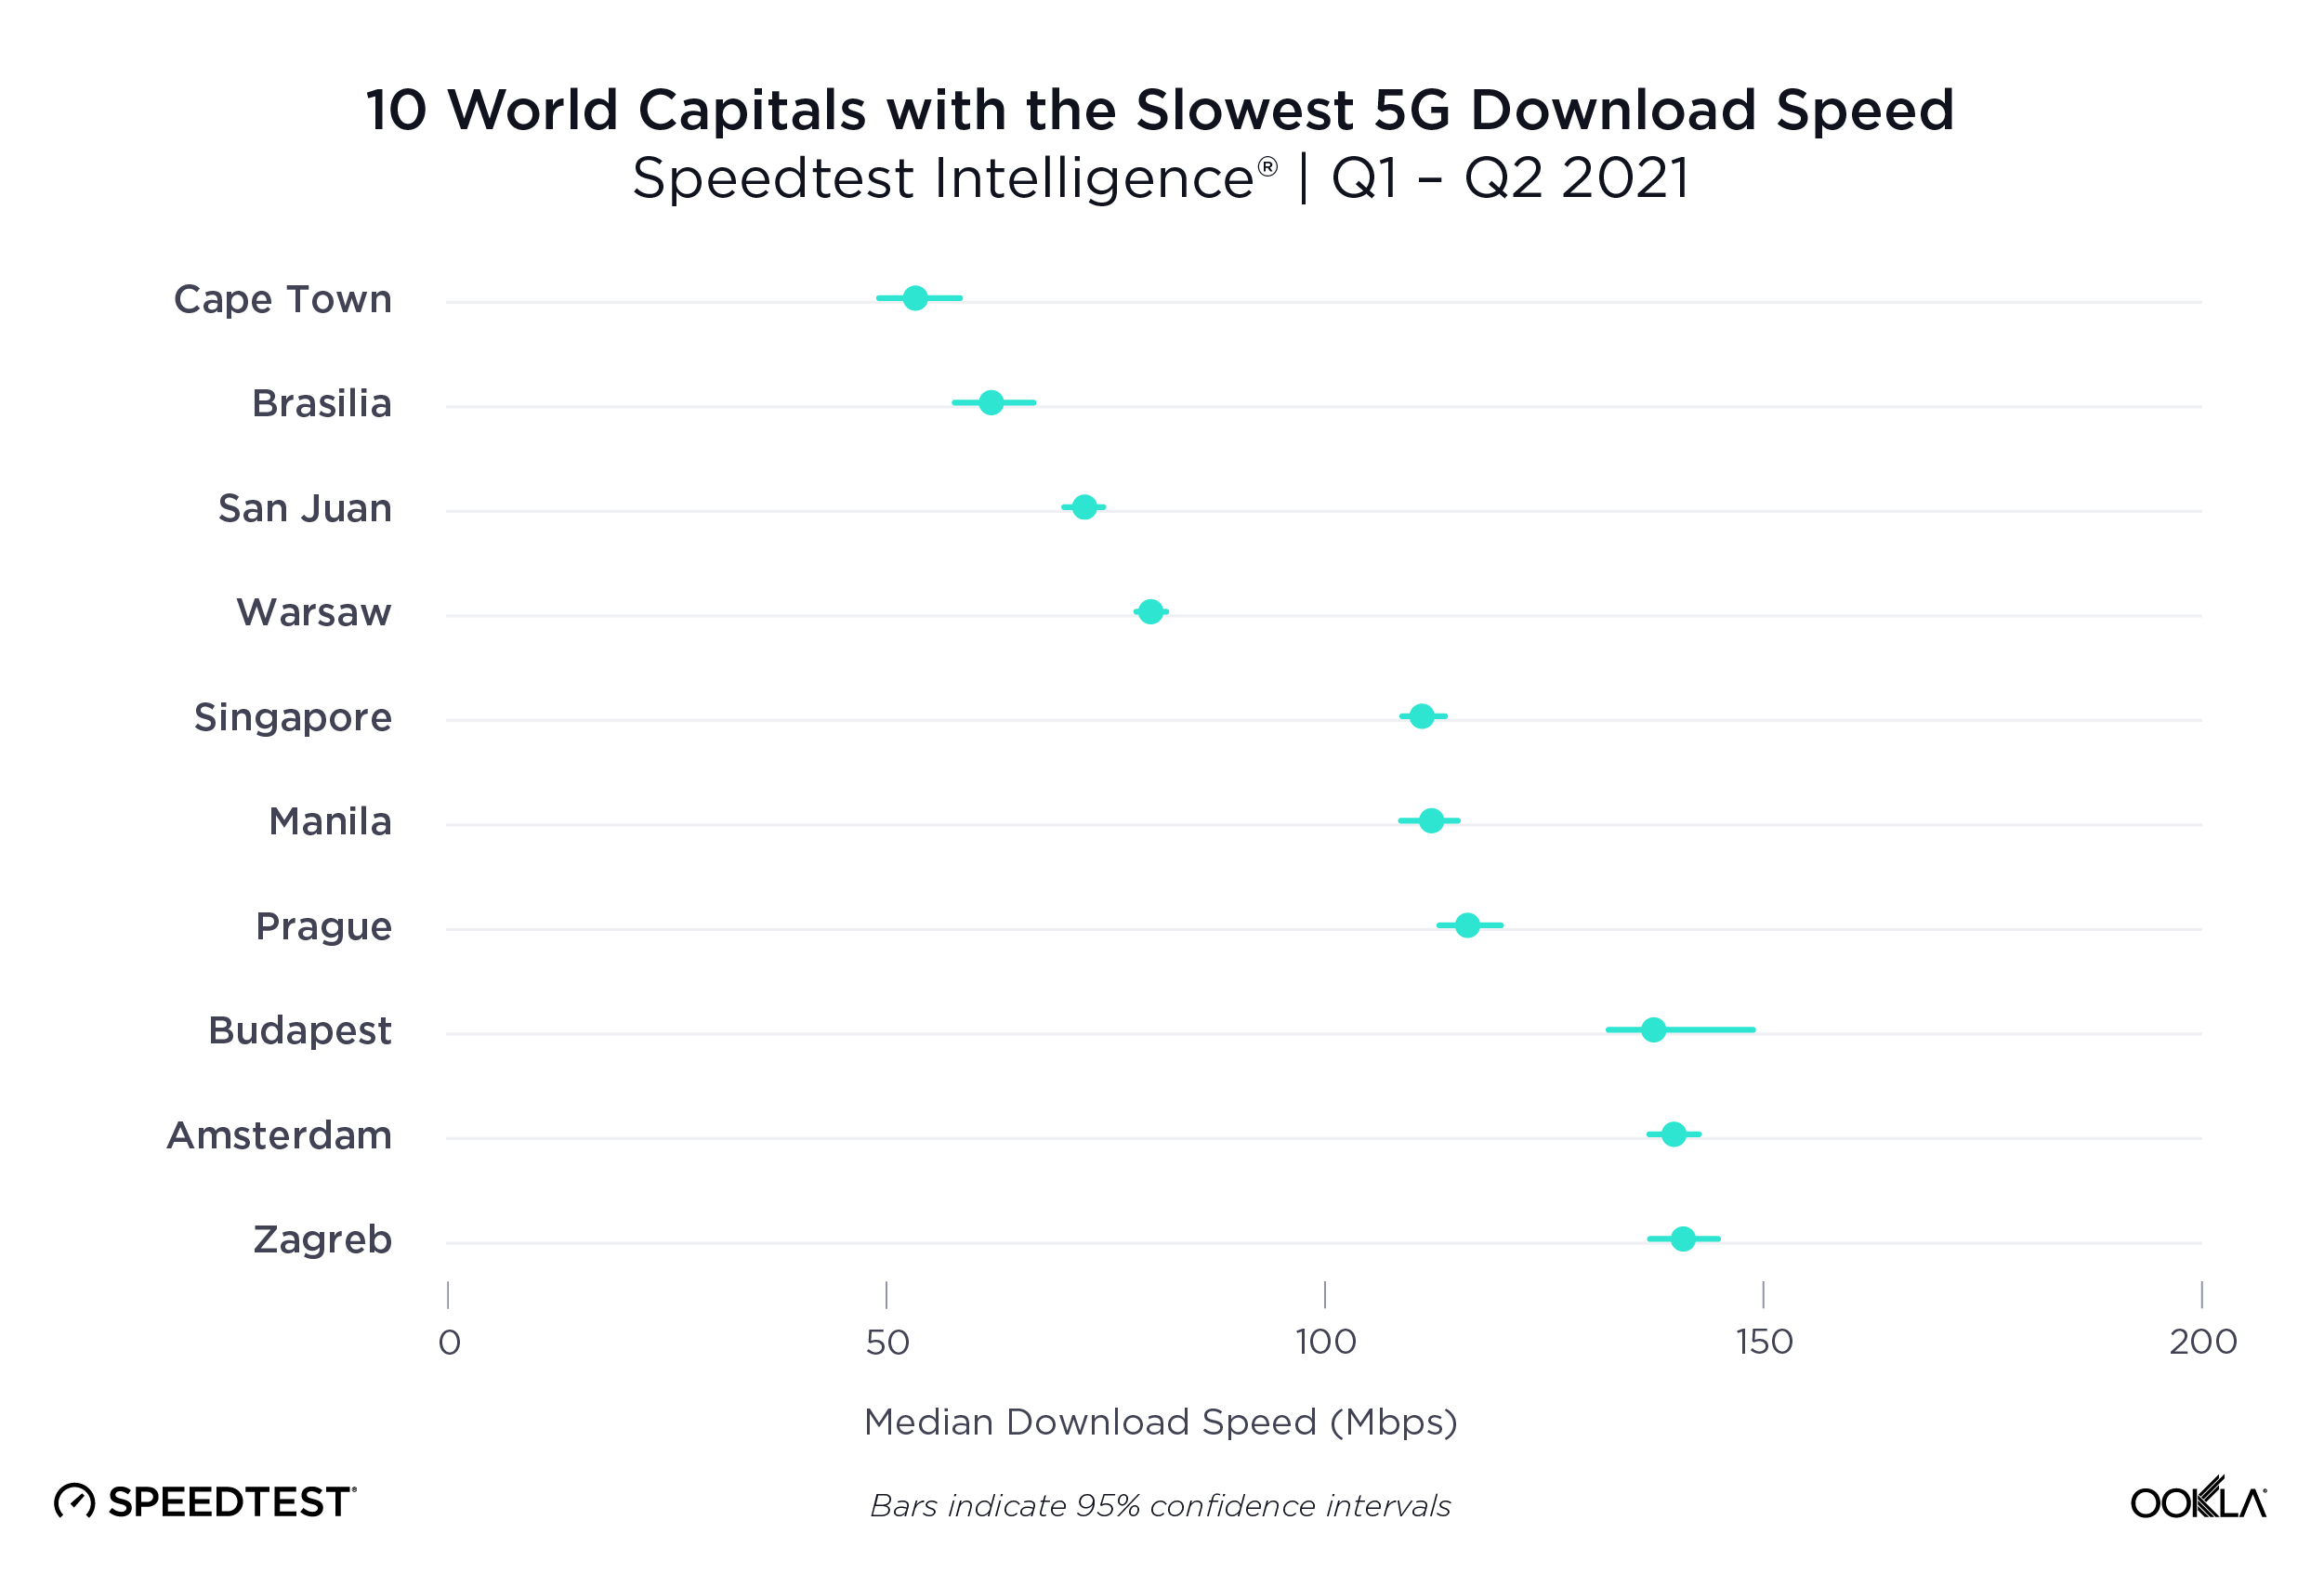
Speedtest Intelligence shows Capetown, South Africa had the slowest median download speed over 5G during Q1-Q2 2021 at 53.33 Mbps. Other world capitals with slower median 5G download speeds included: Brasilia, Brazil (62.18 Mbps); San Juan, Puerto Rico (72.59 Mbps); Warsaw, Poland (80.18 Mbps); Singapore (111.20 Mbps); Manila, Philippines (112.23 Mbps); Prague, Czechia (116.30 Mbps); Budapest, Hungary (137.54 Mbps); Amsterdam, Netherlands (139.75 Mbps); Zagreb, Croatia (140.92 Mbps); Vienna, Austria (144.93 Mbps); Jerusalem, Israel (145.17 Mbps); and Berlin, Germany (148.16 Mbps).

Capitals not mentioned on either of these lists did not have sufficient 5G samples during Q1-Q2 2021 to be included in this report.

The fastest 5G speeds are yet to come

5G is rapidly improving across the world and we’re eager to see how countries, cities and operators continue to perform during Q3 2021 and beyond. If you want to see how your 5G network performs against these benchmarks, please download the Android or iOS app, and take a Speedtest®. Learn more about 5G provider performance in select cities here, and visit the Ookla 5G MapTM to see which providers are offering 5G in your area.

Editor’s note: This article was updated on July 28 to reorganize the content for clarity.

Ookla retains ownership of this article including all of the intellectual property rights, data, content graphs and analysis. This article may not be quoted, reproduced, distributed or published for any commercial purpose without prior consent. Members of the press and others using the findings in this article for non-commercial purposes are welcome to publicly share and link to report information with attribution to Ookla.

| September 18, 2023

New Speedtest Data Shows Starlink Performance is Mixed — But That’s a Good Thing

Satellite providers are playing no small part in the rapid expansion of global connectivity. Some experts predict there will be 58,000 satellites orbiting the earth by 2030 — a nearly 725% increase from 2023. Ookla® is back with our ongoing satellite internet series with compelling, fresh data for satellite providers in Africa, Europe, and Oceania during Q2 2023, including SpaceX’s Starlink, Viasat, and Skylogic.

This analysis includes Starlink Net Promoter Score (NPS) data for France, Germany, Italy, New Zealand, and the United Kingdom, year-over-year data for satellite providers in Europe and Oceania from Q2 2022 to Q2 2023, and new Q2 2023 data from Starlink in Africa.

Starlink users across different continents continue to love the service

Using Speedtest Intelligence®, we examined NPS ratings data for Starlink users against an aggregate of all fixed broadband providers combined. 

NPS is based on Speedtest® user responses after being asked how likely they are to recommend their provider to friends or family on a 0 to 10 scale. NPS ratings are categorized into Detractors (score 0-6), Passives (score 7-8), and Promoters (score 9-10), and is calculated as (% Promoters – % Detractors) x 100. Any NPS score above 0 indicates that a provider’s audience is more loyal than not.
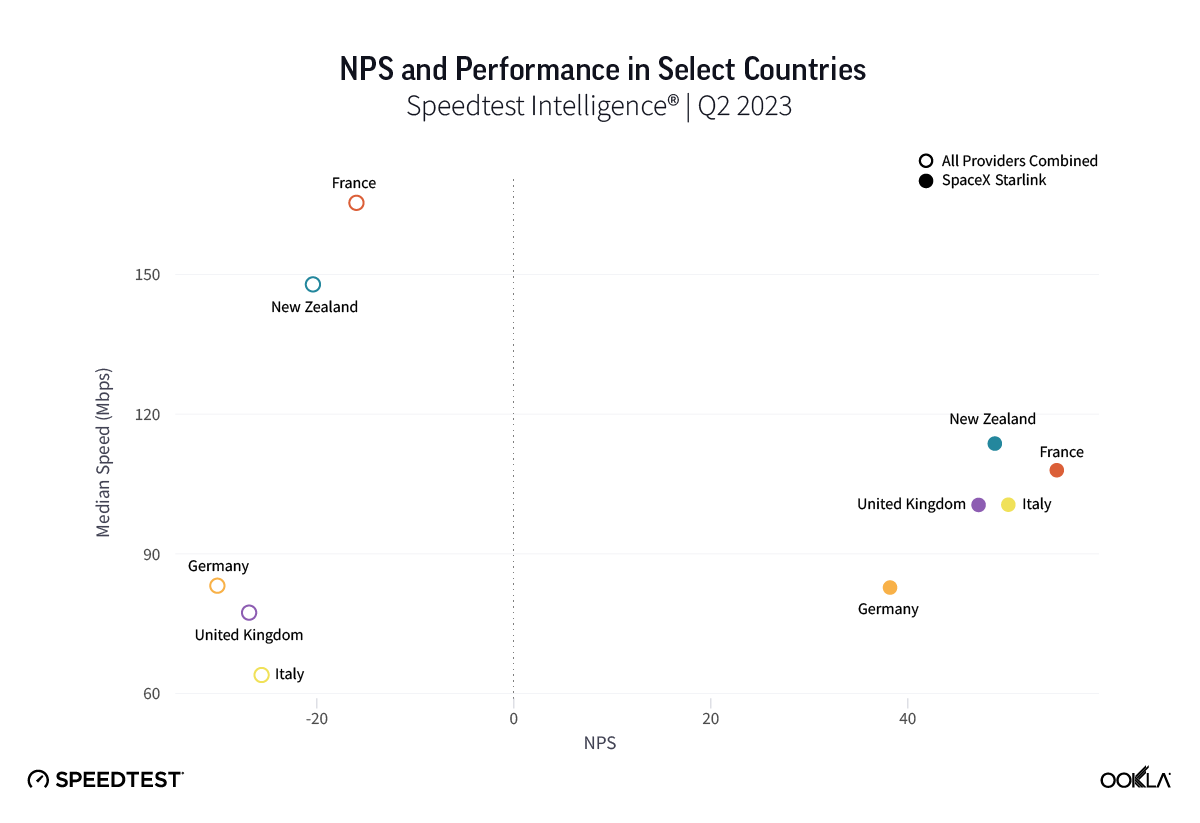
Chart of NPS Performance in Select Countries

As you can see from the above image, Starlink users in France, Germany, Italy, New Zealand, and the U.K. had an NPS score much higher than the aggregate score for all fixed broadband providers combined during Q2 2023. France had the highest NPS among the aggregate of fixed broadband providers for the countries we surveyed at -15.98 and fixed broadband providers had a much faster median download speed at 165.37 Mbps to Starlink’s 107.56 Mbps. In New Zealand there was a similar story with the aggregate of fixed broadband providers having a -20.40 NPS to Starlink’s 48.83, while having a faster median download speed 147.86 Mbps to 113.78 Mbps during Q2 2023.

Germany, which had the lowest NPS rating of aggregate of fixed broadband providers in Europe at -30.10, also had the smallest difference in NPS with Starlink scoring 38.19. Interestingly, the aggregate of fixed broadband providers and Starlink both had similar median download speeds at 83.16 Mbps and 82.56 Mbps, respectively, during Q2 2023.

Of note, Starlink had much higher NPS ratings and median download speeds than the aggregate of all fixed providers combined in Italy and the U.K., respectively, during Q2 2023. Starlink’s NPS was 50.20 to -25.61 for the aggregate of all fixed broadband providers in Italy during Q2 2023, while the median download speeds were 100.68 Mbps to 63.99 Mbps. In the U.K., Starlink’s NPS was 47.18 to -26.88 for the aggregate of all fixed broadband providers combined, with the median download speeds a little closer, 100.11 Mbps to 77.38 Mbps, respectively. 

In our last report, we found a wide NPS gap between U.S. rural Starlink users — who often have fewer options for fixed broadband access — and the corresponding aggregate of fixed broadband providers. Given that all five of these countries have rural or remote regions that are underserved or not served by traditional broadband offerings, it may be no surprise that Starlink users who reside in those areas may feel positive about having access to fast broadband internet. 

Starlink speeds over 100 Mbps in 14 European countries during Q2 2023, speeds stabilizing across Europe

Key takeaways:

  • Starlink results were the fastest among satellite providers we surveyed.
  • Starlink quarter-to-quarter speeds improved or remained about the same (between 5% and -5%) in 23 countries, while decreasing in 4 countries.
  • Among the 27 European countries we surveyed, Starlink had median download speeds greater than 100 Mbps in 14 countries, greater than 90 Mbps in 20 countries, and greater than 80 in 24 countries, with only three countries failing to reach 70 Mbps.
  • Skylogic, while delivering speeds slower than Starlink, showed stabilized broadband speeds over the past year for those seeking a Starlink alternative.

Over the past year, we’ve seen huge developments in the global satellite market, Europe notwithstanding, with Amazon’s Project Kuiper moving forward, the EU creating its own satellite constellation, and OneWeb and Eutelsat merging. While Starlink continues to lead for performance among satellite providers we surveyed, Starlink has experienced some major hurdles over the past year as users flock to the service and speeds have subsequently dipped — but of note those concerns seem to have started allaying in most of Europe during Q2 2023.

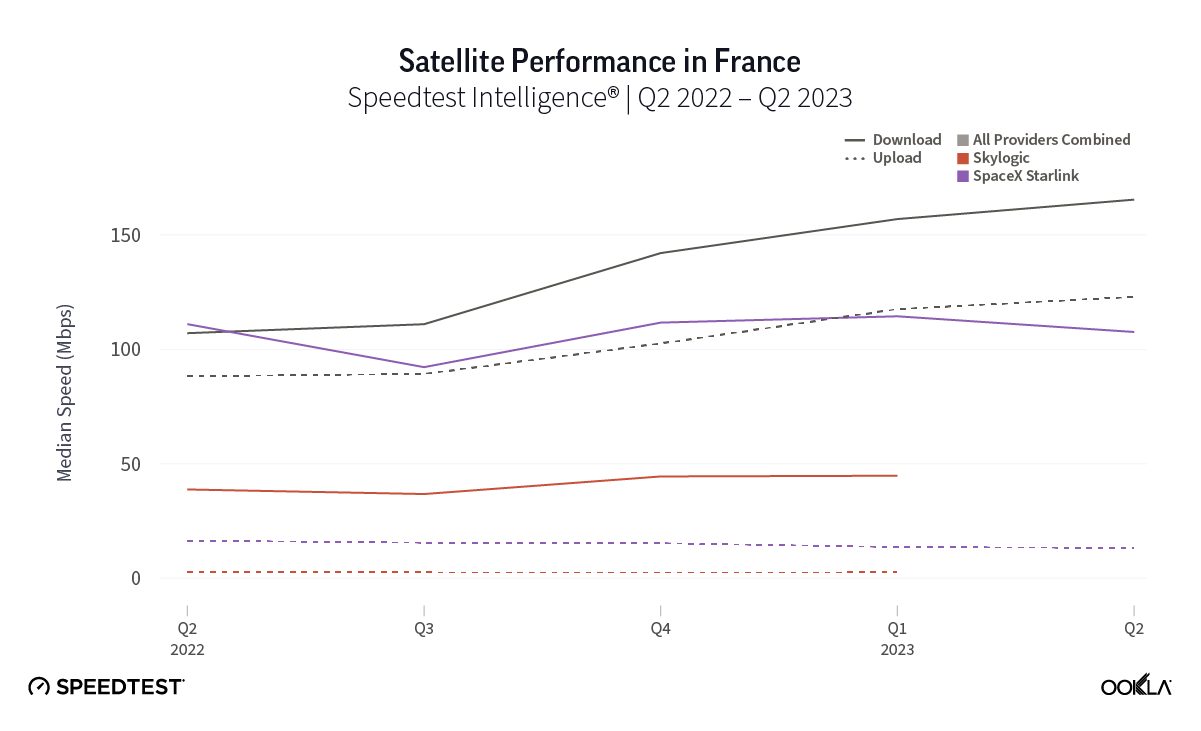
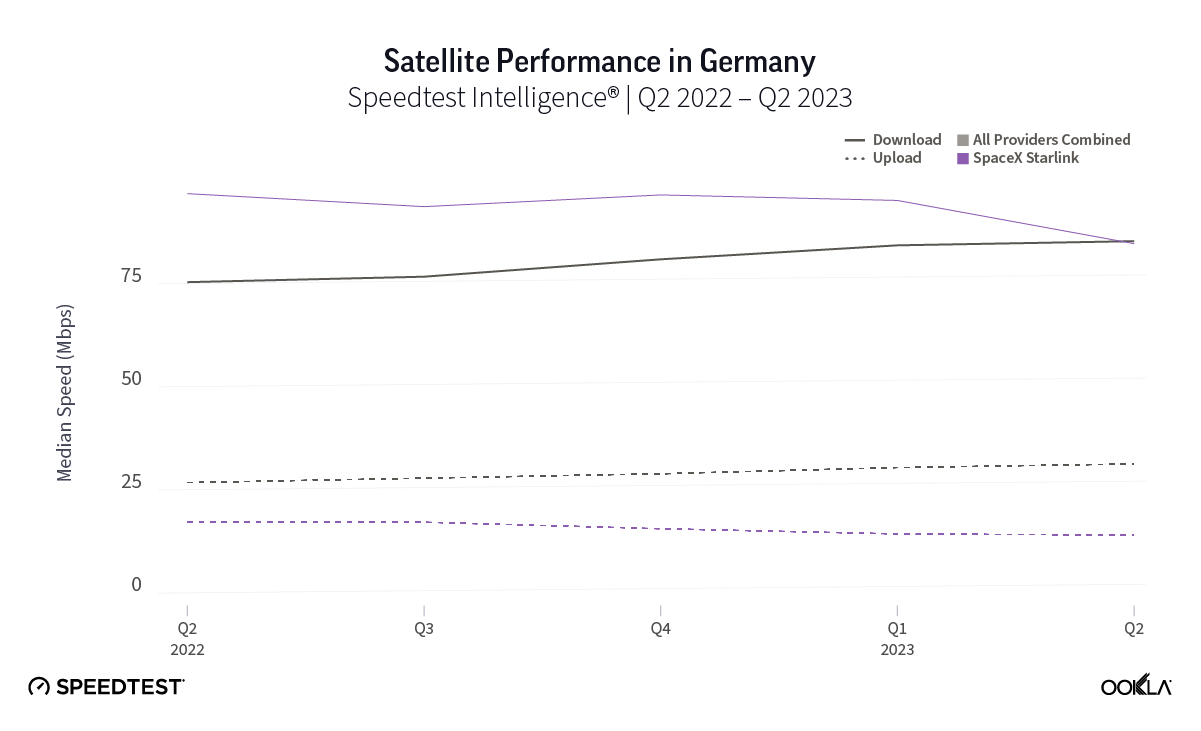
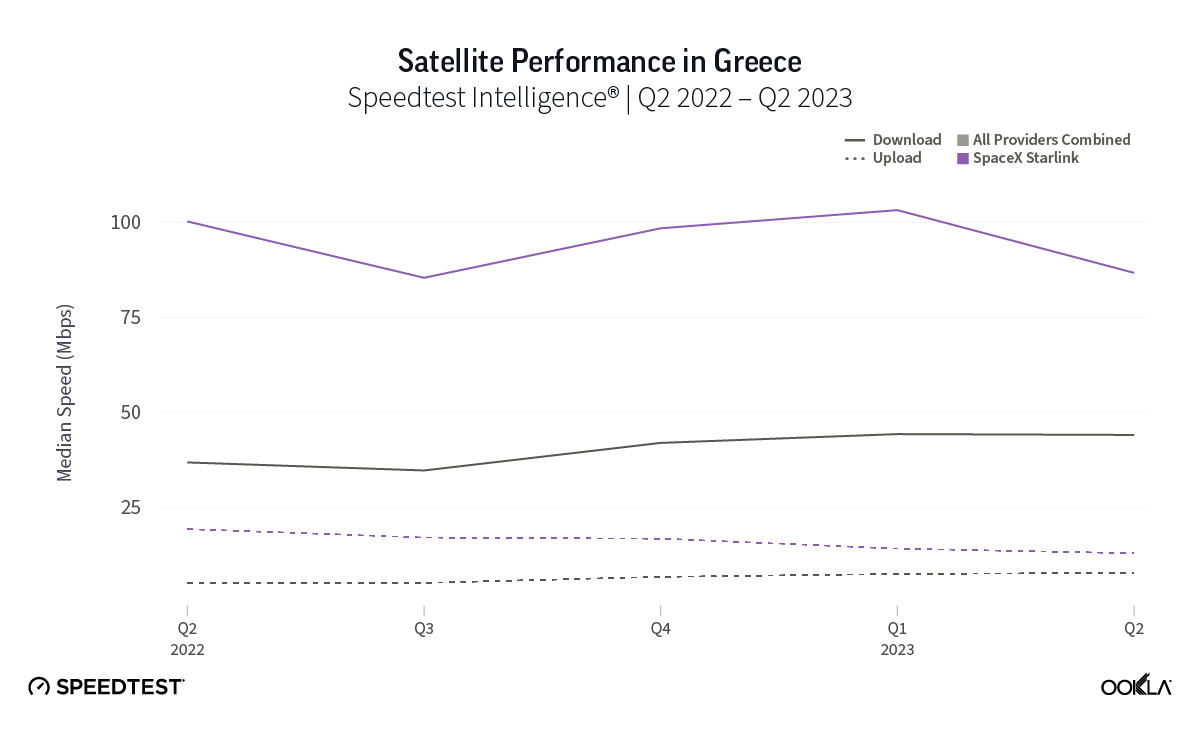
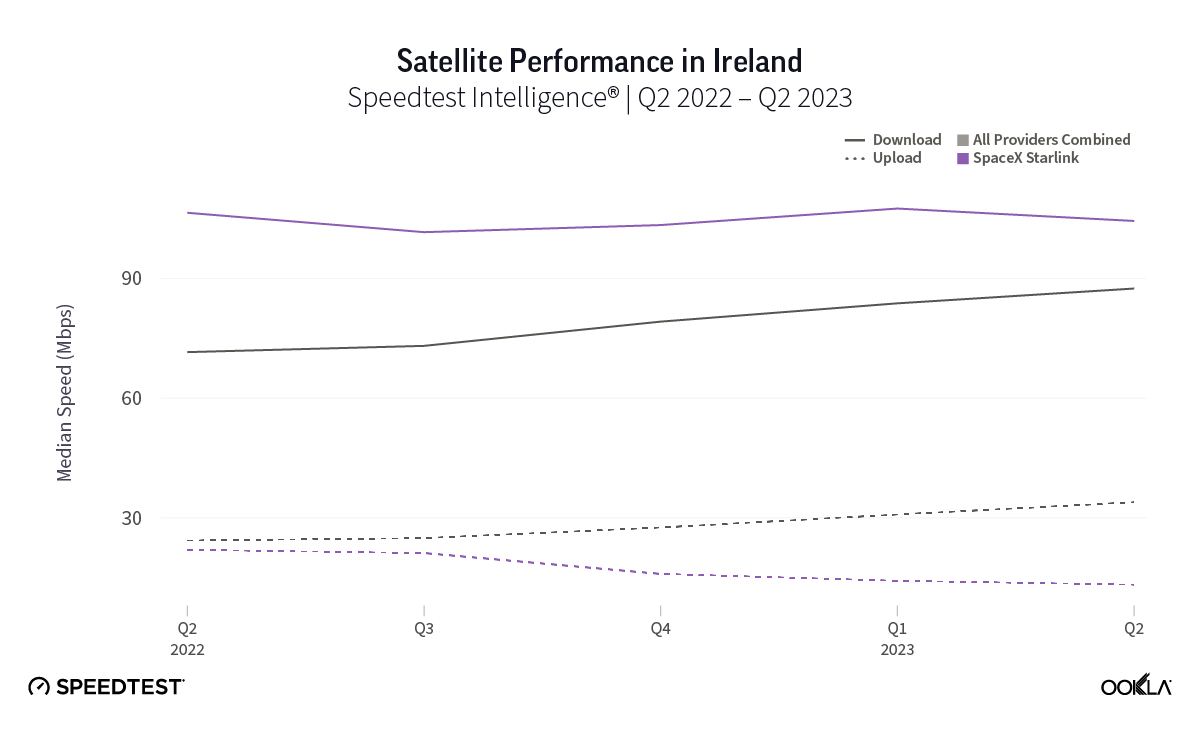
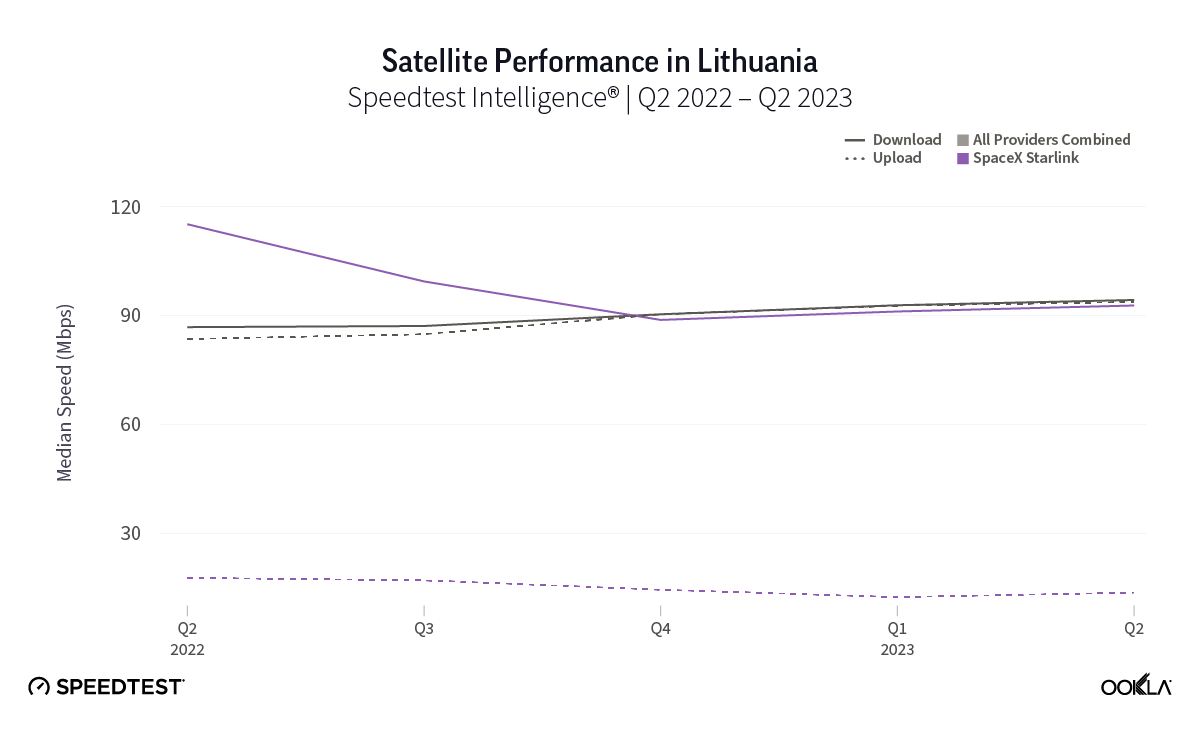
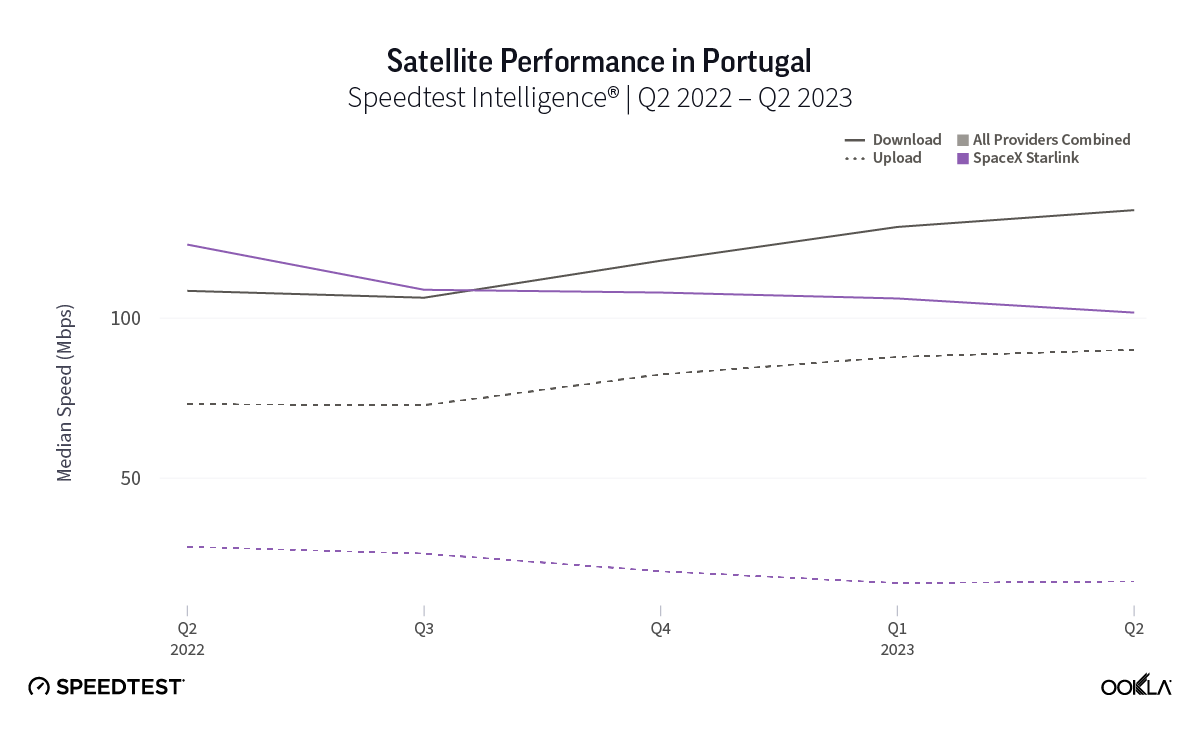
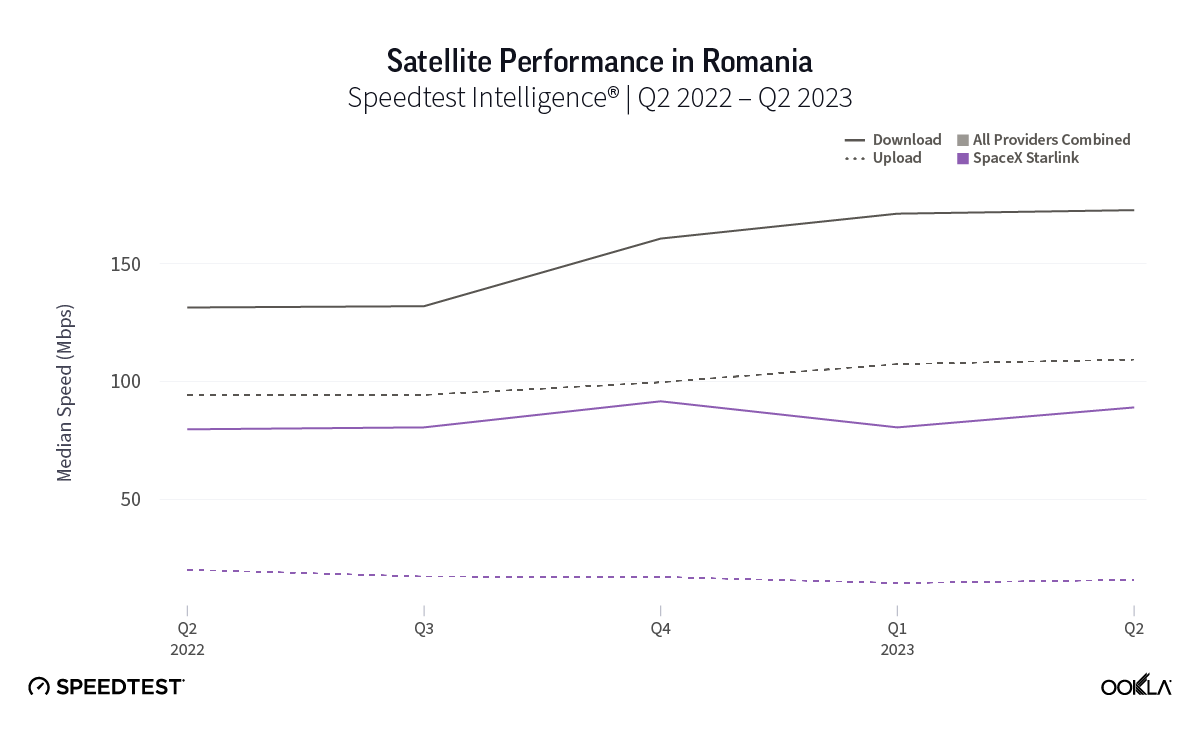
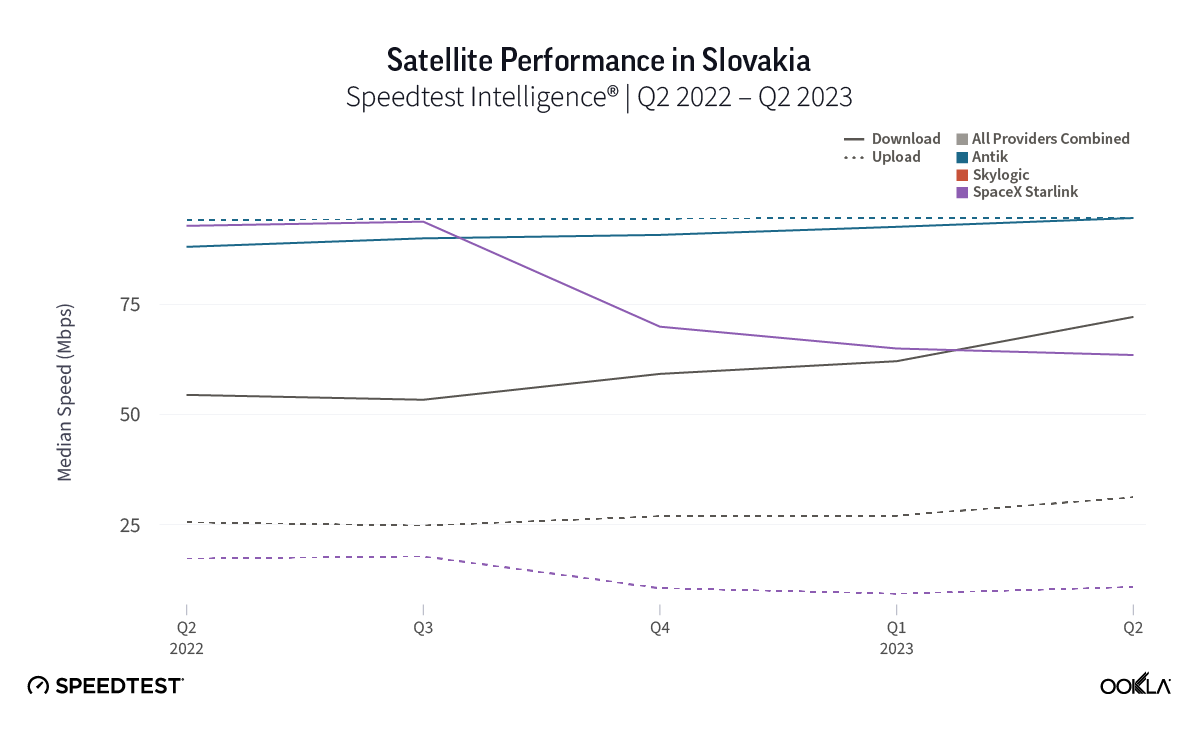
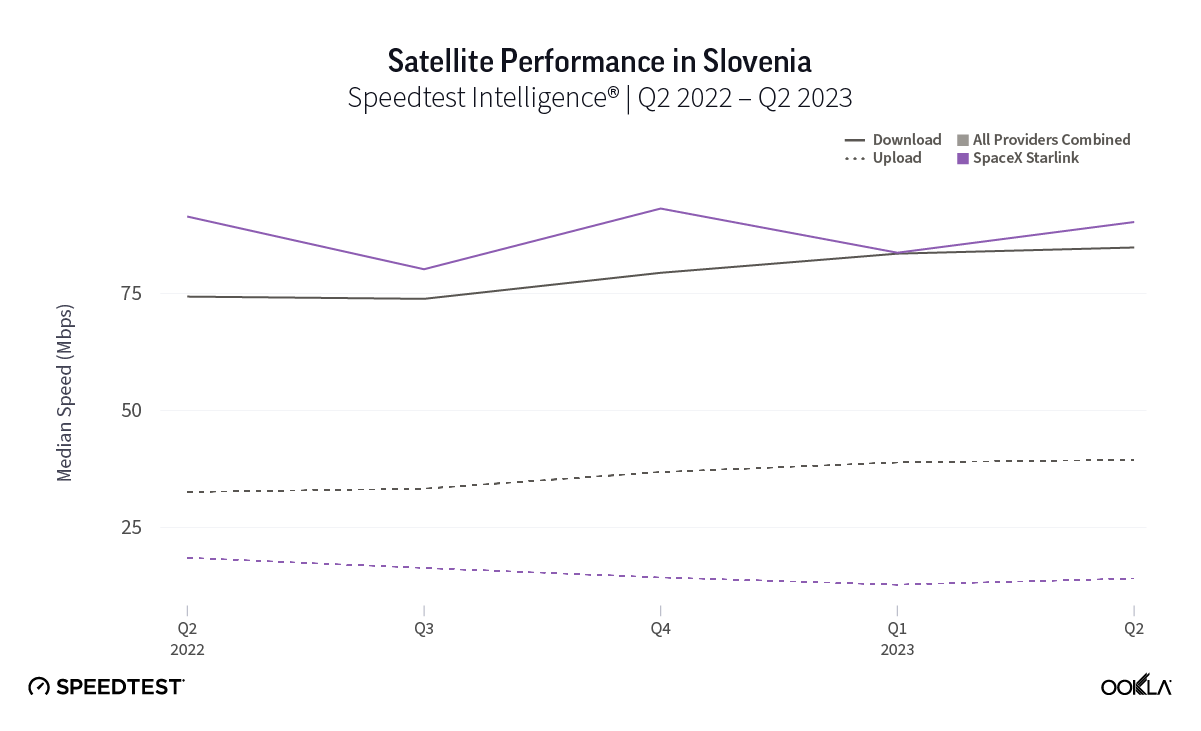
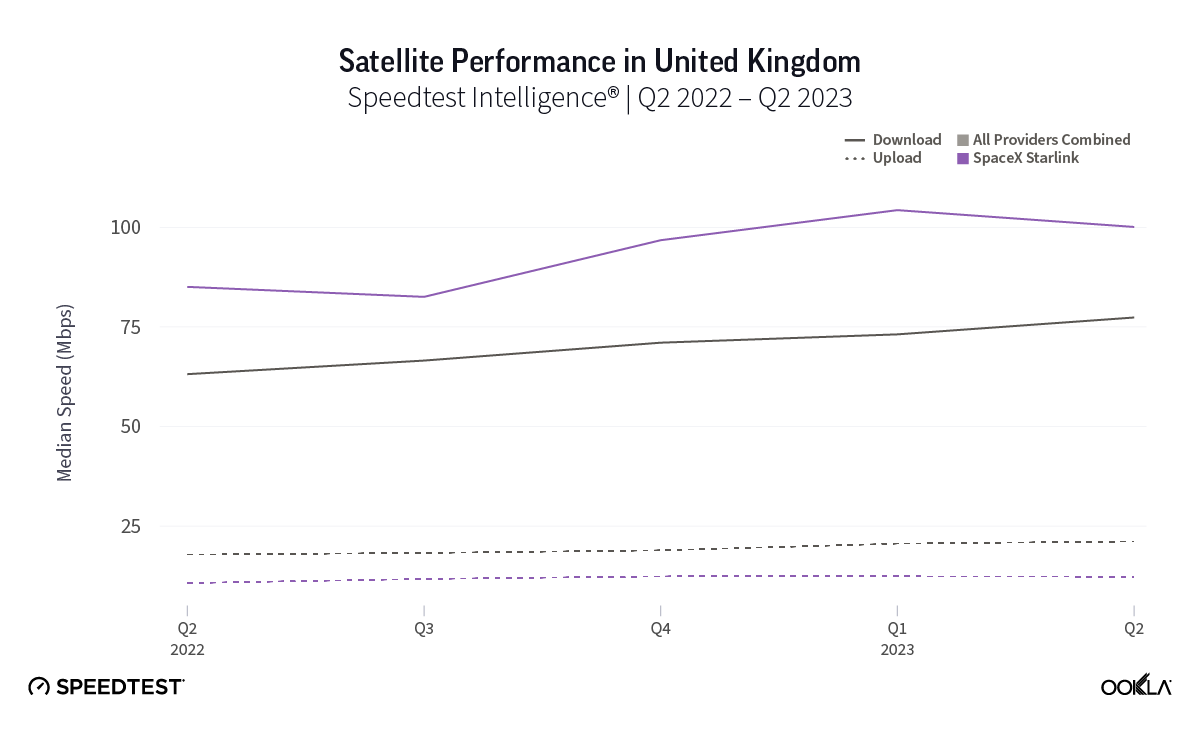
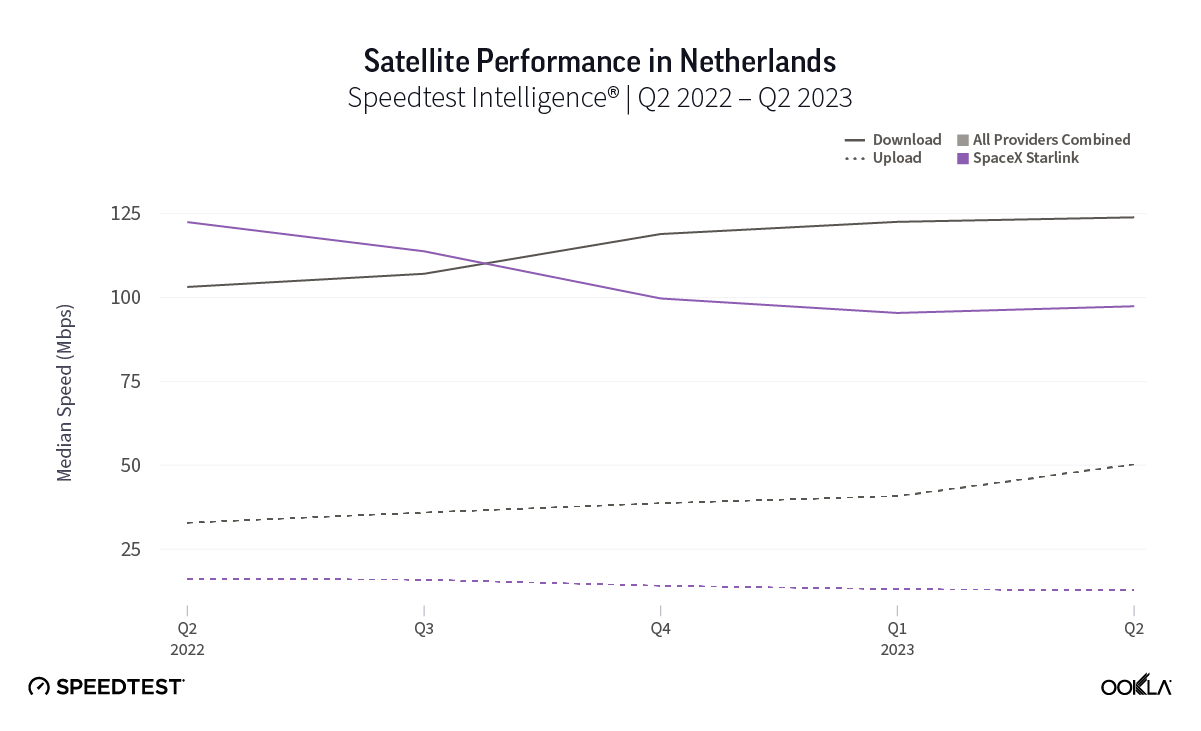
At first glance, year-over-year median download speeds for Starlink are about the same (-5% to 5%) or better (greater than 5%) from Q2 2022 to Q2 2023 in 15 countries and slower (decreasing more than 5%) in 8 countries. But among the 27 countries we surveyed during Q2 2023, Starlink had speeds faster than the aggregate of all fixed broadband providers combined in 11 countries (Austria, Belgium, Bulgaria, Croatia, Czechia, Estonia, Greece, Ireland, Italy, Latvia, and the U.K.) Those speeds were most notably faster in Croatia and Greece for Starlink at 94.41 Mbps to 45.24 Mbps and 108.97 to 44.09 Mbps, respectively, during Q2 2023. Speeds were about the same in four countries (Finland, Slovenia, Germany, and Lithuania), and speeds were slower than the aggregate of fixed broadband providers in 12 countries, most notably in Poland, Spain, Romania, Denmark, and France which saw between 50% and 105% faster aggregate fixed broadband speeds than Starlink.

Quarterly download speeds stabilizing or improving

Looking at results from Q1 2023 to Q2 2023, median download speeds for Starlink remained about the same (between 5% and -5%) in 23 countries, while decreasing in four countries. That’s a big deal, especially given Starlink had median download speeds greater than 100 Mbps in 14 countries, and greater than 90 Mbps in 20 countries, and greater than 80 in 24 countries — with only three countries failing to reach 70 Mbps.

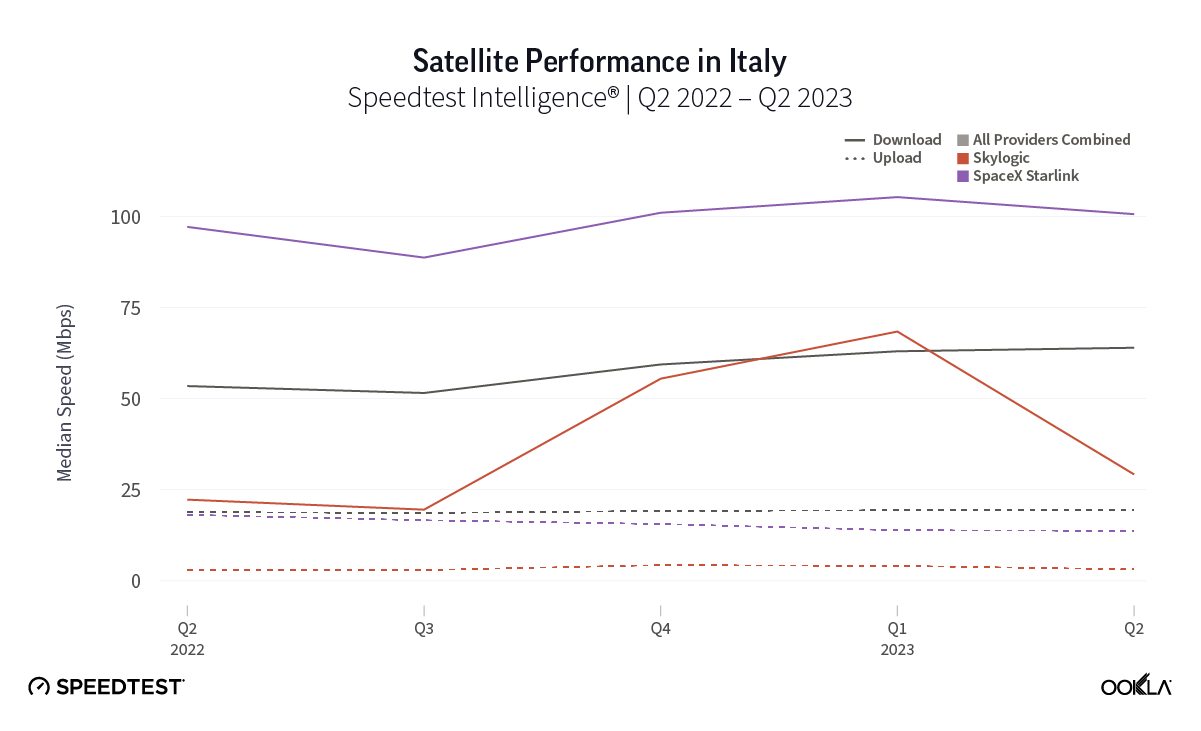
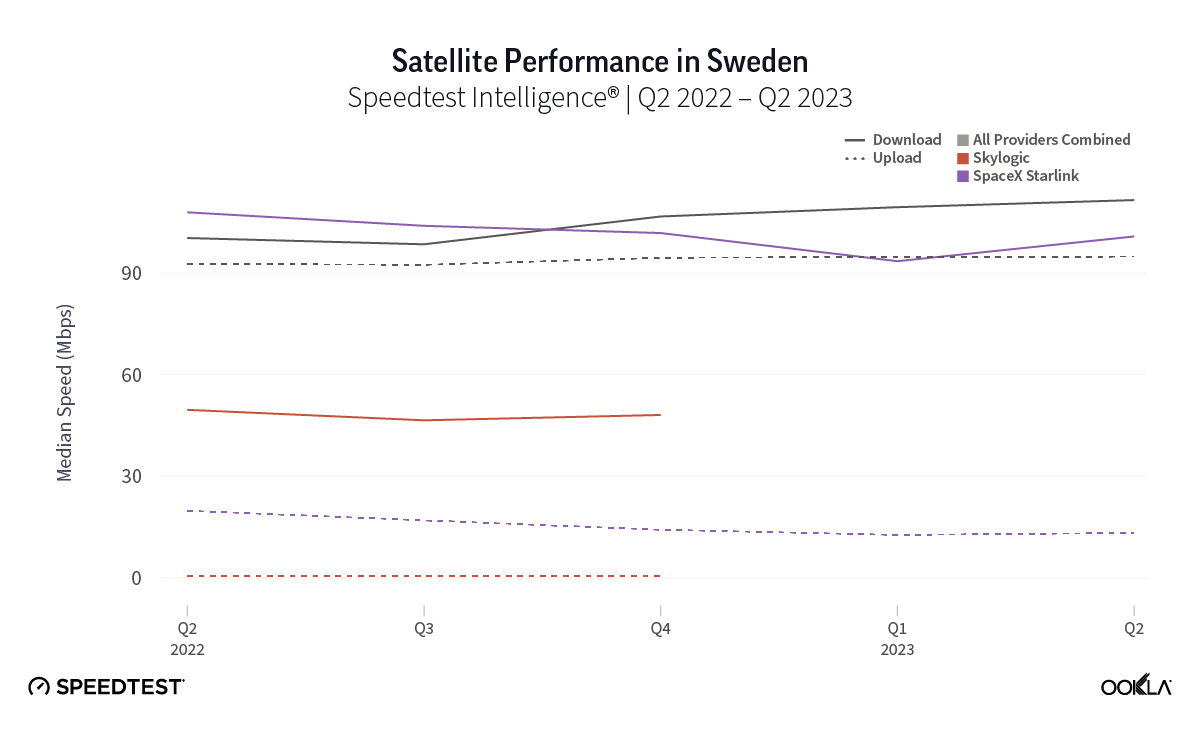
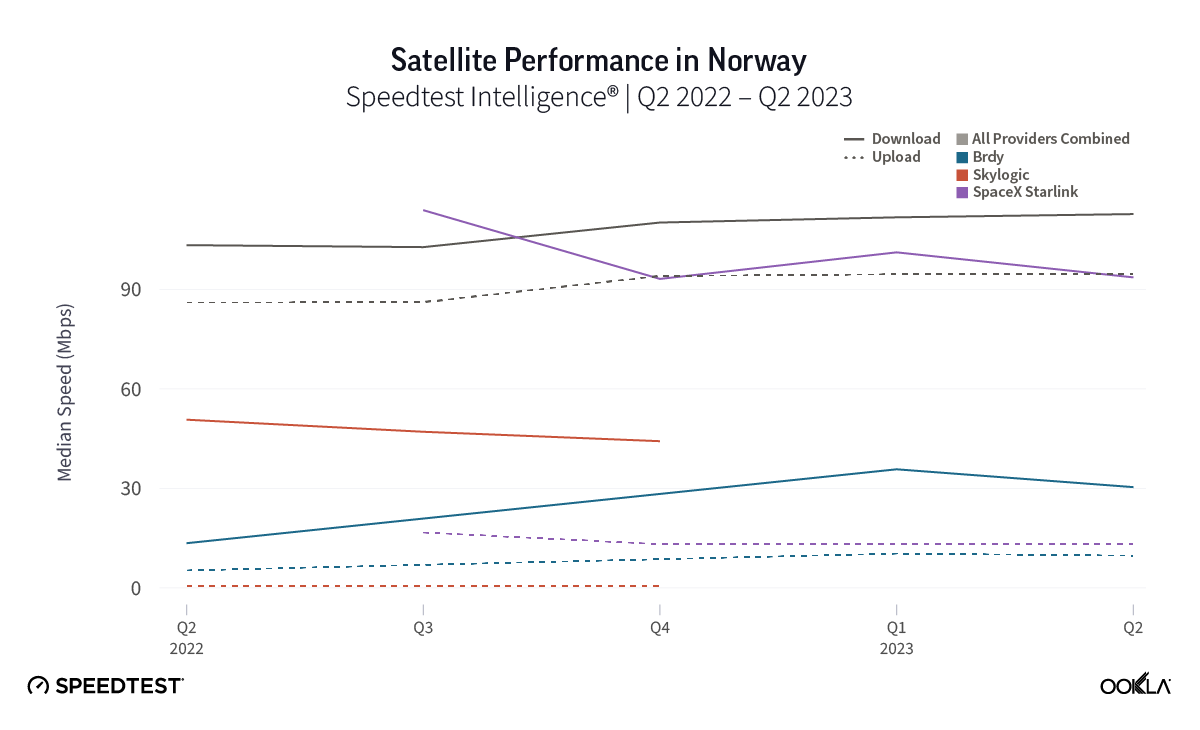
While trailing Starlink speeds, Skylogic recorded median download speeds in Italy at 29.21 Mbps during Q2 2023, a roughly 27% statistical increase year-over-year from 22.28 Mbps during Q2 2022. Notably, Skylogic recorded a median download speed of 68.44 Mbps in Italy during Q1 2023. Among the various countries we recorded Skylogic data for during the past year, the range of median download speeds varied between 19.53 Mbps and 68.44 Mbps, with most speeds between 28 and 50 Mbps, all fast enough to stream 4K video online. Viasat, had relatively similar download speeds in Germany and Italy at 17.22 Mbps and 17.45 Mbps, respectively, during Q2 2023. 

Top 10 fastest Starlink download speeds in European countries
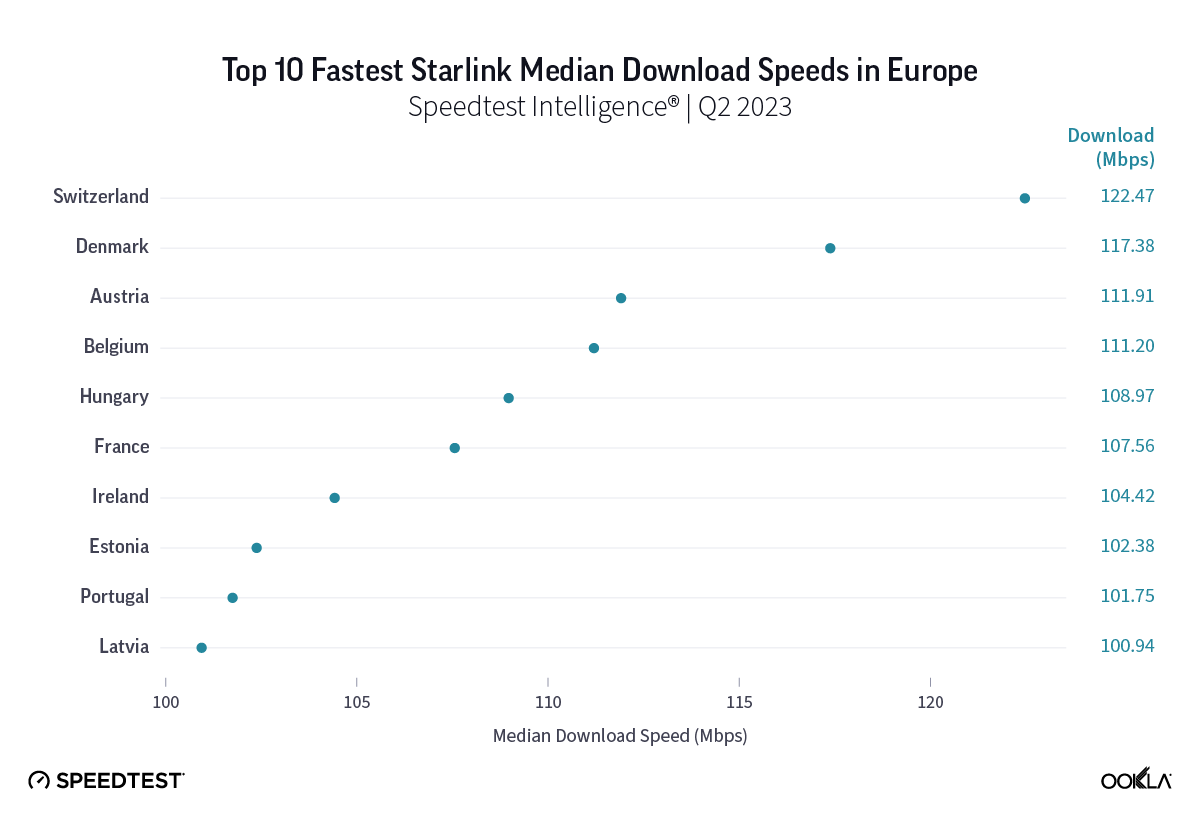
Chart of Top 10 Fastest Starlink Median Download Speeds in Europe

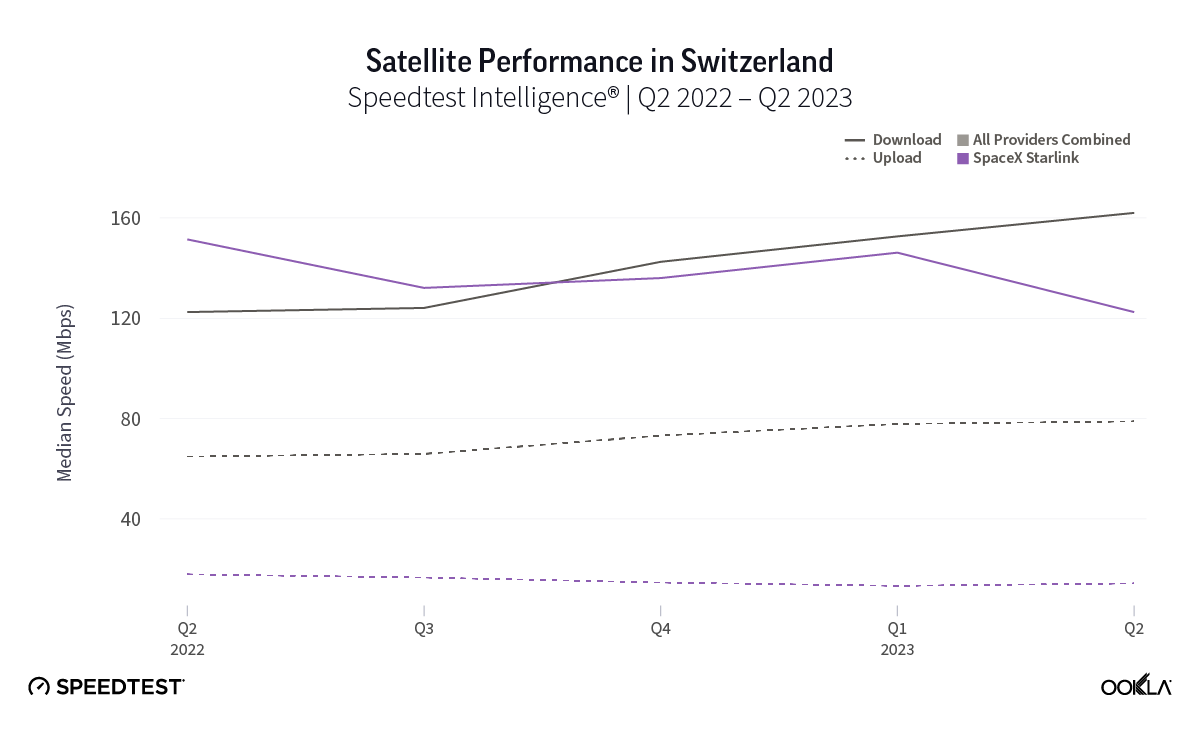
Starlink in Switzerland had one of the fastest median download speed among countries with Starlink during Q2 2023 at 122.47 Mbps, followed by Denmark (117.38 Mbps), Austria (111.91 Mbps), Belgium (111.20 Mbps), Hungary (108.97 Mbps), France (107.56 Mbps), Ireland (104.42 Mbps), Estonia (102.38 Mbps), Portugal (101.75 Mbps), and Latvia (100.94 Mbps). Sweden, Italy, Bulgaria, and the U.K. all followed but had speeds greater than 100 Mbps.

Upload speeds for Starlink are down year over year, but quarterly speeds almost all improved or were about the same

Upload speeds for Starlink mostly decreased notably year over year, with only the U.K. showing an improved median upload speed in Q2 2023 out of 27 countries surveyed. However, looking quarter to quarter, Q2 2023 upload speeds for Starlink stayed about the same or improved in 25 out of 27 countries, with only Greece and Ireland showing declines. For upload speeds, Starlink all 27 countries we surveyed had upload speeds between 10 Mbps and 15 Mbps except Portugal (17.70 Mbps), Hungary (16.91 Mbps), Croatia (16.12 Mbps), Bulgaria (15.93 Mbps), Romania (15.82 Mbps), Spain (15.79 Mbps), and Poland (9.11 Mbps). Starlink in Greece was the only instance of a satellite provider in Europe having an upload speed greater than the aggregate of all fixed providers combined, 12.97 Mbps for Starlink to 7.85 Mbps for the aggregate of fixed broadband providers combined. Skylogic showed upload speeds lower than 4 Mbps in both Austria and Italy during Q2 2023. Viasat had upload speeds of 3.51 Mbps in Germany and 4.69 Mbps in Italy during Q2 2023. 

Multi-server latency is stabilizing for Starlink users across Europe

As an low-earth orbiting (LEO) satellite internet provider, Starlink has a leg up on some satellite competitors who rely on further away geosynchronous-earth orbit (GEO) and medium-earth orbit (MEO) satellite constellations. However, once again, all the aggregates of all fixed broadband providers in Europe had much lower multi-server latencies than Starlink, Viasat (which had latencies over 600 ms) and Skylogic (which had latencies over 700 ms). That being said, Starlink still saw multi-server latencies under 60 ms in the U.K. (51.26 ms), Spain (53.37 ms), Portugal (55.84 ms), and Belgium (59.34 ms). Starlink saw most countries’ multi-server latencies between 60 and 90 ms.

Starlink speeds stabilize in Oceania

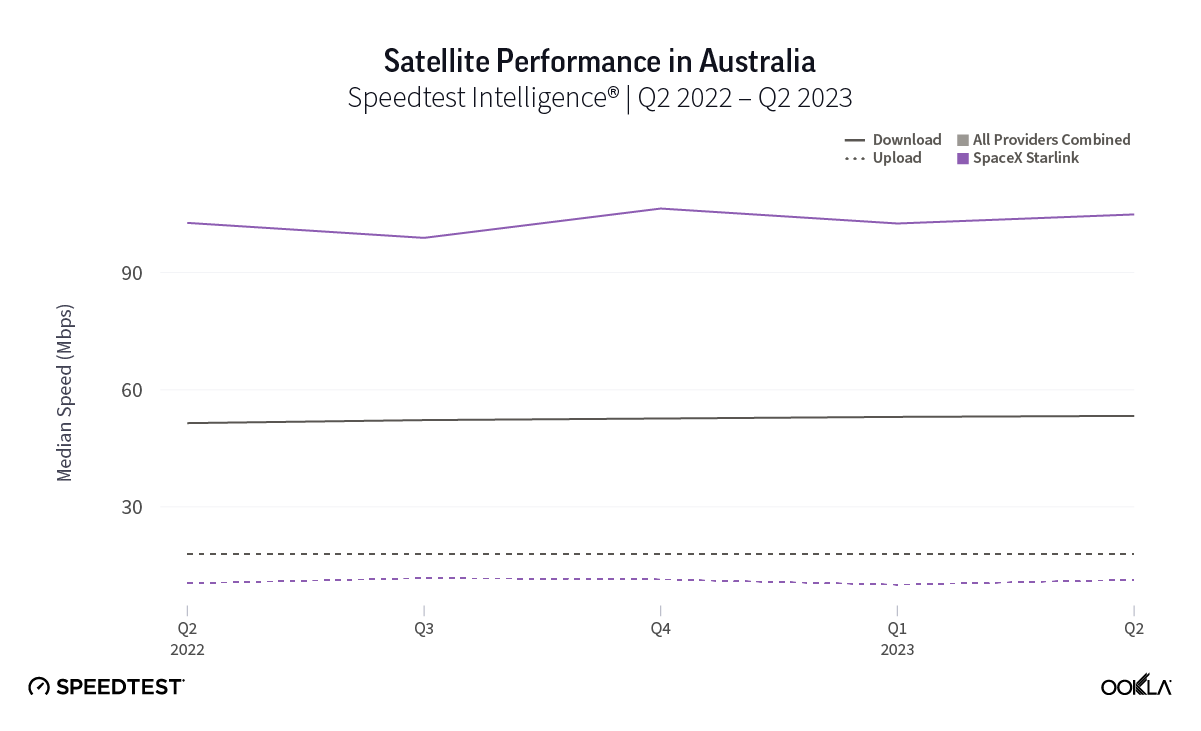
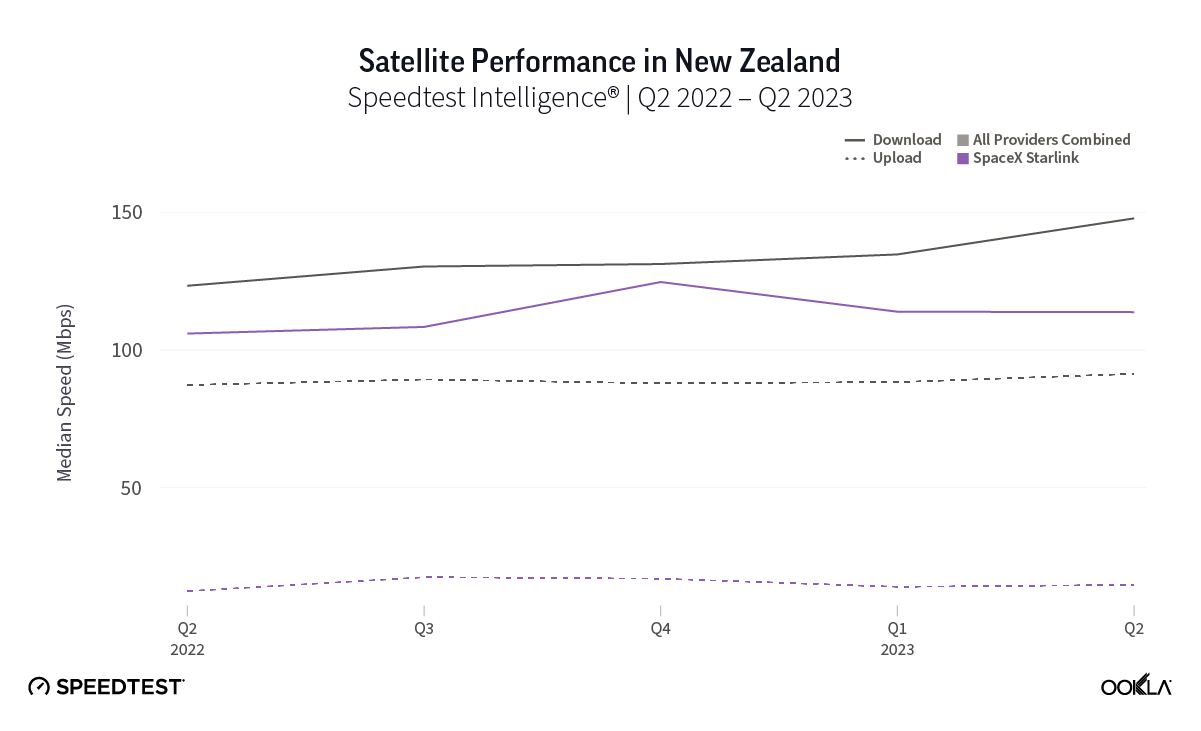
Oceania, the second least densely populated continent in the world to Antarctica, has rural and remote populations that benefit from (and even rely on) satellite internet connections. Luckily for rural and remote Starlink users, they’ve probably seen a good amount of stability over the past year with Q2 2023 median download speeds in New Zealand at 113.78 Mbps (105.99 Mbps in Q2 2022) and Australia at 104.92 Mbps (102.76 Mbps in Q2 2022). Tonga, which is very remote, saw download speeds drop from 45.25 Mbps in Q2 2022 to 37.95 Mbps in Q2 2023. 

Upload speeds also showed some stability with Australia going from 10.45 Mbps in Q2 2022 to 11.33 Mbps during Q2 2023 and New Zealand going from 12.31 Mbps to 14.62 during the same time period. Tonga saw a notable drop in speeds year over year from 19.26 Mbps in Q2 2022 to 6.66 Mbps Q2 2023. 

Multi-server latency, which usually will be higher for satellite internet options, showed promising results for Starlink in Oceania during Q2 2023. Multi-server latency dropped noticeably in New Zealand year over year, going from 89.38 ms in Q2 2022 to 46.42 ms in Q2 2023. Australia saw a more modest drop with multi-server latency going from 63.04 ms to 59.78 ms from Q2 2022 to Q2 2023. Tonga saw an increase in multi-server latency from 125.24 ms to 137.16 ms during the same time period.

Starlink in Africa is off to a promising start
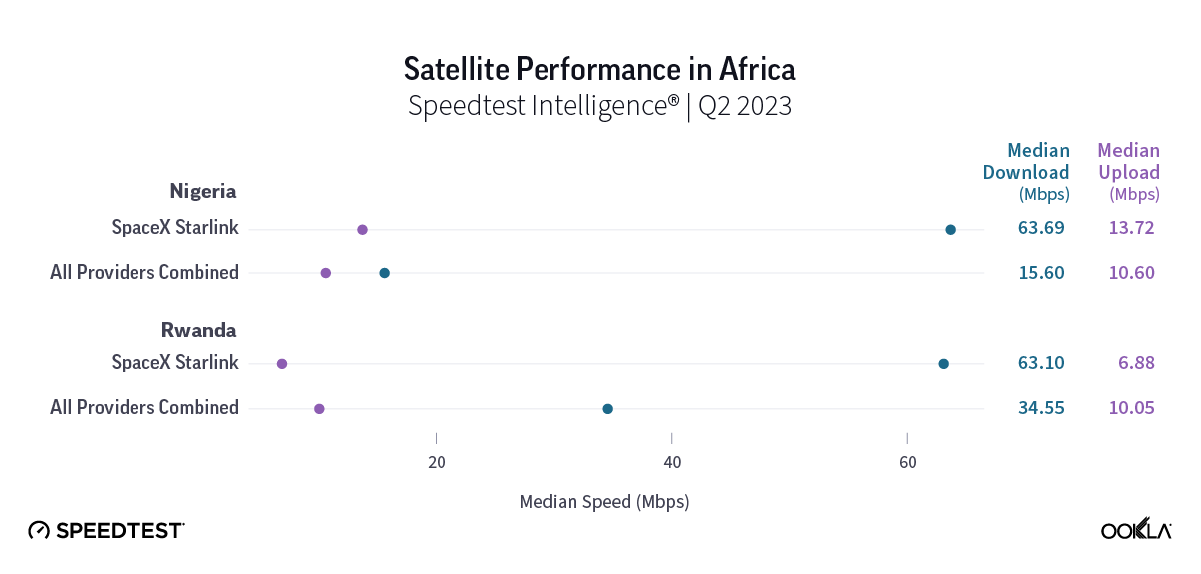
Chart of Satellite Performance in Africa, Q2 2023

Starlink, which first launched on the African continent in Nigeria this past January, is showing intriguing early results. Speedtest Intelligence showed that Starlink in Nigeria had a faster median download speeds than all aggregate fixed broadband providers combined at 63.69 Mbps to 15.60 Mbps during Q2 2023. Upload speeds were more similar during the same time period with Starlink at 13.72 Mbps and the aggregate of all fixed broadband providers combined at 10.60 Mbps. Starlink did have a marginally higher multi-server latency at 55.88 ms to 50.26 ms during Q2 2023.

In Rwanda, median download speeds were a little closer with Starlink recording a median download speed at 63.10 Mbps in Q2 2023 compared to the aggregate of all fixed broadband providers combined at 34.55 Mbps. Starlink trailed behind for median upload speed at 6.88 Mbps to 10.05 Mbps for fixed broadband providers during Q2 2023. Multi-server latency for Starlink was much higher at 320.45 ms to 29.04 ms for fixed broadband providers during the same time period.

The 2023 space revolution is off to a huge start

Here are some major updates about what’s next for various different satellite competitors:

After delays, Amazon’s Project Kuiper aim to launch prototype satellites this fall

Facing a series of rocket-related delays, Amazon recently announced it could send its first two Project Kuiper prototypes into orbit in late September. That news follows a recently announced $120 million 100,000-square-foot satellite processing facility at NASA’s Kennedy Space Center in Florida. Planning on offering internet service in 2025, Amazon is slated to have half of its 3,236 LEO satellite constellation in space by 2026.

China’s grand ambitions to provide internet connectivity to over 362 million people

According to the Wall Street Journal, over 362 million people in China don’t have access to the internet — which is about 1 in every 4 people in China, a large portion of which live in rural or remote communities. In order to overcome that connectivity gap, China is looking to the sky to create its own satellite constellation with potentially over 12,000 satellites. China’s biggest gap seems to be with recreating the success of SpaceX’s reusable rockets — however, initial tests are far underway and a host of reusable rockets are slated for test launches in 2024. 

SpaceX’s Starlink service offerings are about to rapidly expand

While Starlink continues to lead among satellite providers in most areas of the world, their expansion is only starting. Looking at the Starlink availability map, Starlink has an incredibly busy rest of 2023 and 2024 in Africa, Asia, and South America — and they’re marking their intent to expand into most of the world. That comes as Starlink marked launching over 5,000 satellites into space at the end of August. With some wiley entrepreneurs already renting out their Starlink “Dishy McFlatfaces” to vacationers and campers for $25-30 dollars a day, satellite connectivity is truly becoming a full-time gig.

Viasat’s bad luck might affect entire industry

Viasat launched the first of its three long-awaited Viasat-3 arrays — but then their first satellite suffered an antenna anomaly, which prevented a large reflector to deploy that affects whether or not the satellite can operate as intended. While Viasat is rushing to solve the issue, this could ultimately trigger a $420 million insure claim for the loss of the $700 million satellite. With such a high-value loss, this could send ripples through the satellite industry, causing insurance premiums to skyrocket for companies looking to mitigate potential losses through insurance. All of this comes on the heels of acquiring Inmarsat in May for $7.3 billion to expand its satellite arrays and spectrum holdings. We’ll be watching to see whether or not Viasat can find a solution. 

Eutelsat and OneWeb merger imminent, big moves abound

The Eutelsat and OneWeb merger should make competitors take notice — combining satellite networks, expanding enterprise offerings, and competing in emerging markets has big revenue potential — with OneWeb having an already established LEO network of 630 satellites and Eutelsat offering 36 GEO satellites. Of note, OneWeb recently inked a deal with Telstra in Australia to provide satellite backhaul for locations “where satellite backhaul is a preferred or only viable option.” OneWeb is also partnering with the European Space Agency to develop a next-gen 5G beam-hopping satellite, which could quickly increase connectivity for people traveling or for disaster areas that need emergency connectivity. Shareholders are set to vote on approving the merger on Sept. 28.

European Union greenlights multi-orbit constellation

With grand ambitions to launch a multi-orbit, €6 billion constellation in 2024, the European Union is partnering with a consortium of industry players including Airbus, SES, Eutelsat, Hispasat, and Thales to develop the EU’s IRIS² project. The EU still expects to have the first of its satellites go live by the end of 2024 and have a fully operational constellation by 2027.

HughesNet aiming to launch Jupiter 3 array in Q2 2023

HughesNet successfully launched its Jupiter 3 array on July 29, which aims to provide U.S. and Latin America consumers with higher broadband download speeds. While the actual satellite will take some time to reach its geosynchronous orbit and deploy, this satellite adds 500 Gbps of Ka-band capacity for HughesNet, which could see consumers reaching download speeds between 50 Mbps and 100 Mbps. We’ll be eagerly awaiting Speedtest® results from HughesNet’s Jupiter 3 array.

Ookla will continue monitoring new satellite internet developments

2023 continues to be an important year for satellite internet providers. Satellite connectivity is something we’ll be watching closely and we’ll continue our series next quarter with Q3 2023 data from select continents including North America. In the meantime, be sure to download the Speedtest app for Windows and Mac computers or for iOS or Android for devices and see how your satellite internet stacks up to our results.

Ookla retains ownership of this article including all of the intellectual property rights, data, content graphs and analysis. This article may not be quoted, reproduced, distributed or published for any commercial purpose without prior consent. Members of the press and others using the findings in this article for non-commercial purposes are welcome to publicly share and link to report information with attribution to Ookla.

| May 17, 2023

ISPs Need to Do More to Improve Wi-Fi Performance in the Home

Key messages

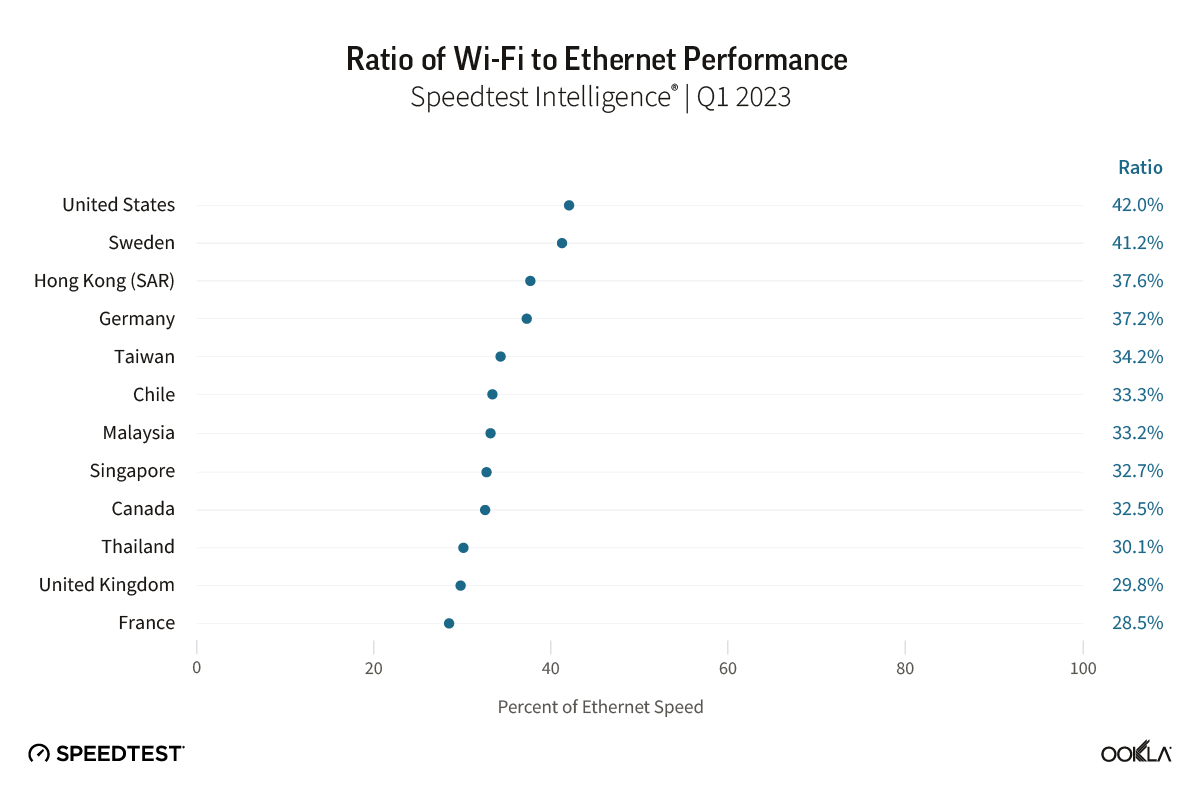
  • Wi-Fi woes continue. Ookla® Speedtest Intelligence® data shows Wi-Fi performance continues to lag behind ethernet performance within home networks in many advanced fixed broadband markets, with Wi-Fi speeds typically ranging from between 30-40% of ethernet speeds during Q1 2023.
  • Developed Asian and North American markets lead the charge to Wi-Fi 6/6E. Wi-Fi 4 and 5 remain the dominant Wi-Fi access technologies globally, accounting for a combined 89% of Speedtest® samples during Q1 2023. However, a number of advanced fixed broadband markets are rapidly migrating to Wi-Fi 6 and 6E, with China, Hong Kong (SAR), Singapore, Canada, and the U.S. leading the charge.
  • Growing Wi-Fi 6/6E adoption helps narrow the gap in Wi-Fi performance. In markets such as Canada, France, Germany, Singapore, Sweden, and the U.S., where the transition to fiber is more advanced, and where ISPs are actively driving adoption of Wi-Fi 6/6E routers, we see Wi-Fi performance closing the gap to ethernet. However, more needs to be done in other markets, where migration to more advanced fixed access networks is exposing the limitations of the installed base of Wi-Fi routers.
  • Router vendors pushing the envelope with Wi-Fi 7 capable launches. ASUS leads the market for Wi-Fi 6/6E routers among Speedtest samples, and both ASUS and other leading router vendors have been quick to launch Wi-Fi 7 capable routers. Despite this, Wi-Fi 6 and 6E remain the growing component of their installed bases. ASUS leads the market according to Speedtest Intelligence with 39% of its routers we sampled supporting Wi-Fi 6/6E during Q1 2023, well ahead of second placed NETGEAR with 26%.
  • Smartphone device support indicates Wi-Fi 6/6E should remain the immediate focus for ISPs. With the two largest smartphone vendors globally, Samsung and Apple, currently shunning Wi-Fi 7, ISPs waiting to see if they can leapfrog Wi-Fi 6E to Wi-Fi 7 should stay their hands. The fact that China still needs to allocate the 6 GHz spectrum band — key for Wi-Fi 6E and 7 — for unlicensed use is also significant, and appears to have weighed on the Wi-Fi 6E adoption among China’s leading Android smartphone manufacturers.

Wi-Fi performance continues to lag ethernet within the home

ISPs in advanced fixed broadband markets are increasingly looking to offer more advanced Wi-Fi routers and solutions such as mesh networks, which are designed to improve Wi-Fi coverage and performance. However, Speedtest Intelligence data shows that more needs to be done to improve Wi-Fi performance, which typically ranged from between 30-40% of ethernet speeds. Median Wi-Fi performance as measured by Speedtest will tend to lag behind median ethernet performance, depending on distance of the end-user device from the router, including any obstacles and signal interference the Wi-Fi signal needs to traverse to reach the device.

Chart of Ratio of Wi-Fi to Ethernet Performance

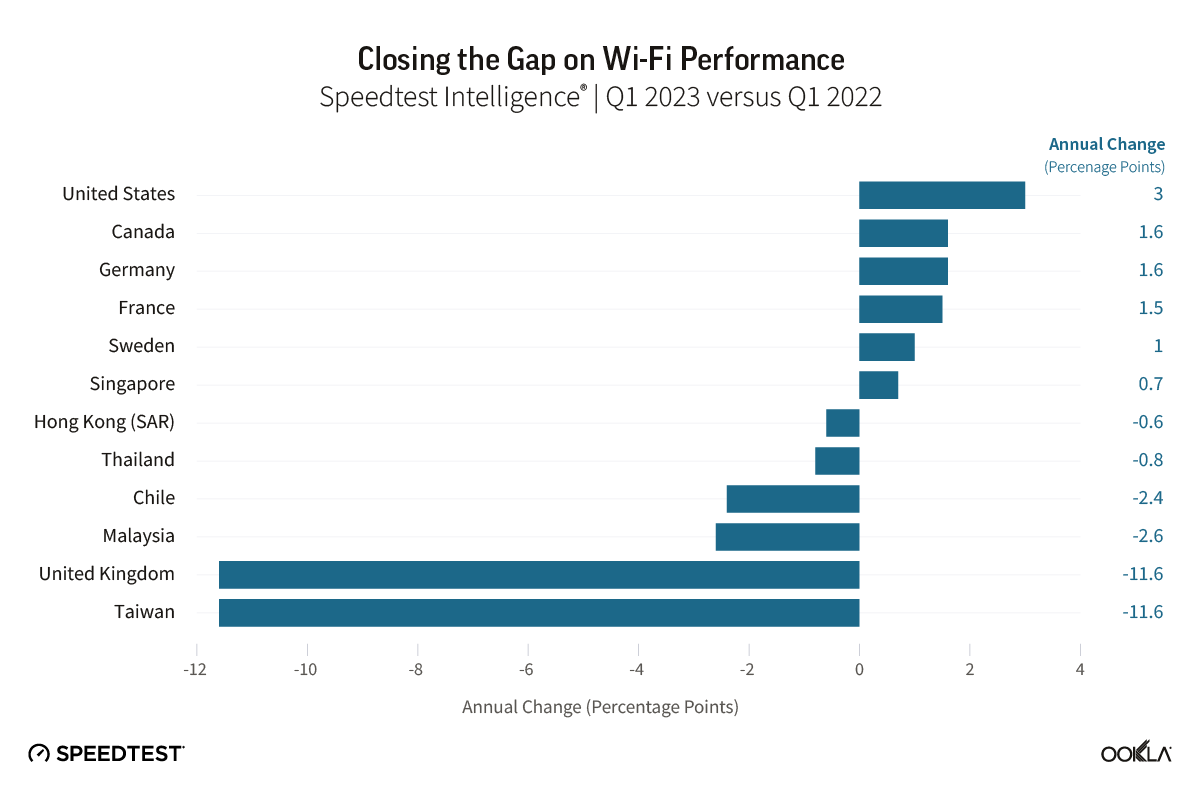
Our analysis of Speedtest Intelligence data reveals that driving greater adoption of more advanced Wi-Fi routers can help ISPs narrow the gap between Wi-Fi and ethernet performance, with ISPs in Canada, France, Germany, Singapore, Sweden, and the U.S. already successfully doing so over the past year.

Chart of Closing the Gap on Wi-Fi Performance

Despite this, the results are not always positive, with the gap between Wi-Fi and ethernet performance widening, in particular in the U.K. and Taiwan. Where markets are rapidly migrating from more legacy fixed broadband technology to advanced cable and fiber connections, Wi-Fi performance can lag relative to ethernet, indicating a need to accelerate the adoption of more advanced Wi-Fi technologies.

Older generations of Wi-Fi 4 and Wi-Fi 5 remain dominant globally

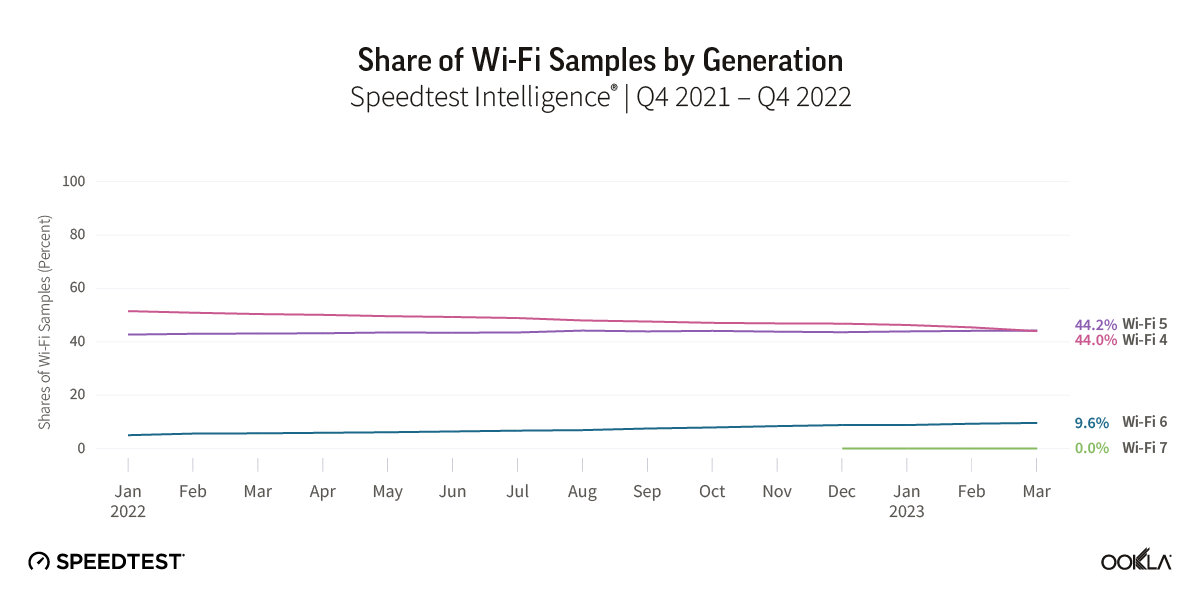
While much of the focus of the device ecosystem is on spurring adoption of the latest Wi-Fi standards, there is a long way to go before even Wi-Fi 6 becomes a dominant standard globally. Based on Speedtest Intelligence data, the proportion of Wi-Fi tests by generation (a good proxy for adoption) shows that Wi-Fi 4 and Wi-Fi 5 remain the dominant router technology, with Wi-Fi 6 representing just under 10% as of February 2023, and Wi-Fi 7 showing very few samples. The share of samples from Wi-Fi 4 routers has fallen by 6 ppts year-over-year, while Wi-Fi 5’s share of samples has marginally increased.

Chart of Share of wi-Fi Samples by Generation

Asian and North American ISPs lead the charge to Wi-Fi 6 and beyond

ISPs are the main driver behind the adoption of new Wi-Fi standards, as highlighted by a 2022 study by Parks Associates, which found that 52% of U.S. consumers acquired their router from their ISP. Rolling out more advanced routers to their customer bases enables them to take advantage of the increased performance of newer generations of Wi-Fi technology, and helps to ensure ISPs deliver faster speeds, particularly over fiber access networks.

Adoption of Wi-Fi 6 varies by market, even among the most developed fixed broadband markets globally. ISPs in a number of advanced fixed markets have already begun offering Wi-Fi 6E routers to their customer bases, with ISPs in North America in particular moving in this direction, including Bell Canada, Rogers, Telus, Verizon, XFINITY, Charter, and Frontier, as well as leading ISPs in advanced Asian and European markets.
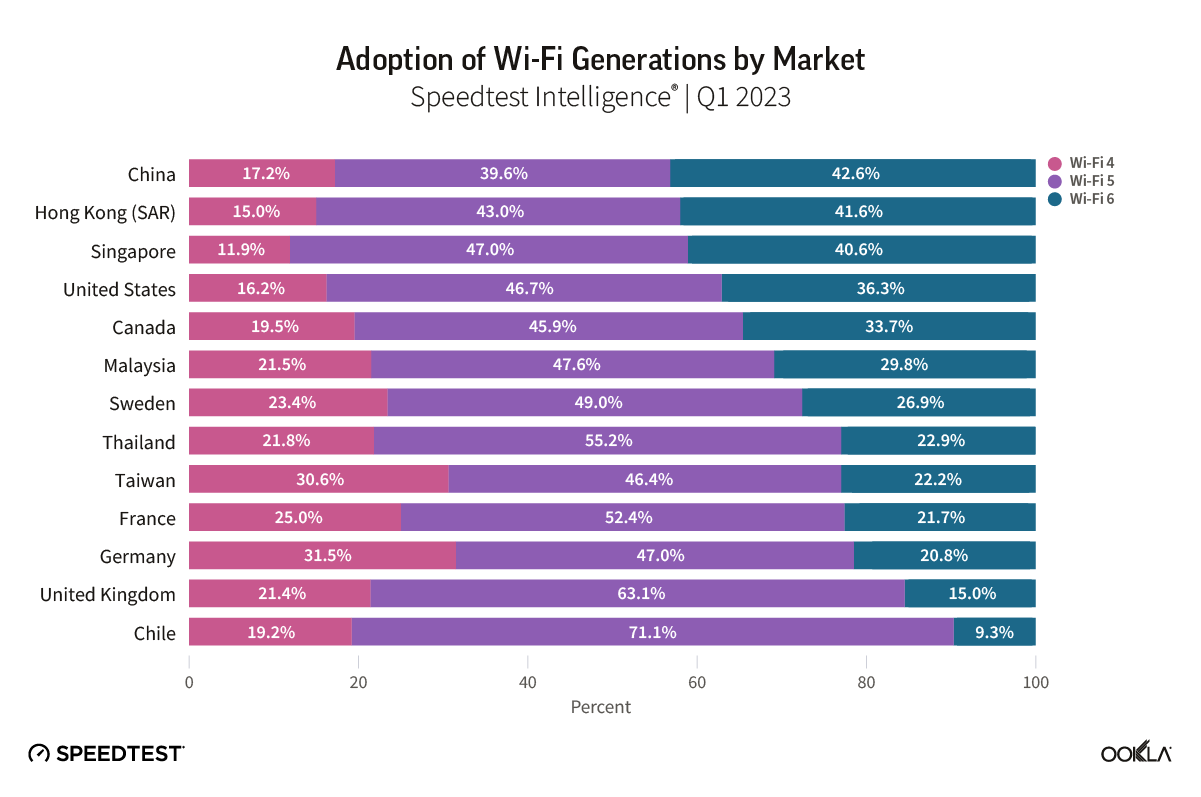
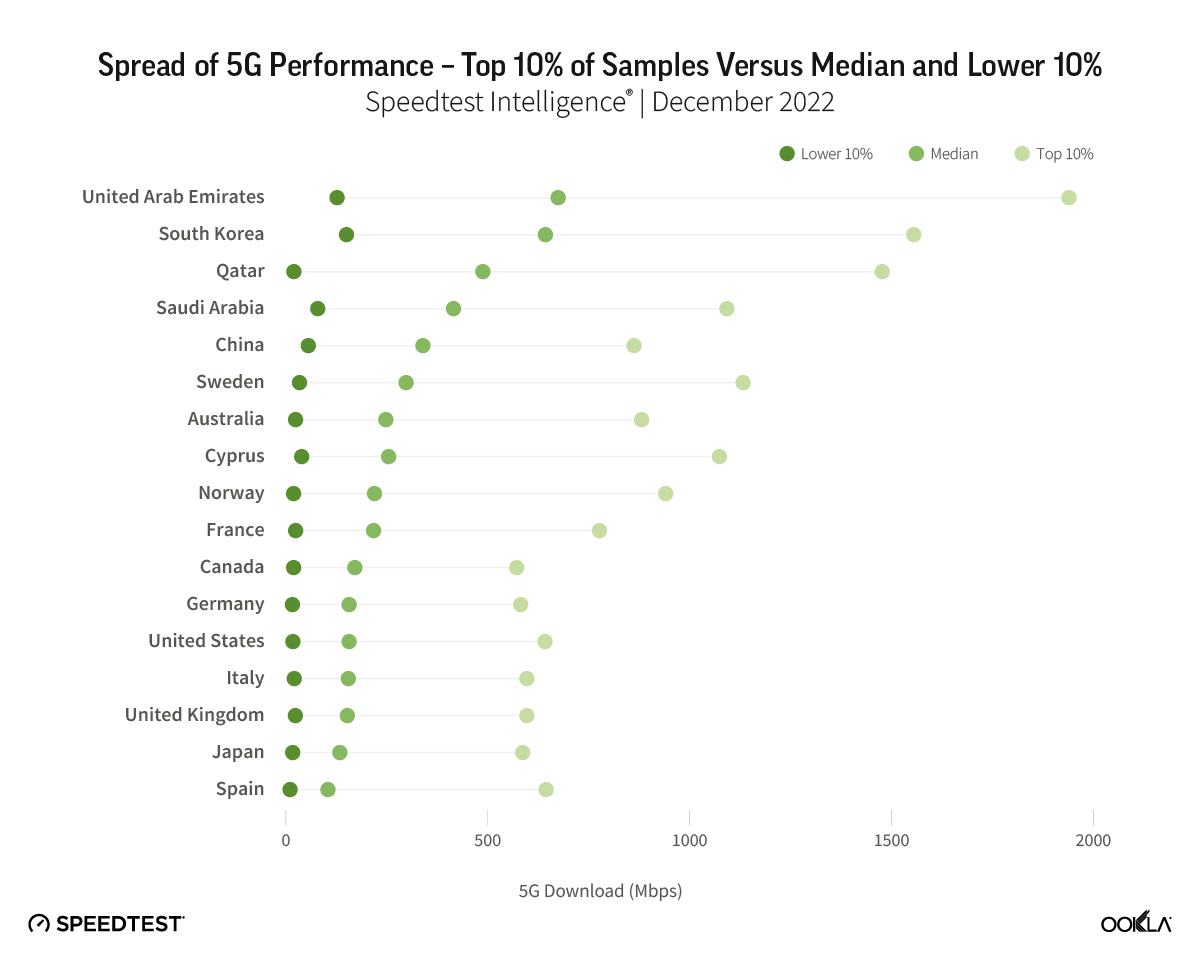
Markets in Asia led the way on Wi-Fi 6 adoption, with China and Hong Kong both recording 42% adoption, followed by Singapore with 37%. Outside of Asia, North America showed the next highest level of adoption, with the U.S. and Canada recording 32% and 30%, respectively. European fixed markets lagged behind, with adoption ranging from 13% in the U.K., to 24% in Sweden. For markets such as Chile, which placed towards the top of the Ookla Speedtest Global Index™ for median fixed broadband speeds, a relatively low-level of Wi-Fi 6 adoption (8% in Q4 2022) signals further opportunity for ISPs in the market to boost performance.

Chart of Adoption of Wi-Fi Generations by Market

The fastest growing markets, in terms of increasing share of Wi-Fi 6 of Speedtest samples year-over-year in Q1 2023, were Canada and Malaysia (+15 ppts), Singapore (+14 ppts), and Hong Kong (+12 ppts). While there was considerable variance between ISPs within each market, leading ISPs such as SmarTone (Hong Kong), DiGi (Malaysia), and ViewQwest (Singapore), are prompting a competitive response so that even ISPs with lower levels of Wi-Fi 6 adoption are prioritizing the technology and seeing adoption grow steadily.

CountryISPWi-Fi 6 %, Q1 2023
Hong Kong (SAR)SmarTone62.4%
CanadaBell pure fibre57.3%
SingaporeViewQwest53.7%
SingaporeMyRepublic50.3%
MalaysiaDigi50.2%
MalaysiaMaxis49.0%
Hong Kong (SAR)NETVIGATOR44.2%
CanadaRogers43.4%
SingaporeM141.7%
SingaporeSingTel41.4%
CanadaTelus PureFibre41.0%
Hong Kong (SAR)HKBN41.0%
CanadaShaw39.0%
SingaporeStarHub35.6%
Hong Kong (SAR)HGC30.0%
MalaysiaTIME28.8%
MalaysiaTM21.5%

In addition to providing newer routers, ISPs are increasingly positioned to help consumers solve Wi-Fi performance issues in the home, such as offering mesh Wi-Fi solutions. For some ISPs, this has even taken precedence over offering newer Wi-Fi 6E routers, as they look to improved coverage within the home as a faster route to improving Wi-Fi performance. 
In the U.K., BT has prioritized whole-home coverage over Wi-Fi 6E with its BT Complete Wi-Fi (mesh) offer, despite the U.K. regulator Ofcom having released the lower portion of the 6 GHz band for unlicensed use in 2020. In Canada, Telus, while having recently released a Wi-Fi 6E router for its broadband users, also offers its WiFi Plus package, which includes professional installation and “wall-to-wall coverage” throughout the home. Rogers also offers guaranteed Wi-Fi coverage throughout the home, as well as Wi-Fi 6E routers. Plume offers a subscription-based service, HomePass, across a number of markets, which allows users to add additional access points to help eradicate not-spots or poor Wi-Fi signal within the home and also offers solutions for ISPs looking to improve their Wi-Fi offerings. In Hong Kong, China Mobile Hong Kong (CMHK) was the first ISP in the market to offer a fiber-to-the-room service, while it and other ISPs such as NETVIGATOR offer consumers the option to subscribe to multiple channels over fiber with separate IP addresses, allowing them to divide their activities across channels and thereby help avoid congestion.

To capture the full performance benefits of Wi-Fi 6E and Wi-Fi 7, countries must allocate 6 GHz spectrum for unlicensed use, therefore allowing Wi-Fi devices to access this higher frequency, higher capacity spectrum, and utilize wider channels. At present, according to the Wi-Fi Alliance, allocation of the lower portion of the 6 GHz spectrum band (5,925 MHz to 6,425 MHz) is common among developed economies, with some notable exceptions in some developed markets in Asia and Asia Pacific, in particular China, while allocation of the full 6 GHz band is more limited, available across North America and some Latin American markets, as well as Saudi Arabia and South Korea.

Wi-Fi 7 on the horizon as router vendors continue to push the envelope on performance

Wi-Fi performance continues to scale, and with Wi-Fi 7 routers and smartphones having launched in the second half of 2022, that trend is set to continue. In addition to higher throughput, successive Wi-Fi generations also support lower latency, helping to better support higher quality video streaming, cloud gaming, and future use cases linked to concepts such as the Metaverse and other uses of extended reality (XR).

The major silicon vendors, Broadcom, Qualcomm, and Mediatek, were quick to update their solutions to support the emerging Wi-Fi 7 standard, and hardware vendors have followed suit. Chinese vendor H3C was the first to launch with its H3C Magic BE18000 Wi-Fi 7 router in July 2022, and it has since been followed by other major vendors including tp-link, ASUS, and more recently NETGEAR. However, the prices of early Wi-Fi 7 routers that take advantage of Wi-Fi 7’s range of enhanced performance capabilities will be a barrier to entry for many, with tp-link’s flagship Archer BE900 currently retailing at a cost of $699.99. 

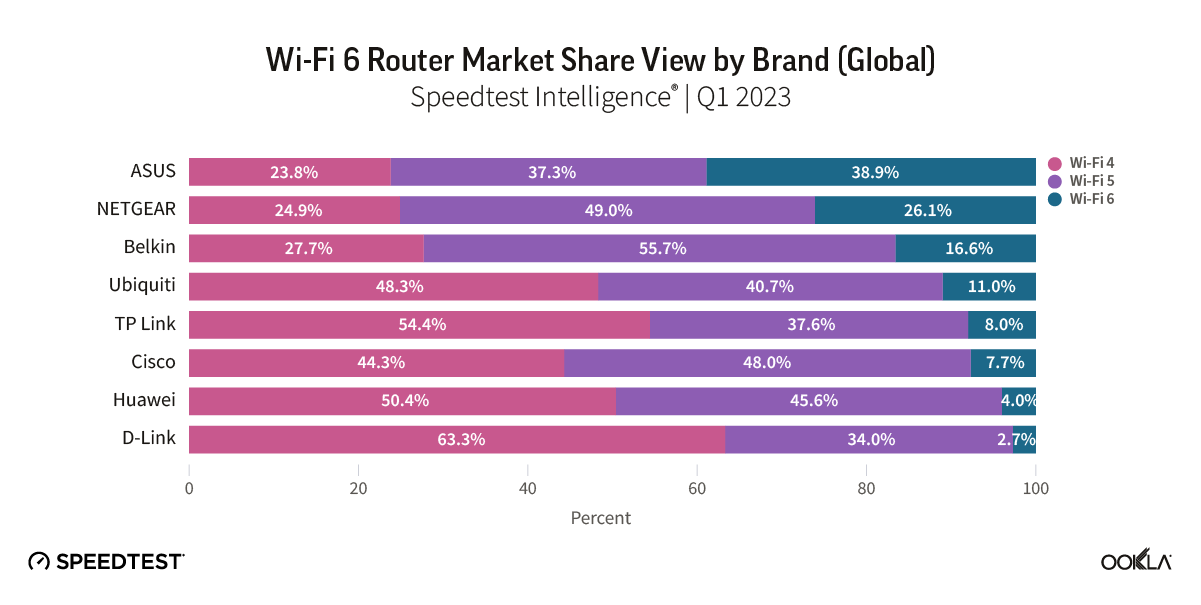
Speedtest Intelligence data shows minimal Wi-Fi 7 adoption as of March 2023, however we are likely to see the same vendors drive Wi-Fi 7 adoption that are currently leading on Wi-Fi 6. Based on global Speedtest Intelligence samples, we see ASUS leading the market in Wi-Fi 6 penetration, with 39% of samples recorded using Wi-Fi 6 compatible routers. NETGEAR and Belkin followed, but for the remaining major router vendors, Wi-Fi 6 penetration currently stands at close to 10% or below. Wi-Fi 6E remains a small but growing subset of Wi-Fi 6 certified devices, currently standing at 7.7% of products based on the latest Wi-Fi Alliance data. Of these, a majority are either routers or smartphones, with an almost even split between the two.

Chart of Wi-Fi 6 Router Market Share view by Brand (Global)

Smartphone support indicates ISPs should focus on Wi-Fi 6E for now

With Samsung releasing its Galaxy S23 range in February 2023 without Wi-Fi 7 support, and Apple’s latest iPhone 14 smartphones limited to Wi-Fi 6, it’s clear that, for now, ISPs should prioritize the rollout of Wi-Fi 6/6E among their customer bases rather than consider leapfrogging to Wi-Fi 7. The Xiaomi Mi13 Pro was the first Wi-Fi 7 capable smartphone to hit the market, launching in December 2022, although it was limited to Wi-Fi 6E initially, requiring a software update to enable Wi-Fi 7. The availability of Wi-Fi 7 supporting Android smartphones will grow through 2023, enabled by SoCs from leading vendor Qualcomm with its flagship Snapdragon 8 Gen 2, and MediaTek with its Dimensity 9200. Apple, on the other hand, lags on the latest Wi-Fi standard support, with the iPhone 14 series featuring Wi-Fi 6, and with its fall 2023 models rumored to be adding Wi-Fi 6E to their feature list.

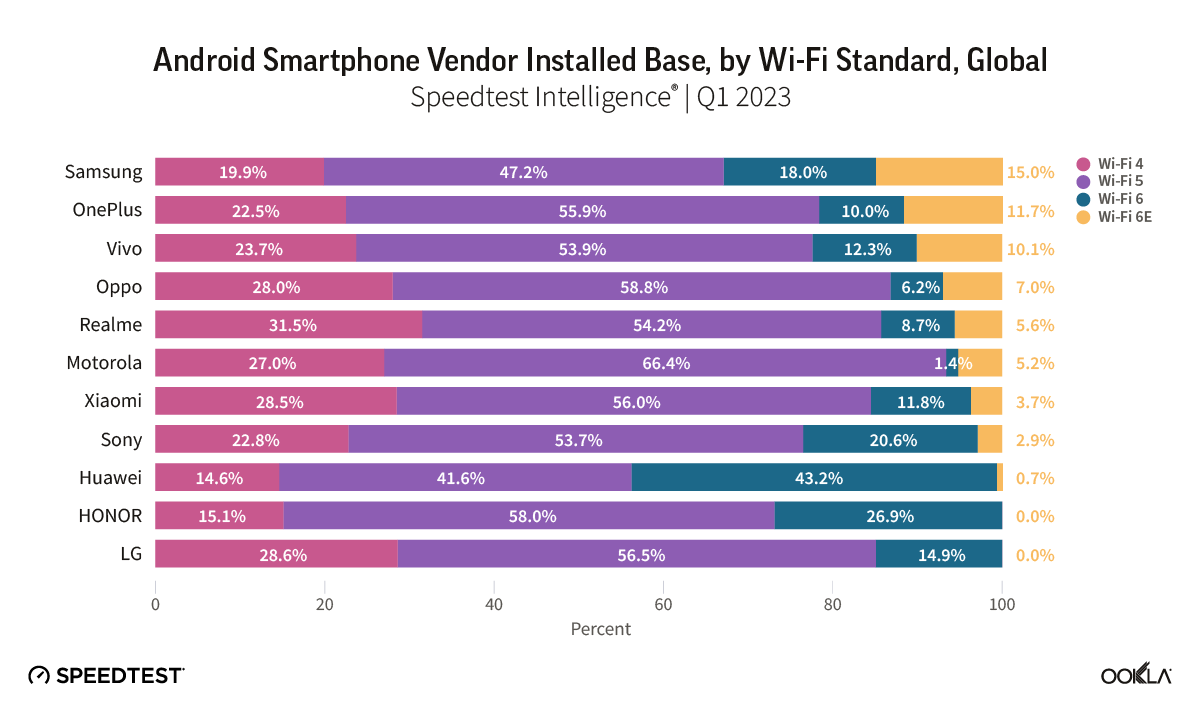
Chart of Android Smartphone Vendor Installed Base, by Wi-Fi Standard, Global

Samsung, as the leading Android smartphone vendor globally, has the largest installed base of smartphones supporting Wi-Fi 6 and Wi-Fi 6E, and has stolen a march on its main rivals Xiaomi, OPPO, and Vivo. While the major Chinese smartphone vendors have launched Wi-Fi 7 compatible devices, the lack of assignment of 6 GHz spectrum for unlicensed use in China does appear to have held them back relative to brands such as Samsung and ASUS.

The outlook for Wi-Fi in the home

It’s clear from the gap between Wi-Fi and ethernet performance that ISPs need to do more to improve the customer experience for Wi-Fi users within the home. Part of the solution lies in rolling out more advanced generations of Wi-Fi technology, given Wi-Fi 4 and 5 remain the dominant technologies deployed globally. However, evidence linking increased adoption of Wi-Fi 6 to overall Wi-Fi closing the gap to ethernet performance is mixed, and validates the approach of ISPs looking to also offer mesh networking Wi-Fi solutions. Contact us to find out more about how Ookla Research can help you monitor the performance of your networks, and stay ahead of the competition.

Ookla retains ownership of this article including all of the intellectual property rights, data, content graphs and analysis. This article may not be quoted, reproduced, distributed or published for any commercial purpose without prior consent. Members of the press and others using the findings in this article for non-commercial purposes are welcome to publicly share and link to report information with attribution to Ookla.

| November 23, 2023

Empowering Europe's Digital Ascent: Insights from Ookla's Gigabit Revolution Webinar

Ookla® has recently hosted a webinar on “Accelerating Europe’s Gigabit Revolution: The importance of high-speed internet in the digital era.” We gathered representatives from three European fiber providers, vertically integrated UK Internet Service Provider (ISP) Hyperoptic, Polish open-access fiber network provider, Fiberhost, and Spanish wholesale provider Onvia, to discuss their strategies and challenges related to fiber roll out and adoption. Industry experts from the European Competitive Telecommunications Association (ecta) and two research houses, Assembly Research and Omdia, also joined us. 

European Commission’s Digital Decade 2030 Strategy

The European Commission’s Digital Decade 2030 strategy, also known as the Digital Compass, is an ambitious roadmap to speed up the digital transformation of Member States by 2030. One of its primary objectives is to enhance digital connectivity, with specific targets such as 100 Mbps services by 2025 and gigabit coverage for all EU households by 2030. We recently published an article to provide a reality check on the progress towards a Gigabit society. Our data suggests a wide gap between advertised and actual speeds for gigabit services, with speeds approaching 100 Mbps commonly seen by users. Despite this gap, our webinar participants were optimistic about achieving the Gigabit Society goal, with 71% supporting that view.

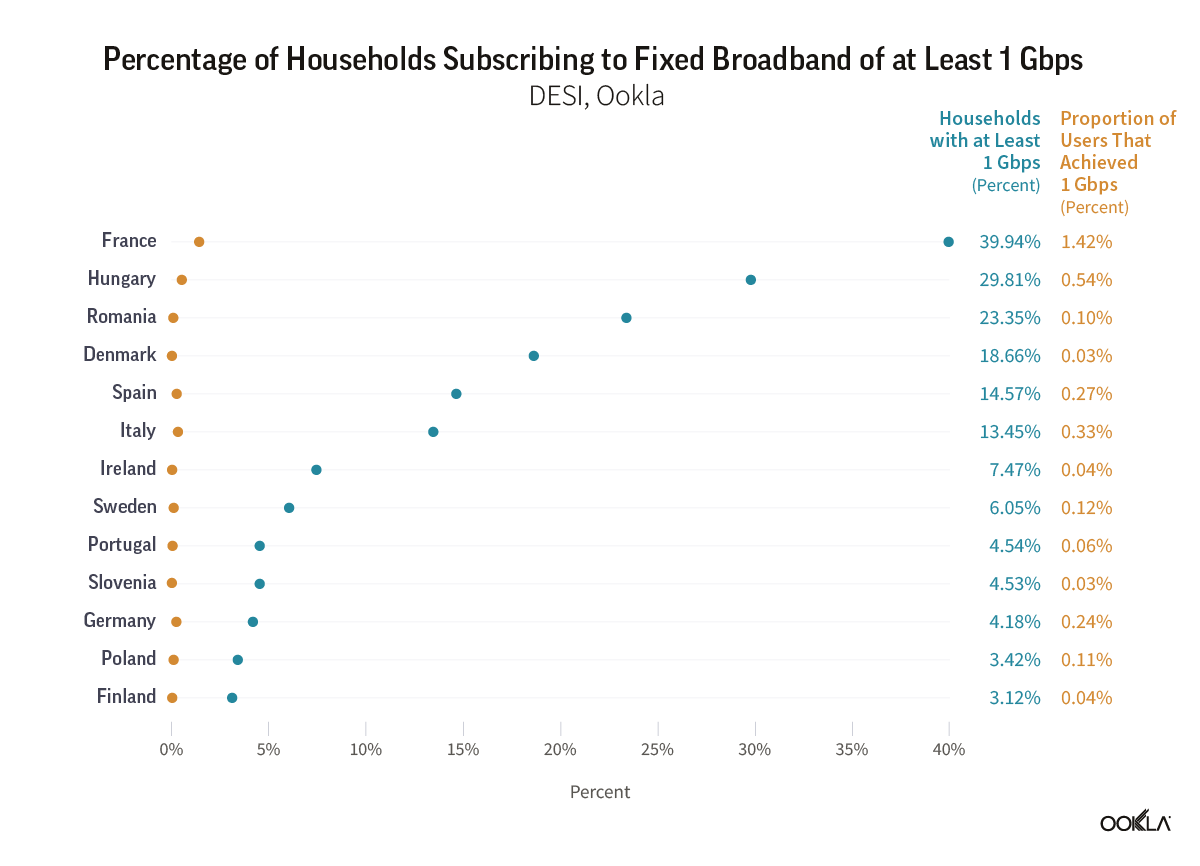
Chart of Percentage of Households Subscribing to Fixed Broadband of at Least 1 Gbps

The EU goal predominantly focuses on the availability aspect. However, it is important to note that having fiber networks available does not automatically equate to actual penetration or adoption rates, although it is a necessary prerequisite. Having physical accessibility to network services is, of course, a vital first step before actual usage, which is influenced by multiple factors such as affordability, awareness, and the perceived need for the service. 

The European fiber network landscape

Stephen Wilson, Senior Principal Analyst from Omdia, provided an analyst’s perspective on how the fiber networks’ competitive landscape is evolving for alternative operators and incumbents. He stated that there has been a substantial increase in Fiber-To-The-Premises (FTTP) coverage, and the investment case for fiber has been spurred by the pandemic. Leading countries, including those in Iberia and Eastern Europe, are pushing coverage to 90% of premises or more, driven by a positive business case. While FTTH (Fiber to the Home) subscriber penetration is generally experiencing steady growth, country-level variations exist, with factors like digital literacy, existing broadband penetration, and competition playing crucial roles in the observed trends. Countries such as Spain and Romania have achieved significant FTTH penetration rates, while others like France have outperformed predictions, emphasizing the diverse dynamics influencing fiber adoption across Europe.

Importance of supportive regulatory framework  

James Robinson, Senior Analyst from Assembly Research, highlighted three measures the European Commission is taking as it seeks to deliver against the Digital Decade’s connectivity targets: the draft Gigabit Recommendation, the proposed Gigabit Infrastructure Act, and a plan for a Digital Networks Act. Although broad industry support exists for the Gigabit Infrastructure Act (GIA), the draft Gigabit Recommendation has proven to be the most controversial. Both measures are still nevertheless expected to be finalized by the end of the year. The Digital Networks Act (DNA) will take longer to materialize, with a white paper not due until H1 2024. Despite its catchy title, the ‘DNA’ is unlikely to represent the urgent concrete action many operators had hoped to see from the Commission following the launch of the exploratory consultation back in February of this year.

Luc Hindryckx, Director General at ecta, expressed doubt about an investment gap that could endanger the 2030 targets. He suggested that some proposed legislation had been developed to support only a few operators rather than to promote competition. Hindryckx stressed the importance of bringing the Gigabit Infrastructure Act to “a good end” and ensuring the reduction of the timing for obtaining permits to deploy networks. He also pointed out that the GIA is complementary to the  European Electronic Communication Code (ECCC), and its key elements include asymmetrical regulation and the Significant Market Power (SMP) regime. Overall, ecta emphasizes the importance of regulatory measures that foster competition, encourage investment, and create a level playing field, ultimately contributing to the successful deployment of gigabit connectivity and the Digital Decade 2030 objectives.

Succeeding in Rural Areas 

Marta Wojciechowska, Chief Executive Officer at Fiberhost, has reported that the company has already met its goal of extending its fiber-optic network to over 1.3 million households by the end of the year. The company primarily focuses on underserved areas, where deployment costs tend to be higher and less predictable. While there are uncertainties regarding demand and fiber service uptake, there are unique benefits, including the low risk of overbuilding. However, the investment process varies significantly between urban and rural areas. In cities, one kilometer of infrastructure can connect one hundred to two hundred households, depending on the city’s size. In rural areas, connectivity extends to just seventeen households per kilometer.

Furthermore, up to 19 formal approvals may be required for infrastructure deployment, which extends the time to connect premises in rural areas to an impractical 24 months. The cost of connecting one household in these secluded “white spots” is over five hundred percent higher than in cities. Overcoming these challenges requires expertise, experience, and a collaborative approach, emphasizing the importance of partnerships with multiple stakeholders. These include local governments and subcontractors to achieve common goals in fiber network expansion.

Strategies for Expansion

Icíar Martínez, Markets and Product Director at Onivia, acknowledged they face similar challenges to Fiberhost but noted that their strategies for expanding the FTTH footprint might differ. Spain boasts close to 90% fiber optic coverage, thanks to private initiatives and government support. Their selective deployment focuses on rural and ultra-rural areas, addressing high customer interest. However, the cherry-picking strategy becomes expensive, impacting profitability, especially in densely competitive areas. Onivia aims to maximize capital returns by identifying key players, adopting XGPON technology for speeds up to 10 Gbps, and strategically balancing deployments in large cities and rural regions to optimize network utilization based on market demands.

On the other hand, Howard Jones, Head of Communications at Hyperoptic, noted that the Hyperoptic approach is distinct, focusing on urban areas with densely populated regions. The key lies in a granular business case approach, evaluating each deployment building by building and street by street. Hyperoptic’s philosophy centers on understanding that the network’s value lies in retaining customers, emphasizing a customer-centric business model. With a customer experience-oriented strategy, the ISP addresses challenges in the UK broadband market, historically marked by lower speeds and inadequate competition. By delivering a high-quality network, reliable service, and fair pricing policies, Jones highlighted that the company aims to set new standards in customer experience, achieving a 40% penetration rate within approximately a year of network deployment. 

Addressing take-up challenges

Marta shared that Fiberhost’s network would not be deployed in white spot areas without EU funds. Fiberhost is the largest beneficiary of EU-funded grants, but this is just the beginning of the investment process. They need to “earn money, and for that, we need to have a good take-up rate.” She added that they must work hard to encourage people to join the fiber network. Their analysis showed that there is a slowdown in activations after ~40 %. While early adopters (47%) are willing to pay a premium for fiber internet, a substantial portion of potential users remain hesitant, contributing to the overall challenge of achieving a high take-up rate. The remaining 53% of households exhibit characteristics of an older demographic (above fifty-five) with limited internet usage, often for undemanding tasks. Their price sensitivity and lower discretionary income present a formidable barrier to higher adoption rates. As a result, Fiberhost adopts a multifaceted strategy, encompassing high-level engagement with Internet Service Providers (ISPs), targeted sales promotions, and educational initiatives. This strategic flexibility recognizes the absence of a one-size-fits-all solution and emphasizes the need for nuanced approaches tailored to the diverse challenges within each territory. 

Iciar echoed this sentiment but also highlighted a need to implement a connectivity plan, not just deploy fiber, but also to digitalize rural areas. Access to a broadband network in rural households is essential, and so is educating people on the benefits of accessing new technologies. Onivia is exploring synergies with other technologies like 5G or satellite to extend broadband connectivity into areas that are difficult to reach. Iciar mentioned that working with local authorities is key to reusing existing infrastructure and avoiding building and disturbing neighborhoods with work.

Demand Aggregation and Competition

Stephen pointed out that the most successful operators are already in the 60-70% take-up rates of premises passed in countries like Norway, which points to demand aggregation being an important factor in getting pre-commitments before you roll out. Howard concluded, “Competition is the key to ensuring that these targets are met because I don’t believe that incumbents alone will do it. They need to be driven, and driven by competition.” He added the introduction of ‘One Touch Switch’ adds another layer of competition into the UK market and presents an opportunity to break the stranglehold of the big retail providers, who still often tend to sell FTTC (Fiber to the Cabinet), by moving a significant number of customers to alternate providers who are more likely to offer FTTP. This initiative is crucial, but what’s more important is the need to retain competition for everyone. 

The journey towards Europe’s gigabit revolution is indeed multifaceted and involves various factors such as regulatory landscapes, diverse deployment strategies, financial dependencies, and the imperative of competition. Achieving the Digital Decade 2030 targets demands not just the availability of physical networks but also a concerted effort to address adoption challenges and ensure that the benefits of enhanced connectivity reach all corners of society. A shared commitment to realizing Europe’s digital potential is crucial, and a regulatory framework that fosters competition emerges as a common thread, underlining its pivotal role in driving investment, innovation, and equality. Moving forward, collaboration, adaptability, and a unified approach are essential to achieving Europe’s digital aspirations. From our side, we will continue to report what we see from Ookla® data in terms of users actually experiencing speeds. 

See the full webinar recording here

Ookla retains ownership of this article including all of the intellectual property rights, data, content graphs and analysis. This article may not be quoted, reproduced, distributed or published for any commercial purpose without prior consent. Members of the press and others using the findings in this article for non-commercial purposes are welcome to publicly share and link to report information with attribution to Ookla.

| March 14, 2019

Ditch the Lag: Cities with Great Gaming Culture and Low Ping

Yes, you can game from anywhere with an internet connection. But if you’re at all competitive, it’s nice to play from somewhere with low ping and fast internet speeds. Plus when you need to leave the house, it’s extra nice to know you’re also surrounded by gamer culture. We’ve examined February 2019 Speedtest results in 35 cities that are known for their esports events, gaming conferences, game companies and more to find out who has the advantage and ranked them based on their ping.

The top contenders

Eleven_Gaming_Cities_0219

First place Bucharest, Romania is home to super-low ping, a lightning fast download speed and a thriving gaming culture. From Bucharest Gaming Week (which includes the CS:GO Southeast Europe Championship and the FIFA National Tournament) to their numerous local game studios, Bucharest is a great place to be a gamer whether you’re online or out and about.

The next five gaming cities with the lowest pings are all in Asia. Hangzhou, China comes in second overall with a fast ping and world-class download speeds. This city is so devoted to its gamers that it opened a $280 million gaming “city” in 2018 and plans 14 new esports arenas before 2022. Coming in third, Chengdu, China has an equally low ping to our first two contenders and serves as one of two host locations in China for the Global Mobile Game Confederation (GMGC). Both Hangzhou and Chengdu are also franchise holders in the Overwatch League, giving local gaming fans something to cheer about. Fourth place Singapore, host of the 5th Annual GameStart Convention in October 2018, had only a slightly slower ping than the first four cities and the fastest download speed of any of the cities we considered.

South Korea is home to the fifth and sixth best cities for gamers. A satellite city of Seoul, Seongnam-si boasts the Pangyo Techno Valley (a.k.a. the Silicon Valley of Korea) and numerous game development companies. Perfect for a city with a 9 ms ping. Though Incheon’s ping was a little slower at 12 ms, gamers there can console themselves with the city’s gamer cred — the 2018 League of Legends World Championship was held in Incheon’s Munhak Stadium.

Coming in at number seven, Budapest, Hungary is an emerging game city, having hosted its first big esports event (the V4 Future Sports Festival) in 2018, but a 12 ms ping makes them a strong contender. More established Malmö, Sweden is number eight with a slightly slower average download speed but the city is headquarters to Massive Entertainment, creators of Tom Clancy’s The Division series, Far Cry 3, Assassin’s Creed: Revelations and many more.

Vancouver, Canada, North America’s only qualifier for the top gaming cities list, comes in at number nine with a 12 ms ping and many gaming companies including the Canadian arms of Nintendo of Canada and EA (Electronic Arts). We included both Shanghai, China and Moscow, Russia on the top gamer cities list as both had a 12 ms ping as well, though the internet speeds in Shanghai are superior. Shanghai will also host the International Dota 2 in 2019 while Moscow is known for Epicenter.

The rest of the pack

Notably absent from the list above is most of the western hemisphere. Cities in North America were held back by their high pings. Cities in South America suffered from high pings and also slow internet speeds — something that esports leagues have complained is a barrier to investment.

Our full list of gaming cities provides wider geographical representation, even if the internet performance is not always as stellar. You’ll find Los Angeles in 27th place, behind Seattle, Boston and Las Vegas. And São Paulo, Brazil has the best showing in Latin America at 23rd.

Internet Performance in 35 Cities with a Gaming Culture
Speedtest Results | February 2019
City Ping (ms) Mean Download (Mbps) Mean Upload (Mbps)
Bucharest, Romania 8 172.13 126.57
Hangzhou, China 8 125.93 29.54
Chengdu, China 8 101.92 33.80
Singapore 9 196.43 200.08
Seongnam-si, South Korea 9 155.25 114.83
Incheon, South Korea 12 139.84 102.91
Budapest, Hungary 12 132.72 54.46
Malmö, Sweden 12 126.28 105.67
Vancouver, Canada 12 117.55 50.23
Shanghai, China 12 75.14 30.06
Moscow, Russia 12 64.56 63.59
Oslo, Norway 13 115.46 69.03
Hong Kong, Hong Kong (SAR) 14 167.59 161.14
Zürich, Switzerland 14 144.36 109.39
Seattle, United States 15 138.50 79.88
Stockholm, Sweden 15 134.16 93.83
Auckland, New Zealand 15 92.05 53.30
Toronto, Canada 16 134.75 67.42
Boston, United States 17 152.42 60.87
Las Vegas, United States 17 141.69 41.22
Chennai, India 17 48.40 42.93
Cologne, Germany 18 63.77 18.36
São Paulo, Brazil 18 46.43 21.57
Jakarta, Indonesia 18 17.88 10.21
Mumbai, India 19 23.40 19.26
Paris, France 20 161.04 93.68
Los Angeles, United States 20 121.00 23.57
London, United Kingdom 20 63.58 23.18
Rio de Janeiro, Brazil 20 36.50 13.33
Buenos Aires, Argentina 21 34.31 6.40
Katowice, Poland 22 83.99 20.91
Mexico City, Mexico 25 37.66 15.39
Sydney, Australia 25 34.20 9.61
Santiago, Chile 26 56.13 18.49
Tokyo, Japan 28 99.24 101.90

Of course, die-hard gamers will know that a low ping in your city won’t necessarily save you if you’re playing on a distant server.

What’s the ping like in your city? Take a Speedtest and see if your connection is hurting your gameplay.

Ookla retains ownership of this article including all of the intellectual property rights, data, content graphs and analysis. This article may not be quoted, reproduced, distributed or published for any commercial purpose without prior consent. Members of the press and others using the findings in this article for non-commercial purposes are welcome to publicly share and link to report information with attribution to Ookla.

| October 23, 2023

A Reality Check on the Progress toward a Gigabit Society

The European Commission has set forth an ambitious goal of achieving a Digital Decade 2030 strategy, also known as the Digital Compass. The aim is to expedite the digital transformation of Member States by 2030. One of the primary objectives of this strategy is to improve digital connectivity, which will be measured through specific targets such as 100 Mbps services by 2025 and gigabit coverage to all EU households by 2030. In this article, we will discuss the progress made so far, the disparities in user experience, and the challenges that need to be addressed to achieve Europe’s connectivity goals.

Key messages 

  • Digital Decade Ambition: The ambitious goals of the EU’s Digital Decade strategy are indeed lofty. Broadband services might promise speeds in excess of 1 Gbps, but the reality is that users rarely experience that level of speed. However, while the gap between advertised speeds and actual speeds for gigabit services is wide, speeds approaching 100 Mbps are far more common. 
  • Median Download Speeds and Infrastructure Development: Several European countries are making substantial progress in offering high-speed broadband. Denmark, Spain, France, and Romania have notably fast median download speeds, primarily due to their fiber-to-the-home (FTTH) infrastructure investments. The type of broadband technology used in those countries (and others) significantly influences the gap between download and upload speeds, with fiber-based networks showing more balanced speeds.
  • AltNets Drive Fiber Adoption: Alternative network providers (AltNets) play a vital role in accelerating fiber adoption and addressing challenges mainstream ISPs face. Their role varies across countries and regions.
  • Take-up rates remain a challenge: With the completion of fiber rollout in several countries, the focus has now shifted towards promoting fiber subscriptions. However, there are challenges that persist, such as consumer reluctance and the need for incentives. A survey conducted in rural France revealed that 42% of the respondents found their current internet sufficient, while 37% said that they would be encouraged to upgrade if offered incentives.

You can also register for our November 8 webinar, where a panel of industry experts will discuss how Europe can accelerate the expansion of gigabit-capable infrastructure. Register now

On the road to 100 Mbps

Chart of Percentage of Households Subscribing to Fixed Broadband of at Least 1 Mbps and Proportion of Users that Achieved 100 Mbps

The European Commission aims to ensure that all European households, businesses, and public institutions should have access to “high internet speeds” of at least 100 Mbps by year-end 2025. The EU is showing progress in terms of achieving that target. According to Broadband Coverage in Europe 2022, 86.6% of EU households were within 100 Mbps + coverage, meaning they had access to broadband services capable of providing at least 100 Mbps download speeds. 

While having networks available does not automatically equate to real penetration or adoption rates, it is an important prerequisite. Physical accessibility to network services is a vital first step before actual usage, which is influenced by factors such as affordability, awareness, and the perceived need for the service.

According to the Digital Economy and Society Index DESI 2023 dashboard for the Digital Decade, 55.08% of EU households had already subscribed to fixed broadband services with internet speeds of at least 100 Mbps. While this rate of subscribers is significant and an indicator of the EC’s ongoing progress, the region is still far from achieving its goal of universal, 100 Mbps coverage by 2025. Some countries like Spain, Sweden, and Romania, where over 80% of households subscribe to broadband exceeding 100 Mbps, have already made significant progress in terms of fiber coverage. 

However, in those countries, there is a significant gap between what households subscribe to and what we see from Ookla® data in terms of users actually experiencing speeds above 100 Mbps. Netherlands, France, and Germany are the outliers where we see more users having “high internet speeds” compared to the speeds advertised in their broadband subscription package. This is particularly interesting because Germany still heavily relies on VDSL for high-speed access technologies. Still, there is a significant amount of work to be done before countries can deliver on their strategies to achieve the 100 Mbps target.

Chart of Fibre to the Premise Coverage as Percentage of Households

The EC’s goal of gigabit connectivity is certainly one of the driving forces behind the rollout of fiber networks in the region. So far, progress is mixed across the region in terms of fiber network rollouts and adoption. As we have discussed, regulatory incentives propel the move to fiber. For example, Romania has one of the highest Fiber to the Home/ Building (FTTP/B) penetration rates across the region — nearly 97.7% of households — which is partially driven by government-backed fixed infrastructure projects such as RoNet, and the special attention given to rural and disadvantaged areas. Portugal, which already scored high on fiber coverage, plans to launch an international public tender by the end of 2023 for a project to cover all underserved areas with fiber-optic networks to boost fiber penetration further.

The reality of gigabit speeds 

The European Commission’s Digital Decade 2030 strategy seeks to extend gigabit (1 Gbps) connectivity to every European Union household by 2030. To track the progress of these objectives, the DESI plays a crucial role in tracking EC’s progress. Only 56% of households in the EU have access to the necessary fiber networks for gigabit connectivity, and the take-up rate (proportion of households that subscribe to fiber) is even lower. According to the DESI 2023 dashboard for the Digital Decade, 13.76% of households in the European Union have subscribed to fixed broadband with at least 1 Gbps as of 2022. Nevertheless, there is a significant disparity in these percentages across different EU nations. For instance, only five countries surpassed the EU value – France leading with 39.94%, Hungary second at 29.81%, followed by Romania at 23.35%, Denmark at 18.66%, and Spain at 14.57%.

Chart of Percentage of Households Subscribing to Fixed Broadband of at Least 1 Gbps

Looking at this data one might believe that many European households have access to Gigabit internet speeds. However, the reality is different as not all of them genuinely experience such high speeds. In fact, the proportion of Speedtest® users registering median download speeds of at least 1 Gbps in many countries is quite low. For example, France only had 1.42%, Hungary at 0.54%, Romania at 0.1%, Denmark at 0.03%, and Spain at 0.27%. 

The significant gap between expectations and reality underscores the importance of not only rolling out gigabit-capable networks but also stimulating demand for those services. Service providers also need to pay attention to home networking equipment. Our research has shown that in markets where legacy broadband technology (such as DSL or coax cable) is being replaced by advanced cable and fiber connections, Wi-Fi performance can lag behind ethernet. Wi-Fi speeds typically range from 30-40% of ethernet, indicating a need to accelerate the adoption of more advanced Wi-Fi technologies and optimize the home network environment.

Median download and upload disparities

Median speeds are a standard metric for measuring performance, but there’s more to the story for the end-user experience. Access technology, be it DSL, cable, or fiber, as well as customer premises equipment and end-user devices, significantly influence the user experience. In our recent article, we highlighted how the persistent use of legacy and underperforming Wi-Fi standards in home networks can hamper efforts to provide the best network experience to customers despite progress in terms of fiber rollout and adoption.

Median Download and Upload Speed across a Sample of European Countries

According to Speedtest Intelligence® in Q3 2023, across Europe, Denmark had the fastest median download speed for fixed broadband (196.43 Mbps), followed by Spain (176.08 Mbps), France (170.51 Mbps), and Romania (166.39 Mbps). Notably, several of those countries have a substantial gap between median download and upload speeds. The type of broadband technology implemented can heavily influence the divergence between download and upload performance. Nations still reliant on DSL and cable often exhibit lower median upload speeds and a wider gap between upload and download speeds. On one hand, the UK and Germany lag behind other countries in broadband infrastructure upgrades due to their reliance on copper-based technologies and cable networks and are at the tail end of the ranking. 

On the other hand, Sweden, with a 63% Fiber-to-the-Home (FTTH) penetration rate in 2022, has the narrowest gap between download and upload speeds. Forward-thinking broadband infrastructure and significant municipal involvement have positioned Sweden to reach the EC’s goals in the coming years. France, Spain, Denmark, Romania, and Portugal are also making significant progress toward achieving full-fiber coverage, with France expecting a full-fiber rollout by 2025. As fiber broadband adoption increases, the gap between download and upload speeds will narrow, mainly because fiber subscriptions are typically offered with symmetrical speeds, where users would experience the same level of speed for both download and upload usage. 

However, even when we look at “the best-connected” Speedtest users (those seeing speeds in the top 10th percentile of our results), there’s a wide range of performance. Download speeds ranged between 417.23 Mbps and 844.04 Mbps, while the range for upload speeds was even wider, with median upload speeds ranging from 57.11 Mbps to 599.39 Mbps. 

When looking at speeds at the 10th percentile, only four countries topped 700 Mbps. France led with a top speed of 844.08 Mbps, followed by Hungary at 765.85 Mbps, Denmark at 734.91 Mbps, and Romania at 704.04 Mbps. Notably, three of these countries (Romania, France, and Denmark) also lead in the top 10% of upload speeds, with all three exceeding 500 Mbps. 

While for most countries included in this analysis, top speeds are at least a few hundred Mbps apart, there are a few exceptions. Spain shined bright, with the top 10% of its download and upload speeds closely matched at 611.17 Mbps and 609.17 Mbps, respectively. 

Chart of Top 10% Download and Upload Speed across a Sample of European Countries

Beyond median speeds

To delve deeper into the performance and reliability of internet services across different countries, it can be helpful to look at the expected speed range, i.e., the range of speeds that the majority of users experience. This middle 50% of speeds are captured by the interquartile range, with the lower value of the range, or lower quartile, indicating the bottom 25% of speeds and the upper value of the range, or upper quartile, indicating the top 25% of speeds. Examining Speedtest Intelligence data from Q3 2023, the lower quartile download speed across European countries ranged from 28.15 Mbps to 81.48 Mbps (in other words,, 25% of downloads were below that speed), while upper quartile speeds clocked in between 166.16 Mbps and 441.38 Mbps (i.e., 25% of downloads were above this speed). 

Chart of Distribution of Interquartile Speeds in European Countries, All Providers Combined

Role of AltNets

According to the FTTH Council Europe, alternative operators (AltNets) are playing a significant role in the adoption of fiber in the EU39 region. The EU39 region comprises the EU27, the UK, Iceland, Israel, North Macedonia, Norway, Serbia, Switzerland, Turkey, and 4 CIS other countries. In 2021, around 56% of FTTH/B initiatives were led by AltNets, which marks a shift from 2011 when alternative ISPs had a 71% share, and incumbents accounted for only 21% of initiatives. 

Chart of Number of Active Internet Service Providers (ISPs) and FTTH Share of All Connections

We looked at data from Omdia to determine whether there is a correlation between the number of active ISPs and the speed of the transition to fiber networks measured by FTTH share of all connections. The relationship is not straightforward and varies significantly depending on each country’s competitive landscape and government initiatives. 

Across a number of countries fiber accounts for the majority of subscriptions – Spain comes on top with 81.8%, followed by Romania (81.7%), Sweden (77.5%), and Portugal (62.4%). Spain is a good example of a market that has been migrating to fiber away from copper ahead of the incumbent Telefonica turning off its legacy fixed network in 2024. Furthermore, Spain’s National Commission for Markets and Competition (CNMC) has simplified its ‘MARCo offer’, making it easier for alternative operators to access Telefonica’s infrastructure to launch their own fiber optic services. 

It is worth noting that countries like the UK and Poland, which have many ISPs, are also leading the way in AltNet-driven fiber initiatives. In our previous article looking at the impact of AltNets in the UK, we concluded that AltNets played an important role. In fact, AltNets provided the top speeds in London, Glasgow, Liverpool, and Manchester, as well as across a number of counties. Public funding has helped facilitate the emergence of fiber ISPs in rural areas where fiber deployment is not commercially viable. Other AltNets like Hyperoptic are already well established, deploying and operating an FTTP network in high-density areas, which connects existing and new multi-dwelling buildings.

Take-up rates come with challenges

As fiber rollout nears completion in some countries, the focus shifts to selling fiber subscriptions to households that are within fiber network coverage. Sweden leads with an 80.1% consumer take-up rate (proportion of households that subscribed to and are actively using fiber-optic broadband services), but Spain, Norway, and France also boast high rates above 70%. 

Chart of FTTP Take-up Rate in European Countries

Sweden was the country that pioneered the open access model for fiber networks to drive competition and contributed to the country’s high fiber broadband penetration rates. Fiberhost, a Polish open-access network provider, is a significant beneficiary of EU funds, with 99% of funding for building the country’s fiber network in white spot areas (areas with limited or no access to high-speed internet).

There also has been notable progress in the wholesale networks market in Europe, some of which look to connect remote and rural areas. The Italian wholesale operator, Open Fiber, is partially funded by the country’s National Recovery and Resilience Plan (PNRR), with the goal of connecting the grey areas (where no other operator has plans to develop an NGA network) to gigabit speeds. 

However, challenges persist in convincing consumers to switch to full fiber, even in countries with high take-up rates. For instance, a joint venture by Orange conducted a survey in rural areas of France to understand why households with FTTH access hadn’t upgraded to fiber services. The study revealed that 42% found their current internet sufficient, while 37% said incentives would encourage them to upgrade. Incentives and other initiatives are being implemented to migrate customers onto fiber networks in many countries in the region and across the world. 

Future Initiatives and Investments

Fiber offers superior internet speeds, lower latency, enhanced security, and environmental sustainability – a noteworthy upgrade from copper networks and also a path forward for some cable operators (instead of DOCSIS 4.0). AltNets are making strides in driving fiber deployment across Europe, pushing toward the EC’s ambitious goals of achieving a gigabit society.

Despite progress, obstacles remain in convincing consumers to fully transition to fiber services. Comprehending consumer behavior, promoting fiber benefits, and inspiring initiatives will all play significant roles in this endeavor. Likewise, continued investments must be made to keep Europe on track to attain its connectivity targets

For more insightful updates on Europe’s fiber connectivity status, look forward to the Network X event in October 2023. It’ll offer a live pulse on the latest developments in fiber connectivity. We will continue to follow European countries’ progress toward Gigabit society and monitor its impact on fixed broadband speeds. If you’d like to learn more about internet speeds and speed performance in other markets around the world, visit the Speedtest Global Index™.

You can also register for our upcoming webinar, “Accelerating Europe’s Gigabit Revolution” on Wednesday, November 8 at 9 a.m. CET (GMT+1). A panel of industry experts will come together to discuss how Gigabit Society fits into Europe’s digital transformation strategy and propose strategies to ensure digital access for all. A recording will be provided for registrants who can’t join the live presentation. Register now

Ookla retains ownership of this article including all of the intellectual property rights, data, content graphs and analysis. This article may not be quoted, reproduced, distributed or published for any commercial purpose without prior consent. Members of the press and others using the findings in this article for non-commercial purposes are welcome to publicly share and link to report information with attribution to Ookla.