| June 11, 2025

How Spain's Mobile Networks Performed During the Iberian Grid Collapse [Visualized] | Cómo Se Comportaron Las Redes Móviles Españolas Durante El Colapso De La Red Ibérica

Spanish/Español

Variation in outage scale and duration across mobile operators during the April 28th event reinforces the case that robust power resilience is now the single most decisive factor in preserving service continuity in mobile networks

The Iberian grid collapse stands as the starkest demonstration yet of the fragility of mobile network infrastructure precisely when it is needed most. Public scrutiny following the historic event has centred on understanding and ultimately mitigating the societal vulnerabilities stemming from mobile networks’ inherent reliance on a constant grid power supply, which is increasingly difficult to guarantee as severe events become more frequent.

For the first time, and with the goal of fostering deeper understanding of the interdependence between mobile and power infrastructure in Europe, Ookla is publishing detailed data exposing the scale and geographic distribution of mobile network disruptions caused by the April 28th event. Building on our earlier analysis, this research reveals that the impact of the power outage on mobile network infrastructure varied significantly across operators, with differing levels of power backup penetration likely a critical factor shaping the severity experienced by end users.

Key Takeaways:

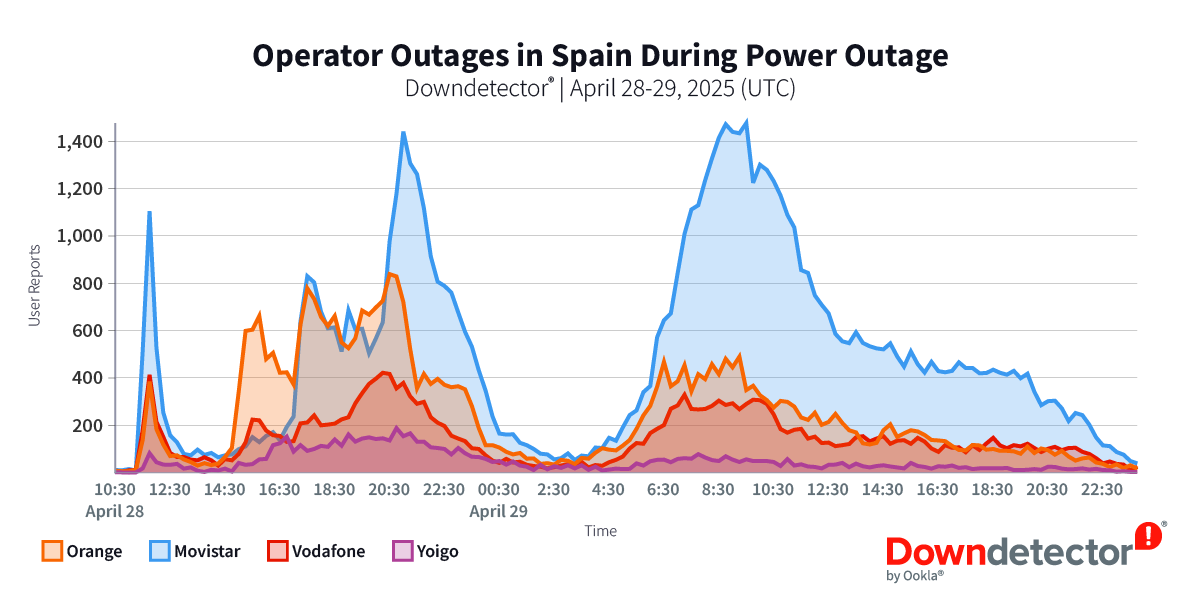
  • At the peak of the April 28th blackout, more than half of all mobile network users across large parts of Spain were left completely without mobile signal. The proportion of mobile network users experiencing complete service loss (unable to call, text, or use data due to sites going dark) surged from a pre-blackout baseline of under 0.5% to more than 50% across extensive areas of Spain at the peak late on April 28th. This indicates a severe, widespread, and historic collapse of the mobile site grid that deepened throughout the afternoon and evening on the day of the blackout as available power backups were progressively depleted.
  • The timing and distribution of mobile network outages closely tracked the pattern of power grid events, underlining the telecom infrastructure’s vulnerability to even brief interruptions in power supply. Within 30 minutes of the grid failure (by 13:00 CET), the proportion of users with no service surged as small cells and sites with minimal power backup and battery autonomy went offline. After two hours, about 12% of users on the most affected operator had no service. Outage growth then slowed, suggesting that remaining macro sites, likely equipped with four-to-six hour battery banks, kept operating until their reserves ran out, leading to a final sharp wave of service loss in the late evening. The restoration of mobile services tracked the geographically-phased re-energisation of the power grid, with network disruptions persisted longer into the night in parts of Andalusia and Galicia.
  • While severe network outages were observed across all Spanish operators during the blackout, mobile users on the Vodafone network were less likely to experience a complete service loss. Four-to-eight hours after the grid collapse, the interval in which every operator hit its worst point in terms of service loss, Vodafone’s subscribers were, on average, less than half as likely to be left without service as subscribers on Orange’s network and notably less likely than subscribers on Movistar or Yoigo as well.
  • Morocco’s mobile site footprint remained operational throughout April 28th since domestic grid supply was unaffected. However, the country’s reliance on Spain for international connectivity in deeper network layers resulted in cascading failures and severe service degradation. The proportion of mobile users experiencing no service on the Orange Maroc and Maroc Telecom networks remained consistent with the pre-blackout baseline on April 28th, confirming there were no sustained network disruptions at the mobile site level due to grid failure, unlike in Spain and Portugal. However, analysis of Speedtest Intelligence data reveals significant performance degradation still occurred in Morocco, with the median load time for popular websites increasing by more than 20% compared to the same day in the previous week. The quality of experience (QoE) for Orange Maroc subscribers was particularly impacted during the blackout, reportedly due to disruptions in upstream subsea connectivity between Morocco and mainland Spain.

Power Resilience and Energy Management Strategies Shape the Anatomy of Network Outages

The Iberian grid collapse exemplifies a type of stress test becoming increasingly common in Europe—the ability of mobile network infrastructure to withstand prolonged, severe external shocks beyond direct operator, ensuring continuity of service precisely when it is most critical for public safety and societal functioning.

Beyond the April 28th blackout, recent events in the UK and Ireland, where winter storms (especially Storm Éowyn) caused extensive localized damage to electricity distribution networks, and in France, where substation vandalism resulted in brief but severe blackouts in Cannes and Nice, highlight electricity supply disruptions as a principal vulnerability for mobile networks reliant entirely on grid power. These disruptions add to other external vulnerabilities faced by operators, such as terrestrial or subsea fiber connectivity, upstream cloud links, and third-party peering connections.

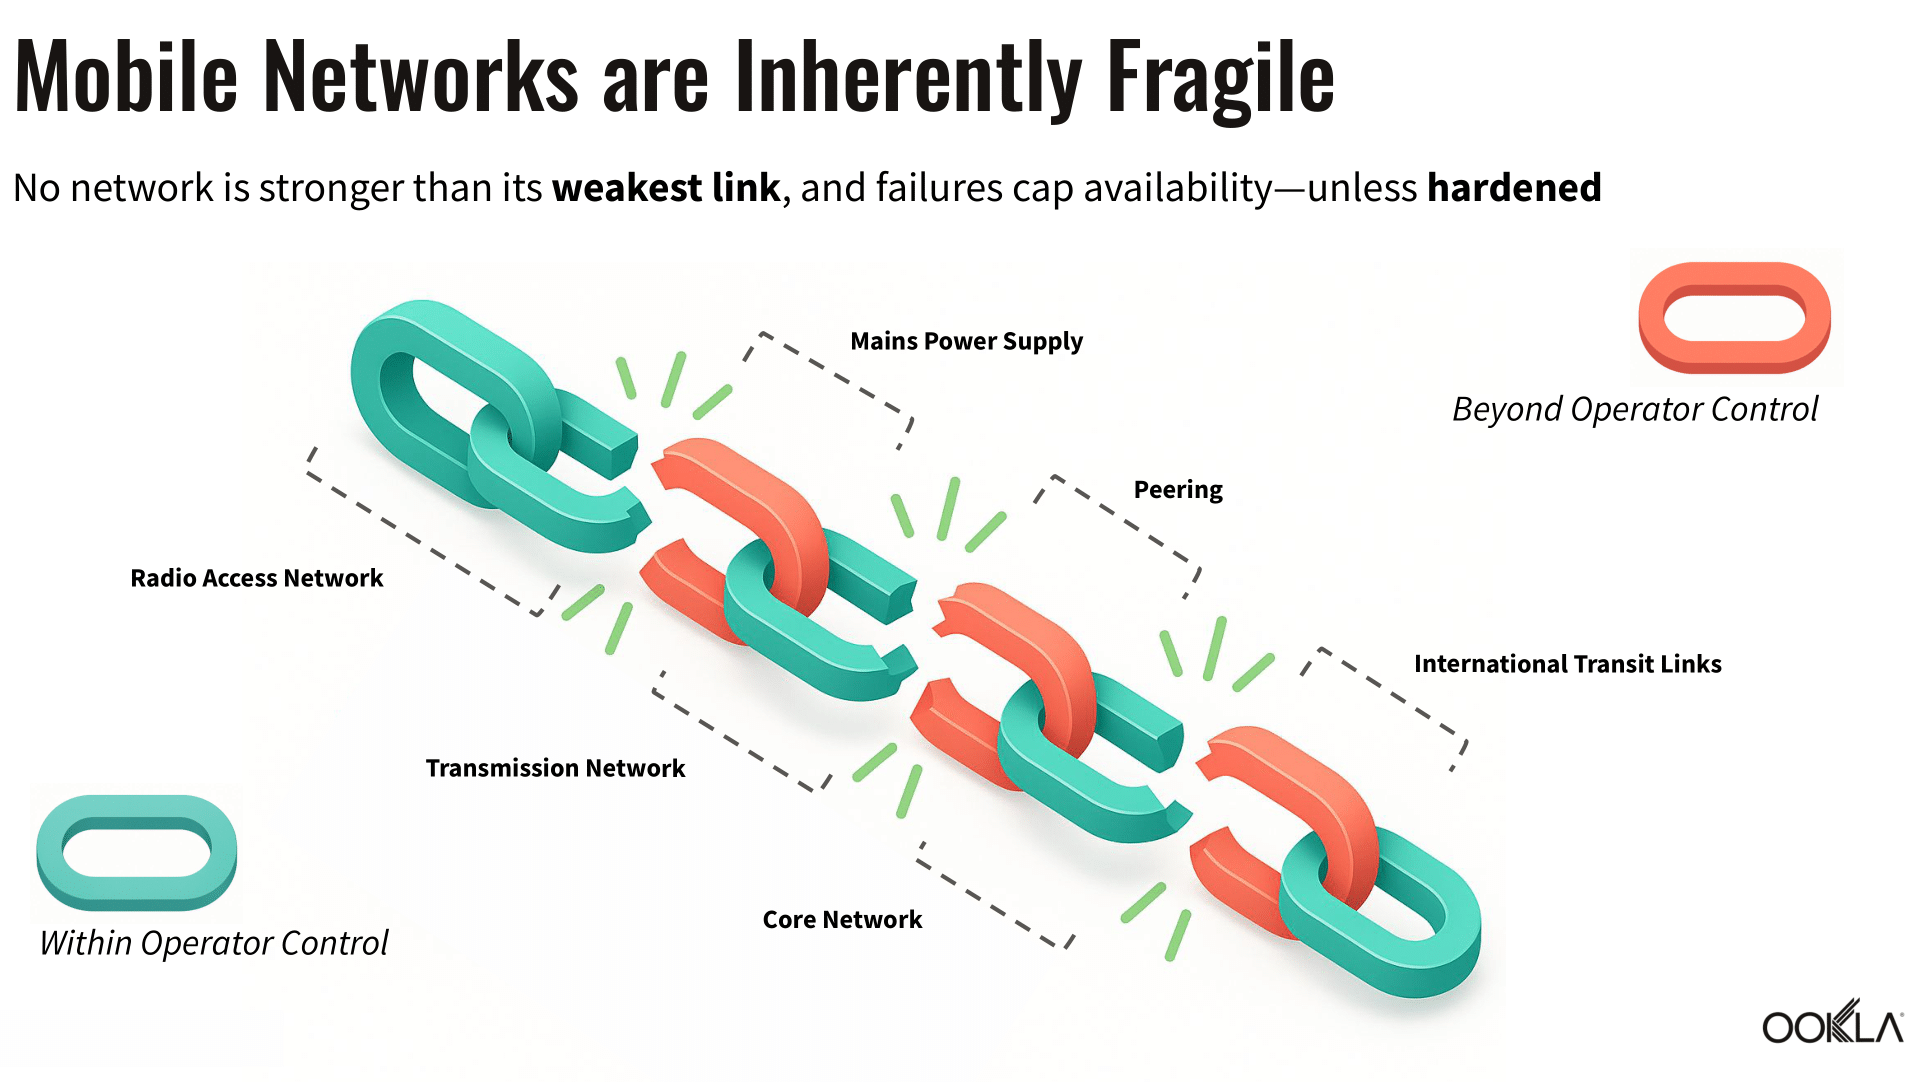
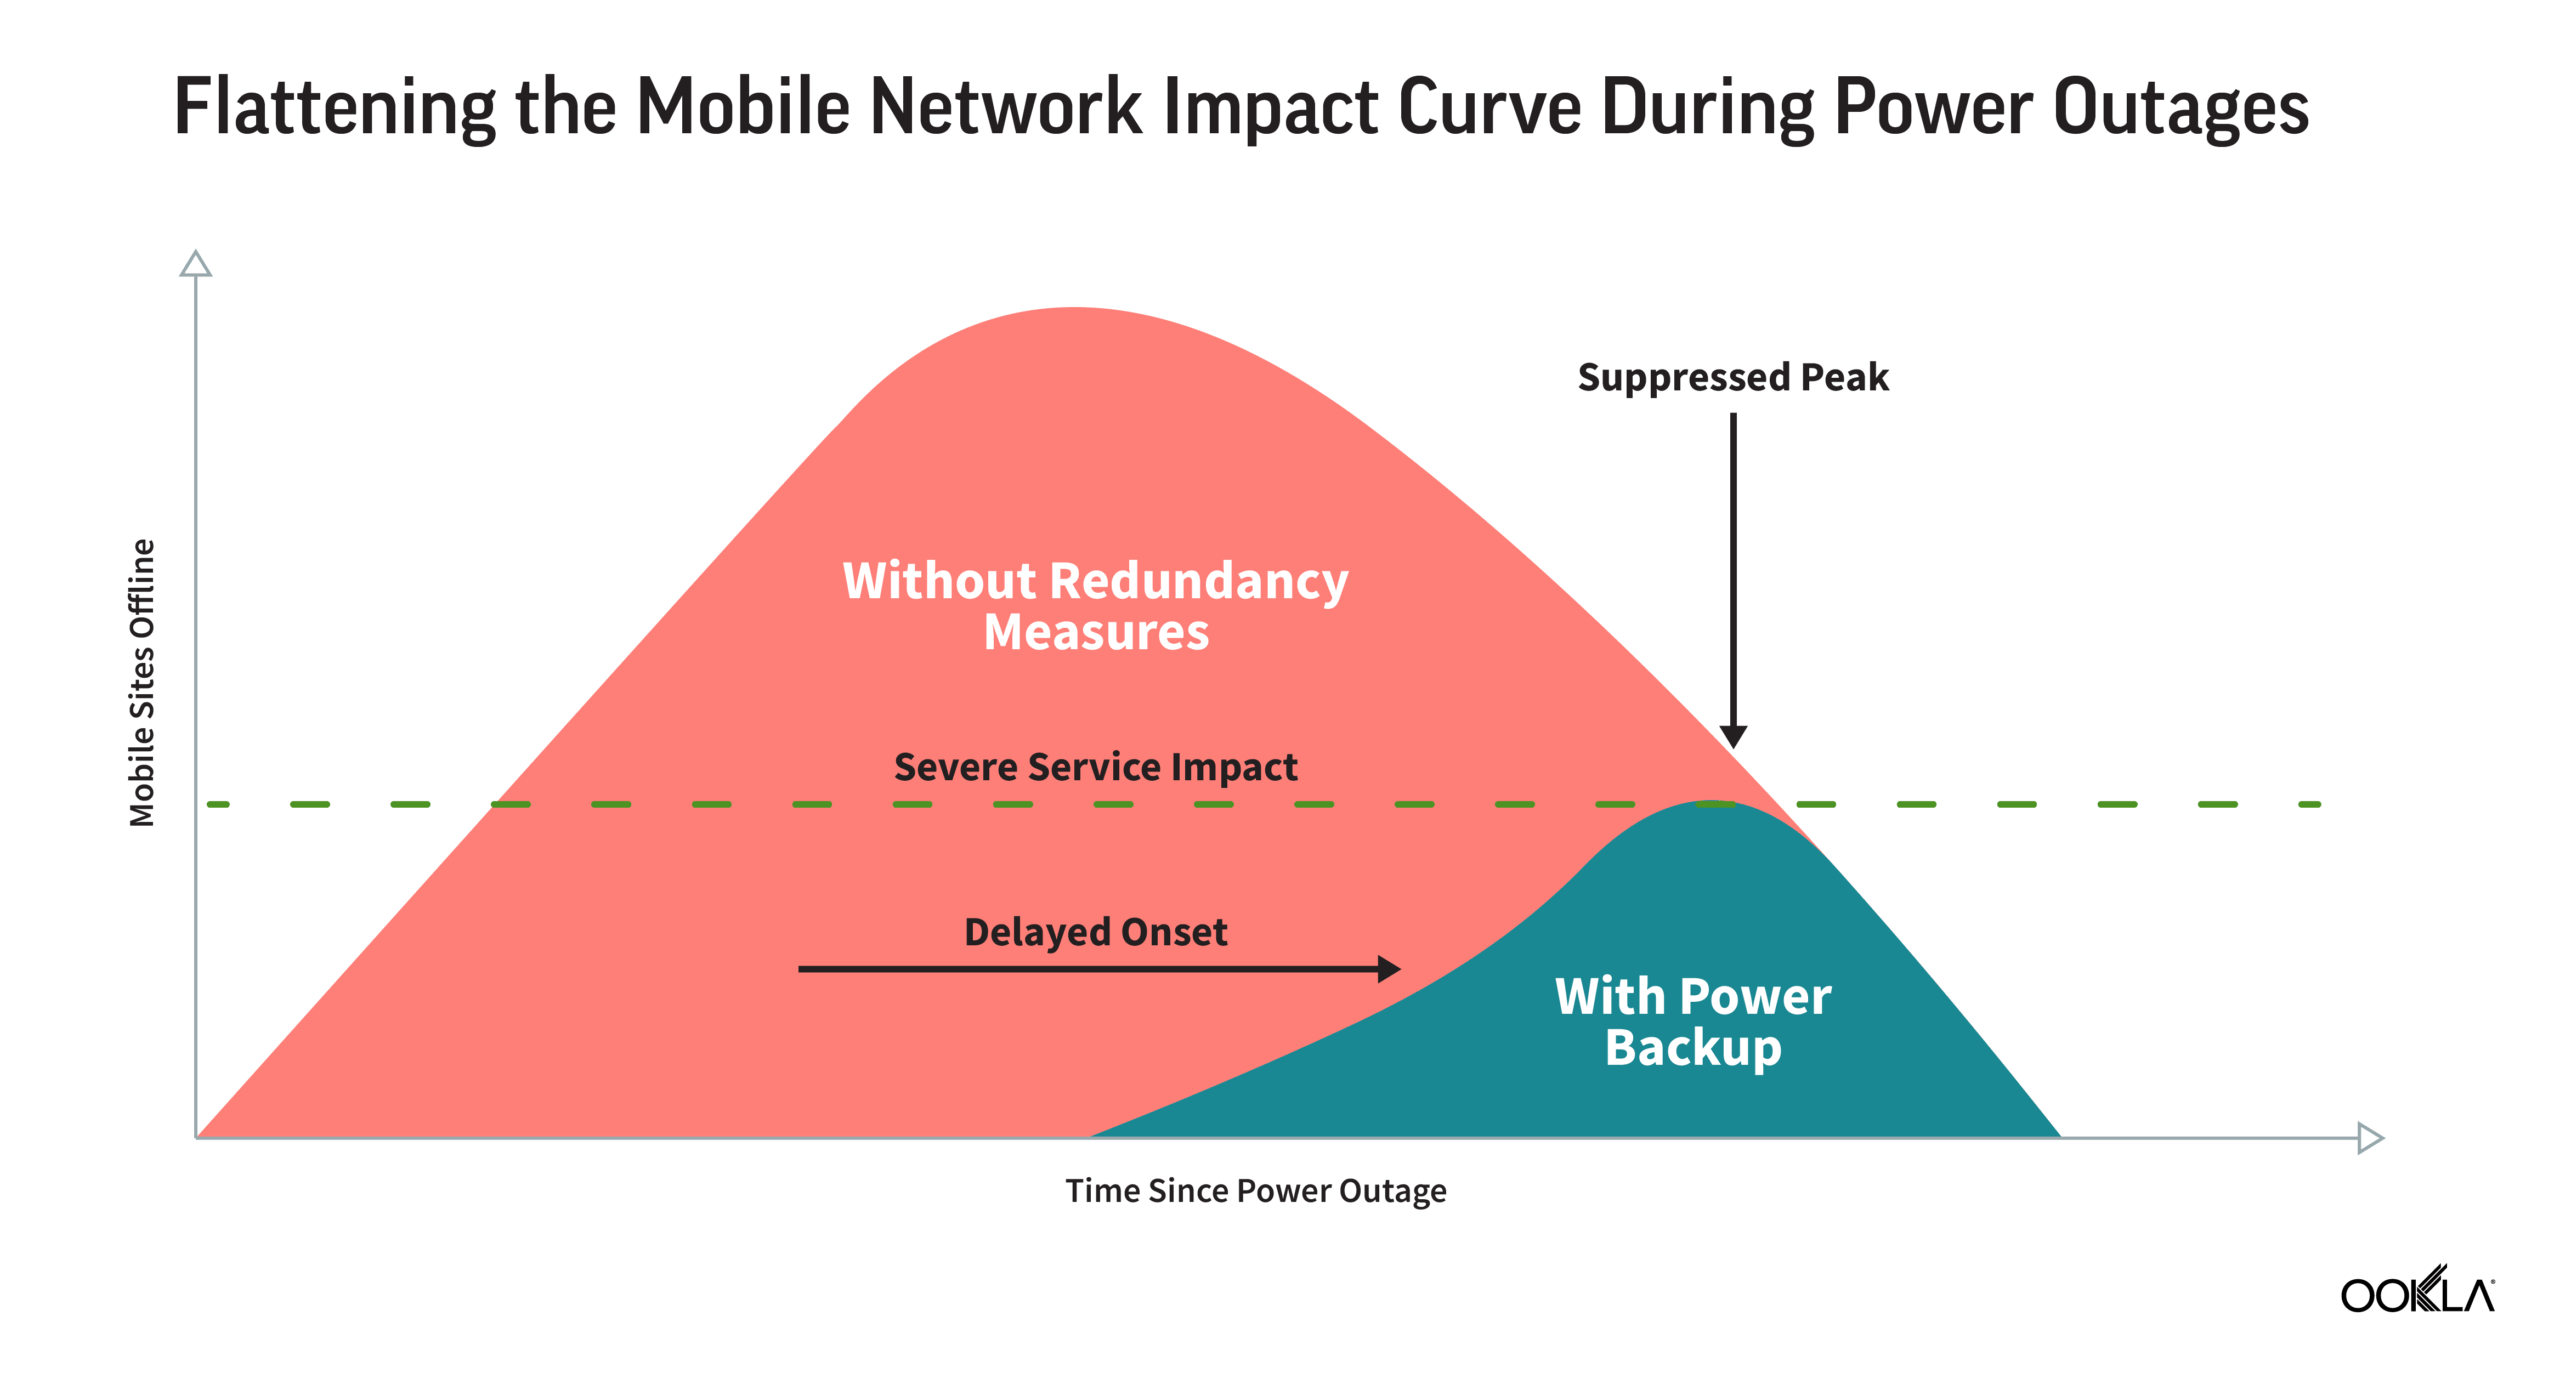
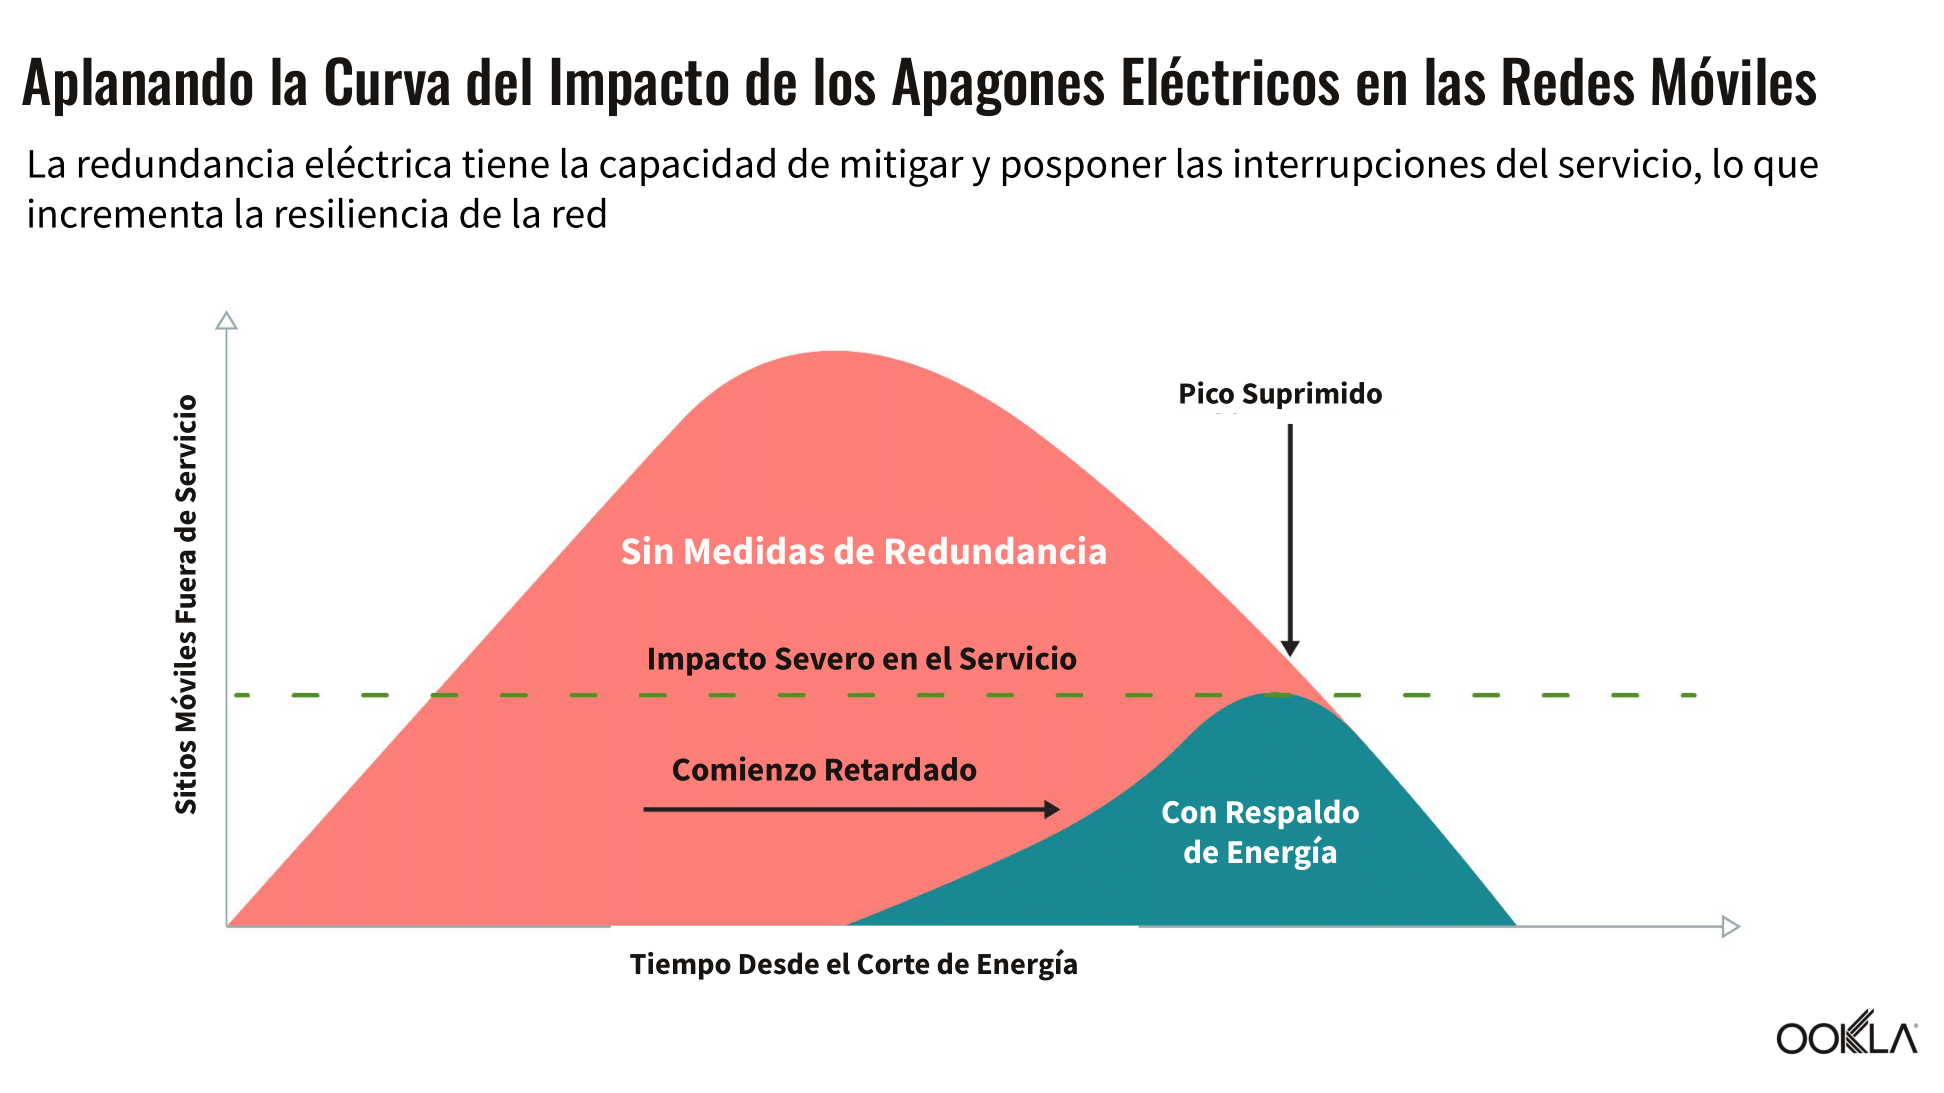
Power resilience, particularly through battery and generator backup systems at mobile sites, has emerged as a key proactive measure to mitigate network outages resulting from electricity grid disruptions. Simply put, backup power serves a role analogous to public health measures in a pandemic: it strategically delays the onset of outages (extending the operational hours before sites lose power) and reduces the peak severity (limiting the total number of sites simultaneously affected).

Capital investments in network hardening tools like power redundancy can therefore “flatten” the service-impact curve during an outage event in the same way public health measures flattened the infection curve during the coronavirus pandemic. Prolonged and wide-area grid disruptions like the one on April 28th, however, demonstrate that no single measure is a silver bullet and long-term power autonomy is often not economically viable across a large proportion of the site footprint. 

Recognizing this, mobile operators typically implement aggressive energy management measures during power disruptions to maximize site uptime and strategically allocate network resources based on user priority. These measures may include throttling site transmit power to reduce coverage footprints, limiting spectrum diversity to limit carrier aggregation and overall capacity, and temporarily disabling newer technologies such as 5G and Massive MIMO to extend battery and generator runtime.

Differences in the extent of power backup deployment and the strategic use of energy conservation and load-shedding measures shape the anatomy of network outages. Such variations among operators may arise from a diversity of fuel choices for backup power (e.g., batteries might offer long-term monetization potential, including opportunities for resale to the grid, but typically have shorter runtimes), network configurations (such as RAN sharing arrangements and site types, with dense urban small cells facing greater physical constraints for power backup deployments), and subscriber base characteristics (e.g., operators serving a larger rural subscriber base face more complex and costly challenges in enhancing network resilience).

Iberian Grid Collapse Cascaded through Mobile Networks in Spain, Moving in Lockstep with Power Disruptions

Analysis of Ookla® background signal scan data reveals that the April 28th event placed unprecedented stress on mobile networks in Spain, triggering a rapid collapse in site grid density. The historic scale of this collapse severely curtailed the coverage footprint of operator infrastructure, pushing a significant share of Spanish mobile subscribers into a ‘no service’ state, unable to connect to a nearby mobile site and thus temporarily unable to make calls, send texts, or use data.

Geospatial sequencing of the ‘no service’ data calculates the average probability that a mobile network user was left without signal during any given time window and serves as a proxy for the overall proportion of subscribers left with no network access. This methodology illustrates that the impact of the power blackout quickly cascaded through Spain’s mobile networks (closely mirroring the infection curve analogy described earlier):

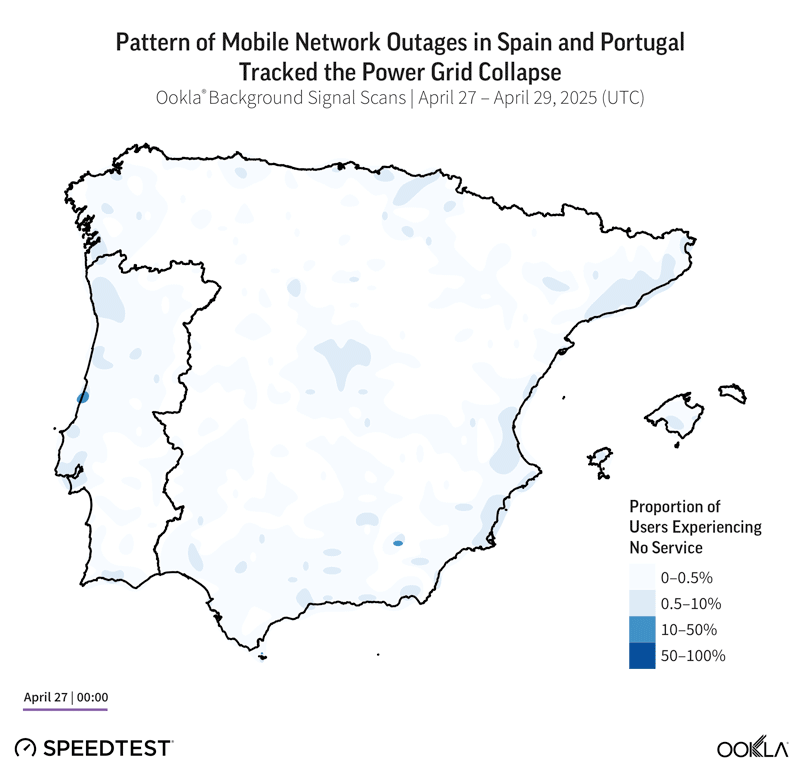
  • Baseline (Pre-Blackout): Mobile sites were operating as normal. The average proportion of subscribers without service was less than 0.5%, reflecting the very high levels of network availability typical of Spain.
  • Initial Impact (Immediate Aftermath of Blackout): The grid collapsed at ~12:33 CET across the Iberian Peninsula, triggering rectifiers or uninterruptible power supply (UPS) devices at mobile sites to switch over to backup batteries or generators (where these were installed and adequately charged or fueled).

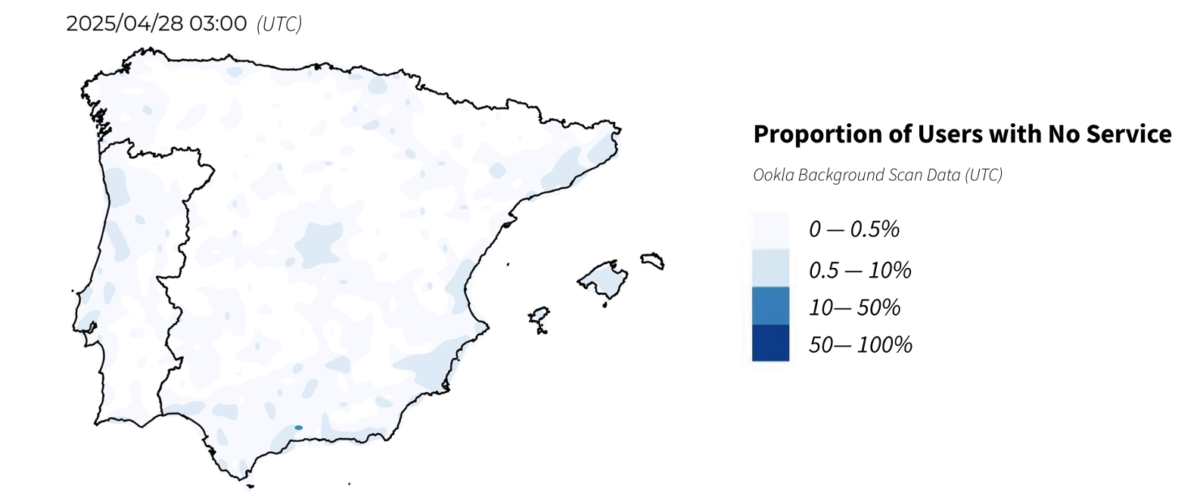
    Within 30 minutes of the voltage drop, the proportion of subscribers without service had climbed well above the pre-event baseline across Spain and the outage curve entered a phase of runaway growth. This limited initial outage impact likely reflected the immediate loss of a small portion of the overall site footprint in areas where power backup was either absent or severely limited in capacity—most commonly at small cell sites in dense urban environments, where physical space restricts battery or generator installations, or at remote rural sites lacking redundancy (or featuring generators that took longer to switch over and come online).

    Notably, the balanced geographical spread of subscribers beginning to experience no service on their devices (i.e. losing network access) at the start of the network outages suggests that the timing of impacts was broadly consistent across Spain, affecting both rural and urban regions. However, the initial severity was more pronounced in areas along the east and south coasts, as well as in the interior of the country, potentially indicating a lower level of power autonomy at sites in these areas.
  • Ramp-Up (2-8 Hours After Blackout): Within two hours of the blackout, the most affected operator had already seen ~12% of users left with no service. After this point, the rate of outage growth slowed temporarily for several hours. This pattern suggests that the power backup profile of Spanish mobile sites was bi- or tri-modal, with a tiered approach to backup capacity employed by operators (i.e., site autonomy was clustered into configurations like two, four or six-hour power resilience, with battery discharge rates determined by amp-hour capacity and site load at each location).

    As a result of this tiered approach to power autonomy and site load variability, a portion of sites continued operating, likely in a reduced state with aggressive energy conservation measures in place (reflected in marked performance degradation observed in Speedtest Intelligence® data), throughout the afternoon and evening of April 28th.

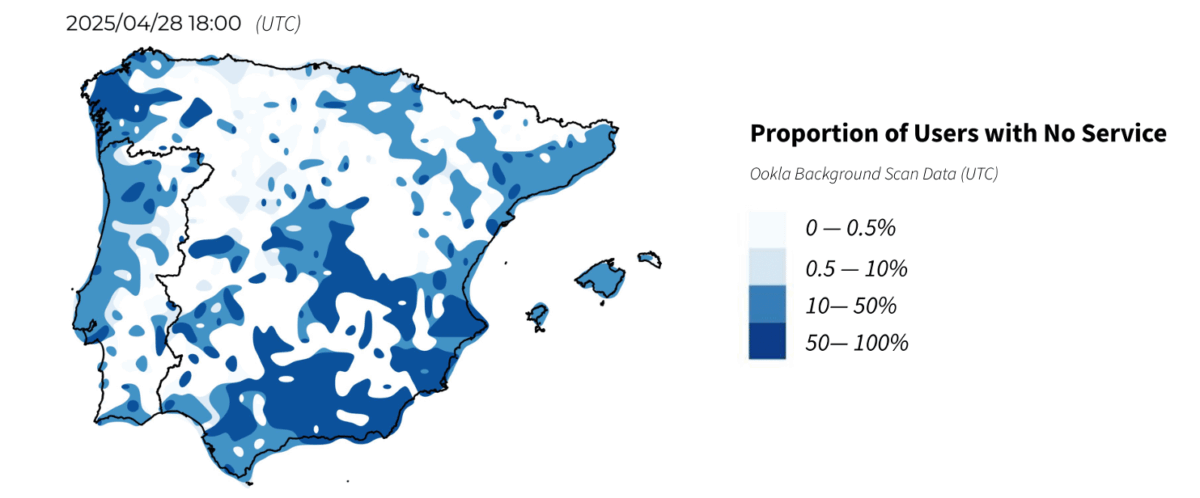
    The eventual depletion of larger power reserves, typically found at major macro sites on lattice or monopole towers, triggered a final sharp wave of network outages four to eight hours after the blackout began. The loss of these wide-area ‘umbrella’ sites in the evening resulted in a substantial share of Spanish mobile subscribers experiencing no service by 21:00 CET, with severe network outages geographically distributed across all of Spain.
  • Peak (8-10 Hours After Blackout): The impact of the blackout on mobile network infrastructure in Spain peaked between 21:00 and 22:00 CET, with more than half of all mobile subscribers left without service across many regions by late evening, just before power began to return. By this stage (about ten hours after the initial power loss), even the most capable battery backups were likely exhausted, leaving only those sites powered by mobile or stationary generators still operational (especially where strategic fuel deliveries could extend uptime). 
  • Recovery (Remainder of April 28th and 29th): Cross-analysis of geospatial sequencing of the no service data with nighttime light emissions detailed in NASA satellite imagery reveals that the recovery of mobile services and the site grid footprint in Spain closely tracked the pattern of grid re-energization. The proportion of users without service began to decline in the mid-afternoon and early evening in the areas where power was first restored, as the grid operator carried out a phased nationwide black-start. This early network recovery was most evident in regions such as the Basque Country, Catalonia, and Castile and León.

    Significant network outages continued into the night in parts of Andalusia and Galicia, meanwhile, mirroring the slower pace of power restoration in these regions. In some parts of Andalusia, for example, more than half of subscribers remained without service by 6:00 a.m. the following morning, only regaining connectivity once power was restored shortly afterwards. The direct relationship between the timing of power restoration and mobile network recovery highlights that operators are wholly dependent on the grid for service continuity once backup systems are inevitably depleted.

Breadth and Depth of Power Autonomy Drives Differences in Network Resilience Outcomes 

The infection curve analogy provides a potent mechanism to visualize and compare network outage profiles and site resilience among Spain’s mobile operators during the blackout. The shape of these outage curves transforms the ‘no service’ data into a story about both network topology and the breadth and depth of power backup deployed across different operators.

In the context of the outage curves, the point where each curve rises from the baseline reflects the level of power autonomy or battery/generator depth. The height of the peak shows how evenly that autonomy is distributed across the site footprint, while the length of the tail can reveal the geographical skew of subscribers within each operator’s network.

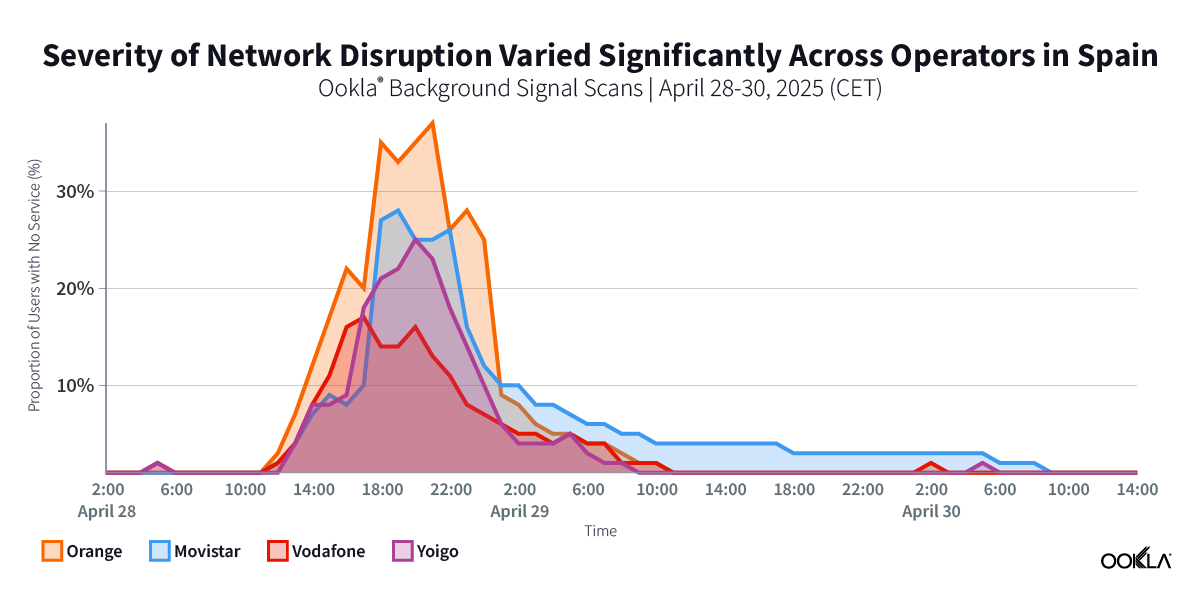
On April 28th, Vodafone exhibited the earliest and lowest outage peak in Spain. The probability that a subscriber on its network was left without service peaked at about half that of Orange and notably below other operators. This early yet suppressed peak indicates a thin but widely deployed power autonomy layer in its network, with small cells (featuring short UPS reserves) dropping out quickly, while most large macro sites carrying modest batteries or generators with different configurations likely kept at least one carrier alive for several hours. This approach of spreading shallow reserves across most sites flattened Vodafone’s outage peak but also pulled it forward in time.

While Orange’s outage curve did not reach its peak until several hours after Vodafone, it is indicative of a strategy that concentrated on thick battery or generator backup at key sites but left a broad swath of sites vulnerable to synchronized collapse (as reflected in the sharp no service spikes), the higher peak suggests a larger share of its subscriber base was likely left with no service during the blackout.

Movistar’s outage profile fell between Vodafone and Orange in both the timing and height of its peak during the blackout, but the recovery of its site footprint was significantly more protracted—taking nearly twice as long (almost a day and a half) as the other operators for the proportion of subscribers with no service to drop below 2%. This is likely an artifact of the unique scale of its rural site and subscriber footprint in Spain, where power backup is often more reliant on generators that require manual intervention and are more limited in deployment due to the economic challenges posed by installation in remote areas. 

Network Resilience is about more than Power Redundancy

While the Iberian blackout may have been a black swan event, the wider global trend of escalating climate, energy, and security-driven shocks impacting multiple layers of telecom infrastructure—often beyond the direct control of mobile operators—has elevated network resilience from a secondary consideration to a core design principle. This shift is reflected in more robust policy oversight (as exemplified in countries like Norway and Finland) and is likely to be underpinned by fiscal subsidies that seek to support the deployment of more power resilience solutions at mobile sites.

Network resilience is, however, more than keeping the lights on; it also depends on other important factors like having diverse, independent paths to the wider internet. On the day of the blackout, Moroccan operators that funnel most of their international traffic through Spanish landing stations lost those paths when the grid collapse knocked Spanish routers and data centers offline.

Since the subsea capacity and routing of some Moroccan operators was dependent on a highly concentrated upstream Spain-centered corridor, there was limited immediate fail-over and users experienced sharp service degradation, even though power and equipment inside Morocco never went down. By contrast, operators that had additional fibers to France or Italy suffered more minor disruptions, highlighting how geographic and upstream diversity are just as critical to mobile network resilience as local power autonomy.


Cómo Se Comportaron Las Redes Móviles Españolas Durante El Colapso De La Red Ibérica

La variación en la escala y duración de las interrupciones entre los operadores de telefonía móvil durante el evento del 28 de abril refuerza la idea de que una sólida capacidad de recuperación energética es ahora el factor más decisivo para garantizar la continuidad del servicio en las redes móviles.

El colapso de la red ibérica es la demostración más clara de la fragilidad de la infraestructura de las redes móviles precisamente cuando más se necesita. El debate público tras el histórico suceso se ha centrado en comprender y, en última instancia, mitigar las vulnerabilidades sociales derivadas de la dependencia inherente de las redes móviles de un suministro constante de energía de la red, que es cada vez más difícil de garantizar a medida que los incidentes graves se hacen más frecuentes.

Por primera vez, y con el objetivo de fomentar una comprensión más profunda de la interdependencia entre la infraestructura móvil y la eléctrica en Europa, Ookla publica datos detallados que muestran la escala y la distribución geográfica de las interrupciones de la red móvil causadas por el apagón del 28 de abril. Sobre la base de nuestro análisis anterior, esta investigación revela que el impacto del corte de energía en la infraestructura de red móvil varió significativamente entre los operadores, y que los diferentes niveles de penetración de la energía de respaldo son probablemente un factor crítico que determina la gravedad que experimentan los usuarios finales.

Principales Conclusiones:

  • En el punto álgido del apagón del 28 de abril, más de la mitad de los usuarios de redes móviles de amplias zonas de España se quedaron completamente sin señal móvil. La proporción de usuarios de redes móviles que experimentaron una pérdida completa del servicio (sin poder llamar, enviar mensajes de texto o utilizar datos debido a que los sitios se habían quedado sin señal) pasó de un valor de referencia previo al apagón inferior al 0,5% a más del 50% en amplias zonas de España en el punto álgido del 28 de abril. Esto indica un colapso grave, generalizado e histórico de la red de telefonía móvil que se agravó durante la tarde y la noche del día del apagón a medida que se agotaban progresivamente las reservas de energía disponibles.
  • El momento y la distribución de los cortes de la red móvil siguieron el patrón de los incidentes de la red eléctrica, lo que evidencia la vulnerabilidad de la infraestructura de telecomunicaciones a las interrupciones, incluso breves, del suministro eléctrico. En los 30 minutos siguientes al fallo de la red (a las 13:00 CET), la proporción de usuarios sin servicio aumentó a medida que se desconectaban las células pequeñas y los emplazamientos con un mínimo de reserva de energía y autonomía de batería. Al cabo de dos horas, alrededor del 12% de los usuarios del operador más afectado carecían de servicio. El aumento de los cortes se ralentizó a continuación, lo que sugiere que los macroemplazamientos restantes, probablemente equipados con bancos de baterías de cuatro a seis horas de autonomía, siguieron funcionando hasta que se agotaron sus reservas, lo que provocó una última y brusca oleada de pérdidas de servicio a última hora de la tarde. El restablecimiento de los servicios móviles siguió el ritmo de la reenergización geográficamente escalonada de la red eléctrica, con interrupciones de la red que se prolongaron hasta bien entrada la noche en partes de Andalucía y Galicia. 
  • Aunque durante el apagón se observaron graves cortes de red en todos los operadores españoles, los usuarios de telefonía móvil de la red de Vodafone tuvieron menos probabilidades de sufrir una pérdida completa del servicio. Entre cuatro y ocho horas después del colapso de la red, el intervalo en el que cada operador alcanzó su peor punto en términos de pérdida de servicio, los abonados de Vodafone tuvieron, de media, menos de la mitad de probabilidades de quedarse sin servicio que los abonados de la red de Orange y notablemente menos probabilidades también que los abonados de Movistar o Yoigo.
  • La red de telefonía móvil de Marruecos permaneció operativa durante todo el 28 de abril, ya que el suministro de la red nacional no se vio afectado. Sin embargo, la dependencia del país de España para la conectividad internacional en capas más profundas de la red provocó fallos en cascada y una grave degradación del servicio. La proporción de usuarios de telefonía móvil sin servicio en las redes de Orange Maroc y Maroc Telecom se mantuvo el 28 de abril en el mismo nivel que antes del apagón, lo que confirma que no se produjeron interrupciones sostenidas de la red en los emplazamientos de telefonía móvil debido a fallos de la red, a diferencia de lo ocurrido en España y Portugal. Sin embargo, el análisis de los datos de Speedtest Intelligence revela que en Marruecos se siguió produciendo una degradación significativa del rendimiento, con un aumento de más del 20% en el tiempo medio de carga de los sitios web más populares en comparación con el mismo día de la semana anterior. La calidad de la experiencia (QoE) de los abonados de Orange Maroc se vio especialmente afectada durante el apagón, al parecer debido a interrupciones en la conectividad submarina ascendente entre Marruecos y España continental.

La resiliencia eléctrica y las estrategias de gestión de la energía determinan la anatomía de los cortes de red

El colapso de la red ibérica ejemplifica un tipo de prueba de resistencia cada vez más habitual en Europa: la capacidad de la infraestructura de redes móviles para resistir perturbaciones externas graves y prolongadas más allá del operador directo, garantizando la continuidad del servicio, precisamente cuando es más crítico para la seguridad pública y el funcionamiento de la sociedad.

Más allá del apagón del 28 de abril, los recientes sucesos en el Reino Unido e Irlanda, donde las tormentas invernales (especialmente la tormenta Éowyn) causaron grandes daños localizados en las redes de distribución eléctrica, y en Francia, donde el vandalismo en subestaciones provocó breves pero graves apagones en Cannes y Niza, ponen de manifiesto que las interrupciones del suministro eléctrico son una de las principales vulnerabilidades de las redes móviles que dependen totalmente de la red eléctrica. Estas interrupciones se suman a otras vulnerabilidades externas a las que se enfrentan los operadores, como la conectividad de fibra terrestre o submarina, los enlaces ascendentes en la nube y las conexiones igualitarias de terceros.

La resiliencia energética, en particular mediante sistemas de baterías y generadores de reserva en los emplazamientos móviles, ha surgido como una medida proactiva clave para mitigar los cortes de red derivados de las interrupciones de la red eléctrica. En pocas palabras, la energía de reserva desempeña un papel análogo al de las medidas de salud pública en una pandemia: retrasa estratégicamente el inicio de los cortes (ampliando las horas operativas antes de que los sites se queden sin energía) y reduce la gravedad máxima (limitando el número total de sitios afectados simultáneamente).

Por tanto, las inversiones de capital en herramientas de refuerzo de la red, como la redundancia de energía, pueden “aplanar” la curva de impacto del servicio durante un apagón, del mismo modo que las medidas de salud pública aplanaron la curva de infección durante la pandemia de coronavirus. Sin embargo, las interrupciones prolongadas y generalizadas de la red, como la del 28 de abril, demuestran que ninguna medida por sí sola es la panacea y que la autonomía energética a largo plazo no suele ser económicamente viable en una gran proporción de la huella del emplazamiento. 

Conscientes de ello, los operadores de telefonía móvil suelen aplicar medidas agresivas de gestión de la energía durante las interrupciones del suministro para maximizar el tiempo de actividad de los emplazamientos y asignar estratégicamente los recursos de red en función de la prioridad de los usuarios. Estas medidas pueden incluir el estrangulamiento de la potencia de transmisión del emplazamiento para reducir las huellas de cobertura, la limitación de la diversidad del espectro para limitar la agregación de portadoras y la capacidad global, y la desactivación temporal de tecnologías más nuevas como 5G y Massive MIMO para ampliar el tiempo de funcionamiento de la batería y el generador.

Las diferencias en el alcance del despliegue de respaldo de energía y el uso estratégico de medidas de conservación de la energía y reducción de la carga conforman la anatomía de los cortes de red. Estas variaciones entre operadores pueden deberse a la diversidad de combustibles elegidos para la energía de reserva (por ejemplo, las baterías pueden ofrecer un potencial de monetización a largo plazo, incluidas las oportunidades de reventa a la red, pero suelen tener tiempos de funcionamiento más cortos), configuraciones de red (como los acuerdos de compartición de RAN y los tipos de emplazamientos, con pequeñas células urbanas densas que se enfrentan a mayores limitaciones físicas para los despliegues de energía de reserva) y características de la base de abonados (por ejemplo, los operadores que atienden a una base de abonados rurales más grande se enfrentan a retos más complejos y costosos para mejorar la resiliencia de la red).

El colapso de la red ibérica se propagó en cascada a través de las redes móviles en España, moviéndose al unísono con las interrupciones del suministro eléctrico

El análisis de los datos de escaneo de señales de fondo de Ookla® revela que el incidente del 28 de abril provocó una tensión sin precedentes en las redes móviles de España, desencadenando un rápido colapso en la densidad de la red. La escala histórica de este colapso redujo gravemente la huella de cobertura de la infraestructura del operador, empujando a una parte significativa de los abonados móviles españoles a un estado de “sin servicio”, incapaces de conectarse a un sitio móvil cercano y, por tanto, temporalmente incapaces de hacer llamadas, enviar mensajes de texto o utilizar datos. 

La secuenciación geoespacial de los datos de “sin servicio” calcula la probabilidad media de que un usuario de red móvil se quedara sin señal durante una ventana temporal determinada y sirve como indicador de la proporción global de abonados que se quedan sin acceso a la red. Esta metodología ilustra que el impacto del apagón se propagó rápidamente en cascada por las redes móviles españolas (reflejando fielmente la analogía de la curva de infección descrita anteriormente):

  • Línea de base (antes del apagón). Los sitios móviles funcionaban con normalidad. La proporción media de abonados sin servicio era inferior al 0,5%, lo que refleja los altísimos niveles de disponibilidad de red típicos de España.
  • Impacto inicial (inmediatamente después del apagón). La red se colapsó en torno a las 12:33 CET en toda la Península Ibérica, lo que provocó que los rectificadores o los dispositivos de alimentación ininterrumpida (SAI) de las ubicaciones móviles pasaran a utilizar baterías o generadores de reserva (cuando éstos estaban instalados y adecuadamente cargados o alimentados). 

    A los 30 minutos de la caída de tensión, la proporción de abonados sin servicio había superado con creces la línea de base anterior al incidente en toda España y la curva de cortes entró en una fase de crecimiento descontrolado. Es probable que este impacto inicial limitado de los cortes reflejara la pérdida inmediata de una pequeña parte de la huella total del emplazamiento en zonas en las que no había suministro eléctrico de reserva o su capacidad era muy limitada, normalmente en emplazamientos de células pequeñas en entornos urbanos densos, donde el espacio físico restringe la instalación de baterías o generadores, o en emplazamientos rurales remotos sin redundancia (o con generadores que tardaron más en conectarse).

    Cabe destacar que la distribución geográfica equilibrada de los abonados que empezaron a quedarse sin servicio en sus dispositivos (es decir, a perder el acceso a la red) al inicio de los cortes de red sugiere que el momento de los impactos fue en general coherente en toda España, afectando tanto a regiones rurales como urbanas. Sin embargo, la gravedad inicial fue más pronunciada en las zonas situadas a lo largo de las costas este y sur, así como en el interior del país, lo que podría indicar un menor nivel de autonomía eléctrica en los emplazamientos de estas zonas. 
  • Recuperación (2-8 horas después del apagón). A las dos horas del apagón, el operador más afectado ya había visto cómo en torno al 12% de los usuarios se quedaban sin servicio. A partir de ese momento, el ritmo de crecimiento de los cortes disminuyó temporalmente durante varias horas. Este patrón sugiere que el perfil de reserva de energía de los sitios móviles españoles era bimodal o trimodal, con un enfoque escalonado de la capacidad de reserva empleada por los operadores (es decir, la autonomía de los sitios se agrupaba en configuraciones como resiliencia de energía de dos, cuatro o seis horas, con tasas de descarga de la batería determinadas por la capacidad de amperios-hora y la carga del sitio en cada ubicación).

    Como resultado de este enfoque escalonado de la autonomía energética y de la variabilidad de la carga del emplazamiento, una parte de los emplazamientos siguieron funcionando, probablemente en un estado reducido con medidas agresivas de conservación de la energía (reflejadas en la marcada degradación del rendimiento observada en los datos de Speedtest Intelligence®), durante toda la tarde y noche del 28 de abril. 

    El agotamiento final de las grandes reservas de energía, que suelen encontrarse en los principales macro-emplazamientos situados en torres de celosía o monoposte, desencadenó una última oleada de cortes de red entre cuatro y ocho horas después del inicio del apagón. La pérdida de estos emplazamientos “paraguas” de área amplia por la noche provocó que una parte sustancial de los abonados móviles españoles se quedaran sin servicio a las 21:00 CET, con graves cortes de red distribuidos geográficamente por toda España.
  • Pico (8-10 horas después del apagón). El impacto del apagón en la infraestructura de la red móvil en España alcanzó su punto álgido entre las 21:00 y las 22:00 CET, con más de la mitad de todos los abonados móviles sin servicio en muchas regiones a última hora de la tarde, justo antes de que empezara a volver la electricidad. Para entonces (unas diez horas después de la pérdida inicial de energía), incluso las baterías de reserva más potentes estaban probablemente agotadas, por lo que sólo quedaban operativas las instalaciones alimentadas por generadores móviles o fijos (especialmente en los casos en que el suministro estratégico de combustible podía prolongar el tiempo de actividad).

  • Recuperación (resto de los días 28 y 29 de abril). El análisis cruzado de la secuencia geoespacial de los datos de ausencia de servicio con las emisiones de luz nocturnas detalladas en las imágenes de satélite de la NASA revela que la recuperación de los servicios móviles y la huella de la red de los emplazamientos en España siguieron de cerca el patrón de reenergización de la red. La proporción de usuarios sin servicio empezó a disminuir a media tarde y a primera hora de la noche en las zonas donde primero se restableció el suministro eléctrico, a medida que el operador de la red realizaba un arranque en negro por fases en todo el país. Esta recuperación temprana de la red fue más evidente en regiones como el País Vasco, Cataluña y Castilla y León.

    Mientras tanto, en algunas zonas de Andalucía y Galicia los cortes de red continuaron durante la noche, reflejando el ritmo más lento del restablecimiento del suministro eléctrico en estas regiones. En algunas zonas de Andalucía, por ejemplo, más de la mitad de los abonados seguían sin servicio a las 6 de la mañana del día siguiente, y sólo recuperaron la conectividad cuando se restableció el suministro poco después. La relación directa entre el momento del restablecimiento del suministro eléctrico y la recuperación de la red móvil pone de manifiesto que los operadores dependen totalmente de la red para la continuidad del servicio una vez que los sistemas de reserva se agotan inevitablemente.

La amplitud y la profundidad de la autonomía eléctrica determinan las diferencias en los resultados de la recuperación de la red 

La analogía de la curva de infección proporciona un potente mecanismo para visualizar y comparar los perfiles de interrupción de la red y la capacidad de recuperación de los emplazamientos entre los operadores móviles españoles durante el apagón. La forma de estas curvas de cortes transforma los datos de “ausencia de servicio” en una historia sobre la topología de la red y la amplitud y profundidad de la reserva de energía desplegada por los distintos operadores.

En el contexto de las curvas de interrupciones, el punto en el que cada curva se eleva desde la línea de base refleja el nivel de autonomía eléctrica o la profundidad de la batería/generador. La altura del pico muestra hasta qué punto la autonomía se distribuye uniformemente a través de la huella del sitio, mientras que la longitud de la cola puede revelar el sesgo geográfico de los abonados dentro de la red de cada operador.

El 28 de abril, Vodafone exhibió el pico de cortes más temprano y más bajo de España. La probabilidad de que un abonado de su red se quedara sin servicio alcanzó un máximo de aproximadamente la mitad que el de Orange y notablemente por debajo de otros operadores. Este pico, temprano pero suprimido, indica una capa de autonomía energética delgada pero ampliamente desplegada en su red, con células pequeñas (que cuentan con reservas cortas de SAI) que se quedan sin servicio rápidamente, mientras que la mayoría de los grandes macroemplazamientos que llevan baterías modestas o generadores con diferentes configuraciones probablemente mantuvieron vivo al menos a un operador durante varias horas. Este planteamiento de repartir reservas poco profundas entre la mayoría de los emplazamientos aplanó el pico de cortes de Vodafone, pero también lo adelantó en el tiempo.

Aunque la curva de cortes de Orange no alcanzó su pico hasta varias horas después que la de Vodafone, es indicativa de una estrategia que se concentró en una reserva de baterías o generadores de gran capacidad en los emplazamientos clave, pero que dejó una amplia franja de emplazamientos vulnerables al colapso sincronizado (como reflejan los fuertes picos sin servicio), el pico más alto sugiere que una mayor parte de su base de abonados probablemente se quedó sin servicio durante el apagón.

El perfil de interrupción de Movistar se situó entre el de Vodafone y Orange tanto en el momento como en la altura de su pico durante el apagón, pero la recuperación de su huella de sitios fue significativamente más prolongada, tardando casi el doble de tiempo (casi un día y medio) que los otros operadores para que la proporción de abonados sin servicio cayera por debajo del 2%. Es probable que esto se deba a la escala única de su presencia rural y de abonados en España, donde la energía de reserva suele depender más de generadores que requieren intervención manual y cuyo despliegue es más limitado debido a las dificultades económicas que plantea la instalación en zonas remotas.

La resiliencia de la red va más allá de la redundancia energética

Si bien el apagón en la Península Ibérica pudo haber sido un evento inesperado, la creciente tendencia global de crisis climáticas, energéticas y de seguridad que impactan múltiples capas de la infraestructura de telecomunicaciones —a menudo fuera del control directo de los operadores móviles— ha elevado la resiliencia de la red de una consideración secundaria a un principio de diseño fundamental. Este cambio se refleja en una supervisión política más exhaustiva (como se ejemplifica en países como Noruega y Finlandia) y es probable que se sustente en subsidios fiscales que buscan apoyar el despliegue de más soluciones de resiliencia energética en las estaciones móviles.

La resiliencia de la red, sin embargo, va más allá de mantener las luces encendidas; también depende de otros factores importantes, como contar con rutas diversas e independientes hacia una internet más amplia. El día del apagón, los operadores marroquíes que canalizan la mayor parte de su tráfico internacional a través de estaciones de aterrizaje españolas perdieron esas rutas cuando el colapso de la red dejó fuera de servicio a los routers y centros de datos españoles.

Dado que la capacidad submarina y el enrutamiento de algunos operadores marroquíes dependían de un corredor de aguas arriba altamente concentrado y centrado en España, la conmutación por error inmediata fue limitada y los usuarios experimentaron una fuerte degradación del servicio, a pesar de que el suministro eléctrico y los equipos dentro de Marruecos nunca se interrumpieron. Por el contrario, los operadores que contaban con fibra adicional con Francia o Italia sufrieron interrupciones menores, lo que pone de manifiesto cómo la diversidad geográfica y de aguas arriba es tan crucial para la resiliencia de la red móvil como la disponibilidad de energía local.

Ookla retains ownership of this article including all of the intellectual property rights, data, content graphs and analysis. This article may not be quoted, reproduced, distributed or published for any commercial purpose without prior consent. Members of the press and others using the findings in this article for non-commercial purposes are welcome to publicly share and link to report information with attribution to Ookla.

| February 15, 2023

Are 5G Networks Meeting Consumers’ Expectations?

Key messages

  • In-market 5G performance varies widely. Reviewing the top 10% and worst 10% of Ookla® Speedtest Intelligence® samples reveals significant variance in the consumer experience on today’s 5G networks, with 5G speeds peaking at over 1 Gbps for the top 10% of users in the U.A.E on average, but falling to below 20 Mbps for the lower 10% in Norway, the U.S., Japan, Germany, and Spain.
  • Median 5G performance is declining in many early launch 5G markets. While understandable as 5G adoption grows and users in more remote locations access 5G, declining median download speeds also point to investment and deployment challenges in some markets. At the same time, many of these markets are facing economic headwinds, placing more emphasis than ever on cost control. As a result, operators must carefully balance network investment priorities.
  • 5G Net Promoter Scores (NPS) significantly higher than 4G LTE in most markets, but waning. With the exception of Sweden and Qatar, all the early launch 5G markets in our analysis saw 5G NPS fall year-over-year. Operators’ 5G NPS still trade at a premium compared to 4G, and while performance is just one part of the equation, operators should take care to build on the positive sentiment that 5G has brought to date.

Despite impressive headline speeds, 5G performance varies a lot

Median 5G performance allows us to gauge the midpoint of user experience on 5G networks, however it doesn’t paint the full picture. While headline 5G speeds impress, Speedtest Intelligence data lays bare the ups and downs of 5G performance for consumers, even in early launch, advanced 5G markets. We recently looked at 5G network performance over high frequency (mmW) bands, painting a view of the true potential of 5G networks. However, if we look at performance on today’s 5G networks, looking beyond the median at the range of performance between users in the top 10% and those in the lower 10%, Speedtest Intelligence data reveals huge variance in the performance users experience.

Chart of psread of 5g performance, top 10% of samples versus median and lower 10%

The U.A.E. was the fastest 5G market in our analysis, based on median download performance of 545.53 Mbps in December 2022, followed by South Korea and Qatar. However, the top 10% of users in the U.A.E. recorded speeds of at least 1,266.49 Mbps on average, while the lowest 10% of users experienced speeds of 127.52 Mbps or slower on average. At the other end of the scale, Spain recorded a median 5G speed of 94.14 Mbps, but also demonstrated wide variance between the top 10% of samples at 537.95 Mbps or faster and the lowest 10% with 10.67 Mbps or less.

Based on many of the marketing messages around 5G, consumers are led to expect a big bang change in performance. However, with 5G operating over a greater range of spectrum bands than previous generations, including high frequency spectrum which has relatively poorer propagation, it’s understandable that 5G performance will vary more than previous generations of mobile network technology.

5G markets set to face performance challenges during 2023

While globally 5G speeds have remained stable, for many of the markets in our analysis, median 5G download speeds have fallen over the past year. The U.S. was the main outlier, recording the strongest uplift in 5G performance as T-Mobile continued to drive home its performance advantage in the market, while Verizon’s performance improved early in 2022 through its deployment of 5G in C-band spectrum. This trend is likely to continue in 2023 in the U.S., as more C-band spectrum is made available. However, the picture remains concerning for a number of other 5G markets, particularly those where median 5G speeds are at the lower end of the spectrum.

Chart of Year-over-Year change in median 5G download performance

In some markets, 5G was initially priced at a premium to 4G, with operators focused on driving incremental returns on the new network technology. However, operators have been increasingly opening up 5G access by removing incremental costs for consumers and adding prepaid plans too. As 5G adoption scales, it places more strain on the new networks. The challenge for many of these markets is that network performance is likely to degrade further unless network densification picks up. 

For network operators, this investment imperative is occuring amidst macroeconomic headwinds, which are driving up operating costs and putting pressure on consumer and enterprise spend. In addition, there remain challenges in deploying additional 5G cell sites in dense urban areas where demand is strongest, while in some markets EMF limits and other regulations can limit the deployment of high-capacity 5G sites.

Degrading 5G performance impacts consumer sentiment

Net Promoter Score (NPS) from Speedtest Intelligence paints a largely positive picture of current 5G networks. NPS is a key performance indicator of customer experience, categorizing users into Detractors (score 0-6), Passives (score 7-8), and Promoters (score 9-10), with the NPS representing the percentage of Promoters minus the percent of Detractors, displayed in the range from -100 to 100. Across the markets we analyzed, 5G users on average rated their network operator with NPS scores that were universally higher than those for 4G LTE users. However, consumer sentiment for users on 5G networks is beginning to shift, with NPS scores falling, coinciding with lower median 5G performance in many of the markets we analyzed.

Chart of 5G uplift in Net Promoter Scores vs. 4G LTE

Declining performance levels will be a factor driving NPS down for some 5G users. It’s also important to remember that as 5G scales in many of these early launch markets, the profile of 5G users is also changing from predominantly urban-based users, to more of a mix of urban, suburban, and rural users, which brings additional coverage and performance challenges for network operators. We plan to examine the relationship between 5G performance and spectrum in an up-coming content piece. Please get in touch if you’d like to learn more about Speedtest Intelligence data.

Ookla retains ownership of this article including all of the intellectual property rights, data, content graphs and analysis. This article may not be quoted, reproduced, distributed or published for any commercial purpose without prior consent. Members of the press and others using the findings in this article for non-commercial purposes are welcome to publicly share and link to report information with attribution to Ookla.

| December 20, 2021

Growing and Slowing: The State of 5G Worldwide in 2021


5G continues to offer new and exciting ways of rethinking everything from streaming video to performing remote surgery. However, not everyone shares equally in these possibilities as many countries do not have access to 5G and even those that do, do not experience the same level of performance from their 5G connections. We examined Speedtest Intelligence® data from Q3 2021 Speedtest® results to see how 5G speeds have changed, where download speeds are the fastest at the country and capital level, where 5G deployments have increased and what worldwide 5G Availability looked like in Q3 2021. We also looked at countries that don’t yet have 5G to understand where consumers are seeing improvements in 4G access.

5G slowed down at the global level

Median-Speeds-Worldwide_1221-01

It’s common to see new mobile access technologies slow down as adoption scales, particularly early on in the tech cycle. Over the past year from Q3 2020 to Q3 2021, the median global 5G download speed fell to 166.13 Mbps, down from 206.22 Mbps in Q3 2020. Median upload speed over 5G also slowed to 21.08 Mbps (from 29.52 Mbps) during the same period.

More users are logging on to existing 5G networks, and we’re also at the stage in the evolution of 5G where countries that have historically had slower speeds are starting to offer 5G. In addition, the widespread use of dynamic spectrum sharing that has been used to boost early 5G coverage weighs on 5G download speeds. While the dip in speeds looks like a letdown, it’s more of a compromise to enable broader access. With additional spectrum and further deployments slated for 2022, we anticipate speeds will begin to pick up again.

South Korea had the fastest 5G in the world

ookla_5g-download_performance_countries_1221-01-1

South Korea had the fastest median download speed over 5G during Q3 2021, leading a top 10 list that included Norway, United Arab Emirates, Saudi Arabia, Qatar, Kuwait, Sweden, China, Taiwan and New Zealand. Sweden, China, Taiwan and New Zealand were new to the top 10 in 2021 while South Africa (whose 5G was brand new last year), Spain and Hungary fell out of the top 10.

5G expanded to 13 additional countries

ookla_5G-map_1221-01

According to the Ookla® 5G Map, there were 5G deployments in 112 countries as of November 30, 2021. That’s up from 99 countries on the same date a year ago. The total number of deployments increased dramatically during the same time period with 85,602 deployments on November 30, 2021 compared to 17,428 on November 30, 2020, highlighting the degree to which 5G networks scaled during the year. Note that there are often multiple deployments in a given city.

Seoul and Oslo lead world capitals for 5G

ookla_5g-download_performance_capitals_1221-01

Speedtest Intelligence data from Q3 2021 shows a wide range of median 5G speeds among global capitals. Seoul, South Korea and Oslo, Norway were in the lead with 530.83 Mbps and 513.08 Mbps, respectively; Abu Dhabi, United Arab Emirates; Riyadh, Saudi Arabia and Doha Qatar followed. Brasilia, Brazil had the slowest median download speed over 5G on our list, followed by Warsaw, Poland; Cape Town, South Africa and Rome, Italy. Stockholm, Sweden and Oslo, Norway had some of the the fastest median upload speeds over 5G at 56.26 Mbps and 49.95 Mbps, respectively, while Cape Town had the slowest at 14.53 Mbps.

The U.S. had the highest 5G Availability

The presence of 5G is only one indicator in a market, because even in markets where 5G has launched, coverage and adoption can be pretty low. We analyzed 5G Availability to see what percent of users on 5G-capable devices spent the majority of their time on 5G, both roaming and on-network during Q3 2021.

ookla_5g-availability_countries_1221-01

The United States had the highest 5G Availability at 49.2%, followed by the Netherlands (45.1%), South Korea (43.8%), Kuwait (35.5%) and Qatar (34.8%). Brazil had the lowest 5G Availability on our list at 0.8%, followed by Sweden (1.5%), South Africa (2.7%), New Zealand (2.9%) and Hungary (3.6%).

Not all 5G networks are created equal

Ookla Speedtest Intelligence data shows a growing disparity in the performance of 5G networks worldwide, even among the pioneer markets who were among the first to launch the new technology. We see leading markets such as South Korea, Norway, the UAE and China pulling well ahead of key European markets, the U.S. and Japan on 5G download speeds, creating what increasingly looks like two tiers of 5G markets.

ookla_5g-download_performance_1221-01

Part of the reason for this divergence is access to key 5G spectrum bands, with Verizon and AT&T in the U.S. for example, soon to deploy their C-band spectrum holdings for 5G use. However, what really seems to separate these markets is the level of 5G network densification. The number of people per 5G base station ranges from 319 in South Korea and 1,531 in China, to 4,224 in the EU and 6,590 in the US, according to the European 5G Observatory’s International Scoreboard during October 2021.

Despite the noise around 6G, 5G still has a long way to run

Median 5G mobile download speeds across these markets are respectable relative to the International Telecommunication Union’s (ITU) IMT-2020 target of 100 Mbps for user experienced download data rates. However, 5G Speedtest® results in each market demonstrate significant variability, with the bottom 10th percentile only recording speeds in excess of the IMT-2020 target in South Korea and Norway, and falling significantly short in many other markets, with Spain, Italy and the U.S. below 20 Mbps.

The story gets worse for upload speeds, where no market’s median speed broke the IMT-2020 recommended 50 Mbps, and where the bottom 10th percentile lay in single digits across the board. Operators are clearly prioritizing download speeds over upload, which makes sense given the asymmetric nature of demand, with most consumer applications requiring higher download speeds. However, as operators increasingly look to target the enterprise market with 5G connectivity and consumer demand for services such as video calling and mobile gaming continues to rise, operators will need to boost upload speeds.

ookla_5g-upload_performance_1221-01-1

Demand for mobile internet bandwidth continues to grow, up 43% year-on-year in Q3 2021 according to Ericsson’s latest mobility report. Looking ahead to 2022, operators will need to increase the capacity of their 5G networks to tackle this growing demand while driving network speeds to new heights. We’ve seen the impact the deployment of new spectrum can have on congested networks during 2021, with Reliance Jio witnessing a bump in 4G LTE performance and consumer sentiment following its acquisition of additional spectrum in India.

Where 5G still fails to reach

Speedtest Intelligence showed 70 countries in the world where more than 20% of samples were from 2G and 3G connections (combined) during Q3 2021 and met our statistical threshold to be included. These are mostly countries where 5G is still aspirational for a majority of the population. As excited as we are about the expansion of 5G, we do not want to see these countries left behind. Not only are 2G and 3G decades old, they are only sufficient for basic voice and texting, social media and navigation apps. To deliver rich media experiences or video calling, users need access to 4G or higher. Having so many consumers on 2G and 3G also prevents mobile operators from refarming that spectrum to make 4G and 5G networks more efficient.

Countries That Still Rely Heavily on 2G and 3G Connections
Speedtest IntelligenceⓇ | Q3 2021
Country 2G & 3G Samples
Central African Republic 89.9%
Palestine 84.7%
Yemen 72.4%
Turkmenistan 71.8%
Micronesia 56.3%
Madagascar 55.0%
Belarus 53.2%
Rwanda 51.7%
Kiribati 48.4%
Equatorial Guinea 47.6%
Afghanistan 44.4%
South Sudan 43.4%
Guyana 42.3%
Guinea 37.0%
Angola 36.8%
Cape Verde 35.9%
Tajikistan 35.6%
Zimbabwe 34.7%
Benin 34.4%
Togo 33.8%
Ghana 33.0%
Sierra Leone 31.7%
Antigua and Barbuda 30.2%
Vanuatu 30.1%
Lesotho 30.0%
Syria 29.6%
Moldova 29.4%
Saint Kitts and Nevis 28.9%
Mozambique 28.8%
Sudan 28.4%
Palau 28.3%
Grenada 28.1%
Tanzania 27.6%
Uganda 27.5%
Niger 27.5%
Gabon 27.5%
Haiti 27.4%
Suriname 27.4%
Tonga 27.3%
Liberia 27.0%
Namibia 26.7%
Swaziland 26.5%
The Gambia 26.3%
Saint Vincent and the Grenadines 26.3%
Dominica 26.3%
Somalia 26.1%
Cook Islands 26.0%
Zambia 25.9%
Barbados 25.7%
Armenia 25.5%
Algeria 25.4%
Papua New Guinea 25.2%
Jamaica 24.5%
Venezuela 24.2%
Ethiopia 24.1%
Uzbekistan 24.0%
El Salvador 23.5%
Honduras 23.1%
Nigeria 23.0%
Solomon Islands 22.8%
Caribbean Netherlands 22.7%
Botswana 22.3%
Anguilla 21.7%
Mauritania 20.6%
Saint Lucia 20.5%
Bosnia and Herzegovina 20.3%
Burundi 20.3%
Ecuador 20.2%
Ukraine 20.1%
Trinidad and Tobago 20.0%

We were pleased to see the following countries come off the list from last year, having dropped below the 20% threshold: Azerbaijan, Bangladesh, Belize, Burkina Faso, Cameroon, Costa Rica, Côte d’Ivoire, DR Congo, Iraq, Kenya, Laos, Libya, Maldives, Mali, Mauritius, Mongolia, Nicaragua, Paraguay and Tunisia. While countries like Palestine, Suriname, Ethiopia, Haiti and Antigua and Barbuda are still on this list, they have improved the percentage of their samples on these outmoded technologies when compared to last year (dropping 10-15 points, respectively), 2G and 3G samples in Belarus increased 6.7 points when comparing Q3 2021 to Q3 2020.

We’re excited to see how performance levels will normalize as 5G expands to more and more countries and access improves. Keep track of how well your country is performing on Ookla’s Speedtest Global Index.

Ookla retains ownership of this article including all of the intellectual property rights, data, content graphs and analysis. This article may not be quoted, reproduced, distributed or published for any commercial purpose without prior consent. Members of the press and others using the findings in this article for non-commercial purposes are welcome to publicly share and link to report information with attribution to Ookla.

| December 18, 2022

Stable and Expanding: The State of Worldwide 5G in 2022


5G is no longer a new technology, however, consumers in many countries are still waiting to see the full benefits of 5G (or even to connect to 5G at all). We examined Speedtest Intelligence® data from Q3 2022 Speedtest® results to see how 5G performance has changed since last year, where download speeds are the fastest at the country level, and how satellite technologies are offering additional options to connect. We also looked at countries that don’t yet have 5G to understand where consumers are seeing improvements in 4G LTE access.

5G speeds were stable at the global level

Graphic of 5G median speed performance worldwide.

In 2021, we discussed how an expansion of 5G access led to a decline in overall speed at the global level. This year showed a stabilization in overall speed, even as 5G access broadened, with a median global 5G download speed of 168.27 Mbps in Q3 2022 as compared to 166.13 Mbps in Q3 2021. Median upload speed over 5G slowed slightly to 18.71 Mbps (from 21.08 Mbps) during the same period. According to the Ookla® 5G Map™, there were 127,509 5G deployments in 128 countries as of November 30, 2022, compared to 85,602 in 112 countries the year prior.

South Korea and the United Arab Emirates led countries for 5G speeds

Chart of fastest countries for median 5G download speed

South Korea and the U.A.E. had the fastest median download speed over 5G at 516.15 Mbps and 511.70 Mbps, respectively, during Q3 2022, leading a top 10 list that included Bulgaria, Qatar, Saudi Arabia, Singapore, Kuwait, New Zealand, Bahrain, and Brazil. Bulgaria, Singapore, Bahrain, and Brazil were new to the top 10 in 2022, while Norway, Sweden, China, and Taiwan fell out of the top 10.

Satellite became more accessible but performance slowed

2022 saw a proliferation of fast, low-earth orbit (LEO) satellite internet from Starlink across the world. Q1 2022 saw Starlink speeds increase year over year in Canada and the U.S., with Starlink in Mexico having the fastest satellite internet in North America, Starlink in Lithuania the fastest in Europe, Starlink in Chile the fastest in South America, and Starlink in Australia the fastest in Oceania.

Q2 2022 saw Starlink speeds decrease in Canada, France, Germany, New Zealand, the U.K., and the U.S. from Q1 2022 as Starlink crossed the 400,000 user threshold across the world. Starlink in Puerto Rico debuted as the fastest satellite provider in North America. Starlink outperformed fixed broadband averages in 16 European countries. Starlink in Brazil had the fastest satellite speeds in South America. And Starlink in New Zealand was the fastest satellite provider in Oceania.

During Q3 2022, Starlink performance dipped once again from Q2 2022 in Canada and the U.S., while remaining about the same in Chile. Starlink in Puerto Rico and the U.S. Virgin Islands had the fastest satellite speeds in North America, while Starlink in Brazil again was the fastest satellite provider in South America.

With Viasat, HughesNet, and Project Kuiper set to launch huge LEO constellations in 2023, consumers around the world are poised to have more fast satellite internet options, particularly as the European Commission makes its own play for a constellation and Eutelsat and OneWeb potentially merging.

5G Availability points to on-going challenges

5G Availability measures the proportion of Speedtest users with 5G-capable handsets, who spend a majority of time connected to 5G networks. It’s therefore a function of 5G coverage and adoption. We see wide disparity in 5G Availability among markets worldwide, with for example the U.S. recording 54.3% in Q3 2022, well ahead of markets such as Sweden and the U.A.E., with 8.6% and 8.3% respectively.

Chart of 5G availability in select markets, based on users with 5G-capable handsets

Critical levers for mobile operators to increase 5G Availability include:

  • Increasing 5G coverage by deploying additional base stations
  • Obtaining access to, or refarming, sub-GHz spectrum, to help broaden 5G coverage, as sub-GHz spectrum has superior propagation properties than that of higher frequency spectrum bands.
  • Encouraging 5G adoption among users with 5G-capable handsets.

Speedtest Intelligence points to 5G adoption challenges in some markets, with 5G Availability dropping in Bulgaria, South Korea, the Netherlands, and the U.A.E. As more users acquire 5G-capable devices, operators need to balance their pricing models to ensure users have sufficient incentives to purchase a 5G tariff.

Chart of percentage change in 5G availability in select markets, based on users with 5G-capable handsets

Where 5G continues to fail to reach

Speedtest Intelligence showed 29 countries in the world where more than 20% of samples were from 2G and 3G connections (combined) during Q3 2022 and met our statistical threshold to be included (down from 70 in Q3 2021). These are mostly countries where 5G is still aspirational for a majority of the population, which is being left behind technologically, having to rely on decades-old technologies that are only sufficient for basic voice and texting, social media, and navigation apps. We’re glad to see so many countries fall off this list, but having so many consumers on 2G and 3G also prevents mobile operators from making 4G and 5G networks more efficient. If operators and regulators are able to work to upgrade their users to 4G and higher, everyone will benefit.

Countries That Still Rely Heavily on 2G and 3G Connections
Speedtest IntelligenceⓇ | Q3 2021
Country 2G & 3G Samples
Central African Republic 76.2%
Turkmenistan 58.5%
Kiribati 51.6%
Micronesia 47.4%
Rwanda 41.1%
Belarus 39.7%
Equatorial Guinea 37.7%
Afghanistan 36.7%
Palestine 33.5%
Madagascar 27.5%
Sudan 27.4%
Lesotho 26.5%
South Sudan 26.3%
Benin 26.0%
Guinea 25.5%
Cape Verde 24.3%
Tonga 24.3%
Syria 23.4%
The Gambia 23.4%
Ghana 23.3%
Palau 22.9%
Niger 22.8%
Tajikistan 22.7%
Mozambique 22.4%
Guyana 21.8%
Togo 21.8%
Congo 21.1%
Moldova 20.8%
Saint Kitts and Nevis 20.0%

We were pleased to see the following countries come off the list from last year, having dropped below the 20% threshold: Algeria, Angola, Anguilla, Antigua and Barbuda, Armenia, Barbados, Bosnia and Herzegovina, Botswana, Burundi, Caribbean Netherlands, Cook Islands, Dominica, Ecuador, El Salvador, Ethiopia, Gabon, Grenada, Haiti, Honduras, Jamaica, Liberia, Mauritania, Namibia, Nigeria, Papua New Guinea, Saint Lucia, Saint Vincent and the Grenadines, Sierra Leone, Solomon Islands, Somalia, Suriname, Swaziland, Tanzania, Trinidad and Tobago, Uganda, Ukraine, Uzbekistan, Vanuatu, Venezuela, Yemen, Zambia, and Zimbabwe. While countries like Belarus, Cape Verde, Central African Republic, Guinea, Guyana, Madagascar, Palestine, Rwanda, South Sudan, Tajikistan, Togo, and Turkmenistan are still on this list, they have improved the percentage of their samples on these outmoded technologies when compared to last year by at least 10 points. Palestine improved by more than 50 points. 2G and 3G samples in Kiribati increased 3.2 points when comparing Q3 2022 to Q3 2021.

We’re glad to see performance levels normalize as 5G expands to more and more countries and access improves and we are optimistic that 2023 will bring further improvements. Keep track of how well your country is performing on Ookla’s Speedtest Global Index™ or track performance in thousands of cities worldwide with the Speedtest Performance Directory™.

Ookla retains ownership of this article including all of the intellectual property rights, data, content graphs and analysis. This article may not be quoted, reproduced, distributed or published for any commercial purpose without prior consent. Members of the press and others using the findings in this article for non-commercial purposes are welcome to publicly share and link to report information with attribution to Ookla.

| March 19, 2025

Fiber-Rich, Wi-Fi Poor: Spain Exemplifies the Scourge of Outdated Wi-Fi | Rica en fibra y pobre en Wi-Fi: España ejemplifica la ‘enfermedad’ del Wi-Fi obsoleto

Spanish/Español

Spain leads Europe in fiber deployment but is now paying the price for neglecting modern Wi-Fi CPE, undermining its global competitiveness in fixed broadband performance. 

Spain’s remarkable transformation from a telecoms laggard a decade ago to a global leader in fiber availability has been dizzying in both scale and speed. Widely hailed as a model of best practice, this transformation has played a key role in vaulting the country to the forefront of Europe in economic growth over the last two years, supporting the attraction of inward investment in precision manufacturing, renewables, and a growing digital nomad community.

If deploying fiber to as many doorsteps as possible were a sprint, Spain would have won hands down. But the real race—the marathon of extending gigabit coverage throughout the entire home, beyond merely the doorstep—requires modernizing Wi-Fi customer premises equipment (CPE). Here, Spain is falling behind, eroding its global competitiveness in fixed broadband performance and limiting Spanish ISPs’ ability to differentiate in a market saturated with multiple overlapping fiber builds.

This chasm between the highly capable fiber connections reaching most Spanish homes and the outdated Wi-Fi equipment delivering that connectivity to end devices exemplifies the paradox of ‘old’ fiber markets like Spain. As an early mover in fiber, Spain migrated from copper before modern Wi-Fi 6 and Wi-Fi 7 CPE—designed to fully leverage fiber’s multi-gigabit potential—became widely available.

Key Takeaways

  • Spain features one of the oldest and least capable Wi-Fi footprints in Europe: By the end of 2024, two-thirds of all Wi-Fi connections in Spain still relied on legacy standards (Wi-Fi 4 and Wi-Fi 5) based on Speedtest Intelligence® data, leaving the country notably behind peers with lower fiber penetration, including neighboring France, the United Kingdom, and all Nordic countries. This deep entrenchment of legacy Wi-Fi standards is artificially constraining the performance of Spain’s full-fiber connections, contributing to its underperformance in the Speedtest Global Index™ compared to countries with less extensive fiber deployment.
  • The capabilities of Spain’s Wi-Fi footprint vary significantly across different ISPs: DIGI has distinguished itself  by offering modern CPE with Wi-Fi 6 as standard across its subscriber base, benefiting from its position as a newer entrant without a legacy customer base. This has driven its strong lead in Wi-Fi 6 penetration in Spain—nearly half of all Speedtest samples on DIGI connections in January used Wi-Fi 6 or 7, compared to less than a quarter on Movistar and Vodafone—enhancing its overall fixed broadband performance. By comparison, ISPs that were slow to introduce modern CPE, such as Movistar, or restricted access to subscribers opting for premium equipment rental add-ons, like Vodafone, retain a much larger share of users on legacy Wi-Fi standards.
  • Modern CPE with Wi-Fi 6 and 7 deliver significant performance gains across all ISPs: The gap between advertised fiber speeds to the doorstep (typically achievable via wired Ethernet) and actual Wi-Fi performance is smallest in homes where Wi-Fi 6 and 7 CPE have been deployed. At the end of 2024, median download speeds on Wi-Fi 6 in Spain reached 419.13 Mbps, exceeding Wi-Fi 5 speeds by more than 54% and surpassing Wi-Fi 4 performance by an order of magnitude. Meanwhile, median latency on Wi-Fi 7 connections (19 ms) was notably improved compared to outcomes on earlier Wi-Fi standards. 

Spain is a victim of its own success, having deployed fiber far and wide before the arrival of Wi-Fi 6 and 7

Spain typifies the legacy Wi-Fi challenges now confronting Europe’s early fiber adopters—countries that moved aggressively to deploy full-fiber networks using GPON (Gigabit Passive Optical Network) technology. The market incumbent, Telefónica, began large-scale fiber deployment in the early 2010s, accelerating from 2015. By the end of the decade, Spain had leapfrogged most countries in fiber coverage and the migration from copper-based DSL, with a groundswell of investment driving multiple overlapping fiber builds across many areas.

The scale of Spain’s success in fiber deployment is often under-appreciated. The European Commission’s latest DESI Index reported that over 95% of Spanish households were passed by a full-fiber network—well above the EU average of 64%. This has placed Spain within striking distance of the Commission’s Digital Decade 2030 target of achieving full-fiber coverage across all member states by the end of the decade.

Spain Continues to Lead Europe in Fiber Deployment
European Commission | DESI 2018 – 2024

Spain’s initial fiber rollouts in the early 2010s coincided with Wi-Fi 4 being the de facto standard for many ISP-supplied CPE. Based on a 2009 standard, Wi-Fi 4 offers theoretical maximum download speeds of up to 600 Mbps. By the peak of fiber deployment in the latter half of the decade, Wi-Fi 5 had become the state-of-the-art standard, delivering peak speeds of 3.5 Gbps and gradually becoming dominant. For instance, in 2016, Telefónica’s Movistar fiber CPE featured a dual-band Wi-Fi 5 model, which was considered high-end at the time.

By the time Wi-Fi 6—the first standard truly designed for multi-gigabit fiber based on XGS-PON (the latest optical networking technology enabling symmetrical speeds of up to 10 Gbps)—became available, Spanish ISPs had already deployed tens of millions of legacy CPE. Analysis of Speedtest Intelligence data reveals that Wi-Fi 4 and Wi-Fi 5 CPE have remained deeply entrenched in Spain’s fiber base, collectively accounting for over 75% of all fixed connections by December 2024, based on Speedtest sample share. 

Competitive dynamics play a key role in shaping Wi-Fi outcomes across countries and ISPs

The long tail of legacy Wi-Fi CPE in Spain stands in stark contrast to other fiber-rich countries like neighboring France, another European leader in fiber deployment—though it lagged behind Spain until recent years. By December 2024, Wi-Fi 6 accounted for nearly a third of all Wi-Fi connections in France, compared to less than a quarter in Spain.

Beyond France’s later fiber deployment timeline compared to Spain, broader competitive dynamics and consumer behavior have likely influenced the differences in Wi-Fi adoption between the two countries. While Spain’s fixed market is highly competitive, it has been led by a few large converged players that have traditionally prioritized convergence and bundling over investing in cutting-edge CPE.

For the most part, Spanish ISPs have traditionally competed on price, content, and speed tiers, with Wi-Fi CPE upgrades not seen as a key differentiator. In France, by contrast, the entry of market disruptor Iliad’s Free at the start of the last decade intensified competition not just on price but also on innovation in the ‘internet box.’ For over a decade, Free set the market pace by integrating cutting-edge technology into its Freebox gateways, from built-in media servers to high-end Wi-Fi.

Wi-Fi 6 Penetration Continues to Rise Slowly in Spain
Speedtest Intelligence® | January 2025

This sparked a ‘box war’ in France, where rival ISPs faced competitive pressure to regularly update their CPE to avoid being outpaced. For example, when Free introduced a Wi-Fi 6-capable Freebox for new subscribers, Orange (Livebox 6) and Bouygues (Bbox Wi-Fi 6) quickly followed suit with their own offerings, treating hardware as a key competitive feature to attract subscribers.

Additionally, French ISPs typically included these newer CPE solutions at no extra cost in standard fiber tariffs. When Orange launched the Livebox 6 in 2022 with Wi-Fi 6E support—leveraging additional spectrum in the 6 GHz band to boost theoretical maximum speeds to 9.6 Gbps—it made the device available to all new fiber customers on eligible tariffs. Free took a similar approach earlier with its mid-range Freebox Pop, adding Wi-Fi 6 support in 2021 for new sign-ups without increasing the base subscription fee.

The absence of a Free-equivalent disruptor in Spain until the later arrival of DIGI, combined with a longstanding focus on bundling and content rather than CPE hardware and multi-gigabit tariffs for competitive differentiation, has likely been a key factor in dampening the adoption of Wi-Fi 6 and 7 in Spain.

DIGI's Emphasis on Modern CPE Drives Leadership in Wi-Fi 6 Penetration
Speedtest Intelligence® | January 2025

  • Telefónica’s Movistar: Movistar introduced its first Wi-Fi 6 CPE (Smart Wi-Fi 6) in mid-2022. The ISP initially sought to monetize the device, charging a one-time installation fee for existing customers while bundling it with a new high-speed multi-gigabit tariff. By January, Wi-Fi 6 accounted for as much as 19% of Movistar’s customer base, based on Speedtest sample share.

    The ISP leveraged its presence at MWC 2025 in Barcelona to unveil plans for a Wi-Fi 7 CPE solution, designed to harness the higher-speed multi-gigabit tariffs enabled by its XGS-PON upgrades and expansion. As it phases out legacy hardware, the ISP is accelerating the migration of subscribers from Wi-Fi 4 and 5 CPE, with Speedtest Intelligence data revealing a progressive decline in Wi-Fi 4 penetration since August last year in Movistar’s base.

    At the start of this year, it announced that all new Movistar fixed subscribers, regardless of tariff tier, would receive its Smart Wi-Fi 6 solution as standard, replacing the previous ‘HGU’ Wi-Fi 5-based offering and replicating the strategy of DIGI.

Movistar is Making Progress in Driving Down Wi-Fi 4 Usage
Speedtest Intelligence® | January 2025

  • Orange: Orange was among the first major ISPs in Spain to introduce Wi-Fi 6 CPE, bringing its Livebox 6 and later Livebox 7 solutions from France to the Spanish market starting in 2021, later extending them to sub-brands like Jazztel. The ISP provided this CPE free of charge to new customers across all tariffs, regardless of speed tier. Like Movistar, it initially charged existing subscribers a (monthly, in this case) fee to upgrade to the new hardware. This relatively early and widespread deployment has given Orange a lead in Wi-Fi 6 adoption over Movistar, with as much as 35% of connections on the ISP using the standard by January, based on Speedtest sample share.

    The ISP has since introduced the ‘Livebox Wi-Fi 7’ CPE solution, bundled with a new suite of 10 Gbps converged fiber tariffs. Leveraging Orange’s XGS-PON footprint, it offers among the highest advertised provisioned speeds in the Spanish market.
  • Vodafone: Vodafone introduced its ‘Wi-Fi 6 Station’ in Spain around mid-2021, making it one of the earliest Wi-Fi 6 solutions in the market. However, the ISP positioned it as a premium add-on rather than a standard feature. While new customers could access the Wi-Fi 6 Station, it was initially bundled with Vodafone’s ‘Super Wi-Fi 6’ service, which required a monthly rental fee unless they were on the top Gigabit plan.

    As a result, customers who did not opt in and pay extra continued to receive the older Wi-Fi 5-based CPE by default (similar to many other ISPs). This approach, combined with the legacy composition of Vodafone’s HFC (hybrid fiber-coaxial) base,  has left the ISP’s Wi-Fi 6 adoption lagging behind competitors, with fewer than 14% of its connections using the standard by January based on Speedtest sample share. 

DIGI is the only Spanish ISP where Wi-Fi 6 penetration surpasses Wi-Fi 5
Speedtest Intelligence® | January 2025

  • DIGI: Unlike other ISPs managing a diverse base of legacy customers across various access technologies and CPE generations, DIGI’s relatively recent entry into the Spanish market has given it a significant competitive advantage, allowing it to build a subscriber base largely equipped with newer Wi-Fi CPE. 

    In early 2022, the ISP introduced a Wi-Fi 6 CPE solution for all its fiber subscribers at no additional cost, ensuring that even customers on DIGI’s basic tariffs received the latest Wi-Fi hardware. This approach has driven rapid Wi-Fi 6 adoption, with penetration surpassing 46% by January. DIGI remains the only Spanish ISP where Wi-Fi 6 represents a larger share of its connection base than Wi-Fi 5, contributing to its lead in fixed download speed performance in the market.

    Building on this, last year, DIGI became the first Spanish ISP to launch a Wi-Fi 7 CPE solution in partnership with ZTE, initially bundling the hardware with its premium ‘Pro-DIGI’ tariffs, which leverage XGS-PON to offer advertised symmetrical speeds of up to 10 Gbps. However, adoption remains limited, with Wi-Fi 7 accounting for less than 1% of Speedtest samples on DIGI in January.

Newer Wi-Fi standards enhance performance across all metrics and Spanish ISPs

Despite the wide variation in Wi-Fi standard adoption among Spanish ISPs, the common feature is that newer CPE models drive significant performance improvements across all metrics. Most notably, Wi-Fi 6 and 7 are playing a key role in narrowing the performance gap between advertised fiber speeds—typically achievable via wired Ethernet—and real-world wireless performance in Spanish homes.

Wi-Fi 6 and Wi-Fi 7 Drive Substantial Performance Gains Across All ISPs and Metrics
Speedtest Intelligence® | January 2025

At the end of 2024, median download speeds on Wi-Fi 7 in Spain reached 664.25 Mbps, surpassing Wi-Fi 6 by 58% and more than doubling speeds on Wi-Fi 5. Median upload speeds on Wi-Fi 7, enhanced by features like Multi-Link Operation (MLO), which enables simultaneous transmissions across multiple spectrum bands, reached 449.69 Mbps—28% higher than Wi-Fi 6 and 51% above Wi-Fi 5. Wi-Fi 7 also delivered marked latency improvements, with a median latency of 19 ms, up to 12% lower than Wi-Fi 6.

Wi-Fi 7 is Key to Unlocking the Full Potential of Multi-Gigabit Fiber Tariffs
Speedtest Intelligence® | January 2025

The proliferation of multi-gigabit tariffs with XGS-PON, which has progressed more slowly in Spain than in other fiber-rich markets like France but is now accelerating thanks to moves by ISPs like DIGI and Orange, underlines the need for CPE capable of fully utilizing provisioned speeds and spreading gigabit performance throughout the home. Speedtest Intelligence data reveals that early Wi-Fi 7 CPE deployments are the first to achieve median download speeds exceeding 1 Gbps at the 90th percentile in Spain, showcasing how Wi-Fi 7’s technical advances like wider channel bandwidth and higher modulation are emerging as key differentiators for the technology in the premium segment.

Newer Wi-Fi Generations Drive Latency Improvements
Speedtest Intelligence® | January 2025

Driving adoption of newer Wi-Fi standards requires fresh strategies but create new revenue opportunities for ISPs

As advanced fiber markets like Spain mature, the focus is shifting from simply delivering gigabit speeds to the doorstep to ensuring seamless whole-home performance that meets the diverse demands of emerging connected devices. As a result, investments in enhancing the Wi-Fi experience through ISP-supplied CPE will be key to differentiating multi-gigabit tariffs beyond price and ensuring the full potential of fiber connections can be realised.

Spain must accelerate the modernization of its Wi-Fi base to fully capitalize on substantial investments in XGS-PON, deliver meaningful improvements in quality of experience (QoE) for consumers, and catch up with leading markets in the Nordics. Spanish ISPs can take cues from neighboring countries like France, where CPE upgrades are bundled with tariff speed upgrades, and targeted swap-and-replace programs systematically identify and phase out legacy Wi-Fi hardware to drive adoption of next-generation Wi-Fi 6 and 7 equipment. Recent moves by ISPs like Telefónica’s Movistar to sunset legacy CPE and provide Wi-Fi 6 solutions as standard are evidence of progress in this respect.

Leading European ISPs that have prioritized consumer awareness of Wi-Fi standards and their impact on fiber performance—while modernizing their Wi-Fi CPE base to support monetizable offerings like minimum speed guarantees in every room—are seeing tangible benefits. This strategy not only enhances the overall fixed broadband experience but also unlocks new revenue streams through service differentiation.


Rica en fibra y pobre en Wi-Fi: España ejemplifica la ‘enfermedad’ del Wi-Fi obsoleto

España lidera Europa en despliegue de fibra, pero está pagando el precio de descuidar la modernización de equipos Wi-Fi, lo que socava su competitividad global en rendimiento de banda ancha fija.

La notable transformación de España, que hace una década pasó de ser un país rezagado en telecomunicaciones a convertirse en líder mundial en disponibilidad de fibra, ha sido vertiginosa tanto en escala como en velocidad. Aclamada ampliamente como modelo de buenas prácticas, esta transformación ha desempeñado un papel clave para que el país se sitúe a la vanguardia de Europa en crecimiento económico durante los dos últimos años, apoyando la atracción de inversión en fabricación de precisión, energías renovables y una creciente comunidad de nómadas digitales.

Si el despliegue de fibra en el mayor número posible de hogares fuera una carrera de velocidad, España habría ganado sin duda alguna. Pero la verdadera carrera -la maratón de extender la cobertura gigabit a todo el hogar, más allá de la puerta- requiere modernizar los equipos Wi-Fi de las instalaciones del cliente (CPE). En este aspecto, España se está quedando rezagada, lo que merma su competitividad global en rendimiento de banda ancha fija y limita la capacidad de los proveedores de servicios de internet (ISP) españoles para diferenciarse en un mercado saturado con múltiples despliegues de fibra que se solapan. 

Este abismo entre las conexiones de fibra de alta capacidad que llegan a la mayoría de los hogares españoles y los anticuados equipos Wi-Fi que suministran esa conectividad a los dispositivos finales ejemplifica la paradoja de los “antiguos” mercados de fibra como España. Como pionera en fibra, España migró desde el cobre antes de que los modernos CPE Wi-Fi 6 y Wi-Fi 7 -diseñados para aprovechar al máximo el potencial multi-gigabit de la fibra- estuvieran ampliamente disponibles.

Aspectos Clave:

  • España cuenta con una de las huellas Wi-Fi más antiguas y menos capaces de Europa. A finales de 2024, dos tercios de todas las conexiones Wi-Fi en España todavía dependían de estándares heredados (Wi-Fi 4 y Wi-Fi 5), dejando al país notablemente por detrás de sus iguales con menor penetración de fibra, incluyendo la vecina Francia, el Reino Unido y todos los países nórdicos. Este profundo arraigo de los estándares Wi-Fi heredados está limitando artificialmente el rendimiento de las conexiones de fibra de España, contribuyendo a su bajo rendimiento en el Speedtest Global Index™ en comparación con países con un despliegue de fibra menos extenso.
  • Las capacidades de la huella Wi-Fi de España varían significativamente entre los distintos ISP. DIGI se ha distinguido por ofrecer CPE modernos con Wi-Fi 6 como estándar a toda su base de abonados, beneficiándose de su posición como nuevo operador sin una base de clientes heredada. Esto ha impulsado su fuerte liderazgo en la penetración de Wi-Fi 6 en España -casi la mitad de todas las muestras de Speedtest en conexiones de DIGI en enero utilizaban Wi-Fi 6 o 7, frente a menos de una cuarta parte en Movistar y Vodafone-, mejorando su rendimiento global de banda ancha fija. En comparación, los ISP que tardaron en introducir CPE modernos, como Movistar, o que restringieron el acceso a los abonados que optaron por complementos de alquiler de equipos premium, como Vodafone, conservan una cuota mucho mayor de usuarios con estándares Wi-Fi heredados.
  • Los CPE modernos con Wi-Fi 6 y 7 ofrecen importantes mejoras de rendimiento en todos los proveedores. La diferencia entre las velocidades de fibra anunciadas hasta la puerta de casa (normalmente alcanzables a través de Ethernet por cable) y el rendimiento Wi-Fi real es menor en los hogares en los que se han desplegado CPE Wi-Fi 6 y 7. A finales de 2024, las velocidades medianas de descarga en Wi-Fi 6 en España alcanzaron los 419,13 Mbps, superando las velocidades de Wi-Fi 5 en más de un 54% y el rendimiento de Wi-Fi 4 en un orden de magnitud. Mientras tanto, la latencia mediana de las conexiones Wi-Fi 7 (19 ms) mejoró notablemente en comparación con los resultados de los estándares Wi-Fi anteriores.

España, víctima de su propio éxito: desplegó fibra por todas partes antes de la llegada de Wi-Fi 6 y 7

España es un ejemplo típico de los retos que plantea el Wi-Fi heredado a los que fueron los primeros en adoptar la fibra óptica en Europa, países que se lanzaron a desplegar redes de fibra completa con tecnología GPON (Gigabit Passive Optical Network, red óptica pasiva Gigabit). En este sentido, Telefónica inició el despliegue de fibra a gran escala a principios de la década de 2010 y lo aceleró a partir de 2015. A finales de la década, España se había adelantado a la mayoría de los países en cobertura de fibra y en la migración desde la DSL basada en cobre, con una inversión que impulsó múltiples despliegues de fibra superpuestos en muchas zonas. 

A menudo se subestima la magnitud del éxito de España en el despliegue de fibra. El último índice DESI de la Comisión Europea indica que más del 95% de los hogares españoles contaban con una red de fibra óptica, lo que sitúa al país muy por encima de la media de la UE (64%). Esto ha colocado a España a una distancia asombrosa del objetivo de la Comisión para la Década Digital 2030 de lograr una cobertura total de fibra en todos los Estados miembros al final de la década.

España sigue liderando Europa en despliegue de fibra
Comisión Europea | DESI 2018-2024

Los despliegues iniciales de fibra en España a principios de 2010 coincidieron con el hecho de que el Wi-Fi 4 era el estándar de facto para muchos CPE suministrados por los operadores. De acuerdo con una norma de 2009, el Wi-Fi 4 ofrece velocidades máximas teóricas de descarga de hasta 600 Mbps. En el punto álgido del despliegue de fibra en la segunda mitad de la década, el Wi-Fi 5 se había convertido en el estándar de vanguardia, ofreciendo velocidades máximas de 3,5 Gbps y convirtiéndose gradualmente en dominante. Por ejemplo, en 2016, el CPE de fibra de Movistar contaba con un modelo Wi-Fi 5 de doble banda, considerado de gama alta en aquel momento.

Para cuando el Wi-Fi 6 (el primer estándar realmente diseñado para fibra multi-gigabit basado en XGS-PON -la última tecnología de redes ópticas que permite velocidades simétricas de hasta 10 Gbps-) estuvo disponible, los ISP españoles ya habían desplegado decenas de millones de CPE heredados. El análisis de los datos de Speedtest Intelligence revela que los CPE Wi-Fi 4 y Wi-Fi 5 han permanecido profundamente arraigados a la base de fibra de España, representando colectivamente más del 75% de todas las conexiones fijas en diciembre de 2024, según la cuota de muestras de Speedtest. 

La dinámica competitiva desempeña un papel clave en la configuración de los resultados de Wi-Fi de los distintos países e ISP

La gran cantidad de CPE Wi-Fi heredados en España contrasta fuertemente con otros países ricos en fibra, como la vecina Francia, otro líder europeo en despliegue de fibra a pesar de que ha ido a la zaga de España hasta hace pocos años. En diciembre de 2024, el Wi-Fi 6 representaba casi un tercio de todas las conexiones Wi-Fi en Francia, frente a menos de una cuarta parte en España.

Más allá del calendario de despliegue de fibra más tardío de Francia en comparación con el de España, es probable que la dinámica competitiva y el comportamiento de los consumidores hayan influido en las diferencias de adopción del Wi-Fi entre ambos países. Aunque el mercado fijo español es muy competitivo, ha estado liderado por unos pocos grandes operadores convergentes que tradicionalmente han dado prioridad al precio de los paquetes y a los contenidos frente a la inversión en CPE de vanguardia.

En su mayor parte, los ISP españoles han competido tradicionalmente en precio, contenido y niveles de velocidad, sin que las mejoras del CPE Wi-Fi se considerasen un diferenciador clave. En Francia, por el contrario, la entrada en el mercado de Free, de Iliad, a principios de la década pasada, intensificó la competencia no sólo en precios, sino también en innovación en la “caja de Internet”. Durante más de una década, Free marcó el ritmo del mercado integrando tecnología punta en sus pasarelas Freebox, desde servidores multimedia incorporados hasta Wi-Fi de alta gama.

La penetración del Wi-Fi 6 sigue creciendo lentamente en España
Speedtest Intelligence® | Enero 2025

Esto desencadenó una “guerra de cajas” en Francia, donde los operadores rivales se enfrentaron a la presión competitiva de actualizar periódicamente sus CPE para evitar ser superados. Por ejemplo, cuando Free introdujo un Freebox Wi-Fi 6 para nuevos abonados, Orange (Livebox 6) y Bouygues (Bbox Wi-Fi 6) no tardaron en lanzar sus propias ofertas, considerando el hardware como una característica competitiva clave para atraer abonados. 

Además, los ISP franceses solían incluir estas nuevas soluciones CPE sin coste adicional en las tarifas de fibra estándar. Cuando Orange lanzó el Livebox 6 en 2022 con soporte Wi-Fi 6E -aprovechando el espectro adicional en la banda de 6 GHz para aumentar las velocidades máximas teóricas a 9,6 Gbps- puso el dispositivo a disposición de todos los nuevos clientes de fibra con tarifas elegibles. Free ya había adoptado un enfoque similar con su Freebox Pop de gama media, añadiendo la compatibilidad con Wi-Fi 6 en 2021 para los nuevos suscriptores sin aumentar la cuota de suscripción básica.

La ausencia de un disruptor equivalente a Free en España hasta la posterior llegada de DIGI, combinada con un enfoque centrado desde hace tiempo en la paquetización y los contenidos más que en el hardware (CPE) y en las tarifas multi-gigabit para la diferenciación competitiva, ha sido probablemente un factor clave para frenar la adopción de Wi-Fi 6 y 7 en España.

Foco de DIGI en CPE modernos promueve liderazgo en la adopción de Wi-Fi 6
Speedtest Intelligence® | Enero 2025

  • Telefónica: Movistar introdujo su primer CPE Wi-Fi 6 (Smart Wi-Fi 6) a mediados de 2022. Inicialmente, el operador trató de rentabilizar el dispositivo cobrando una cuota única de instalación a los clientes y combinándolo con una nueva tarifa multi-gigabit de alta velocidad. En enero, el Wi-Fi 6 representaba hasta el 19% de la base de clientes de Movistar, según la cuota de muestreo de Speedtest. 

    El operador aprovechó su presencia en el MWC 2025 de Barcelona para desvelar sus planes para una solución CPE Wi-Fi 7, diseñada para aprovechar las tarifas multi-gigabit de mayor velocidad habilitadas por sus actualizaciones y ampliaciones XGS-PON. A medida que va eliminando hardware heredado, el operador está acelerando la migración de abonados desde CPE Wi-Fi 4 y 5. A este respecto, los datos de Speedtest Intelligence revelan un descenso progresivo de la penetración de Wi-Fi 4 desde agosto del año pasado en la base de Movistar. 

    A principios de este año, Movistar anunció que todos sus nuevos abonados de telefonía fija, independientemente del nivel de tarifa, recibirán su solución CPE ‘Smart Wi-Fi 6’, para sustituir la anterior oferta basada en Wi-Fi 5 ‘HGU’, replicando, así, la estrategia de DIGI.

Movistar avanza en la reducción del uso de Wi-Fi 4
Speedtest Intelligence® | Enero 2025

  • Orange: Orange fue uno de los primeros grandes operadores en España en introducir un CPE Wi-Fi 6, al traer sus soluciones Livebox 6 y más tarde Livebox 7 de Francia al mercado español a partir de 2021, y extenderlas más tarde a submarcas como Jazztel. El ISP proporcionó este CPE de forma gratuita a los nuevos clientes en todas las tarifas, independientemente del nivel de velocidad. Al igual que Movistar, cobró inicialmente a los abonados existentes una cuota (mensual, en este caso) para actualizar al nuevo hardware. Este despliegue relativamente temprano y generalizado ha dado a Orange una ventaja en la adopción de Wi-Fi 6 sobre Movistar, con hasta un 35% de sus conexiones utilizando el estándar en enero, según la cuota de muestra de Speedtest.

    Desde entonces, el operador ha introducido la solución CPE ‘Livebox Wi-Fi 7’, incluida en un nuevo paquete de tarifas de fibra convergente de 10 Gbps. Aprovechando la huella XGS-PON de Orange, ofrece las velocidades más altas anunciadas en el mercado español.
  • Vodafone: Vodafone introdujo su ‘Wi-Fi 6 Station’ en España a mediados de 2021, lo que la convierte en una de las primeras soluciones Wi-Fi 6 del mercado. Sin embargo, el proveedor la posicionó como un complemento premium más que como una característica estándar. Aunque los nuevos clientes podían acceder al router Wi-Fi 6, en un principio estaba vinculado al servicio ‘Súper Wi-Fi 6’, que exigía una cuota mensual de alquiler a menos que estuvieran en el plan gigabit superior. 

    En consecuencia, los clientes que no optaban por este servicio ni pagaban una cuota adicional seguían recibiendo por defecto el antiguo CPE basado en Wi-Fi 5 (al igual que en el caso de muchos otros operadores). Este enfoque, combinado con la composición heredada de la base HFC (fibra híbrida coaxial) de Vodafone, ha dejado la adopción de Wi-Fi 6 por parte del operador por detrás de sus competidores, con menos del 14% de sus conexiones utilizando este estándar en enero según la cuota de muestreo de Speedtest. 

DIGI es el único ISP español en el que la penetración de Wi-Fi 6 supera la de Wi-Fi 5
Speedtest Intelligence® | Enero 2025

  • DIGI: A diferencia de otros ISP que gestionan una base diversa de clientes heredados a través de diversas tecnologías de acceso y generaciones de CPE, la entrada relativamente reciente de DIGI en el mercado español le ha dado una ventaja competitiva significativa, lo que le ha permitido construir una base de suscriptores en gran parte equipada con CPE Wi-Fi más nuevos. 

    A principios de 2022, el operador introdujo una solución Wi-Fi 6 CPE para todos sus abonados de fibra sin coste adicional, garantizando que incluso los clientes de las tarifas básicas de DIGI recibieran el hardware Wi-Fi más reciente. Este enfoque ha impulsado la rápida adopción del Wi-Fi 6, con una penetración superior al 46% en enero. DIGI sigue siendo el único proveedor español en el que el Wi-Fi 6 representa una cuota mayor de su base de conexiones que Wi-Fi 5, lo que contribuye a su liderazgo en rendimiento de velocidad de descarga fija en el mercado

    Sobre esta base, el año pasado DIGI se convirtió en el primer operador español en lanzar una solución CPE Wi-Fi 7 en colaboración con ZTE, e incluyó inicialmente el hardware con sus tarifas premium ‘Pro-DIGI’, que aprovechan XGS-PON para ofrecer velocidades simétricas anunciadas de hasta 10 Gbps. Sin embargo, la adopción sigue siendo limitada, y el Wi-Fi 7 representó menos del 1% de las muestras de Speedtest en DIGI en enero.

Los nuevos estándares Wi-Fi mejoran el rendimiento en todas las métricas e ISP españoles

A pesar de la amplia variación en la adopción de estándares Wi-Fi entre los ISP españoles, un resultado común es que los nuevos modelos de CPE impulsan mejoras en el rendimiento significativas en todas las métricas. En particular, Wi-Fi 6 y Wi-Fi 7 desempeñan un papel clave en la reducción de la diferencia entre las velocidades de fibra anunciadas -que normalmente se consiguen a través de Ethernet por cable- y el rendimiento inalámbrico real en los hogares españoles.

Wi-Fi 6 y Wi-Fi 7 impulsan mejoras sustanciales en todos los ISP y métricas
Speedtest Intelligence® | Enero 2025

A finales de 2024, las velocidades medianas de descarga en Wi-Fi 7 en España alcanzaron los 664,25 Mbps, superando las de Wi-Fi 6 en un 58% y duplicando con creces las velocidades de Wi-Fi 5. Por su parte, las velocidades medianas de carga en Wi-Fi 7, mejoradas por características como la Operación Multienlace (MLO), que permite transmisiones simultáneas a través de múltiples bandas de espectro, alcanzaron los 449,69 Mbps, un 28% más que en Wi-Fi 6 y un 51% por encima de Wi-Fi 5. El Wi-Fi 7 también ofreció notables mejoras de latencia, con una latencia mediana de 19 ms, hasta un 12% inferior a la de Wi-Fi 6.

Wi-Fi 7 es clave para aprovechar el potencial de las tarifas de fibra multi gigabit
Speedtest Intelligence® | Enero 2025

La proliferación de tarifas multi-gigabit con XGS-PON, que ha progresado más lentamente en España que en otros mercados ricos en fibra, como Francia, pero que ahora se está acelerando gracias a los movimientos de operadores como DIGI y Orange, subraya la necesidad de CPE capaces de utilizar plenamente las velocidades provisionadas y extender el rendimiento gigabit por todo el hogar. Los datos de Speedtest Intelligence revelan que los primeros despliegues de CPE Wi-Fi 7 son los primeros en alcanzar velocidades medias de descarga superiores a 1 Gbps en el percentil 90 en España, lo que demuestra cómo los avances técnicos de Wi-Fi 7, como un mayor ancho de banda de canal y una modulación más alta, se están convirtiendo en diferenciadores clave de la tecnología en el segmento premium.

Las nuevas generaciones de Wi-Fi promueven mejoras en la latencia
Speedtest Intelligence® | Enero 2025

Impulsar la adopción de los nuevos estándares Wi-Fi requiere nuevas estrategias, pero crea nuevas oportunidades de ingresos para los ISP

A medida que los mercados avanzados de fibra (como el español) maduran, la atención pasa de centrarse simplemente en ofrecer velocidades gigabit hasta la puerta de casa a garantizar un rendimiento sin fisuras en todo el hogar, que satisfaga las diversas demandas de los dispositivos conectados emergentes. Como resultado, las inversiones para mejorar la experiencia Wi-Fi a través del CPE suministrado por el ISP serán clave para diferenciar las tarifas multi-gigabit más allá del precio y garantizar que se pueda aprovechar todo el potencial de las conexiones de fibra. 

España debe acelerar la modernización de su base Wi-Fi para capitalizar plenamente las importantes inversiones en XGS-PON, ofrecer mejoras significativas en la calidad de la experiencia (QoE) para los consumidores y alcanzar a los mercados líderes de los países nórdicos. Los operadores españoles pueden seguir el ejemplo de países vecinos como Francia, donde las actualizaciones de CPE se incluyen en las actualizaciones de velocidad de las tarifas, y los programas de intercambio y sustitución identifican y eliminan sistemáticamente el hardware Wi-Fi heredado para impulsar la adopción de equipos Wi-Fi 6 y 7 de nueva generación. Los recientes movimientos de ISP como Movistar para eliminar el CPE heredado y ofrecer soluciones Wi-Fi 6 de serie son una prueba de los avances en este sentido.

Los principales ISP europeos que han dado prioridad a la concienciación de los consumidores sobre los estándares Wi-Fi y su impacto en el rendimiento de la fibra, al tiempo que han modernizado su base de CPE Wi-Fi para dar soporte a ofertas rentables como las garantías de velocidad mínima en cada habitación, están viendo beneficios tangibles. Esta estrategia no sólo mejora la experiencia general de la banda ancha fija, sino que también desbloquea nuevas fuentes de ingresos a través de la diferenciación del servicio.

Ookla retains ownership of this article including all of the intellectual property rights, data, content graphs and analysis. This article may not be quoted, reproduced, distributed or published for any commercial purpose without prior consent. Members of the press and others using the findings in this article for non-commercial purposes are welcome to publicly share and link to report information with attribution to Ookla.

| April 14, 2024

Early 5G Results for the Samsung Galaxy S24 Family: How do New S24 Models Stack up to Previous Generations and iPhone 15’s on 5G? 

Consumers around the world eagerly awaited Samsung’s release of the latest line of its flagship Galaxy S series of smartphones on February 1, 2024. Was the wait worth it? In this article, we analyze how the Samsung Galaxy S24 family measures up against its predecessors in terms of 5G speed and latency during its first several weeks on the market (February 1 – March 24, 2024). 

With new chipsets and technologies alongside plenty of other cool new features in Galaxy S24 devices, we examined early results from Speedtest® users in 15 select countries around the world to see whether the Galaxy S24 lineup — comprising the S24, S24+, and S24 Ultra models — outpaced Samsung’s earlier S22 and S23 families for 5G performance. Additionally, we’ve compared the 5G speeds and latency of Apple’s iPhone 15 family — including the iPhone 15, 15 Pro, and 15 Pro Max — against Samsung’s offerings.

It’s important to note that device performance metrics can vary significantly from one country to another. Factors such as government and mobile operator investments in 5G infrastructure, spectrum allocations, and the extent of 5G network deployment all contribute to these variations.

Key takeaways:

  • The Samsung Galaxy S24 family showed a statistically significant lead for median 5G download speeds in seven out of 15 countries in this study. On the other hand, the Apple iPhone 15 family posted the fastest 5G speeds in only one country. It’s worth noting, however, that speed differences between Galaxy S24 devices and iPhone 15’s were relatively minor in some of the countries analyzed (see the charts below for details). 
  • The S24 family recorded the lowest median 5G multi-server latency in 10 of 15 countries, whereas iPhone 15 devices offered the highest median 5G latency in 10 markets.
  • Samsung Galaxy S22 models unsurprisingly offered the slowest median 5G download speeds in eight countries, while the Galaxy S23 family was slowest in four countries. 
  • Devices in the Galaxy S24 family experienced the fastest median 5G upload speed in 13 of the 15 countries examined for this analysis. However, upload speeds were much slower than 5G download speeds, ranging from 11.83 Mbps to Mbps to 66.52 Mbps, with median 5G upload speeds of 50 Mbps or better found in only three countries (South Korea, Qatar, and the U.A.E.). 

To learn more about what speeds mean in real-world terms, check out our article looking at how much speed users need for a variety of daily mobile activities.

Take me straight to the data!

Asia Pacific | Middle East & Africa | Europe | North America 

New chipsets and modems in the Galaxy S24 family 

Everyone wants to know if the newest technology is worth the upgrade when they’re investing in an expensive new smartphone. Each device within the Galaxy S24 family has various upgrades (including new AI features), but when it comes to features that impact speed and latency performance, here’s a look at the chipsets and modems for each line of smarthpones in our study:

  • Samsung Galaxy S24 Ultra models use Qualcomm’s Snapdragon 8 Gen 3 chipset globally, while the S24 and S24+ use it only in Canada, China, Hong Kong, Taiwan, and the United States. The Samsung Exynos 2400 is used elsewhere for the S24 & S24+.
  • The Galaxy S23 series uses Qualcomm’s Snapdragon 8 Gen 2 worldwide, while Samsung S22 models use an Exynos 2200 chipset in Europe and the Snapdragon 8 Gen 1 elsewhere. 
  • Galaxy S24 devices utilize the Snapdragon X75 5G modem, S23 models have a Qualcomm Snapdragon X70 modem, while S22 models have a Qualcomm Snapdragon X65 modem.
  • Apple iPhone 15 models use Apple’s A16 Bionic chipset, while iPhone 15 Pro and Pro Max models use the A 17 Pro chip. All devices in the Apple iPhone 15 family utilize Qualcomm’s Snapdragon X70 5G modem. 

Do you own one of these devices? See how your speeds compare by taking a quick Speedtest. And to learn more about mobile and fixed broadband performance in cities and regions across the world, visit the Speedtest Performance Directory, where you’ll find ISP recommendations, insights on mobile and fixed broadband performance, and more. 

Digging into the Data: Where does the Samsung Galaxy S24 Family Lead its S22, S23, and iPhone 15 Counterparts Around the Globe? 

Early findings from Speedtest Intelligence® reveal that the latest Galaxy S24 family outperformed its predecessors — especially S22 models — in terms of 5G speed across several of the countries we analyzed. While differences in speed between devices were minimal in some countries, S24 models showed significant speed advantages over previous generation Samsung devices in markets like Qatar, the United Arab Emirates, and others. 

Does that mean users in those locations should upgrade immediately? Not necessarily. The decision to upgrade depends on various factors, from price to features to performance and more. However, if speed is your primary concern, the Galaxy S24 series is a compelling option, especially for consumers currently utilizing devices from the Galaxy S22 lineup, which is now over two years old.

Read on to see our complete analysis of all 15 countries in this study or select a region below to dig into more localized results. 

Asia Pacific | Middle East & Africa | Europe | North America 

Asia Pacific

Consumers in Hong Kong who want new features might want to upgrade

Speedtest Intelligence data revealed strong performance for all device families in Hong Kong, with the new Galaxy S24 family performing particularly well, boasting a median 5G download speed of 165.74 Mbps and the lowest median 5G multi-server latency in the market at 21.74 ms. However, the S24’s median 5G download speed was statistically comparable to that of its older Samsung and iPhone 15 peers, making the choice to upgrade currently more about new features than about performance.

Bottom line: With strong — and similar — 5G download speeds across all device families in Japan, upgrading to a new Galaxy device isn’t a must just yet, unless you want to enjoy the S24 family’s new features.

5G speeds were fast across the board in India, where the Samsung Galaxy 24 family held a slight edge 

In the early days following the release of the Galaxy S24 series in India, the latest Samsung models led for both 5G download speeds and 5G multi-server latency. While 5G speeds impressed across all device families in India — all notched speeds of at least 273.78 Mbps — Galaxy S24 models posted the top median 5G download speed at 302.43 Mbps and the lowest median 5G multi-server latency at 41.56 ms. On the other hand, Galaxy S22 devices showed the slowest — but still impressive — speeds in India at 273.78 Mbps, while the Samsung Galaxy S23 was just a tick behind at 279.93 Mbps. The iPhone 15 family, meanwhile, clocked in with a median 5G download speed of 285.78 Mbps.

Bottom line: Consumers in India currently using S22 devices might want to upgrade to an S24 model, given the nearly 30 Mbps speed advantage the new devices provided in this study. However, with excellent 5G speeds across all device families and similar speeds for devices in the S22, S23, and iPhone 15 families, users might not feel a huge difference in their 5G experience from one device to another. 

Samsung Galaxy enthusiasts in Indonesia needn’t rush to upgrade to an S24 device — yet

In contrast with what our results showed in most countries, the iPhone 15 family emerged as the leader in Indonesia with a median 5G download speed of 80.49 Mbps. All three Samsung Galaxy families trailed with speeds ranging from 55.61 Mbps for the S24 family to 69.24 Mbps for S23 models. While the iPhone 15 family’s 5G speed was nearly 25 Mbps faster than that of S24 devices, it’s worth noting that the difference among all three Samsung Galaxy models was only about 14 Mbps, and our results revealed no statistical difference in median 5G download speeds between the S22 and S23 families. 

Bottom line: Despite the iPhone 15 providing the top speeds in the market, the Galaxy S24 could hold greater long-term potential for consumers in Indonesia, especially when compared to older Samsung models. Equipped with a newer processor and modem, the S24 could see quicker speeds over time as Indonesia’s 5G networks evolve. In the meantime, users shouldn’t experience notable disparities in speed or latency among all three Samsung device families analyzed. 

No clear advantage to upgrading to a new Galaxy S24 in Japan

People in Japan who upgraded to a Galaxy S24 device likely haven’t seen a performance boost just yet. While all four device families performed similarly well in Japan, there was no statistical difference in the median 5G download speeds offered by all three Galaxy families, with speeds ranging from 110.48 Mbps to 118.93 Mbps across all three Galaxy devices. The iPhone 15 lineup also had a strong speed at 125.48 Mbps. 

Bottom line: With generally similar median 5G download speeds across all device families in Japan, users who are considering upgrading to a new Galaxy smartphone might want to wait. While we anticipate the S24’s speeds to surpass those of its predecessors over time, 5G speeds in the market were quite close across all three Galaxy device families in the early days of the S24’s release. 

For users in the Philippines who want the fastest 5G, Galaxy S22 users may want to upgrade. 

Samsung Galaxy S24 users in the Philippines might have noticed a modest improvement to their 5G speeds compared to those on older S23 and S22 models since they upgraded, as the Galaxy S24 family’s median 5G download speed of 157.38 Mbps was about 20 Mbps faster than that of Galaxy S22’s (137.68 Mbps) and a little over 15 Mbps faster than the Galaxy S23 family (140.06 Mbps). Meanwhile, the iPhone 15 family’s median 5G download speed of 120.04 Mbps trailed all three Samsung Galaxy families in the market.

Bottom line: For users in the Philippines seeking the fastest possible 5G experience, upgrading to an S24 device is worth considering. However, it’s worth noting that the differences in speed between devices wasn’t as stark as that in some other countries, and upgrading likely isn’t for everyone just yet.

Samsung Galaxy S24 and iPhone 15 much faster on 5G in South Korea than S22 devices 

In South Korea, home to the first widespread 5G launch in the world, our results reflected outstanding 5G speeds, with the iPhone 15 and Samsung Galaxy S24 families posting similar median 5G download speeds of 598.64 Mbps and 590.28 Mbps, respectively. The S22 family, meanwhile, offered the “slowest” 5G speeds in South Korea, posting an excellent median 5G download speed of 475.42 Mbps, while Galaxy S23 devices came in at 511.82 Mbps.

Bottom line: 5G users in South Korea can expect remarkable 5G speeds across the board, regardless of their device. However, Samsung Galaxy loyalists who currently use S22 models might want to consider moving to an S24 model, given that the S24 family was over 100 Mbps faster than Galaxy S22’s, while also offering the top median 5G upload speed in the market at 55.22 Mbps. For users who prioritize the fastest 5G experience, Galaxy S24’s and iPhone 15’s are both worth a look.

Samsung Galaxy S24 family provides top 5G download speeds in Thailand 

In Thailand, Speedtest Intelligence showed that the Galaxy S24 family delivered the fastest median 5G download speed in the market at 171.27 Mbps. That speed marks a notable improvement of roughly 35 Mbps over the S22’s 132.60 Mbps and the S23’s 135.55 Mbps. The Galaxy S24 family also offered the lowest median 5G multi-server latency in Thailand at 32.46 ms. The iPhone 15 family provided the second-fastest median 5G download speed in the market at 147.53 Mbps.

Bottom line: If you’re thinking of upgrading from an S22 or S23 device, our findings suggest that the Galaxy S24 might be the right choice. With faster 5G speeds compared to previous generations, coupled with low latency, smartphones in the Galaxy S24 family should allow for quick content downloads and smooth connectivity overall.

Middle East and Africa 

Excellent 5G speeds in Nigeria, but too soon to tell if you should upgrade for performance 

In Nigeria, 5G speeds were impressive overall, from the Galaxy S23 family’s median 5G download speed of 281.67 Mbps to the new Galaxy S24’s speed of 383.97 Mbps. However, in these early days of the S24 lineup’s release, we are still waiting to see how things stabilize in the market before we can make a firm recommendation on whether to upgrade. 

Bottom line: For users who like to have the latest gear and/or want the new features offered by the S24 lineup, upgrading is certainly worth considering. But with fast 5G speeds in general, users on any of the device families we looked at should see a quick download experience in general. 

Samsung Galaxy S24 by far the fastest 5G in Qatar 

Home to some of the fastest 5G speeds in the world, Qatar showcased impressive median 5G download speeds across all three device families analyzed. The Galaxy S24 family led the pack with a jaw-dropping median 5G download speed of 971.49 Mbps and the top median 5G upload speed in the market at 66.52 Mbps. The Galaxy S22 and S23 families trailed, albeit with great median 5G download speeds of 675.06 Mbps and 758.49 Mbps, respectively. The iPhone 15 family also had a strong showing in Qatar, posting a median 5G download speed of 788.97 Mbps. 

Bottom line: Consumers in Qatar with older Galaxy S22 or S23 devices might want to make the switch, given that the S24 family’s remarkable median 5G download speed of nearly 1 Gbps was much faster than those of either the Galaxy S23 or especially S22 families.

Galaxy S24 a good option for Samsung fans in the U.A.E.

In the U.A.E., which is home to outstanding 5G speeds in general, the Samsung Galaxy S24 and iPhone 15 families delivered the top median 5G download speeds in the market at 828.11 Mbps and 819.48 Mbps, respectively. When compared to its earlier generation Samsung predecessors, the S24 family held a commanding speed advantage, boasting speeds that were at least 170 Mbps higher than those of either the S22 (639.33 Mbps) or S23 (657.79 Mbps) families. 

Bottom line: With median 5G download speeds ranging from 639.33 Mbps to 828.11 Mbps, consumers in the U.A.E. will likely enjoy fantastic speeds regardless of device model. However, for current S22 or S23 users hoping to boost their speeds, the Galaxy S24 family stands out as a good choice.

Europe

Galaxy 24 family clocked 5G speeds over 80 Mbps faster than those on S22 devices in France

In France, the Galaxy S24 family was the frontrunner, delivering the fastest median 5G download speed among all device families in the market at 292.15 Mbps. That marks a significant improvement of over 80 Mbps compared to the S22 family’s speed of 211.32 Mbps, along with a jump of more than 60 Mbps compared to the S23’s speed of 229.78 Mbps. Meanwhile, iPhone 15 users experienced the second-fastest median 5G download speed in the market at 257.15 Mbps, with 5G latency nearly identical to that of the S22 and S23 families.

Bottom line: For consumers currently using an S23 or especially an S22 model, upgrading to an S24 device is worth considering. Our results in France showed that the latest Samsung lineup delivered a superior 5G speed experience over older Galaxy models, especially those in the Galaxy S22 family.

Galaxy S24’s a good choice over S22 models in Spain

All four device families in Spain provided good 5G speeds, ranging from the S22’s median 5G download speed of 141.33 Mbps to the S24 family’s speed of 179.34 Mbps. While speeds recorded on S24, S23, and iPhone 15 devices were statistically similar, the difference in speed between the S24 and S22 was much starker, with the S24 nearly 40 Mbps faster than the S22. 

Bottom line: The decision to upgrade should be more straightforward for S22 users in Spain compared to those with S23 or iPhone 15 models, as the S24’s median 5G download speed of 179.34 Mbps was almost 40 Mbps faster than that of the S22 family. 

Samsung Galaxy S24 likely worth an upgrade from S22 in the U.K. 

In the U.K., Samsung Galaxy S24 models were the fastest in the market, with the S24’s median 5G download speed of 156.71 Mbps offering a speed gain of nearly 40 Mbps compared to the Galaxy S22 family. Galaxy S24 models also posted faster speeds than both the Galaxy S23 and iPhone 15 families, but the difference was less stark than it was with the S22 family, with Galaxy S22 models clocking in at 120.49 Mbps, Galaxy S23’s at 133.49 Mbps, and iPhone 15’s at 138.07 Mbps. 

Bottom line: U.K. consumers using either S22 or S23 models may want to look into upgrading to the S24 to enjoy faster speeds. That’s especially true for S22 users, given that the S24’s median 5G download speed was nearly 40 Mbps faster than that of S22 devices.

North America

No major 5G speed boost for users in Mexico who upgraded to a Galaxy S24 

5G speeds in Mexico were impressive, with all device families posting median 5G download speeds of 176.53 Mbps or better. While Speedtest users of the Galaxy S24 family experienced the fastest median 5G download speed in the market at 197.42 Mbps, that speed marked only a modest improvement compared to Galaxy S22 devices (186.51 Mbps) and iPhone 15 models (193.73 Mbps). The Galaxy S23 family showed the slowest 5G speed in the market at 176.53 Mbps, coming in about 20 Mbps slower than Galaxy S24 models

Bottom line: For users eager to embrace the new features offered by Galaxy S24 devices or move on from S23 devices, an upgrade might be worthwhile. However, with fast 5G speeds across all device families in Mexico and only about 20 Mbps separating all four device families in our study, users likely won’t see a major change in their 5G experience by upgrading. 

Galaxy S22 users in the U.S. could get faster 5G with the S24 family. 

5G speeds in the U.S. had an impressive showing across the board, with median 5G download speeds of at least 232.46 Mbps across all device families. The Samsung Galaxy S24 family led the way with an excellent median 5G download speed of 306.90 Mbps and the lowest median 5G multi-server latency at 45.71 ms. Users of the Galaxy S24 family enjoyed speeds roughly 75 Mbps faster than those on S22 models (232.46 Mbps) and approximately 65 Mbps faster than those on S23 devices (241.60 Mbps). Meanwhile, the iPhone 15 family also offered a strong performance, with a median 5G download speed of 272.99 Mbps. 

Bottom line: Users of older Samsung device models in the United States may want to switch to one of the newer models to capitalize on the faster 5G speeds offered by S24 devices, though speeds were strong for all device families in this study. 

Ookla will continue monitoring how devices are performing 

We’ll continue to check in on device performance as new models enter the market, so stay tuned for further insights into mobile and fixed broadband performance in countries around the world. 

If you’ve recently made the switch to an S24 device, make sure you’re getting the speeds you need by downloading the iOS or Android Speedtest® app.

Ookla retains ownership of this article including all of the intellectual property rights, data, content graphs and analysis. This article may not be quoted, reproduced, distributed or published for any commercial purpose without prior consent. Members of the press and others using the findings in this article for non-commercial purposes are welcome to publicly share and link to report information with attribution to Ookla.

| July 29, 2024

Faster Speeds and the Promise of New Use Cases is Driving 5G SA Adoption

The deployment of 5G networks is progressing as demand for faster and more reliable connectivity continues to grow. The standalone (SA) deployment model marks a significant milestone in the evolution of 5G, aiming to offer lower latency, increased bandwidth, and improved reliability compared to earlier network configurations. In this article, we use Ookla Speedtest Intelligence® data to track 5G SA deployments since Q2 2023, 5G SA service adoption, and examine its impact on network performance. We also highlight key regions and countries that made notable advancements in 5G SA infrastructure.

Key Takeaways:

  • India, the U.S., and Southeast Asia are at the forefront of 5G SA adoption. T-Mobile and SK Telekom were among the first to launch 5G SA in 2020, while Chinese operators and Jio in India lead in terms of active 5G SA users. Europe somewhat lags, with operators still hesitant due to the relatively low ROI on existing 5G investments and unclear business cases for 5G SA. However, Europe has the highest number of operators planning to launch it.
  • The U.A.E. and South Korea lead the world in 5G SA performance. 5G SA download speeds reached 879.89 Mbps and 729.89 Mbps, respectively. Their 5G SA upload speeds were also impressive, at 70.93 Mbps and 77.65 Mbps, respectively. This performance is a result of significant advancements made by local operators in deploying 5G SA and testing advanced features such as network slicing and mobile edge computing (MEC).
  • The change in speed of 5G SA varied widely between countries over a year. Speedtest Intelligence data shows that 5G SA performance declined in many countries between Q2 2023 and Q2 2024, primarily driven by increased user base and network traffic. Conversely, markets such as Canada and the U.S. improved their performance thanks to access to additional spectrum.

5G SA deployments are expected to increase this year as adoption gains momentum and ecosystem matures

Most existing 5G deployments use the non-standalone (NSA) model which uses the 4G core network. This model is faster to roll out, requires less investment, and maximizes existing network assets. Unlike 5G NSA, 5G SA uses a dedicated 5G core network, unlocking the full capabilities of 5G with better speed, latency, support for large numbers of devices, and more agile service creation. It also enables new features such as network slicing where an operator can dedicate a network segment to specific customers or use cases. Furthermore, the core network functions provided by a cloud-native architecture enable more scalability and automation than physical or virtualized architectures. However, this comes with higher infrastructure complexity, investment as well as staff training costs.  Many operators use NSA as a stepping stone towards SA, with a few exceptions, such as DISH in the U.S. and Jio in India, which adopted SA from the outset. Other scenarios for deploying 5G SA include an overlay for a public 5G NSA network or as a private network for enterprise use cases. 

The Global Mobile Suppliers Association (GSA) identified 130 operators that had invested in public 5G SA networks as of the end of June 2024. 5G SA represented more than 37% of the 614 operators known to have invested in 5G either through trials or deployments. The GSA reported 1,535 commercially available devices, including handsets and fixed wireless access (FWA) customer premises equipment (CPEs), that support 5G SA, demonstrating the growing maturity of the device ecosystem. 

However, only 11 new 5G SA deployments in nine countries were recorded (out of 46 new 5G networks launched in 32 countries) in 2023, according to Analysys Mason, showing a slowdown in deployments. We expect the pace of 5G SA launches to accelerate in 2024 and beyond supported by the growing device ecosystem and commercial appetite for new 5G use cases. 

To identify where 5G SA access has been activated and the network expanded between Q2 2023 and Q2 2024, we used Speedtest Intelligence® data to identify devices that connect to 5G SA. The maps below confirm that the number of 5G SA samples increased year-on-year and that coverage has expanded beyond urban centers. However, mobile subscribers in most of Africa, Europe, Central Asia, and Latin America have yet to experience 5G SA.

In the following sections, we examine the year-on-year changes in 5G SA performance across different regions and identify which countries are leading in the Developed Asia Pacific, the Americas, Emerging Asia Pacific, and Europe.

The developed Asia-Pacific (DVAP) region is at the forefront of 5G SA launches

Operators in this region boast 5G SA networks, with launches happening as early as 2020. Strong government support, operators’ technology leadership, and a high consumer appetite for high-speed internet services drove this rapid adoption.

South Korea is considered a pioneer in the adoption and deployment of 5G technology, with SK Telecom deploying one of the first 5G SA services in H1 2020, and supporting advanced features such as network slicing and mobile edge computing (MEC). Speedtest Intelligence data shows that the country led the region in download and upload speeds in Q2 2024. South Korea has one of the highest median speeds among the countries analyzed at 729.89 Mbps (download) and 77.65 Mbps (upload). The other top-performing country is the U.A.E with a median download speed of 879.89 Mbps and a median upload speed of 70.93 Mbps. 

All three service providers in Singapore commercialized 5G SA services, covering more than 95% of the country. Users experienced excellent download speed with a median value of 481.96 Mbps. However, Singapore lagged in upload speed with a median value of 32.09 Mbps.

Macau and Japan are second and third in the region with median download speeds of 404.22 Mbps and 272.73 Mbps, respectively. Mainland China followed with a median speed of 236.95 Mbps. Policies and initiatives such as network-sharing agreements and government subsidies supported 5G growth.

In Australia, TPG Telecom launched its 5G SA network in November 2021, following Telstra’s announcement in May 2020. However, the country lagged behind its regional peers with median download speeds and upload speeds of 146.68 Mbps and 17.69 Mbps, respectively.

The performance of most reviewed DVAP countries remained largely stable or slightly declined between Q2 2023 and Q2 2024. The only two exceptions are South Korea and Australia where performance improved by 12% and 18%, respectively. The most substantial declines were observed in upload speeds, while South Korea stood out with a 17% boost in performance.

5G Standalone Network Performance, Select Countries in Developed Asia Pacific
Source: Speedtest Intelligence® | Q2 2023 – Q2 2024
5G Standalone Network Performance, Select Countries in Developed Asia Pacific

T-Mobile and DISH Push 5G SA Coverage in the U.S.

In the U.S., T-Mobile launched its 5G Standalone (SA) network over 600 MHz spectrum in August 2020, becoming one of the first operators in the world to do so. This was followed by a faster service over 2.5 GHz mid-band spectrum in November 2022 which helped the operator to maintain its national lead in 5G performance. On the other hand, Verizon extensively tested 5G SA in 2023 but so far has been slow to deploy a nationwide SA network. DISH, another notable 5G SA operator, pioneered a cloud-native Open RAN-based 5G SA network in June 2023 and expanded coverage to 73% of the population by the end of that year. In Canada, Rogers Wireless launched the first 5G SA at the beginning of 2021, a year after introducing 5G NSA. 

In Brazil, the median download and upload speeds reached 474.65 Mbps and 32.36 Mbps in Q2 2024, respectively, exceeding those in Canada and the U.S. The main operators in Brazil, Claro, Telefonica (Vivo), and TIM have launched 5G SA over the 3.5 GHz band, making the service available to a large proportion of the population.

While download and upload speed improved in Canada and the U.S. between Q2 2023 and Q2 2024, according to Speedtest Intelligence, it declined in Brazil. The deployment of C-band has likely helped to increase download speed in both Canada and the U.S.

5G Standalone Network Performance, Select Countries in the Americas
Source: Speedtest Intelligence® | Q2 2023 – Q2 2024
5G Standalone Network Performance, Select Countries in the Americas

India leads in the Emerging Asian Pacific (EMAP) region with fast expansion to 5G SA network

India is at the forefront of the Emerging Asian Pacific region’s rapid 5G Standalone (SA) network expansion. However, according to Ookla’s Speedtest data for Q2 2024, the Philippines surpasses both India and Thailand with a median 5G SA download speed of 375.40 Mbps. Globe, the first mobile operator to introduce 5G Non-Standalone (NSA) in the Philippines, expanded its 5G outdoor coverage to 97.44% of the capital by the end of H1 2023. The company also launched 5G SA private networks in 2023, along with network slicing.

India follows closely behind the Philippines, with a median download speed of just under 300 Mbps. Jio has been a leader in enhancing 5G SA coverage since its launch in October 2022, while Bharti Airtel initially opted for NSA, with plans to transition to full 5G SA. 

Jio’s rapid coverage expansion and high throughput are supported by its access to mid-band (3.5 GHz) and low-band (700 MHz) frequencies. Additionally, all new 5G handsets released in India are SA-compatible, boosting the adoption of 5G SA services, and more than 90% of them support carrier aggregation and Voice over New Radio (VoNR). 

Thailand lags behind in median download speed for Q2 2024 but outperforms India and the Philippines in upload speed. It was among the first countries in the region to introduce 5G services, with operators quickly expanding coverage to reach over 80% of the population. AIS, the leading operator in Thailand, launched 5G NSA services in February 2020 using 700 MHz, 2.6 GHz, and 26 GHz bandwidths, followed by 5G SA in July 2020. The operator enabled VoNR in 2021. 

Unlike the DVAP region, countries in EMAP have experienced a more substantial decline in 5G SA network performance compared to Q2 2023. The rapid coverage expansion and adoption have likely increased the load on 5G SA infrastructure, putting pressure on the operators to scale up network capacity in the future to at least maintain a similar performance level.

5G Standalone Network Performance, Select Countries in Emerging Asia Pacific
Source: Speedtest Intelligence® | Q2 2023 – Q2 2024
5G Standalone Network Performance, Select Countries in Emerging Asia Pacific

Europe is home to the highest number of operators looking to deploy 5G SA

A growing number of European operators are offering or planning to offer 5G SA, driven by a maturing device ecosystem. However, many remain hesitant due to cost and the need to demonstrate clear business cases for 5G SA. GSMA Intelligence reports that Europe has the highest number of planned 5G SA launches, with 45 operators planning to deploy it as of Q1 2024.

Elisa in Finland was one of the first operators in the region to launch 5G SA in November 2021. Other notable examples of SA implementations include Vodafone in Germany (April 2021) and the UK (June 2023), Bouygues Telecom (2022) in France, Three in Austria, Wind Tre in Italy (both in 2022), Orange and Telefónica in Spain, and TDC Denmark in 2023. 

The recent 5G SA launch in Spain may explain why that country saw such high speeds, with Speedtest Intelligence reporting download and upload speeds of 614.91 Mbps and 56.93 Mbps, respectively, in Q2 2023. However, Spain experienced a significant drop in performance in 2024, with speeds falling to 427.64 Mbps (download) and 30.55 Mbps (upload). Despite this decline, Spain continued to outperform the UK and Germany.

5G Standalone Network Performance, Select Countries in Europe
Source: Speedtest Intelligence® | Q2 2023 – Q2 2024
5G Standalone Network Performance, Select Countries in Europe

While 5G SA deployments appear to have slowed in 2023 compared to previous years, we expect momentum to increase from 2024 due to rising enterprise demand for private networks and interest in network slicing, as well as consumer demand for immersive gaming and VR applications.  The ecosystem’s maturity and the availability of more network equipment and devices supporting 5G SA will also stimulate the market. According to the GSA, 21% of operators worldwide investing in 5G have included 5G SA in their plans.

Interestingly, the growing popularity and adoption of 5G SA have impacted its performance, with many markets seeing some degradation compared to 2023, according to Speedtest Intelligence.  Nonetheless, 5G SA still offers a markedly faster download speed than 5G NSA. Beyond speed, 5G SA promises new capabilities, such as network slicing, that have started to emerge in the most advanced markets but will take time to become a reality for most consumers and enterprises worldwide.

We will continue to track the deployments of 5G SA and monitor their impact on network global performance. For more information about Speedtest Intelligence data and insights, please contact us.

Ookla retains ownership of this article including all of the intellectual property rights, data, content graphs and analysis. This article may not be quoted, reproduced, distributed or published for any commercial purpose without prior consent. Members of the press and others using the findings in this article for non-commercial purposes are welcome to publicly share and link to report information with attribution to Ookla.

| September 18, 2023

New Speedtest Data Shows Starlink Performance is Mixed — But That’s a Good Thing

Satellite providers are playing no small part in the rapid expansion of global connectivity. Some experts predict there will be 58,000 satellites orbiting the earth by 2030 — a nearly 725% increase from 2023. Ookla® is back with our ongoing satellite internet series with compelling, fresh data for satellite providers in Africa, Europe, and Oceania during Q2 2023, including SpaceX’s Starlink, Viasat, and Skylogic.

This analysis includes Starlink Net Promoter Score (NPS) data for France, Germany, Italy, New Zealand, and the United Kingdom, year-over-year data for satellite providers in Europe and Oceania from Q2 2022 to Q2 2023, and new Q2 2023 data from Starlink in Africa.

Starlink users across different continents continue to love the service

Using Speedtest Intelligence®, we examined NPS ratings data for Starlink users against an aggregate of all fixed broadband providers combined. 

NPS is based on Speedtest® user responses after being asked how likely they are to recommend their provider to friends or family on a 0 to 10 scale. NPS ratings are categorized into Detractors (score 0-6), Passives (score 7-8), and Promoters (score 9-10), and is calculated as (% Promoters – % Detractors) x 100. Any NPS score above 0 indicates that a provider’s audience is more loyal than not.

Chart of NPS Performance in Select Countries

As you can see from the above image, Starlink users in France, Germany, Italy, New Zealand, and the U.K. had an NPS score much higher than the aggregate score for all fixed broadband providers combined during Q2 2023. France had the highest NPS among the aggregate of fixed broadband providers for the countries we surveyed at -15.98 and fixed broadband providers had a much faster median download speed at 165.37 Mbps to Starlink’s 107.56 Mbps. In New Zealand there was a similar story with the aggregate of fixed broadband providers having a -20.40 NPS to Starlink’s 48.83, while having a faster median download speed 147.86 Mbps to 113.78 Mbps during Q2 2023.

Germany, which had the lowest NPS rating of aggregate of fixed broadband providers in Europe at -30.10, also had the smallest difference in NPS with Starlink scoring 38.19. Interestingly, the aggregate of fixed broadband providers and Starlink both had similar median download speeds at 83.16 Mbps and 82.56 Mbps, respectively, during Q2 2023.

Of note, Starlink had much higher NPS ratings and median download speeds than the aggregate of all fixed providers combined in Italy and the U.K., respectively, during Q2 2023. Starlink’s NPS was 50.20 to -25.61 for the aggregate of all fixed broadband providers in Italy during Q2 2023, while the median download speeds were 100.68 Mbps to 63.99 Mbps. In the U.K., Starlink’s NPS was 47.18 to -26.88 for the aggregate of all fixed broadband providers combined, with the median download speeds a little closer, 100.11 Mbps to 77.38 Mbps, respectively. 

In our last report, we found a wide NPS gap between U.S. rural Starlink users — who often have fewer options for fixed broadband access — and the corresponding aggregate of fixed broadband providers. Given that all five of these countries have rural or remote regions that are underserved or not served by traditional broadband offerings, it may be no surprise that Starlink users who reside in those areas may feel positive about having access to fast broadband internet. 

Starlink speeds over 100 Mbps in 14 European countries during Q2 2023, speeds stabilizing across Europe

Key takeaways:

  • Starlink results were the fastest among satellite providers we surveyed.
  • Starlink quarter-to-quarter speeds improved or remained about the same (between 5% and -5%) in 23 countries, while decreasing in 4 countries.
  • Among the 27 European countries we surveyed, Starlink had median download speeds greater than 100 Mbps in 14 countries, greater than 90 Mbps in 20 countries, and greater than 80 in 24 countries, with only three countries failing to reach 70 Mbps.
  • Skylogic, while delivering speeds slower than Starlink, showed stabilized broadband speeds over the past year for those seeking a Starlink alternative.

Over the past year, we’ve seen huge developments in the global satellite market, Europe notwithstanding, with Amazon’s Project Kuiper moving forward, the EU creating its own satellite constellation, and OneWeb and Eutelsat merging. While Starlink continues to lead for performance among satellite providers we surveyed, Starlink has experienced some major hurdles over the past year as users flock to the service and speeds have subsequently dipped — but of note those concerns seem to have started allaying in most of Europe during Q2 2023.

At first glance, year-over-year median download speeds for Starlink are about the same (-5% to 5%) or better (greater than 5%) from Q2 2022 to Q2 2023 in 15 countries and slower (decreasing more than 5%) in 8 countries. But among the 27 countries we surveyed during Q2 2023, Starlink had speeds faster than the aggregate of all fixed broadband providers combined in 11 countries (Austria, Belgium, Bulgaria, Croatia, Czechia, Estonia, Greece, Ireland, Italy, Latvia, and the U.K.) Those speeds were most notably faster in Croatia and Greece for Starlink at 94.41 Mbps to 45.24 Mbps and 108.97 to 44.09 Mbps, respectively, during Q2 2023. Speeds were about the same in four countries (Finland, Slovenia, Germany, and Lithuania), and speeds were slower than the aggregate of fixed broadband providers in 12 countries, most notably in Poland, Spain, Romania, Denmark, and France which saw between 50% and 105% faster aggregate fixed broadband speeds than Starlink.

Quarterly download speeds stabilizing or improving

Looking at results from Q1 2023 to Q2 2023, median download speeds for Starlink remained about the same (between 5% and -5%) in 23 countries, while decreasing in four countries. That’s a big deal, especially given Starlink had median download speeds greater than 100 Mbps in 14 countries, and greater than 90 Mbps in 20 countries, and greater than 80 in 24 countries — with only three countries failing to reach 70 Mbps.

While trailing Starlink speeds, Skylogic recorded median download speeds in Italy at 29.21 Mbps during Q2 2023, a roughly 27% statistical increase year-over-year from 22.28 Mbps during Q2 2022. Notably, Skylogic recorded a median download speed of 68.44 Mbps in Italy during Q1 2023. Among the various countries we recorded Skylogic data for during the past year, the range of median download speeds varied between 19.53 Mbps and 68.44 Mbps, with most speeds between 28 and 50 Mbps, all fast enough to stream 4K video online. Viasat, had relatively similar download speeds in Germany and Italy at 17.22 Mbps and 17.45 Mbps, respectively, during Q2 2023. 

Top 10 fastest Starlink download speeds in European countries

Chart of Top 10 Fastest Starlink Median Download Speeds in Europe

Starlink in Switzerland had one of the fastest median download speed among countries with Starlink during Q2 2023 at 122.47 Mbps, followed by Denmark (117.38 Mbps), Austria (111.91 Mbps), Belgium (111.20 Mbps), Hungary (108.97 Mbps), France (107.56 Mbps), Ireland (104.42 Mbps), Estonia (102.38 Mbps), Portugal (101.75 Mbps), and Latvia (100.94 Mbps). Sweden, Italy, Bulgaria, and the U.K. all followed but had speeds greater than 100 Mbps.

Upload speeds for Starlink are down year over year, but quarterly speeds almost all improved or were about the same

Upload speeds for Starlink mostly decreased notably year over year, with only the U.K. showing an improved median upload speed in Q2 2023 out of 27 countries surveyed. However, looking quarter to quarter, Q2 2023 upload speeds for Starlink stayed about the same or improved in 25 out of 27 countries, with only Greece and Ireland showing declines. For upload speeds, Starlink all 27 countries we surveyed had upload speeds between 10 Mbps and 15 Mbps except Portugal (17.70 Mbps), Hungary (16.91 Mbps), Croatia (16.12 Mbps), Bulgaria (15.93 Mbps), Romania (15.82 Mbps), Spain (15.79 Mbps), and Poland (9.11 Mbps). Starlink in Greece was the only instance of a satellite provider in Europe having an upload speed greater than the aggregate of all fixed providers combined, 12.97 Mbps for Starlink to 7.85 Mbps for the aggregate of fixed broadband providers combined. Skylogic showed upload speeds lower than 4 Mbps in both Austria and Italy during Q2 2023. Viasat had upload speeds of 3.51 Mbps in Germany and 4.69 Mbps in Italy during Q2 2023. 

Multi-server latency is stabilizing for Starlink users across Europe

As an low-earth orbiting (LEO) satellite internet provider, Starlink has a leg up on some satellite competitors who rely on further away geosynchronous-earth orbit (GEO) and medium-earth orbit (MEO) satellite constellations. However, once again, all the aggregates of all fixed broadband providers in Europe had much lower multi-server latencies than Starlink, Viasat (which had latencies over 600 ms) and Skylogic (which had latencies over 700 ms). That being said, Starlink still saw multi-server latencies under 60 ms in the U.K. (51.26 ms), Spain (53.37 ms), Portugal (55.84 ms), and Belgium (59.34 ms). Starlink saw most countries’ multi-server latencies between 60 and 90 ms.

Starlink speeds stabilize in Oceania

Oceania, the second least densely populated continent in the world to Antarctica, has rural and remote populations that benefit from (and even rely on) satellite internet connections. Luckily for rural and remote Starlink users, they’ve probably seen a good amount of stability over the past year with Q2 2023 median download speeds in New Zealand at 113.78 Mbps (105.99 Mbps in Q2 2022) and Australia at 104.92 Mbps (102.76 Mbps in Q2 2022). Tonga, which is very remote, saw download speeds drop from 45.25 Mbps in Q2 2022 to 37.95 Mbps in Q2 2023. 

Upload speeds also showed some stability with Australia going from 10.45 Mbps in Q2 2022 to 11.33 Mbps during Q2 2023 and New Zealand going from 12.31 Mbps to 14.62 during the same time period. Tonga saw a notable drop in speeds year over year from 19.26 Mbps in Q2 2022 to 6.66 Mbps Q2 2023. 

Multi-server latency, which usually will be higher for satellite internet options, showed promising results for Starlink in Oceania during Q2 2023. Multi-server latency dropped noticeably in New Zealand year over year, going from 89.38 ms in Q2 2022 to 46.42 ms in Q2 2023. Australia saw a more modest drop with multi-server latency going from 63.04 ms to 59.78 ms from Q2 2022 to Q2 2023. Tonga saw an increase in multi-server latency from 125.24 ms to 137.16 ms during the same time period.

Starlink in Africa is off to a promising start

Chart of Satellite Performance in Africa, Q2 2023

Starlink, which first launched on the African continent in Nigeria this past January, is showing intriguing early results. Speedtest Intelligence showed that Starlink in Nigeria had a faster median download speeds than all aggregate fixed broadband providers combined at 63.69 Mbps to 15.60 Mbps during Q2 2023. Upload speeds were more similar during the same time period with Starlink at 13.72 Mbps and the aggregate of all fixed broadband providers combined at 10.60 Mbps. Starlink did have a marginally higher multi-server latency at 55.88 ms to 50.26 ms during Q2 2023.

In Rwanda, median download speeds were a little closer with Starlink recording a median download speed at 63.10 Mbps in Q2 2023 compared to the aggregate of all fixed broadband providers combined at 34.55 Mbps. Starlink trailed behind for median upload speed at 6.88 Mbps to 10.05 Mbps for fixed broadband providers during Q2 2023. Multi-server latency for Starlink was much higher at 320.45 ms to 29.04 ms for fixed broadband providers during the same time period.

The 2023 space revolution is off to a huge start

Here are some major updates about what’s next for various different satellite competitors:

After delays, Amazon’s Project Kuiper aim to launch prototype satellites this fall

Facing a series of rocket-related delays, Amazon recently announced it could send its first two Project Kuiper prototypes into orbit in late September. That news follows a recently announced $120 million 100,000-square-foot satellite processing facility at NASA’s Kennedy Space Center in Florida. Planning on offering internet service in 2025, Amazon is slated to have half of its 3,236 LEO satellite constellation in space by 2026.

China’s grand ambitions to provide internet connectivity to over 362 million people

According to the Wall Street Journal, over 362 million people in China don’t have access to the internet — which is about 1 in every 4 people in China, a large portion of which live in rural or remote communities. In order to overcome that connectivity gap, China is looking to the sky to create its own satellite constellation with potentially over 12,000 satellites. China’s biggest gap seems to be with recreating the success of SpaceX’s reusable rockets — however, initial tests are far underway and a host of reusable rockets are slated for test launches in 2024. 

SpaceX’s Starlink service offerings are about to rapidly expand

While Starlink continues to lead among satellite providers in most areas of the world, their expansion is only starting. Looking at the Starlink availability map, Starlink has an incredibly busy rest of 2023 and 2024 in Africa, Asia, and South America — and they’re marking their intent to expand into most of the world. That comes as Starlink marked launching over 5,000 satellites into space at the end of August. With some wiley entrepreneurs already renting out their Starlink “Dishy McFlatfaces” to vacationers and campers for $25-30 dollars a day, satellite connectivity is truly becoming a full-time gig.

Viasat’s bad luck might affect entire industry

Viasat launched the first of its three long-awaited Viasat-3 arrays — but then their first satellite suffered an antenna anomaly, which prevented a large reflector to deploy that affects whether or not the satellite can operate as intended. While Viasat is rushing to solve the issue, this could ultimately trigger a $420 million insure claim for the loss of the $700 million satellite. With such a high-value loss, this could send ripples through the satellite industry, causing insurance premiums to skyrocket for companies looking to mitigate potential losses through insurance. All of this comes on the heels of acquiring Inmarsat in May for $7.3 billion to expand its satellite arrays and spectrum holdings. We’ll be watching to see whether or not Viasat can find a solution. 

Eutelsat and OneWeb merger imminent, big moves abound

The Eutelsat and OneWeb merger should make competitors take notice — combining satellite networks, expanding enterprise offerings, and competing in emerging markets has big revenue potential — with OneWeb having an already established LEO network of 630 satellites and Eutelsat offering 36 GEO satellites. Of note, OneWeb recently inked a deal with Telstra in Australia to provide satellite backhaul for locations “where satellite backhaul is a preferred or only viable option.” OneWeb is also partnering with the European Space Agency to develop a next-gen 5G beam-hopping satellite, which could quickly increase connectivity for people traveling or for disaster areas that need emergency connectivity. Shareholders are set to vote on approving the merger on Sept. 28.

European Union greenlights multi-orbit constellation

With grand ambitions to launch a multi-orbit, €6 billion constellation in 2024, the European Union is partnering with a consortium of industry players including Airbus, SES, Eutelsat, Hispasat, and Thales to develop the EU’s IRIS² project. The EU still expects to have the first of its satellites go live by the end of 2024 and have a fully operational constellation by 2027.

HughesNet aiming to launch Jupiter 3 array in Q2 2023

HughesNet successfully launched its Jupiter 3 array on July 29, which aims to provide U.S. and Latin America consumers with higher broadband download speeds. While the actual satellite will take some time to reach its geosynchronous orbit and deploy, this satellite adds 500 Gbps of Ka-band capacity for HughesNet, which could see consumers reaching download speeds between 50 Mbps and 100 Mbps. We’ll be eagerly awaiting Speedtest® results from HughesNet’s Jupiter 3 array.

Ookla will continue monitoring new satellite internet developments

2023 continues to be an important year for satellite internet providers. Satellite connectivity is something we’ll be watching closely and we’ll continue our series next quarter with Q3 2023 data from select continents including North America. In the meantime, be sure to download the Speedtest app for Windows and Mac computers or for iOS or Android for devices and see how your satellite internet stacks up to our results.

Ookla retains ownership of this article including all of the intellectual property rights, data, content graphs and analysis. This article may not be quoted, reproduced, distributed or published for any commercial purpose without prior consent. Members of the press and others using the findings in this article for non-commercial purposes are welcome to publicly share and link to report information with attribution to Ookla.

| April 29, 2025

Power Outages in Spain and Portugal Test the Resilience of Europe’s Telecoms Infrastructure

The April 28th event highlights concerns about the critical need for resilience and continuity of service for telecom providers

Spain and Portugal are in recovery mode after a historic power outage crippled their national grids on April 28, triggering a cascading failure across mobile network infrastructure. Analysis of Speedtest Intelligence® and Downdetector® data reveals that network performance progressively deteriorated as battery backups, where available, were exhausted, and shifting traffic patterns placed maximum strain on an already stretched mobile site grid. The scale of the disruption—with near-synchronous impact across all operators in both countries—marks the largest stress test of telecommunications infrastructure in Europe in recent memory.

Key Takeaways:

Power outages triggered a rapid, severe, and sustained decline in mobile performance across all operators in Spain and Portugal on April 28, with impacts peaking in the mid-afternoon as backup batteries became depleted. The share of Spanish mobile users experiencing a consistent network connection (defined as minimum 5 Mbps download speeds and 1 Mbps upload speeds) dropped from a baseline of over 90% at 9:00 AM CET on April 28 to 50% by 12:00 PM, reaching a low of 40% by 3 PM. The decline in network consistency was even more pronounced on Portuguese mobile networks, falling below 40% by 2 PM and initially recovering more slowly than in Spain. Median mobile download speeds on April 28 were 73% lower in Spain and 75% lower in Portugal compared to the previous day.

Mobile Network Performance Collapsed in Close Synchrony with Power Grid Outage in Spain and Portugal
Speedtest Intelligence® | 28 April 2025 (CET)

While substantial service disruptions affected all operators, mobile performance remained relatively stronger on Orange and Movistar in Spain, and Vodafone in Portugal, compared to others on April 28. In Spain, Movistar delivered higher mobile download speeds (1.01 Mbps), upload speeds (0.30 Mbps), and lower multi-server latency (190 ms) at the 10th percentile—meaning for the worst-performing user —on April 28 compared to other Spanish operators, with Orange close behind. This suggests that, even in the worst cases, Movistar’s weakest network performance was materially better than that of Yoigo or Vodafone on average. In Portugal, Vodafone showed a clear lead over both NOS and MEO in metrics such as median download speed and latency on April 28, marking a shift from the pre-event trend in which NOS had led on several performance measures.

Consistency Remained Materially Depressed Across All Operators by Midnight on April 28
Speedtest Intelligence® | 28 April 2025 (CET)

The magnitude of service disruption varied across Spain and Portugal, reflecting differences in regional telecoms infrastructure resilience and the timing of power restoration. In Spain, the outer fringes of the mainland—including the northern and Mediterranean coasts as well as the southern and northeastern border regions—experienced the sharpest declines in mobile performance on April 28, but also showed faster recovery throughout the day, closely tracking grid restoration patterns. Median download speeds fell by more than 85% across areas such as the Valencian Community, Galicia, Andalusia, and the Region of Murcia, compared to declines of around 60% in central regions like Castile-La Mancha, Castile and León, and the Community of Madrid. In Portugal, the most significant impacts were likewise concentrated along the north-south and coastal corridor—from Braga and Porto down through Vila Real and Santarém—where download speeds fell by as much as 90%. In contrast, the interior highlands experienced milder declines of less than 40%, possibly reflecting earlier network hardening efforts in response to wildfire risks.

Outer Regions of the Spanish Mainland Suffered Largest Mobile Network Impacts
Speedtest Intelligence® | Comparison of Median Download Speed on April 27 and April 28

Network outages extended beyond declines in mobile performance to include complete loss of service

In practical terms, the service disruptions and declines in mobile performance in Spain and Portugal led to a significant deterioration in quality of experience (QoE) outcomes. Speedtest Intelligence data revealed a sharp rise in web page load times, a decrease in the proportion of mobile users able to stream Full HD videos, and a substantial increase in latency to key gaming and hyperscaler services across both countries on April 28. In Spain, for example, median web page load time rose by more than 20% where access remained available, while in Portugal it increased by more than 27%.

In the few locations where substantial power backup was available at mobile sites, either through batteries or stationary generators, site uptime was more resilient. However, the cascading effects of increased load, driven both by users migrating from nearby offline sites and by subscribers relying on the mobile network as a substitute for fixed broadband, likely played a significant role in depressing mobile network performance.

The large number of mobile users who were left without any network connection for a prolonged period, with no access to data services and only limited access to voice and text, was reflected in a record volume of partial or failed Speedtest sessions observed on the day of the outage, as large numbers of network subscribers attempted to diagnose connectivity issues but lacked a connection altogether to complete a test.

Power Cuts Produced a Major Spike in Telecoms Outage Reports Across Spain and Portugal
Downdetector® | 28 April 2025 (CET)

This likely also explains the unusual pattern of Downdetector outage reports on April 28, which spiked in Spain and Portugal immediately after the power outage took hold, declined during the afternoon as network performance reached its lowest point with backup batteries depleted, and then surged again in the evening as power was restored and users were better able to access a connection to report outages affecting one of their access paths.

The best time to strengthen mobile networks is before the lights go out

The limited penetration of battery backup solutions in the mobile site grids across Spain and Portugal was a key contributor to the scale of network disruption caused by the collapse of the power grid on April 28, providing a historic lesson on the importance of infrastructure redundancy.

The policy success of Nordic countries such as Norway and Finland, where local regulators NKOM and Traficom have intervened with legislative instruments to stipulate a minimum number of hours of continuity of mobile service post-power outage, demonstrates that there are viable solutions to harden mobile network infrastructure. Similar efforts have been observed in Australia, where the government subsidized a ‘Mobile Network Hardening’ program to retrofit 467 cell sites with 12 hours power backup capability.

Ookla retains ownership of this article including all of the intellectual property rights, data, content graphs and analysis. This article may not be quoted, reproduced, distributed or published for any commercial purpose without prior consent. Members of the press and others using the findings in this article for non-commercial purposes are welcome to publicly share and link to report information with attribution to Ookla.

| December 19, 2023

The State of Worldwide Connectivity in 2023

To gain insight into the current performance of networks, we analyzed Speedtest® data in Q3 2023. Our analysis compares changes in 5G performance to the previous year, identifies the top 10 countries with the best performance, and discusses customer satisfaction with 5G. We also ranked countries based on the performance of their fixed networks and investigated the connectivity gap across the world.

5G | Fixed | Connectivity for All

Key takeaways 

  • Global 5G download speed improved. The median global 5G download speed experienced a substantial 20% increase in Q3 2023, reaching 203.04 Mbps, compared to 168.27 Mbps in Q3 2022. This improvement aligns with a significant rise in global 5G subscriptions, indicating positive progress in user adoption of 5G and the performance of 5G networks. 
  • Top 5G performers have shifted. The top 10 countries for 5G performance witnessed notable changes, with the United Arab Emirates claiming the top spot, surpassing South Korea. Malaysia, India, and the Dominican Republic also made significant strides, showcasing a dynamic shift in the global 5G landscape.
  • Speedtest user ratings indicate room for 5G improvement. Despite advancements in 5G technology, there has been a decline in the Net Promoter Score (NPS) among 5G users. Factors contributing to this dissatisfaction could include unmet expectations and discrepancies between actual 5G speeds and advertised speeds.
  • Fixed Networks Advancements. On a global scale, fixed networks demonstrated significant performance improvement, with a 19% increase in median download speed (83.95 Mbps) and a 28% increase in upload speed (38.32 Mbps) in Q3 2023 compared to the previous year. This highlights the ongoing transition to more advanced broadband technologies, particularly Fiber-to-the-Home (FTTH).
  • The imperative of closing the connectivity gaps. Despite improvements in global connectivity, there are still areas that fall outside of network coverage. Speedtest® data highlights disparities in internet performance between fixed and mobile networks across different regions, emphasizing the importance of addressing connectivity challenges worldwide.

5G Networks

Global 5G download speed improvements

Illustration of 5G Median Performance Worldwide

The median global 5G download speed has experienced a noteworthy surge, registering a 20% increase and reaching 203.04 Mbps in Q3 2023, compared to 168.27 Mbps in Q3 2022, according to Speedtest Intelligence® data. This improvement coincides with a substantial rise in global 5G connections, reaching 1.4 billion according to GSMA Intelligence, representing a 65% year-on-year increase from 872 million a year ago. 

In terms of upload speed and latency, only a very modest improvement of 1% occurred. Median 5G upload speeds reached 18.93 Mbps in Q3 2023, compared to 18.71 Mbps in the same period last year; multi-server latency, a critical metric for network responsiveness, improved from 45 ms in Q3 2022 to 44 ms in Q3 2023. 

Speedtest users experiencing the top 10% of 5G download speeds globally have seen a 9% increase, rising from 525.54 Mbps in Q3 2022 to 573.12 Mbps in Q3 2023. However, speeds have not yet reached Gigabit levels, primarly because of network economics. 5G was originally designed to deliver peak data rates of up to 20 Gbps based on IMT-2020 requirements, but we are still a ways off before gigabit speeds become the new normal. For instance, symmetrical download, upload speeds, and ultra-low latency haven’t been realized, partially because the vast majority of 5G networks are not ‘true 5G’ as they have been deployed in Non-Standalone (NSA) mode, meaning they rely on a 4G LTE network core. According to GSA, over 40 operators have launched 5G standalone (SA) in public networks, but the rollout is not yet complete. Nevertheless, the industry is actively exploring the prospect of 5G Advanced, which promises symmetrical upload and download speeds and ultra-low latency, signaling a proactive stance ahead of the eventual transition to 6G.

Malaysia joined South Korea and the U.A.E at 5G speeds podium

Chart of Fastest Countries for Median 5G Download Speed

During Q3 2023, the United Arab Emirates and South Korea stood out as leaders in 5G performance, boasting the fastest median 5G download speeds globally at 592.01 Mbps and 507.59 Mbps, respectively. Our top 10 list also includes Malaysia, Qatar, Brazil, the Dominican Republic, Kuwait, Macau, Singapore, and India. The shift in the top 10 rankings reveals dynamic changes, with Malaysia, the Dominican Republic, and India making significant strides, while Bulgaria, Saudi Arabia, New Zealand, and Bahrain dropped out of the rankings.

The U.A.E showcased a 14% increase in its median 5G download speed, reaching 592.01 Mbps in Q3 2023, up from 511.68 Mbps in Q3 2022, allowing the U.A.E to take the top spot from South Korea. Key factors contributing to the U.A.E.’s 5G leadership include fierce market competition driven by Etisalat and du, resulting in extensive 5G coverage and widespread access to 5G services. Additionally, the allocation of a 100 MHz of contiguous spectrum, as discussed in our 5G spectrum article, has played a pivotal role in achieving faster speeds, lower latency, and improved spectral efficiency.

The regional shift in 5G performance leadership is noteworthy. In 2022, half of the top 10 countries were from the Middle East, while in 2023, the same proportion hailed from the Asia Pacific region. Our analysis suggests that early adopters in the Asia Pacific region have outperformed major European markets in 5G performance, due to factors such as early spectrum availability and supportive government policies.

Malaysia’s remarkable achievement in reaching the third spot globally for 5G download speed, with a reported speed of 485.24 Mbps in Q3 2023, is particularly noteworthy. Despite launching its nationwide 5G network less than two years ago, Malaysia’s unconventional deployment strategy has proven effective. India has also made a significant leap, with its median 5G download speed of 312.26 Mbps allowing India to reach the top 10 worldwide. The country’s climb of 72 places on the Speedtest Global Index™ between September 2022 and August 2023 is primarily credited to the launch of 5G. Following a 5G spectrum auction in India, operators have successfully addressed network congestion issues by offloading 4G traffic onto 5G networks.

In Brazil, 5G download speed increased 1.4 times, jumping from 312.09 Mbps in Q3 2022 to 443.93 Mbps in Q3 2023. Before Brazil’s 5G spectrum auction, operators had offered 5G using DSS since July 2020. While DSS can provide broad 5G coverage, its speeds are often similar to those on 4G LTE networks. In November of 2021, however, Brazil’s multi-band 5G spectrum auction closed, which not only generated BRL47.2 billion ($8.5 billion) in total commitments, but it also allowed operators to deliver much faster speeds on dedicated 5G spectrum compared to DSS. National operators – Telefonica Brasil (Vivo), Claro Brazil, and TIM Brazil – ended up with 40 MHz or 50 MHz in the 2.3 GHz spectrum band and 100 MHz each in the 3.5 GHz band. The subsequent simultaneous activation of 5G networks in July 2022 marked a transformative moment with the continuous expansion of 5G services to 623 municipalities by December 2023. An upcoming spectrum auction expects to improve Brazil’s 5G standing even further.

The Dominican Republic’s entry into the top 10 fastest 5G countries was marked by its official launch of 5G services in December 2021, making it the first Caribbean nation and the third in Latin America to adopt a 5G network.

Disparity Between 5G Performance and Consumer Perception

The Net Promoter Score (NPS) is a tool that gauges customer loyalty and satisfaction. At the end of Speetest, users may be asked to answer “How likely is it that you would recommend [provider] to a friend or colleague?” on a scale from 0-10. Net Promoter Scores are applied to both users and providers. Users are categorized into Detractors (score 0-6), Passives (score 7-8), and Promoters (score 9-10). NPS is the percent of Promoters minus the percent of Detractors and is displayed in the range from -100 to 100. Providers are ranked in descending order of NPS. NPS categorizes users into Detractors (those that score 0-6), Passives (scores between 7 and 8), and Promoters (scores of 9-10). NPS represents the percentage of Promoters minus the percent of Detractors displayed in the range from -100 to 100. 

In our article discussing whether 5G was meeting customer expectations, we found that 5G users typically rate their network operator with NPS scores universally higher than those for 4G LTE users. In Q3 2023, that trend continued, as 5G  users that were on 5G network when answering the NPS question still scored higher than those on 4G across all markets analyzed. It isn’t surprising given that at a global level, 5G had a 637% better median download speed than 4G and a 130% better median upload speed. 

Chart of NPS Score, 5G Compared to 4G

While 5G NPS still outpaces scores on 4G, our data shows that 5G NPS has been decreasing annually. This could point to the fact that excitement about 5G as a new technology is waning as users become used to faster speeds, or as customers await new use cases that can take advantage of the faster speeds that 5G can provide. After all, we are still waiting for that killer app for 5G, the way the video and streaming were for 4G. 

While it is difficult to fully explain the reasons behind the 5G NPS decrease without further research, we can clearly see that network performance isn’t the only factor at play influencing NPS declines. Others can include customer care, pricing, and other services. For example, in South Korea, one of the first countries to launch 5G with one of the world’s fastest speeds, consumers scored 5G networks -41.47 in Q3 2023 compared to -20.51 in Q3 2022. 

In March 2021, South Korean consumers launched a class action suit against operators because they felt they were being misled by the promises of 5G in the country. Recently, South Korea’s antitrust regulator fined three 5G operators a total of 33.6 billion won ($25.06 million) for making exaggerated claims about the level of performance their networks could achieve. South Korean operators claimed consumers could experience theoretical 5G speeds, which are not practically achievable in a “real world” environment, as factors such as spectrum usage, network densification, user location, and device capability significantly affect actual performance. Our data shows that the top 10% of 5G users in South Korea experienced speeds of 1.004 Gbps in Q3 2023, which, although impressive, are far lower than the advertised 20 Gbps speeds. 

Chart of 5G NPS Score Change Year on Year

Fixed Networks

Fiber driving fixed performance gains 

Illustration of Fixed Median Performance Worldwide

On a global scale, fixed networks have demonstrated significant advancements, achieving a median download speed of 83.95 Mbps and an upload speed of 38.32 Mbps in Q3 2023, per Speedtest Intelligence data. This signifies a substantial 19% improvement in download speed and an impressive 28% enhancement in upload speed compared to those in 2022. This also indicates that more fixed connections have migrated to fiber networks.

According to the World Broadband Association (WBBA) report titled “Next Generation Broadband Roadmap 2023 to 2030” Fiber-to-the-Home (FTTH) is identified as the natural progression from copper-based xDSL broadband networks. The shift towards FTTH varies across different countries and regions, but the industry is committed to embracing more advanced and efficient broadband technologies. 

Oftentimes, despite improvement in underlying broadband technology, Wi-Fi is the bottleneck that reduces customer experience. Our research has shown that Wi-Fi performance can lag behind ethernet in markets where advanced cable and fiber connections are replacing legacy broadband technology (such as DSL or coax cable). Wi-Fi speeds typically range from 30-40% of ethernet, indicating a need to accelerate the adoption of more advanced Wi-Fi technologies and optimize the home network environment.

The UAE, Singapore, and Hong Kong are in the lead for fixed

Chart of Fastest Countries for Fixed Broadband Download Speed

The United Arab Emirates (UAE) and Singapore led the way in fixed network performance.

The UAE achieved a median download speed of 247.63 Mbps in Q3 2023, representing a notable 1.83 times increase compared to the previous year. Most customers in the UAE have access to fiber networks, and additional measures have been implemented by operators in the region to enhance internet speeds, such as increasing the minimum download speed from 250 Mbps to 500 Mbps and offering price discounts to incentivize users to upgrade to higher-tier plans. 

Singapore also leads on the 2023 Fiber Development Index (FDI), with maximum scores in seven of the nine metrics. Singapore, along with Qatar and South Korea, has achieved 100% FTHH coverage. One of the reasons for this success, besides having a smaller area, is that Singapore’s regulator mandates building owners and real estate developers to provide adequate space, facilities, and accessibility for network operators to pre-install fiber networks.

Hong Kong also demonstrated significant progress, with a 37% increase in median download speed and a 40% increase in upload speed. To track broadband adoption, the Office of the Communications Authority (OFCA) in Hong Kong monitors broadband adoption by advertised speed and technology mix; as of August 2023, 66% of residential clients already subscribed to the Internet with a download speed equal to or greater than 1 Gbps.

Chile has seen a 14% improvement in median download speed and a 29% improvement in upload speed on the back of a greater fiber adoption. Chile has been the top-performing fixed broadband market across Latin America, consistently outperforming other regional markets but over the last three years, it has also closed the performance gap with other leading markets globally. Chile’s strong fixed broadband performance — an anomaly in the region — is primarily due to strong competition among Chilean ISPs. Chile has seven ISPs with over 5% market share, all heavily focused on migrating customers to fiber. 

Thailand is a newcomer to the ranking as FTTH continues to grow strongly. FTTH constitutes an impressive 95% of fixed broadband users in Thailand, equivalent to around 58.96% of household penetration. Operators have been actively rolling out fiber in adherence to the Digital Thailand National Policy.

In the United States, there has been a 26% improvement in median download speed and a 7% improvement in upload speed. In this very competitive market, with a range of access technologies vying for customers, a combination of migration to fiber, 5G fixed-wireless access (FWA), and faster cable connections is helping drive higher performance levels. In line with the demand for faster network performance in the market, the FCC recently announced that it is seeking input on a planned increase to its definition of broadband/high-speed internet to 100 Mbps download and 20 Mbps upload, up from the current 25 Mbps download and 3 Mbps upload standard.

As discussed in our recent article, several European countries are making substantial progress in offering high-speed broadband. Across Europe, Denmark had the fastest median download speed for fixed broadband (196.43 Mbps), followed by Spain (176.08 Mbps) and France (170.51 Mbps). Denmark experienced a 25% improvement in median download speed and a 16% improvement in upload speed. Spain also showed significant improvement, with a 32% increase in median download speed and a 29% increase in upload speed. France exhibited even stronger progress, with a 53% increase in median download speed and a 41% increase in upload speed. The speed gains we’ve seen in Spain and France are correlated with an increase in fiber adoption; for example, Spain boasts nearly 90% fiber optic coverage, thanks to private initiatives and government support, while France expects a full-fiber rollout by 2025.

Connectivity for All

The imperative of closing the connectivity gap

Massive investments are being made to bridge the connectivity gap as recognition of connectivity as a fundamental human right is growing. According to a WBBA Whitepaper, a high level of broadband penetration is critical to the country’s socioeconomic development. However, it’s not only about being connected to the network per se; the quality of that broadband connection is equally crucial. Unlike other utility services like gas and electricity, where quality is generally stable, with broadband, the quality of the network experience is crucial to ensure users can benefit fully from multiple applications.

To assess the digital divide, we mapped mobile and fixed internet performance using data from the Open Data Initiative, which Ookla provides as part of Ookla for Good

Determining where a digital divide exists is a complex issue that involves identifying where network infrastructure is located, where people need connectivity, and how affordable it is. Although it can be challenging to dig into a specific location, it is evident that there are varying levels of Internet performance worldwide. A quick glance at our data shows that fixed broadband customers are more likely to experience faster networks (measured as an average download speed of 100 Mbps and above) than mobile across the Americas and Europe. The opposite is true for mobile networks across Africa and APAC, where mobile networks are often the primary means of connectivity. Compared to urban areas, rural communities are often ill-equipped for broadband access. Due to a lack of bandwidth (and therefore slower speeds), people in these areas need help doing many things on the internet, such as streaming videos. The US regulator FCC defines broadband in the United States as access to  25 Mbps download and 3 Mbps upload speeds. Areas without those speeds are classified as broadband “digital deserts,” even if those areas have internet access. Although broadband definitions can vary considerably from country to country, we can see in the next section that many areas fall outside any standards of connectivity globally.

Despite the world becoming increasingly connected, many rural and remote areas still struggle to access the internet. For example, large swathes of South America and Africa fall outside terrestrial network coverage. As discussed in our recent article, cellular networks are critical to connecting individuals and businesses as internet access in Africa is predominantly mobile. Before we can start discussing 5G, connecting communities with the internet in general is a priority. Affordable 4G smartphones and targeted financing for under-served demographics are key for bridging the digital divide and reducing poverty, as a World Bank study found that 4G coverage can help cut poverty by up to 4.3%. 

5G technology can potentially replace fixed internet access in situations where the cost of fiber deployments is high and rolling out traditional fixed broadband networks isn’t commercially viable. However, in countries like Indonesia, satellite technology may be a more effective solution for connecting remote areas. While 5G Fixed Wireless Access (FWA) and satellite technology can complement each other, the adoption of satellite technology is currently limited by factors such as coverage, device affordability, and service cost. As revealed in our recent article, Starlink outperforms GEO satellites and is a suitable replacement for fixed networks in rural areas. While it may not match the leading cable or fiber providers in terms of median speeds or multi-server latency, satellite internet provides a viable alternative in places where cable and fiber access networks are unavailable. This is mainly due to a more consistent distribution of download performance across Speedtest samples, unlike FWA and DSL-based services, where performance is impacted by the distance from the cell site or exchange/DSLAM.

Fixed and mobile network operators across the globe widely use Speedtest data to enhance Internet quality, improve accessibility, and inform network expansion. The United States Federal Communications Commission and the Malaysian Communications and Multimedia Commission rely on Speedtest data to ensure accountability of telecommunications entities and allocate funds for rural and urban connectivity development. Ookla also licenses data to NGOs and educational institutions to help bridge the digital divide between areas with and without modern Internet access. Our mapping data is used to track results and determine whether broadband infrastructure can handle growth as more people connect devices and technologies demand more bandwidth. We are also actively involved in discussing best practices for ensuring digital transformation and connectivity for all in the APAC region, Central Asia, and Europe. If you are interested in working with us, please reach out. 

Keep track of how well your country is performing on Ookla’s Speedtest Global Index and get advice on how to plan and optimize your network.

Ookla retains ownership of this article including all of the intellectual property rights, data, content graphs and analysis. This article may not be quoted, reproduced, distributed or published for any commercial purpose without prior consent. Members of the press and others using the findings in this article for non-commercial purposes are welcome to publicly share and link to report information with attribution to Ookla.