| February 22, 2023

Starlink Resurgence? Speeds Increase in Europe and Oceania

Ookla® is back with exciting, fresh data from Q3 and Q4 2022 for SpaceX’s Starlink and Sky Logic in Europe and Oceania, as well as new Starlink markets we haven’t yet featured in our ongoing series on satellite internet. With the FCC greenlighting Amazon’s Project Kuiper and many other exciting satellite developments launching this year, we’re certain all eyes will be on the sky in 2023 as new orbital connectivity options become available for consumers.

This analysis includes Starlink results from six new countries, and data for Starlink and Sky Logic in Europe and Starlink in Oceania. We also examine how Starlink’s internet performance has changed over the past year in Australia, Austria, Belgium, Croatia, France, Germany, Ireland, Italy, the Netherlands, New Zealand, Poland, Portugal, and the United Kingdom.

Starlink is mostly speeding up again from Q3 to Q4 2022, but is still slower than a year ago

As Starlink rides the wave of becoming an increasingly popular connectivity option for consumers, we’ve seen the service speed up and then slow down year-over-year in most markets. However, Q4 2022 data shows many countries are experiencing a modest rise in median download speeds when compared to Q3 2022. That’s encouraging for consumers, especially as Starlink hit over 1 million users in Q4 2022, and could be a sign that Starlink seems to be maturing its constellation’s capacity. That’s particularly intriguing as Starlink launches more next-gen satellites, which were first deployed at the tail end of Q4 2022 and will most likely show up in Q1 2023 results.

In Europe, all the countries we evaluated for year-over-year median download speeds were slower for Q4 2022 than Q4 2021 when there were fewer users on each network. Most countries showed between 10-20% slower speeds in Q4 2022 than what users experienced in Q4 2021, including Ireland (at least 11% slower), Austria (at least 13%), Portugal (at least 14%), Italy (at least 15%), Germany (at least 16%), and the U.K. (at least 19%). Users in France saw very similar speeds year over year, with just a 4% decrease from Q4 2021 to Q4 2022, while users in Poland saw a large decrease (at least 56% slower), and users in the Netherlands (at least 21%) and Belgium (at least 28%) saw substantial decrease during the same period.

In Oceania, Starlink year-over-year results were mixed, with Starlink’s download speed in Australia 24% slower in Q4 2022 than during Q4 2021, while in New Zealand it was 4% faster in Q4 2022 than Q4 2021.

Starlink in Denmark and Switzerland had the fastest satellite internet in Europe during Q4 2022

Speedtest Intelligence® reveals there was no fastest satellite provider in Europe during Q4 2022, though Starlink in Denmark (147.52 Mbps) and Switzerland (136.03 Mbps) led the pack for fastest median download speed. In all, Starlink download speeds were faster than 100 Mbps in 10 out of 15 European countries during Q4 2022 — a rise from just five out 15 in Q3 2022. 

Starlink outperformed fixed broadband providers over download speed in eight countries, including: Austria (105.67 Mbps), Belgium (104.84 Mbps), Croatia (102.99 Mbps), Czechia (64.67 Mbps), Germany (94.37 Mbps), Ireland (103.39 Mbps), Italy (101.06 Mbps), and the U.K. (96.79 Mbps). Fixed broadband providers were faster than satellite providers analyzed in Denmark, France, Netherlands, and Poland. Results were too close to call in Sweden with fixed providers at 106.73 Mbps and Starlink at 101.83 Mbps, as well as Portugal with Starlink at 108.02 Mbps and fixed broadband at 117.97 Mbps. Skylogic was too close to call between the median fixed broadband speed in Italy at 55.50 Mbps to 59.40 Mbps, and had download speeds faster than 40 Mbps in France (44.46 Mbps) and Sweden (48.09 Mbps).

For upload speeds, every country’s combined fixed broadband providers had faster median upload speeds than every satellite provider, though Starlink in Portugal had the fastest upload speed among satellite providers at 20.86 Mbps. All Starlink upload speeds ranged between 10-20 Mbps except Poland (9.79 Mbps) and Denmark (8.04 Mbps). 

Multi-server latency for all satellite providers was higher than fixed broadband providers in every European country in Q4 2022, which ranged from 12.34 ms in Sweden to 23.46 ms in Italy. However, Starlink had a median multiserver latencies of less than 60 ms in the U.K. (53.24 ms), Portugal (56.81 ms), and the Netherlands (58.85 ms). Most latencies were between 60-75 ms, with Poland having the highest latency at 86.46 ms — still low enough to have a good quality of experience and be able to video chat.

Starlink in New Zealand was the fastest satellite provider in Oceania

During Q4 2022, Starlink in New Zealand had the fastest median download speed among satellite providers in Oceania at 124.72 Mbps, followed by Starlink in Australia (106.43 Mbps), and Starlink in Tonga (35.15 Mbps). However, New Zealand fixed broadband outperformed Starlink, while Starlink in Australia outperformed fixed broadband providers. In Tonga, speeds were too close to call. 

Speedtest Intelligence shows Starlink falling behind fixed broadband providers for median upload speeds in New Zealand (16.89 Mbps) and Australia (11.38 Mbps), while Tonga was again too close to call.

Multi-server latency was higher over Starlink than fixed broadband in all three countries we surveyed in Oceania during Q4 2022. However, Starlink’s median latency was under 50 ms in New Zealand (48.11 ms), which is a very exciting development for consumers, especially with latency becoming an increasingly important metric. Starlink latency in Australia was higher at 65.52 ms, while Tonga followed at 88.81 ms.

New Q4 2022 Starlink countries show very promising results

Speedtest Intelligence shows the six new countries where we found new Starlink data are off to a roaring start in Q4 2022, which include Bulgaria, Finland, Jamaica, Japan, Latvia, and Malta. Starlink had faster median download speeds than the country’s respective fixed broadband providers combined in two countries: Bulgaria (110.76 Mbps versus 65.69 Mbps), and Jamaica (87.43 Mbps vs. 48.34 Mbps), while results were too close to call in the remaining four markets. However, Starlink showed promising 100+ Mbps speeds in Japan (156.94 Mbps), Finland (102.70 Mbps), and Malta (101.36 Mbps). 

Median upload speeds for Starlink lagged behind fixed broadband providers in all markets, though Malta was too close to call (20.40 Mbps for Starlink and 20.25 Mbps for fixed broadband). Starlink upload speeds ranged from about 14 Mbps to 20 Mbps in every market.

Consumers and enterprises stand to benefit from satellite developments in 2023

Starlink dominated headlines in 2022 — and for good reason. They’ve gained over 1 million users worldwide, will be available in connected vehicles, planes, RVs, and ships, partnered with T-Mobile to bring Starlink to mobile devices, and launched their second-gen satellites at the end of 2022. But that could very seriously change in 2023 with multiple competitors deploying major offensives in the satellite market. We’ll say it again: there is a new space race for connectivity being waged, and we’re just at the tip of what’s to come.

Here are some major updates about what’s next for various different satellite competitors:

Amazon’s Project Kuiper approved by the FCC

The biggest news concerning satellite connectivity is the FCC approving Amazon’s Project Kuiper constellation, which will include 3,236 satellites in an LEO array. On two fronts, this poses two potential challenges for Starlink: on one hand, Amazon has the global reach, scale, and consumer base that being one of the largest companies in the world provides. On the other, Blue Origin is a direct competitor of SpaceX, and won’t have to rely on the service or other vendors to launch their array into space. Amazon is in a good position to compete and Project Kuiper could become a major player if their prototypes, which will be launched in early 2023, reach speeds anywhere close to competing with broadband internet. 

Viasat set to launch Viasat-3 arrays around April 8, 2023

Long-term incumbent satellite internet provider, Viasat, has a big year ahead after years of planning and providing connectivity to remote locations around the world. Viasat is finally set to launch its Viasat-3 array, which aims to provide 1 Terabit per second (Tbps) of network capacity on each satellite, allowing its users to experience 100+ Mbps connections; that’s a huge improvement for the mainly GEO provider. While consumers likely won’t see these results until Q4 2023, we’re very excited to see how Viasat improves its network.

Eutelsat’s merger with OneWeb approved by Eutelsat board, second-gen array being planned

One of the biggest mergers in recent years among satellite providers has jumped a major hurdle and was approved by the Eutelsat board. While the combined entities still have to be approved by shareholders and regulators, this merger could expand both companies’ market share, particularly in India, which has fast become an important satellite market. Furthermore, OneWeb is already planning a second-gen satellite, which they’re aiming to launch in 2025.

European Commission forges ahead on Constellation Iris

The European Union has been working to create its own satellite constellation since 2020, and during November 2022, agreed to a plan to commit €2.4 billion for a third satellite array named Iris, in addition to Galileo and Copernicus. The project, which includes GEO, MEO, and LEO arrays, will help support EU connectivity priorities including the economy, environment, security, and defense, and is hoping to launch in 2024, and be fully operational by 2027.

HughesNet aiming to launch Jupiter 3 array in H1 2023

Incumbent satellite internet provider HughesNet is planning to launch its new Jupiter 3 array in the first half of 2023, which will help expand its network capacity, “doubling the size of the Hughes JUPITER fleet over North and South America.” While the Jupiter 3 array will still be a GEO constellation, the added network capacity will alleviate congested networks and give consumers more bandwidth to use the internet.

Ookla will continue monitoring new satellite internet developments

As 2023 continues to shape up as a pivotal year for satellite internet providers, we’ll be watching the sky to make sure providers are providing the connectivity consumers need. We’ll continue our series next quarter with Q4 2022 and Q1 2023 data from North and South America and any new countries where Starlink launches, and be back with Europe and Oceania data in Q3 2023. In the meantime, be sure to download the Speedtest® app for Windows and Mac computers or for iOS or Android for devices and see how your satellite internet stacks up to our findings.

Ookla retains ownership of this article including all of the intellectual property rights, data, content graphs and analysis. This article may not be quoted, reproduced, distributed or published for any commercial purpose without prior consent. Members of the press and others using the findings in this article for non-commercial purposes are welcome to publicly share and link to report information with attribution to Ookla.

| September 20, 2022

Starlink Slowed in Q2, Competitors Mounting Challenges

Ookla® has covered SpaceX’s Starlink satellite internet for over a year now with our ongoing series on satellite internet performance. We’ve seen Starlink launch in new locations across the world, and while some speeds have shown signs of slowing down from their initial launches, the newly announced T-Mobile partnership with Starlink could extend the benefit of satellite connections to the mobile market.

Today, we have fresh data on satellite performance during Q2 2022 in Europe, Oceania, North America, and South America. This analysis includes results from eight additional countries, two new providers, and expanded data for Starlink, HughesNet, and Viasat. We also examine how Starlink’s internet performance has changed over the past year in Canada, France, Germany, New Zealand, the United Kingdom, and the United States.

Starlink speeds decreased in every country we surveyed over the past year as more users sign up for service

Chart of Starlink performances in select countries

Speedtest Intelligence® reveals that median download speeds for Starlink fell across Canada, France, Germany, New Zealand, the U.K, and the U.S., dropping between 9% and 54% from Q2 2021 to Q2 2022 as more users signed up for the service. However, Starlink still reached a median download speed of at least 60 Mbps in North America during Q2 2022, which is more than enough for at least one connected device to do most everything on the internet including streaming video, downloading games, and chatting on video with friends and family.

Upload speeds also slowed on Starlink, with speeds decreasing across all of the countries we’ve tracked over the past year. Latency fared a little better with latency remaining relatively flat (though high when compared to fixed broadband) in most countries. New Zealand was the outlier, with latency dropping 23 ms. For most users, we still suspect these dips are still worthwhile for areas that have no service, slow service, or few affordable options for fast internet.

Starlink in Puerto Rico was the fastest satellite provider in North America

Chart of Satellite performance versus fixed broadband internet in North America

Starlink in Puerto Rico had the fastest satellite internet in North America during Q2 2022 with a median download speed of 112.22 Mbps, followed by Starlink in Mexico (80.17 Mbps), Canada (75.73 Mbps), and the U.S. (62.53 Mbps). Starlink in Puerto Rico and Mexico was faster than their countries’ fixed broadband providers combined (74.80 Mbps and 45.50 Mbps, respectively), while fixed broadband in the U.S. (150.12 Mbps) and Canada (106.41 Mbps) was faster than each country’s satellite providers.

In every country except Mexico, fixed broadband upload speeds were faster than satellite speeds. Starlink in Mexico edged out fixed broadband providers 14.48 Mbps to 12.20 Mbps. Latency was higher for every satellite provider compared to fixed broadband. Starlink in the U.S. had the lowest median latency among satellite providers at 48 ms.

Starlink outperformed fixed broadband average in 16 European countries

Chart of Satellite performance versus fixed broadband internet in Europe

Speedtest Intelligence shows Starlink was fast in Europe during Q2 2022, outperforming fixed broadband median download speed in 16 countries and reached download speeds over 100 Mbps in 10 countries. In contrast, fixed broadband only achieved median download speeds over 100 Mbps in six countries: Romania, Spain, Portugal, France, Hungary, and the Netherlands during Q2 2022. Starlink was fastest for median download speed in Portugal at 123.01 Mbps, the Netherlands (122.43 Mbps), Austria (112.01 Mbps), France (110.98 Mbps), and Belgium (110.40 Mbps). Romania and Spain were the only countries to have fixed broadband beat Starlink for fastest median download speed, achieving 131.41 Mbps and 127.19 Mbps, respectively.

For upload, Starlink in Greece and Austria was the only satellite provider to achieve faster upload speeds than all fixed broadband providers combined at 19.34 Mbps to 5.14 Mbps, and to 17.14 Mbps to 15.90 Mbps, respectively. Fixed broadband providers in Spain (99.21 Mbps), Romania (94.23 Mbps), Sweden (92.77 Mbps), France (88.22 Mbps), Lithuania (83.54 Mbps), and Portugal (73.13 Mbps) all recorded median upload speeds greater than 70 Mbps, with the closest satellite provider being Starlink in Portugal at 28.52 Mbps.

All satellite providers fell far behind fixed broadband providers in the whole of Europe for latency during Q2 2022. Starlink in Spain and the United Kingdom recorded the lowest satellite latencies at 37 ms and 39 ms, respectively — still a far cry from the closest fixed broadband latency, which was 14 ms in Germany, Greece, and Italy.

Starlink in Brazil was the fastest satellite provider in South America

Chart of Satellite performance versus fixed broadband internet in South America

Our analysis of Speedtest Intelligence data found Starlink in Brazil was the fastest satellite provider in South America with a median download speed of 128.38 Mbps during Q2 2022, followed by Starlink in Chile at 94.79 Mbps. Chilean fixed broadband internet was still much faster for those who could get access to it. The Speedtest Global Index™ found Chile had the second fastest fixed broadband internet in the world with a median download speed of 211.43 Mbps during August 2022. Starlink in Brazil was the only satellite provider to be faster than its country’s fixed broadband providers combined.

Like last quarter, South American fixed broadband providers surpassed satellite providers in each respective upload speeds during Q2 2022. All satellite providers had a higher median latency than fixed broadband, though Starlink in Brazil and Chile had latencies of 38 ms.

Starlink in New Zealand was the fastest satellite provider in Oceania 

Chart of Satellite performance versus fixed broadband internet in Oceania

Starlink’s fastest median download speed in Oceania was in New Zealand at 105.99 Mbps, though this still fell short of fixed broadband providers in the country. Starlink in Australia was faster than fixed broadband providers by a wide margin at 102.76 Mbps to 51.46 Mbps during Q2 2022. Starlink outperformed fixed broadband providers in new-to-our-list Tonga 45.25 Mbps to 22.32 Mbps. 

New Zealand’s fixed broadband dominated for the fastest median upload speed in Oceania at 87.29 Mbps during Q2 2022, while Australia’s fixed broadband fell far behind with an upload speed of 17.86 Mbps. Both speeds were still faster than Starlink’s median upload speeds in New Zealand and Australia (12.31 Mbps and 10.45 Mbps, respectively). Tonga didn’t have a statistical winner for fastest upload speed, but Starlink reached 19.26 Mbps and fixed broadband 18.11 Mbps. Fixed broadband also had a lower median latency than Starlink during Q1 2022, which clocked in at 49 ms in Australia, 78 ms in New Zealand, and 98 ms in Tonga.

Biggest questions lie ahead, but competition will be good for consumers

Satellite connectivity is coming to mobile, with Starlink’s new partnership with T-Mobile and new mobile devices becoming satellite enabled. This will cause ripples across North America, which is a net positive for consumers who live in areas with low mobile and fixed broadband connectivity. Connecting with the world won’t be a question of how anymore, it will be a question of how good your experience is. That’s hopefully a win-win for consumers, especially as more providers vie for the fastest and best satellite experience — a true global space race.

Starlink isn’t stopping there — they’re trying to get into airplanes, cruise ships, and cars. But they’re not the only satellite provider making moves; Viasat is launching its Viasat-3 fleet, OneWeb is combining business with Eutelsat, and Amazon is sending 3,236 Project Kuiper satellites into orbit. We’ll be here monitoring the skies in our ongoing satellite series. Take a Speedtest® to help us provide an accurate and more complete picture of real-world performance. And if we’re missing data on your satellite network, send us a screenshot of your speed on Twitter or Facebook.

Ookla retains ownership of this article including all of the intellectual property rights, data, content graphs and analysis. This article may not be quoted, reproduced, distributed or published for any commercial purpose without prior consent. Members of the press and others using the findings in this article for non-commercial purposes are welcome to publicly share and link to report information with attribution to Ookla.

| June 28, 2022

Here’s How Fast Starlink Has Gotten Over the Past Year

It’s been a year since we first examined SpaceX’s Starlink satellite internet, which launched its public beta in November 2020. Today we’re updating our ongoing series on satellite internet performance with data from Q1 2022 in Europe, Oceania, North America, and South America, including results from 10 additional countries. We’re also examining how Starlink’s internet performance has changed over the past year in the United States and Canada.

Starlink speeds increased nearly 58% in Canada and 38% in the U.S. over the past year

chart of Starlink and fixed broadband performance in Canada and the United States

Speedtest Intelligence® reveals that median download speeds for Starlink dramatically increased from Q1 2021 to Q1 2022 in the U.S. and Canada, as did speeds for all fixed broadband providers combined. In the U.S., Starlink median download speeds improved roughly 38% from 65.72 Mbps in Q1 2021 to 90.55 Mbps in Q1 2022. In Canada, Starlink’s download speed leapt ahead nearly 58% from 61.84 Mbps to 97.40 Mbps during the same time period.

However, Speedtest Intelligence also showed that upload speeds for Starlink decreased at least 33% in the U.S. (16.29 Mbps in Q1 2021 to 9.33 Mbps in Q1 2022) and at least 36% in Canada (16.69 Mbps to 10.70 Mbps) during the same time period. Median latency on Starlink marginally increased from 40 ms to 43 ms in the U.S. and from 51 ms to 55 ms in Canada during the past year. For many Starlink users, we suspect these changes are negligible.

Starlink in Mexico was the fastest satellite provider in North America

Chart of Satellite performance versus fixed broadband internet in North America

Starlink in Mexico had the fastest satellite internet in North America during Q1 2022 with a median download speed of 105.91 Mbps, followed by Starlink in Canada (97.40 Mbps) and the U.S. (90.55 Mbps). Mexico’s fixed broadband download speed (40.07 Mbps) was much slower than Starlink, while Starlink download speeds were slower than fixed broadband for all providers combined in the U.S. (144.22 Mbps) and Canada (106.86 Mbps). Puerto Rico, new to our list, showed HughesNet had the fastest satellite internet on the island territory at 20.54 Mbps, though fixed broadband was much faster at 68.88 Mbps.

Starlink in Lithuania was the fastest satellite provider in Europe

Chart of satellite performance versus fixed broadband internet in Europe

Speedtest Intelligence showed that Starlink blazed ahead in Europe during Q1 2022, with Starlink achieving a 100+ Mbps median download speed in every country where it was commercially available. In contrast, fixed broadband only achieved median download speeds over 100 Mbps in Spain, Portugal, and the Netherlands during Q1 2022. Starlink was fastest for download speed in Lithuania at 160.08 Mbps, followed by Belgium (147.85 Mbps), Slovakia (146.25 Mbps), Croatia (136.00 Mbps), and Austria (132.61 Mbps). Spain was the only country to have its fixed broadband beat Starlink for fastest median download speed, achieving 131.99 Mbps to Starlink’s 108.43 Mbps within the country.

For upload, fixed broadband providers in Spain (100.65 Mbps), France (86.02 Mbps), Portugal (74.42 Mbps), and Lithuania (73.95 Mbps) all recorded median speeds greater than 70 Mbps, while the closest satellite provider, Starlink in Portugal, trailed at 32.05 Mbps.

All satellite providers fell far behind fixed broadband providers in the whole of Europe for latency during Q1 2022, with Starlink in Spain and the United Kingdom recording the highest satellite latencies at 35 ms and 36 ms, respectively — a far cry from the lowest fixed broadband latency, which was 15 ms in the U.K.

Starlink in Chile was the fastest satellite provider in South America

Chart of Satellite performance versus fixed broadband internet in South America

Our analysis of Speedtest Intelligence data found Starlink in Chile was the fastest satellite provider in South America with a median download speed of 110.49 Mbps during Q1 2022. Although Chilean fixed broadband internet was much faster for those who could get access to it. In fact, during May 2022, the Speedtest Global Index™ found Chile had the second fastest fixed broadband internet in the world with a median download speed of 206.97 Mbps, just a hair shy of Singapore’s first place speed of 209.21 Mbps. 

No South American satellite provider surpassed its country’s fixed broadband download or upload speeds during Q1 2022. Viasat in Brazil had a noteworthy median download speed of 62.07 Mbps, though still fell short of the country’s fixed broadband speed of 90.20 Mbps. All satellite providers had a higher median latency than fixed broadband, though Starlink in Chile had a latency of 38 ms.

Starlink in Australia was the fastest satellite provider in Oceania

Chart of Satellite performance versus fixed broadband internet in Oceania

Starlink raced ahead in Oceania, recording faster median download speeds than fixed broadband in both Australia and New Zealand. In Australia, Starlink had a median download speed of 124.31 Mbps, much faster than Australian fixed broadband at 50.87 Mbps for download during Q1 2022. The comparison in New Zealand was much closer with Starlink’s median download speed at 118.70 Mbps and fixed broadband at 116.83 Mbps during Q1 2022.

New Zealand’s fixed broadband dominated for the fastest median upload speed in Oceania at 84.34 Mbps during Q1 2022, while Australia’s fixed broadband fell far behind with an upload speed at 17.85 Mbps. Both speeds were still faster than Starlink’s median upload speeds in New Zealand and Australia (13.09 Mbps and 11.71 Mbps, respectively). Fixed broadband also had a faster median latency than Starlink during Q1 2022, which clocked in at 47 ms in Australia and 78 ms in New Zealand.

Consumers are flocking to Starlink, but competitors are close behind

As we’ve continued to see over the past year, Starlink’s low-earth orbit satellites (LEOs) provide a life-changing service for consumers in rural areas that might not otherwise have access to high-speed internet. However, more companies are looking to compete with Starlink and launch their own LEO constellations, including Amazon’s Project Kuiper, which recently received FCC permission to test their own satellite service and is slated to launch later this year, and Viasat which is set to merge with Inmarsat and launch new constellations by 2023.

We’ll continue to monitor the skies in our ongoing satellite series, but if you’re using satellite internet, take a Speedtest® to help us provide an accurate and more complete picture of real-world performance.

Editor’s note: This article was amended on June 28 to clarify percentage increases in the U.S. and Canada and to update the percent change for upload for Canada.

Ookla retains ownership of this article including all of the intellectual property rights, data, content graphs and analysis. This article may not be quoted, reproduced, distributed or published for any commercial purpose without prior consent. Members of the press and others using the findings in this article for non-commercial purposes are welcome to publicly share and link to report information with attribution to Ookla.

| March 16, 2022

Starlink Hits 100+ Mbps Download Speed in 15 Countries During Q4 2021

Fast satellite internet has become increasingly available to more and more people across the globe. It’s already a huge boon to rural communities that might otherwise be too remote for fixed broadband service. Starlink, Viasat, HughesNet, and other satellite providers are all placing big bets on low-earth orbital (LEO) satellite constellations, and Starlink is even introducing a new premium service with speeds expected to be around 150-500 Mbps. It’s a gamble, as Starlink recently learned after losing about 40 satellites to a geomagnetic storm, but it’s a gamble worth making. The European Commission is even planning a multibillion Euro investment to connect the continent to satellite internet. 

We’ve analyzed fresh satellite internet performance data from Q4 2021 including results from seven additional countries to update our ongoing series.

United States: Starlink was the fastest satellite provider during Q4 2021 and speeds increased over Q3 2021

Satellite Internet Performance vs Fixed in USA

U.S. consumers saw mixed satellite performance when comparing Q3 2021 to Q4 2021, while the United States government has been trying to increase satellite internet competition. Starlink’s median download speed increased from 87.25 Mbps during Q3 2021 to 104.97 Mbps in Q4 2021 — an important benchmark that inches Starlink closer to reaching the Rural Digital Opportunity Fund’s (RDOF) baseline of download speeds greater than 100 Mbps. Viasat overtook HughesNet to follow Starlink distantly at 21.81 Mbps (comparable to the 18.75 Mbps we saw in Q3 2021) and HughesNet followed at 20.92 Mbps (19.30 Mbps in Q3 2021). SES, new to our list this quarter, trailed far behind at 2.19 Mbps. For comparison, the median download speed for all fixed broadband providers rose moderately in the U.S. during Q4 2021 from 119.84 Mbps in Q3 2021 to 131.30 Mbps in Q4 2021.

Starlink saw a slight decrease in median upload speed from 13.54 Mbps during Q3 2021 to 12.04 Mbps in Q4 2021, still short of the median upload speed for all fixed broadband, which rose to 19.49 Mbps in Q4 2021 from 18.03 Mbps in Q3 2021. Viasat followed at 2.88 Mbps (2.96 Mbps in Q3 2021), then HughesNet at 2.54 Mbps (2.13 Mbps in Q3 2021), and SES at 1.19 Mbps.

As we’ve seen over the past year, Starlink, which uses only low earth orbit (LEO) satellites, was once again the only satellite internet provider with a median latency anywhere close to fixed broadband in Q4 2021 (40 ms and 14 ms, respectively). SES, Viasat, and HughesNet, which all utilize higher geosynchronous earth orbit (GEO) satellites for now, had much higher median latencies at 613 ms, 627 ms, and 725 ms, respectively.

Starlink performance continues to vary widely at the county level

Median Download Speed for Starlink in Selected US Counties

During Q4 2021, we saw about a 130 Mbps range in performance between the U.S. county with the fastest median download speed over Starlink (Miami Dade County in Florida at 191.08 Mbps) and the county with the slowest median download speed (Columbia County in Oregon at 64.95 Mbps). Even the lower-end speeds were well above the FCC’s baseline performance tier for broadband internet of at least a 25 Mbps download speed.

Satellite internet performance elsewhere in the world

We examined satellite internet performance in countries with an established market share to see how well their speeds compare to local fixed broadband. We’re excited to add analyses on satellite performance in Austria, Ireland, Italy, Mexico, Netherlands, Poland, and Portugal this quarter. We’ve also added Starlink to the list of providers in Chile. With Starlink continuing to launch in additional countries, we’re looking forward to seeing how Starlink performs during Q1 2021.

Australia: Starlink nearly triples fixed broadband download average

Starlink performed well in Australia during Q4 2021 with a median download speed of 141.55 Mbps. The median download speed for all fixed broadband providers was 51.35 Mbps. Starlink’s 14.84 Mbps median upload speed fell behind fixed broadband providers’ 18.01 Mbps. Starlink is a clear alternative to traditional fixed broadband for speeds, however Starlink can’t yet compete for latency, with Starlink showing a median latency of 43 ms vs. 10 ms for all fixed broadband combined.

Austria: Starlink download speed outpaces fixed broadband by more than double

New to our list this quarter, Austrian consumers had fast speeds over Starlink during Q4 2021, achieving faster median download speeds than that of all fixed broadband providers combined at 131.84 Mbps vs. 50.33 Mbps on fixed broadband. Starlink also had a faster median upload speed at 19.91 Mbps vs. 14.34 Mbps on fixed broadband. Starlink trailed fixed broadband on median latency during Q4 2021, 52 ms vs. 13 ms.

Satellite Internet Performance vs Fixed Broadband in Austria

Belgium: Starlink much faster than fixed broadband

Starlink’s median download speed of 155.15 Mbps during Q4 2021 was much faster than the country’s median download for all fixed broadband of 76.94 Mbps. That’s also a large increase from Starlink’s median download speed of 127.46 Mbps in Q3 2021. For median upload speed, Starlink was only slightly slower at 15.15 Mbps than the median fixed broadband upload speed of 18.05 Mbps. However, Starlink’s 45 ms latency was higher than the country’s median latency of 13 ms. Starlink was the only satellite internet provider with adequate samples to analyze in Belgium during Q4 2021. For rural Belgians, Starlink is a strong option.

Satellite Internet Performance vs Fixed Broadband in Belgium

Brazil: Viasat fell further behind as national fixed broadband sped up

Viasat’s median download speed in Brazil dipped slightly from 66.32 Mbps during Q3 2021 to 62.80 Mbps during Q4 2021. This fell further away from the national median for fixed broadband, which sped up to 83.03 Mbps during Q4 2021 (71.50 Mbps in Q3 2021). Viasat’s median upload speed (1.07 Mbps) was much slower than that on fixed broadband (40.76 Mbps), and Viasat’s latency was much higher (610 ms vs 6 ms). With Starlink slated to enter the Brazilian market soon, we’ll be watching these numbers closely to see if additional competition spurs the market.

Satellite Internet Performance vs Fixed Broadband in Brazil

Canada: Starlink performance reaches milestone during Q4 2021

In our last article, Starlink’s median download speed decreased to slower than fixed broadband in Canada during Q3 2021 (84.55 Mbps vs. 90.67 Mbps). But in Q4 2021, Starlink’s median download speed leapt ahead, achieving 106.64 Mbps while median download speed for fixed broadband increased to 96.39 Mbps. Starlink’s median upload speed was slower than fixed broadband (12.82 Mbps vs. 21.66 Mbps) and latency on Starlink was still much higher (55 ms vs. 11 ms). Starlink should be considered a viable option compared to fixed broadband in Canada, especially for rural consumers or those without access to fast fixed broadband options like fiber.

Satellite Internet Performance vs Fixed Broadband in Canada

Starlink faster than overall fixed broadband in nearly every province

Median Download Speed for Starlink in Canadian Provinces

Starlink showed enough samples to analyze performance in all 10 provinces in Canada during Q4 2021 — all of which showed substantial increases in Starlink’s download speed during Q4 2021 compared to Q3 2021. Starlink’s median download speed was faster than the median download for all fixed broadband in seven provinces during Q4 2021: Manitoba (101.66 Mbps vs. 83.06 Mbps), Newfoundland and Labrador (195.30 Mbps vs. 131.58 Mbps), Nova Scotia (143.52 Mbps vs. 121.57 Mbps), Ontario (106.24 Mbps vs. 95.06 Mbps), Prince Edward Island (139.11 Mbps vs. 75.95 Mbps), Quebec (123.50 Mbps vs. 84.50 Mbps), and Saskatchewan (116.24 Mbps vs. 68.43 Mbps).

Download speeds were comparable between Starlink and overall fixed broadband in New Brunswick (130.67 Mbps vs. 132.65 Mbps), and overall fixed broadband was faster than Starlink in Alberta (107.32 Mbps vs. 96.56 Mbps) and British Columbia (130.97 Mbps vs. 94.74 Mbps) — with the latter two provinces having better access to fiber-to-the-home (FTTH).

Chile: Starlink debuts fast speeds, but still much slower than scorching fast fixed broadband

Chilean fixed broadband providers have continued to achieve some of the fastest speeds in the world, recording the fastest speed on the Speedtest Global Index during February 2022, and we were interested to see how Starlink would compete. Starlink reached 118.95 Mbps in Chile during Q4 2021, which was faster than HughesNet (15.30 Mbps) but much slower than Chile’s median download speed for all fixed broadband providers (168.92 Mbps). 

Median upload speeds also showed a wide gap in Chile between satellite and fixed broadband during Q4 2021 (23.46 Mbps for Starlink and 3.42 Mbps for HughesNet vs. 89.76 Mbps on fixed broadband). Fixed broadband was also much faster for latency: 7 ms for fixed broadband vs. 38 ms for Starlink and 615 ms for HughesNet.

Satellite Internet Performance vs Fixed Broadband in Chile

Colombia: HughesNet decreased over download and upload speeds

HughesNet’s median download speed decreased in Q4 2021 to 11.75 Mbps from 12.12 Mbps during Q3 2021, while Colombia’s fixed broadband increased to 54.60 Mbps (46.08 Mbps in Q3 2021). Median upload speed was also slower for HughesNet than fixed broadband (2.88 Mbps vs. 11.86 Mbps), and latency was much higher on HughesNet (717 ms vs. 14 ms).

Satellite Internet Performance vs Fixed Broadband in Colombia

France: Starlink download speed increased, still faster than fixed broadband

Starlink users in France saw a median download speed of 121.21 Mbps in Q4 2021 (up from 102.15 Mbps in Q3 2021). Starlink’s download speed easily beat the country-wide median for fixed broadband of 90.88 Mbps (up from 75.47 Mbps in Q3 2021). Starlink’s upload speed during Q4 2021 was slower than the fixed broadband median (17.20 Mbps vs. 69.49 Mbps), and Starlink’s latency was higher (51 ms vs. 12 ms). Satellite provider SES, on this list for the first time, trailed behind both Starlink and fixed broadband with a 14.88 Mbps download speed, 1.83 Mbps upload speed, and 649 ms latency. Starlink remains an good option for rural French consumers.

Satellite Internet Performance vs Fixed Broadband in France

Germany: Starlink blazes ahead of fixed broadband download speed

Starlink’s median download speed in Germany of 115.58 Mbps was much faster than the fixed broadband median of 65.86 Mbps during Q4 2021 (and Starlink’s Q3 2021 download speed of 95.40 Mbps). Starlink was slightly slower for upload speed than overall fixed broadband (15.17 Mbps vs. 22.40 Mbps) and Starlink showed a higher latency (47 ms) than fixed broadband (14 ms).

Satellite Internet Performance vs Fixed Broadband in Germany

Ireland: Starlink download debuts nearly double that of fixed broadband

Starlink’s debut on our list is noteworthy in Ireland, where it achieved a download speed almost double that of Ireland’s combined fixed broadband average during Q4 2021 (123.51 Mbps vs. 65.89 Mbps). Median upload speeds were almost level, with Starlink recording a median upload speed at 24.35 Mbps vs. 22.63 Mbps for fixed broadband. Starlink lagged for latency at 45 ms vs. 11 ms for fixed broadband. Starlink is a great option for those who are looking for fast speeds in Ireland and can’t get access to fixed broadband.

Satellite Internet Performance vs Fixed Broadband in Ireland

Italy: Starlink dominates against fixed broadband

Starlink enters our list in Italy with a decisive statement during Q4 2021: It achieved a median download speed of 124.39 Mbps, a huge leap ahead of Italy’s fixed broadband average of 49.56 Mbps. Upload speeds were comparable between the two, with Starlink recording a median of 18.90 Mbps to 18.29 on fixed broadband. Starlink had a higher latency at 52 ms vs. 14 ms on fixed broadband. Starlink is an attractive option for fast internet in Italy.

Satellite Internet Performance vs Fixed Broadband in Italy

Mexico: Starlink impresses during Q4 2021 debut

Starlink, which only became commercially available in Mexico during November 2021, made a significant splash during its brief Q4 2021 debut, achieving a median download speed of 141.94 Mbps. That was significantly faster than Viasat (16.34 Mbps), HughesNet (10.63 Mbps), and all fixed broadband providers combined (36.56 Mbps). 

Starlink also outpaced fixed broadband for fastest upload speed (22.32 Mbps vs. 9.53 Mbps). HughesNet and Viasat followed at 3.10 Mbps and 2.06 Mbps, respectively. Starlink was the only satellite provider that came close to fixed broadband median latency, 64 ms to 11 ms. Viasat and HughesNet were distantly behind at 676 ms and 763 ms, respectively. With Starlink making such an impressive entrance into Mexico, we’ll be interested to see if the performance holds up in the coming months.

Satellite Internet Performance vs Fixed Broadband in Mexico

Netherlands: Starlink faster for median download, lagging on upload and latency

The Netherlands, which is new to this list, has some of the fastest median mobile and fixed broadband speeds in the world according to the Speedtest Global Index. We were eager to see how Starlink would perform against this competition. During Q4 2021, Starlink achieved a median download speed of 138.40 Mbps compared to 95.55 Mbps over fixed broadband. Starlink lagged noticeably behind for upload speed at 15.60 Mbps vs. 30.87 Mbps on fixed broadband. Starlink also had a higher latency at 45 ms vs. 11 ms on fixed broadband.

Satellite Internet Performance vs Fixed Broadband in Netherlands

New Zealand: Starlink slowed slightly, still faster than fixed broadband download

Starlink’s Q4 2021 median download speed (116.44 Mbps, down slightly from 120.10 Mbps Mbps in Q3 2021, likely due to increased adoption) was faster than New Zealand’s median fixed broadband download speed (98.61 in Q4 2021, up from 84.98 Mbps in Q3 2021). Starlink was much slower than New Zealand’s median fixed broadband upload speed for Q4 2021 (13.79 Mbps vs. 59.26 Mbps, which was a huge increase from 23.62 Mbps on fixed broadband during Q3 2021). Starlink’s median latency during Q4 2021 was comparable to Q3 2021 (79 ms vs. 81 ms) which was still much slower than New Zealand’s median for all fixed broadband of 6 ms during Q4 2021.

Satellite Internet Performance vs Fixed Broadband in New Zealand

Poland: Starlink a fast option for Poles

Starlink launched in Poland during September 2021 and is already recording fast speeds. The median download speed for Starlink was much faster than fixed broadband at 129.29 Mbps to 83.88 Mbps during Q4 2021. Upload speed was roughly comparable, with Starlink recording a slightly slower median upload speed of 24.17 Mbps and fixed broadband ahead at 28.60 Mbps. Starlink’s latency was higher at 58 ms to 10 ms on fixed broadband. That’s still acceptable for online gaming, but higher than what’s considered optimal.

Satellite Internet Performance vs Fixed Broadband in Poland

Portugal: Starlink far ahead on download speed in debut, fixed broadband much faster on upload

Another newcomer to this list this quarter, Portugal was a place where Starlink dominated with a much faster median download speed than fixed broadband at 140.35 Mbps to 94.62 Mbps, respectively, during Q4 2021. Upload speed was a different story, with fixed broadband notching a median upload speed of 65.52 Mbps to Starlink’s 30.16 Mbps. Starlink also had a much higher latency than fixed broadband at 44 ms to 7 ms. Starlink remains a good option if you don’t have access to good fixed broadband in Portugal. 

Satellite Internet Performance vs Fixed Broadband in Portugal

United Kingdom: Starlink still nearly twice as fast as fixed broadband median

Starlink showed a faster median download speed in the U.K. (121.94 Mbps in Q4 2021, up from 111.66 Mbps in Q3 2021) than the country’s median for fixed broadband (57.66 Mbps in Q4 2021, up from 53.16 Mbps in Q3 2021). Starlink’s median upload speed (13.96 Mbps) was comparable to the median upload for all fixed broadband in the U.K. (16.84 Mbps), and the latency was relatively fast given the distance traveled (36 ms for Starlink vs. 15 ms for all fixed broadband) — enough to be able to reliably play online multiplayer games. Satellite provider SES trailed far behind during Q4 2021 with a 3.79 Mbps median download speed, 3.74 Mbps median upload, and 636 ms median latency.

Satellite Internet Performance vs Fixed Broadband in United Kingdom

Competition among satellite providers is rapidly increasing and we’ll continue watching closely

We look forward to updating this data again next quarter with new locations as satellite internet continues to become a more viable option for many. If you’re using satellite internet, take a Speedtest® to help us provide an accurate picture of real-world performance.

Editor’s note: The section on Australia was amended on March 24 to remove performance details for Viasat which was determined not to be a consumer offering at this time.

Ookla retains ownership of this article including all of the intellectual property rights, data, content graphs and analysis. This article may not be quoted, reproduced, distributed or published for any commercial purpose without prior consent. Members of the press and others using the findings in this article for non-commercial purposes are welcome to publicly share and link to report information with attribution to Ookla.

| February 12, 2020

How Roaming Affects Mobile Speeds in Europe

Last year, we conducted an expansive analysis of mobile roaming in the European Union. We’re updating our data to see which countries have the best roaming speeds and how roaming affects time spent on Wi-Fi. This analysis is based on Speedtest data from Android devices in Europe during Q3-Q4 2019. Despite Brexit, we’ve included data from the United Kingdom to keep parity year-over-year, as the roaming agreement remains in place for 2020 and this data involves travel within a specific set of countries.

Roaming in Europe typically means slower download speeds

Mobile roaming speeds are affected by the deals struck between individual mobile operators on a country-by-country basis. This means roaming speeds can depend on the plan a subscriber has selected in their home country and on what is offered in the country of destination.

Out of the 28 countries we examined, residents of 22 countries experienced slower speeds when roaming elsewhere in Europe than they do in their home countries. Travelers from the Netherlands experience the most significant loss in speed, with a roaming download speed that is 54.7% slower than at home. However, users in Slovakia barely notice a change in download speed with a roaming download speed only 2.6% slower than the mean download speed in Slovakia during this period.

Roaming vs. Local Mobile Download Speeds in Europe
Speedtest® Data | Q3-Q4 2019
Country Local Speeds (Mbps) Roaming Speed Upload (Mbps) % Change
Austria 46.30 35.93 -22.4%
Belgium 50.95 33.38 -34.5%
Bulgaria 55.32 30.95 -44.1%
Croatia 52.40 43.73 -16.6%
Cyprus 43.50 21.04 -51.6%
Czech Republic 47.00 36.37 -22.6%
Denmark 48.38 32.28 -33.3%
Estonia 42.61 43.90 3.0%
Finland 43.38 41.46 -4.4%
France 44.34 34.00 -23.3%
Germany 34.07 30.48 -10.5%
Greece 39.90 45.03 12.9%
Hungary 45.53 29.55 -35.1%
Ireland 26.73 32.05 19.9%
Italy 33.64 40.98 21.8%
Latvia 33.20 38.54 16.1%
Lithuania 46.72 39.73 -15.0%
Luxembourg 52.55 34.61 -34.1%
Malta 48.88 32.30 -33.9%
Netherlands 62.52 28.31 -54.7%
Poland 33.07 25.57 -22.7%
Portugal 34.49 36.34 5.4%
Romania 37.84 33.69 -11.0%
Slovakia 34.74 33.83 -2.6%
Slovenia 39.34 32.67 -16.9%
Spain 34.28 27.56 -19.6%
Sweden 48.52 36.55 -24.7%
United Kingdom 36.36 34.96 -3.8%

Upload speeds locally are also mostly faster than those experienced while roaming. Cyprus, Denmark, and the Netherlands all had relatively high mean upload speeds locally, but they also had the largest loss in roaming upload speeds ranging from 31.3% to 36.7% slower upload speeds on mobile roaming.

Residents of some European countries do benefit from faster speeds when roaming on mobile. Users from Estonia, Portugal, Greece, Latvia, Ireland, and Italy all experienced faster download speeds when roaming elsewhere in Europe than they did in their home countries during Q3-Q4 2019. Italian and Irish travelers gained the most when roaming with download speeds that were 21.8% and 19.9% faster than their local speeds, respectively.

A total of 12 countries had higher mean upload speeds while roaming than they experienced locally during this period. France, Latvia, and Ireland benefitted the most with an increase in upload speeds that ranged from 26.5% to 21.4% while roaming.

Latency increases dramatically while roaming in Europe

Unlike mean download and upload speeds, latency is almost always dramatically different while roaming. This is because roaming signals are routed through a user’s home network, making latency a significant issue for Europeans when traveling.

Local vs. Roaming Latency in Europe
Speedtest® Data | Q3-Q4 2019
Country Local Latency (ms) Roaming Latency (ms) % Change
Austria 26 84 220.4%
Belgium 27 83 205.7%
Bulgaria 27 127 368.3%
Croatia 33 89 166.0%
Cyprus 23 213 825.5%
Czech Republic 26 74 187.6%
Denmark 26 100 287.9%
Estonia 25 76 201.5%
Finland 27 97 254.6%
France 41 82 98.8%
Germany 38 87 128.1%
Greece 29 129 349.8%
Hungary 25 93 272.6%
Ireland 35 100 185.0%
Italy 50 91 81.2%
Latvia 26 95 268.2%
Lithuania 27 107 302.2%
Luxembourg 23 83 262.6%
Malta 19 136 611.6%
Netherlands 28 87 208.3%
Poland 35 109 209.2%
Portugal 30 109 258.8%
Romania 30 113 275.3%
Slovakia 31 76 105.5%
Slovenia 24 74 208.2%
Spain 45 107 137.4%
Sweden 29 118 304.3%
United Kingdom 38 103 173.1%

In their home country, residents of Malta (19 ms), Luxembourg (22 ms) and Cyprus (23 ms) enjoyed the lowest latencies in Europe. Residents of France, Spain and Italy experienced the highest latencies in their home countries at 41 ms, 45 ms and 50 ms, respectively.

European residents experienced an increase of at least 81.2% in their latency when visiting other countries within Europe. Residents from Cyprus, Malta and Bulgaria experience the biggest increase in latency when visiting other countries in Europe, ranging from Cyprus’ 825.5% to Bulgaria’s 368.3%. The countries that experienced the smallest increase in latency were Italy (81.2%), France (98.8%) and Germany (128.1%).

Locals spend more time on Wi-Fi than visitors in Europe

While there are no roaming changes within the E.U., users often opt to connect to Wi-Fi to avoid additional data overages at home and abroad. The following table compares the percentage of time spent on Wi-Fi by a resident of a country with that of a visitor to the same country during Q3-Q4 2019.

Percentage of Time Spent on Wi-Fi in Europe
Speedtest® Data | Q3-Q4 2019
Country Local Customers Visitors % Change
Austria 75.5% 40.5% -46.3%
Belgium 77.9% 35.8% -54.1%
Bulgaria 74.0% 60.3% -18.5%
Croatia 74.3% 53.8% -27.5%
Cyprus 79.3% 70.2% -11.5%
Czech Republic 80.1% 46.6% -41.8%
Denmark 78.7% 60.3% -23.4%
Estonia 70.3% 51.9% -26.2%
Finland 63.0% 60.3% -4.4%
France 69.3% 48.7% -29.7%
Germany 80.0% 47.1% -41.1%
Greece 79.3% 64.3% -19.0%
Hungary 76.8% 47.8% -37.8%
Ireland 75.6% 58.9% -22.0%
Italy 70.9% 55.1% -22.2%
Latvia 68.8% 49.2% -28.4%
Lithuania 73.8% 52.2% -29.2%
Luxembourg 72.4% 30.8% -57.4%
Malta 79.4% 65.9% -17.1%
Netherlands 81.8% 49.1% -40.1%
Poland 70.2% 58.2% -17.1%
Portugal 76.5% 61.9% -19.0%
Romania 69.6% 64.1% -7.9%
Slovakia 76.2% 40.1% -47.4%
Slovenia 70.7% 24.7% -65.2%
Spain 78.3% 62.8% -19.7%
Sweden 81.8% 53.8% -34.3%
United Kingdom 79.3% 60.9% -23.1%

As we saw last year, Finnish residents spent the least amount of time on Wi-Fi at 63.0%. Latvia showed the second lowest time spent on Wi-Fi (68.8%), followed by France (69.3%). Residents from the Netherlands, Sweden and the Czech Republic spent the most time on Wi-Fi at 81.8%, 81.8%, and 80.1%, respectively.

Visitors to Cyprus, Malta and Greece spent the most amount of time on Wi-Fi during this period. Time spent on Wi-Fi by visitors ranged from 64.3% in Greece to 70.2% in Cyprus. Visitors to Slovenia, Luxembourg and Belgium as a destination country spent the least amount of time on Wi-Fi at 25.7%, 30.8% and 35.8%, respectively.

Are you interested in more data on roaming performance? Read more here!

Ookla retains ownership of this article including all of the intellectual property rights, data, content graphs and analysis. This article may not be quoted, reproduced, distributed or published for any commercial purpose without prior consent. Members of the press and others using the findings in this article for non-commercial purposes are welcome to publicly share and link to report information with attribution to Ookla.

| March 2, 2020

Mobile and Fixed Broadband Speeds and 4G Availability in Spain

Versión en español

We investigated Spain’s fixed broadband and mobile network performance, 4G Availability, how Spain’s speeds and coverage compare with neighboring European countries and the performance and 4G Availability of top providers in Spain’s ten largest cities during Q3-Q4 2019. In addition to ranking Spain’s providers by top speeds and coverage, we also analyzed the effects of mobile plans with speed caps on Speedtest® results and ranked the providers on consistency of their network performance.

Spain and France were the fastest on our list for fixed broadband

We compared Spain’s fixed broadband performance at the country level to several other western European countries during Q3-Q4 2019. Spain was well positioned for mean download speed on fixed broadband at 113.72 Mbps, second only to France’s 119.37 Mbps. Spain had the fastest mean upload speed on this list at 103.72 Mbps. Italy had the slowest mean download speed on this list at 56.72 Mbps while the United Kingdom had the slowest mean upload speed at 18.28 Mbps.

fixed-broadband-speeds-eng-1

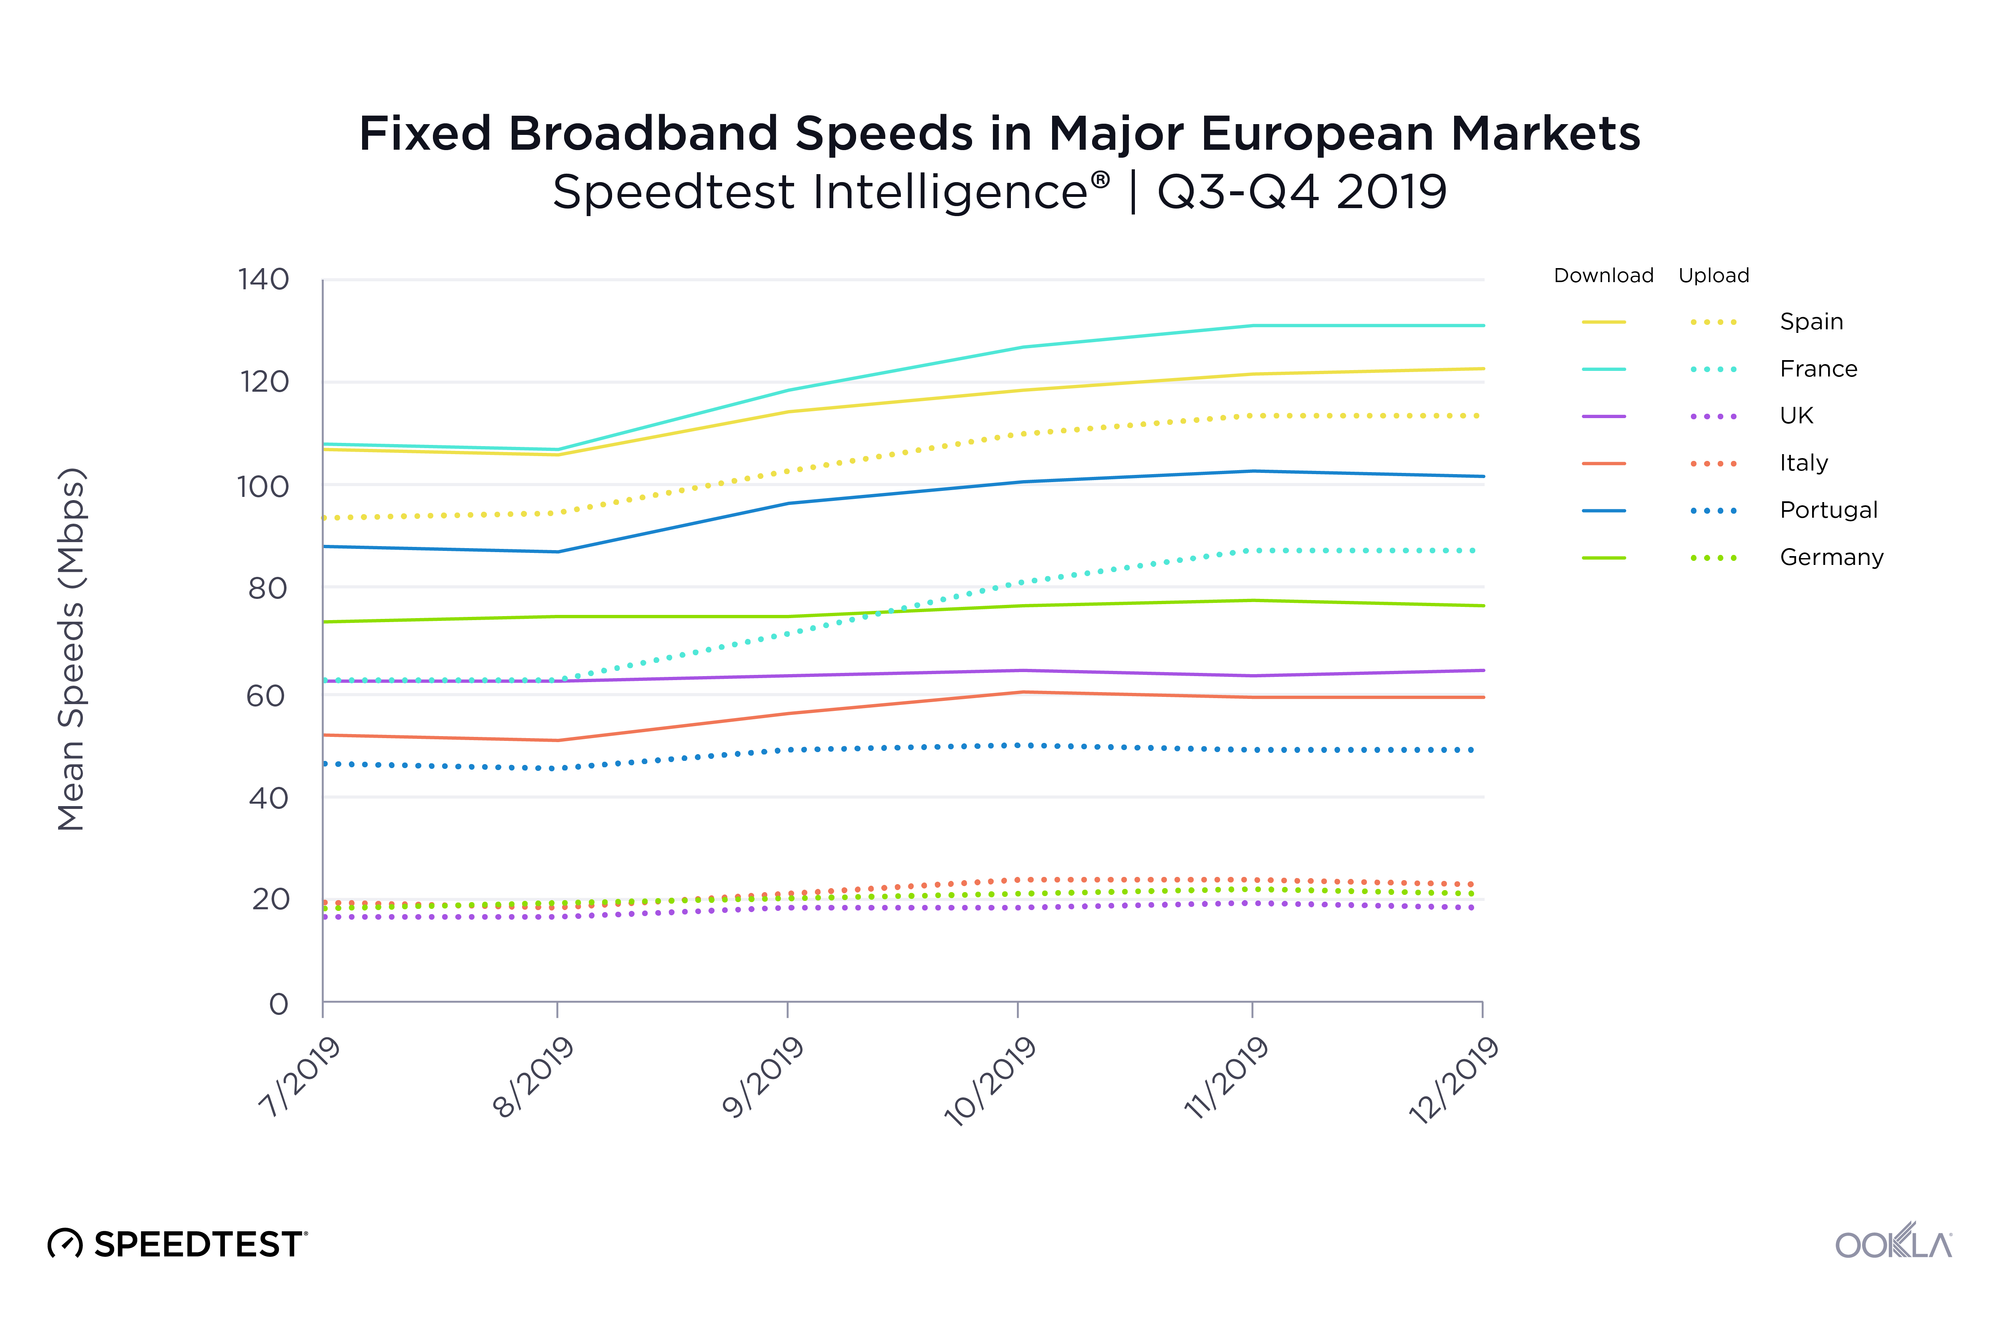
France showed the highest increase in mean download speed during Q3-Q4 2019 at 21.5%, followed by Portugal and Italy at 15.4% and Spain at 14.5%. Speeds remained relatively flat for this period for Italy, the U.K. and Germany.

An examination of latency over fixed broadband during Q3-Q4 2019 revealed a very different performance order. Portugal had the lowest latency during this period at 16 ms. Germany and the U.K. were tied for second at 23 ms. Spain was third (25 ms), Italy fourth (30 ms) and France fifth (32 ms).

Spain ranks fourth for mobile download speed

mobile-speeds-eng-1

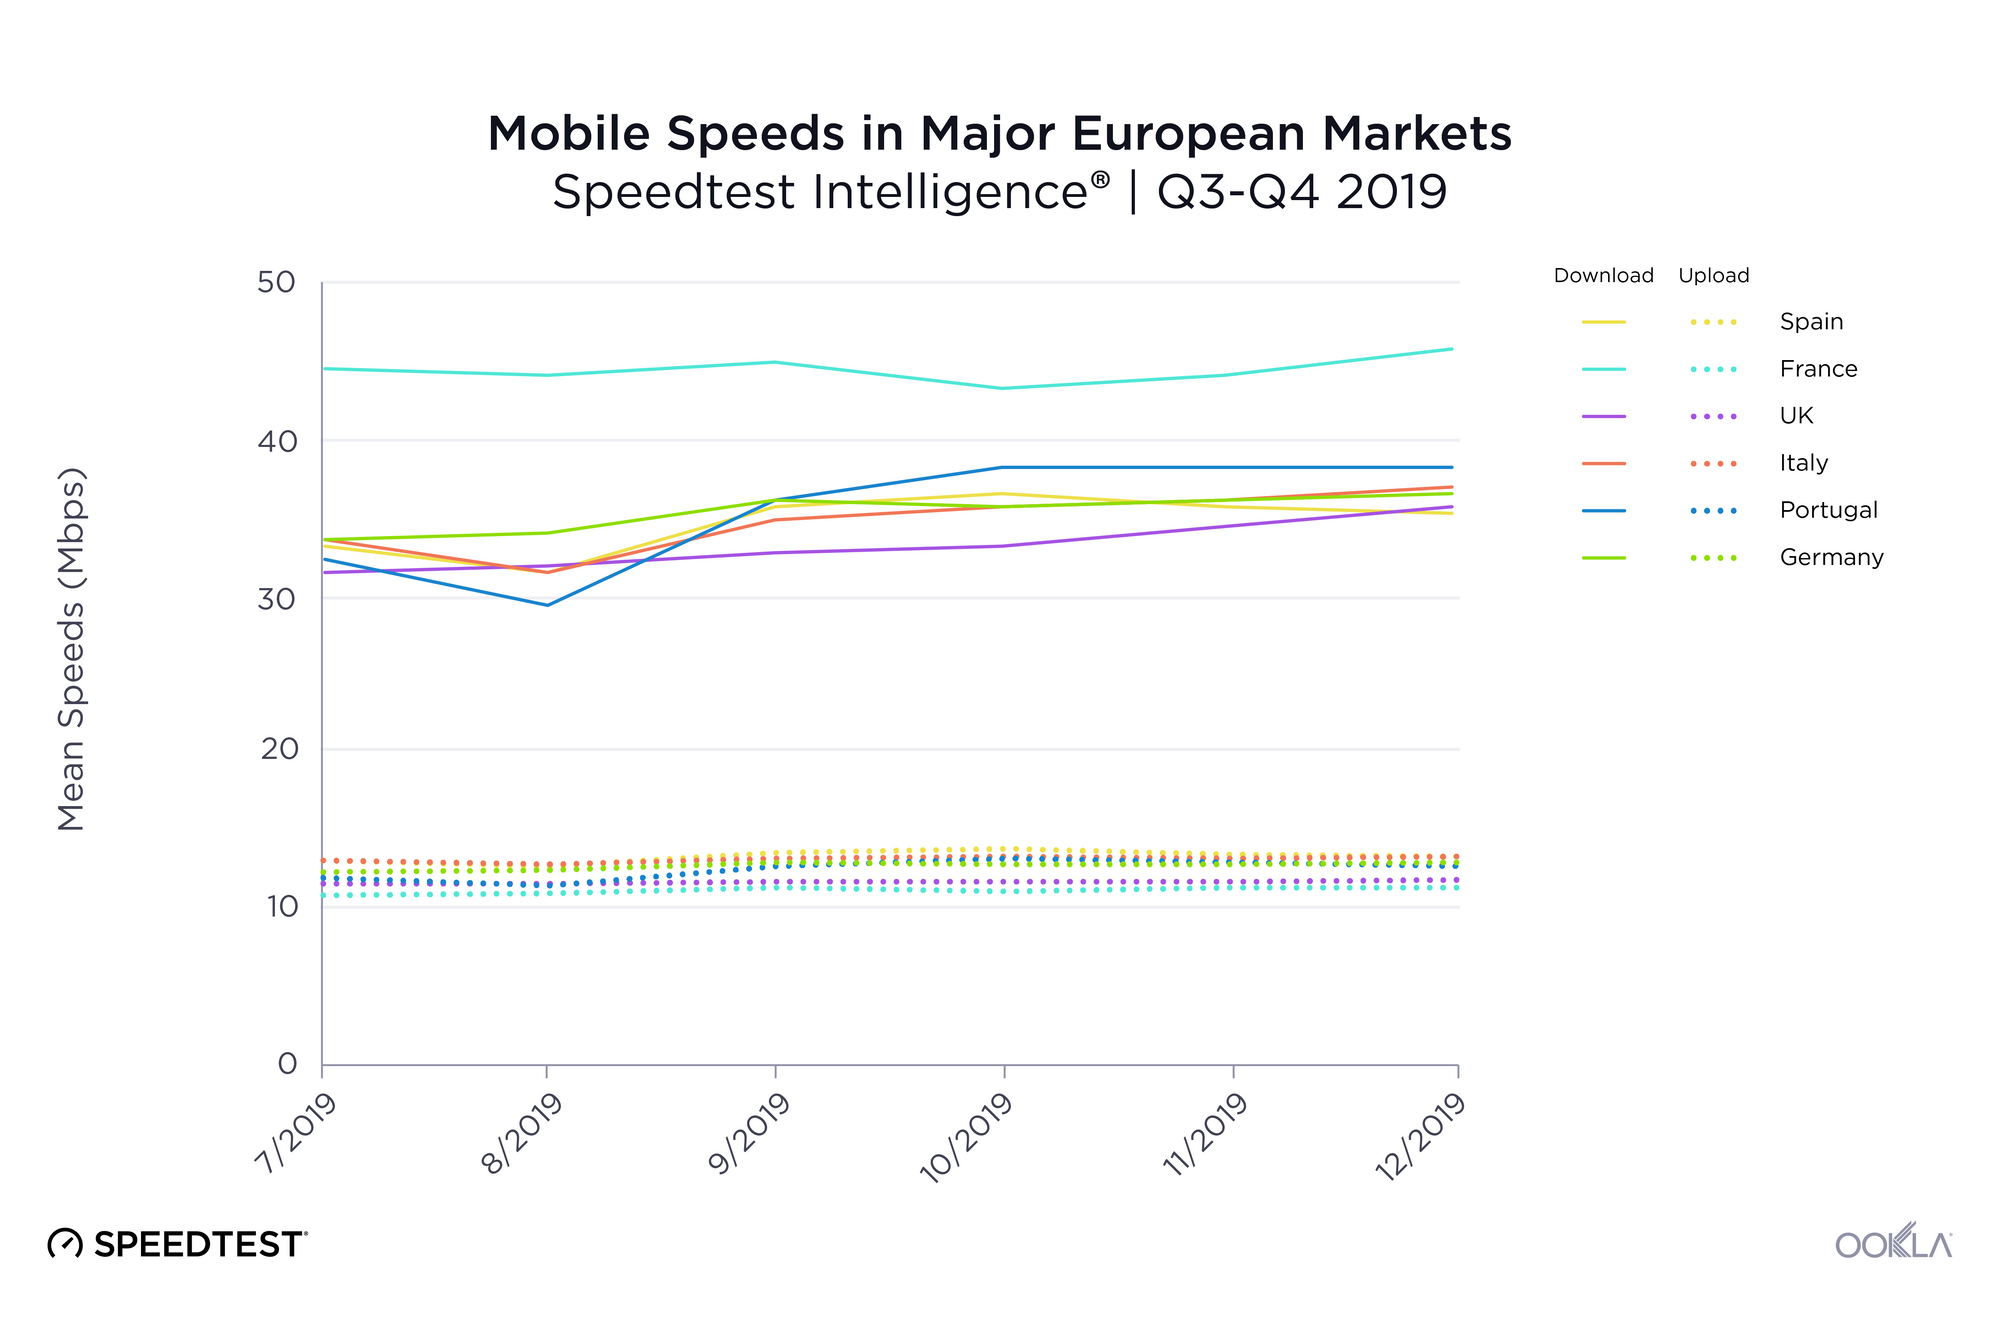
Spain did not rank as well for mean download speed over mobile as they did on fixed broadband, coming in fourth with 33.97 Mbps during Q3-Q4 2019. This was 22.8% slower than first-place France. However, Spain showed the fastest mean upload speeds on mobile at 13.12 Mbps during Q3-Q4 2019.

Portugal saw the largest increase in mobile download speed during Q3-Q4 2019 at 18.4%. Spain’s mean download speed over mobile increased only 6.7% during this period. France showed the smallest increase in mobile download speed at 2.8%.

As we saw on fixed broadband, Portugal had the lowest mobile latency at 32 ms. Germany was second at 41 ms, France third at 43 ms, the U.K. fourth at 44 ms, Spain fifth at 47 ms and Italy last at 52 ms.

United Kingdom and Spain lead in 4G Availability

We used data from Speedtest coverage scans on Android to compare 4G Availability in each market during Q3-Q4 2019. While the U.K. showed the highest 4G Availability at 88.8%, Spain tied for a very close second, with 4G available in 87.7% of tested locations. Germany had the lowest 4G Availability at 72.1% during this period.

4G Availability in Major European Markets
Speedtest Intelligence® | Q3-Q4 2019
Country 4G Availability
United Kingdom 88.8%
Spain 87.7%
France 87.7%
Italy 86.7%
Portugal 85.0%
Germany 72.1%

Looking specifically at Spain’s top mobile providers, Orange had the highest 4G Availability at 88.1%. Movistar was second, Yoigo third, and Vodafone fourth.

4G Availability by Provider in Spain
Speedtest Intelligence® | Q3-Q4 2019
Provider 4G Availability
Orange 88.1%
Movistar 87.7%
Yoigo 87.4%
Vodafone 86.1%

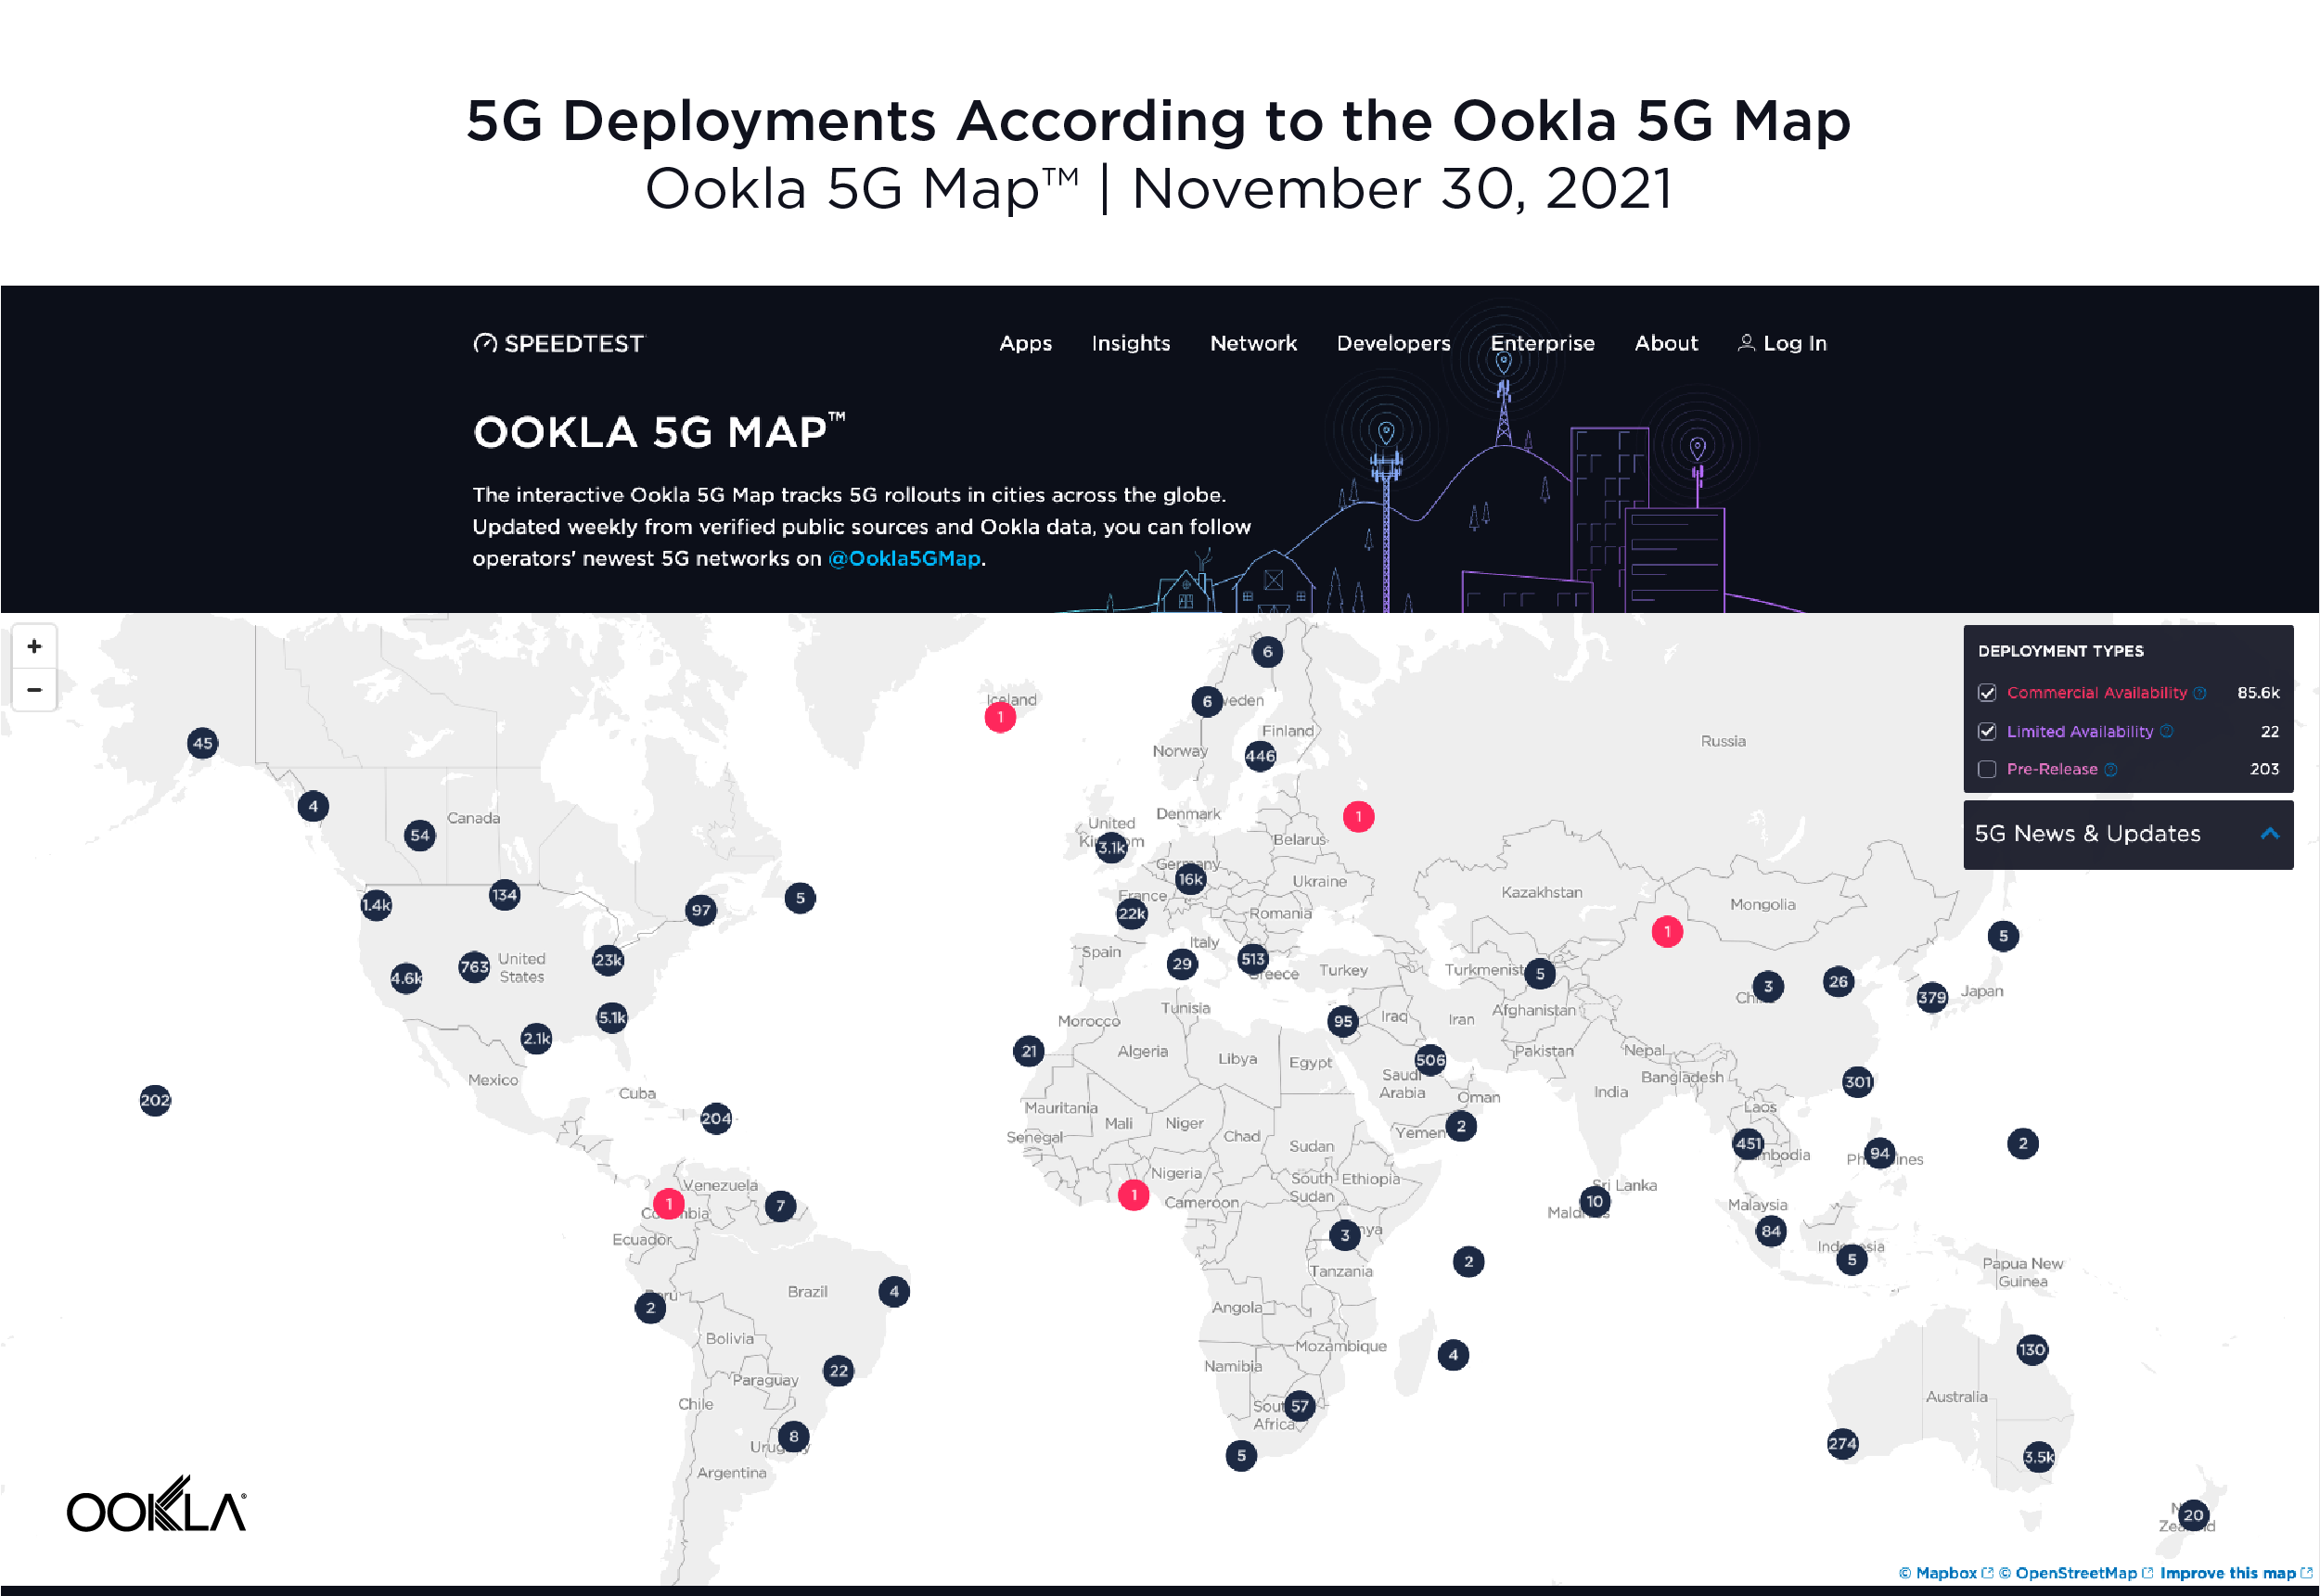
Spain’s 5G deployments are expanding

5G-Deployments-in-Spain-0220-1
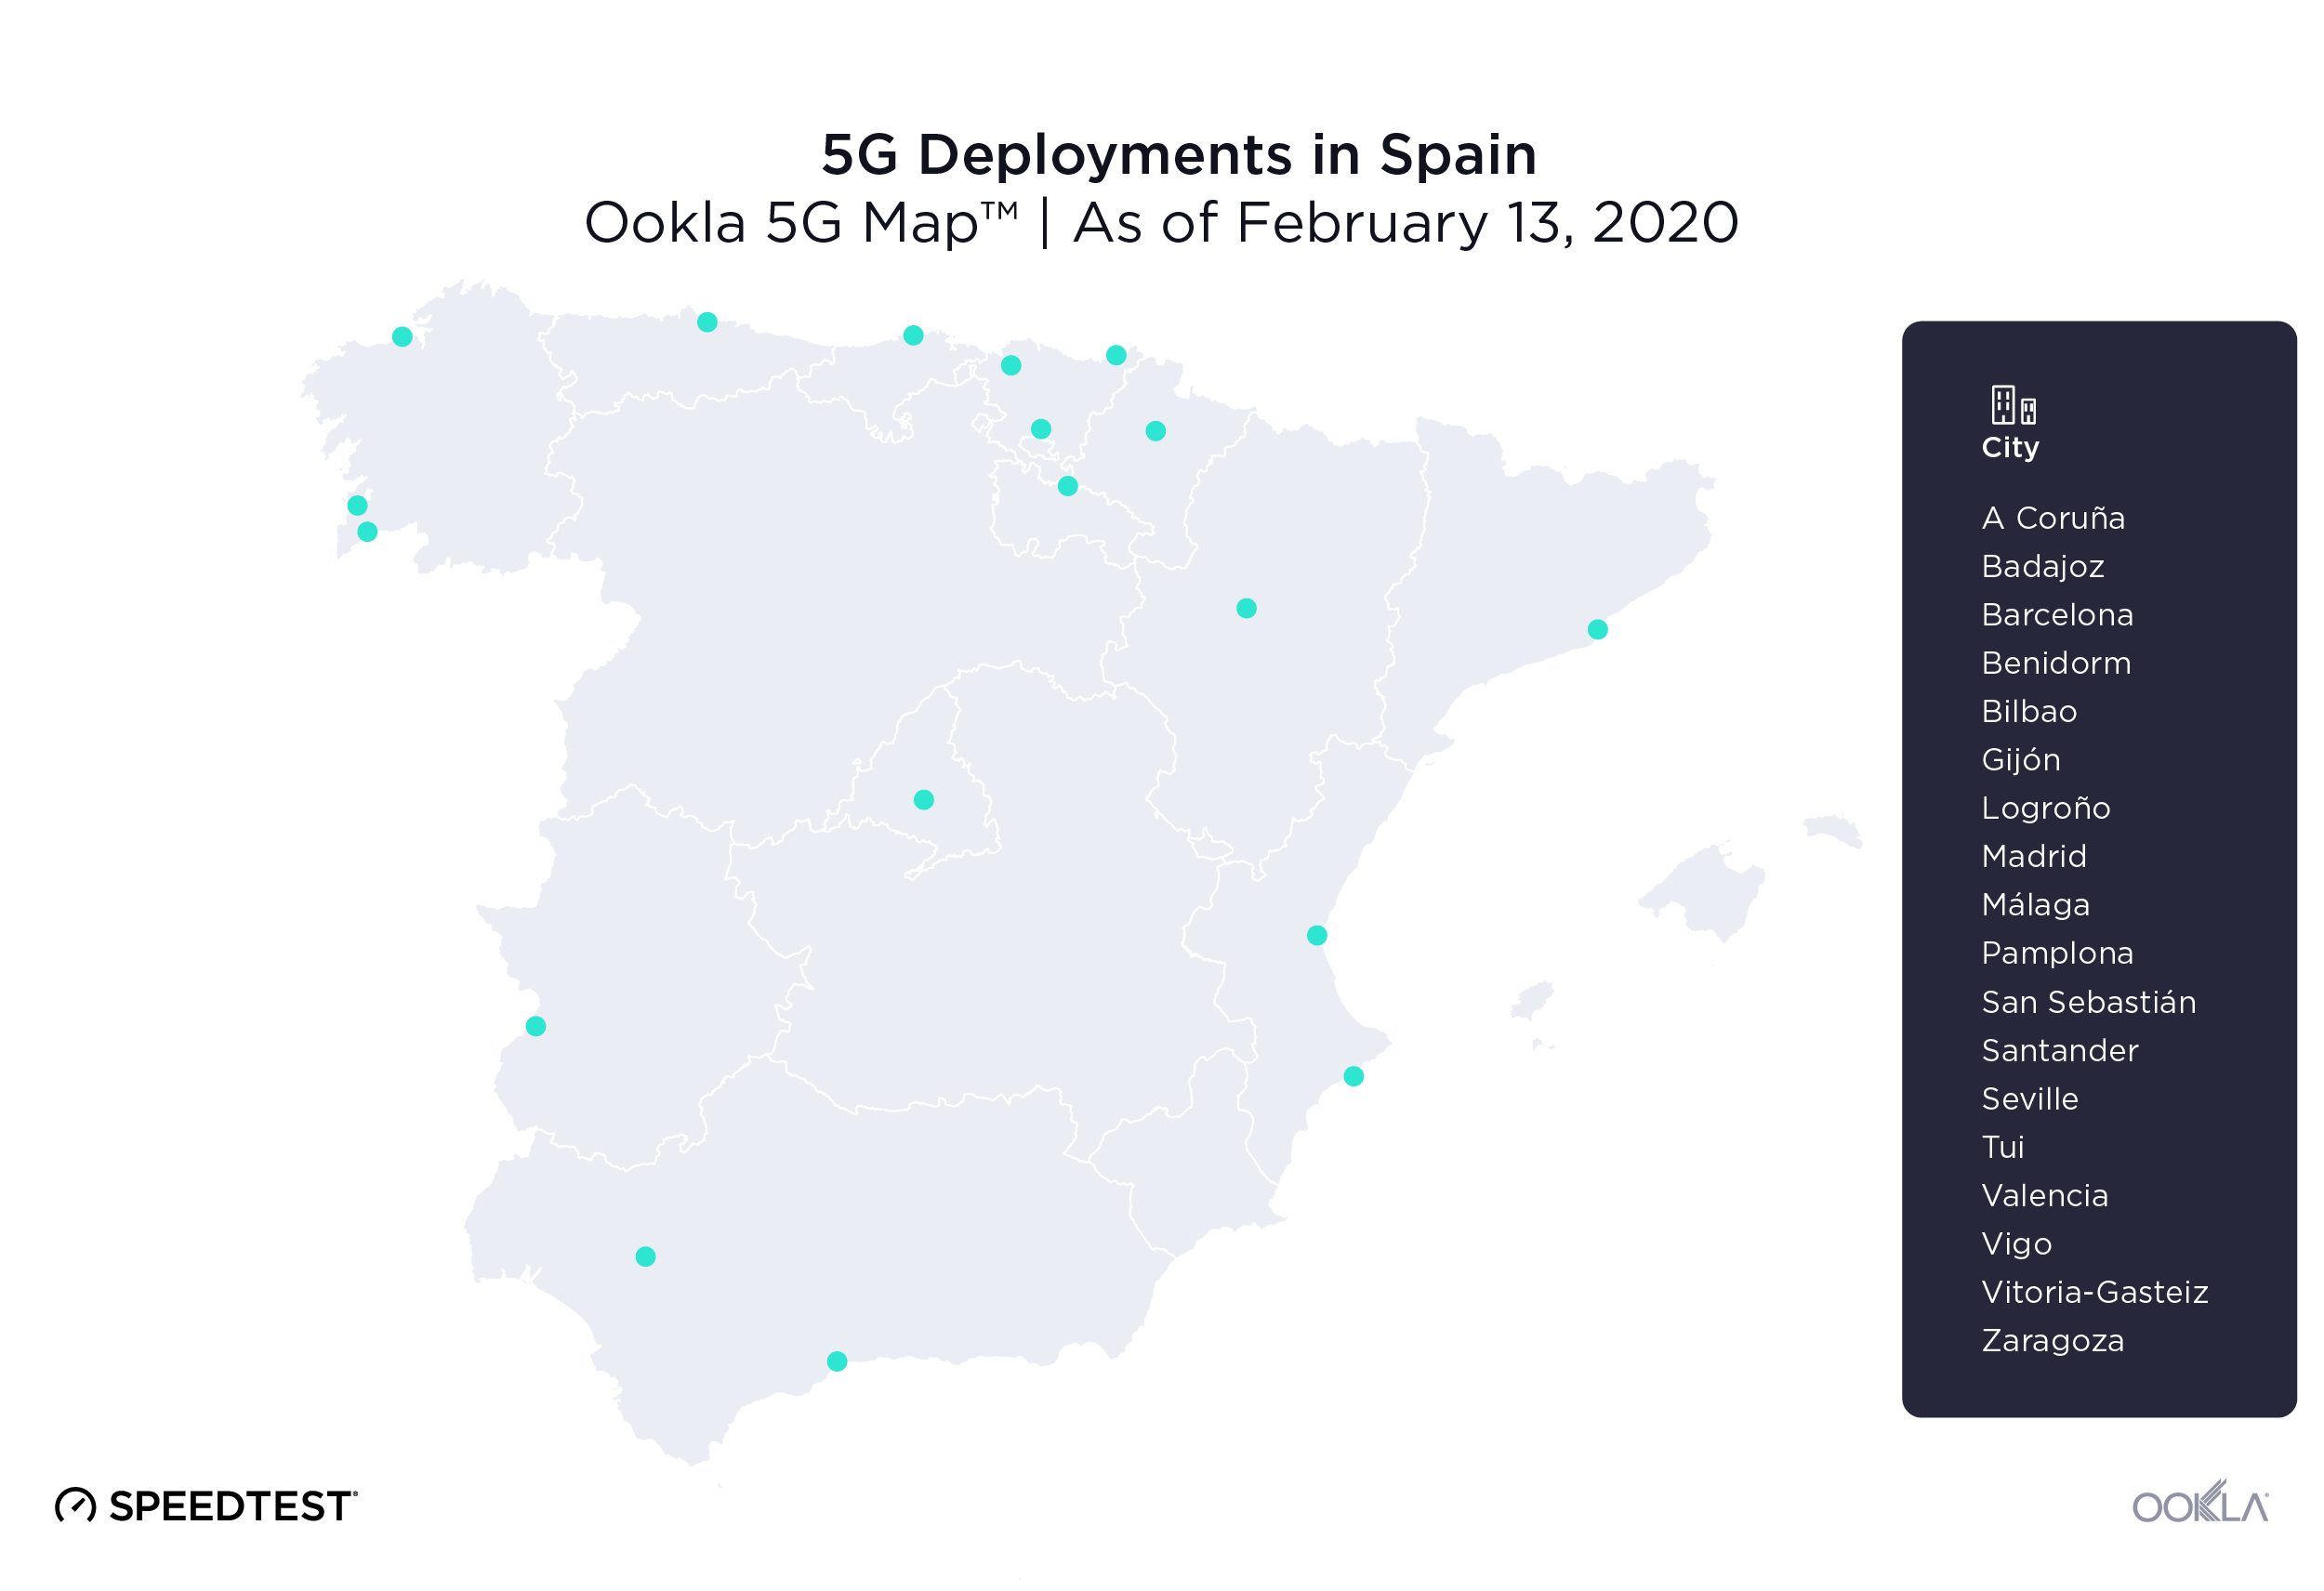
The excitement for 5G is evident in Spain. Vodafone had commercially available 5G deployments in a total of 18 Spanish cities as of February 13, 2020, including Barcelona, Madrid, Valencia, Málaga and Bilbao. Speedtest data reveals the mean download speed on 5G for Spain in Q3-Q4 2019 was 350.68 Mbps — an order of magnitude faster than the national average for mobile download speed — and the mean upload speed over 5G was 31.82 Mbps. Mean latency over 5G in Spain was 27 ms during Q3-Q4 2019.

MÁSMÓVIL was Spain’s fastest fixed broadband provider

Using Speed Score, a metric that combines measures of download and upload speed, to compare top ISPs in Spain during Q3-Q4 2019, we found that MÁSMÓVIL led with a score of 133.75 on fixed broadband. Orange was in second place with 115.25, followed by Vodafone (105.07) and Movistar (103.01).

Fixed Broadband Performance by Provider in Spain
Speedtest Intelligence® | Q3-Q4 2019
Provider Speed ScoreTM
MÁSMÓVIL 133.75
Orange 115.25
Vodafone 105.07
Movistar 103.01

Movistar was Spain’s fastest mobile operator

Movistar had the highest Speed Score among Spain’s mobile operators during Q3-Q4 2019 at 37.76. Orange was second at 33.02, Vodafone third at 26.34 and Yoigo fourth at 22.43. As we will discuss below, overall speed performance can be impacted by the speed caps and tariff plans that are in place in Spain.

Mobile Performance by Operator in Spain
Speedtest Intelligence® | Q3-Q4 2019
Provider Speed ScoreTM
Movistar 37.76
Orange 33.02
Vodafone 26.34
Yoigo 22.43

Speed capping affects overall performance

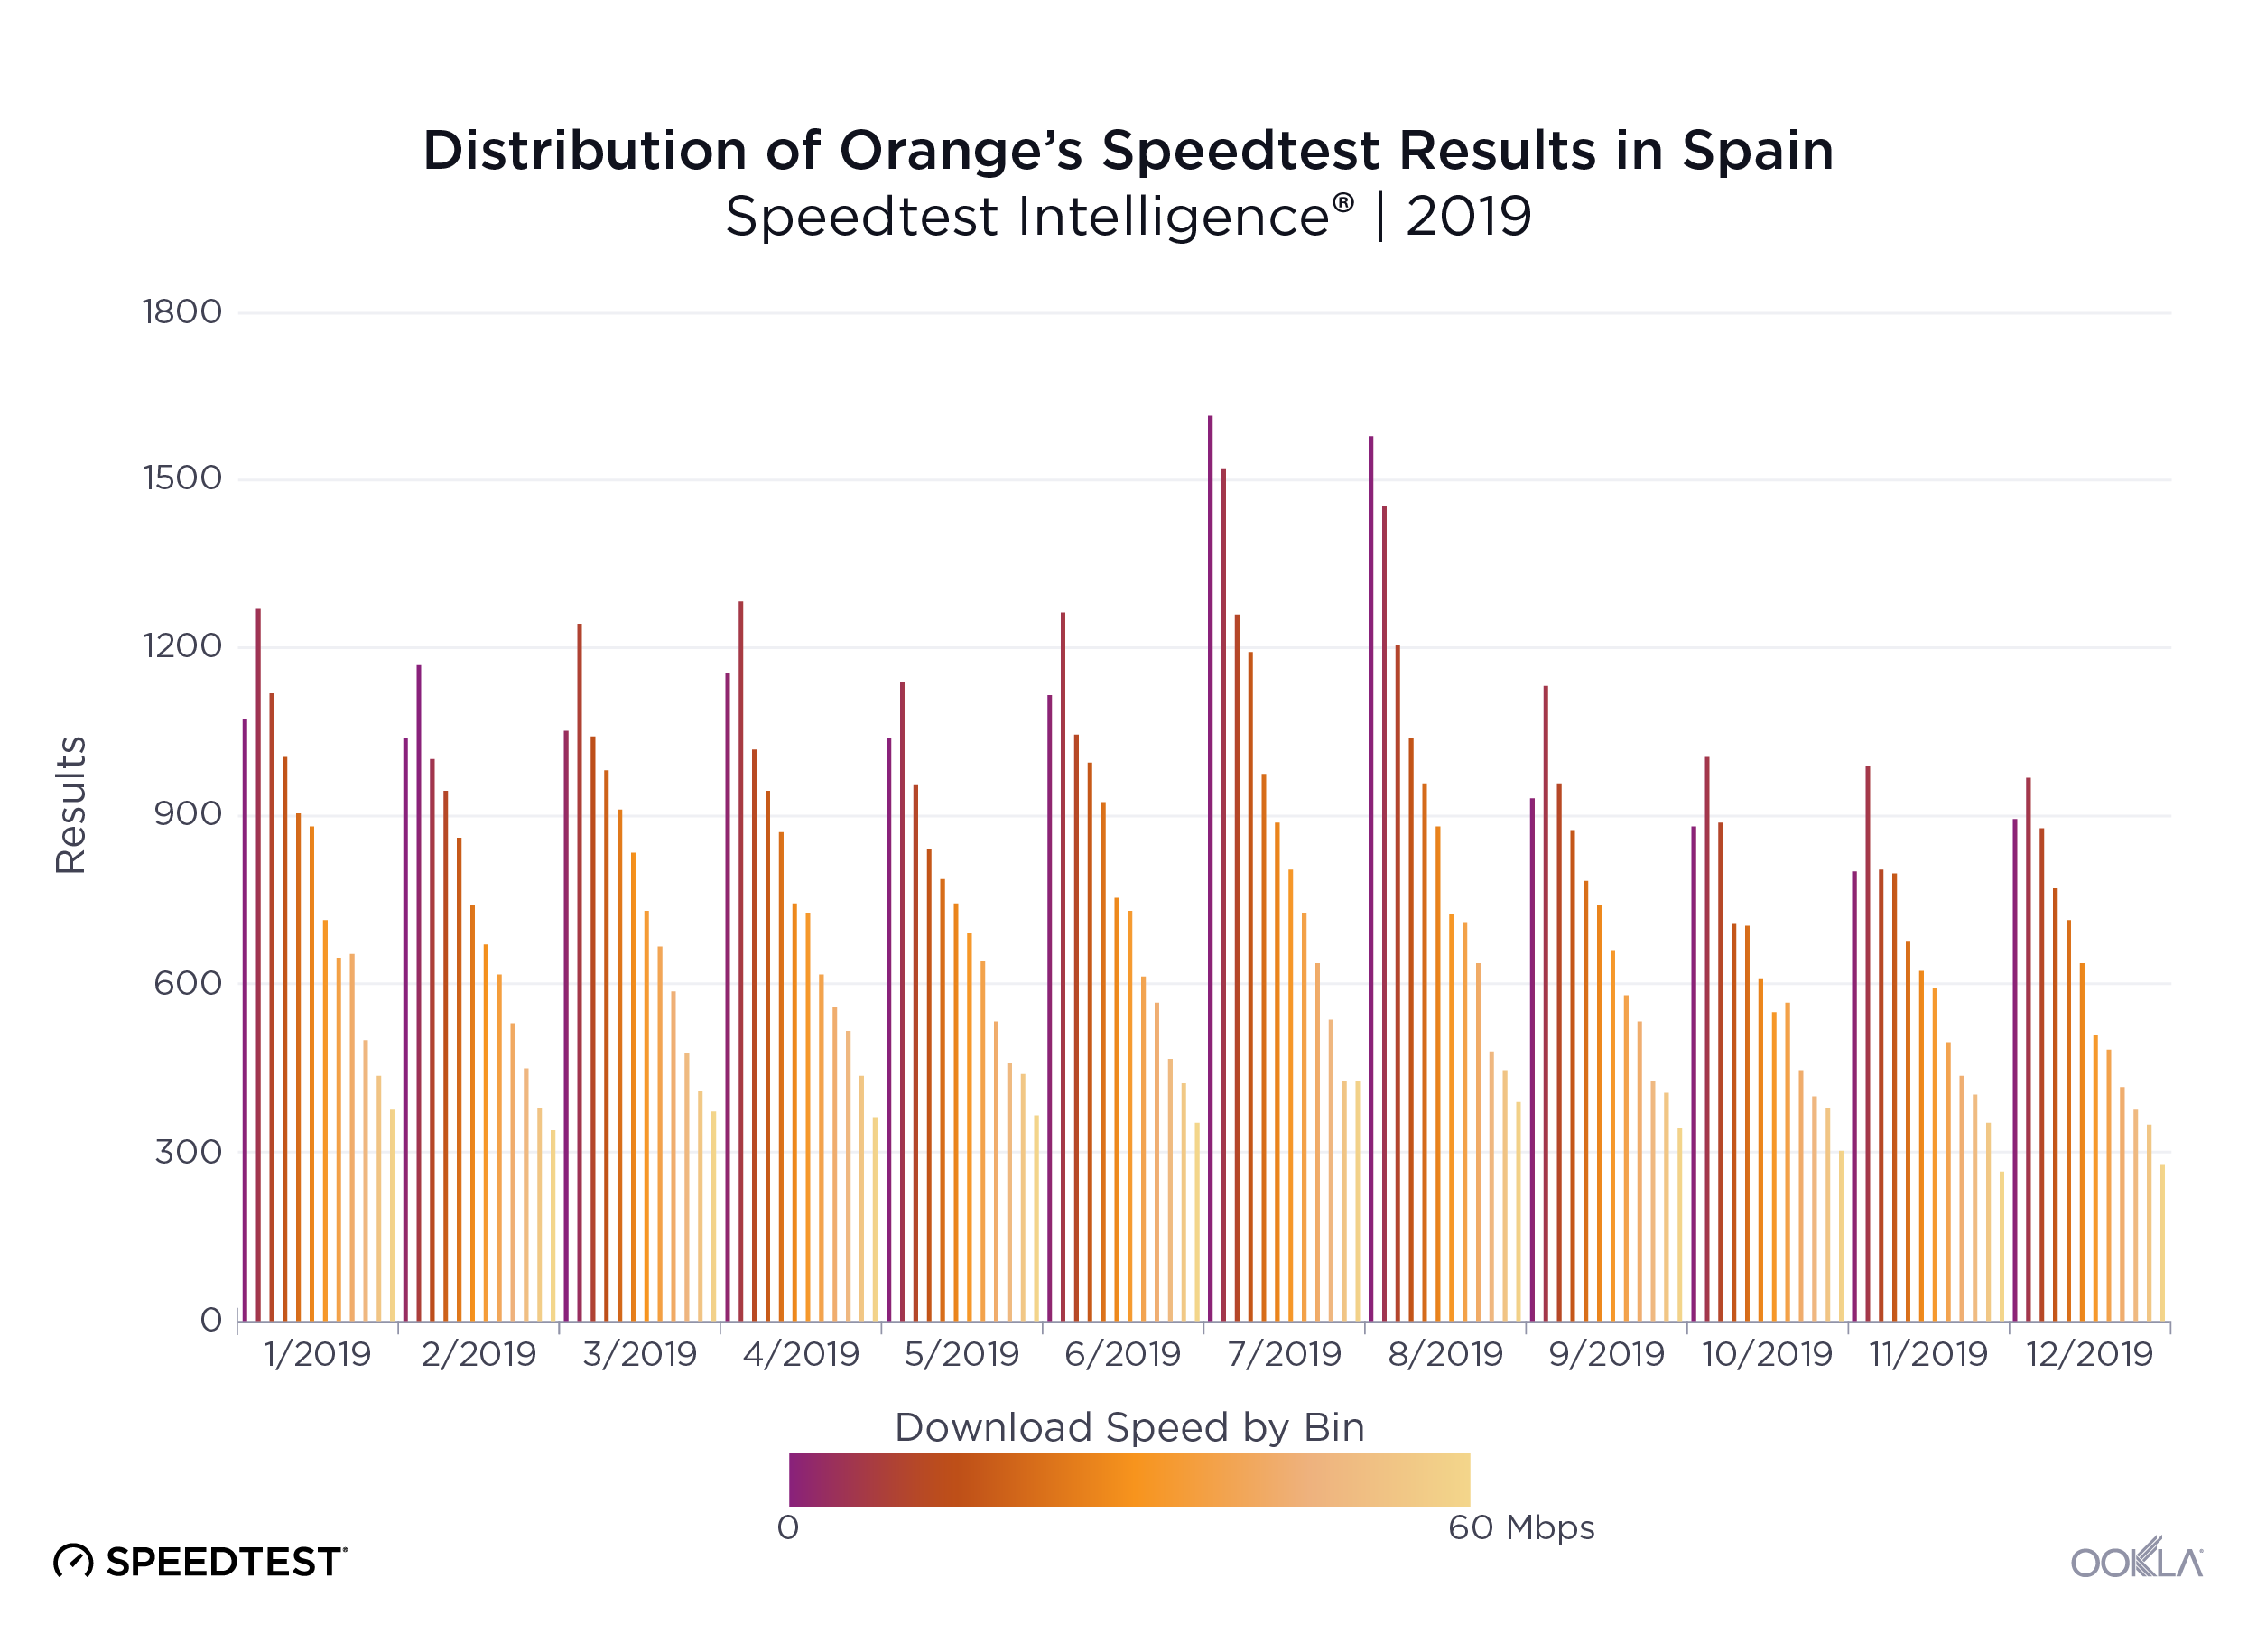
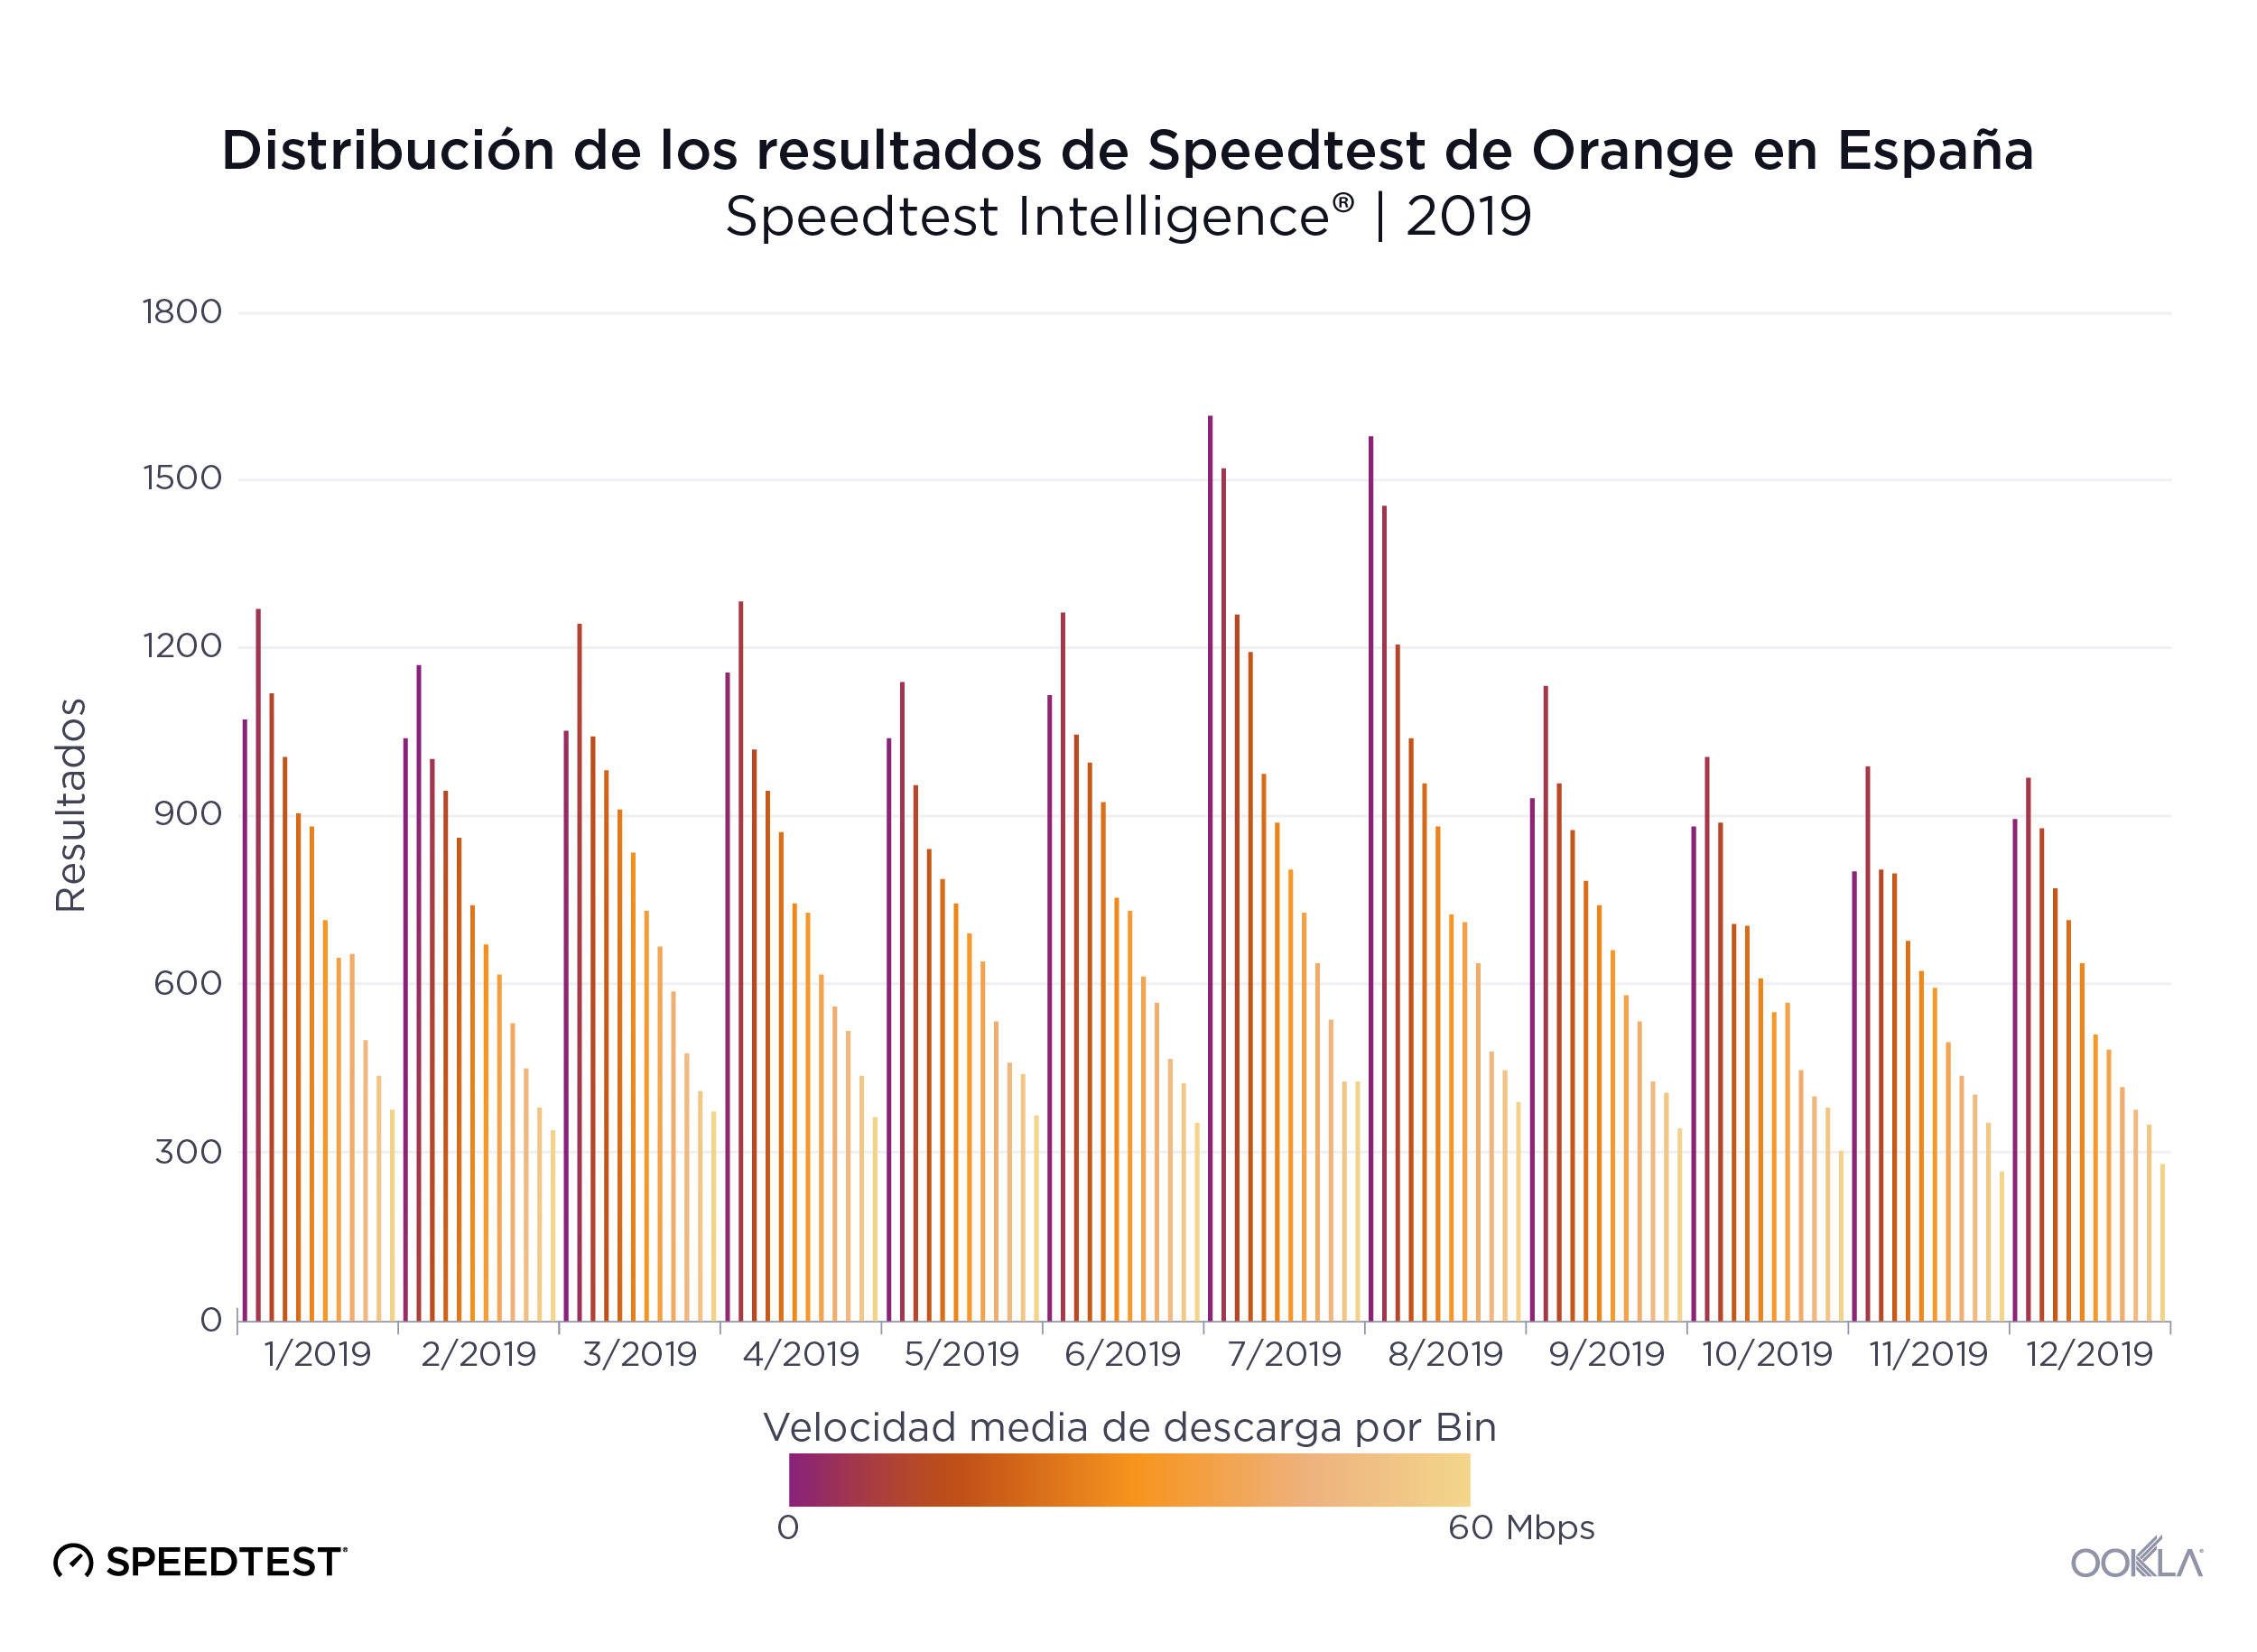
Speed capping, a limit of service imposed onto an internet connection by an operator, allows operators to also offer plans that focus on affordability rather than maximum performance.
Ookla_Distribution-Speedtest-Results_Vodafone_Spain_0220-3_en
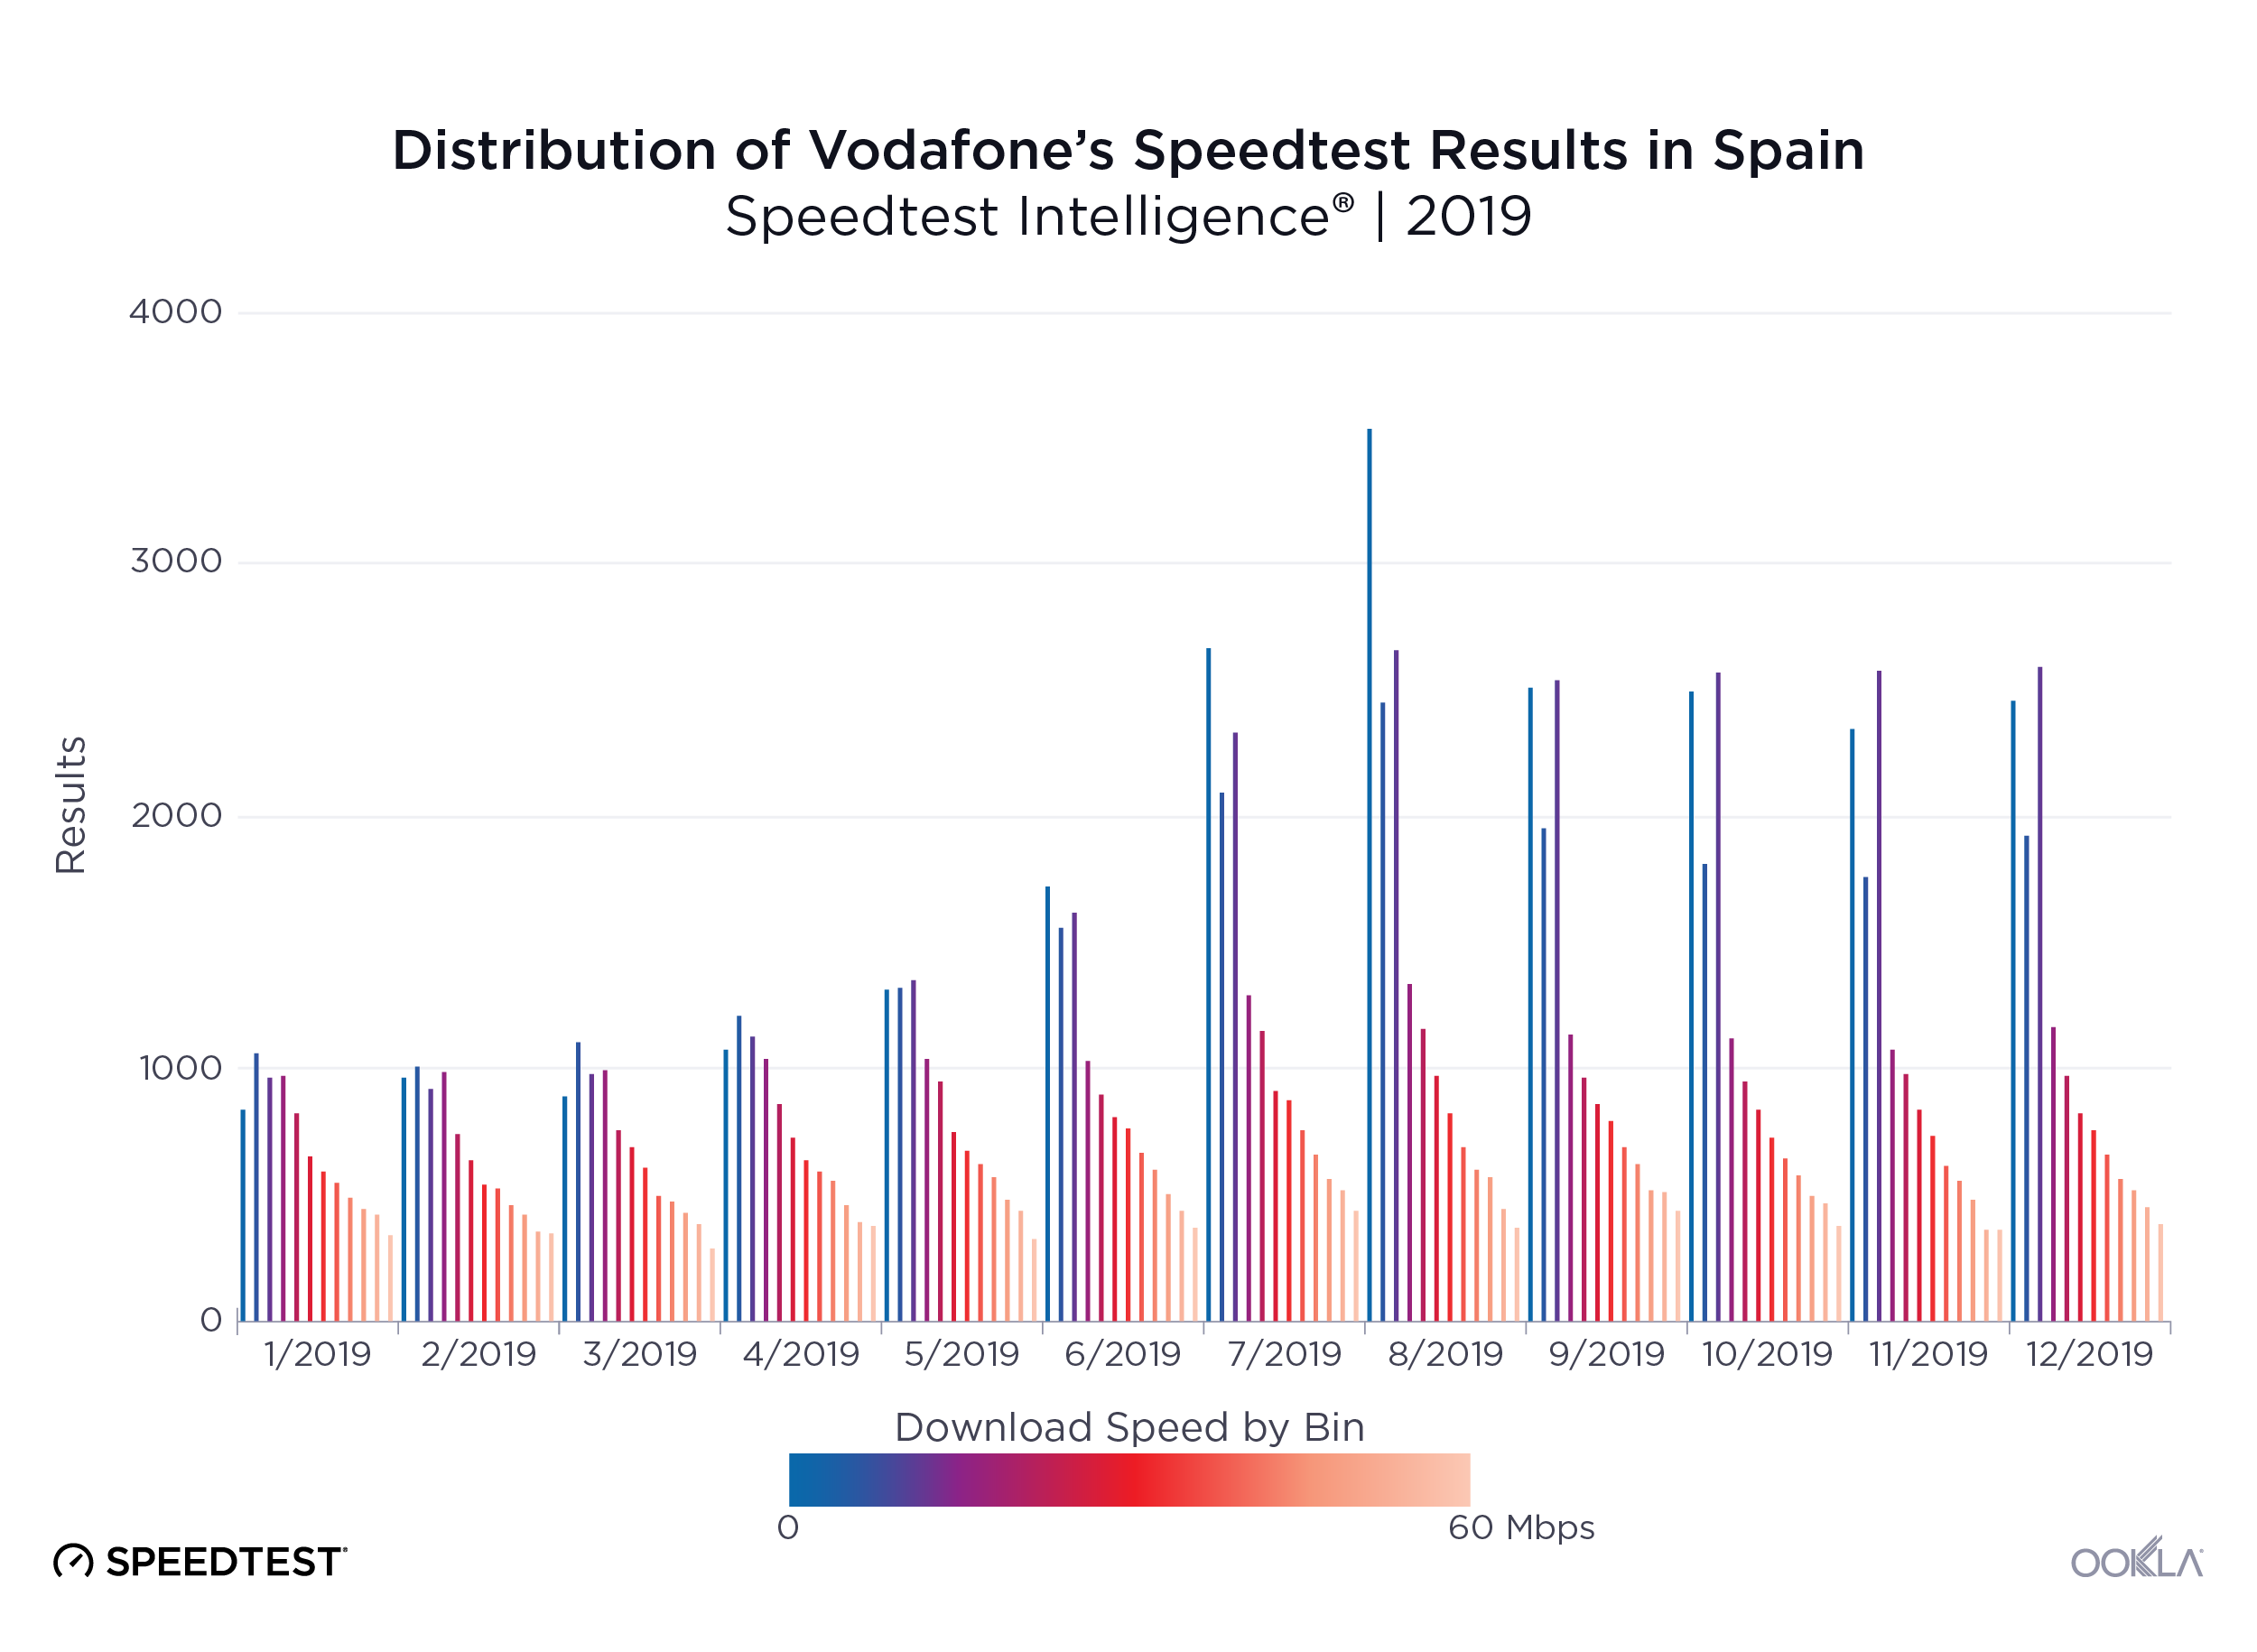
The chart above shows how Vodafone’s introduction of subscription plans that use speed capping affected the distribution of download speeds. While those plans (with caps at 2 Mbps and 10 Mbps, respectively) were available starting in April, we don’t see the true effect on average speeds until May and June when the 0-5 Mbps and 10-15 Mbps buckets start to spike. We’ve only showed bins up to 60 Mbps to make this and the following graphs more legible.

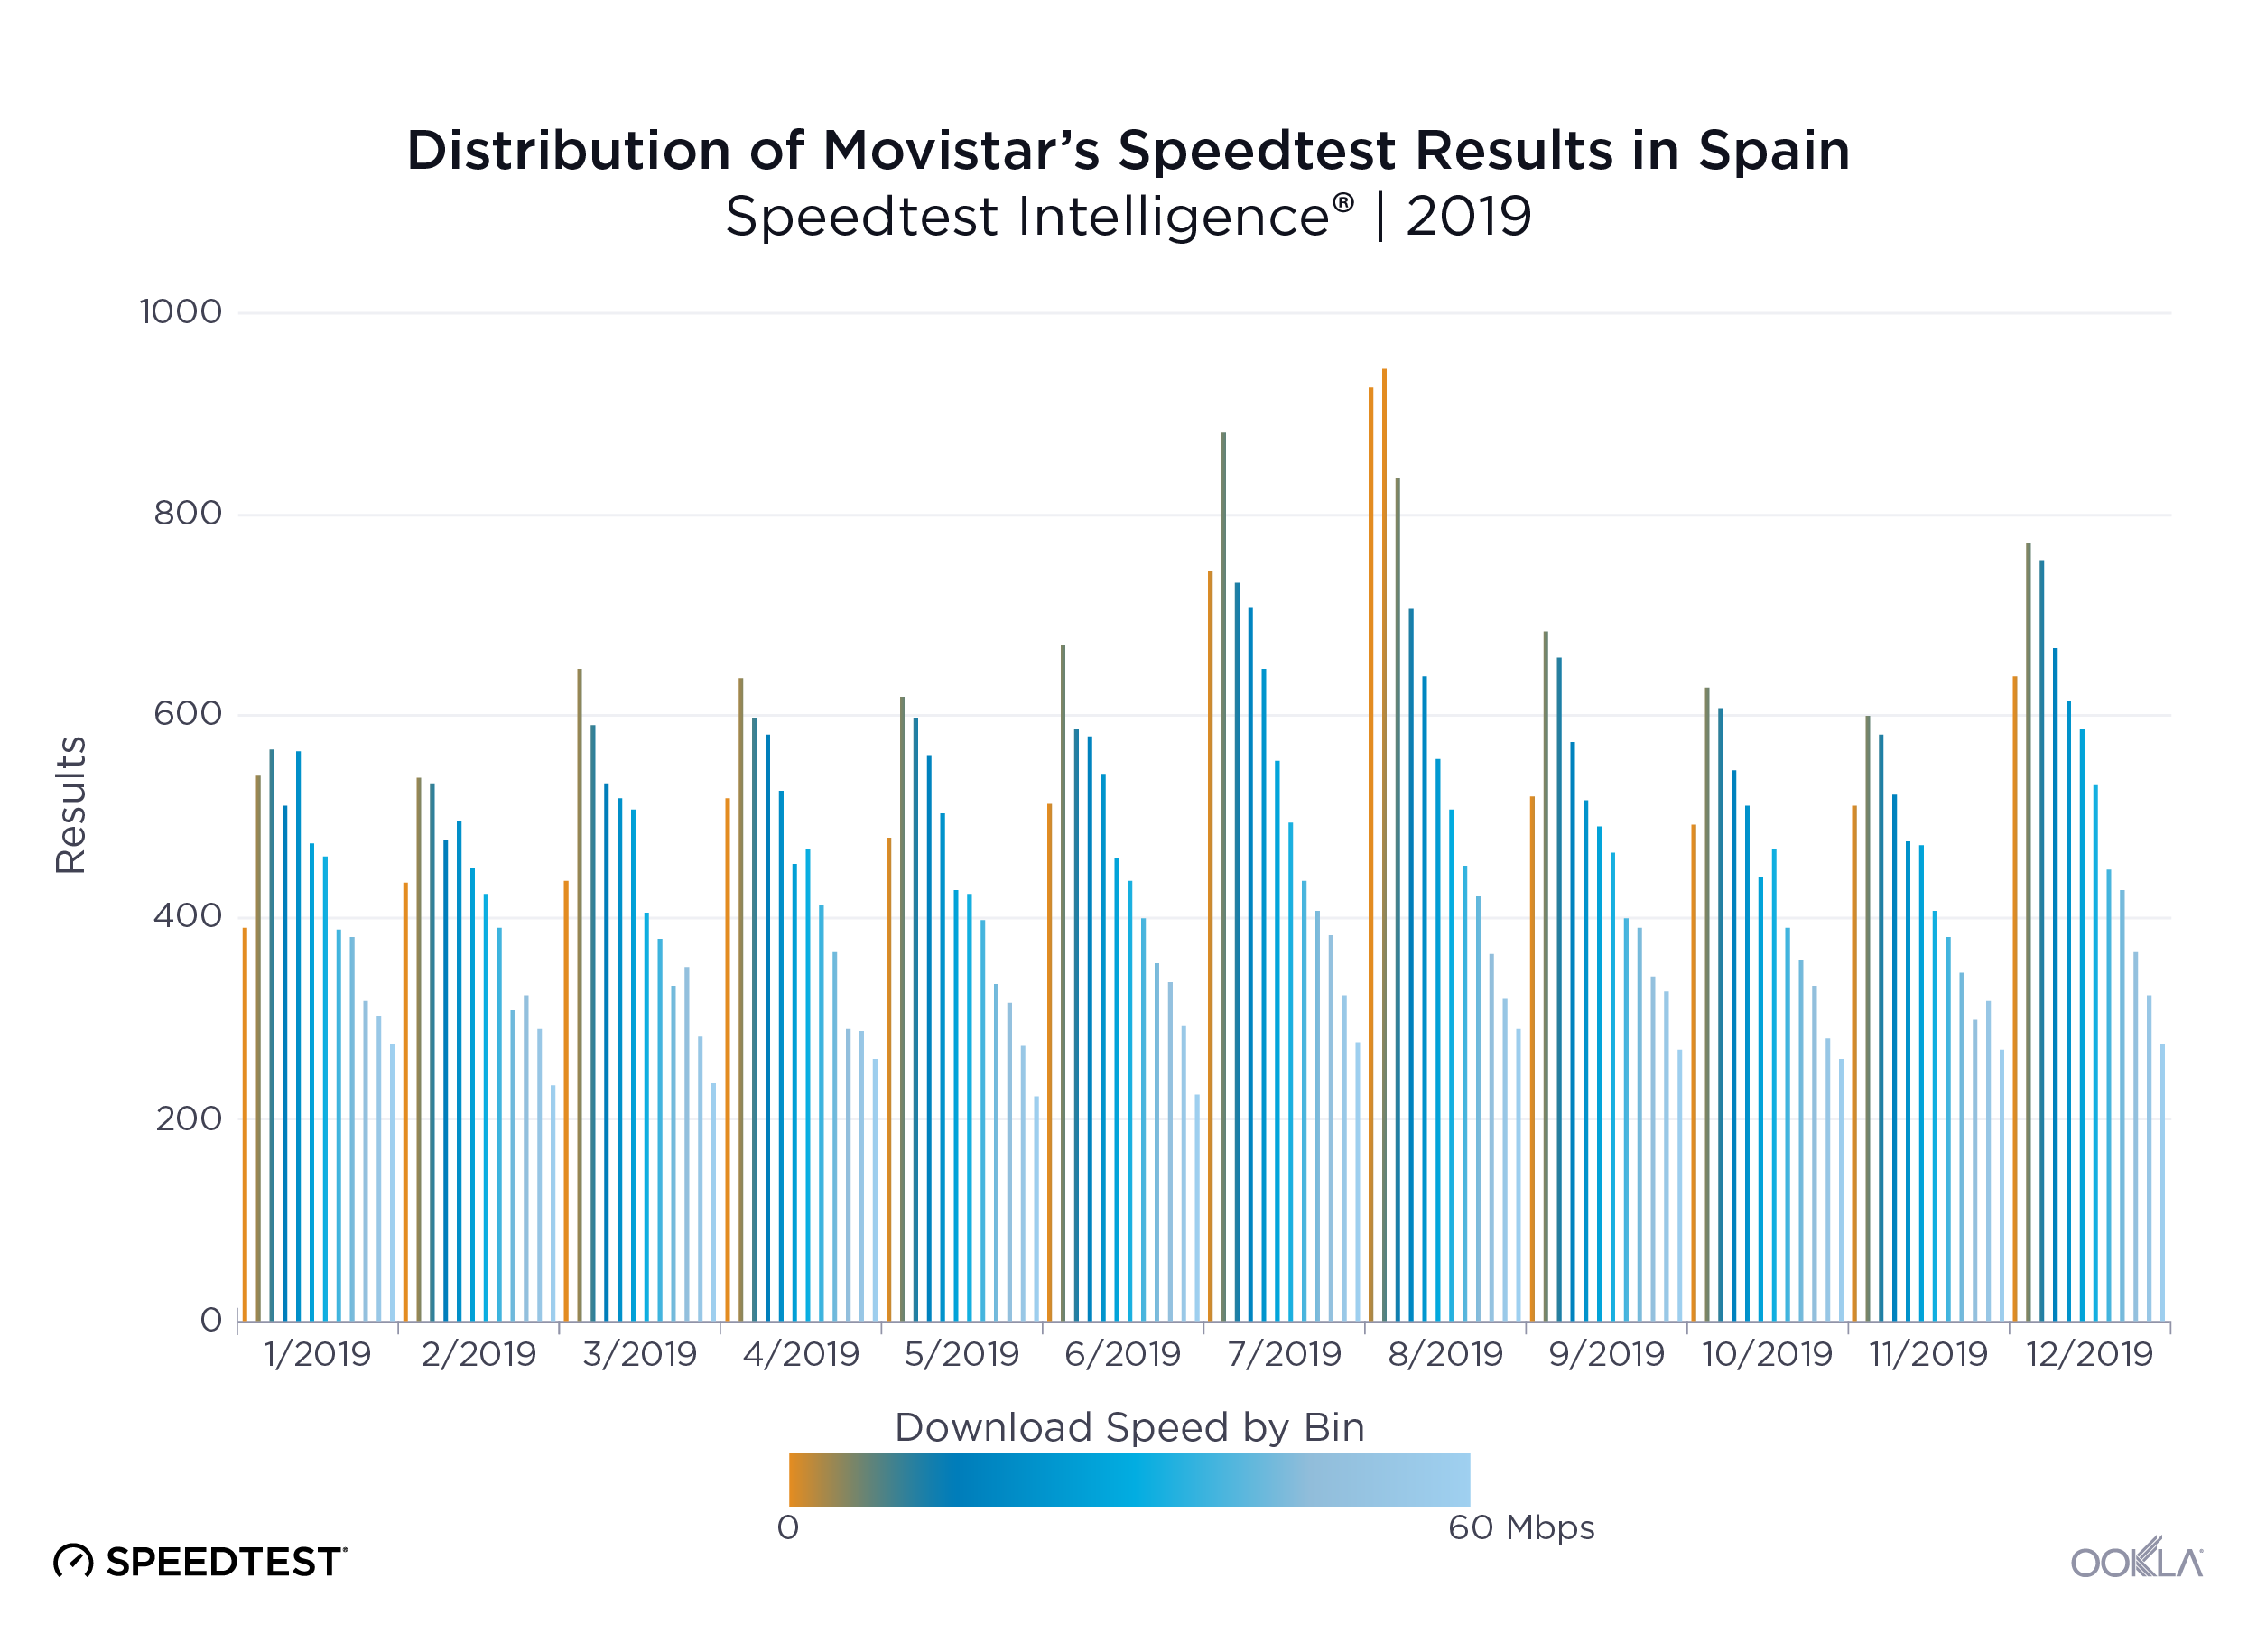
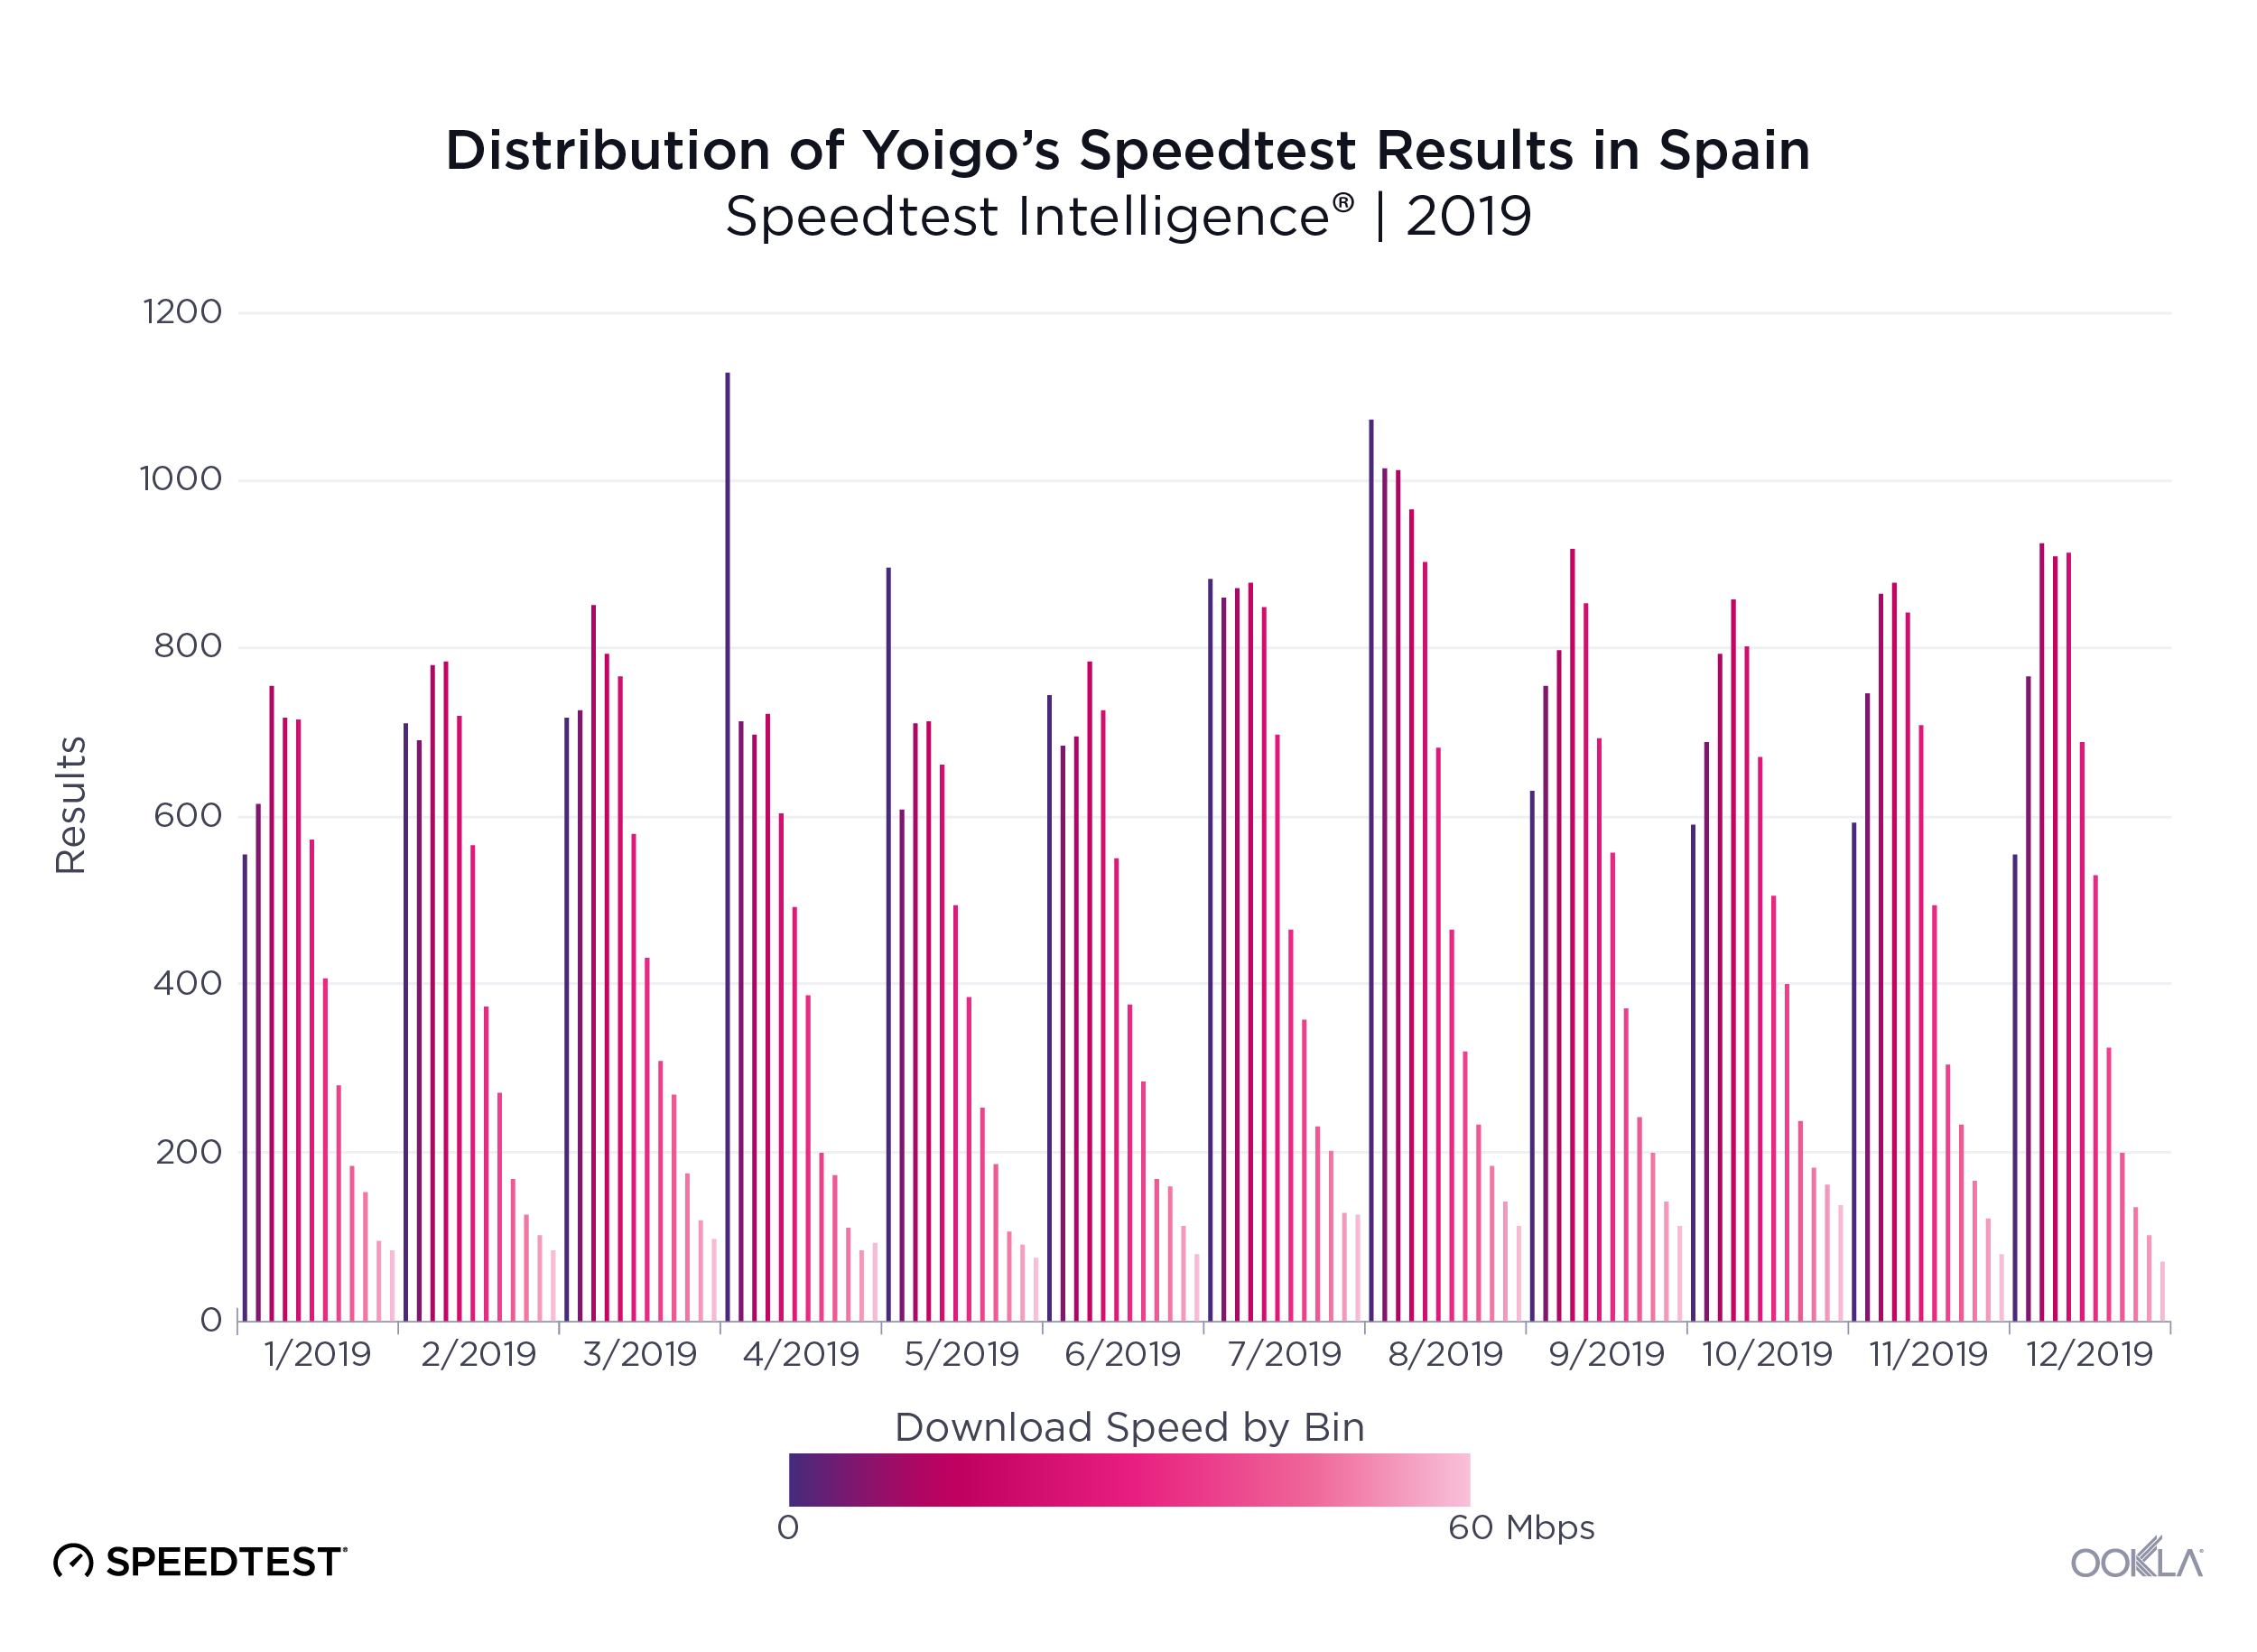
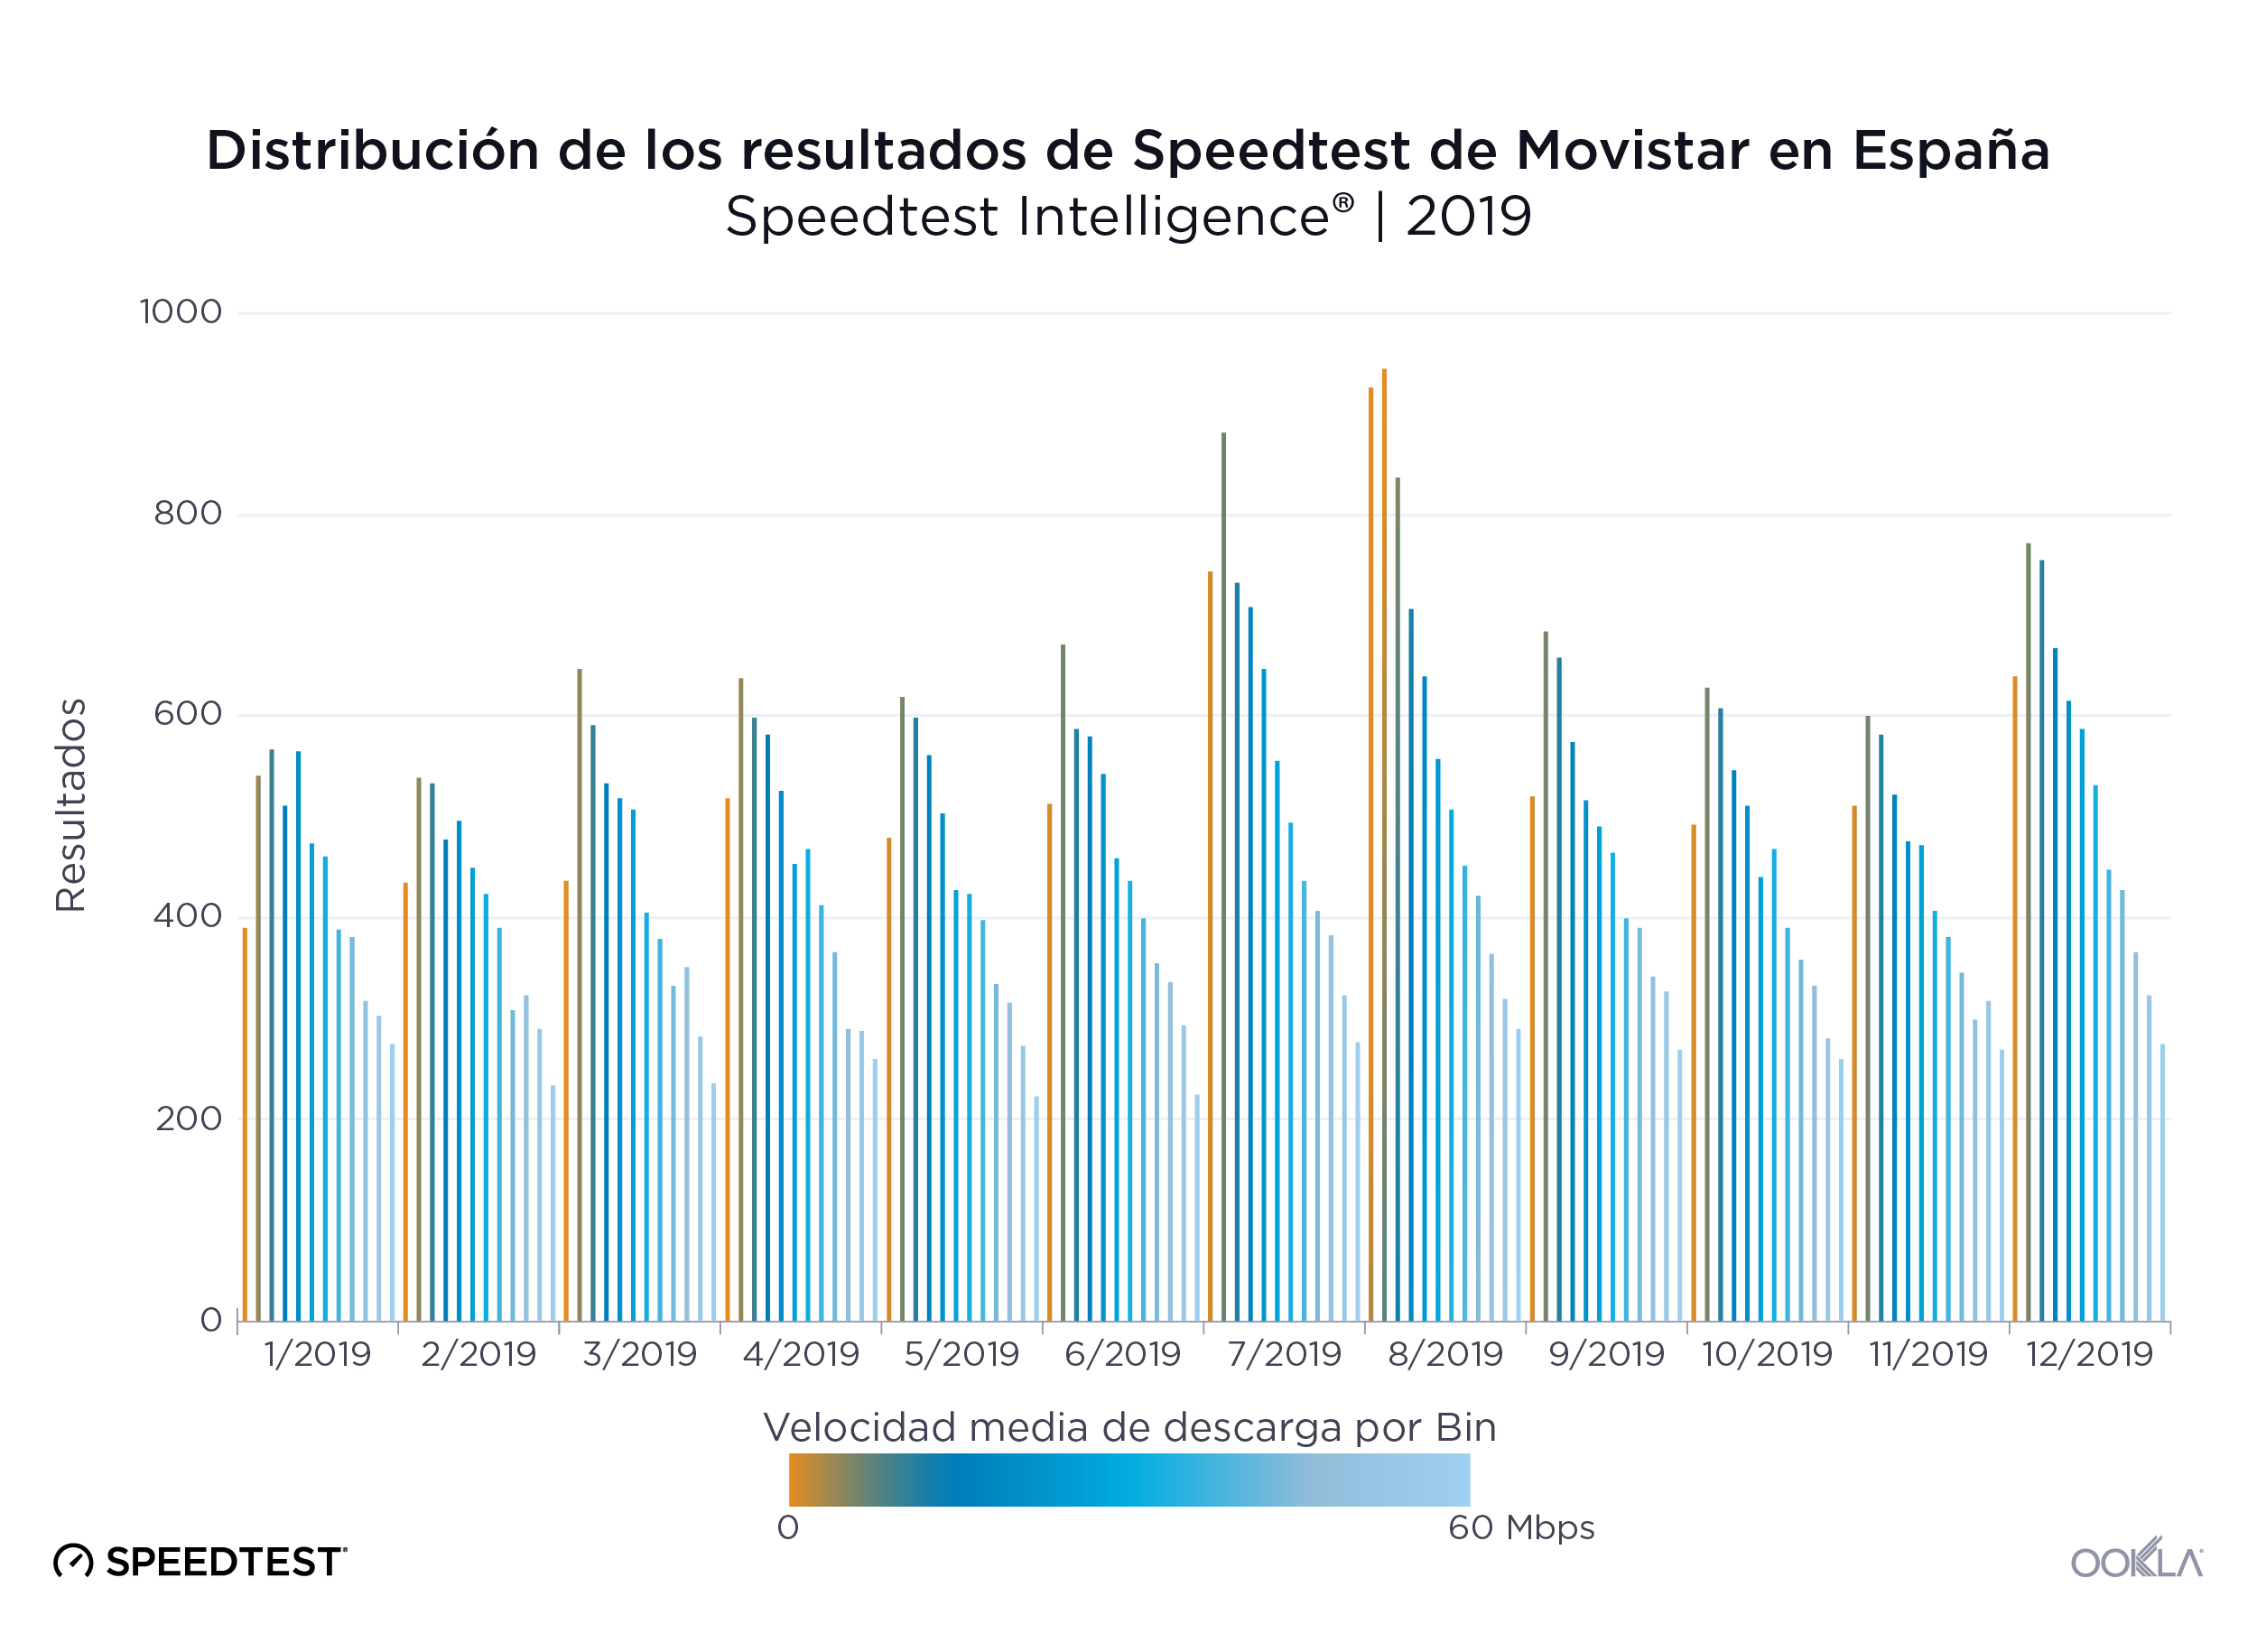
In contrast, we see more even distributions of download speeds among all other mobile operators in Spain.
Ookla_Distribution-Speedtest-Results_Movistar_Spain_0220-3_en
Ookla_Distribution-Speedtest-Results_Orange_Spain_0220-3_en
Ookla_Distribution-Speedtest-Results_Yoigo_Spain_0220-3_en

MÁSMÓVIL and Movistar (mobile) offer the most consistent speeds

Speed is important, but if those speeds are inconsistent, it becomes difficult for users to reliably use their devices to stream HD video, browse the web or use online gaming. We used Speedtest data to calculate each top provider’s APS (Acceptable Performance Score) in Spain during Q3-Q4 2019.

APS for fixed broadband measures the percentage of samples that equal or exceed a download speed of 25 Mbps and also equal or exceed an upload speed of 3 Mbps. MÁSMÓVIL provided the most consistent experience in Spain on fixed broadband in Q3-Q4 2019 with an APS of 81.6%. Movistar was in last place with an APS of 61.9%.

Speed Consistency by Provider on Fixed Broadband
Speedtest Intelligence® | Q3-Q4 2019
Provider APS
MÁSMÓVIL 81.6%
Orange 75.1%
Vodafone 73.5%
Movistar 61.9%

APS on mobile measures the percentage of samples that equal or exceed a download speed of 5 Mbps and also equal or exceed an upload speed of 1 Mbps. Movistar took the top spot for consistency on mobile broadband with an APS of 88.9%. Vodafone had the lowest consistency score with an APS of 79.8%.

Speed Consistency by Operator on Mobile
Speedtest Intelligence® | Q3-Q4 2019
Provider APS
Movistar 88.9%
Orange 84.3%
Yoigo 82.6%
Vodafone 79.8%

Madrid led fixed and mobile broadband speeds

Ookla_Fixed-Broadband-Speeds_Spain_0220-1
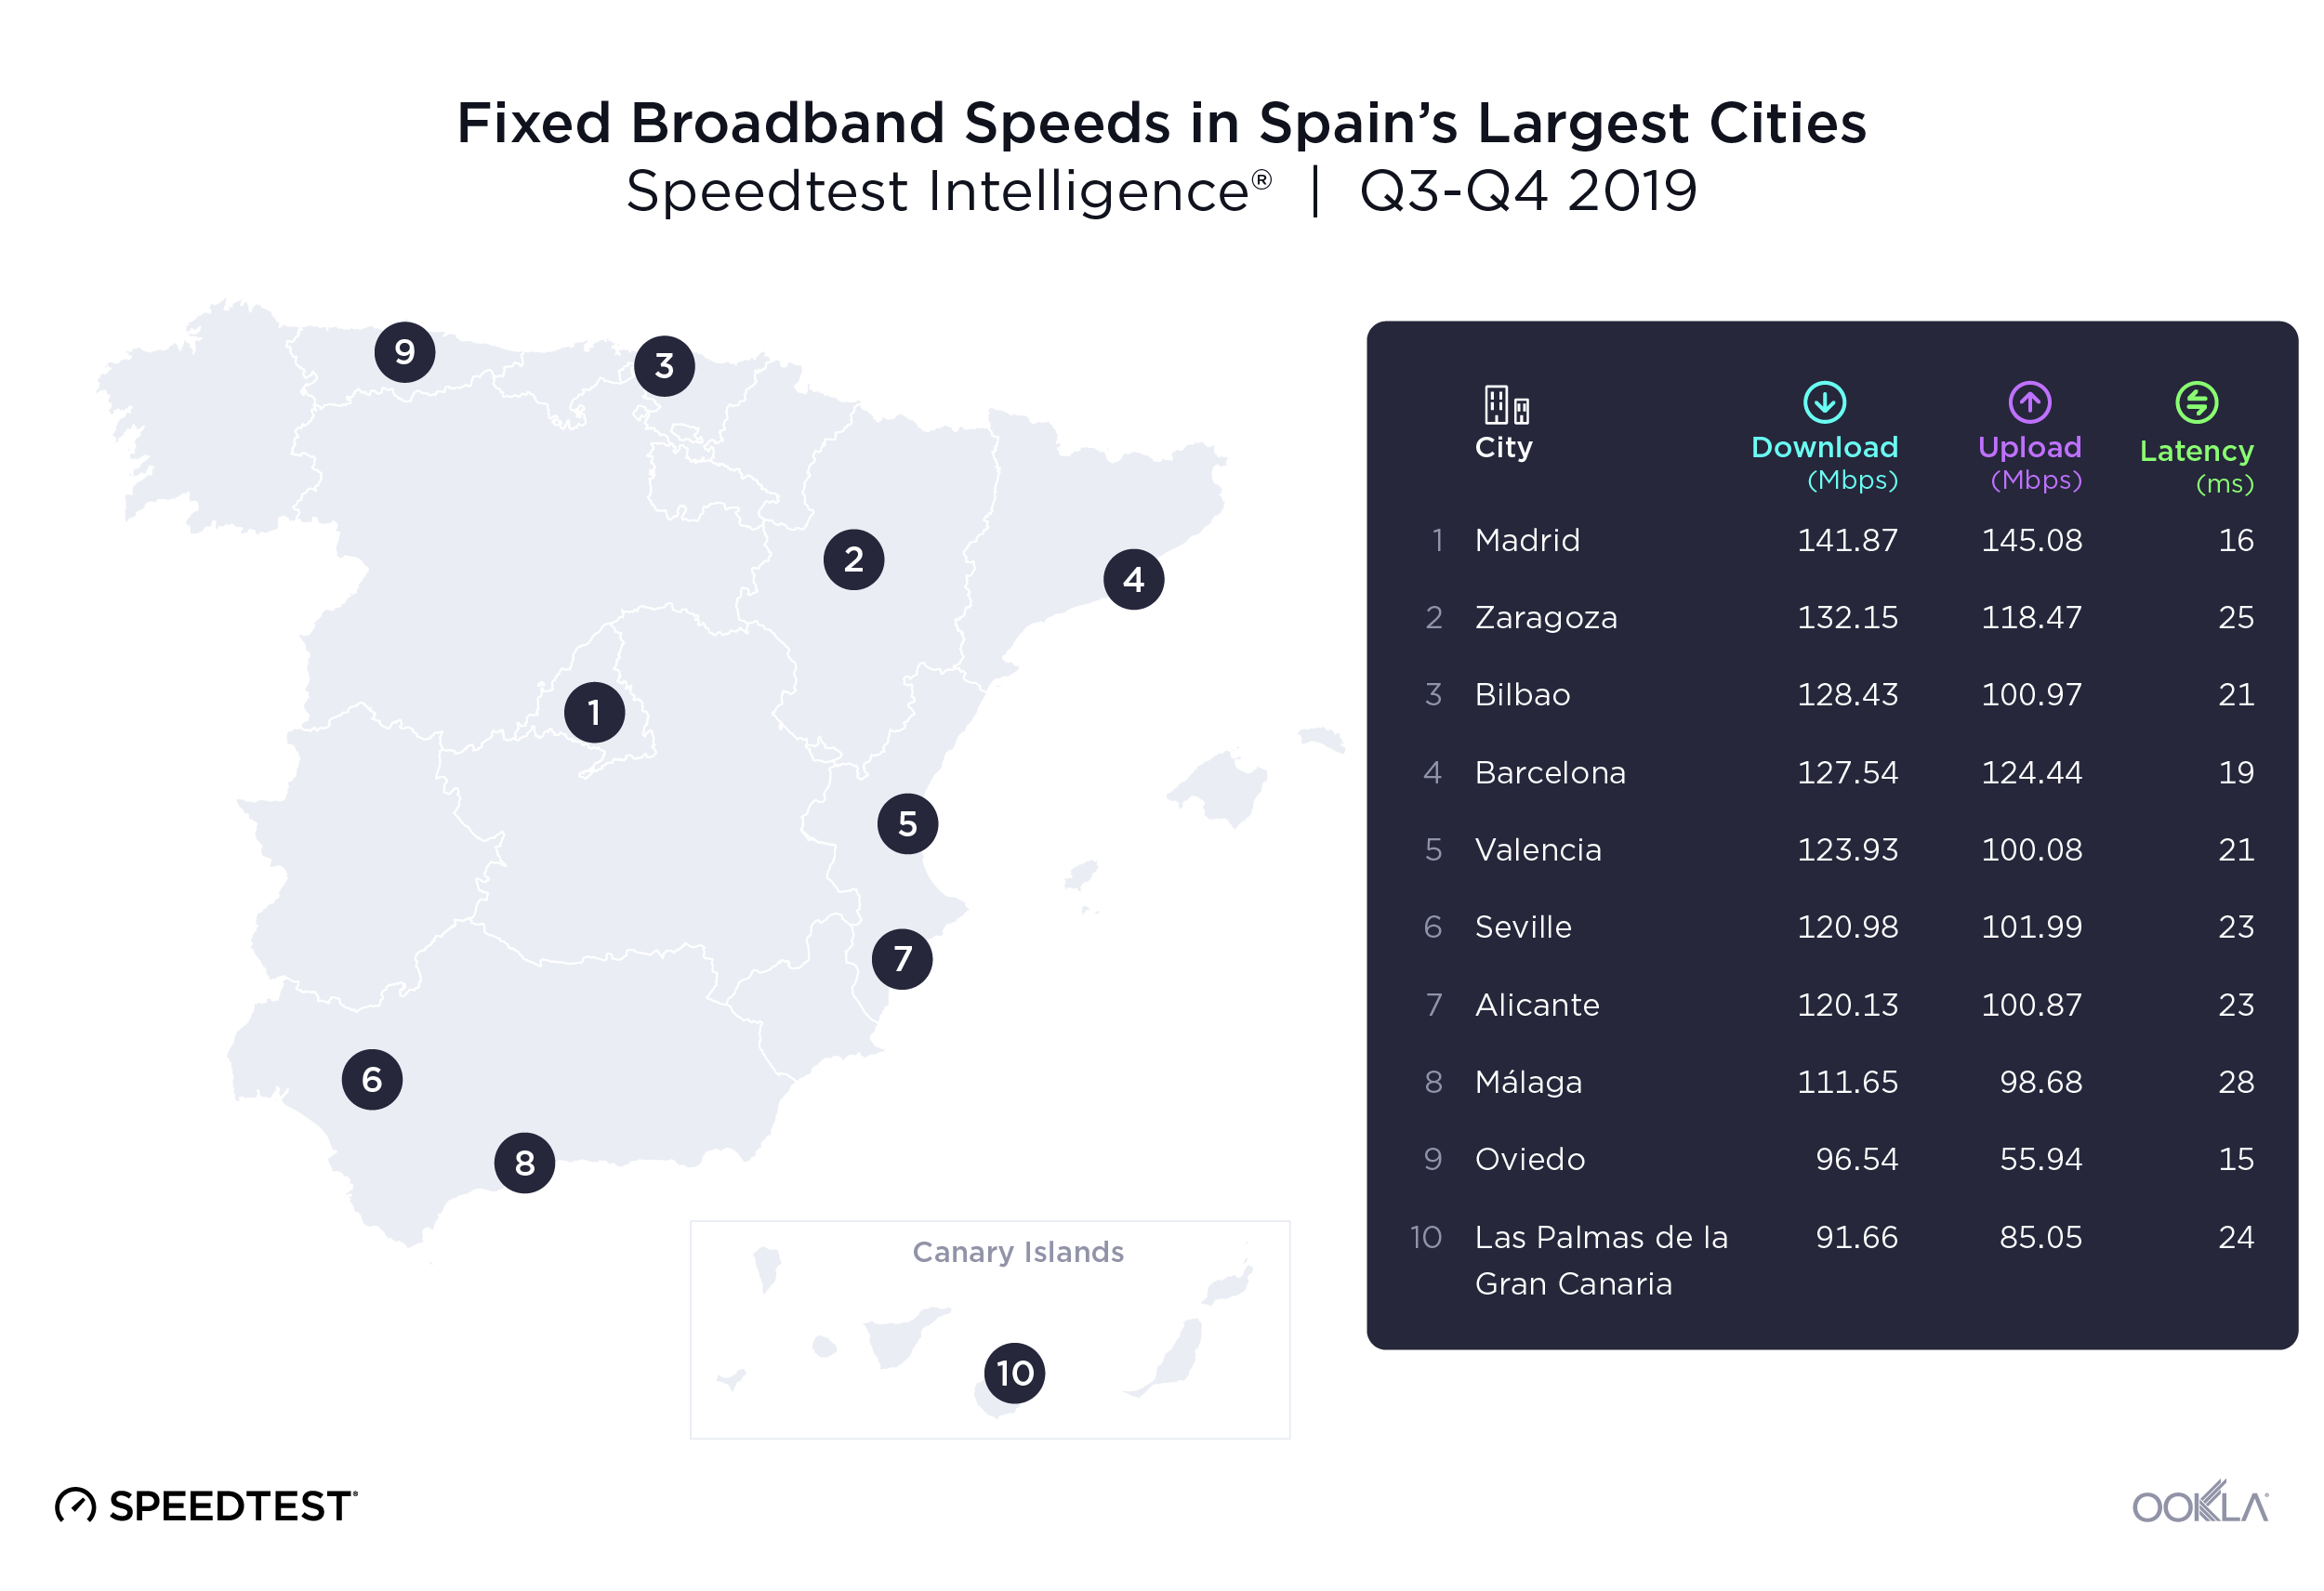
We used Speedtest data from 2,183,336 user-initiated tests to investigate internet speeds in Spain’s ten most populous cities during Q3-Q4 2019. Madrid had the fastest mean download speeds on both fixed broadband and mobile.

Mean download speeds on fixed broadband ranged from 141.87 Mbps in Madrid to 91.66 Mbps in Las Palmas de la Gran Canaria, a 35.4% difference. Madrid also had the fastest mean upload speed over fixed broadband at 145.08 Mbps. Oviedo took the last place in upload speeds on fixed broadband with a 61.4% slower upload speed than Madrid.

Oviedo had the lowest latency over fixed broadband of the cities on our list during Q3-Q4 2019 at 15 ms. Málaga had the highest latency at 28 ms.
Ookla_Mobile-Broadband-Speeds_Spain_0220-1
The gap between fastest and slowest speeds between Spanish cities on mobile broadband was similar to what we saw fixed broadband during Q3-Q4 2019. Madrid once again led in performance on mobile broadband with a mean download speed of 44.35 Mbps and a mean upload speed of 15.89 Mbps. Las Palmas was in last place on download speeds with a 37.9% slower mean download speed than Madrid. Valencia had the slowest mean upload speed over mobile at 13.86 Mbps. Seville had the lowest latency over mobile at 36 ms during Q3-Q4 2019 and Las Palmas had the highest mobile latency at 73 ms.

Zaragoza led 4G Availability in Spain’s most populous cities

4G Availability in Spain’s Largest Cities
Speedtest Intelligence® | Q3-Q4 2019
City 4G Availability
Zaragoza 97.2%
Valencia 97.1%
Seville 96.8%
Málaga 96.7%
Oviedo 95.4%
Madrid 95.1%
Las Palmas de la Gran Canaria 95.0%
Alicante 94.6%
Bilbao 94.3%
Barcelona 87.7%

4G Availability was higher in Spain’s largest cities than the country’s average, with Zaragoza having the highest 4G Availability at 97.2% of tested locations. Barcelona had the lowest 4G Availability on our list at 87.7%.

MÁSMÓVIL was fastest fixed broadband provider in 6 cities

Looking specifically at Speed Score in individual Spanish cities during Q3-Q4 2019, we found MÁSMÓVIL was the fastest provider in six cities: Málaga, Seville, Zaragoza, Madrid, Valencia and Alicante. Adamo, the fastest fixed provider in Barcelona, had the highest Speed Score on the list at 185.29. Vodafone was the fastest provider in Bilbao and Oviedo.

Fixed Broadband Performance by Operator in Spain’s Largest Cities
Speedtest Intelligence® | Q3-Q4 2019
City Provider Speed ScoreTM
Barcelona Adamo 185.29
Málaga MÁSMÓVIL 156.24
Seville MÁSMÓVIL 148.78
Madrid MÁSMÓVIL 145.83
Bilbao Vodafone 144.65
Zaragoza MÁSMÓVIL 144.40
Oviedo Vodafone 143.85
Valencia MÁSMÓVIL 143.99
Alicante MÁSMÓVIL 143.72
Las Palmas Orange 114.46

Looking at the fastest Spanish providers on mobile broadband for each city during Q3-Q4 2019, Movistar dominated the list with the fastest Speed Score in 7 cities. Movistar also had the highest Speed Score overall at 52.04 in Seville. Vodafone was the fastest mobile provider in Madrid (35.67). Orange was the fastest provider in Barcelona (35.37) and Oviedo (45.10).

Mobile Performance by Operator in Spain’s Largest Cities
Speedtest Intelligence® | Q3-Q4 2019
City Provider Speed ScoreTM
Seville Movistar 52.04
Valencia Movistar 50.80
Alicante Movistar 50.36
Málaga Movistar 48.97
Bilbao Movistar 48.86
Oviedo Orange 45.10
Zaragoza Movistar 40.79
Madrid Vodafone 35.67
Las Palmas Movistar 35.37
Barcelona Vodafone 31.37

We look forward to following these markets and investigating the changing landscape of internet performance and mobile coverage in Europe. Want to learn more about fixed and mobile speeds in different markets? Click here to read more Ookla Research.

Editor’s note: This article was updated on March 4, 2020 to correct an editing error that incorrectly reported the figures for mobile APS.

Velocidades de banda ancha fija y móvil, y disponibilidad de 4G en España

Hemos investigado el rendimiento de la banda ancha fija y móvil, así como la disponibilidad de 4G en España. También hemos comparado las velocidades y la cobertura españolas con las de los países europeos vecinos, así como el rendimiento y la disponibilidad de 4G de los principales proveedores de las diez ciudades más grandes de España en el segundo semestre de 2019. Además de clasificar a los proveedores españoles por su velocidad y cobertura máximas, también hemos analizado los efectos de los planes móviles con limitaciones de velocidad basándonos en los resultados de Speedtest® y hemos clasificado a los proveedores según la constancia del rendimiento de sus redes.

España y Francia fueron los países más rápidos de nuestra lista de banda ancha fija

Hemos comparado el rendimiento de la banda ancha fija de España a nivel de país con varios otros países de la Europa occidental en el segundo semestre de 2019. España obtuvo una buena posición en cuanto a velocidad de descarga media en banda ancha fija, con 113,72 Mbps, en segundo lugar solo después de los 119,37 Mbps de Francia. España registró la velocidad de subida media más alta de esta lista: 103,72 Mbps. Italia obtuvo la velocidad de descarga media más baja de esta lista, 56,72 Mbps, mientras que el Reino Unido registró la velocidad de subida media más baja, 18,28 Mbps.

fixed-broadband-speeds-sp-2

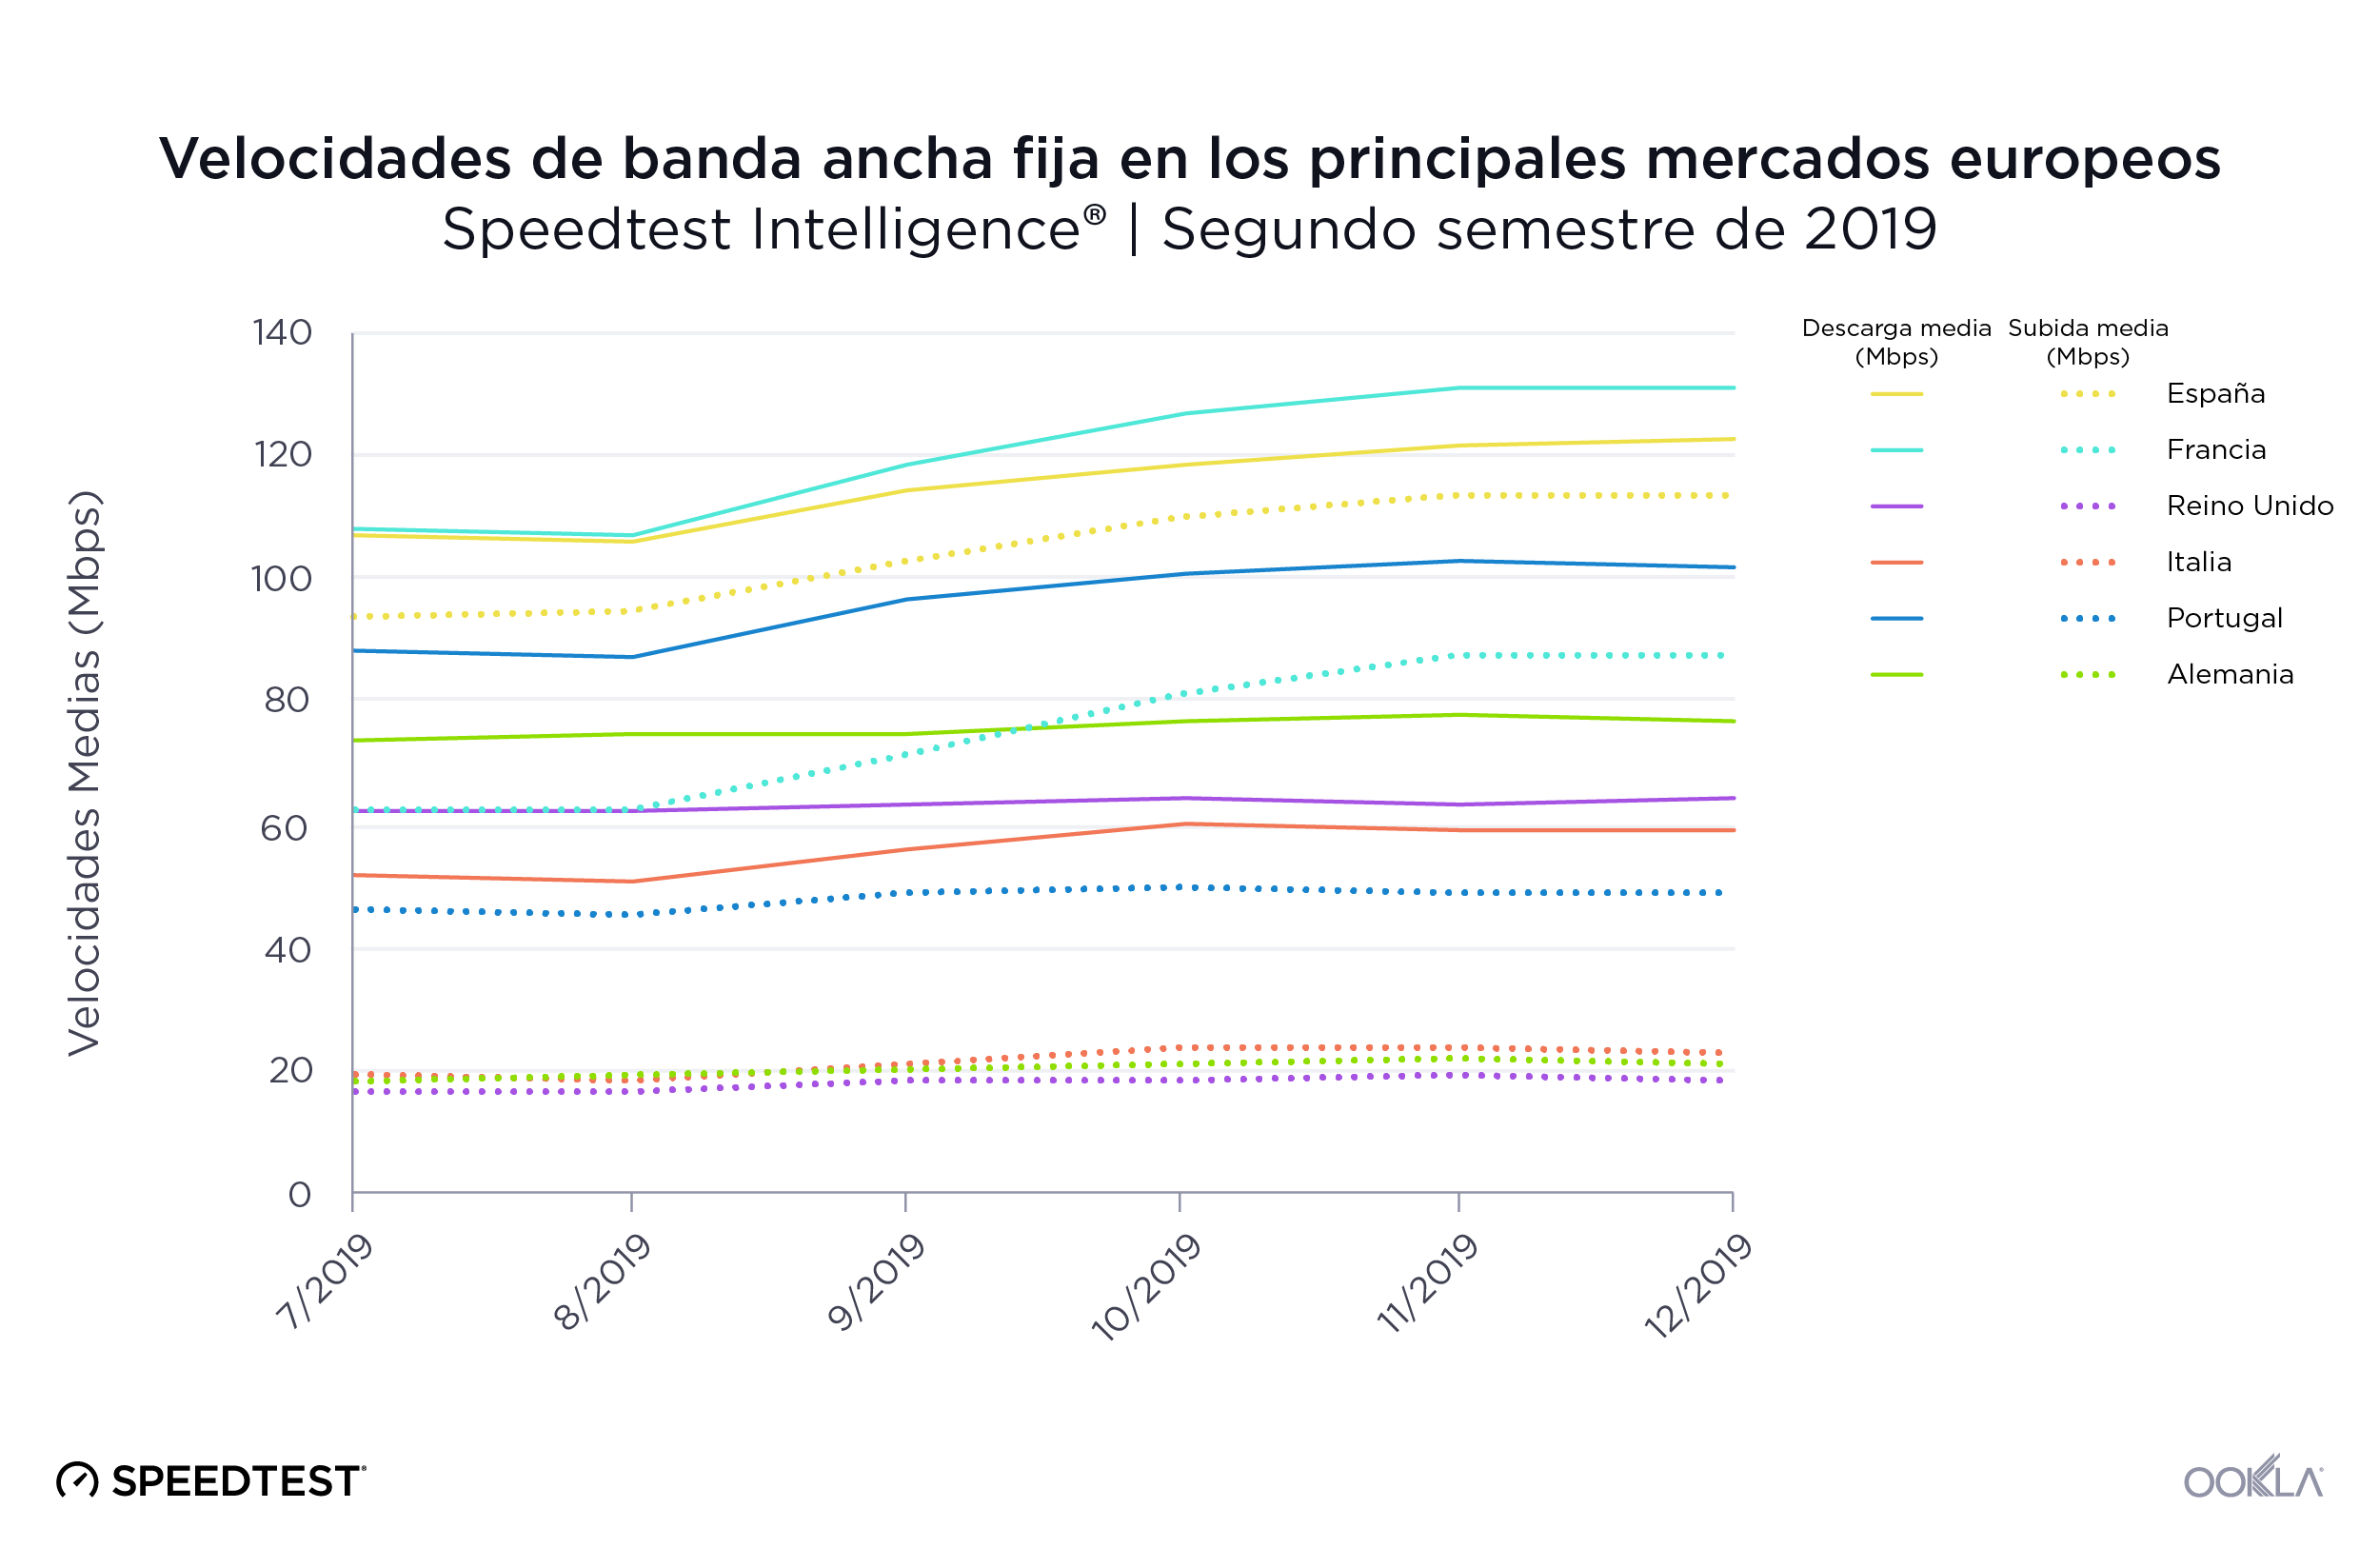
Francia registró el mayor aumento en la velocidad de descarga media del segundo semestre de 2019, con el 21,5 %, seguida de Portugal y Italia, con el 15,4 %, y España, con el 14,5 %. Las velocidades se mantuvieron relativamente invariables durante este periodo en Italia, Reino Unido y Alemania.

Un análisis de la latencia en banda ancha fija en el segundo semestre de 2019 reveló una clasificación por rendimiento muy distinta. Portugal se anotó la latencia más baja de este periodo: 16 ms. Alemania y Reino Unido empataron en el segundo puesto con 23 ms. España resultó tercera (25 ms), Italia cuarta (30 ms) y Francia quinta (32 ms).

España, cuarto país en velocidad de descarga en Internet móvil

mobile-speeds-sp-3

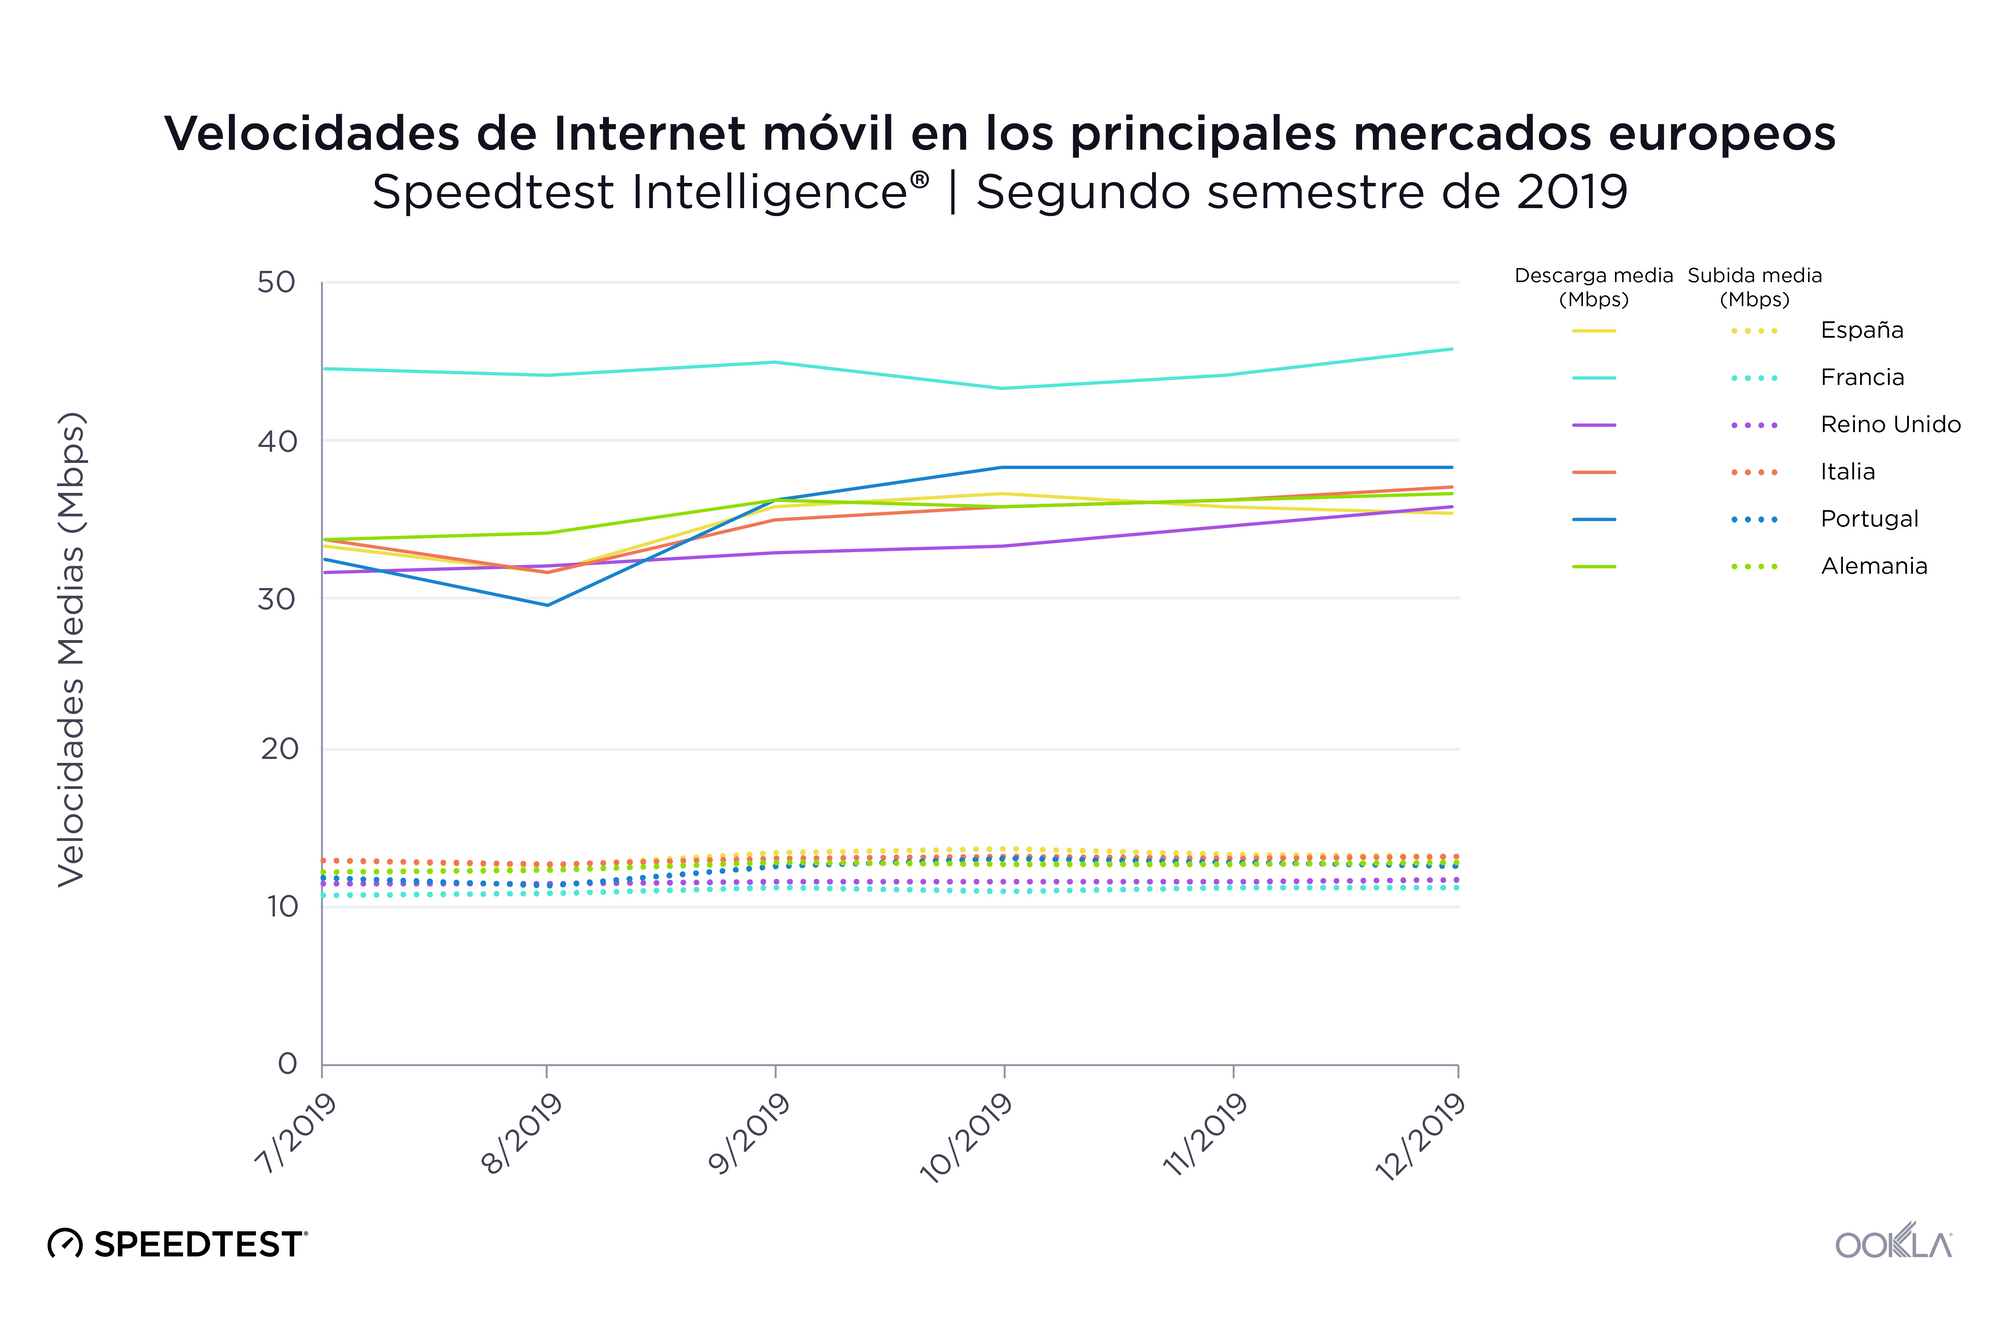
La clasificación de España en velocidad de descarga media por móvil no fue tan buena como la de banda ancha fija, quedándose con un cuarto puesto con 33,97 Mbps en el segundo semestre de 2019. Esto supuso una velocidad un 22,8 % más lenta que la del primer país clasificado, Francia. Sin embargo, España registró las velocidades de subida medias más altas en Internet móvil, con 13,12 Mbps en el segundo semestre de 2019.

Portugal experimentó el mayor aumento en velocidad de descarga de Internet móvil en el segundo semestre de 2019, el 18,4 %. La velocidad de descarga media de España en Internet móvil aumentó solo un 6,7 % en este periodo. Francia registró el menor aumento de velocidad de descarga de Internet móvil, un 2,8 %.

Como vimos en la banda ancha fija, la latencia móvil más baja fue la de Portugal, con 32 ms. Alemania fue segunda con 41 ms, Francia tercera con 43 ms, Reino Unido cuarto con 44 ms, España quinta con 47 ms e Italia última con 52 ms.

Reino Unido y España, líderes en disponibilidad de 4G

Utilizamos datos de exploraciones de cobertura de Speedtest en Android para comparar la disponibilidad de 4G en cada mercado en el segundo semestre de 2019. Mientras que el Reino Unido mostró la mayor disponibilidad de 4G con el 88,8 %, España y Francia ocuparon el segundo lugar, con 4G disponible en el 87,7 % de las ubicaciones probadas. Durante ese período, Alemania tuvo la menor disponibilidad de 4G con un 72,1 %.

Disponibilidad de 4G en los principales mercados europeos
Speedtest Intelligence® | Segundo semestre de 2019
País Disponibilidad de 4G
Reino Unido 88,8 %
España 87,7 %
Francia 87,7 %
Italia 86,7 %
Portugal 85,0 %
Alemania 72,1 %

Si nos fijamos específicamente en los principales proveedores móviles de España, Orange ofreció la mayor disponibilidad de 4G con un 88,1 %. Movistar fue segundo, Yoigo tercero, y Vodafone cuarto.

Disponibilidad de 4G por proveedor en España
Speedtest Intelligence® | Segundo semestre de 2019
Proveedor Disponibilidad de 4G
Orange 88,1 %
Movistar 87,7 %
Yoigo 87,4 %
Vodafone 86,1 %

Los despliegues de 5G en España se están expandiendo

5G-Deployments-in-Spain-0220_es
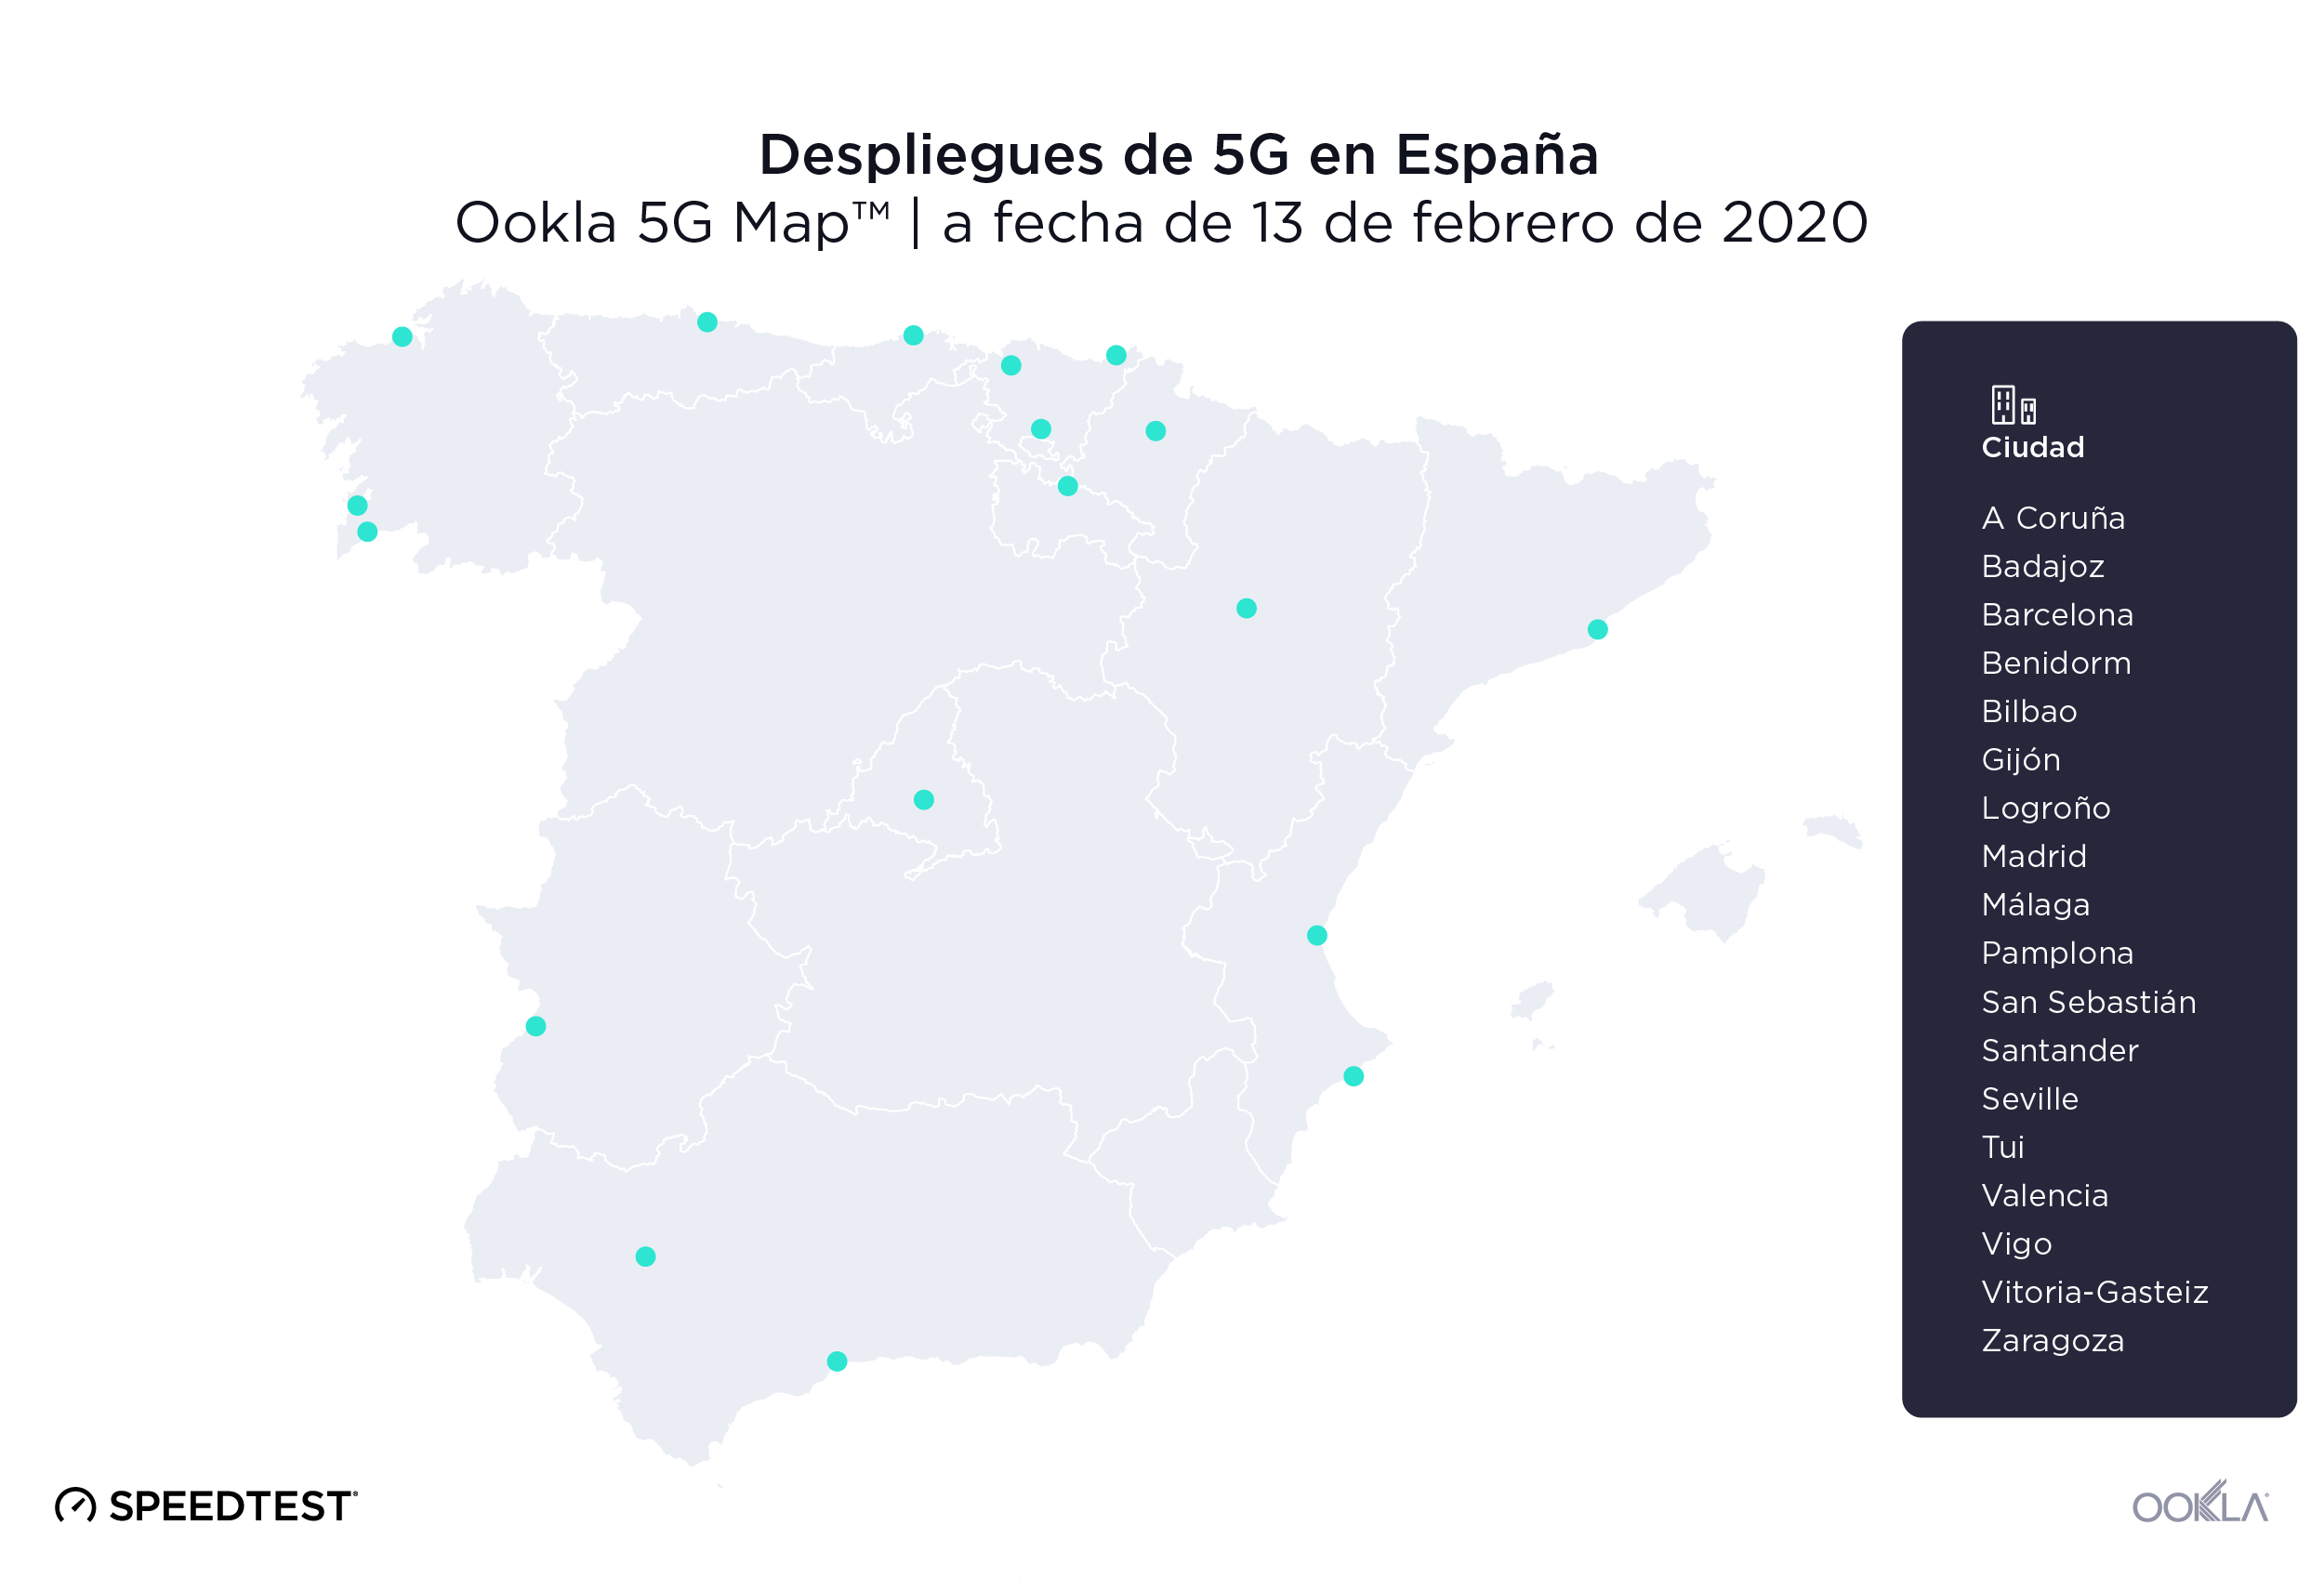
El entusiasmo por el 5G es evidente en España. Vodafone desplegó 5G comercialmente disponible en un total de 18 ciudades españolas a fecha del 13 de febrero de 2020, incluidas Barcelona, Madrid, Valencia, Málaga y Bilbao. Los datos de Speedtest revelan que en España la velocidad media de descarga en 5G en el segundo semestre de 2019 fue de 350,68 Mbps (velocidad superior a la media nacional para Internet móvil) y la velocidad de subida media por 5G fue de 31,82 Mbps. La latencia media por 5G en España fue de 27 ms en el segundo semestre de 2019.

MÁSMÓVIL fue el proveedor de banda ancha fija más rápido de España

Al utilizar Speed Score™, sistema que combina mediciones de velocidades de descarga y de subida, para comparar los principales proveedores de servicios de Internet de España en el segundo semestre de 2019, descubrimos que MÁSMÓVIL obtuvo los mejores resultados, con una puntuación de 133,75 en banda ancha fija. Orange ocupó el segundo lugar con 115,25, seguido de Vodafone (105,07) y Movistar (103,01).

Rendimiento de la banda ancha fija en España por proveedor
Speedtest Intelligence® | Segundo semestre de 2019
Proveedor Speed ScoreTM
MÁSMÓVIL 133,75
Orange 115,25
Vodafone 105,07
Movistar 103,01

Movistar fue el operador móvil más rápido de España

Movistar obtuvo la máxima puntuación de velocidad de entre los operadores móviles de España en el segundo semestre de 2019, con 37,76. Orange fue segundo con 33,02, Vodafone la tercera con 26,34 y Yoigo cuarta con 22,43. Como veremos más adelante, el rendimiento general de la velocidad puede verse afectado por los límites de velocidad y los planes de tarifas vigentes en España.

Rendimiento de Internet móvil en España por operador
Speedtest Intelligence® | Segundo semestre de 2019
Proveedor Speed ScoreTM
Movistar 37,76
Orange 33,02
Vodafone 26,34
Yoigo 22,43

La limitación de velocidad afecta al rendimiento general

La limitación de la velocidad, una restricción de servicio impuesta a una conexión de Internet por los operadores, permite a estos ofrecer también planes que se centren en la asequibilidad más que en el rendimiento máximo.
Ookla_Distribution-Speedtest-Results_Vodafone_Spain_0220-3_es
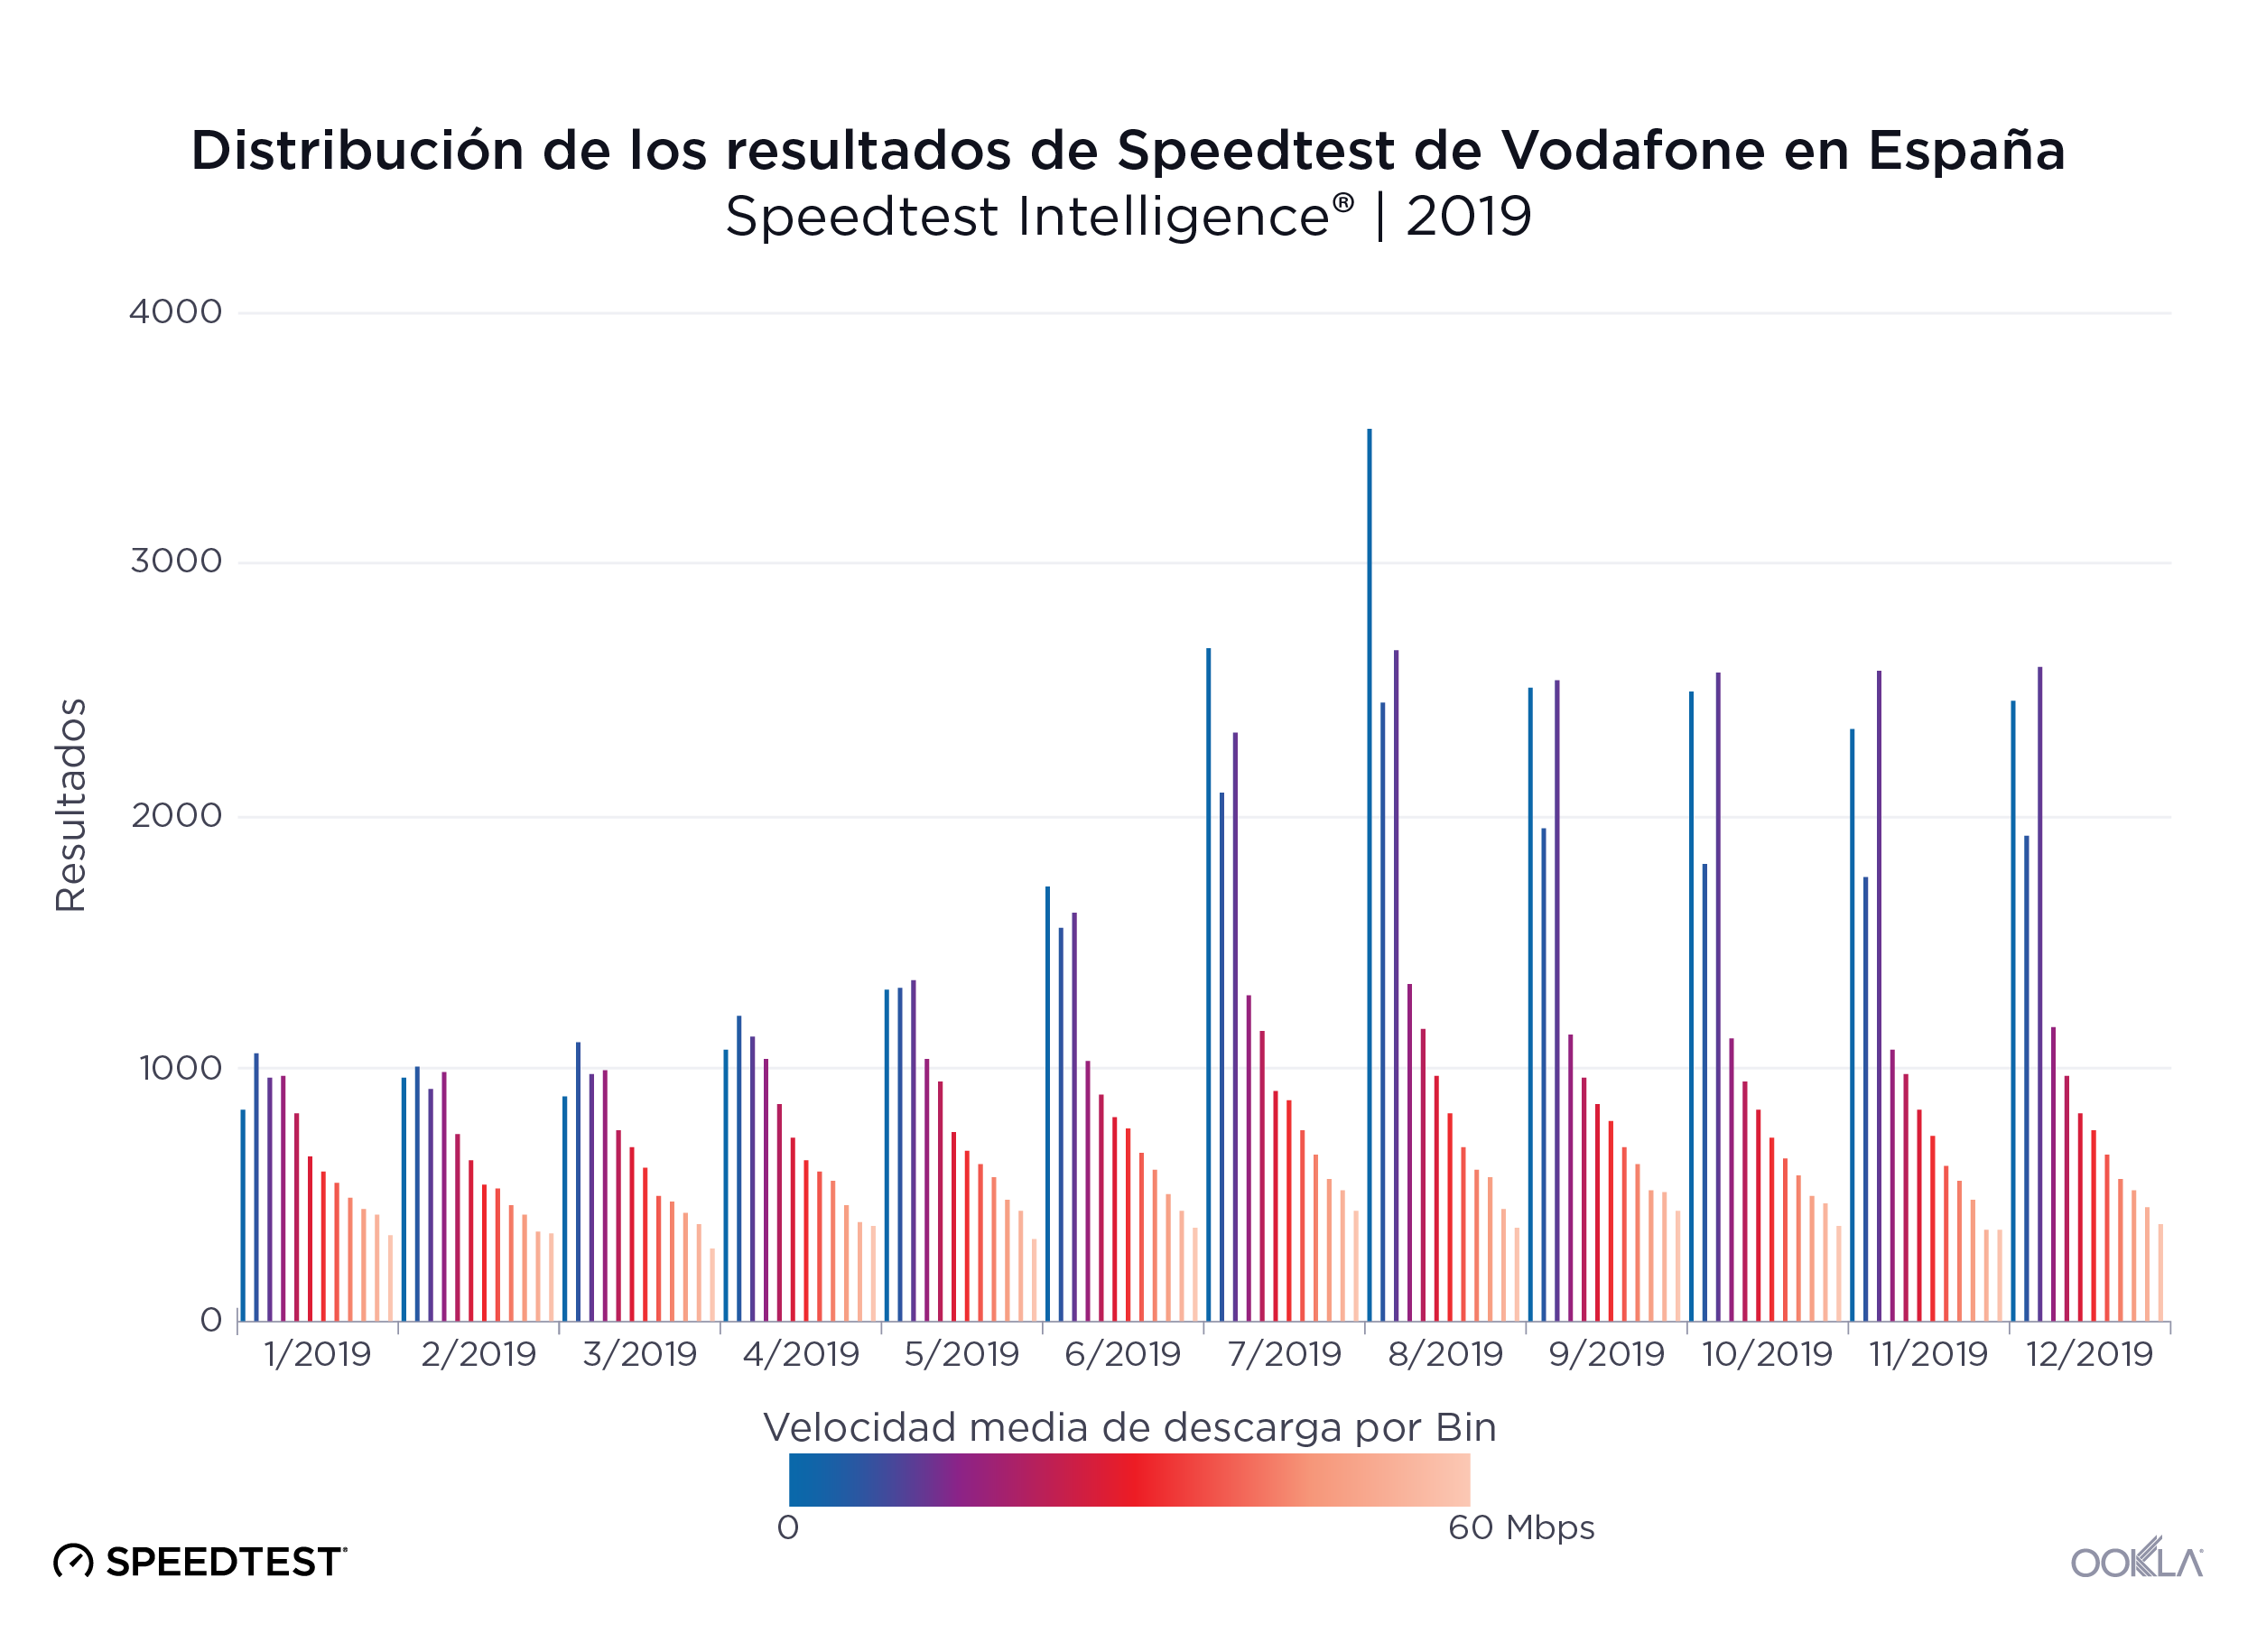
En el gráfico anterior se muestra cómo los planes de suscripción con limitación de velocidad introducidos por Vodafone afectaron a la distribución de las velocidades de descarga. Aunque esos planes (con limitaciones de 2 Mbps y 10 Mbps, respectivamente) estaban disponibles desde abril, no vemos un efecto verdadero en las velocidades medias hasta mayo y junio cuando las medidas de 0-5 Mbps y 10-15 Mbps empiezan a sobresalir.

En cambio, en el resto de operadores móviles de España vemos distribuciones más uniformes de las velocidades de descarga.
Ookla_Distribution-Speedtest-Results_Movistar_Spain_0220-3_es
Ookla_Distribution-Speedtest-Results_Orange_Spain_0220-3_es
Ookla_Distribution-Speedtest-Results_Yoigo_Spain_0220-3_es

MÁSMÓVIL y Movistar (móvil) ofrecen las velocidades más constantes

La velocidad es importante, pero si no es constante, resulta difícil que los usuarios utilicen sus dispositivos con fiabilidad para transmitir vídeo de alta definición, navegar por la web o jugar en línea. Utilizamos los datos de Speedtest para calcular la PRA (puntuación de rendimiento aceptable) de cada uno de los principales proveedores de España durante el segundo semestre de 2019.

La PRA de banda ancha fija mide el porcentaje de muestras que igualan o superan una velocidad de descarga de 25 Mbps y que también igualan o superan una velocidad de subida de 3 Mbps. MÁSMÓVIL proporcionó el mayor nivel de constancia de España en banda ancha fija en el segundo semestre de 2019 con una PRA de 81,6 %. Movistar quedó en último lugar con una PRA del 61,9 %.

Constancia de velocidad por proveedor en banda ancha fija
Speedtest Intelligence® | Segundo semestre de 2019
Proveedor PRA
MÁSMÓVIL 81,6 %
Orange 75,1 %
Vodafone 73,5 %
Movistar 61,9 %

La PRA de Internet móvil mide el porcentaje de muestras que igualan o superan una velocidad de descarga de 5 Mbps y que también igualan o superan una velocidad de subida de 1 Mbps. Movistar ocupó el primer lugar en constancia de banda ancha móvil con una PRA del 88,9 %, Vodafone obtuvo la puntuación más baja en constancia con una PRA del 79,8 %.

Constancia de velocidad por operador en Internet móvil
Speedtest Intelligence® | Segundo semestre de 2019
Proveedor PRA
Movistar 88,9 %
Orange 84,3 %
Yoigo 82,6 %
Vodafone 79,8 %

Madrid lideró las velocidades de banda ancha fija y móvil

Ookla_Fixed-Broadband-Speeds_Spain_0220_es-2
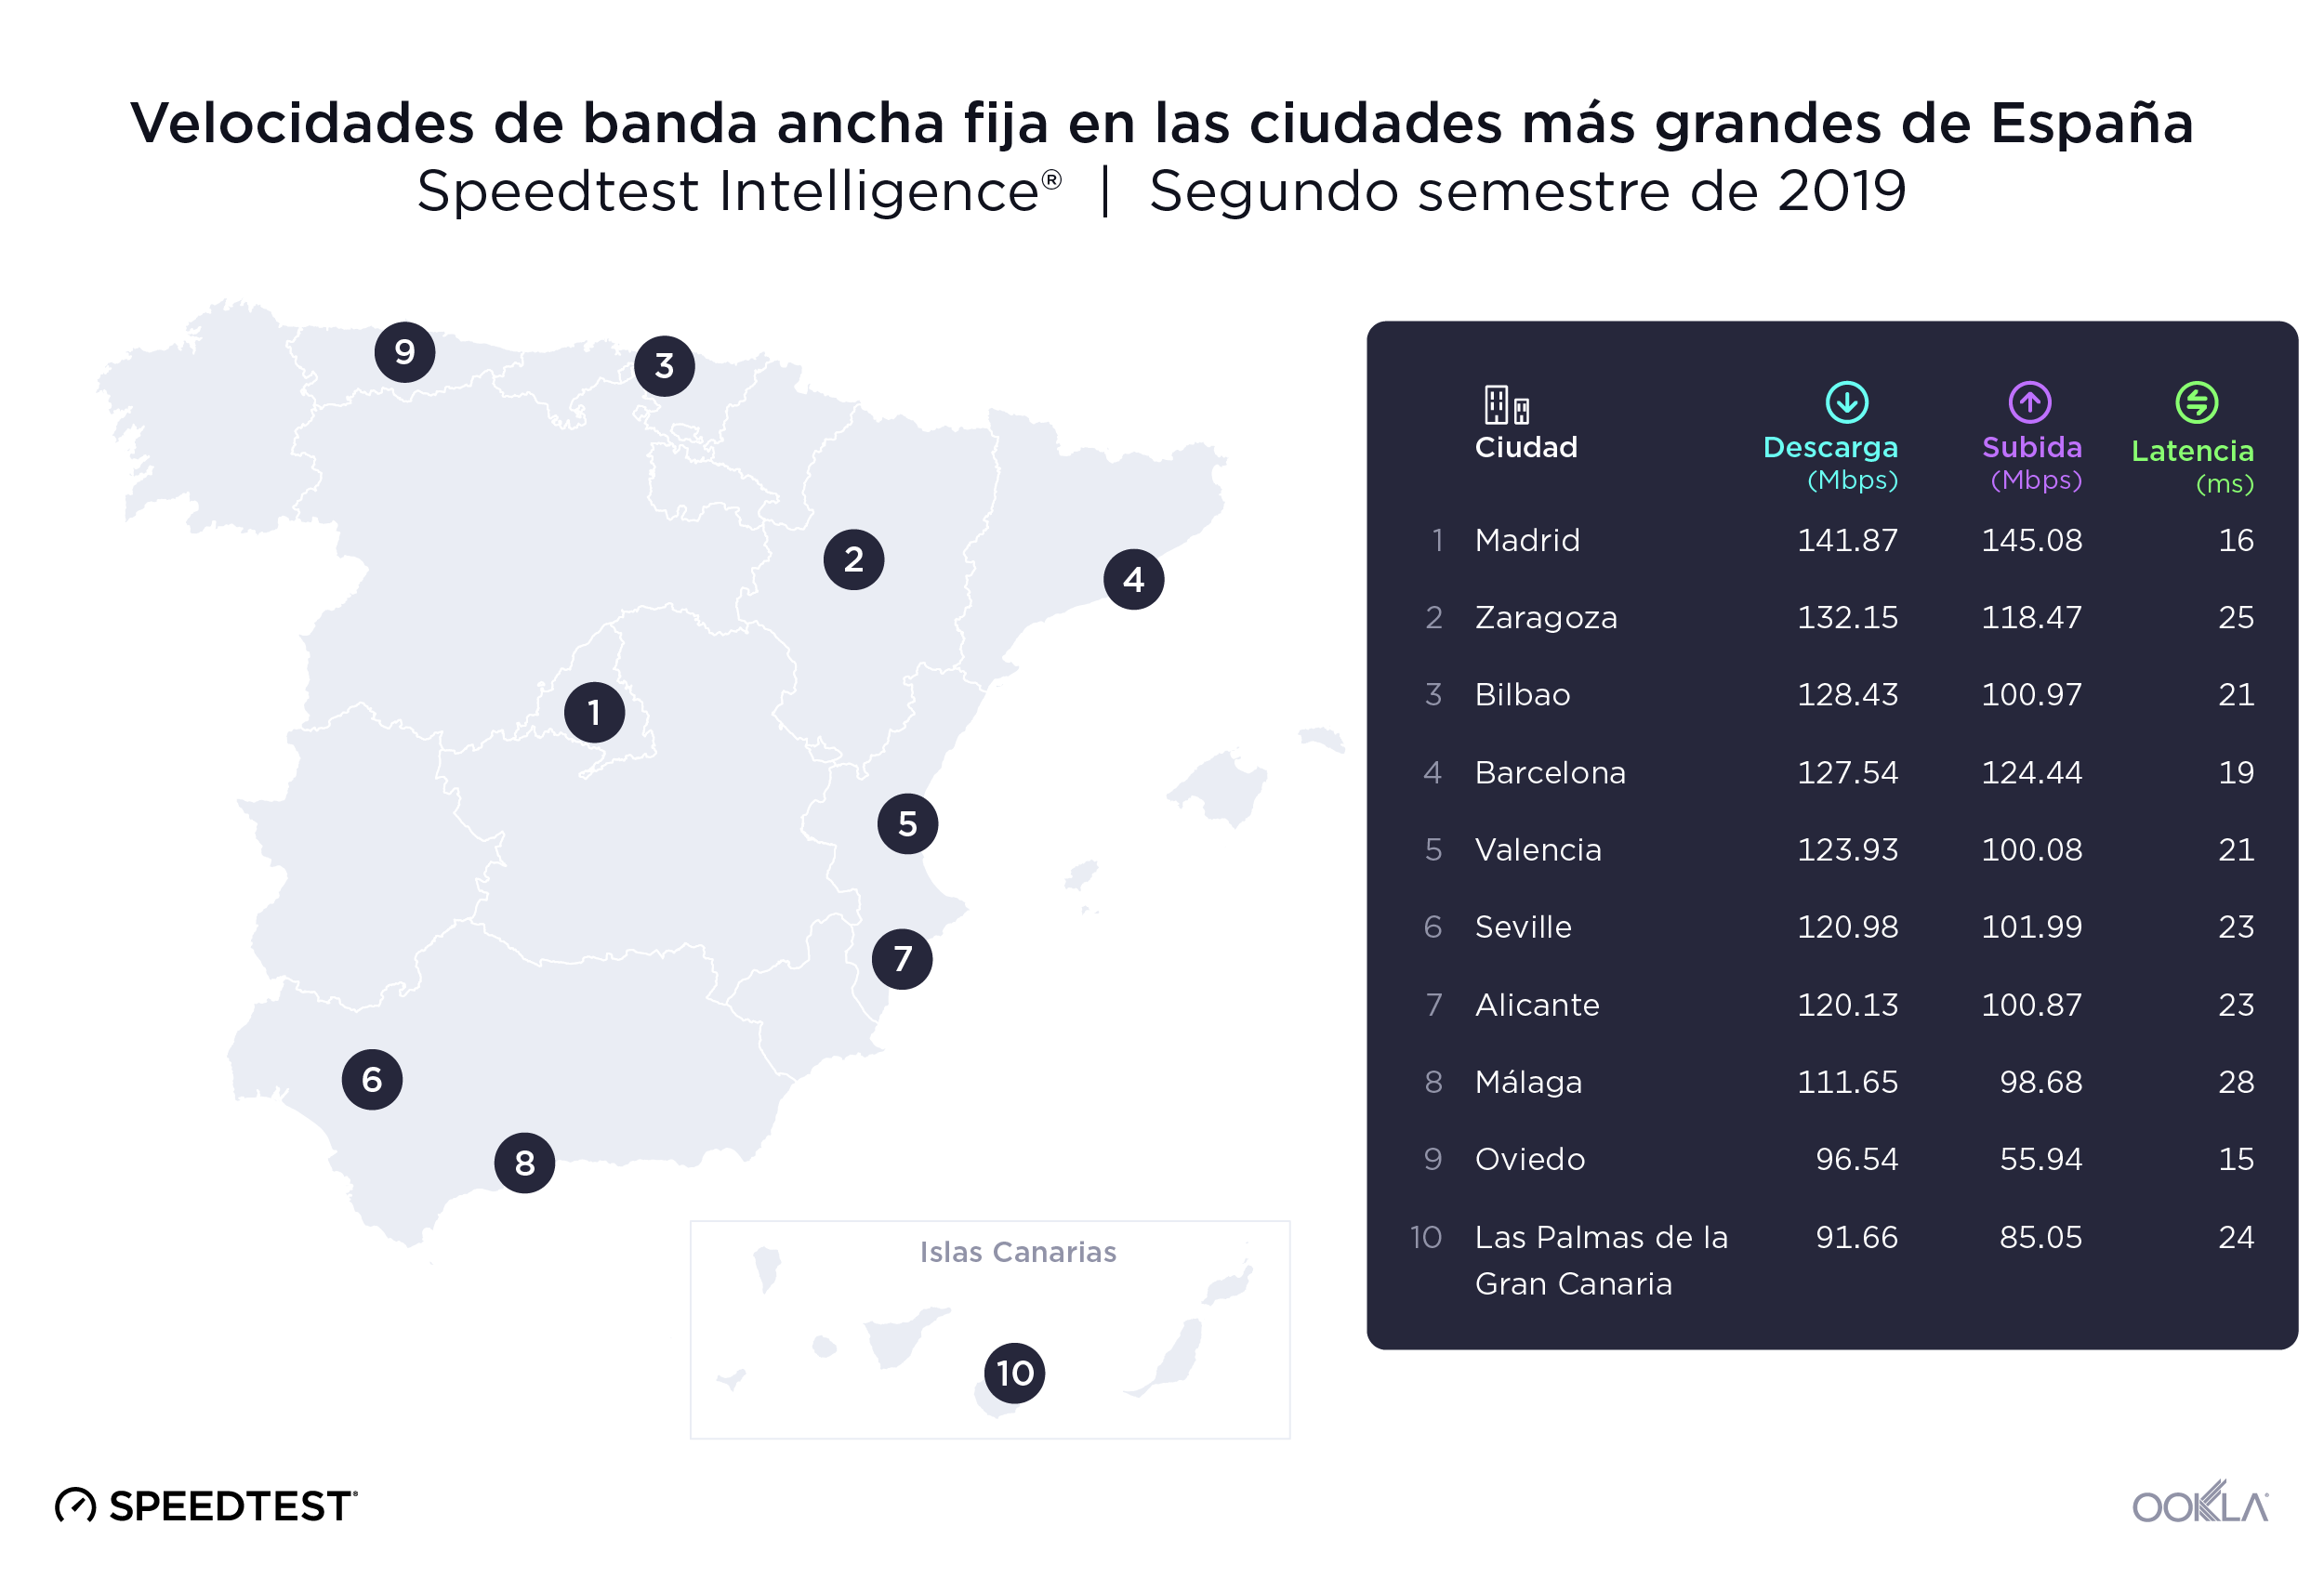
Para estudiar las velocidades de Internet de las diez ciudades más pobladas de España en el segundo semestre de 2019 utilizamos los datos de Speedtest de 2.183.336 pruebas realizadas por los usuarios. Madrid registró las velocidades medias de descarga más altas tanto en banda ancha fija como en Internet móvil.

Las velocidades medias de descarga por banda ancha fija oscilaron entre los 141,87 Mbps de Madrid y los 91,66 Mbps de Las Palmas de la Gran Canaria, una diferencia del 35,4 %. Madrid registró también la velocidad de subida media más alta por banda ancha fija, con 145,08 Mbps. Oviedo ocupó el último lugar en velocidad de subida por banda ancha fija con un 61,4 % menos de velocidad de subida que Madrid.

Oviedo tuvo la menor latencia en banda ancha fija de las ciudades de nuestra lista durante el segundo semestre de 2019, con 15 ms. Málaga registró la latencia más alta, con 28 ms.
Ookla_Mobile-Broadband-Speeds_Spain_0220_es-1
La brecha entre las velocidades más rápidas y más lentas de las ciudades españolas por banda ancha móvil fue similar a la que apreciamos en la banda ancha fija en el segundo semestre de 2019. Madrid volvió a liderar el rendimiento de la banda ancha móvil con una velocidad media de descarga de 44,35 Mbps y una velocidad media de subida de 15,89 Mbps. Las Palmas quedó en último lugar en velocidades de descarga con un 37,9 % menos de velocidad media de descarga que Madrid. Valencia registró la velocidad de subida media más baja por Internet móvil: 13,86 Mbps. Sevilla obtuvo la menor latencia por Internet móvil con 36 ms en el segundo semestre de 2019 y Las Palmas registró la mayor latencia por Internet móvil con 73 ms.

Zaragoza lideró la disponibilidad de 4G en las ciudades españolas más pobladas

Disponibilidad de 4G en las ciudades más grandes de España
Speedtest Intelligence® | Segundo semestre de 2019
Ciudad Disponibilidad de 4G
Zaragoza 97,2 %
Valencia 97,1 %
Sevilla 96,8 %
Málaga 96,7 %
Oviedo 95,4 %
Madrid 95,1 %
Las Palmas de la Gran Canaria 95,0 %
Alicante 94,6 %
Bilbao 94,3 %
Barcelona 87,7 %

La disponibilidad de 4G en las ciudades más grandes de España superó el promedio del país, siendo Zaragoza la de mayor disponibilidad de 4G con el 97,2 % de las ubicaciones analizadas. Barcelona tuvo la menor disponibilidad de 4G de nuestra lista, con el 87,7 %.

MÁSMÓVIL fue el proveedor de banda ancha fija más rápido de 6 ciudades

Si nos fijamos específicamente en la puntuación de velocidad en cada una de las ciudades españolas en el segundo semestre de 2019, vemos que MÁSMÓVIL fue el proveedor más rápido en seis ciudades: Málaga, Sevilla, Zaragoza, Madrid, Valencia y Alicante. Adamo, el proveedor fijo más rápido de Barcelona, consiguió la puntuación de velocidad más alta de la lista con 185,29. Vodafone fue el proveedor más rápido en Bilbao y Oviedo.

Rendimiento de la banda ancha fija por operador en las ciudades más grandes de España
Speedtest Intelligence® | Segundo semestre de 2019
Ciudad Proveedor Speed ScoreTM
Barcelona Adamo 185,29
Málaga MÁSMÓVIL 156,24
Sevilla MÁSMÓVIL 148,78
Madrid MÁSMÓVIL 145,83
Bilbao Vodafone 144,65
Zaragoza MÁSMÓVIL 144,40
Valencia MÁSMÓVIL 143,99
Oviedo Vodafone 143,85
Alicante MÁSMÓVIL 143,72
Las Palmas Orange 114,46

Si nos fijamos en los proveedores españoles más rápidos en banda ancha móvil de cada ciudad en el segundo semestre de 2019, Movistar dominó la lista con la puntuación de velocidad más alta en 7 ciudades. Movistar consiguió también la puntuación de velocidad máxima, con 52,04 en Sevilla. Vodafone fue el proveedor de Internet móvil más rápido en Madrid (35,67). Orange fue el proveedor más rápido de Barcelona (35,37) y Oviedo (45,10).

Rendimiento de Internet móvil por operador en las ciudades más grandes de España
Speedtest Intelligence® | Segundo semestre de 2019
Ciudad Proveedor Speed ScoreTM
Sevilla Movistar 52,04
Valencia Movistar 50,80
Alicante Movistar 50,36
Málaga Movistar 48,97
Bilbao Movistar 48,86
Oviedo Orange 45,10
Zaragoza Movistar 40,79
Madrid Vodafone 35,67
Barcelona Orange 35,37
Las Palmas Movistar 31,37

Nos encantará seguir la evolución de estos mercados y estudiar el cambiante panorama del rendimiento de Internet y de la cobertura móvil en Europa. Si desea obtener más información sobre las velocidades fijas y móviles en diferentes mercados, haga clic aquí para leer más información de Ookla.

Nota del editor: Este artículo fue actualizado el 4 de marzo del 2020 que para corregir un error de edición que reportaba cifras incorrectas del PRA móvil.

Ookla retains ownership of this article including all of the intellectual property rights, data, content graphs and analysis. This article may not be quoted, reproduced, distributed or published for any commercial purpose without prior consent. Members of the press and others using the findings in this article for non-commercial purposes are welcome to publicly share and link to report information with attribution to Ookla.

| June 16, 2021

How COVID-19 Affected Roaming for Mobile Speeds in Europe

Roaming might seem like an unusual topic in a time when inter-country travel has been largely prohibited, but we wanted to build on our previous analysis to see how roaming performance and behaviors evolved over the past year. This analysis examines Speedtest data from Android devices in the European Union (E.U.) and the United Kingdom (U.K.) from Q1 2020 through Q1 2021. We’ve included the U.K. to maintain continuity with pre-Brexit reports.

Roaming speeds were slower in most European countries in Q1 2021

Speedtest Intelligence® again showed that consumers who are roaming outside their home countries often experience slower speeds. During Q1 2021, 19 out of the 26 European countries with statistically viable roaming sample sizes experienced slower median roaming download speeds than median local download speeds. Cyprus and Malta had too few roaming samples to be included in this year’s analysis for Q1 2021.

For the seven countries that saw increased speeds, Latvians experienced the largest increase in median download speed when roaming elsewhere in Europe at 23.4%, which was followed closely by Estonia (22.8%) and Ireland (19.5%). Greece, Romania and Slovenia saw increases of more than 5%. The U.K. saw about the same speeds roaming and locally with an increase of only 0.5% when roaming. Hungary also saw comparable roaming download speeds to local speeds with a decrease of only 0.5% when roaming.

Median Local vs. Roaming Download Speeds in Europe
Speedtest Intelligence® | Q1 2021
Country Local Download (Mbps) Roaming Download (Mbps) % Change
Austria 36.19 26.13 -27.8%
Belgium 43.90 27.52 -37.3%
Bulgaria 61.76 29.74 -51.8%
Croatia 48.23 31.3 -35.1%
Czechia 31.35 19.74 -37.0%
Denmark 50.11 22.18 -55.7%
Estonia 34.34 42.16 22.8%
Finland 43.02 31.68 -26.4%
France 34.68 29.62 -14.6%
Germany 27.56 20.14 -26.9%
Greece 32.38 35.51 9.7%
Hungary 28.66 28.51 -0.5%
Ireland 14.99 17.91 19.5%
Italy 25.24 21.66 -14.2%
Latvia 22.69 28.00 23.4%
Lithuania 33.66 30.80 -8.5%
Luxembourg 40.65 26.31 -35.3%
Netherlands 77.52 26.48 -65.8%
Poland 26.51 23.13 -12.7%
Portugal 26.16 23.74 -9.3%
Romania 25.12 26.80 6.7%
Slovakia 23.79 20.94 -12.0%
Slovenia 27.63 29.58 7.1%
Spain 23.78 18.21 -23.4%
Sweden 38.26 23.16 -39.5%
United Kingdom 27.96 28.09 0.5%

Every other country on our list saw decreases in median download speeds of 8.5% or more while roaming, with customers from the Netherlands experiencing the largest drop (65.8%) from a local speed of 77.52 Mbps to 26.48 Mbps while roaming. Customers from Denmark and Bulgaria experienced roaming speeds less than half of what they’re accustomed to at home with decreases of 55.7% and 51.8%, respectively.

Roaming decreased during the pandemic while speeds increased

The COVID-19 pandemic has upended countless lives with multiple lockdowns throughout 2020 and 2021 and severe limits to movement across borders. Data from Speedtest Intelligence reflects this decrease in roaming with roaming samples markedly down when comparing Q1 2021 to Q1 2020. We saw the most roaming samples during Q3 2020 and Q1 2020, which corresponds to increased lockdowns and movement restrictions in Q2 and Q4 2020 in response to the first and second waves of the pandemic.

Roaming speeds for all European countries combined increased 6.9% between Q1 2020 and Q1 2021, though the increase was not linear. Median download speed while roaming decreased from 22.89 Mbps in Q1 2020 to 22.09 in Q2 2020 and slipped down to 20.68 Mbps in Q3 2020. Roaming speeds began to increase in Q4 2020 with the median download speed rising to 23.42 Mbps, and Q1 2021 saw a further increase to 24.47 Mbps.

ookla_roaming_quarter_change_eu_0621-1

Estonia saw the biggest year-over-year increase in median roaming download speed, Slovakia and Italy saw the largest decrease

Median European Roaming Download Speeds
Speedtest Intelligence® | Q1 2020 – Q1 2021
Country Q1 2020 Download (Mbps) Q1 2021 Download (Mbps) % Change
Europe (All Countries Combined) 22.89 24.47 6.9%
Austria 24.39 26.13 7.1%
Belgium 23.78 27.52 15.7%
Bulgaria 22.81 29.74 30.4%
Croatia 29.28 31.30 6.9%
Czechia 20.23 19.74 -2.4%
Denmark 21.38 22.18 3.7%
Estonia 27.82 42.16 51.5%
Finland 32.18 31.68 -1.6%
France 24.57 29.62 20.6%
Germany 20.74 20.14 -2.9%
Greece 41.07 35.51 -13.5%
Hungary 25.10 28.51 13.6%
Ireland 22.08 17.91 -18.9%
Italy 26.98 21.66 -19.7%
Latvia 26.38 28.00 6.1%
Lithuania 22.60 30.80 36.3%
Luxembourg 18.82 26.31 39.8%
Netherlands 18.39 26.48 44.0%
Poland 17.01 23.13 36.0%
Portugal 23.78 23.74 -0.2%
Romania 23.64 26.80 13.4%
Slovakia 26.16 20.94 -20.0%
Slovenia 25.30 29.58 16.9%
Spain 15.05 18.21 21.0%
Sweden 21.36 23.16 8.4%
United Kingdom 29.48 28.09 -4.7%

2020 also posed many challenges for telecom operators around the world as customers shifted use patterns. Despite these challenges, many Europeans saw increases in median roaming speeds year-over-year. In fact, customers in 17 out of the 26 countries analyzed saw faster download speeds while roaming elsewhere in Europe when comparing Q1 2020 to Q1 2021. Estonians saw the largest increase at 51.5% (from 27.82 Mbps to 42.16 Mbps), the Netherlands was next with a 44.0% jump (from 18.39 Mbps to 26.48 Mbps) and Luxembourg saw a 39.8% increase in download speed (from 18.82 Mbps to 26.31 Mbps).

Countries whose customers experienced year-over-year decreases in median downloads speed while roaming include Slovakia (20.0% decrease), Italy (19.7%), Ireland (18.9%), Greece (13.5%), the U.K. (4.7%), Germany (2.9%), Czechia (2.4%), Finland (1.6%) and Portugal (0.2%).

While the year-over-year change is an interesting baseline metric, it’s also important to note only Denmark, Germany, Poland and Spain had consistently slower median roaming download speeds than the European average during every quarter from Q1 2020 to Q1 2021. Every other country had at least one quarter where speeds were faster than the European average.

Outbound roaming speeds varied drastically from country to country from Q1 2020 to Q1 2021

Roaming speeds are heavily dependent on agreements between individual operators, which means they can vary dramatically by country and by operator. We looked closely at outbound roaming for individual countries to see how different countries’ networks performed during COVID-19 lockdowns.

Customers from the Netherlands roaming in France saw the fastest median roaming download speed in all of Europe during Q1 2021 at 70.46 Mbps. Customers from Germany roaming in Portugal experienced the slowest median roaming download speed during Q3 2020 at 0.42 Mbps.

Here were some of the fastest roaming speeds from select countries to other countries within Europe between Q1 2020 and Q1 2021:

  • Netherlands to France (70.46 Mbps in Q1 2021)
  • Bulgaria to the U.K. (58.21 Mbps in Q4 2020)
  • Netherlands to Poland (55.77 Mbps in Q1 2021)
  • Denmark to Sweden (40.46 Mbps in Q4 2020)
  • Finland to Estonia (48.41 Mbps in Q1 2020)

Here were some of the slowest roaming speeds between Q1 2020 and Q1 2021:

  • Germany to Portugal (0.42 Mbps in Q3 2020)
  • Czechia to France (4.98 Mbps in Q3 2020)
  • France to Portugal (5.54 Mbps in Q3 2020)
  • Hungary to France (5.95 Mbps in Q3 2020)
  • Poland to Belgium (7.59 Mbps in Q1 2020)

We’ll continue to watch roaming speeds over the next year to see how roaming changes as more countries reopen and travel picks up again. If you’re interested in learning more about roaming speeds for your business or country, please click here.

Ookla retains ownership of this article including all of the intellectual property rights, data, content graphs and analysis. This article may not be quoted, reproduced, distributed or published for any commercial purpose without prior consent. Members of the press and others using the findings in this article for non-commercial purposes are welcome to publicly share and link to report information with attribution to Ookla.

| July 27, 2021

Oslo Tops the List of World Capitals with the Fastest 5G in Q1-Q2 2021

Mobile operators are rapidly expanding 5G deployments across the globe, with 16,410 new 5G deployments across 109 countries added to the Ookla 5G Map in June 2021 alone. Huge investments in 5G are being made to increase performance, especially in major cities. We used Speedtest Intelligence® to see which world capitals have the best 5G speeds and availability, based on locations with commercially available 5G during Q1-Q2 2021.

Oslo, Norway was the fastest world capital for 5G during Q1-Q2 2021

ookla_fastest_5g_download_speed_world_capitals_0721

The race for fastest 5G performance among world capitals was extremely competitive during Q1-Q2 2021. Oslo, Norway had the fastest 5G of any world capital, clocking in with a median download speed of 526.74 Mbps. Seoul, South Korea had the second fastest median download speed over 5G at 467.84 Mbps; Abu Dhabi, United Arab Emirates was third (421.26 Mbps); Doha, Qatar fourth (413.40 Mbps) and Stockholm, Sweden fifth (401.30 Mbps). Riyadh, Saudi Arabia (384.66 Mbps); Kuwait City, Kuwait (338.97 Mbps), Muscat, Oman (318.95 Mbps); Beijing, China (291.19 Mbps); and Taipei, Taiwan (287.86 Mbps); rounded out the top 10. Helsinki, Finland showed a median 5G download speed of 279.59 Mbps; Sofia, Bulgaria 260.55 Mbps; Canberra, Australia 258.39 Mbps; Bangkok, Thailand 253.73 Mbps; Manama, Bahrain 249.71; Dublin, Ireland 223.01; Luxembourg City, Luxembourg 209.98 Mbps; Paris, France 208.48 Mbps and Bucharest, Romania 203.44 Mbps.

We saw median 5G download speeds between 150 Mbps and 200 Mbps in the following world capitals during Q1-Q2 2021: Ottawa, Canada (196.11 Mbps); Hanoi, Vietnam (195.99 Mbps); Bratislava, Slovakia (188.23 Mbps); Madrid, Spain (183.37 Mbps); Bern, Switzerland (175.69 Mbps); Rome, Italy (171.79 Mbps); London, United Kingdom (167.50 Mbps); Tokyo, Japan (167.02 Mbps); Athens, Greece (164.95 Mbps); Copenhagen, Denmark (162.75 Mbps); Ljubljana, Slovenia (158.50 Mbps); Hong Kong (153.78) and Washington, D.C., United States (151.80 Mbps).

Cape Town, South Africa was the slowest world capital for 5G in Q1-Q2 2021

ookla_slowest_5g_download_speed_world_capitals_0721

Speedtest Intelligence shows Capetown, South Africa had the slowest median download speed over 5G during Q1-Q2 2021 at 53.33 Mbps. Other world capitals with slower median 5G download speeds included: Brasilia, Brazil (62.18 Mbps); San Juan, Puerto Rico (72.59 Mbps); Warsaw, Poland (80.18 Mbps); Singapore (111.20 Mbps); Manila, Philippines (112.23 Mbps); Prague, Czechia (116.30 Mbps); Budapest, Hungary (137.54 Mbps); Amsterdam, Netherlands (139.75 Mbps); Zagreb, Croatia (140.92 Mbps); Vienna, Austria (144.93 Mbps); Jerusalem, Israel (145.17 Mbps); and Berlin, Germany (148.16 Mbps).

Capitals not mentioned on either of these lists did not have sufficient 5G samples during Q1-Q2 2021 to be included in this report.

The fastest 5G speeds are yet to come

5G is rapidly improving across the world and we’re eager to see how countries, cities and operators continue to perform during Q3 2021 and beyond. If you want to see how your 5G network performs against these benchmarks, please download the Android or iOS app, and take a Speedtest®. Learn more about 5G provider performance in select cities here, and visit the Ookla 5G MapTM to see which providers are offering 5G in your area.

Editor’s note: This article was updated on July 28 to reorganize the content for clarity.

Ookla retains ownership of this article including all of the intellectual property rights, data, content graphs and analysis. This article may not be quoted, reproduced, distributed or published for any commercial purpose without prior consent. Members of the press and others using the findings in this article for non-commercial purposes are welcome to publicly share and link to report information with attribution to Ookla.

| December 6, 2021

Ookla Video Analytics Reveals the State of Global Video Experience


Video is essential to today’s internet across the world. We use it to watch shows and movies, stream live events and even keep up to date on our favorite cats on social media. Ookla® launched video testing in the Speedtest® app for iOS and Android earlier this year so consumers can measure the quality of their video experience. Already, millions of video tests have been initiated by consumers. Today we’re sharing some of that data to provide insight into video experience around the world, specifically, we’ve analyzed adaptive start time and highest overall video resolution over all mobile technologies, 5G and fixed broadband in select countries during Q3 2021.

Switzerland had the fastest adaptive start time for all mobile technologies, South Africa fastest for 5G

Video streaming services use adaptive bitrate technology

All modern video streaming platforms use adaptive bitrate technology to automatically adjust video quality based on network conditions and device capabilities in order to display the highest quality video that a device can support, while minimizing buffering and slow video start time. Speedtest Video Analytics provides deep insights and competitive benchmarking for device and network video streaming capabilities.

Adaptive start time — the time it takes for adaptive bitrate playback to initiate — allows us to see how quickly videos are loading. A 2012 study found that users will leave a video if it doesn’t begin playing within two seconds. We have to imagine in 2021, that timeframe is being squeezed even further. Our analysis shows how countries are performing against this important benchmark.

ookla_adaptive-start-time_all-mobile-tech_1121-01-3

Speedtest Intelligence® reveals that Switzerland had the fastest median adaptive start time for all mobile technologies combined among the countries we analyzed at 1.02 seconds during Q3 2021. South Korea and Norway were close behind at 1.07 seconds and 1.10 seconds, respectively. Five more countries achieved a median adaptive start time at or under 1.25 seconds during Q3 2021, including Hong Kong (SAR) and Croatia (1.17 seconds), Portugal (1.24 seconds), and Kuwait and Mexico (1.25 seconds). All but three of the remaining countries we surveyed achieved a median adaptive start time between 1.25 seconds and 2.00 seconds during Q3 2021 except Colombia (2.11 seconds), Saudi Arabia (2.12 seconds) and India (2.13 seconds).

Most 5G-capable video tests showed blazing fast adaptive start times

ookla_adaptive-start-time_5g_1121-01

We’ve seen median 5G download speeds zoom ahead of traditional mobile technologies, even reaching median download speeds 10 times faster than on 4G LTE. It’s no surprise Video Analytics revealed adaptive start time was often much faster on 5G than on all mobile technologies combined. Five countries achieved median adaptive start times faster than 1.00 second during Q3 2021: South Africa (0.73 seconds), Switzerland (0.79 seconds), Norway (0.82 seconds), Hong Kong (0.86 seconds) and South Korea (0.90 seconds). Video Analytics shows the only countries with a median 5G adaptive start time slower than 1.25 seconds were the United States (1.27 seconds), Brazil (1.42 seconds) and Saudi Arabia (1.94 seconds).

Five countries’ adaptive start time improved more than 0.25 seconds on 5G compared to all technologies combined during Q3 2021: the Philippines (-0.62 seconds), South Africa (-0.53 seconds), Brazil (-0.39 seconds), Hong Kong (-0.31 seconds) and Norway (-0.29 seconds). However, several countries showed a less than 0.20 second improvement when comparing adaptive start rate on 5G to that on all technologies combined during Q3 2021: the U.S. (-0.14 seconds), Bahrain (-0.16 seconds), South Korea and Saudi Arabia (-0.17 seconds), and the United Kingdom (U.K.) and France (-0.18 seconds).

Adaptive start time is not always faster on fixed broadband

ookla_adaptive-start-time_fixed_1121-01-1

Speedtest Intelligence showed a narrower range for adaptive start time on fixed broadband than on 5G with every country on our list achieving between 0.67 and 1.85 seconds during Q3 2021. Ten countries on our list achieved a median adaptive start time faster than 1.00 second during Q3 2021: South Korea (0.67 seconds), Norway (0.74 seconds), Hong Kong (0.75 seconds), Switzerland (0.76 seconds), the U.K. (0.79 seconds), France (0.86 seconds), the U.S. (0.87 seconds), Spain (0.88 seconds), Portugal (0.89 seconds) and Italy (0.98 seconds).

Twenty out of the 24 countries we surveyed had a median fixed broadband adaptive start time faster than 1.50 seconds during Q3 2021. Colombia (1.50 seconds), Egypt (1.59 seconds), Turkey (1.64 seconds) and Saudi Arabia (1.85 seconds) were the only countries with a median adaptive start time slower than 1.50 seconds on fixed broadband during Q3 2021.

South Korea video tests reached 4K resolutions at the highest proportion on mobile and fixed broadband

Video resolution is incredibly important in the experience of streaming video and the higher the resolution, the more definition and clarity we are able to see. These days, the difference between an SD and 4K experience is gigantic. Resolution is measured in the numbers of pixels in a 16:9 ratio, with 2160 pixel height representing a 4K picture. Video Analytics measures the resolution rates, which represent the portion of samples that reach a particular resolution. In this analysis, we evaluated the resolution rates for 4K, typically the highest resolution users will need.

ookla_highest-video-resolution_all-mobile-tech_1121-01

Using Speedtest Intelligence, we found South Korea and Switzerland had the highest overall successful resolution rates for all mobile technologies combined during Q3 2021, reaching 4K resolutions 80.4% and 80.3% of the time, respectively. Croatia (79.7%), Kuwait (77.4%) and Norway (75.4%) were the only other countries on our list that achieved 4K video resolution more than 75.0% of the time. Only seven countries on our list did not reach a 4K resolution at least 50% of the time on all mobile technologies combined: the Philippines (38.4%), India (41.1%), Indonesia (44.8%), Colombia (45.3%), Mexico (46.3%), Russia (49.7%) and Egypt (49.9%).

5G led to higher video resolution, but 4K mobile devices still remain rare

ookla_highest-video-resolution_5g_1121-01

5G provided a higher resolution for mobile devices during Q3 2021 than all technologies combined. Every country we surveyed reached a 4K resolution over 80.0% of the time over 5G. In fact, six out of the 14 countries we surveyed for 5G achieved a 4K resolution more than 90.0% of the time, including South Korea (95.9%), Norway (94.5%), Kuwait (94.0%), South Africa (93.6%), Switzerland (92.6%) and France (91.5%). On the lower end of our list, only Italy (81.9%), Brazil (83.9%) and the U.S. (83.9%) achieved 4K resolutions less than 85.0% of the time.

While this is great news for the future of mobile devices, 4K resolutions in mobile devices still aren’t common: Sony is the only popular device manufacturer producing 4K mobile devices. In the meantime, users who can connect to 5G through either a hot spot or fixed wireless access (FWA) will reap the benefits of being able to stream on 4K devices like computers, televisions or tablets.

South Korean fixed broadband delivers ultra-high definition resolutions

ookla_highest-video-resolution_fixed_1121-01

Speedtest Intelligence reveals South Korea had the highest fixed broadband 4K resolution rate among countries surveyed at 92.2% during Q3 2021. Other countries that achieved 4K resolution rates above 85.0% on fixed broadband during Q3 2021 included: Switzerland (89.4%), Hong Kong (87.6%), Norway (87.1%) and the U.S. (86.7%). Every other country in our analysis achieved 4K resolution rates between 65.0% and 85.0%, except Egypt (49.5%), Indonesia (52.5%), the Philippines (64.2%) and Turkey (64.3%).

Video Analytics gives you the information you need about your video playback

We’re excited to share more about video performance and quality of experience using Video Analytics in the coming months. In the meantime, if you want to learn more about Video Analytics and how it can help you benchmark and improve your network, please join our upcoming webinar, December 9 by clicking here.

Ookla retains ownership of this article including all of the intellectual property rights, data, content graphs and analysis. This article may not be quoted, reproduced, distributed or published for any commercial purpose without prior consent. Members of the press and others using the findings in this article for non-commercial purposes are welcome to publicly share and link to report information with attribution to Ookla.

| March 27, 2023

Early Testing Shows How Fast the New Samsung Galaxy S23 Models Are

The new Samsung Galaxy S23, S23+, and S23 Ultra models launched February 17 and Ookla® is here today to see how they’ve performed over 5G against their predecessor S22 models. Our analysis looks at data from the first month after launching in 12 of the largest mobile markets with an established 5G market and the highest number of connected mobile devices during Q4 2022 according to GSMA. Previously, in October 2022, we used Speedtest Intelligence® to look at 5G performance data right after the launches of the iPhone 14 and Samsung Galaxy Z Fold4 in various countries

Note that device data differs across markets due to a variety of factors, including: 5G investments by governments and mobile operators, different 5G spectrum allocations by operator, 5G Availability, the number of and different kinds of 5G deployments, and other differences, including mobile 5G plans. Read on to learn more and see whether or not you should upgrade your Samsung S22 to a newer model.

Key takeaways:

  • The Samsung S23 models only statistically outperformed corresponding S22 models in Germany and two out of three models in the United States for 5G download speed, but the S23 looks poised to be faster as further 5G adoption and build out continues and more spectrum is allocated for 5G across the C-band and mmWave frequencies.

Key improvements to the new Galaxy S23 models

You want to know if the latest technology is worth the price of an upgrade when you’re looking for a new phone. The S23, S23+, and S23 Ultra have various upgrades, but when it comes to performance, here’s a quick list of what’s different between the new and older models. 

All Samsung Galaxy S23 vs. S22 models

  • The Samsung S23 models have a Qualcomm Snapdragon 8 Gen 2, while the Samsung S22 models have a Samsung Snapdragon 8 Gen 1
  • The S23 models have a Qualcomm Snapdragon X70 modem, while the S22 models have an X65 modem
  • The S23 models have an upgraded GPU

Samsung Galaxy S23 vs. S22 base models

  • The S23 has a bigger battery capacity at 3,900 mAh over the S22’s 3,700 mAh
  • The S23 has slightly better ultra-wide and front cameras and video recording capabilities

Samsung Galaxy S23+ vs. S22+ models

  • The S23+ has expanded storage capacity at a base level of 256 GB (which can be upgraded to 512 GB) over the S22+’s base of 128 GB
  • The S23+ has a bigger battery capacity at 4,700 mAh over the S22+’s 4,500 mAh
  • The S23+ has slightly better ultra-wide and front cameras and video recording capabilities

Samsung Galaxy S23 Ultra vs. S22 Ultra models

  • The S23 Ultra has expanded storage capacity at a base level of 256 GB (which can be upgraded to 512 GB) over the S22 Ultra’s base of 128 GB
  • The S23 Ultra has much better main camera, with up to 200 MP vs. the S22 Ultra’s maximum of 108 MP

Samsung Galaxy S23 performance in the world’s largest mobile device markets

Brazilian S22 and S23 users saw seriously fast 5G speeds (even though 5G Availability remains low)

Chart of Samsung Galaxy S23 vs. S22 5G Performance in Brazil

Speedtest Intelligence shows that the new S23 models were not yet statistically faster than the older S22 models in Brazil during the first month of launch, but they did exceed the median 5G download speed in Brazil during Q4 2022. Despite that, every S22 and S23 model had blazing fast speeds in Brazil, with median 5G download speeds faster than 400 Mbps. The S22 had a median download speed of 431.61 Mbps, the S22 Ultra was at 451.01 Mbps, and the S22+ at 451.85 Mbps. While the S23 models were not statistically faster than their S22 counterparts, the S23 had a median download speed of 459.76 Mbps, the S23 Ultra at 479.78 Mbps, and the S23+ at 494.18 Mbps. 5G upload speeds showed a similar trend, with no statistically faster S22 or S23 model, but with S22 models ranging from 35.73 Mbps to 39.42 Mbps and S23 models ranging from 39.30 Mbps to 42.59 Mbps. Multi-server latency — the latency you should expect to encounter more generally when your network is not under heavy load — ranged from 28.01 ms to 31.78 ms across all models over 5G.

Recommendation: Brazilian Galaxy S22 users should consider upgrading your phone if you can get 5G access; you’re going to get fast speeds and the new features of the S23, especially the camera of the S23 Ultra, may be worth it alone.

Chinese S23 users haven’t quite seen an improved 5G experience over S22 users

Chart of Samsung Galaxy S23 vs. S22 5G Performance in China

Data from the first month since the Samsung S23 launching illuminates that S23 models did not statistically outperform S22 models over 5G in China, and S23 models also didn’t quite exceed the Q4 2022 median 5G download speed. The S22 had a median 5G download speed of 267.47 Mbps, the S22 Ultra was similar at 265.65 Mbps, and the S22+ was at 301.41 Mbps. The S23 showed a median 5G download speed at 242.70 Mbps, while the S23 Ultra had a median download speed of 269.86 Mbps. 5G upload speeds on S22 models ranged from 48.40 Mbps to 62.93 Mbps, while the S23 and S23 Ultra were at 50.77 Mbps and 42.65 Mbps, respectively. While the S23 models showed lower median multi-server latency over 5G, there was no statistical winner between the S22 and S23 models. The S23+ did not meet the statistical threshold for inclusion in our analysis in China. 

Recommendation: Chinese Galaxy S22 users should wait to upgrade your phone until speeds improve, unless the new S23 model hardware upgrades have you wanting a new phone.

French S23 users saw promising 5G results, S22 users might want to wait to upgrade

Chart of Samsung Galaxy S23 vs. S22 5G Performance in France

There was no statistically faster Samsung Galaxy S22 or S23 model over 5G in France during the first month of the S23’s release. However, median 5G download speeds for the S22 models ranged from 177.98 Mbps to 219.32 Mbps, while the S23 models ranged from 196.53 to 249.46 Mbps. 5G upload speeds showed a similar story, with no statistical winner. Upload speeds on S22 models ranged from 11.46 Mbps to 14.15 Mbps, and upload speeds on S23 models ranged from 14.89 Mbps to 19.22 Mbps. 5G multi-server latency was virtually the same for both models, which all ranged from 41.40 ms to 43.24 ms.

Recommendation: French Galaxy S22 users who want faster speeds might want to wait to upgrade your phone, but the new features of the S23 may make upgrading very tempting.

German Samsung Galaxy S22 users should feel confident upgrading to S23 models

Chart of Samsung Galaxy S23 vs. S22 5G Performance in Germany

Speedtest Intelligence reveals that German S23 users experienced faster 5G download speeds than their S22 counterparts during the first month of S23 availability across all models. The S23 outperformed the S22 for median 5G download speed, 147.26 Mbps to 112.01 Mbps, the S23 Ultra outperformed the S22 Ultra 141.56 Mbps to 124.45 Mbps, and the S23+ outperformed the S22+ 174.74 Mbps to 128.69 Mbps. Upload speeds had a bit more parity with the S22 models showing a range of 5G upload speeds from 20.47 Mbps to 26.10 Mbps, while the S23 models showed a range from 23.59 Mbps to 31.64 Mbps. Multi-server latency over 5G showed no statistical winner for either model but ranged from 36.76 ms to 38.58 ms.

Recommendation: Germany Galaxy S22 users shouldn’t hesitate to run to your operator to immediately upgrade your phone to an S23 model for faster speeds and better features.

Samsung Galaxy S23 users in Italy saw mixed 5G results after launch

Chart of Samsung Galaxy S23 vs. S22 5G Performance in Italy

New Speedtest Intelligence data reveals that while the basic S23 model outperformed the S22 model over 5G in Italy for median download speed 178.67 Mbps to 128.53 Mbps during the first month after launch, the S23 Ultra and S23+ models didn’t statistically outperform their S22 counterparts. That held true for upload speeds as well, with the S23 recording a median 5G upload speed of 21.73 Mbps to the S22’s 15.50 Mbps, while the S23 Ultra and S23+ weren’t statistically faster than the S22 Ultra and S22+, respectively. All of the S23 and S22 models during the first month of the S23 launch, except the S22 base model, were statistically faster than the 5G median download speed in Italy during Q4 2022. Median multi-server latency showed closer parity, with S22 models ranging from 45.02 ms to 47.79 ms, and S23 models ranging from 43.50 ms to 48.24 ms.

Recommendation: Unless you want a basic Galaxy S23 model and have consistent 5G access in Italy, you might want to wait to upgrade your phone to the S23 models unless you really want the new features.

Samsung Galaxy S23 showed 5G potential in the Philippines

Chart of Samsung Galaxy S23 vs. S22 5G Performance in Philippines

Fresh data from Speedtest Intelligence shows that while the S23 and S23+ had faster median 5G download speeds than their S22 counterparts during the first month of the S23’s launch, there were no statistical winners between the models in the Philippines. The S23 models’ median 5G download speeds ranged from 142.31 Mbps to 185.32 Mbps, while the S22 models ranged from 131.87 Mbps to 143.57 Mbps. Median 5G upload speed for the S23 Ultra was faster than its S22 Ultra counterparts at 15.46 Mbps to 12.68 Mbps, respectively. There were no statistical winners for median multi-server latency over 5G, though the S22 models ranged from 35.42 ms to 38.39 ms, while the S23 models ranged from 34.29 ms to 35.31 ms.

Recommendation: Filippino Galaxy S22 users should upgrade their phones to the S23 models if they want new features, but shouldn’t expect faster speeds and a better experience quite yet.

Polish Samsung S23 models had a promising debut over 5G

Chart of Samsung Galaxy S23 vs. S22 5G Performance in Poland

Speedtest Intelligence data shows Poland had some of the slowest median 5G download speeds on Samsung S23 and S22 models among the countries we surveyed. While the new S23 models had a higher median 5G download speed than their counterparts during the first month after launching, there were no statistically significant faster speeds. The S23 models ranged from 83.74 Mbps to 98.99 Mbps, while the S22 models ranged from 75.70 Mbps to 80.43 Mbps. Upload speeds were similarly faster, but not statistically so, with S22 models ranging from 16.89 Mbps to 19.62 Mbps and S23 models ranging from 19.94 Mbps to 24.25 Mbps. Median multi-server latency over 5G was a mixed bag, with the new S23+ actually having a higher latency than the S22+ 44.25 ms to 38.37 ms, respectively. The other two models were too close to call.

Recommendation: Polish Galaxy S22 users can upgrade their phones to the S23 models for the new features, but might not yet experience faster 5G speeds on the new models.

Samsung S23 models in South Africa don’t live up to the hype just yet

Chart of Samsung Galaxy S23 vs. S22 5G Performance in South Africa

Speedtest Intelligence reveals that the new S23 models weren’t yet statistically faster than their S22 counterparts over 5G in South Africa during the first month after launch. S22 models had median 5G download speeds that ranged from 172.07 Mbps to 206.03 Mbps, while the S23 models ranged from 187.62 Mbps to 202.10 Mbps. There was one bright note — the median 5G upload speed for the S23 Ultra was faster than the S22 Ultra 20.43 Mbps to 14.75 Mbps. Median multi-server latency showed parity over 5G for the S22 models and S23 models. The S22 models ranged from 29.06 ms to 33.75 ms, while the S23 models ranged from 31.41 ms to 32.92 ms.

Recommendation: South African Galaxy S22 users should probably wait to upgrade their phones to the S23 models if they are looking for faster 5G experience, but the S23 features may outweigh the parity in speeds between models.

South Koreans saw fast 5G speeds on the new Samsung Galaxy S23 models

Chart of Samsung Galaxy S23 vs. S22 5G Performance in South Korea

Home to Samsung, South Korea showed some of the fastest 5G speeds on our list. Every S23 model had a faster median 5G download speed than the corresponding S22 models, but statistical winners remained elusive during the first month after launch, which we expect will probably change upon more adoption in the near future. S22 models recorded median 5G download speeds between 418.57 Mbps and 537.28 Mbps, while the S23 models ranged from 503.99 Mbps and 584.08 Mbps. Upload speeds were similarly impressive — though with no statistically faster median 5G upload speeds than another — with S22 models ranging from 37.76 Mbps to 51.66 Mbps over 5G, and S23 models ranging from 47.51 Mbps to 57.62 Mbps. Median multi-server latency over 5G showed ranges from 65.00 ms to 69.81 ms for the S22 models, and a range of 66.13 ms to 68.15 ms for the S23 models.

Recommendation: If you’re a South Korean Galaxy S22 user, you can probably expect slightly faster speeds if you upgrade to the new S23 models, but an upgrade for the new features, especially for the new S23 Ultra camera, might be more justified.

Thai Samsung Galaxy S22 and S23 users saw faster 5G speeds than the median average during Q4 2022

Chart of Samsung Galaxy S23 vs. S22 5G Performance in Thailand

Speedtest Intelligence shows that the Samsung Galaxy S23 Ultra was the only S23 model to achieve faster median 5G speeds than its predecessor in Thailand during the first month after launching. The S23 Ultra outperformed the S22 Ultra 222.21 Mbps to 198.74 Mbps over 5G for download speed and 33.57 Mbps to 30.10 Mbps for upload speed, respectively. The S23 and S23+ were not statistically faster, though the S23+ and S23 had median 5G download speeds of 202.64 Mbps and 229.56 Mbps, respectively. Median 5G multi-server latency showed close parity with the S22 ranging from 31.06 ms to 32.34 ms and the S23 ranging from 30.40 ms to 34.14 ms.

Recommendation: Thai Galaxy S22 Ultra users should feel confident in upgrading your phones to the S23 Ultra, especially for the new features. If you are a S22 and S22+ 5G user, you should absolutely consider upgrading, but might not yet see faster speeds.

Samsung Galaxy S23 results showed potential in the United Kingdom, but you still may want to wait to upgrade

Chart of Samsung Galaxy S23 vs. S22 5G Performance in United Kingdom

New 5G data from the U.K. reveals that while the new Samsung Galaxy S23 models have higher median download speeds, the S23 models are not statistically faster than the S22 models. The S22 models had median 5G download speeds that ranged from 113.18 Mbps to 129.16 Mbps, and the S23 models ranged from 123.57 Mbps to 137.20 Mbps. 5G download speeds in the U.K. weren’t the slowest we saw among the countries we surveyed, but they were quite close to Poland’s bottom-tier results. The S23 Ultra was one stand-out performer, which had a faster median 5G upload speed than the S22 Ultra at 15.36 Mbps to 13.07 Mbps, though the other models weren’t significantly faster, but came close. Median multi-server latency over 5G was too statistically close to call, with the S22 models between 43.04 ms and 45.09 ms, and the S23 models between 41.77 ms and 46.63 ms. 

Recommendation: U.K. Samsung Galaxy S22 users should wait to upgrade their phones to the S23 models unless you’re dying for the S23’s new features. But don’t expect faster results quite yet, especially as the U.K. continues to lag behind other more mature 5G markets around the world.

If you have 5G and a Samsung Galaxy S22 in the United States, don’t hesitate to upgrade to an S23 model

Chart of Samsung Galaxy S23 vs. S22 5G Performance in United States

New data from Speedtest Intelligence reveals that during the first month of the Samsung Galaxy S23 series’ availability, the S23 and S23 Ultra outperformed the S22 and S22 Ultra for 5G download speeds, respectively, while the S23+ and S22+ were statistically too close to call. The S23 raced ahead of the S22 177.15 Mbps to 145.91 Mbps, and the S23 Ultra was faster than the S22 Ultra at 187.83 Mbps to 161.87 Mbps. All of the S22 and S23 models outperformed the median 5G download speed in the U.S. during Q4 2022. The Samsung S23 Ultra was the only S23 model to statistically outperform its counterpart for median 5G upload speeds, with an upload speed of 17.56 Mbps to 14.60 Mbps. The S23 and S23+ were too close to call. Looking at median multi-server latency over 5G, the S23 Ultra edged ahead of its S22 Ultra counterpart 50.44 ms to 51.52, while the other S23 didn’t have a statistical leg up. 

Recommendation: U.S. Samsung Galaxy S22 users shouldn’t hesitate to upgrade to the S23 models, especially for the new features and hardware — particularly if you want the S23 Ultra’s 200 MP camera. With 5G networks increasingly getting faster, we suspect the S23 models have yet to see their full potential in the U.S., too.

The Speedtest® Android app can help benchmark your device’s 5G performance

After promising launches that have seen the Samsung Galaxy S23 models pull ever-so-slightly ahead in the U.S. and Germany, you can track how the Samsung Galaxy S23 performs on our next release of Ookla Market Reports™. If you recently upgraded your phone, be sure to download the Android Speedtest app to make sure you are getting the speeds you need along with access to video testing. We’ll be back throughout the year with fresh data on new phone launches, so if you’re considering upgrading your phone, be on the lookout for a new Ookla® device report.

Ookla retains ownership of this article including all of the intellectual property rights, data, content graphs and analysis. This article may not be quoted, reproduced, distributed or published for any commercial purpose without prior consent. Members of the press and others using the findings in this article for non-commercial purposes are welcome to publicly share and link to report information with attribution to Ookla.