| November 1, 2023

Plan, Optimize, and Monitor Your 5G Network with QoS and QoE Data

5G is a critical technology for the future of mobile communications. To meet the growing demand for mobile data and to enable innovative applications, mobile network operators are expanding 5G networks around the world. As operators face economic challenges with inflation and constrained Capex budgets, the optimization of existing infrastructure and cost-effective investments is essential. Having access to good quality data can help them make informed decisions on how best to allocate resources. Crowdsourced data needs to be a part of the 5G network strategy because it provides operators with a real-time view of their 5G network performance and coverage, as well as insights into how users are experiencing the network. 

Operators can use QoS (Quality of Service) and QoE (Quality of Experience) metrics to plan, monitor, and optimize 5G network performance. In this article we will look at an example of how an operator in Bangkok, Thailand has used Ookla’s QoS and QoE data over the past two years. 

Planning where to add 5G SA cell sites or deploy 5G NSA 

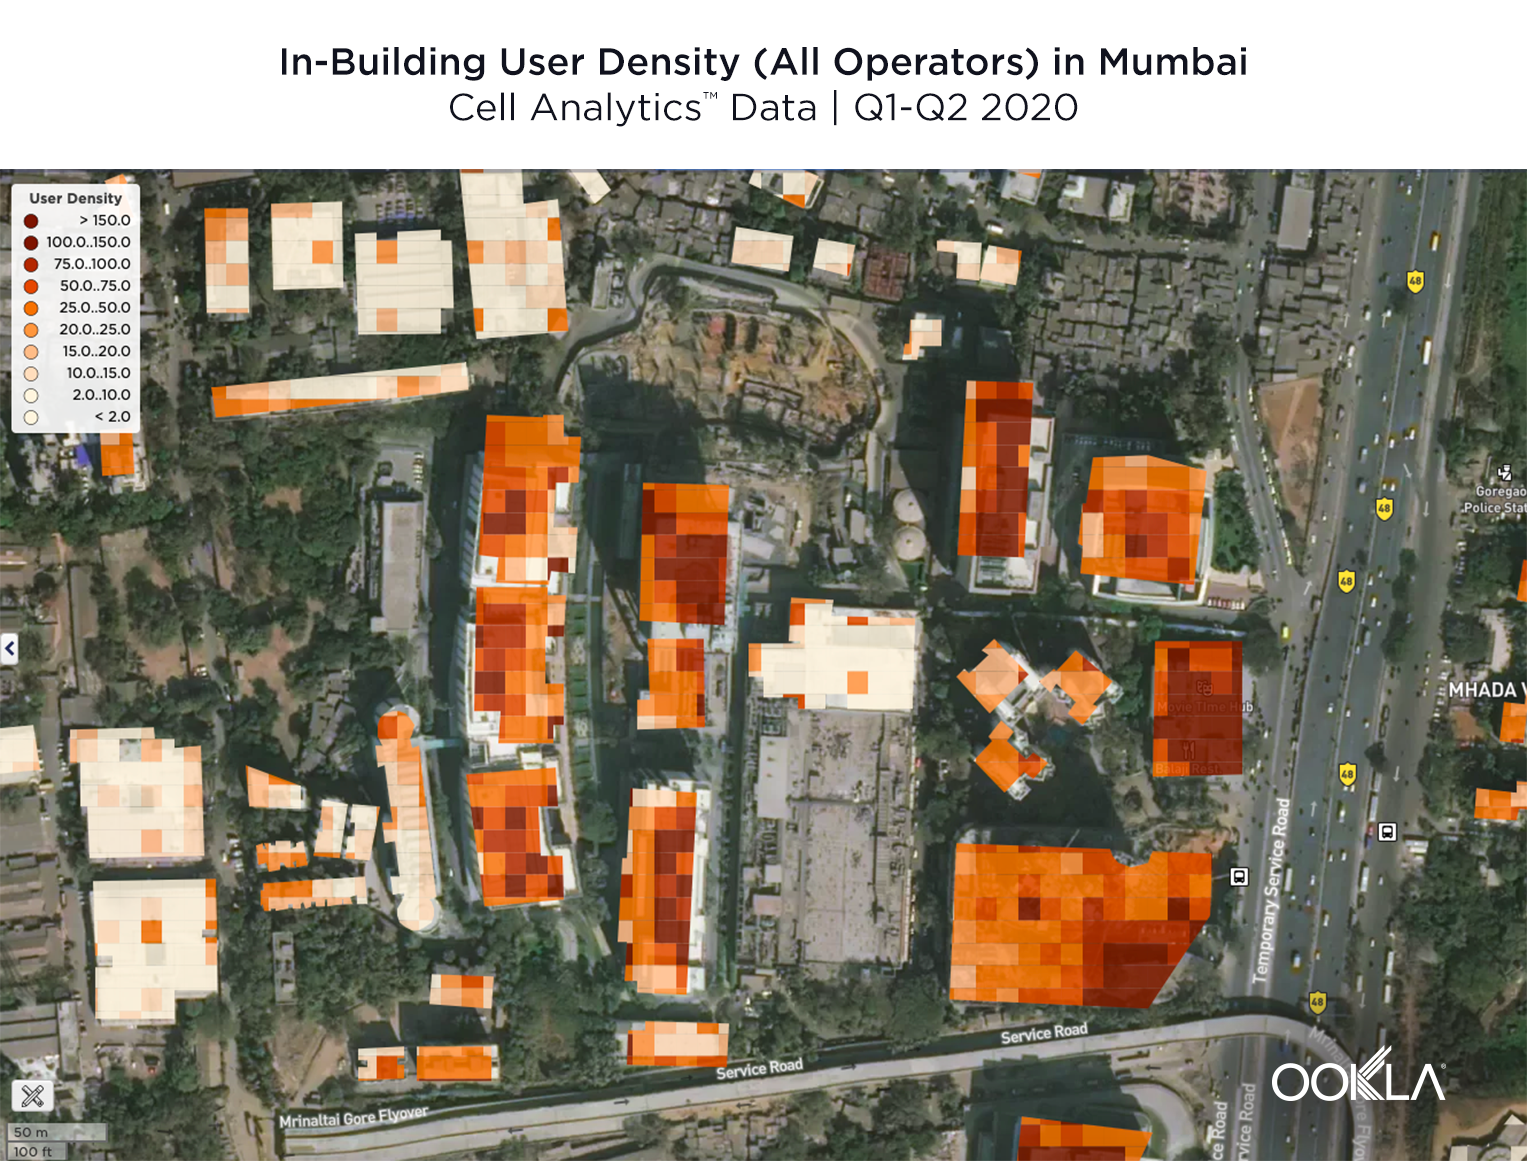
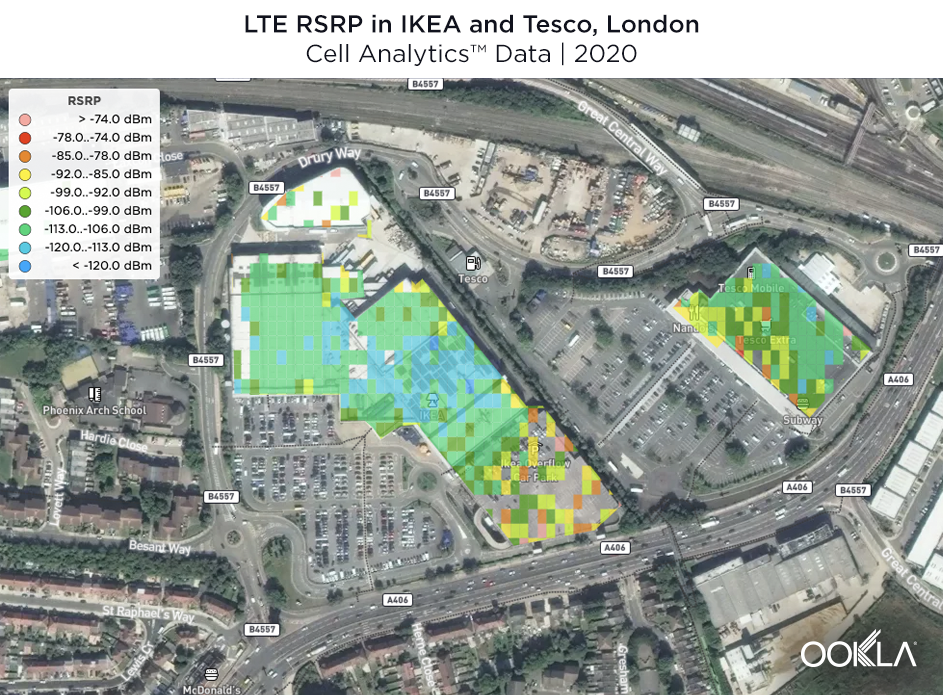
QoS and QoE data can help operators understand whether to add 5G standalone (SA) cell sites or deploy 5G non-standalone (NSA) on existing 4G cell sites. Using Ookla Cell AnalyticsTM, operators can find out where they have poor coverage and performance with existing cell sites, so that they can prioritize additional cell sites in areas that need the most improvement. 

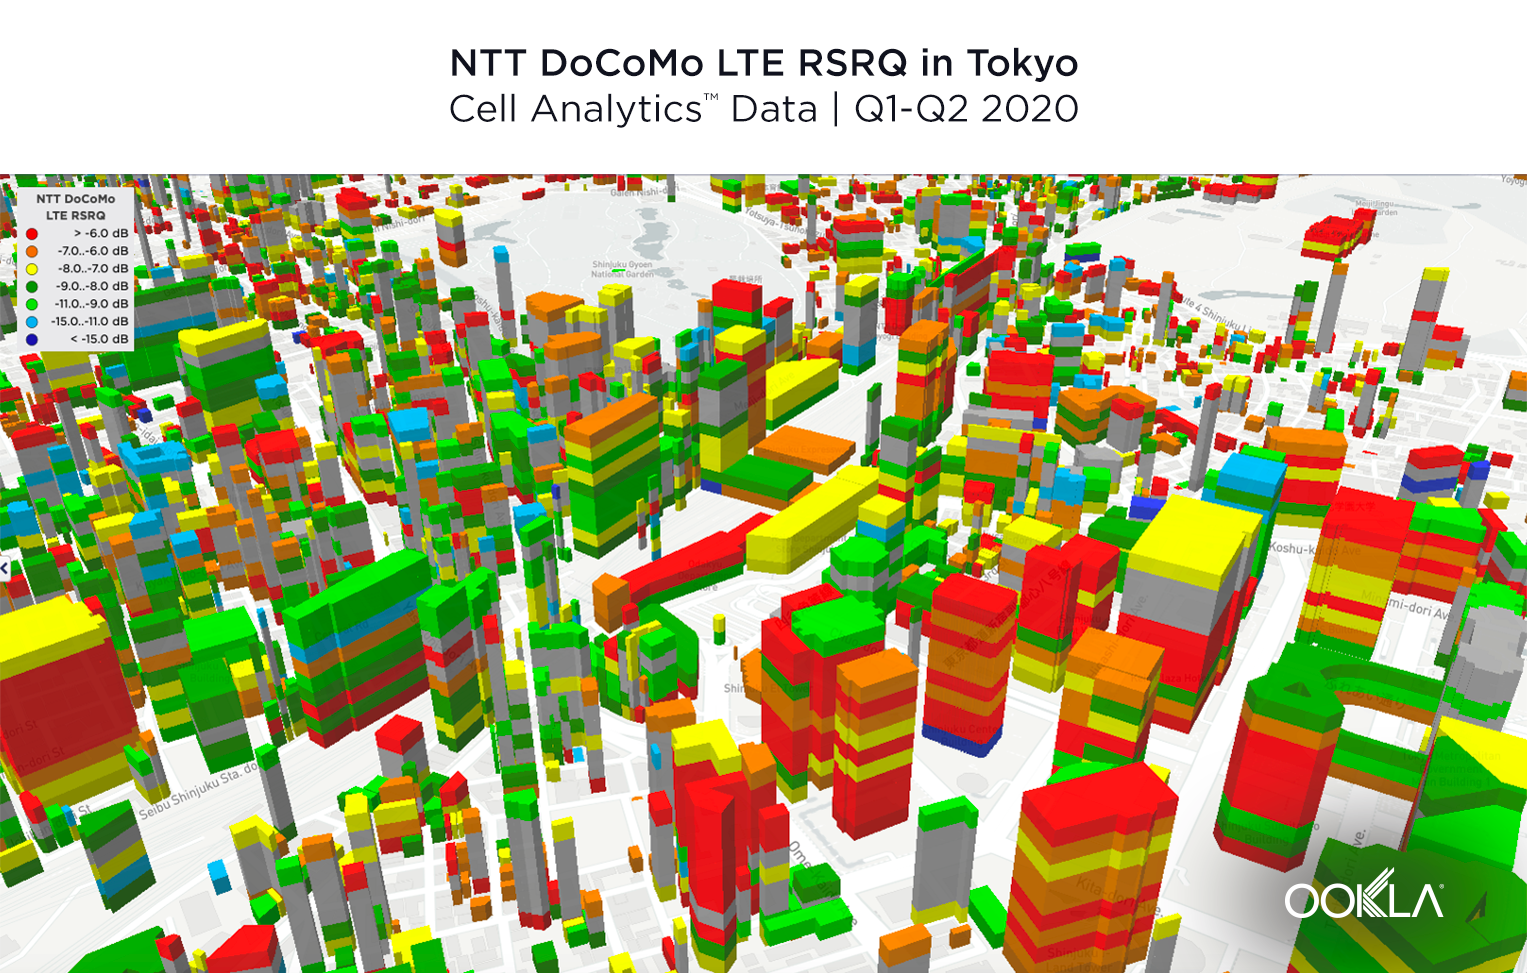
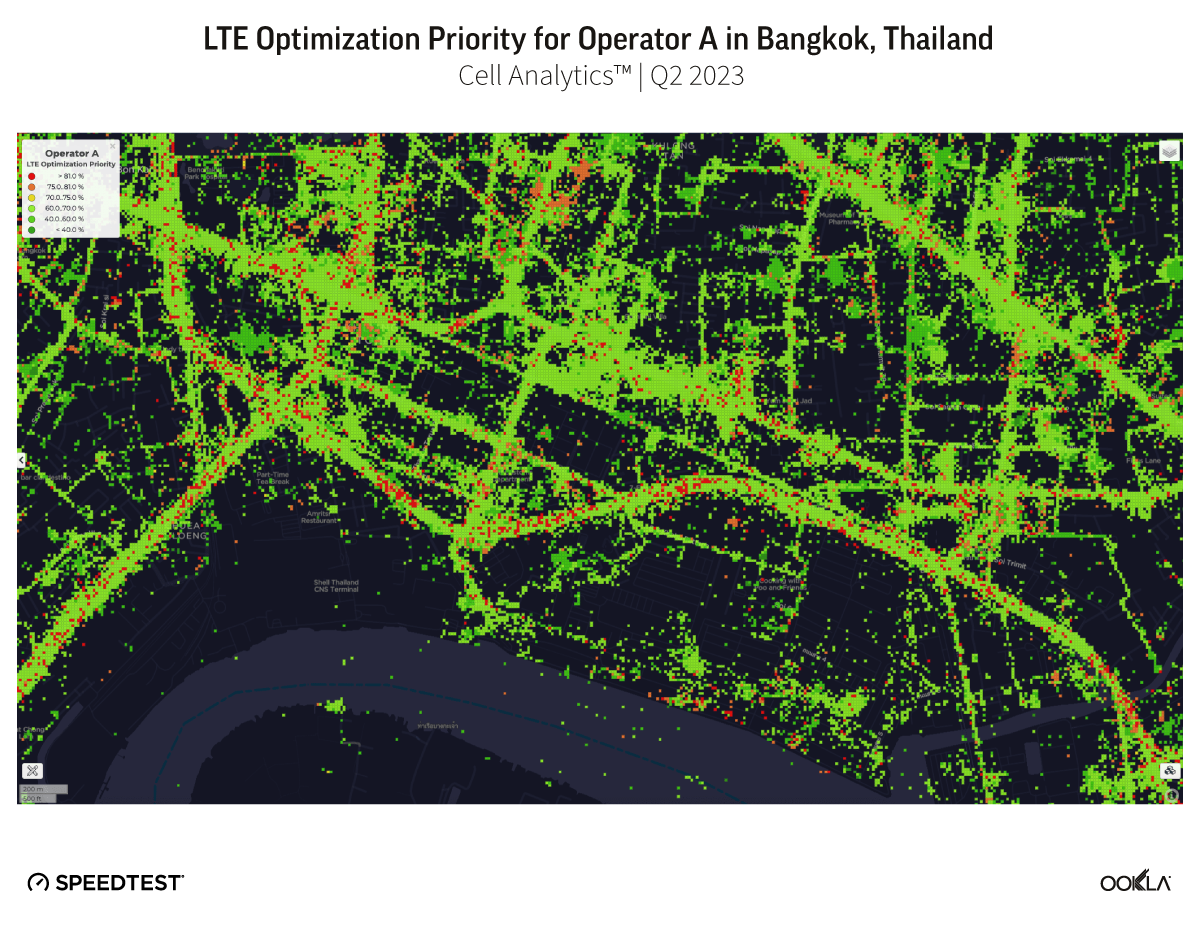
As 5G replaces 4G LTE footprints, operators need to understand existing LTE network performance. LTE optimization priority is a KPI that can help operators identify where optimization is needed by showing areas that have good LTE signal level and poor signal quality. A high percentage indicates that optimization is most urgently needed, and a low percentage indicates that no optimization is needed. 

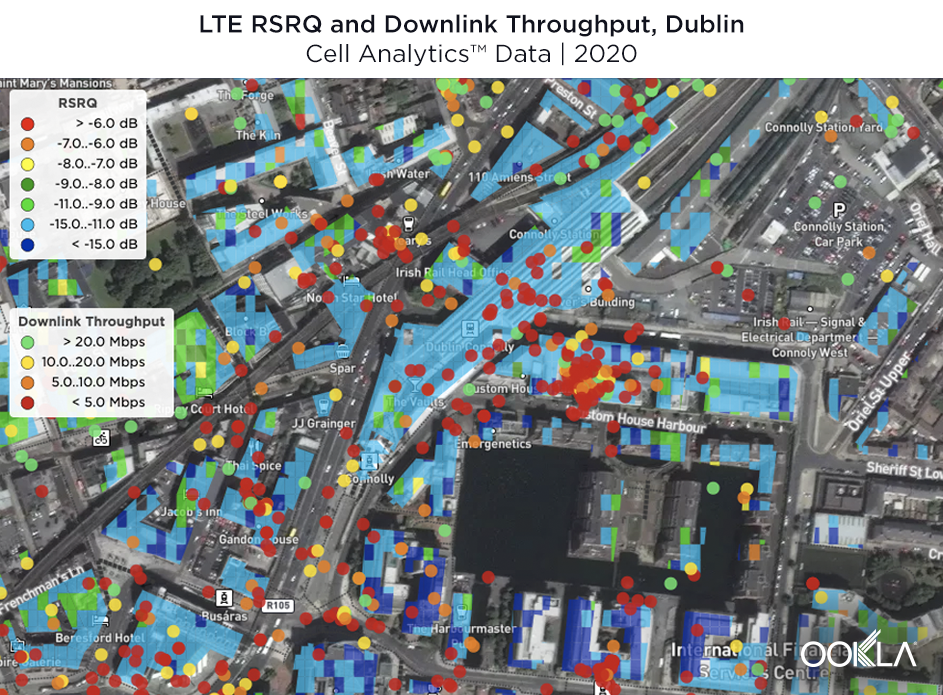
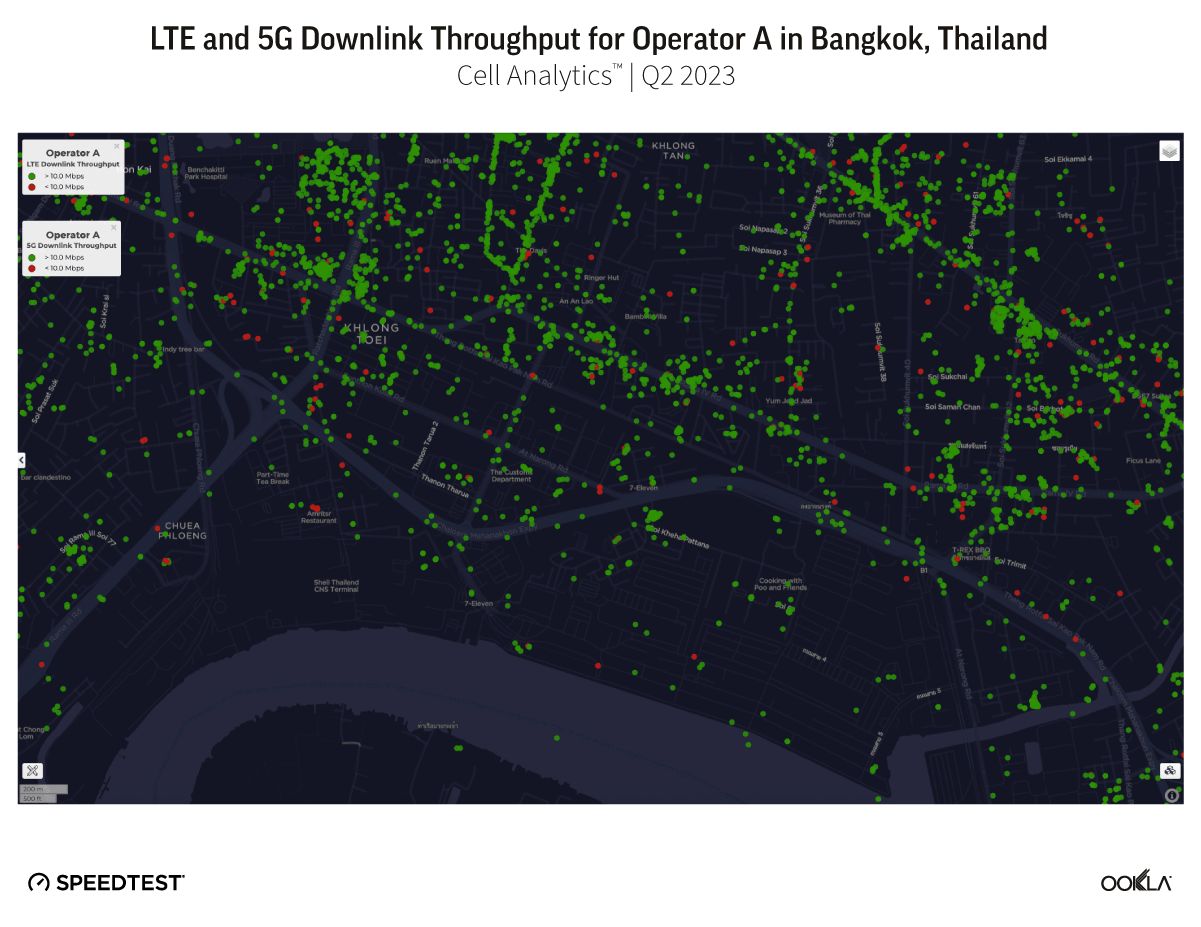
Looking at data from late 2021, we can see areas with high optimization priority (shown by the red bins in the first image), and network performance test results that indicate low LTE downlink throughput and low 5G downlink throughput (shown by the red dots in the second image). 

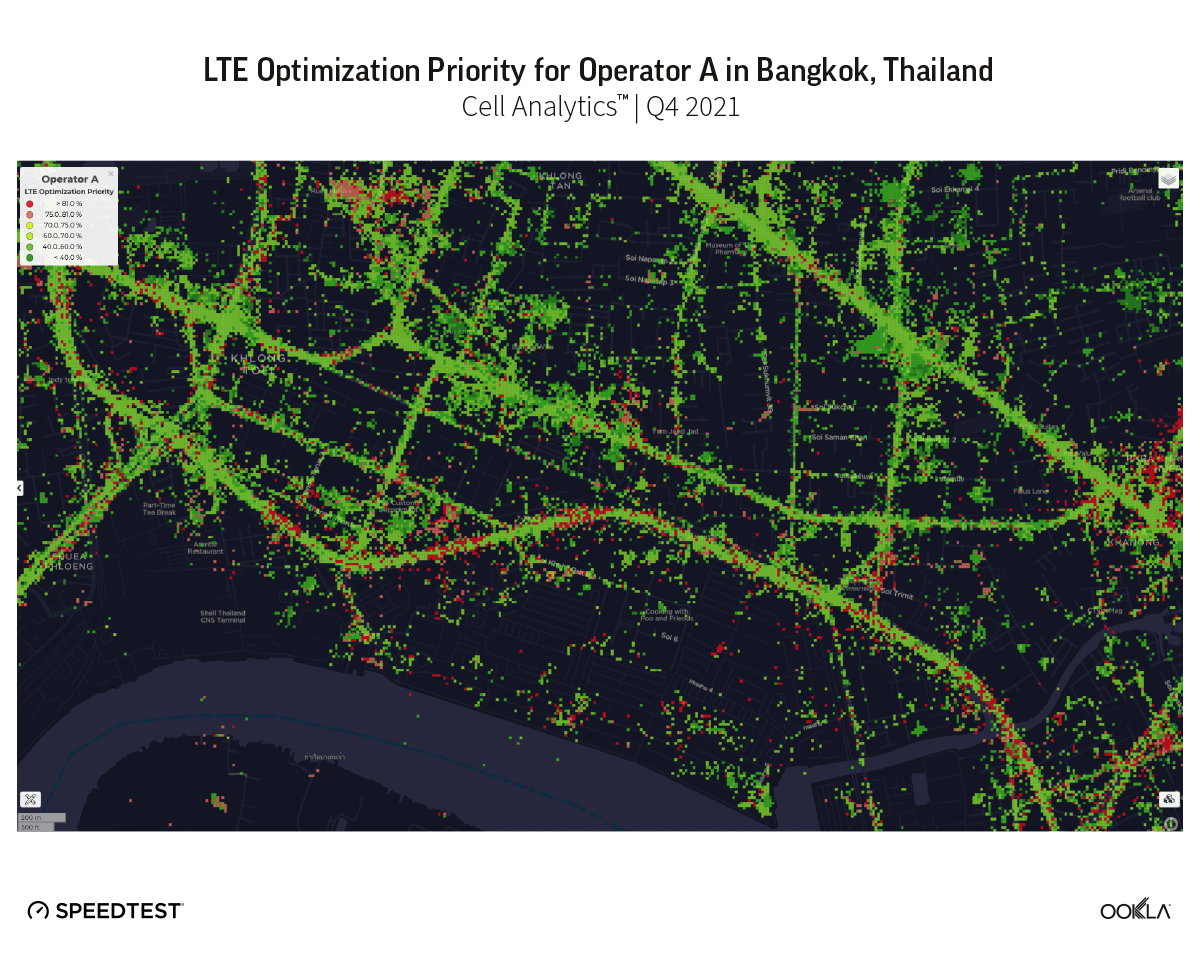
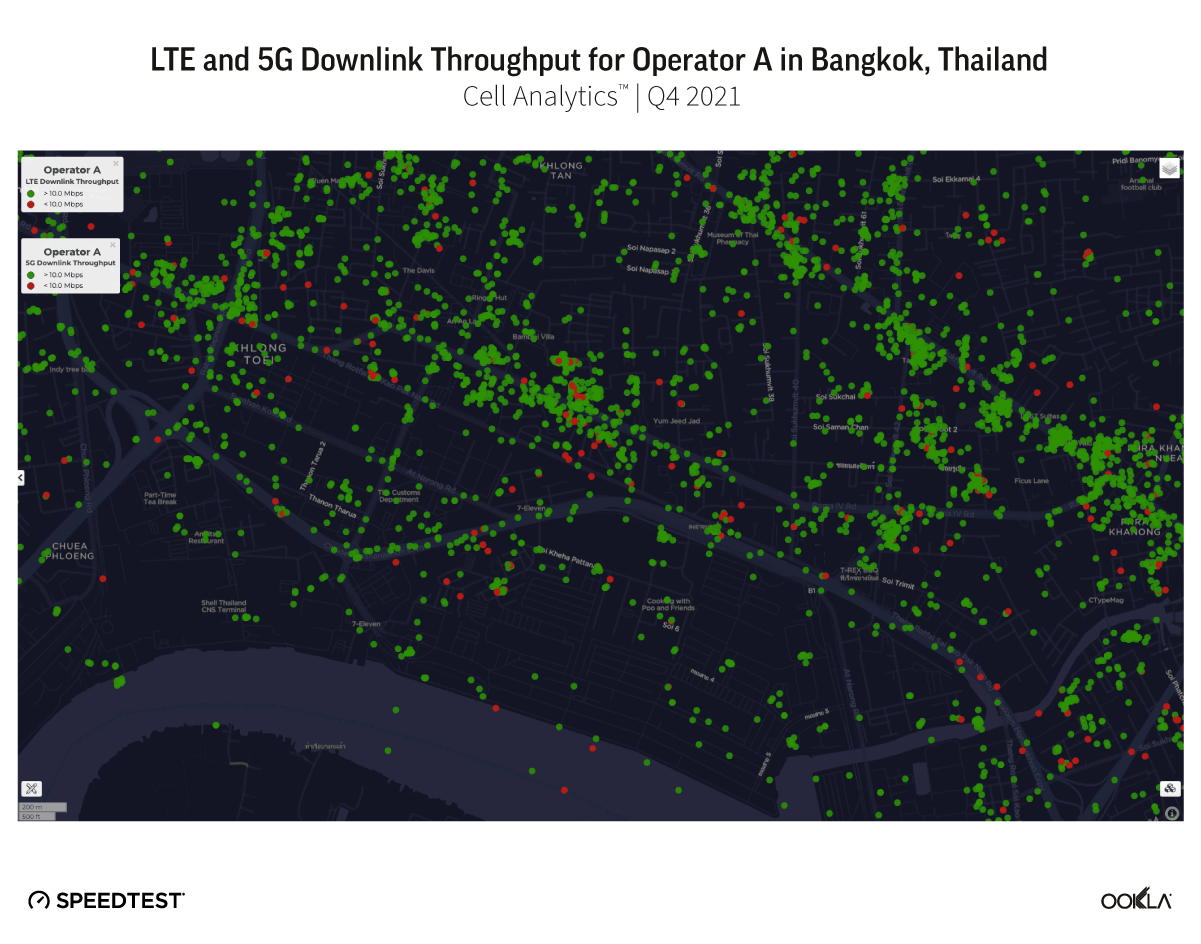
Operator A was able to visualize the areas with high optimization priority and low download speeds on LTE and 5G, indicating that those areas have good coverage but bad quality, and should be prioritized for adding new 5G sites.

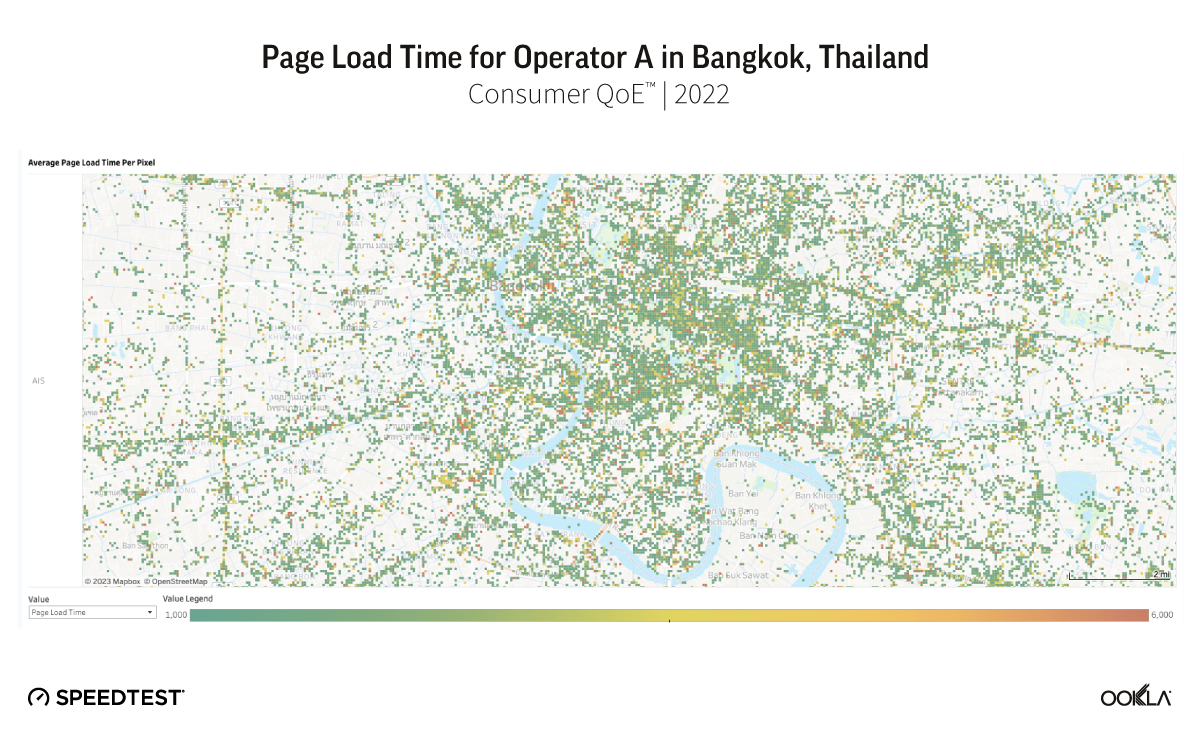
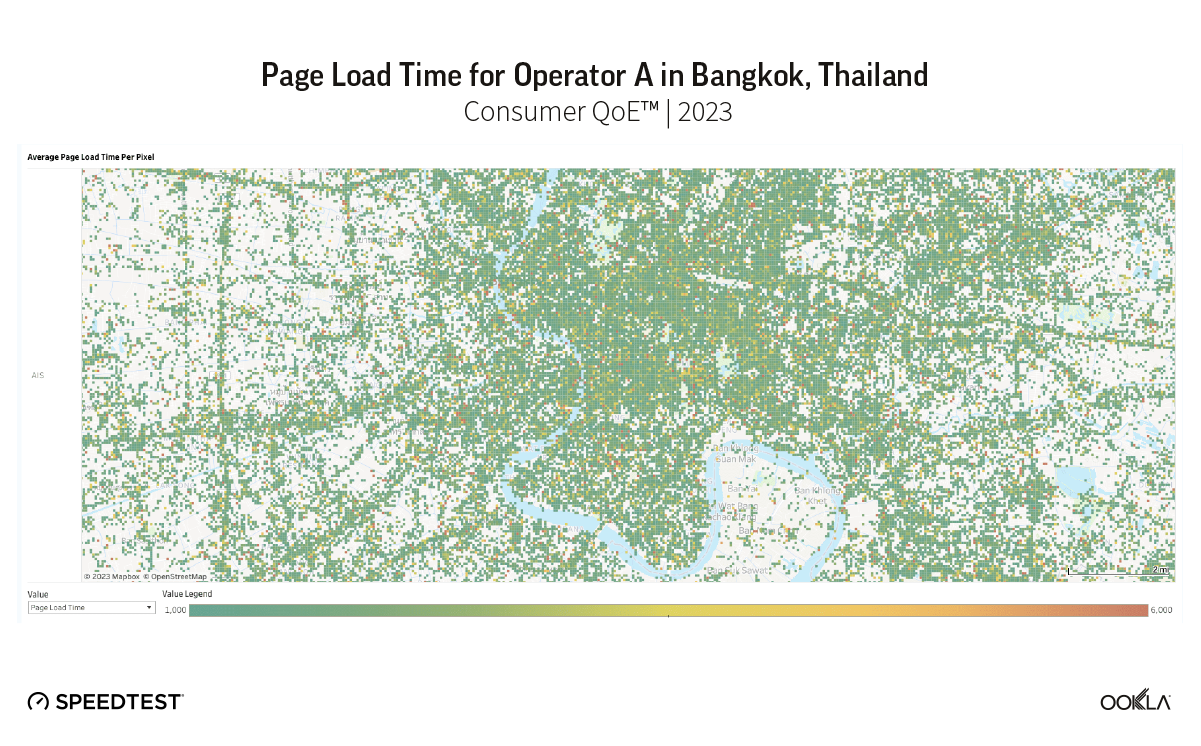
Operators can also use Consumer QoETM to understand where they have poor user experience and where a new 5G cell site would have the most impact on QoE metrics such as web page load time for web browsing. Customers expect to have good connectivity on the go, so slow page load time for web browsing leads to poor customer experience. 

Looking at data from 2022, Operator A was able to see on a map where web pages were taking the most time to load on customer devices (shown in red). 

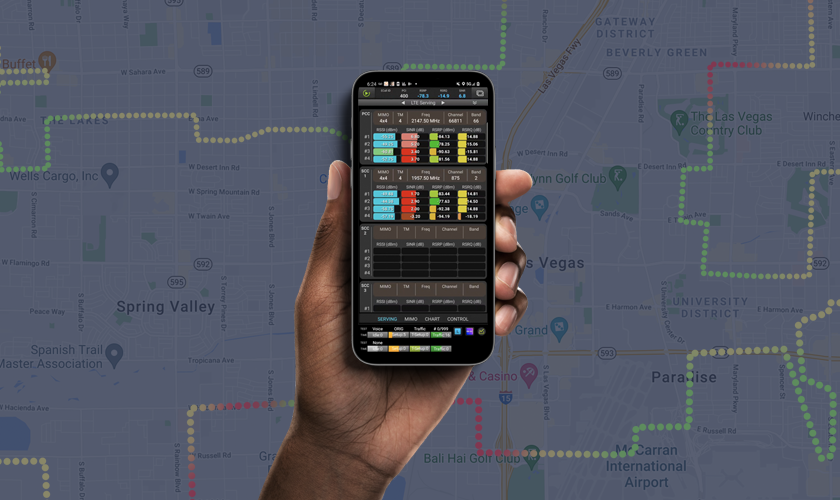
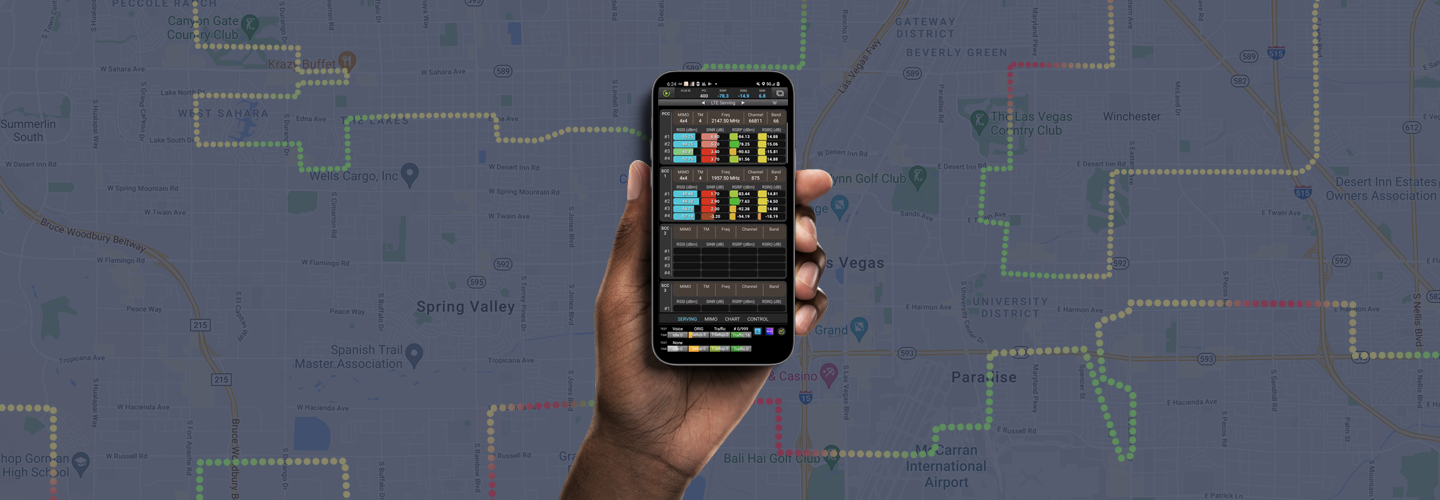
Operators can also use Cell Analytics to see where existing 5G cell sites are on their network. In the screenshot below, we can see all of the 5G cell sites for Operator A in Bangkok, Thailand. 

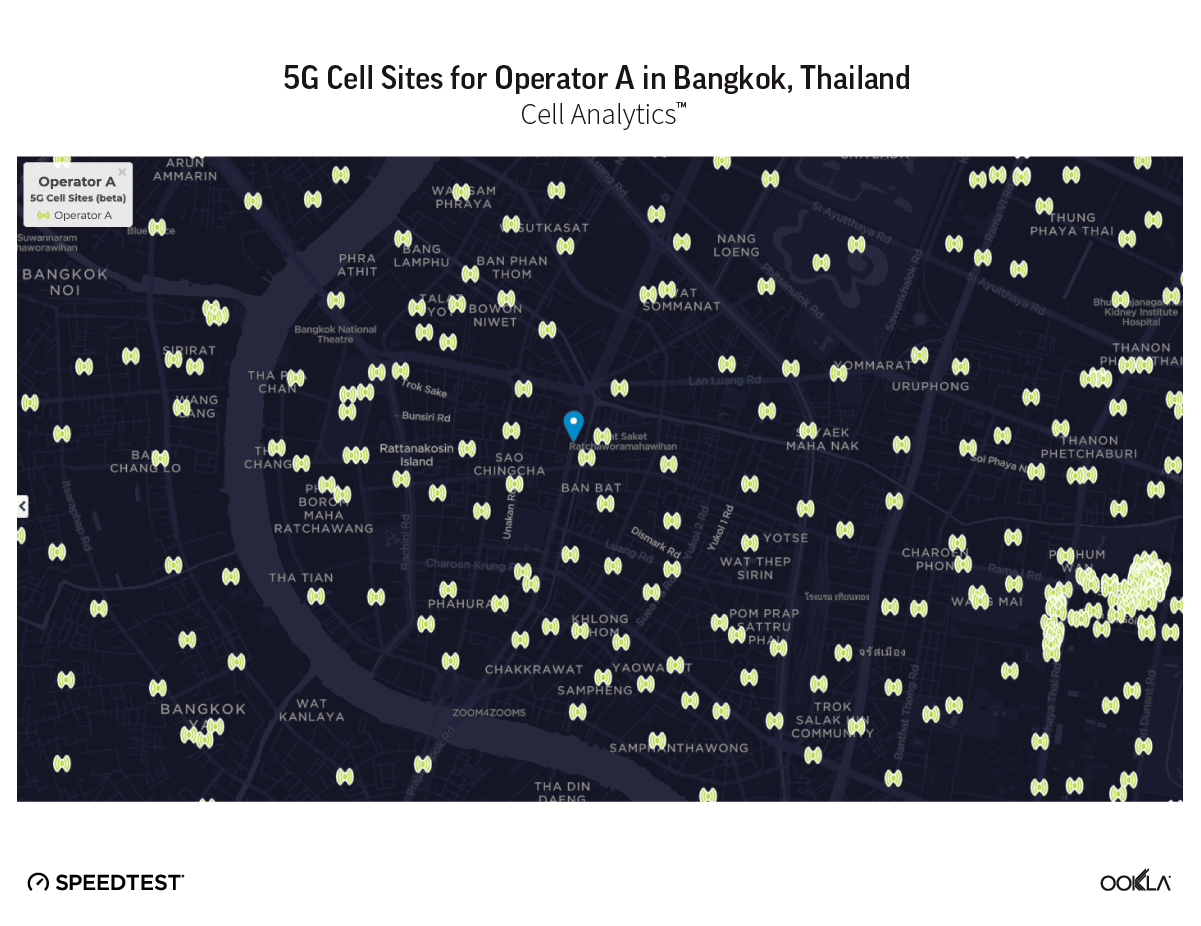
Using 5G cell site locations in conjunction with RF metrics such as LTE optimization priority and QoE metrics like web page load time, Operator A was able to make informed decisions about where to add new 5G SA cell sites or deploy 5G NSA. 

Optimizing your 5G network

After adding new 5G SA cell sites and deploying 5G NSA, operators can use Ookla data to continually optimize their 5G network. QoS and QoE data supports optimization use cases including pinpointing overshooting cells, finding areas with a lack of cell dominance, and identifying areas where users are experiencing poor performance, coverage, quality, or degrading QoE. 

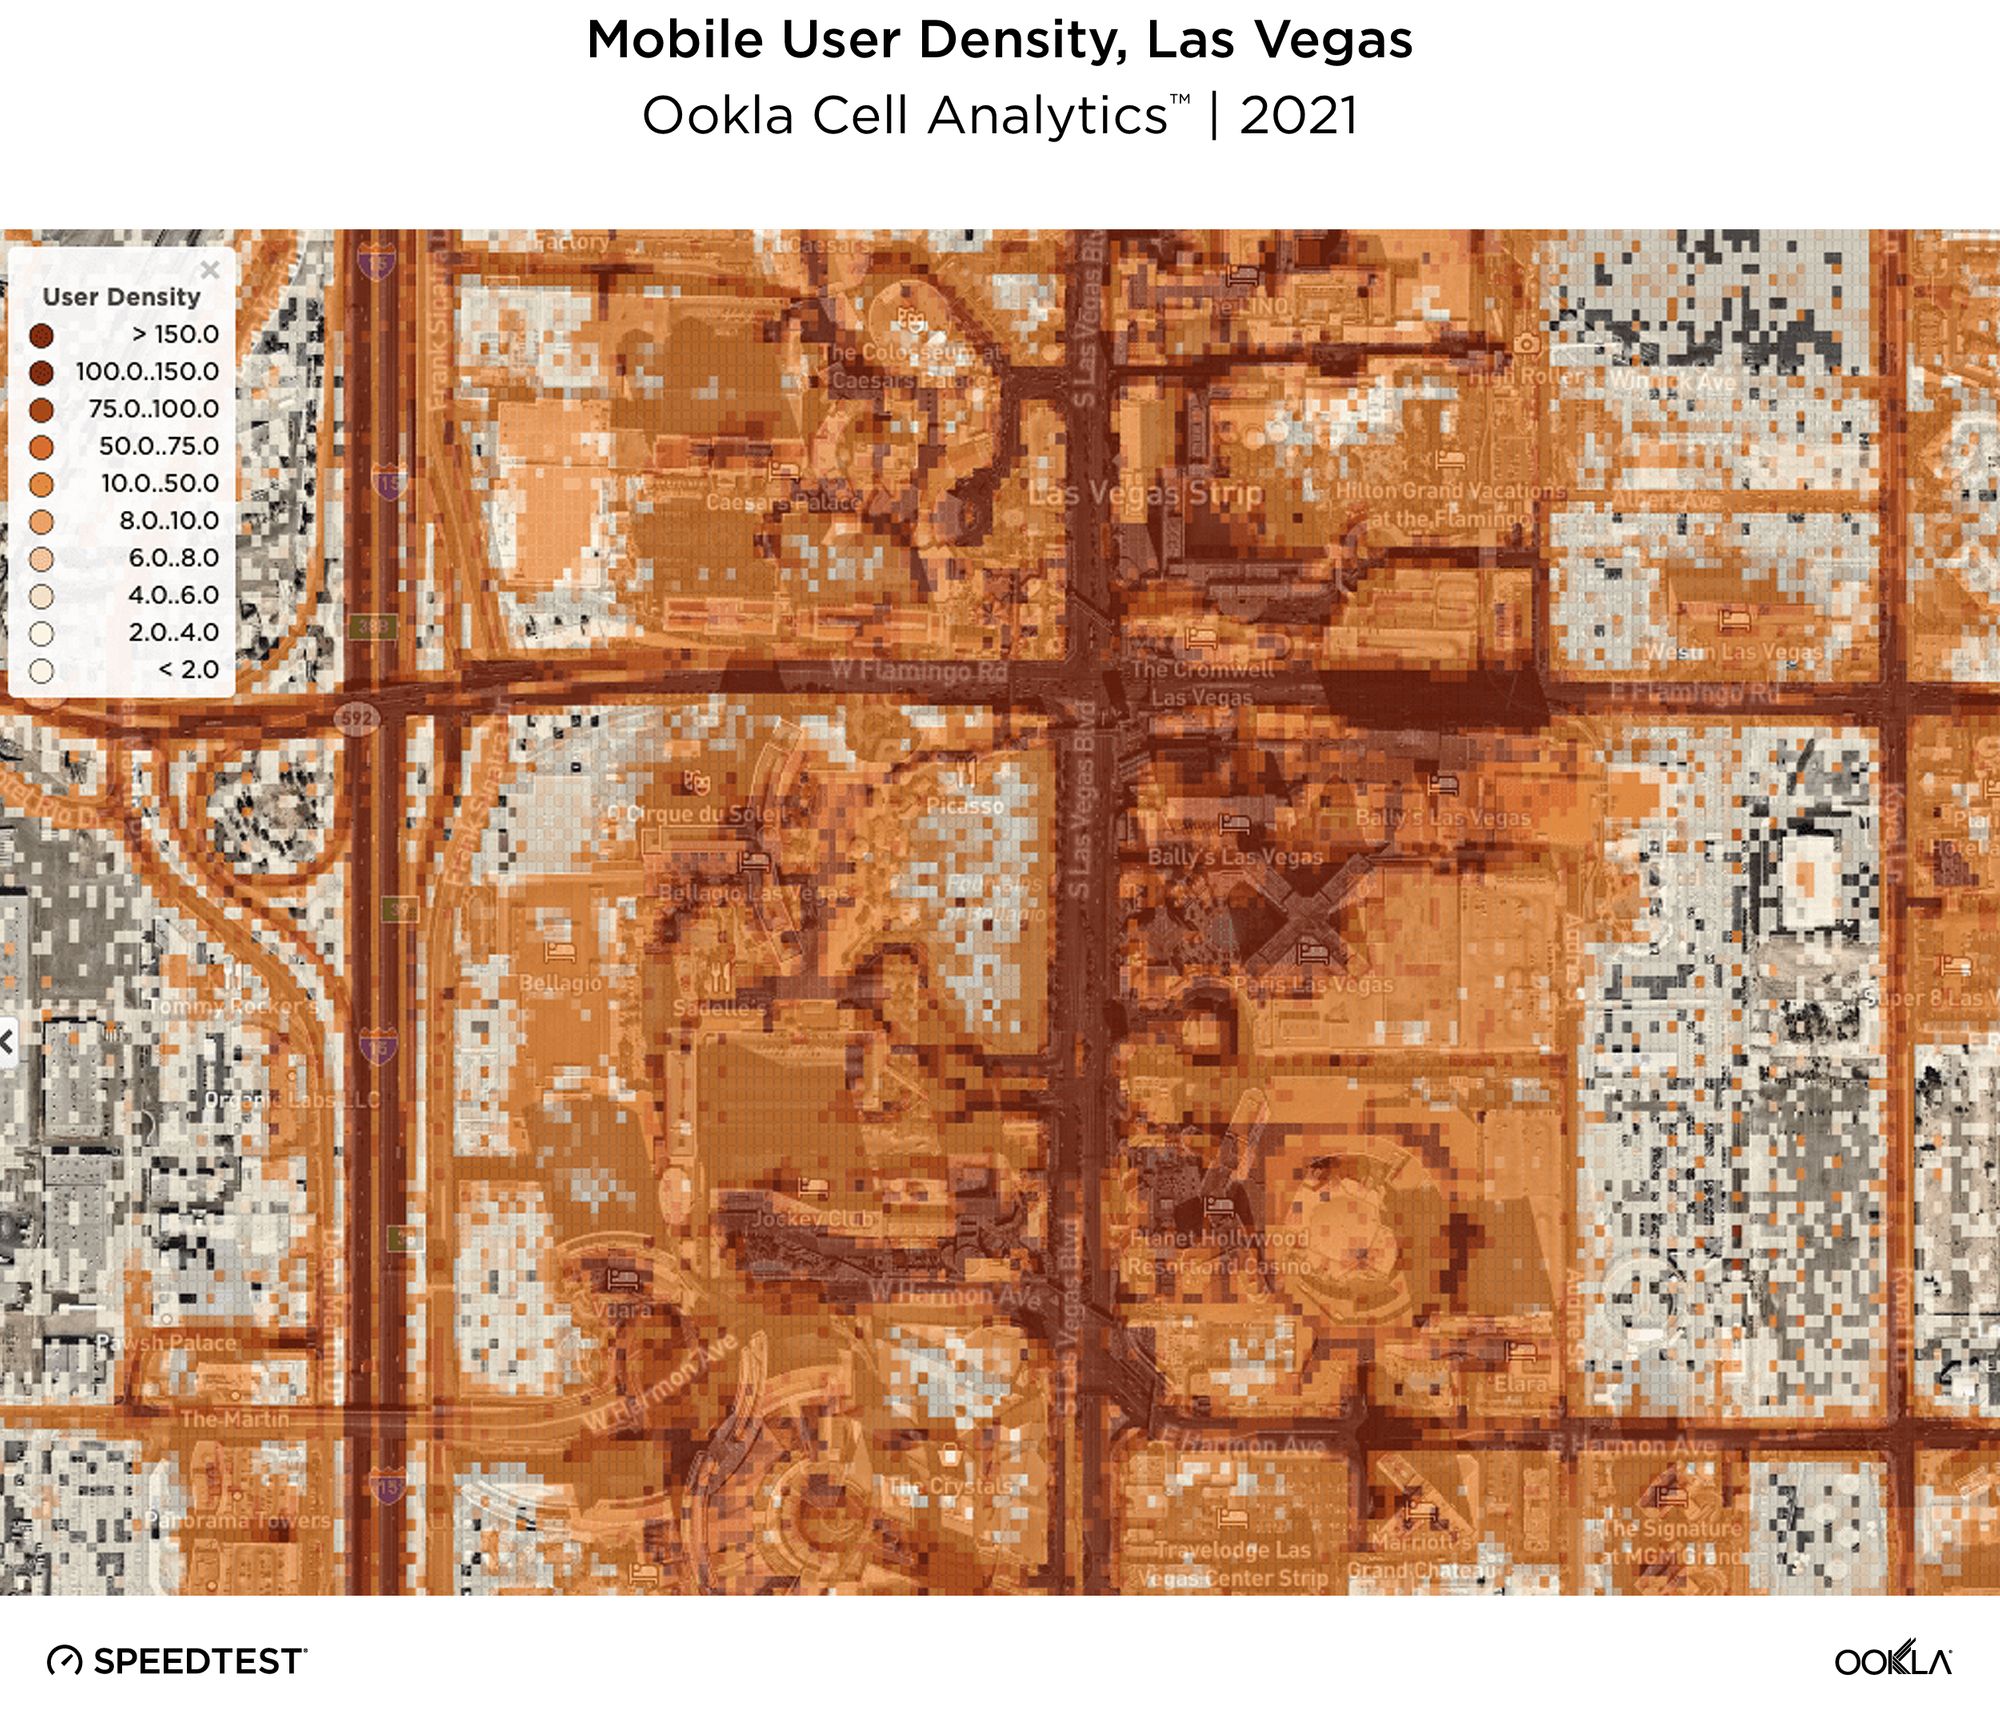
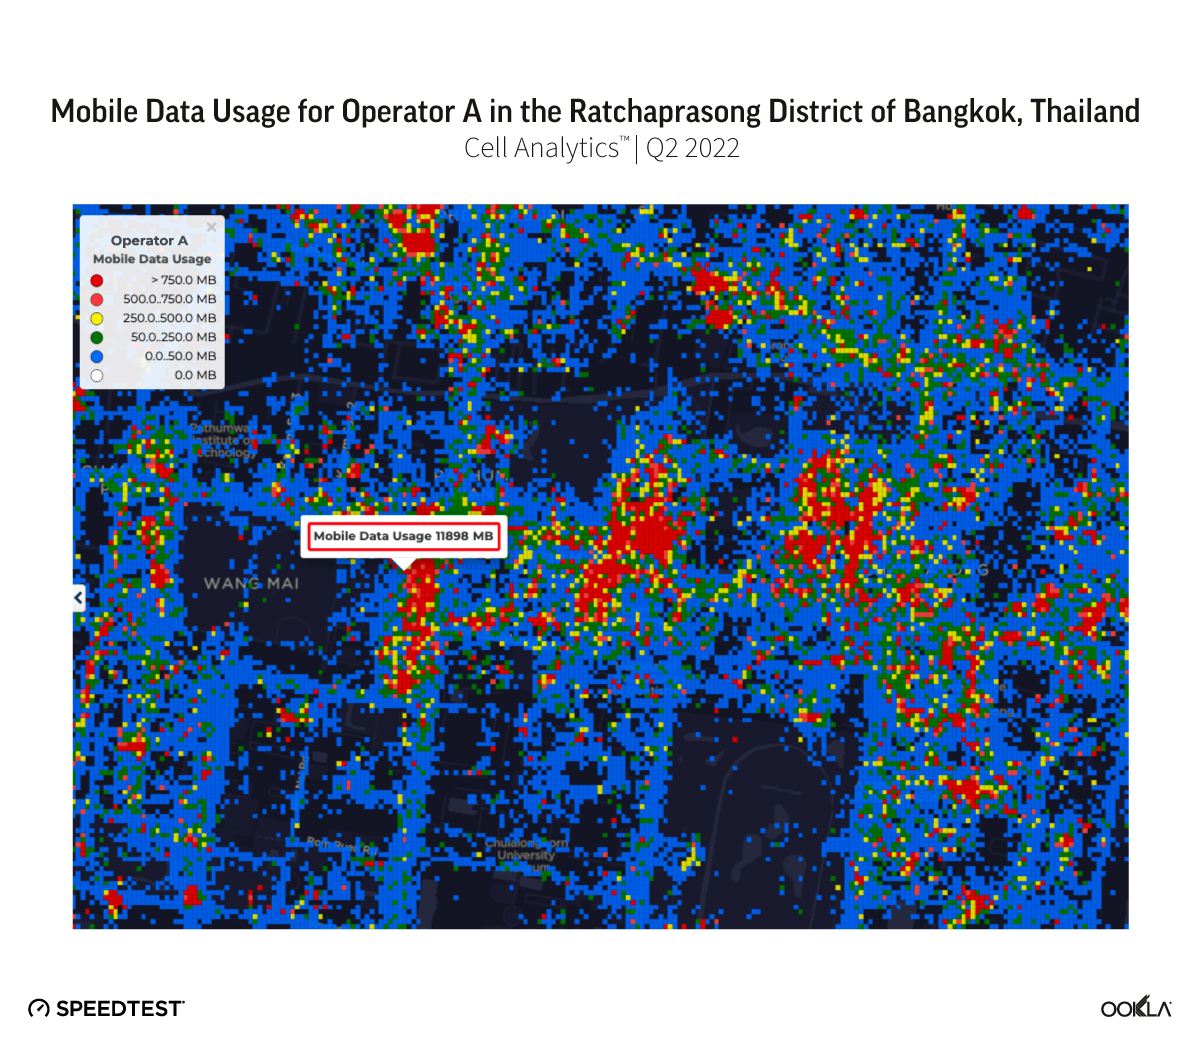
For example, Operator A was able to identify areas with high data traffic that was leading to poor signal quality. In the image below, Operator A can see that mobile data usage is particularly high (shown in red) in the Ratchaprasong District, a popular shopping area with 9 major malls and more than 5,500 shops. 

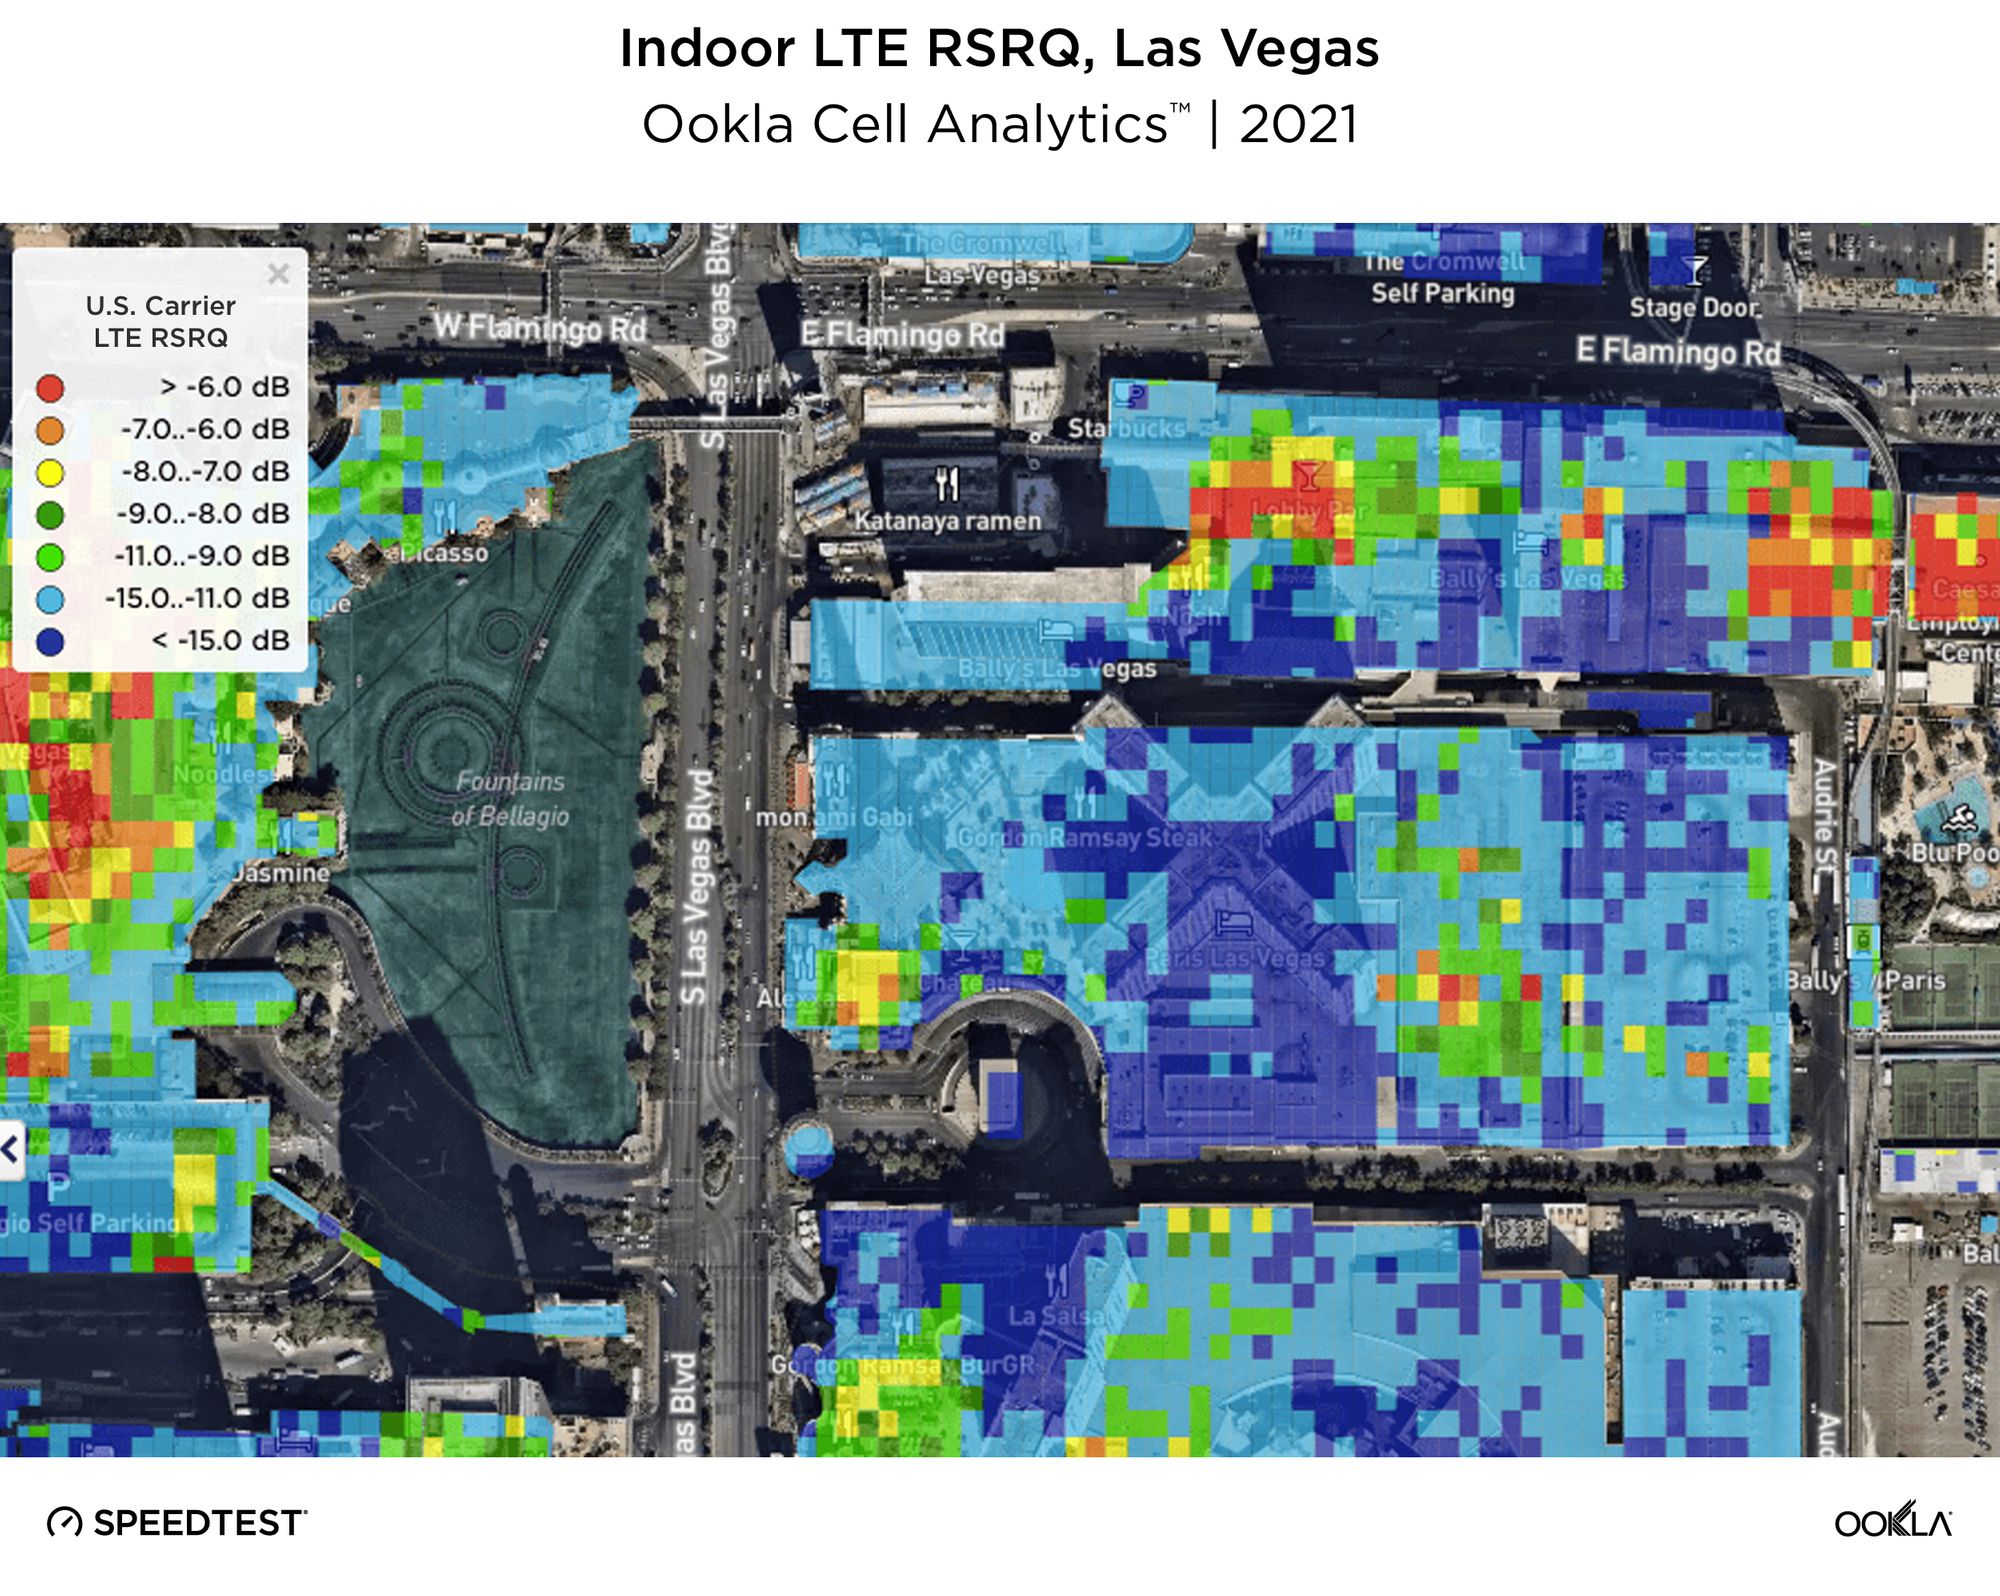
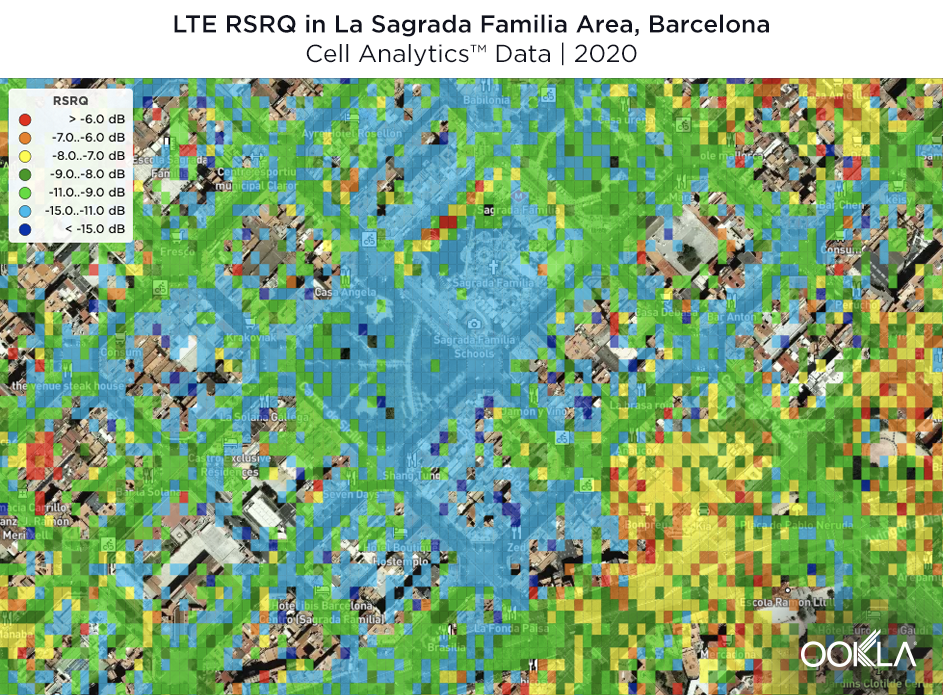
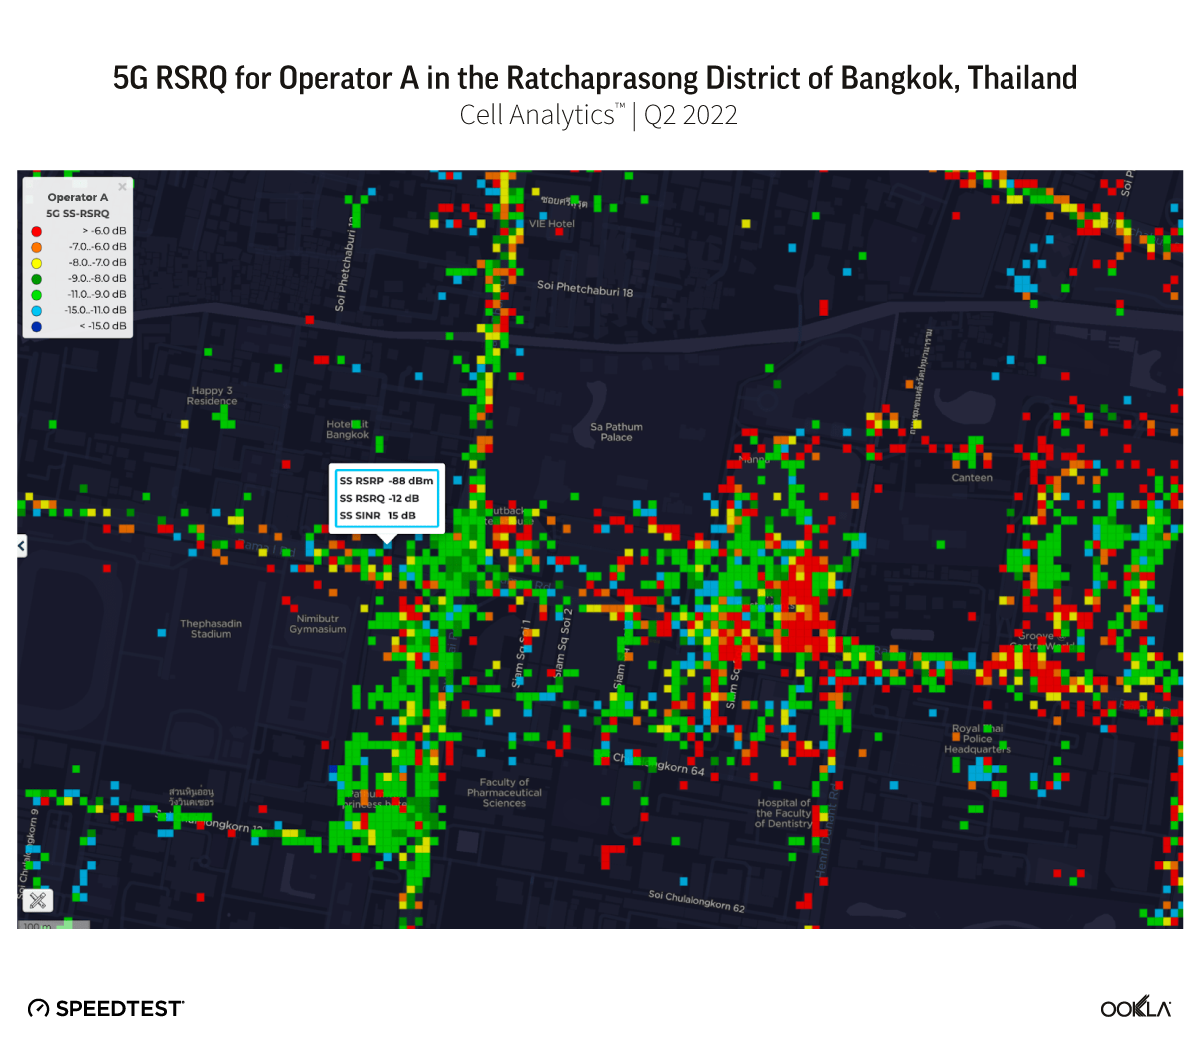
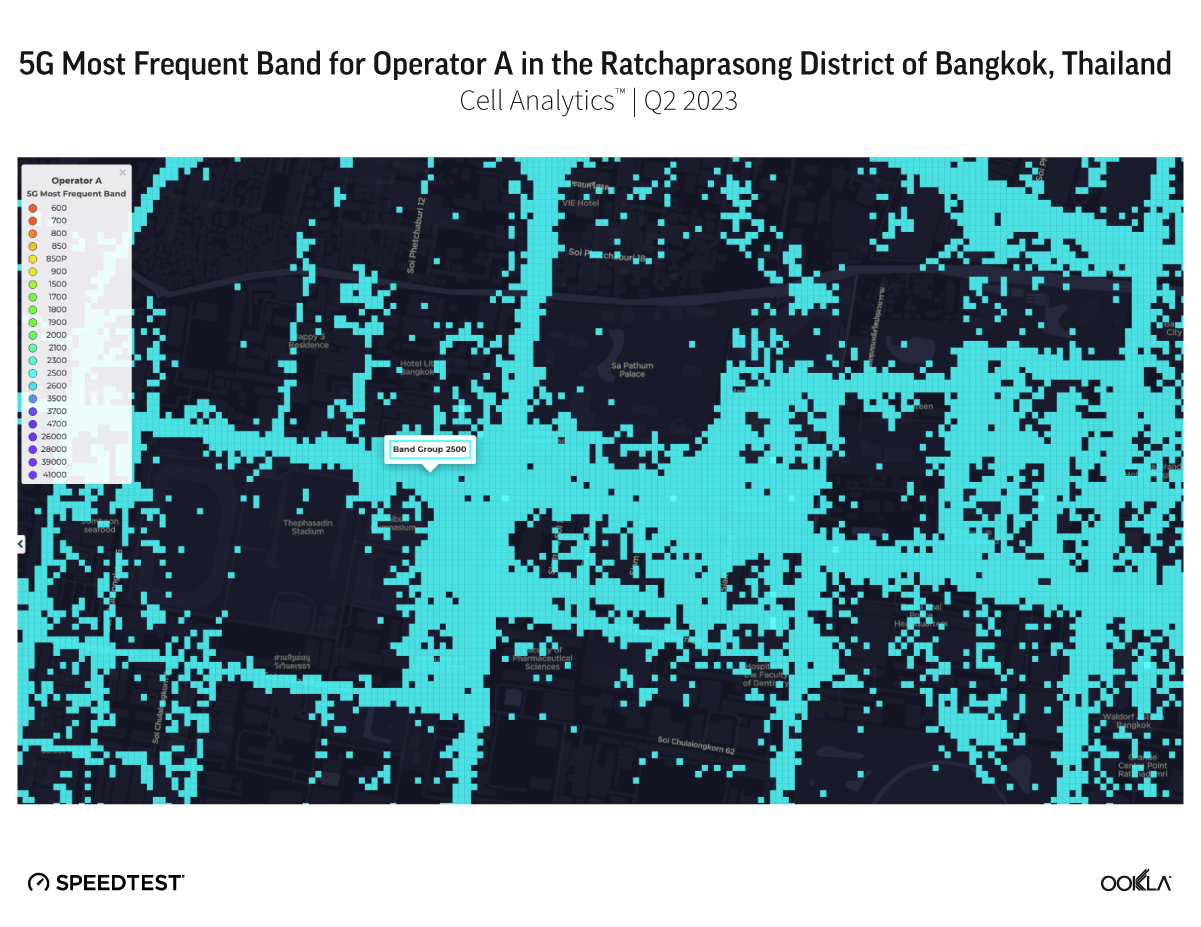
Taking a look at 5G RSRQ data for this area, Operator A was able to see that signal quality was poor (shown in green and blue) in some of the busier areas of the shopping district.

These problem areas with high traffic and low signal quality are areas where Operator A should optimize their network by ensuring signals are routed efficiently. One year later in Q2 2023, there are many more areas with strong signal quality (shown in red), indicating that Operator A has improved the signal quality in the area. 

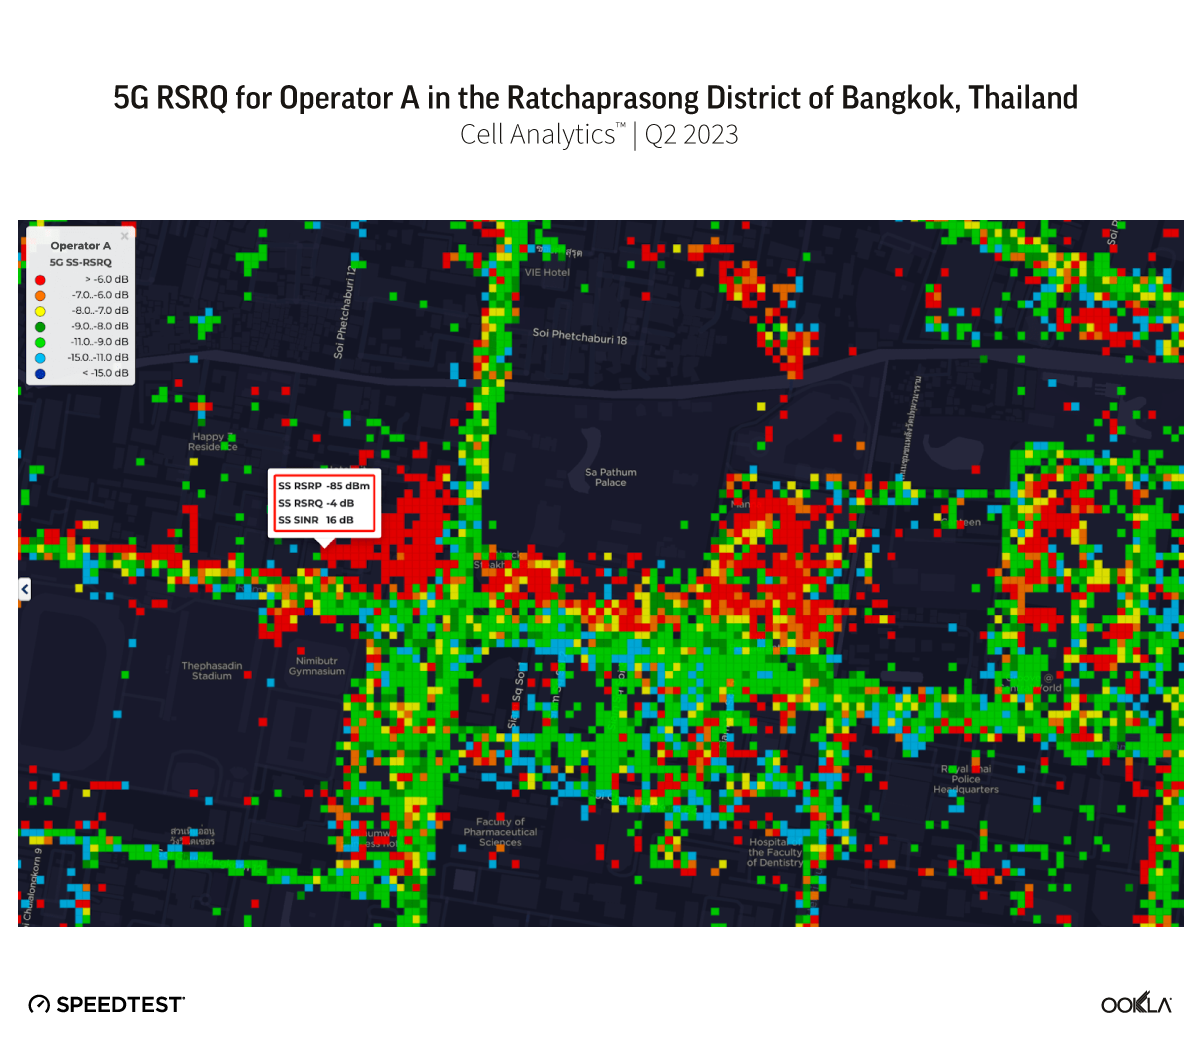
We can see that the improvement is due to a new 5G cell site, and we can examine its cell ID and PCI along with its coverage footprint. We can also see that this operator is using the 2500 MHz frequency band for 5G in the area.

Monitoring your 5G network performance and competitor rollouts 

To ensure that customers are realizing the improved QoS and QoE that 5G has promised, it’s important that operators are continuously monitoring and optimizing their network. Operators can use Ookla data to validate the impact that the rollout has had on performance, coverage, and quality. 

Looking again at LTE optimization priority and downlink throughput two years later in 2023, we can see that Operator A has successfully optimized the network and is providing better RSRP, RSSNR, and download speeds to their customers than they were in 2021 (less red and more green). 

Additionally, Operator A can validate improved QoE by looking at web page load time in 2023. There are significantly more green areas on the map than there were in 2022, indicating that page load times in Bangkok have become much faster and Operator A is now providing a better quality of experience.

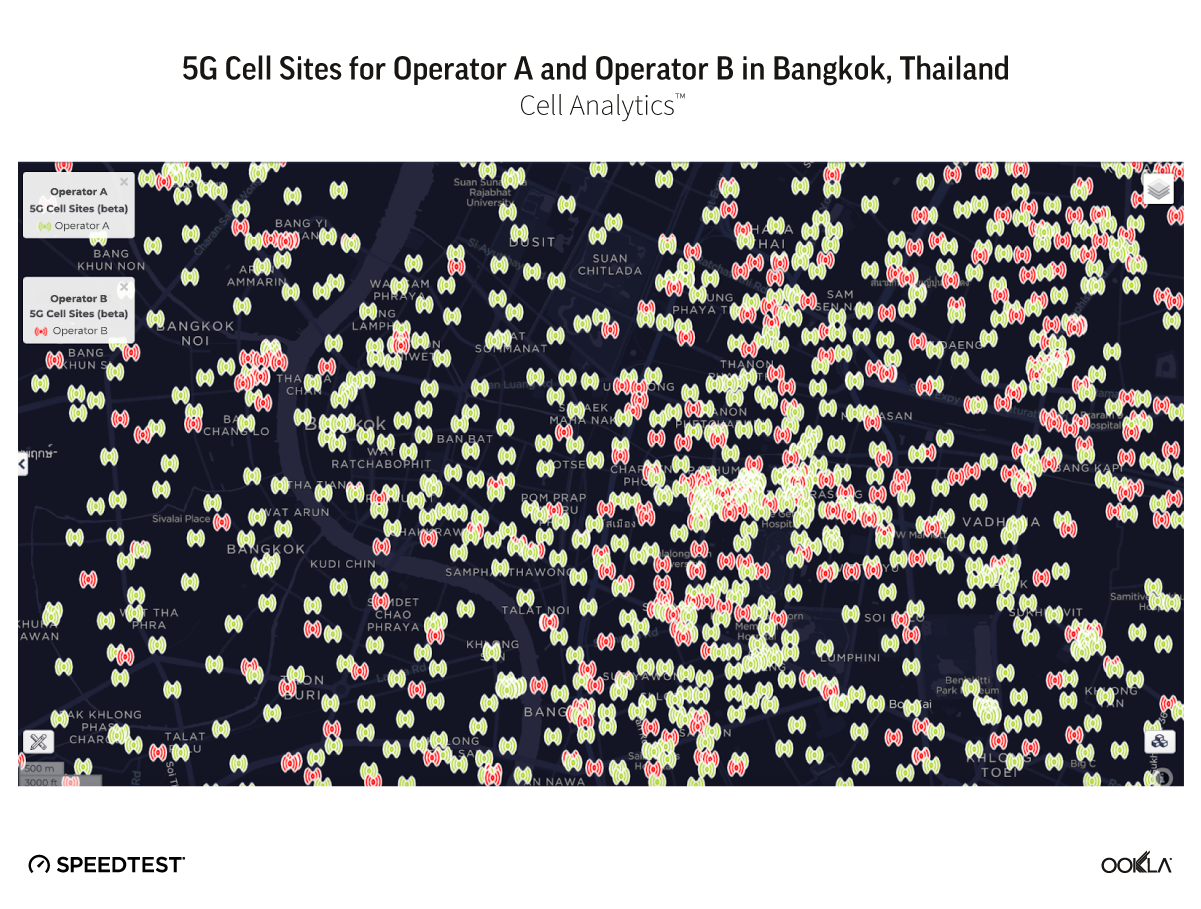
Operators can also monitor the rollout of their own network and competitor networks by viewing 5G cell site locations. Operator A can see their 5G cell sites (shown in green), as well as their competitor Operator B’s 5G cell sites (shown in red). Operator A is able to see that they are leading the way in 5G deployments for Bangkok. 

From 2021 to 2023, Operator A used Ookla data to plan where to build 5G SA cell sites and deploy 5G NSA, optimize their 5G network, validate network improvements, and monitor competitor rollouts. 

As operators expand their 5G networks to meet the increasing demand for mobile data and support innovative applications, the need for efficient network management becomes paramount. Ookla can help operators make data-driven decisions at every stage of the 5G lifecycle — planning, optimizing, and monitoring — allowing them to stay ahead and deliver exceptional mobile performance to customers. If you’re interested in getting started with Cell Analytics or Consumer QoE, inquire here

Ookla retains ownership of this article including all of the intellectual property rights, data, content graphs and analysis. This article may not be quoted, reproduced, distributed or published for any commercial purpose without prior consent. Members of the press and others using the findings in this article for non-commercial purposes are welcome to publicly share and link to report information with attribution to Ookla.

| August 26, 2021

How to Identify and Resolve Network Issues in Real-Time [Webinar]


Drive testing has historically been a time-consuming, expensive and labor-intensive effort — but it doesn’t have to be. With recent advances in crowdsourced network insights, revolutionary new live testing capabilities and real-time analytics, some of the leading operators in the U.S. have drastically cut the time and budget they spend finding and fixing network issues.

The upcoming Ookla® webinar on September 9 will show how Network Optimization and RAN teams can combine crowdsourced network data with surgical drive and walk testing to make immediate network improvements in the areas that matter most to consumers. Read on to learn how mobile network operators can save countless hours and dollars with this new approach to live testing.


Use Crowdsourced network data to pinpoint areas with high user counts and poor signal or throughput

It’s impossible to drive test every street and walk test every building — but crowdsourced network data allows you to see real-world connectivity where it matters most to customers. Powered by hundreds of millions of daily performance, coverage and signal measurements from Speedtest®, Ookla Cell Analytics™ provides unparalleled intelligence about wireless service quality, RF measurements, data use, indoor vs. outdoor performance, cell site locations and much more.

By looking at user density, mobile operators can understand where the highest volume of customers are impacted by poor signal or throughput. After you’ve prioritized the areas where network improvements will have the most impact on subscribers, you can send your field testing team to conduct more targeted analysis on-site.

With Cell Analytics, we can scan wide regions to identify and prioritize problem areas. In this case, we looked at a wireless network in Las Vegas and quickly saw that the Paris Las Vegas Hotel & Casino has lots of users, but the network has very poor quality there (LTE RSRQ and SNR) and also low data speeds, despite having good coverage throughout the property.

Mobile-User-Density-in-Las-Vegas

The poor quality extends from the ground floor through the upper floors of the building. We can also see that the operator has a cell site on the property.

Indoor-LTE-RSRQ

From the crowdsourced data in Cell Analytics, we can also see that the 1900 and 2100 MHz bands are most heavily used throughout the property.

Most-Frequent-Band

eNodeB 80024 and 80155 are serving most frequently on the property, although some others are also seen.

LTE-Most-Frequent-Cell

LTE-Most-Frequent-Cell-2

Armed with this knowledge, the mobile network operator can send someone to conduct a quick walk test of the building.

Perform targeted drive and walk tests for problem areas with real-time analytics

In the past, drive and walk testing could be prohibitively expensive for smaller network operators. For example, let’s say you’re an operator with 40,000 sites, and a tester spends an average of five hours per site at $50/hr. Testing every site in your network would cost upwards of $10 million per year. Ookla Wind™ (Wireless Intelligence On Demand) offers a revolutionary approach to drive and walk testing with affordable devices, real-time analytics and no time spent on post-processing.

As we saw above, Ookla’s Cell Analytics allows us to identify the “symptoms” of poor network performance. Specific indoor areas in the main lobby and casino floor inside the Paris Las Vegas Hotel & Casino showed poor signal-to-interference-and-noise-ratio (SINR) and low throughput performance. Upon completing a surgical walk-test of the same areas using the Ookla Wind handset based network measurement platform, the operator was able to diagnose the issue.

Below we can see it was clear that the indoor area lacked any 5G connectivity. This, coupled with no carrier aggregation, low MIMO utilization and lower modulation scheme due to poor SINR, all contribute to poor throughput.

real-time-walk-test-view-2

Given the large number of handover attempts in our walk-test, the recommended next step for the operator is to address the pilot and reference signal pollution in the area and to establish clear dominance to improve the network performance. By utilizing Ookla Wind, a remote engineer could analyze the data in real-time and make these adjustments to the network while the tester is still on site. This should save you hours or days that would otherwise be spent waiting for post-processing to happen.

Processed-Report

The webinar on Thursday, September 9 at 9 a.m. PDT (12 p.m. EDT / 4 p.m. GMT) will show you how to combine crowdsourced network data with surgical drive and walk testing to make immediate network improvements. Don’t miss it. A recording will be provided for registrants who can’t tune in to the live presentation.


Ookla retains ownership of this article including all of the intellectual property rights, data, content graphs and analysis. This article may not be quoted, reproduced, distributed or published for any commercial purpose without prior consent. Members of the press and others using the findings in this article for non-commercial purposes are welcome to publicly share and link to report information with attribution to Ookla.

| November 2, 2020

How to Improve In-Building Network Performance and Coverage with Crowdsourced Data (White Paper)

With much of the world still sheltering in place, most mobile network operators have been tasked with supporting additional demand from customers who are increasingly reliant on their networks for access to work, education and entertainment. RAN engineering teams are tasked with increasing capacity and improving service — while working within budgets that may be much tighter than in previous years.

In this white paper, you’ll learn how to use crowdsourced network performance data from Cell Analytics™ to prioritize the network improvements that have the most impact on your customers. By looking at where users are connecting but receiving poor service, you can discover and prioritize the best places to improve performance and coverage, benchmark your network metrics against competitors and monitor their 5G rollouts. Download the full white paper here.

Prioritizing locations with high user density but poor performance

Poor wireless service in a popular location like a shopping center, office park or transit center can impact a wireless customer’s satisfaction and an operator’s reputation. Cell Analytics helps you identify hotspots with a high concentration of users where your customers are experiencing poor performance and coverage.

Cell-Analytics_User-Density_Mumbai-1

The above image shows very high user density in Mumbai’s airport. In the white paper, we show how to prioritize optimization by user density and mobile data usage, then drill down into metrics like RSRQ (signal quality) and LTE most frequent band, to discover which band is showing the most issues for a given operator. From there, we can look at the operator’s LTE most frequent cell to pinpoint the exact cell site causing the issues, and make specific recommendations to improve their customers’ network experience at the airport — without spending excessive additional funds.

Discover where competitors have better in-building performance and coverage to prioritize infrastructure investments

Knowing where your competitors outperform your network can help you prioritize your investments and improvements. Beyond analyzing an existing network to find areas of competitive weakness or strength, operators can also monitor the status of 5G rollouts.

Cell-Analytics_5G-SS-RSRP_Hong-Kong2

The above image compares 5G SS-RSRP (signal level) for two network operators in Hong Kong, showing variable coverage between providers. In the white paper we show how network operators can use this crowdsourced data to benchmark 5G network performance and coverage and to discover areas to prioritize for optimization.

Use 3D views to analyze performance in tall buildings, find problem cell sites and identify needed capacity expansion

Performance and quality of a network can vary dramatically in tall buildings. In densely populated cities with many tall buildings, detailed in-building analysis can show where performance is suffering by height, down to individual floor groups. A customer may have a variable experience on your network, depending on where they are located in a given building — which can make a critical difference in a populous office high-rise or on the ground floor of a hospital. Using the 3D “z-axis” view in Cell Analytics, you can see where optimization is needed to accommodate for variable performance in important buildings.

Cell-Analytics_3D-LTE-RSRP_Hong-Kong2

In the above image of Kwong Wah Hospital in Hong Kong, we can see that, while LTE signal level is sufficient for acceptable service within all levels of the building, RF quality gets progressively worse in the upper floors of the hospital. The white paper explores potential issues with nearby cells to help the operator find a solution that offers their customers good network quality, no matter where they are located within the hospital.

In this report, we walk through seven in-depth use cases where RAN engineering teams can use Cell Analytics data to prioritize engineering efforts and make no-cost or low-cost improvements to the network. The white paper also includes information on benchmarking 5G metrics and monitoring competitors’ new deployments.

Download the full whitepaper to learn how to use crowdsourced data to prioritize the network improvements that have the most impact on your customers.

Ookla retains ownership of this article including all of the intellectual property rights, data, content graphs and analysis. This article may not be quoted, reproduced, distributed or published for any commercial purpose without prior consent. Members of the press and others using the findings in this article for non-commercial purposes are welcome to publicly share and link to report information with attribution to Ookla.

| August 16, 2020

Problems on the 37th Floor: Analyzing In-Building Network Performance and Coverage (Webinar)

Drive testing and walk testing are useful for capturing isolated snapshots of network performance and quality, but not efficient ways to discover where users are having problems connecting. Mobile network operators must understand where users are experiencing poor indoor network performance or a weak 5G signal to provide consumers with good quality of service. It is especially important to understand performance issues in densely populated urban areas with many tall high-rise buildings, because indoor service issues can sometimes be limited to specific floor groups.

In the upcoming Ookla® webinar, we’ll share three real-world use cases where operators in Asia can improve performance and coverage with Cell Analytics™ data on user density and traffic, indoor vs. outdoor performance and 5G network metrics.

Read on to discover how operators can monitor 5G networks and identify problem buildings and cells with crowdsourced data — and don’t miss the webinar on Wednesday, August 26 at 12:00 GMT+8 (9:30 Mumbai, 11:00 Bangkok, 12:00 Singapore/Kuala Lumpur/China, 13:00 Tokyo, 14:00 Sydney).


1. Monitor your 5G network performance and coverage as well as competitors’

As mobile network operators invest heavily in 5G, it’s critical to monitor progress and compare network coverage and performance to that of your competitors. Powered by hundreds of millions of signal measurements collected daily by Speedtest®, Cell Analytics provides intelligence about wireless service quality, RF measurements, data usage, user density, cell site locations and much more, including 5G network metrics. By tracking your own and competitors’ performance, you can understand where new 5G deployments are impacting user experience and quality of service.

5G-HK-SS-RSRP-1

3hk-5g-ss-rsrp-2

In the above example, we can see China Mobile Hong Kong provides 5G coverage over a much larger area than the 3 Hong Kong network.

2. Identify problem buildings and cells with crowdsourced data — and prioritize efforts to improve them

Cell Analytics makes it easy to identify buildings where users are experiencing issues and to prioritize which network improvements will have the most impact. By looking at user density (both indoor and outdoor), you can understand where the highest volume of users are impacted and determine which cell sites need low-cost or no-cost adjustments to improve service.

Mumbai-LTE-RSRP-1

In-Building-User-Density-Mumbai-1

In the above example, we see Nirlon Knowledge Park, a busy office park in Mumbai with very high user density, but very low LTE signal level on the Jio network. By comparing these views, Jio can discover opportunities to improve in-building performance and coverage in popular locations.

3. Analyze network performance in tall buildings, down to individual floor groups

With new z-axis views in Cell Analytics, it is possible to determine the altitudes at which users experience poor network quality or performance. By analyzing which floor groups within a building are showing network issues, you can identify good buildings for DAS or other capacity expansion.

NTTDoCoMo-LTE-Tokyo-2

In the above example, we can see that the upper floors of several buildings are experiencing poor quality on the NTT DoCoMo network in Tokyo.

To see in-depth recommendations for the operators in the above scenarios, don’t miss the webinar on August 26 at 12:00 GMT+8. If you cannot make the presentation, you can register to receive a video recording after the live event. We look forward to showing you how to leverage real-world data to make better network decisions and answering any questions you may have. Register now

Ookla retains ownership of this article including all of the intellectual property rights, data, content graphs and analysis. This article may not be quoted, reproduced, distributed or published for any commercial purpose without prior consent. Members of the press and others using the findings in this article for non-commercial purposes are welcome to publicly share and link to report information with attribution to Ookla.

| June 3, 2020

Efficiently Design and Optimize Your Network with Crowdsourced Data (Webinar)

Mobile network operators are currently faced with a double challenge. With much of the globe still under stay-at-home orders, consumers are increasingly reliant on the quality and availability of their networks — and worldwide, operators are facing both budget cutbacks and logistical limitations on traditional data collection methods like walk-testing and drive-testing. Now more than ever, network planners and engineers must prioritize their decisions to have the maximum impact on customer experience with the minimum associated cost.

In Ookla’s upcoming webinar, we’ll show three real-world use cases where European operators can make low-cost or no-cost changes to their existing networks — without drive testing. By identifying competitors’ cell site locations and finding areas of high density and usage where competitor networks perform better, operators can use the crowdsourced data in Cell Analytics™ to prioritize improvements to their networks.

Read on to discover three ways operators can make smarter design and optimization decisions, and don’t miss the webinar on Wednesday, June 17, 2020 at 7am PDT / 10am EDT / 4pm CEST.


1. Identify populated areas where competitor networks outperform yours

Powered by hundreds of millions of signal measurements collected daily by Speedtest®, Cell Analytics provides intelligence about wireless service quality, RF measurements, data usage, user density (both indoors and outdoors), cell site locations and much more. By looking at areas with the highest user density and data usage, you can identify areas where people need a strong connection — and see where competitors provide better wireless service.

webinar-screenshot_LTE_RSRQ_Barcelona

In the above example, we can see signal quality for a given operator both in and around one of Barcelona’s most popular locations, La Sagrada Familia cathedral. By looking at real-world measurements, you can discover the highest-priority places to invest in capacity expansion or relatively simple fixes like antenna downtilt or network parameter changes.

2. Identify competitor cell sites and monitor new cell site deployments

Without visibility into your competitors’ network performance, quality and availability, it can be difficult to benchmark your own network metrics. Crowdsourced data provides actionable intelligence to assess your network performance inside and outside of buildings and to compare your network to competitors’. Use the Cell Site Finder tool in Cell Analytics to discover the location of competitor cell sites, analyze your performance vs. competing networks and identify opportunities for potential collocation or new deployments.

webinar-screenshot_LTE_RSRP_London

In the above example, we have cross-referenced the location of various network operators’ cell sites with RSRP in two busy shopping locations near London’s Wembley Stadium. From this, we can see the location of all cell sites in the area and a precise view of the service they are delivering. By viewing the coverage of individual competitor sites, you can avoid costly errors that result from relying on RF prediction tools alone during new cell site design.

3. Identify ways to make low-cost improvements to your existing network

Once you’ve prioritized the areas where improvements are most needed, dig into our data to see why users might be experiencing poor network performance and low data quality. To troubleshoot the underlying issues, you can analyze serving cells and band usage in high resolution and then look at the relation between RF conditions and service indicators like throughput, latency and jitter.

webinar-screenshot_LTE_RSRQ_Dublin

By comparing one operator’s RSRQ with downlink throughput in Dublin’s busiest railway station, we can pinpoint the exact sites that need adjustment to increase the quality of service for this operator. This type of data shows you where a relatively easy fix like antenna azimuth or downtilt changes might help.

To see in-depth recommendations for the operators in the above scenarios, don’t miss the webinar on June 17. If you cannot make the presentation, you can register to receive a video recording after the live event. We look forward to showing you how to leverage real-world data to make better network decisions and answering any questions you may have. Register now.

Ookla retains ownership of this article including all of the intellectual property rights, data, content graphs and analysis. This article may not be quoted, reproduced, distributed or published for any commercial purpose without prior consent. Members of the press and others using the findings in this article for non-commercial purposes are welcome to publicly share and link to report information with attribution to Ookla.

| March 11, 2020

Three Ways to Improve Your Network Strategy with Crowdsourced Data (White Paper)

Both wireless network operators and infrastructure companies face challenges when determining where to make investments or improvements. Wireless network operators must properly configure cell sites to minimize interference, determine where networks are performing poorly and rapidly identify what network changes to implement to improve service in those locations. Similarly, infrastructure companies, such as tower and distributed antenna system (DAS) builders, must be able to determine areas and buildings with lots of users and poor service on multiple networks, then use this information to identify the best places to build new towers or “neutral host” indoor systems to lease to as many operators as possible.

To make these decisions, most providers currently rely on expensive drive testing, performance counter data that doesn’t offer location accuracy and outdated information on population density. In this new white paper, we share how providers can use real-world network performance and quality measurements from Ookla® to inform their network strategy. Download the full white paper here.

A better way to collect network performance, coverage and signal data

Recent advances in collecting and analyzing crowdsourced measurements can help inform network optimization decisions. Ookla Cell Analytics™ surfaces real-world data on wireless service quality, RF measurements, data usage, user density and other key metrics. Cell Analytics uses the results from 10+ million daily consumer-initiated tests taken on Speedtest® and hundreds of millions of coverage scans on Speedtest Android every day to provide accurate location information, both indoors and out, down to the individual building level.

Performance-Counter_Crowdsourced-RSRP-Measurement-Views-1

The above image compares typical performance counter metrics to the detailed view in Cell Analytics of LTE signal level (RSRP) for one network operator in Philadelphia.

Locating competitor cell sites and opportunities for new cell site deployment

Using the Site Finder feature in Cell Analytics, mobile network operators and infrastructure providers can accurately estimate the locations of cell sites for all operators. In addition to competitive benchmarking, this also allows providers to discover areas with poor coverage or quality — and no existing cell sites — to identify deployment opportunities.

Houston_Poor-Coverage_High-User-Density
The above image shows individual buildings that are scored on the count of indoor users and indoor service quality on all networks. Buildings with a high score (indicated in red) may be good opportunities for network operators to increase capacity and for infrastructure providers to build new rooftop assets or neutral host systems.

In this white paper, we share how network engineering teams can use Cell Analytics data to discover the locations that need easy-to-make network improvements, find opportunities to add new cell sites and prioritize optimization efforts based on user density and coverage data from multiple networks.

Looking at real-world data from Italy, Brazil and the United States, download the full white paper to discover how operators can make immediate, data-driven improvements to their networks — without the overhead and limitations of drive testing.

Ookla retains ownership of this article including all of the intellectual property rights, data, content graphs and analysis. This article may not be quoted, reproduced, distributed or published for any commercial purpose without prior consent. Members of the press and others using the findings in this article for non-commercial purposes are welcome to publicly share and link to report information with attribution to Ookla.